Article

Numerical and Experimental Study of Heat Transfer in Pyrolysis Reactor Heat Exchange Channels with Different Hemispherical Protrusion Geometries

by
Oleg A. Kolenchukov
1,
Kirill A. Bashmur
1,
Sergei O. Kurashkin
2,3,4,*,
Elena V. Tsygankova
5,
Natalia A. Shepeta
1,6,
Roman B. Sergienko
7,
Praskovya L. Pavlova
1 and
Roman A. Vaganov
3
1
Department of Technological Machines and Equipment of Oil and Gas Complex, School of Petroleum and Natural Gas Engineering, Siberian Federal University, 660041 Krasnoyarsk, Russia
2
Information Control Systems Department, Institute of Informatics and Telecommunications, Reshetnev Siberian State University of Science and Technology, 660037 Krasnoyarsk, Russia
3
Laboratory of Biofuel Compositions, Siberian Federal University, 660041 Krasnoyarsk, Russia
4
Scientific and Educational Center “Artificial Intelligence Technologies”, Bauman Moscow State Technical University, 105005 Moscow, Russia
5
Department of Foreign Languages for Natural Science, School of Philology and Language Communication, Siberian Federal University, 660041 Krasnoyarsk, Russia
6
Electronic Engineering and Telecommunications Department, Institute of Informatics and Telecommunications, Reshetnev Siberian State University of Science and Technology, 660037 Krasnoyarsk, Russia
7
Machine Learning Department, Gini GmbH, 80339 Munich, Germany
*
Author to whom correspondence should be addressed.
Energies 2023, 16(16), 6086; https://doi.org/10.3390/en16166086
Submission received: 18 July 2023 / Revised: 14 August 2023 / Accepted: 18 August 2023 / Published: 21 August 2023
(This article belongs to the Special Issue CO2 Reduction and H2 Promotion Techniques in Energies)

Abstract

:
One of the most effective technologies for recycling organic waste is its thermal destruction by pyrolysis methods to produce valuable products such as hydrogen and mixtures containing hydrogen. Increasing the thermal power of the flow helps to reduce the formation of secondary reactions, making the non-condensable hydrocarbon gas in the pyrolysis process cleaner, which simplifies further technology for the production of hydrogen and hydrogen-containing mixtures. In addition, the economic viability of pyrolysis depends on the energy costs required to decompose the organic feedstock. Using passive intensifiers in the form of discrete rough surfaces in heat exchanging channels is a widely used method of increasing heat transfer. This paper presents the results of numerical and experimental studies of heat transfer and hydraulic resistance in a channel with and without hemispherical protrusions applied to the heat transfer surface. The investigations were carried out for a reactor channel 150 mm long and 31 mm in diameter, with a constant pitch of the protrusions along the channels of 20 mm and protrusion heights h of 1 to 4 mm for 419 ≤ Re ≤ 2795. Compared to a smooth channel, a channel with protrusions increases heat transfer by an average of 2.23 times. By comparing the heat exchange parameters and the hydraulic resistance of the heat exchange channels, it was determined that h = 2 mm and 838 < Re < 1223 is the combination of parameters providing the best energetic mode of reactor operation. In general, an increase in h and coolant flow rate resulted in an uneven increase in heat transfer intensity. However, as h increases, the dead zone effect behind the protrusions increases and the rough channel working area decreases. Furthermore, increasing Re > 1223 is not advisable due to the increased cost of maintaining high coolant velocity and the reduced heat transfer capacity of the channel.

1. Introduction

Industrial processes produce by-products—industrial waste—in addition to the basic useful products [1,2]. The conversion of by-products into a useful product and/or disposal often requires a different level of processing [3]. One of today’s burning issues is the generation of hydrocarbon waste [4,5,6], particularly gases [7], which is a major cause of global warming [8]. There are many sources of hydrocarbon gas emissions into the atmosphere [9,10,11]: the processing or incomplete combustion of hydrocarbons, including flue gas formation from various sources; the thawing of organic material residues; as well as others. Approximately 2 million tonnes of unburned methane are released into the atmosphere each year, according to estimates [12,13]. As the problems of global warming and the depletion of non-renewable natural resources become more pressing, the issue of technologies for the capture, processing and disposal of waste hydrocarbon gases appears to be increasingly important for sustainable development in the environmental and energy fields [14]. There remains a pressing scientific and practical challenge to the breadth and quality of hydrocarbon waste treatment processes.
As production capacities and consumer needs evolve, more and more attention is paid to improving the performance of heat exchangers, and in particular, to increasing the yield of the finished product while maintaining its performance characteristics [15,16,17]. Process lines and equipment for the thermal destruction of hydrocarbon waste were developed as a special type of industrial heat exchanger [18,19]. The ability to utilise waste while producing useful products in the form of hydrogen and hydrogen mixtures is a key feature of these units [20]. However, there are a number of technical problems associated with this type of process. For instance, the thermal utilisation of organic products is carried out at the recommended temperatures of 650 to 1150 K [21], requiring high energy consumption. This, in turn, reduces the efficiency of hydrocarbon processing in terms of production and economic costs. In a thermal destruction apparatus, there is an interaction between two substances, hydrocarbon waste and a coolant (heat source to sustain the destruction reaction), separated by a wall. High-temperature (873 K and above) convective gases from the combustion of fossil fuels in flare burners, which combine radiation and convective heat transfer, are often used as coolants. Due to the high cost of energy, using electricity as a heat source is considered to be less feasible [22]. In order to reduce energy costs in thermal destruction facilities, it is, therefore, necessary to develop scientific and technical solutions aimed at improving the quality of the thermal destruction process.
It is known that in order to reduce energy costs, it is possible to artificially enhance the heat transfer by changing the nature of the coolant flow in the channel by transferring it from laminar to turbulent motion [23,24]. The following criterion equations, proposed by Petukhov for laminar flow, can be used to mathematically describe these types of flows (Re < 2300) and by Mikheev for turbulent flow (2300 ≤ Re ≤ 104) [25]. Simplified, these equations can be presented for laminar (1) and turbulent (2) flows as follows:
Nu = 0.146 Re 0.33 Gr 0.1
Nu = 0.018 Re 0.8
where Re is the Reynolds number; Gr is the Grashof number.
When the thermal conductivity is determined using the criterion of Equations (1) and (2), it can be seen that in turbulent gas flows corresponding to higher Reynolds numbers, the thermal conductivity increases and, consequently, the thermal energy requirement of the apparatus decreases. In industry, passive heat exchange intensifiers are used to improve the thermal characteristics of heat exchange equipment by transitioning the coolant (gas) from laminar to turbulent motion [26]. Passive devices used to increase heat exchange are a type of structural modification to the heat exchanger. Their main benefit is to increase the efficiency of waste recycling processes by increasing thermal capacity without adding energy to the equipment.
The intensification of heat and mass exchange processes is an urgent task in the production of hydrocarbon gas, which is required in the complex technology of the production of hydrogen mixtures and hydrogen by the thermal processing of organic raw materials, described in [27,28]. The technology involves two main stages. Sequential controlled thermal decomposition of hydrocarbons into their constituent parts is the essence of the stages. In the first stage, hydrocarbons are formed by breaking down into lighter compounds according to the radical chain mechanism. The second stage involves the decomposition of non-condensable hydrocarbon gases to produce hydrogen-containing mixtures and hydrogen. The purity of the resultant hydrocarbon gas has a direct impact on the quality of the next stage of hydrogen blending and hydrogen production [29]. When C-C bonds are broken, radicals are formed that have an interaction with a larger hydrocarbon molecule. A new aliphatic radical is formed in this reaction. Secondary β-decay reactions also occur, and the resulting radical can enter new reactions and be the source of nucleation for new chains [30]. However, secondary reactions give rise to substances that are pollutants in the hydrocarbon gases. This effect can be reduced by the use of intensification equipment. As mentioned above, with these devices it is possible to add more heat power to the flow. Thus, by heating the feedstock faster, we can avoid or reduce the formation of secondary reactions, thereby making the resulting non-condensable hydrocarbon gas cleaner and the complex process of producing hydrogen mixtures and hydrogen simpler.
The main types of passive intensifiers that are widely used in the industry are as follows:
1. Intensifying turbulators and swirl flow devices. They are devices used to control the flow of liquid or gas in a channel [31]. In particular, the geometry of the devices generates swirls and redistributes the flow velocities and forces. As a result, the coolant path length is increased, entropy generation is minimised and output power is maximised in accordance with the Gouy–Stodola theorem [32,33]. The most commonly used turbulators are twisted tapes and other screw inserts in various configurations [34]. Disadvantages of their use, which have a negative impact on heat transfer and flow parameters, include significant blockage of the flow channel causing flow retardation and increased pumping costs and high pressure drop, which can cause reverse flow and cavitation. Furthermore, these devices are relatively complicated to manufacture and require a significant change in heat exchanger design.
2. Rough surface intensifiers, especially discreet rough surface intensifiers. Surface roughness refers to different types of micro or macro unevenness, periodic or non-periodic, on the surface of the hydraulic channels of equipment or piping [35,36]. A discrete (discontinuous) arrangement of dimples or protrusions of different shapes is usually used to distinguish discrete rough surfaces. Using rough channels helps to increase heat transfer by increasing the area of the heat exchanging surface and transitioning the material flow to the earlier turbulent motion [37]. Rough-surfaced channels have a higher thermal-hydraulic efficiency than turbulence inserts [38]. The technologies are well studied and proven on existing equipment to produce rough surfaces, such as plastic deformation [39] or the cutting of material [40,41].
The geometric parameters, shape and density of rough heat transferring surfaces are covered in many modern studies [36,42,43,44]. High heat transfer rates in systems with rough surfaces are noted by the authors [45,46,47]. The use of ribbed channels and channels with hemispherical dimples/protrusions is the most attractive from the point of view of heat exchange intensification [48,49]. The effect of sinusoidal wave roughness on heat transfer was studied by Xu et al. [50]. Surface roughness was found to play a dominant role in the heat transfer rate increase coefficient. Ebrahimi and Naranjani [51] conducted a numerical investigation of the thermal-hydraulic properties of a flat-plate channel equipped with pyramidal protrusions under laminar flow conditions. Heat transfer was found to increase by 277.9% but with a significant increase in pressure loss, up to 179.4%. The previous numerical studies have reported the enhancement of heat transfer through the use of working fluids, such as nanofluids [52] and shear-thinning liquids [53], in combination with equipping the channels with longitudinal vortex generators. The combination of channel reshaping and specialised working fluids is predominantly employed for the cooling of high-performance electronic devices. In their study, Nagesha et al. [54] analysed the impact of surface roughness elements, such as V-grooves and multiple hemispheres, on heat transfer enhancement in a flat channel under turbulent conditions at room temperature, using both numerical and experimental methods. The study’s findings indicate that multiple hemispheres with significant separation between them lead to higher heat transfer enhancement than V-grooves that are closely spaced together. The hemispherical shaped channels are known to have better flowability. If the flowability is poor, there is flow separation and stagnant zones are formed where there is almost no heat transfer. Due to these phenomena, the efficiency of heat transfer channels with hemispherical dimples/protrusions is close to the efficiency of using circumferentially ribbed tubes [55]. Numerical studies of passive heat transfer intensifiers in the form of spherical depressions are reported by Isaev et al. [56]. While the heat transfer enhancement by spherical depressions is evident, the intensity of swirling currents and the heat transfer coefficient inside the depression is observed to be low, leaving the problem of selecting rational forms of passive intensifiers with the highest thermal and hydraulic characteristics unresolved. In a numerical comparison, Wang et al. [57] compared heat transfer intensifiers in the form of spherical depressions and protrusions in the channel of a tubular heat exchanger using turbulent water flow with a temperature of 546 K. The maximum heat transfer enhancement was 1.94 times in the depression and 2.74 times in the protrusion when compared to a smooth channel wall. Using a roughened surface in the form of hemispherical protrusions can also be justified by the simple technology used to produce them.
Most of the previous studies have investigated the heat transfer characteristics through a numerical simulation, which presents both technological challenges in experimental setups as well as the ability to visualise the simulation results. It is important to note the limited number of studies that have explored the efficiency of passive heat transfer intensification in high-temperature plant operations, especially in industrial waste pyrolysis plants. The majority of the studies on increasing passive heat exchange efficiency are related to cooling physical objects. This involves different modelling conditions, such as the use of the incompressible flow of the working medium and a channel wall heated above the working medium temperature serving as a boundary condition. Nevertheless, there is ample evidence to demonstrate that fitting ducts with vortex generators is a promising method for enhancing passive heat transfer efficiency. The optimal parameters for rough heat exchanger surfaces depend on equipment-specific processes and their process parameters, including the substances used, temperatures and others. In view of the foregoing, the purpose of this article is to study the efficiency of using channels with hemispherical protrusions and their optimal parameters in the complex technology of hydrogen-containing mixtures and hydrogen production during the thermal destruction of hydrocarbon feedstocks in a batch tubular pyrolysis reactor using the COMSOL Multiphysics software product and laboratory experiments.

2. Materials and Methods

2.1. Model and Numerical Method

2.1.1. Geometrical Model

SolidWorks 2020 CAD software was used to create the initial model geometry. The batch pyrolysis reactor was modelled using a reduced scale 1:10 model of the existing apparatus. The geometric dimensions of the reactor model are shown in Figure 1. Pipes 1 and 2 are designed for feedstock inlet and outlet and form a feedstock flow channel with baffles 3. Waste oil was used as the feedstock in this CFD modelling. The space bounded by the inlet 4 and outlet 5 openings forms a flow channel for heating the feedstocks.
The channels through which the coolant flows were a smooth channel and channels with a discrete rough surface in the form of hemispherical protrusions located on the inner surface of the shell 6 (Figure 1). The height and pitch of the hemispherical protrusions were chosen on the basis of the ratio obtained by Solntsev and Krukov for rough surfaces of different pitches [58]:
α α s m = 0.91 + 0.275 ln t / h
where α and αsm—heat transfer coefficients for rough and smooth channels, respectively; t—pitch of the protrusions (mm); h—height of the protrusions (mm). At the same time, the ratio t/h should be ≤10, as maintaining this condition ensures the highest heat transfer efficiency.
In addition, the height of the protrusions also depends on the diameter of the channel with a discrete rough surface. The correction factor obtained by Zlobin and Tarasevich was also used to determine the optimal height of the hemispherical protrusions [59]:
ε p r = 1 + 2.8 h / d e q 0.3
d e q = 4 V π L 0.5
where deq—equivalent diameter (mm); V—channel volume (m3); L—channel length (m). The correction factor εpr is taken into account further for determining the heat transfer intensity and is calculated at Re up to 9∙104 and the ratio of height to equivalent diameter h/deq = 0.025–0.065. This range provides the highest heat transfer efficiency [59]. In simulation modelling, the h/deq ratio was in the range 0.033–0.144, where the expression error is embedded (4).
Thus, the reactor channel was used with the height of the hemispherical protrusions being equal to 1 mm, 2 mm, 3 mm and 4 mm. The pitch, i.e., the distance between the centres of the hemispherical protrusions, was 20 mm along the channel and 9.7 mm along the circumference; the number of protrusions was 150; and the arrangement of the protrusions was staggered. For example, Figure 2 shows the channels with protrusion heights of 1 and 2 mm.

2.1.2. Mathematical Model, Governing Equations and Boundary Conditions

The k-ε model is one of the most commonly used turbulence models for computations in fluid dynamics. The k-ε model was first proposed in 1968 by Harlow and Nakayama [60] as a universal approach to the determination of the missing variable at any point in space. In 1972, after the publication of Launder and Spalding, the formulation of the k-ε model of turbulence acceptable for numerical computations became widespread [61]. The model is widely used in industrial applications due to its robustness to errors and its reasonable accuracy for a wide range of turbulent flows [62]. This model includes two transfer variables: the turbulent kinetic energy k and the dissipation rate of the turbulent kinetic energy ε. The transport equation for the turbulent kinetic energy k was obtained by transforming the Reynolds stress transport equation and has the following form [63]:
ρ ( u . ) k = ( ( μ + μ T σ k ) k ) + P k ρ ε
P k = μ T ( u : ( u + ( u ) T ) 2 3 ( u ) 2 ) 2 3 ρ k u
μ T = ρ C μ k 2 ε
where ρ—density; k—turbulent kinetic energy; u = [ux, uy, uz]—velocity vector in the global coordinates x, y, z; Pk—production term; μ—dynamic viscosity coefficient; μT—turbulent dynamic viscosity coefficient; σk—empirical constant; is a model constant. The transport equation for ε reads:
ρ ( u . ) ε = ( ( μ + μ T σ ε ) ε ) + ε k C ε 1 P K C ε 2 ρ ε
where σε—is the analogue of the Prandtl number for ε; Cε1, Cε2—empirical constants. The empirical constants for the standard k-ε model are assigned the following values [64]: = 0.09; Cε1 = 1.44; Cε2 = 1.92; σk = 1.0; σε = 1.3.
The k-ε model has proven to be stable, relatively computationally inexpensive and of considerable accuracy for a wide range of problems. In addition, the advantage of this model is that it has a relatively low degree of non-linearity, which results in fewer convergence problems. As the model uses adjoint functions, there is no need for strong densification of the mesh near the walls. The disadvantage of this turbulence model is the rather poor results for calculations under large pressure gradients, which is due to the presence of the near-wall functions [65].
In view of the above, it was decided to use the k-ε turbulence closure model for further studies by CFD modelling of heat transfer in a channel with hemispherical protrusions. To investigate the heat transfer properties of a tubular pyrolysis reactor heating hydrocarbon products, CFD modelling was conducted on a circular cross-section channel including hemispherical protrusions of varying heights as a heat exchange mechanism.
The study of the heat exchange efficiency was carried out by comparing the average temperatures in the reaction zone of the reactor at a fixed coolant temperature. The k-ε turbulence model Equations (6)–(9) were solved using the COMSOL Multiphysics software (version 5.5). The CFD commercial code COMSOL Multiphysics software allows us to determine the velocity components and temperature of the non-isothermal, compressible gas flow within the tubular reactor channel by solving the RANS averaged transport equations and adopting eddy viscosity turbulence models:
  • the equation of mass conservation:
ρ t + ( ρ u ) = 0
  • and the momentum conservation equation:
ρ u t + ρ u u = p + τ + F
τ = μ ( u + ( u ) T ) 2 3 μ ( u ) I
where p—pressure; F = [0, −g, 0]T—body force vector; τ—viscous stress; I—identity tensor.
The energy conversion equation for the cooling fluid is expressed as
ρ C p u T + q = Q
q = k f T
where Cp—specific heat capacity; q—conductive heat flux vector; T—absolute temperature; kf—thermal conductivity; Q—heat sources.
Figure 3 shows the boundary conditions for the fluid domain. Nitrogen was used as the heat transfer gas. A standard set of parameters embedded in COMSOL Multiphysics was used to determine the physical properties of the nitrogen. The temperature of the coolant was chosen on the basis of the experimental data obtained at the production plant and was set at 973 K. The inlet coolant flow rate was varied from 1 to 5 m/s with a pitch of 2 m/s. Waste oil, with the characteristics outlined in Table 1, was used as a heated raw material. The waste oil’s initial temperature was 293 K. Due to the fact that the feedstock is in the reactor for approximately 20–25 min, the flow velocity of the waste oil in the reactor was set to 3∙10−4 m/s to indicate the absence of feedstock movement within the reaction zone of the reactor. AISI 310S stainless steel with a thickness of 5 mm is used for the reactor body and elements.
The inlets 1 and 3 of the coolant and oil flows were set to have a fully developed flow condition, in terms of average flow velocity. This was accomplished by selecting the “Fully developed flow” and “Average velocity” options, respectively, as shown in Figure 3. Fully developed flow is a type of boundary condition in COMSOL Multiphysics, where a virtual domain is constructed. The one-dimensional Navier–Stokes equation for stabilised flow is solved within the virtual domain and then transferred to the boundary. This boundary condition variant is available for both laminar and turbulent models. At outlets 2 and 4 (Figure 3) of the coolant and oil flows, respectively, zero gauge pressure (P0 = 0) was set. The parameters for normal flow (selected as “Normal flow” option) and suppression of backflow (selected as “Suppress backflow” option) were configured. The flow modelling considers the incompressible flow condition (selected option: “Compressible Flow (Ma < 0.3))”. All internal surfaces, highlighted in white in the figure, and hemispherical protrusions had a thin layer condition applied (“Thin Layer” option). The adiabatic wall condition was applied to all internal surfaces highlighted in green in the figure. A non-adhering boundary condition was introduced to describe the flow of heat transfer gas and waste oil (“No slip” option). The generalised modelling conditions are summarised in Table 1.
In order to estimate the pressure losses in the channel with the coolant, the friction factor, derived from the Darcy–Weisbach formula, is calculated as follows [66]:
f = 2 Δ p D H ρ u 2 L
where Δp—pressure difference in the channel (based on pressure contours) (Pa); u—average velocity of the coolant flow in the channel (based on velocity contours) (m/s); DH—hydraulic channel diameter (m).

2.1.3. Mesh and Code Validation

A mesh independence test was applied on both the smooth channel and the channel with 3 mm hemispherical protrusions to assess the density of the mesh required. For both channels, five meshes were used, labelled “Coarser”, “Coarse”, “Normal”, “Fine” and “Finer”. The average channel temperature T calculated for each mesh is shown in Figure 4. As can be seen, the “Fine” mesh provides acceptable results and turnaround time, so it was used as the base mesh (Figure 5) for reactors with different channels. The scale residual has convergence conditions of the order of 10−5 for velocity and 10−6 for temperature. The “physics-controlled mesh” parameter was activated to automatically determine the size attributes and the sequence of operations required to generate a mesh adapted to the task, using the internal algorithms of the software package.
The simulation model was compared with previous numerical studies to ensure the accuracy of the results. The model was compared with Wang et al. [57], who modelled a tubular heat exchanger in the FLUENT numerical simulation software environment to investigate channels with different height dimples/protrusions. The comparison of the drag coefficient calculations (15) of the present simulation in COMSOL with the published results is shown in Figure 6.
The comparison with the present work showed a good agreement when the temperature at the inlet of the channel with protrusions was set at 546 K, the pressure at the outlet of this channel was set at 20 MPa, and the height of the hemispherical protrusions was set at 7 mm. At Re = 10,000, the maximum relative error of the calculated drag coefficient was 3.4%. The possible explanations for this error include algorithmic variations in two different commercial CFD modelling software, errors in the solvers themselves, and uncontrolled errors in modelling conditions such as mesh differences. The Reynolds number was defined by the channel inlet velocity uin and the hydraulic diameter DH as
Re = u i n D H / υ

2.2. Laboratory Studies

To conduct the experimental studies, a thermal degradation process unit equipped with a tubular pyrolysis reactor was utilised. This unit can be represented in a simplified manner using the scheme presented in Figure 7. The process unit comprised a heat carrier gas supply unit 1, known as the gas generator, a thermal destruction reactor 2, and a heat carrier channel 3. The thermal destruction reactor 2 was designed in two versions. The first version utilised a reactor with a smooth coolant channel 3, featuring a nominal diameter of 31 mm. In the second option, a reactor 2 with a rough discrete channel 3 having a nominal diameter of 31 mm and hemispherical protrusions 2 mm high (deq = 30.2 mm) was implemented. The design was based on CFD modelling results from this study. The remaining channel geometry also adhered to the parameters presented in Figure 1 and Figure 2. The technological unit also included a Forsthoff Grand-L-Electronic-3400 model hot air gun (Forsthoff GmbH, Solingen, Germany) 4, an OVEN 2TRM1 model thermoregulator-measurer (Production Association OVEN LLC, Ekaterinburg City, Russia) 5 that has an accuracy class of 0.5/0.25 and hoods.
Thermoelectric transducers of type K 7, Panametrics GM868(XGM) flow meters 8 (Baker Hughes (Panametrics), Billerica, MA, USA), and an acoustic signal sensor 9 were utilised to monitor the operating parameters. For acoustic signal detection, a piezoelectric film sensor SDT1-028K (Measurement Specialties, Inc., Hampton, VA, USA) model 9 was used. The sensor has a uniform bandwidth of 10 Hz to 10 MHz and an output resistance of 10 MΩ. Additionally, the sensor’s sensitivity is guaranteed to not be worse than 2% strain.
The VK-701 signal collection board (Vkinging Corporation, Shanghai, China) was used to convert the analogue signal from the acoustic sensor and transmit it to the computer.
Reactor 2 was equipped with a feedstock loading port 10, a reaction product discharge port 11 and a coolant outlet port 12. The unreacted feedstock residue was discharged through the reactor lid 2, which is not displayed in the diagram. In addition, automatic shut-off valves were employed, although they are not shown on the diagram. The pressure control was conducted with the aid of MP100HH pressure gauge 13 (Jumas LLC (scientific production association), Moscow, Russia).
The start of the thermal degradation process involved feeding the feedstock into the reactor via nozzle 10 (refer to Figure 7). The waste engine oil, whose properties are explained in Table 1, served as a feedstock to the reactor. Gas generator 1 facilitated the generation and heating of heat carrier gas at the appropriate temperature, which was then supplied to channel 3 of reactor 2, aided by a hot air gun 4. After releasing the required amount of heat energy, the heat carrier gas was directed to fume hood 6 through branch pipe 12 for further utilisation. The gaseous reaction products resulting from the thermal processing of organic raw material were directed through branch pipe 11 to hood 6 for further processing, in line with the complex technology of hydrogen production and hydrogen-containing mixtures presented in [27,28].
Carbon dioxide was used as a heat carrier gas (CO2) (ρ = 0.533 kg/m3, υ = 77.1·10−6 m2/s, Cp = 1.225 kJ/(kg·K) at 973 K and P0 = 0). The initial coolant temperature was 973 K with laminar and turbulent flows, and the reactor pressure was approximately equal to the atmospheric pressure (P0 = 0). The acoustic signal sensor 9 was used to determine the laminar-to-turbulent transition. Simultaneously, a surge in amplitude was observed on the pulse wave feature when the coolant flow velocity changed. The temperature of the raw material was determined by readings from thermoelectric transducers 7. Once the raw material temperature had stabilised, indicating a steady state in the heat transfer process, all measurements were taken. The required average velocity was regulated by reading flowmeter sensor 8. The sensors recorded all necessary information, while the temperature indicator and its average value was determined with the help of the thermoregulator–measurer.
As previously stated, CFD modelling assumes that the process is adiabatic (with adiabatic reactor surfaces being selected as an option). However, it is impossible to confirm that the process occurs without heat losses through the reactor elements into the environment under experimental conditions. To minimise this factor, thermal insulation materials based on polyisocyanurate foam were applied. Tolerances in the dimensions and shapes of the parts, necessary technological clearances and manufacturing tolerances of the reactor parts can also cause losses. This is the primary assumption considered in the experimental studies. Another assumption involves the allowable deviations in the chemical composition of the steel and the differences in the chemical and/or physical surface treatment technologies of the reactor components, which are used in the experimental study. These factors influence the difference in mechanical and physical properties of the materials and parts used in their production. Furthermore, it is crucial to acknowledge that these properties can change during experimental studies. Finally, experimental studies can be prone to errors, particularly due to uncertainties in the measurements and the parameters produced.
The uncertainties of measured and produced parameters are ±2.8% for the coolant temperature measured by thermoelectric elements, ±3.5% for the coolant flow rate and ±0.01% for the hydrocarbon flow rate obtained by means of flowmeters. The measurement error for the thermometer regulator is ±0.15% and the acoustic signal sensor is ±0.49%.
The heat transfer efficiency was determined by finding the Nusselt number at fluid flow velocities from 1 to 7 m/s with 1 m/s increments. The Nusselt number for a smooth channel was determined using expression (1) for laminar flow and expression (2) for turbulent flow and the same formulae but taking into account the correction factor εpr for a rough channel:
Nu p r = 0.146 Re 0.33 Gr 0.1 ε p r
Nu p r = 0.018 Re 0.8 ε p r
The processing of the experimental results was based on the comparison of the results obtained by experimental means and the results of the analytical solution for coolant flow in smooth and discrete rough channels. The error was estimated as follows:
E r r = N u exp N u a n N u a n 100 %
where Nuexp and Nuan are the Nusselt numbers based on the experimental data and on the analytical calculations, respectively, which are calculated according to the following Formulae (1), (2), (17) and (18). In this case, the correction factor εpr was determined from (4), and to determine the Reynolds number according to (16), the kinematic viscosity of CO2 was determined based on the temperature given for the analytical solution and measured by the above method for experimental studies.
As mentioned above, in order to study a discrete rough surface with hemispherical protrusions, a channel with the protrusion height of 2 mm was created. The technology to obtain a channel with a discrete rough surface consisted of three main stages: forming the thermal contact surface on the sheet material (Figure 8); giving the sheet the required shape; and fixing the sheet with the thermal contact surface using an adhesive. Similar to the CFD modelling, the reactor material used here was AISI 310S steel. The hemispherical protrusions were formed using knurling technology with a forming tool. This technology was chosen for the trial because of its ability to create complex protrusion profiles as an alternative to thin sheet forging. The results of the tests will be presented in future studies. The forming tool is shown in Figure 9.
The forming tool (Figure 9) was a hollow shaft 8 supported by a holder 7 in the form of a U-shaped frame. A drum 4 was mounted on a shaft 8. The drum 4 consisted of assembly sections—inserts 1, the number of which was adjusted according to the width of the sheet material and the required discrete roughness of the surface. The inserts 1 could be quickly mounted on the drum 4. A convex relief 2 was formed on the working surface of the inserts 1 so that when knurling took place, recesses were created that were a reflection of the relief 2 on the workpiece 3. The smooth and discrete rough channels were brought to Ra = 0.11 µm by grinding the channel with a diamond-coated needle and then polishing the channel with ASM 7/3 diamond paste. The roughness of the channel surfaces was measured using a HOMMEL Tester T2000 (Hommelwerke GmbH, Ingelheim am Rhein, Germany) profilograph-profilometer.

3. Results and Discussion

3.1. CFD-Modelling

The CFD modelling was performed with the same parameters for a smooth channel and a channel with hemispherical protrusions of different sizes to determine the benefits of using discrete rough channels. The temperature distribution contours obtained in COMSOL Multiphysics for a flat channel and a channel with hemispherical protrusions of 1 mm height are shown in Figure 10. Figure 11 shows the temperature distribution contours for the protrusion heights of 2 and 3 mm.
The average temperature in the reaction chamber of the reactor was used to estimate the heat transfer efficiency of the channels. According to the results of the CFD modelling, it becomes obvious that the first factor influencing the heat transfer was the flow velocity of the coolant, regardless of the pipe geometry (with or without protrusions). For example, for the smooth channel (Figure 10a–c) with an initial coolant temperature of 973 K and coolant flow rates of 1, 3 and 5 m/s, the average waste oil temperatures were 778, 854.5 and 880.5 K, respectively. The same pattern of increasing average temperature with increasing coolant flow velocity is observed for rough channels (Figure 10d–f).
The second factor with an impact on heat transfer was the modification of the channel geometry with a discrete rough surface. Modification of the channel with hemispherical protrusions of 1 mm height contributed to a slight increase in the average temperature in the reactor, which was 794.8, 865.5 and 888.6 K at coolant flow velocities of 1, 3 and 5 m/s, respectively (Figure 10d–f). Compared to the smooth channel, the percentage increases in average temperature in the reactor reaction chamber were 2.1, 1.3 and 0.9% for coolant flow rates of 1, 3 and 5 m/s, respectively. The insignificant increase in the average temperature is explained by the fact that the condition t/h ≤ 10 from Equation (3) is not fulfilled, as well as by the insignificant entry of the correction factor εpr from Equation (4) into the threshold, which is confirmed by the corresponding calculations (t = 20 mm, h = 1 mm, t/h = 20 and h/deq = 0.033).
The third factor with an impact on heat transfer was the change in geometry of the discrete rough surface. Increasing the height of the hemispherical protrusions to 2 mm, while maintaining the pitch, contributes to a more significant increase in the average temperature in the reactor reaction chamber (Figure 11a–c). The mean temperature index values in this case were 818, 880.1 and 899.7 K at coolant flow rates of 1, 3 and 5 m/s, respectively. Compared to the smooth channel, the percentage increases in the average temperature in the reactor reaction chamber were 4.9, 2.9 and 2.1% for the coolant flow velocities of 1, 3 and 5 m/s, respectively. The value of t/h is 10, and the value of h/deq = 0.066.
Higher mean temperatures were observed at 3 mm protrusion height (Figure 11d–f). At coolant flow rates of 1, 3 and 5 m/s, the temperatures in the reaction chamber were 830.3, 888.9 and 907.5 K, respectively (t/h = 6.67, h/deq = 0.102). If we express these figures as percentages, we can see that the average temperature increases by 6.3, 3.9 and 3%, respectively, in comparison with the smooth channel.
The clear influence of protrusion height on the reaction chamber average temperature in the tubular pyrolysis reactor can be illustrated by the graph shown in Figure 12. The average reactor temperature did not increase significantly when the height of the protrusions was increased to 4 mm (t/h = 5, h/deq = 0.144). This advantage was only 6, 3.2 and 2.8 K at coolant flow velocities of 1, 3 and 5 m/s, respectively, compared to a 3 mm channel.
The insignificant overshoot of the h/deq ratio of the correction factor εpr at the height of the protrusions of 2 mm can be explained by the error in the SFD modelling related both to the experimental conditions (type and parameters of the mesh, boundary conditions, etc.) and to the approximate analytical solution of the correction factor εpr by expression (4). Exceeding the limits of the h/deq ratio in the case of a 3 mm protrusion height is accompanied by a decrease in the rise in the average temperature of the reactor reaction chamber. When using 2 mm high protrusions, the average temperature increased by 19.2–40 K compared to the smooth channel; then, when 3 mm protrusions were applied, the average temperature increase amounted to 27–52.3 K compared to the smooth channel. When the height of the protrusions was further increased to 4 mm, the h/deq increased and resulted in even lower average temperature gains (heat transfer efficiency), which generally showed a decrease in the average temperature rise per millimetre of protrusion and good agreement with the need to ensure the condition h/deq = 0.025–0.065. This indicates that it is inappropriate to analyse the effect of further increasing the height of the protrusions with a set pitch, given the negative effects of a jump-like increase in hydraulic resistance to flow when increasing the height of the protrusions, which is analysed below.
The influence of the coolant flow velocity u and the height of the hemispherical protrusions on the friction factor f is shown in Figure 13.
The analysis of the data obtained shows that with the appearance of hemispherical protrusions and the increase in their height, the friction factor increases. Increasing the height of the protrusions creates a greater hydraulic resistance, which, in turn, has a positive effect on the heat transfer capacity of the channel, up to a certain limit. The highest coefficient of hydraulic resistance is observed at a coolant flow rate of 1 m/s in all of the channels taken into consideration. Between 1 and 3 m/s, the greater the drop rate f, the higher the height of the protrusion and, consequently, the pressure drop in the channel. At 3 m/s, the slope of the friction factor curve is altered. Between 3 and 5 m/s the curve becomes almost linear, with the square of the coolant flow rate being proportional to and almost equal to the pressure drop. From this, it can be concluded that increasing the coolant flow rate from 3 m/s and above is not advisable in view of the increase in the cost of maintaining a high coolant flow rate and the low indicators of increasing the heat transfer capacity of the channel. It was found that increasing the height of the protrusions up to 4 mm significantly increases the hydraulic resistance without significantly increasing the average temperature of the channel. This phenomenon can be explained by the fact that the height of the protrusions relative to the channel diameter reaches such values that the vortices formed become less stable, resulting in an increased probability of their entering the main flow.

3.2. Experimental Studies

The kinematic viscosity of CO2 was assumed to be 77.1·10−6 m2/s (at 973 K) for the analytical solution. The CO2 temperature obtained during the experimental studies and the corresponding kinematic viscosity of the coolant are shown in Table 2.
Based on the data in Table 2, the numbers Re and Nu were calculated. The compared calculations of the analytical solution of Rean and Nuan, based on the experiment Reexp and Nuexp, are given for both types of channels in Table 3. For clarity, Figure 14 shows the variation in the Nusselt criterion as a function of different Reynolds numbers for a smooth channel and a channel with 2 mm high hemispherical protrusions.
In the range of coolant velocities investigated, the heat transfer performance increases non-linearly with the Reynolds number. The growth of Nu is quite intense in the range of Re numbers from 419 to 838 (coolant velocity from 1 to 2 m/s). This is probably due to the fact that at Re = 419, the vortex (disturbance) formed by the protrusion has a small force, which does not allow it to be fully distributed behind the protrusion. Starting from Re~838, the vortex formation increases, the flow strength stabilises, and the further growth of the heat transfer intensity is almost linear up to Re = 2021 (coolant velocity—5 m/s). This phenomenon can also be observed in the results of the CFD modelling. As the coolant flow rate was increased up to ~3 m/s, the curve also showed intense growth, and from 3 m/s the curve growth rate slowed, which is expressed as flow stabilisation (Figure 12). In the range of Re ~ 2410–2795 (6–7 m/s) the flow becomes transitional and the influence of the protrusions on the heat transfer intensity becomes smaller, which is expressed in a smaller difference between the ratio of Nu numbers of the channel with protrusions and the smooth channel (Figure 14).
Comparing the Nusselt numbers obtained for the coolant flow in a smooth channel and a channel with hemispherical protrusions of 2 mm height, the efficiency of the latter becomes obvious. The protuberance surface significantly improves the heat transfer characteristics, as shown in Table 3 and Figure 14. A more than two-fold increase in the heat transfer capacity of the reactor, according to the Nusselt criterion, is observed in the rough channel. On average, a channel with protrusions increases heat transfer by 2.23 times compared to a smooth channel. At the same time, this ratio of heat transfer intensities decreases slightly at Re > 2300, probably due to the increase in the dead zone behind the protrusion and, consequently, the decrease in the working surface of the rough channel. These results correlate well with [57], where a more than twofold increase in Nu is also observed for channels with grooves of different structures compared to a smooth channel, and the influence of the dead zone of channels with protrusions is also noted.
The experimental results on the heat transfer of a smooth channel and a channel with hemispherical protrusions of 2 mm height can be considered satisfactory. The error Err of the experimental data with the analytical calculation was in the range of 0.77 to 3.01% for the smooth channel (Table 3). For the channel with hemispherical protrusions of 2 mm in height, the error Err was in the range of 1.54 to 3.61%. In general, increasing the Reynolds number resulted in a decrease in error due to a smaller change in the viscosity of carbon dioxide.
Several conclusions can be drawn about the changes in thermal conductivity in channels with hemispherical protrusions by analysing the results obtained from CFD modelling and experimental studies:
  • The inclusion of spherical protrusions in the channel of a tubular pyrolysis reactor enhances heat transfer. Studies have found that the pressure difference between the two sides of the protrusion causes the detachment of the flow from the edges, resulting in the generation of longitudinal, transverse and horseshoe vortices [67]. The protrusions enable the slow and inactive part of the flow (known as the wall flow) to be redirected around the protrusion, resulting in the formation of a horseshoe vortex that reduces the thickness of the boundary layer. This is especially true in laminar flow conditions [68]. In addition, vortices created by the protrusions improve fluid mixing and hinder the growth of the thermal boundary layer, leading to an increase in the efficiency of heat exchange [53]. At the same time, a stagnant (dead) zone is created at the back of the protrusion [57]. This limits the average temperature rise as the height of the protrusions increases. However, an increase in the height of the protrusions contributes to an increase in the average heat transfer, an increase in the amount of turbulence near the wall and, thus, an intensification of the heat transfer.
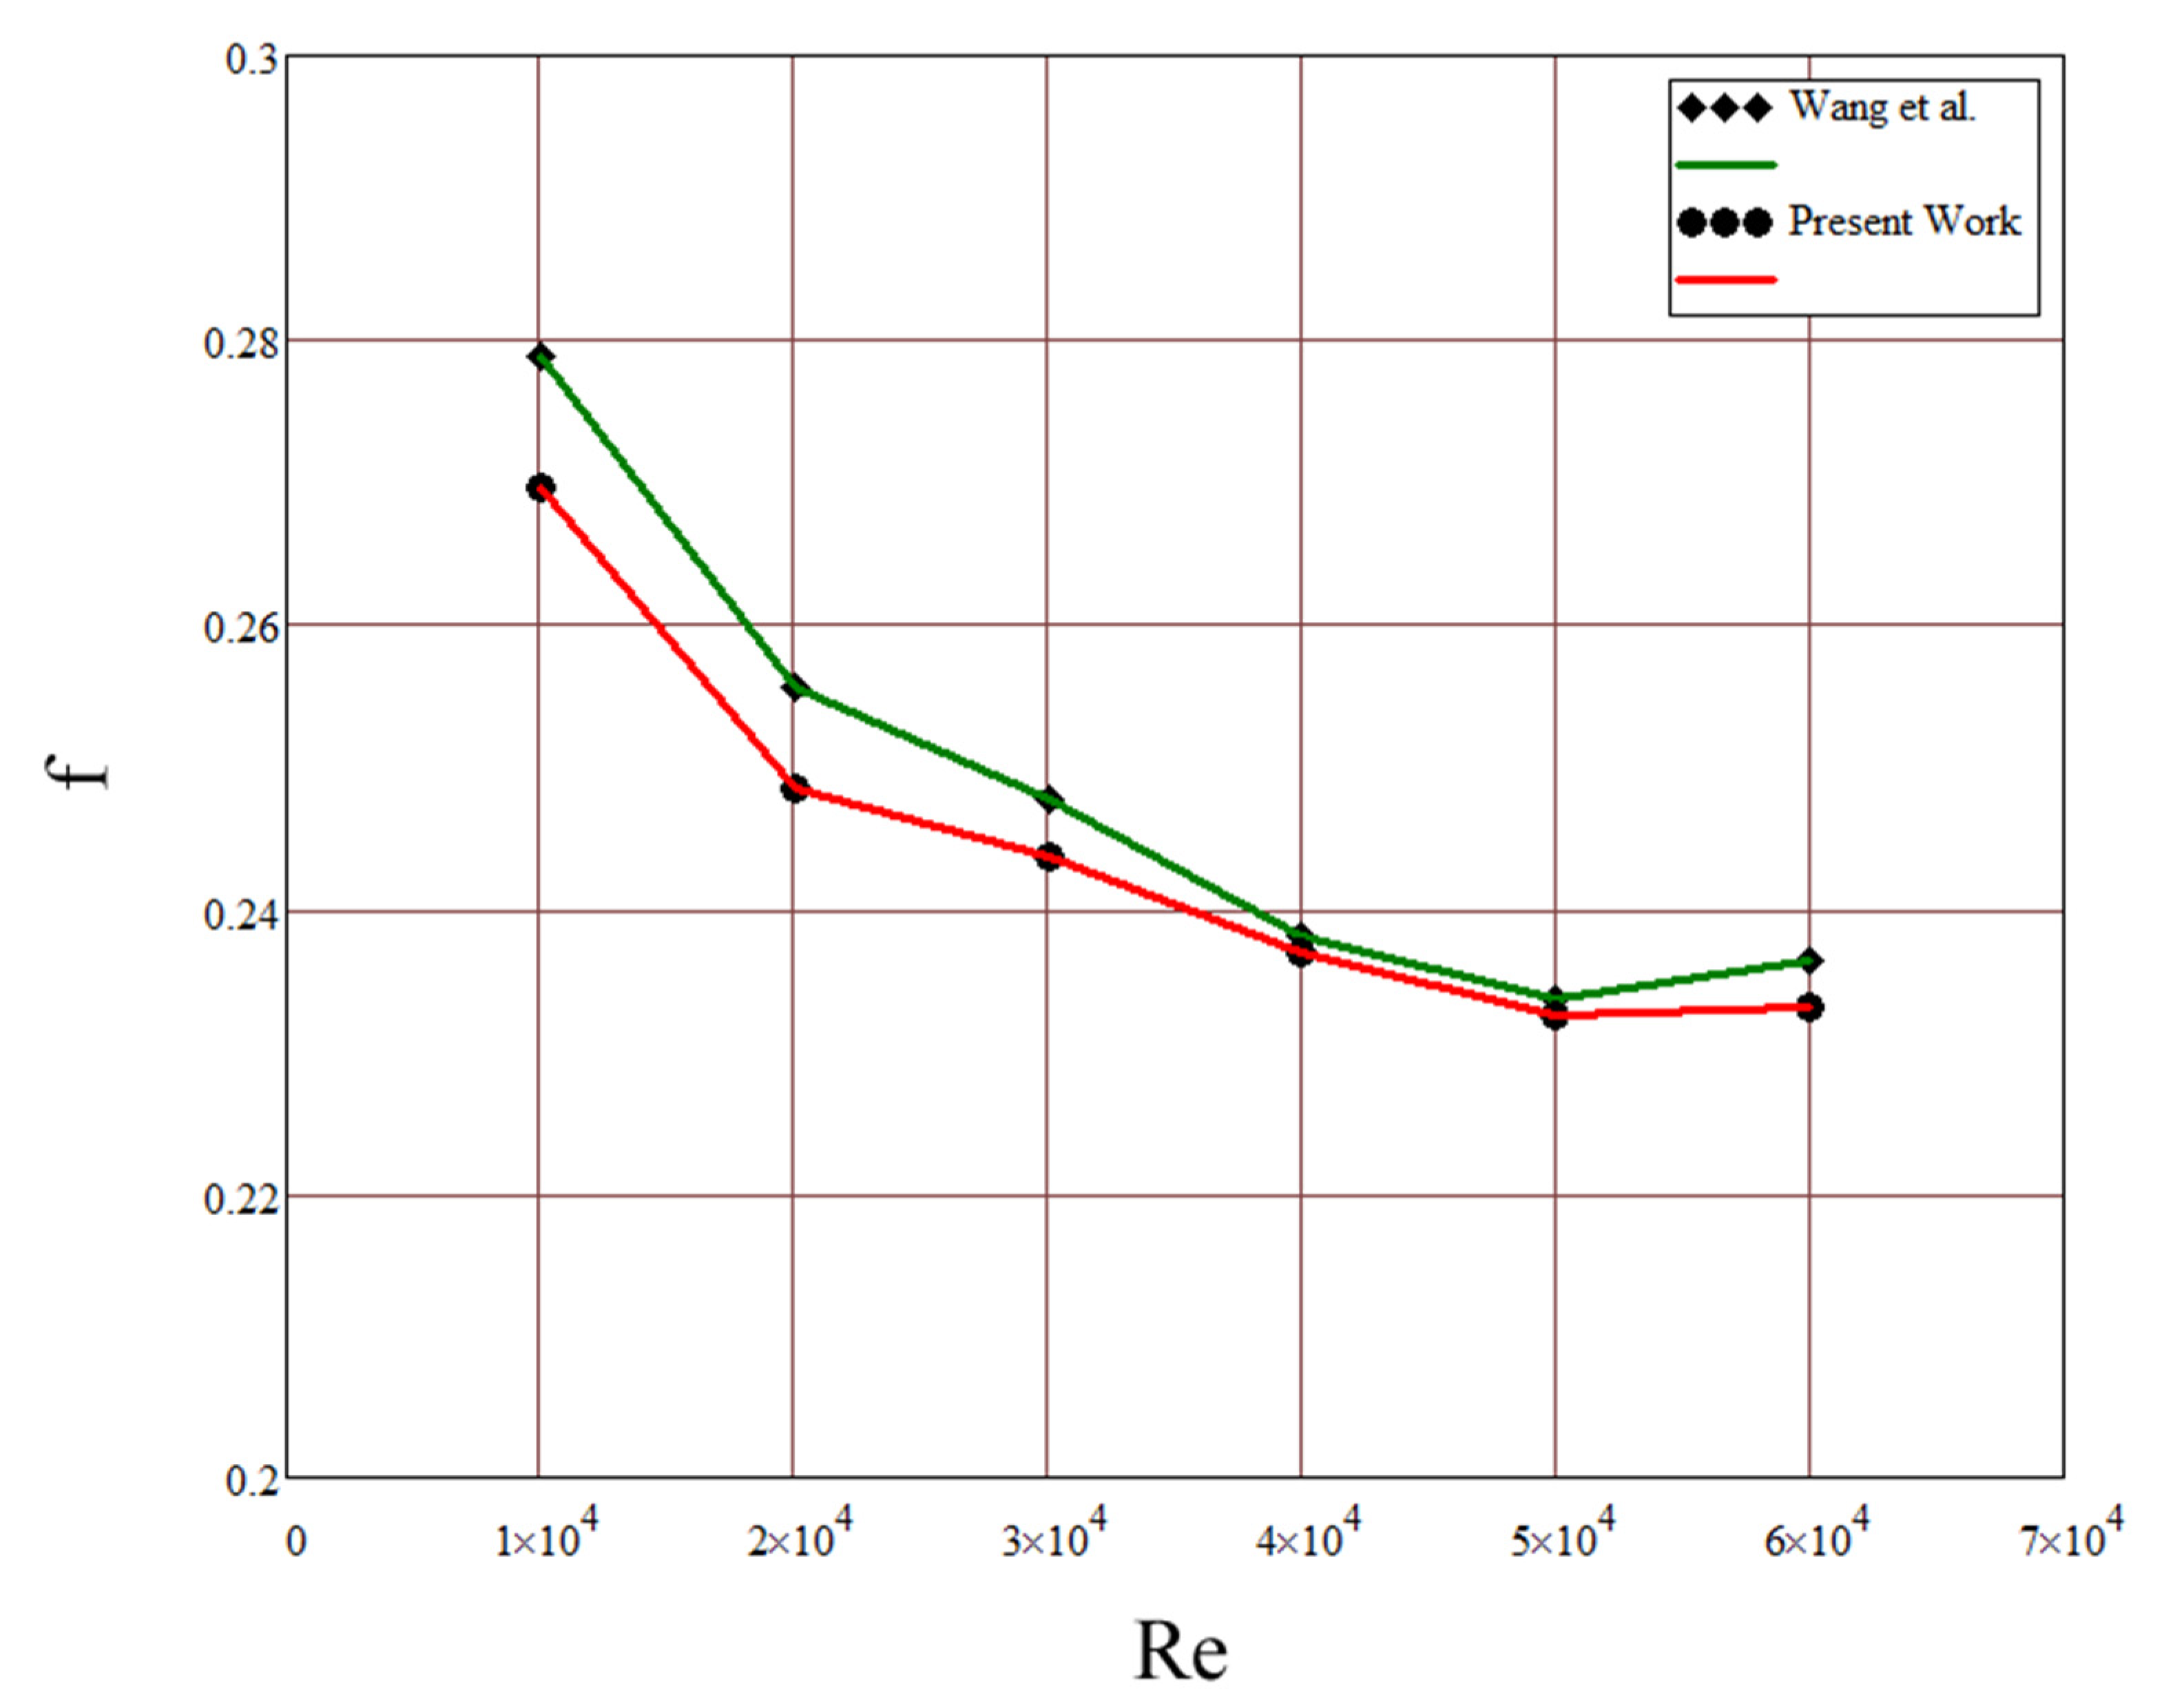
  • Increasing the coolant flow rate led to an increase in the average temperature in the reactor reaction chamber in all cases. At the same time, the heat transfer increased. This phenomenon’s results are obtained through flow visualisation using thermochromic liquid crystals [69]. In the case of flow over spherical protrusions, it is demonstrated that at Re = 550, a laminar flow is observed over the protrusion. However, the protrusion creates perturbations in the wake, resulting in an increased heat release. Upon Re increment to 1025, the flow behind the protrusion separates, forming a substantial recirculation zone. Simultaneously, the instability of the recirculation zone is observed, introducing perturbations in the flow behind the protrusion, causing further heat transfer intensification in the trail. A faster laminar–turbulent transition is favoured by the presence of hemispherical protrusions on the channel surface. In addition to the change in the character of the obtained curves, the onset of the transition regime is confirmed by the data obtained from the acoustic signal sensor, where a characteristic amplitude spike in the pulse wave characteristic is observed when the flow velocity changes (Figure 15). The acceleration of the transition up to critical Reynolds numbers due to the presence of discrete roughness is also confirmed by the data obtained for channels with spherical grooves [70].
  • The enhancement of heat transfer in channels featuring hemispherical protrusions during flow regime transition can be explained by the formation of a viscous sublayer phenomenon. The vortex formation as the Reynolds number changes can be visualised in the diagram in Figure 16.
  • The protrusions are completely covered by the viscous sublayer if the thickness of the viscous sublayer is greater than the height of the protrusions (H > h). As can be seen from the scheme presented (Figure 16a), the low flow velocities of the coolant flow smoothly around the hemispherical protrusions and do not significantly affect the flow pattern. As the Reynolds number increases, the thickness of the viscous sublayer decreases. After reaching a certain condition, the ductile sublayer thickness may be less than the height of the protrusions (H < h) (Figure 16b). This, in turn, results in the dissipation of the kinetic energy of the flow turbulence, improving the heat transfer between the heat transfer medium and the heat transfer surface.
  • Increasing the coolant flow rate in tubular pyrolysis reactors can help reduce their mass dimension indicators by increasing heat exchange efficiency. However, the physical and chemical properties of heat transfer fluids are worth considering. Therefore, if the heat transfer fluids have drastically different heat transfer coefficients, the velocity of the heat transfer fluid with the higher heat transfer coefficient has little effect on the heat transfer coefficient. For this reason, it may be necessary to make dimensional adjustments to the reactor design.

4. Conclusions

The thermal-hydraulic characteristics of channels with hemispherical protrusions in tubular pyrolysis reactors were analysed through numerical and experimental studies. The results of heat transfer variation for surfaces modified by roughness elements were compared with those for a smooth surface. The velocity of the coolant flow for CFD modelling ranged from 1 to 5 m/s in intervals of 2 m/s, while for laboratory experiments, the flow velocity ranged from 1 to 7 m/s in intervals of 1 m/s (419 ≤ Re ≤ 2795). The protrusion heights of 1, 2, 3 and 4 mm were analysed for CFD modelling, whereas the laboratory experiments utilised a height of 2 mm based on the results from the CFD modelling analysis.
The hemispherical protrusions present on the channel surface facilitate an earlier laminar–turbulent transition compared to a smooth channel. An uneven increase in the average temperature in the reactor reaction chamber was observed when increasing the height of protrusions while maintaining the pitch. The heat transfer is on average increased 2.23 times more in the channel with protrusions compared to a smooth channel. The maximum increase in the average channel temperature was observed at a protrusion height of 2 mm. Increasing the height of the protrusions results in a decrease in the average temperature increase due to the increase in the stagnant zone behind these protrusions. This stagnant zone reduces the working surface of the rough channel. Irrespective of the type of channel, increasing the coolant velocity results in an increase in heat transfer and a drop in the friction factor when non-uniform velocity is present. It is not recommended to increase the coolant flow velocity beyond 3 m/s (Re = 1175) due to the high costs of maintaining this velocity and the low increase in the heat transfer capacity of the channel.
The use of passive heat exchange process intensifiers in tubular pyrolysis reactors at the first stage (pyrolysis of feedstock) for the complex technology of organic waste utilisation has a positive effect on the quality of hydrogen-containing mixtures and hydrogen production. The intensification of thermal energy transfer helps to minimise secondary decomposition reactions, thus, reducing the amount of pollutants produced by pyrolysis of non-condensable hydrocarbon gas wastes. The direct influence of the intensification of heat exchange processes at the complex technology of organic raw materials thermal processing on the quality of hydrogen-containing mixtures and hydrogen production is planned to be presented in future works. Planned studies will investigate the impact of protrusion pitch (density) and placement in the channel of a tubular pyrolysis reactor on heat transfer.

Author Contributions

Conceptualisation, O.A.K., K.A.B. and N.A.S.; methodology, K.A.B., O.A.K., S.O.K., E.V.T. and N.A.S.; validation, R.B.S., O.A.K. and P.L.P.; formal analysis, N.A.S., R.A.V. and S.O.K.; investigation, O.A.K., K.A.B., R.B.S. and P.L.P.; resources, E.V.T., R.A.V., S.O.K. and P.L.P.; data curation, R.B.S., S.O.K. and R.A.V.; writing—original draft preparation, K.A.B., O.A.K. and E.V.T.; writing—review and editing, K.A.B., O.A.K., N.A.S. and E.V.T.; visualisation, O.A.K., K.A.B., P.L.P. and R.A.V.; supervision, S.O.K., E.V.T. and R.B.S.; project administration, S.O.K. and E.V.T.; funding acquisition, K.A.B. All authors have read and agreed to the published version of the manuscript.

Funding

The studies were carried out according to the state assignment from the Ministry of Science and Higher Education of the Russian Federation for the project “Development of a set of scientific and technical solutions in the field of creating biofuels and optimal biofuel compositions, providing the possibility of transforming consumed types of energy in accordance with trends in energy efficiency, reducing the carbon footprint of products and using alternative fuels to fossil fuels” (Contract FSRZ-2021-0012), in the scientific laboratory of biofuel compositions of the Siberian Federal University, created as part of the activities of the Scientific and Educational Center “Yenisei Siberia”.

Institutional Review Board Statement

Not applicable.

Informed Consent Statement

Not applicable.

Data Availability Statement

Not applicable.

Conflicts of Interest

The authors declare no conflict of interest.

Nomenclature

CpSpecific heat capacity, kJ/(kg·K)qConductive heat flux vector, W/m2
Cε1, Cε2Empirical constantsQHeat sources, W/m3
Cμk-ε model constantRaRoughness, µm
deqEquivalent diameter, mmReReynolds number
DHHydraulic diameter, mReanReynolds number based on analytical calculations
ErrComparison errorReexpReynolds number based on experimental data
fFriction factortPitch of the protrusions, mm
FBody force vector, NTAbsolute temperature
GrGrashof numberuAverage velocity, m/s
hHeight of the protrusions, mmuinInlet velocity, m/s
IIdentity tensorui,kFluctuation velocities of particles in turbulent motion, m/s
kTurbulent kinetic energyVChannel volume, m3
kfThermal conductivity, W/(m·k)Greek symbols
LChannel length, mαHeat transfer coefficient for rough channel
MaMach numberαsmHeat transfer coefficient for smooth channel
NuNusselt numberεTurbulent dissipation rate
NuanNusselt number based on analytical calculationsεprCorrection factor
NuexpNusselt number based on experimental dataμDynamic viscosity, Pa·s
NuprNusselt number based forrough channelμTTurbulent dynamic viscosity, Pa·s
pPressure, PaυKinematic viscosity, m2/s
ΔpPressure drop on the flow channel, PaρDensity, kg/m3
P0Gauge pressureσk, σεEmpirical constants
PkProduction termτViscous stress, MPa

References

  1. Asim, N.; Badiei, M.; Torkashvand, M.; Mohammad, M.; Alghoul, M.A.; Gasaymeh, S.S.; Sopian, K. Wastes from the Petroleum Industries as Sustainable Resource Materials in Construction Sectors: Opportunities, Limitations, and Directions. J. Clean. Prod. 2021, 284, 125459. [Google Scholar] [CrossRef]
  2. Jąderko-Skubis, K. Production of Alternative Fuels from Waste: Assumptions for the Design of New Fuel Recipes. Int. J. Sustain. Eng. 2021, 14, 1157–1169. [Google Scholar] [CrossRef]
  3. Artiola, J.F. Industrial Waste and Municipal Solid Waste Treatment and Disposal. In Environmental and Pollution Science; Academic Press: Cambridge, MA, USA, 2019; pp. 377–391. [Google Scholar] [CrossRef]
  4. Farzadkia, M.; Jorfi, S.; Nikzad, M.; Nazari, S. Evaluation of Industrial Wastes Management Practices: Case Study of the Savojbolagh Industrial Zone, Iran. Waste Manag. Res. 2020, 38, 44–58. [Google Scholar] [CrossRef] [PubMed]
  5. Garcia, A.; Gandini, A.; Labidi, J.; Belgacem, N.; Bras, J. Industrial and Crop Wastes: A New Source for Nanocellulose Biorefinery. Ind. Crops Prod. 2016, 93, 26–38. [Google Scholar] [CrossRef]
  6. Hui, K.; Tang, J.; Lu, H.; Xi, B.; Qu, C.; Li, J. Status and Prospect of Oil Recovery from Oily Sludge: A Review. Arab. J. Chem. 2020, 13, 6523–6543. [Google Scholar] [CrossRef]
  7. Verweij, J.M. Hydrocarbon Migration Systems Analysis; Elsevier: Amsterdam, The Netherlands, 1993. [Google Scholar] [CrossRef]
  8. Liu, X.; Wang, X.; Meng, X. Carbon Emission Scenario Prediction and Peak Path Selection in China. Energies 2023, 16, 2276. [Google Scholar] [CrossRef]
  9. Schirrmeister, L.; Froese, D.; Tumskoy, V.; Grosse, G.; Wetterich, S. Yedoma: Late Pleistocene Ice-Rich Syngenetic Permafrost of Beringia. In The Encyclopedia of Quaternary Science; Elias, S., Ed.; Elsevier: Amsterdam, The Netherlands, 2013; pp. 542–552. [Google Scholar]
  10. Lee, H.; Yi, S.; Holsen, T.M.; Seo, Y.; Choi, E. Estimation of CO2 emissions from Waste Incinerators: Comparison of Three Methods. Waste Manag. 2018, 73, 247–255. [Google Scholar] [CrossRef]
  11. Zhang, H.; Pham, C.-T.; Chen, B.; Zhang, X.; Wang, Y.; Bai, P.; Zhang, L.; Nagao, S.; Toriba, A.; Nghiem, T.-D.; et al. Main Emission Sources and Health Risks of Polycyclic Aromatic Hydrocarbons and Nitro-Polycyclic Aromatic Hydrocarbons at Three Typical Sites in Hanoi. Atmosphere 2023, 14, 782. [Google Scholar] [CrossRef]
  12. Stettler, M.E.J.; Mino, W.; Ainalis, D.; Achurra-Gonzalez, P.; Speirs, J.; Cooper, J.; Dong-Ha, L.; Brandon, N.; Hawkes, A. Review of Well-To-Wheel Lifecycle Emissions of Liquefied Natural Gas Heavy Goods Vehicles. Appl. Energy 2023, 333, 120511. [Google Scholar] [CrossRef]
  13. Khalili-Garakani, A.; Nezhadfard, M.; Iravaninia, M. Enviro-Economic Investigation of Various Flare Gas Recovery and Utilization Technologies in Upstream and Downstream of Oil and Gas Industries. J. Clean. Prod. 2022, 346, 131218. [Google Scholar] [CrossRef]
  14. Bashmur, K.A.; Kolenchukov, O.A.; Bukhtoyarov, V.V.; Tynchenko, V.S.; Kurashkin, S.O.; Tsygankova, E.V.; Kukartsev, V.V.; Sergienko, R.B. Biofuel Technologies and Petroleum Industry: Synergy of Sustainable Development for the Eastern Siberian Arctic. Sustainability 2022, 14, 13083. [Google Scholar] [CrossRef]
  15. Kharkov, V. Thermal Distillation Study on Heat and Mass Transfer Improvement of Column Contact Devices. J. Jpn. Pet. Inst. 2015, 58, 189–196. [Google Scholar] [CrossRef]
  16. Hampel, U.; Schubert, M.; Döß, A.; Sohr, J.; Vishwakarma, V.; Repke, J.U.; Gerke, S.J.; Leuner, H.; Rädle, M.; Kapoustina, V.; et al. Recent Advances in Experimental Techniques for Flow and Mass Transfer Analyses in Thermal Separation Systems. Chem. Ing. Tech. 2020, 92, 926–948. [Google Scholar] [CrossRef]
  17. Madyshev, I.N.; Dmitrieva, O.S.; Dmitriev, A.V. Heat-Mass Transfer Efficiency Within the Cooling Towers with Jet-Film Contact Devices. MATEC Web Conf. 2018, 194, 01036. [Google Scholar] [CrossRef]
  18. Fulgencio-Medrano, L.; García-Fernández, S.; Asueta, A.; Lopez-Urionabarrenechea, A.; Perez-Martinez, B.B.; Arandes, J.M. Oil Production by Pyrolysis of Real Plastic Waste. Polymers 2022, 14, 553. [Google Scholar] [CrossRef] [PubMed]
  19. Cheng, S.; Wang, Y.; Gao, N.; Takahashi, F.; Li, A.; Yoshikawa, K. Pyrolysis of Oil Sludge with Oil Sludge Ash Additive Employing a Stirred Tank Reactor. J. Anal. Appl. Pyrolysis 2016, 120, 511–520. [Google Scholar] [CrossRef]
  20. Pandey, U.; Stormyr, J.A.; Hassani, A.; Jaiswal, R.; Haugen, H.H.; Britt, M.E. Pyrolysis of Plastic Waste to Environmentally Friendly Products. In Energy Production and Management in the 21st Century IV; Moldestad University of South-Eastern Norway: Kongsberg, Norway, 2020; p. 61. [Google Scholar] [CrossRef]
  21. Yansaneh, O.Y.; Zein, S.H. Recent Advances on Waste Plastic Thermal Pyrolysis: A Critical Overview. Processes 2022, 10, 332. [Google Scholar] [CrossRef]
  22. Kubba, S. Chapter Nine—Impact of Energy and Atmosphere. In Handbook of Green Building Design and Construction, 2nd ed.; Kubba, S., Ed.; Butterworth-Heinemann: Cambridge, MA, USA, 2017; pp. 443–571. [Google Scholar]
  23. Patil, P.M.; Yadav, A.P.; Patil, P.A. Comparative Study between Heat Transfer through Laminar Flow and Turbulent Flow. Int. J. Innov. Res. Sci. Eng. Technol. 2015, 4, 2223–2226. [Google Scholar]
  24. Celata, G.P.; Cumo, M.; McPhail, S.J.; Zummo, G. Single-Phase Laminar and Turbulent Heat Transfer in Smooth and Rough Microtubes. Microfluid. Nanofluid. 2007, 3, 697–707. [Google Scholar] [CrossRef]
  25. Kandlikar, S.; Garimella, S.; Li, D.; Colin, S.; King, M.R. Heat Transfer and Fluid Flow in Minichannels and Microchannels; Elsevier: Amsterdam, The Netherlands, 2006. [Google Scholar]
  26. Mousavi Ajarostaghi, S.S.; Zaboli, M.; Javadi, H.; Badenes, B.; Urchueguia, J.F. A Review of Recent Passive Heat Transfer Enhancement Methods. Energies 2022, 15, 986. [Google Scholar] [CrossRef]
  27. Kolenchukov, O.A.; Bashmur, K.A.; Bukhtoyarov, V.V.; Kurashkin, S.O.; Tynchenko, V.S.; Tsygankova, E.V.; Sergienko, R.B.; Kukartsev, V.V. Experimental Study of Oil Non-Condensable Gas Pyrolysis in a Stirred-Tank Reactor for Catalysis of Hydrogen and Hydrogen-Containing Mixtures Production. Energies 2022, 15, 8346. [Google Scholar] [CrossRef]
  28. Kolenchukov, O.A.; Bashmur, K.A.; Bukhtoyarov, V.V.; Sergienko, R.B.; Tynchenko, V.S. The Experimental Research of n-Butane Pyrolysis Using an Agitator. SOCAR Proc. 2022, 85, 29–34. [Google Scholar] [CrossRef]
  29. Dunker, A.M.; Kumar, S.; Mulawa, P.A. Production of Hydrogen by Thermal Decomposition of Methane in a Fluidized-Bed Reactor—Effects of Catalyst, Temperature, and Residence Time. Int. J. Hydrogen Energy 2006, 31, 473–484. [Google Scholar] [CrossRef]
  30. Xie, W.-L.; Hu, B.; Liu, Y.; Fu, H.; Liu, J.; Zhang, B.; Lu, Q. Unraveling the Radical Chain Mechanism in the Pyrolysis of β-O-4 Linked Lignin: The Role of Aliphatic Substituents. Proc. Combust. Inst. 2023, 39, 3303–3311. [Google Scholar] [CrossRef]
  31. Manglik, R.M.; Bergles, A.E. Swirl Flow Heat Transfer and Pressure Drop with Twisted-Tape Inserts. Adv. Heat Transf. 2003, 36, 183–266. [Google Scholar] [CrossRef]
  32. Desale, P.S.; Ghuge, N.C. Effect of Use of Swirl Flow Devices to Improve Heat Transfer Rate in Heat Exchangers. Int. J. Adv. Sci. Technol. 2014, 11, 235–243. [Google Scholar]
  33. Mwesigye, A.; Bello-Ochende, T.; Meyer, J.P. Heat transfer and entropy generation in a parabolic trough receiver with wall-detached twisted tape inserts. Int. J. Therm. Sci. 2016, 99, 238–257. [Google Scholar] [CrossRef]
  34. Nanan, K.; Yongsiri, K.; Wongchareec, K.; Thianpong, C.; Eiamsa-ard, S. Heat Transfer Enhancement by Helically Twisted Tapes Inducing Co- and Counter-Swirl Flows. Int. Commun. Heat Mass Transf. 2013, 46, 67–73. [Google Scholar] [CrossRef]
  35. Hudina, M. Rough Surface Heat Transfer and Pressure Drop; EIR-Bericht Nr. 474; Eidg. Institut für Reaktorforschung: Würenlingen, Switzerland, 1982. [Google Scholar]
  36. Kolenchukov, O.A.; Kolenchukova, T.N.; Bashmur, K.A.; Bukhtoyarov, V.V.; Sergienko, R.B. Discrete Rough Surface Intensifiers in the Thermal Decomposition Plants: Current Status and Future Potential. SOCAR Proc. 2023, 91, 1–8. [Google Scholar] [CrossRef]
  37. Bergles, A.E. Heat Transfer Enhancement—The Maturing of Second-Generation Heat Transfer Technology. Heat Transf. Eng. 1997, 18, 47–55. [Google Scholar] [CrossRef]
  38. Leontiev, A.I.; Popov, I.A.; Gortyshov, Y.F.; Olympiev, V.V.; Kas’kov, S.I. Efficiency of Surface Heat Transfer Intensifiers for Laminar and Turbulent Flows in Heat Exchanger Channels. In Proceedings of the ASME 2006 International Mechanical Engineering Congress and Exposition, Chicago, IL, USA, 5–10 November 2006; ASME: New York, NY, USA, 2007; pp. 637–644. [Google Scholar] [CrossRef]
  39. Bulatov, V.P.; Krasny, V.A.; Schneider, Y.G. Basics of Machining Methods to Yield Wear- and Fretting-Resistive Surfaces, Having Regular Roughness Patterns. Wear 1997, 208, 132–137. [Google Scholar] [CrossRef]
  40. Ali, S.; Kurniawan, R.; Moran, X.; Ahmed, F.; Danish, M.; Aslantas, K. Effect of Micro-Dimple Geometry on the Tribological Characteristics of Textured Surfaces. Lubricants 2022, 10, 328. [Google Scholar] [CrossRef]
  41. Petrovsky, E.A.; Bashmur, K.A.; Shadchina, Y.N.; Bukhtoyarov, V.V.; Tynchenko, V.S. Study of Microrelief Forming Technology on Sliding Bearings for Oil and Gas Centrifugal Units. J. Phys. Conf. Ser. 2019, 1399, 055032. [Google Scholar] [CrossRef]
  42. Cui, J.; Cui, Y. Effects of Surface Wettability and Roughness on the Heat Transfer Performance of Fluid Flowing through Microchannels. Energies 2015, 8, 5704–5724. [Google Scholar] [CrossRef]
  43. Ying, P.; He, Y.; Tang, H.; Ren, Y. Numerical and Experimental Investigation of Flow and Heat Transfer in Heat Exchanger Channels with Different Dimples Geometries. Machines 2021, 9, 72. [Google Scholar] [CrossRef]
  44. Mironov, A.; Isaev, S.; Skrypnik, A.; Popov, I. Numerical and Physical Simulation of Heat Transfer Enhancement Using Oval Dimple Vortex Generators—Review and Recommendations. Energies 2020, 13, 5243. [Google Scholar] [CrossRef]
  45. Hussain, L.; Khan, M.M.; Masud, M.; Ahmed, F.; Rehman, Z.; Amanowicz, Ł.; Rajski, K. Heat Transfer Augmentation through Different Jet Impingement Techniques: A State-of-the-Art Review. Energies 2021, 14, 6458. [Google Scholar] [CrossRef]
  46. Mahmood, G.I.; Ligrani, P.M.; Sabbagh, M.Z. Heat Transfer in a Channel with Dimples and Protrusions on Opposite Walls. J. Thermophys. Heat Transf. 2012, 15, 275–283. [Google Scholar] [CrossRef]
  47. Bagheri, E.; Wang, B.C. Direct Numerical Simulation of Turbulent Heat Transfer in Concentric Annular Pipe Flows. Phs. Fluids 2021, 33, 055131. [Google Scholar] [CrossRef]
  48. Zhang, D.-H.; Li, G.-Q.; Xie, G.-N.; Shi, Z.-C. Numerical Research on Flow and Heat Transfer Performance in Rotating Channel with Hemispherical Dimples or Protrusions. Appl. Math. Mech. 2013, 34, 965–975. [Google Scholar] [CrossRef]
  49. Olimpiev, V.V.; Mirzoev, B.G. Effectiveness of Channels with Heat Transfer Intensifiers in the Form of Protrusions. Therm. Eng. 2013, 60, 182–189. [Google Scholar] [CrossRef]
  50. Xu, P.; Sasmito, A.P.; Qiu, S.; Mujumdar, A.S.; Xu, L.; Geng, L. Heat Transfer and Entropy Generation in air Jet Impingement on a Model Rough Surface. Int. Commun. Heat Mass Transf. 2016, 72, 48–56. [Google Scholar] [CrossRef]
  51. Ebrahimi, A.; Naranjani, B. An Investigation on Thermo-Hydraulic Performance of a Flat-Plate Channel with Pyramidal Protrusions. Appl. Therm. Eng. 2016, 106, 316–324. [Google Scholar] [CrossRef]
  52. Naranjani, B.; Roohi, E.; Ebrahimi, A. Thermal and Hydraulic Performance Analysis of a Heat Sink with Corrugated Channels and Nanofluids. J. Therm. Anal. Calorim. 2020, 146, 2549–2560. [Google Scholar] [CrossRef]
  53. Ebrahimi, A.; Naranjani, B.; Milani, S.; Javan, F.D. Laminar Convective Heat Transfer of Shear-Thinning Liquids in Rectangular Channels with Longitudinal Vortex Generators. Chem. Eng. Sci. 2017, 173, 264–274. [Google Scholar] [CrossRef]
  54. Nagesha, K.; Srinivasan, K.; Sundararajan, T. Enhancement of Jet Impingement Heat Transfer Using Surface Roughness Elements at Different Heat Inputs. Exp. Therm. Fluid Sci. 2019, 112, 109995. [Google Scholar] [CrossRef]
  55. Hwang, S.D.; Cho, H.H. Heat Transfer Enhancement of Internal Passage Using Dimple/Protrusion. In Proceedings of the International Heat Transfer Conference 13, Sydney, Australia, 13–18 August 2006; pp. 10–17. [Google Scholar] [CrossRef]
  56. Isaev, S.; Leontiev, A.; Chudnovsky, Y.; Nikushchenko, D.; Popov, I.; Sudakov, A. Simulation of Vortex Heat Transfer Enhancement in the Turbulent Water Flow in the Narrow Plane-Parallel Channel with an Inclined Oval-trench Dimple of Fixed Depth and Spot Area. Energies 2019, 12, 1296. [Google Scholar] [CrossRef]
  57. Wang, Z.; Wang, Y.; Zhang, J.; Li, S.; Xu, Y. Numerical Simulation of Heat Transfer Performance of a Dimpled Tubular Heat Exchanger. Appl. Sci. 2022, 12, 12965. [Google Scholar] [CrossRef]
  58. Kryukov, V.N.; Solntsev, V.P. Investigation of Heat Transfer on a Rough Plate. Heat Transf. Sov. Res. 1973, 5, 102–105. [Google Scholar]
  59. Zlobin, A.V.; Tarasevich, S.É. Hydraulic Resistance of Pipes with Uniform Continuous Roughness in the Form of a Metric Thread of Varying Profile and an Inserted Twisted Tape. J. Eng. Phys. Thermophy. 2020, 93, 1226–1232. [Google Scholar] [CrossRef]
  60. Asinari, P.; Fasano, M.; Chiavazzo, E. A Kinetic Perspective on k–ε Turbulence Model and Corresponding Entropy Production. Entropy 2016, 18, 121. [Google Scholar] [CrossRef]
  61. Lopez-Santana, G.; Kennaugh, A.; Keshmiri, A. Experimental Techniques against RANS Method in a Fully Developed Turbulent Pipe Flow: Evolution of Experimental and Computational Methods for the Study of Turbulence. Fluids 2022, 7, 78. [Google Scholar] [CrossRef]
  62. Menter, F.R. Two-Equation Eddy-Viscosity Turbulence Models for Engineering Applications. AIAA J. 1994, 32, 1598–1605. [Google Scholar] [CrossRef]
  63. Versteeg, H.K.; Malalasekera, W. An Introduction to Computational Fluid Dynamics: The Finite Volume Method, 2nd ed.; Pearson Education Limited: London, UK, 2007. [Google Scholar]
  64. Wilcox, D.C. Turbulence Modeling for CFD, 3rd ed.; DCW Industries: La Cãnada, CA, USA, 2006. [Google Scholar]
  65. Bardina, J.; Huang, P.; Coakley, T. Turbulence Modeling Validation, Testing, and Development. NASA Tech. Memo. 1997, 110446, 147. [Google Scholar]
  66. Sun, H.; Fu, H.; Yan, L.; Ma, H.; Luan, Y.; Magagnato, F. Numerical Investigation of Flow and Heat Transfer in Rectangular Microchannels with and without Semi-Elliptical Protrusions. Energies 2022, 15, 4927. [Google Scholar] [CrossRef]
  67. Ahmed, H.E.; Mohammed, H.A.; Yusoff, M.Z. An Overview on Heat Transfer Augmentation Using Vortex Generators and Nanofluids: Approaches and Applications. Renew. Sustain. Energy Rev. 2012, 16, 5951–5993. [Google Scholar] [CrossRef]
  68. Alshroof, O.; Reizes, J.; Timchenko, V.; Leonardi, E. Heat Transfer Enhancement in Laminar Flow by a Protrusion in a Rectangular Channel. In Proceedings of the CHT-08 ICHMT International Symposium on Advances in Computational Heat Transfer, Marrakesh, Morocco, 11–16 May 2008. CHT-08-404. [Google Scholar] [CrossRef]
  69. Alshroof, O.; Doig, G.; Barber, T.J.; Neely, A.J.; Timchenko, V. The Use of Thermochromic Liquid Crystals to Investigate Heat Transfer Enhancement in a Channel with a Protrusion. In Proceedings of the 17th Australasian Fluid Mechanics Conference, Auckland, New Zealand, 5–9 December 2010. [Google Scholar]
  70. Vicente, P.G.; García, A.; Viedma, A. Experimental Study of Mixed Convection and Pressure Drop in Helically Dimpled Tubes for Laminar and Transition Flow. Int. J. Heat Mass Transf. 2002, 45, 5091–5105. [Google Scholar] [CrossRef]
Figure 1. The reactor model geometrical dimensions (protrusions are not shown and all dimensions are in millimetres (mm), where: 1—feedstock inlet pipe; 2—feedstock outlet pipe; 3—baffle; 4—coolant flow channel inlet; 5—coolant flow channel outlet; 6—shell.
Energies 16 06086 g001
Figure 2. Channel models with hemispherical protrusions used in CFD modelling: (a) protrusion height—1 mm; (b) protrusion height—2 mm.
Energies 16 06086 g002
Figure 3. Fluid domain boundary nomenclature, where: 1—coolant channel inlet; 2—coolant channel outlet; 3—waste oil channel inlet; 4—waste oil channel outlet.
Energies 16 06086 g003
Figure 4. Grid independence test for a smooth channel (left) and a channel with 3 mm protrusions (right), showing the average channel temperature calculated for different precision meshes at 3 m/s gas velocity.
Energies 16 06086 g004
Figure 5. COMSOL Mesh.
Energies 16 06086 g005
Figure 6. Model validation [57].
Energies 16 06086 g006
Figure 7. Experimental thermal destruction unit diagram, where: 1—gas-heat carrier supply block; 2—thermal destruction reactor; 3—heat carrier channel; 4—hot air gun; 5—thermoregulation measuring device; 6—hood; 7—thermoelectric transducers; 8—flow meters; 9—acoustic signal sensor; 10—raw material loading pipe; 11—reaction product unloading pipe; 12—heat carrier outlet pipe; 13—pressure gauge.
Energies 16 06086 g007
Figure 8. Sheet metal element with thermal contact surface (photographed after use in the reactor).
Energies 16 06086 g008
Figure 9. Forming tool, where: 1—section insert; 2—relief; 3—workpiece; 4—drum; 5—tool holder; 6—support sleeve; 7—holder; 8—shaft; 9—axis.
Energies 16 06086 g009
Figure 10. Temperature distribution contours (K): (ac)—smooth channels with coolant flow velocity of 1, 3 and 5 m/s, respectively; (df)—rough channels with hemispherical protrusions of 1 mm height with the coolant flow velocity of 1, 3 and 5 m/s, respectively.
Energies 16 06086 g010
Figure 11. Temperature distribution contours (K): (ac)—rough channels with hemispherical protrusions of 2 mm height with the coolant flow velocity of 1, 3 and 5 m/s, respectively; (df)—rough channels with hemispherical protrusions of 3 mm height with the coolant flow velocity of 1, 3 and 5 m/s, respectively.
Energies 16 06086 g011
Figure 12. Effect of coolant velocity and protrusion height on average reactor channel temperature.
Energies 16 06086 g012
Figure 13. Variation in friction factor with coolant velocity.
Energies 16 06086 g013
Figure 14. Variation in Nusselt number with Reynolds number.
Energies 16 06086 g014
Figure 15. The pulse wave (Re~2410).
Energies 16 06086 g015
Figure 16. Flow diagram of hemispherical protrusions under different flow conditions: (a) laminar, (b) turbulent.
Energies 16 06086 g016
Table 1. CFD modelling conditions.
ParameterValue
Pressure in the channelsZero gauge pressure (P0 = 0)
Working gas (heat carrier)Nitrogen
Gas velocity, m/s1, 3 and 5
Gas initial temperature, K973
Gas density, kg/m3 at 973 K and P0 = 00.340
Gas viscosity, mm2/s at 973 K and P0 = 0116.7·10−6
Gas specific heat capacity, kJ·kg−1K−1 at 973 K and P0 = 01.161
Raw materialWaste oil
Oil density, kg/m3 at 15 °C878
Oil viscosity, mm2/s at 40 °C5.4
Oil specific heat capacity, kJ·kg−1K−1 at 40 °C2.173
Oil flow velocity, m/s3∙10−4
Initial oil temperature, K293
Reactor materialAISI 310S steel
AISI 310S thermal conductivity, W·m−1K−114.2
Turbulence modelk-ε
Height of hemispherical protrusions, mm1, 2, 3 and 4
Turbulent flow modeFully developed flow
Housing thickness (reactor vessel), mm5
Properties of housing (reactor vessel)Thin layer, nonlayered shell
Table 2. Temperature measured and the corresponding CO2 viscosity.
Velocity, m/sSmooth ChannelChannel with Protrusions
Temperature, KViscosity, 10−6·m2/sTemperature, KViscosity, 10−6·m2/s
194272.9093672.10
294873.7594373.08
395474.6095074.05
495975.1995374.39
596375.7795574.72
696576.0495975.18
796776.3096275.64
Table 3. Calculated results for determining heat exchange intensity.
Channel Typeu, m/sReanReexpNuanNuexpErr (19), %
Smooth Channel14024252.993.083.01
28048413.763.852.39
3120612474.294.371.86
4160816494.734.791.27
5201020465.085.130.98
6241224469.159.251.09
72815284410.3510.430.77
Channel with Protrusions13924196.656.893.61
27838388.368.663.60
3117512239.559.762.20
41567162410.5010.701.90
51959202111.3111.501.68
62350241020.0620.472.04
72742279522.7023.051.54
Disclaimer/Publisher’s Note: The statements, opinions and data contained in all publications are solely those of the individual author(s) and contributor(s) and not of MDPI and/or the editor(s). MDPI and/or the editor(s) disclaim responsibility for any injury to people or property resulting from any ideas, methods, instructions or products referred to in the content.

