Article

An EV Charging Guidance Strategy Based on the Hierarchical Comprehensive Evaluation Method

1
School of Electrical Electronic Engineering, Shandong University of Technology, Zibo 255020, China
2
School of Business, Shandong University of Technology, Zibo 255000, China
*
Author to whom correspondence should be addressed.
Energies 2023, 16(7), 3113; https://doi.org/10.3390/en16073113
Submission received: 22 February 2023 / Revised: 18 March 2023 / Accepted: 27 March 2023 / Published: 29 March 2023

Abstract

:
With the increasing number of electric vehicles (EVs), the randomness of the charging load will have an increasing impact on the distribution network (DN) and road network. Different guidance strategies lead to different network-related capabilities of fast charging stations (FCSs). In this paper, a hierarchical and comprehensive evaluation method is proposed for the network-related capability of FCSs. Based on the comprehensive evaluation method, a charging guidance strategy is proposed to improve the network-related capability of FCSs. Finally, the network connection capability of FCSs under four strategies is comprehensively evaluated to verify the effectiveness of the proposed method.

1. Introduction

Electric vehicles (EVs) have been considered as a feasible solution to deal with high fuel consumption and greenhouse gas emissions [1,2]. The global stock of EVs increased by 68% with respect to the previous year, and it targets a 30% sales share for EVs by 2030 [3]. Therefore, the charging load will become one of the important loads of the distribution network. However, the uncontrolled nature of charging may have adverse effects on the distribution network and road network [4,5,6].
At present, the research mainly focuses on the impact assessment of electric vehicles on the distribution network. Wang, H. [7] proposed a comprehensive risk assessment method for distribution network operation, considering multiple risk factors in view of the security, economic, and other operational risks caused by EVs’ access to the distribution network. The principal component analysis method was used to reduce the dimensions of the risk assessment matrix and calculate the objective weight coefficient, and the acceptable number of electric vehicles in the region was estimated. Chen, W. [8] proposed the evaluation index system of distribution network carrying capacity, and evaluated the carrying capacity of the distribution network from the aspects of technical rationality, safety, reliability, and economy. Wang, J. [9] evaluated the economic performance of fast charging stations (FCSs) from the aspects of investment costs and operating benefits.
In order to reduce the adverse impact of a charging load on the power system, Li, D. [10] proposed a charging guidance strategy based on the real-time demand of the market. Through the application of the strategy, EVs can obtain subsidies for charging or discharging. However, the author did not consider the negative impact of a large number of EVs charging on the power system. In order to improve the consumption level of renewable energy generation, Ding, Z. [11] proposed a charging guidance strategy for the operation of highway FCSs. However, the operation status of the power system mentioned in [11] is relatively fixed. In order to reasonably guide EVs to the FCSs, T. Zhao [12] proposed a charging price formulation strategy based on the Stackelberg game. EVs can be guided to the appropriate FCSs to complete charging according to the change in price. X. Sun [13] proposed a voltage control strategy for the distribution network based on charging navigation. The operation level of the distribution network has been effectively improved. In order to reduce the travel cost and improve the operation level of the distribution network, H. Yang [14] proposed the road speed matrix acquisition and recovery algorithm to achieve the orderly charge and discharge of EVs, and improve the load operation level of the distribution network.
At the same time, some scholars also began to study how to mitigate the impact of EVs on the power system and road network. In order to meet the charging demand of EVs and reduce the traffic burden, Li, X. [15] proposed a charging navigation strategy for EVs based on price incentives. In order to relieve the charging problem at peak hours, J. Tan [16] proposed a charging guidance strategy based on a hierarchical game. A non-cooperative game is used to simulate competition between FCSs. The evolutionary game is used to realize the decision-making and selection of EVs. The reliability of the distribution network and the utilization efficiency of FCSs were improved. Z. Moghaddam [17] proposed an intelligent charging guidance strategy based on the EV network. The charging time, driving time, and charging cost were considered. Shi, X. [18] proposed an electric EV charging guidance strategy based on locational marginal prices (LMP). The congestion problem of traffic and power lines was alleviated. Z. Jin [19] proposed a charging guidance strategy based on the alliance blockchain for the taxi charging system to maximize passenger satisfaction and the service efficiency of operators. Qian, T. [20] proposed an EV charging guidance strategy based on deep reinforcement learning. However, the proposed strategy did not analyze the impact on the power system and road network.
Furthermore, Zenginis I [1] proposed a charging price strategy based on the daily profits of FCSs and charging waiting time which effectively avoided the congestion in FCSs. Y. Xiang [21] studied the interaction of EVs in the process of path planning, and proposed an optimization method of the EV charging path based on an event-driven pricing strategy.
Although the above article alleviates the impact of EV charging on the power system and road network, it does not offer a quantitative analysis of the network connection capability of FCSs. The main contributions of this article are as follows:
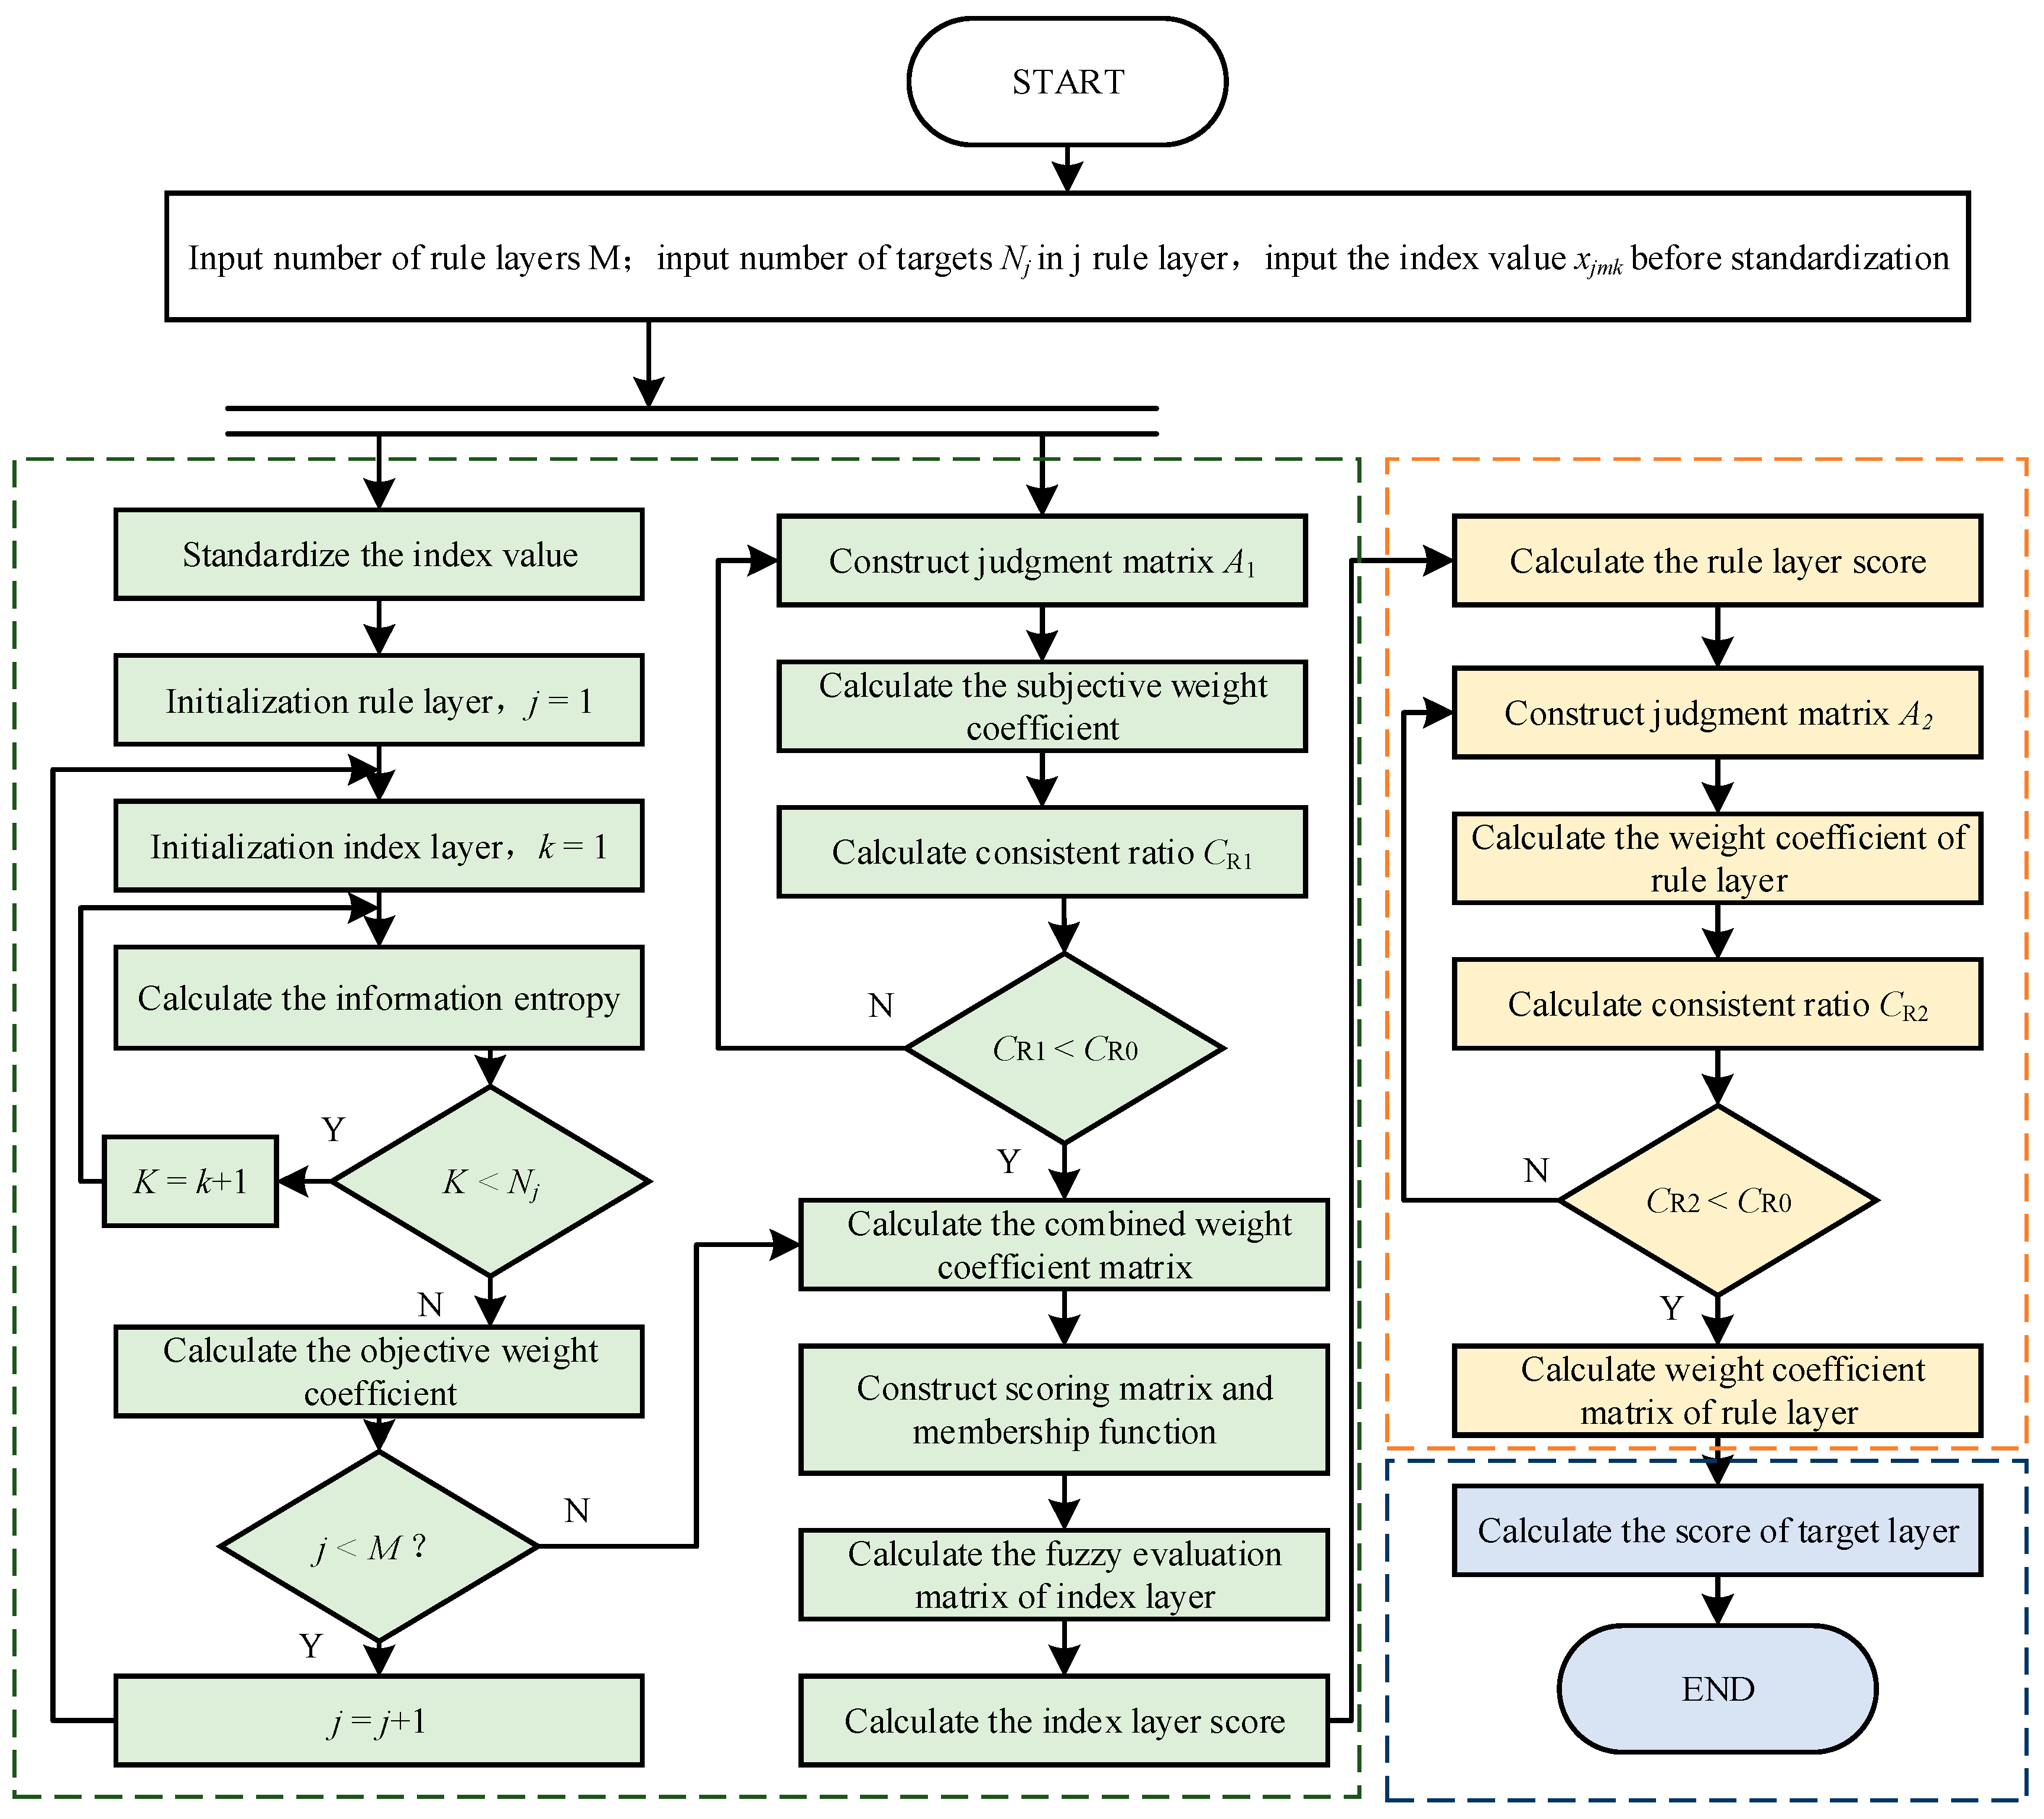
(1) A hierarchical comprehensive evaluation architecture for the network-related capability of fast charging stations is proposed. The architecture is mainly divided into three layers which comprehensively evaluate the operation status of the system under different guidance strategies. From the three dimensions of the index layer, the rule layer, and the target layer, the network-related capability of FCSs can be evaluated quantitatively.
(2) A hierarchical comprehensive evaluation method is proposed. In the index layer, a combination weighting method based on the entropy weight method (EWM) and analytic hierarchy process (AHP) is proposed to allocate the weight of indicators. In addition, the fuzzy comprehensive evaluation method (FCEM) is applied to evaluate the network-related capability of FCSs.
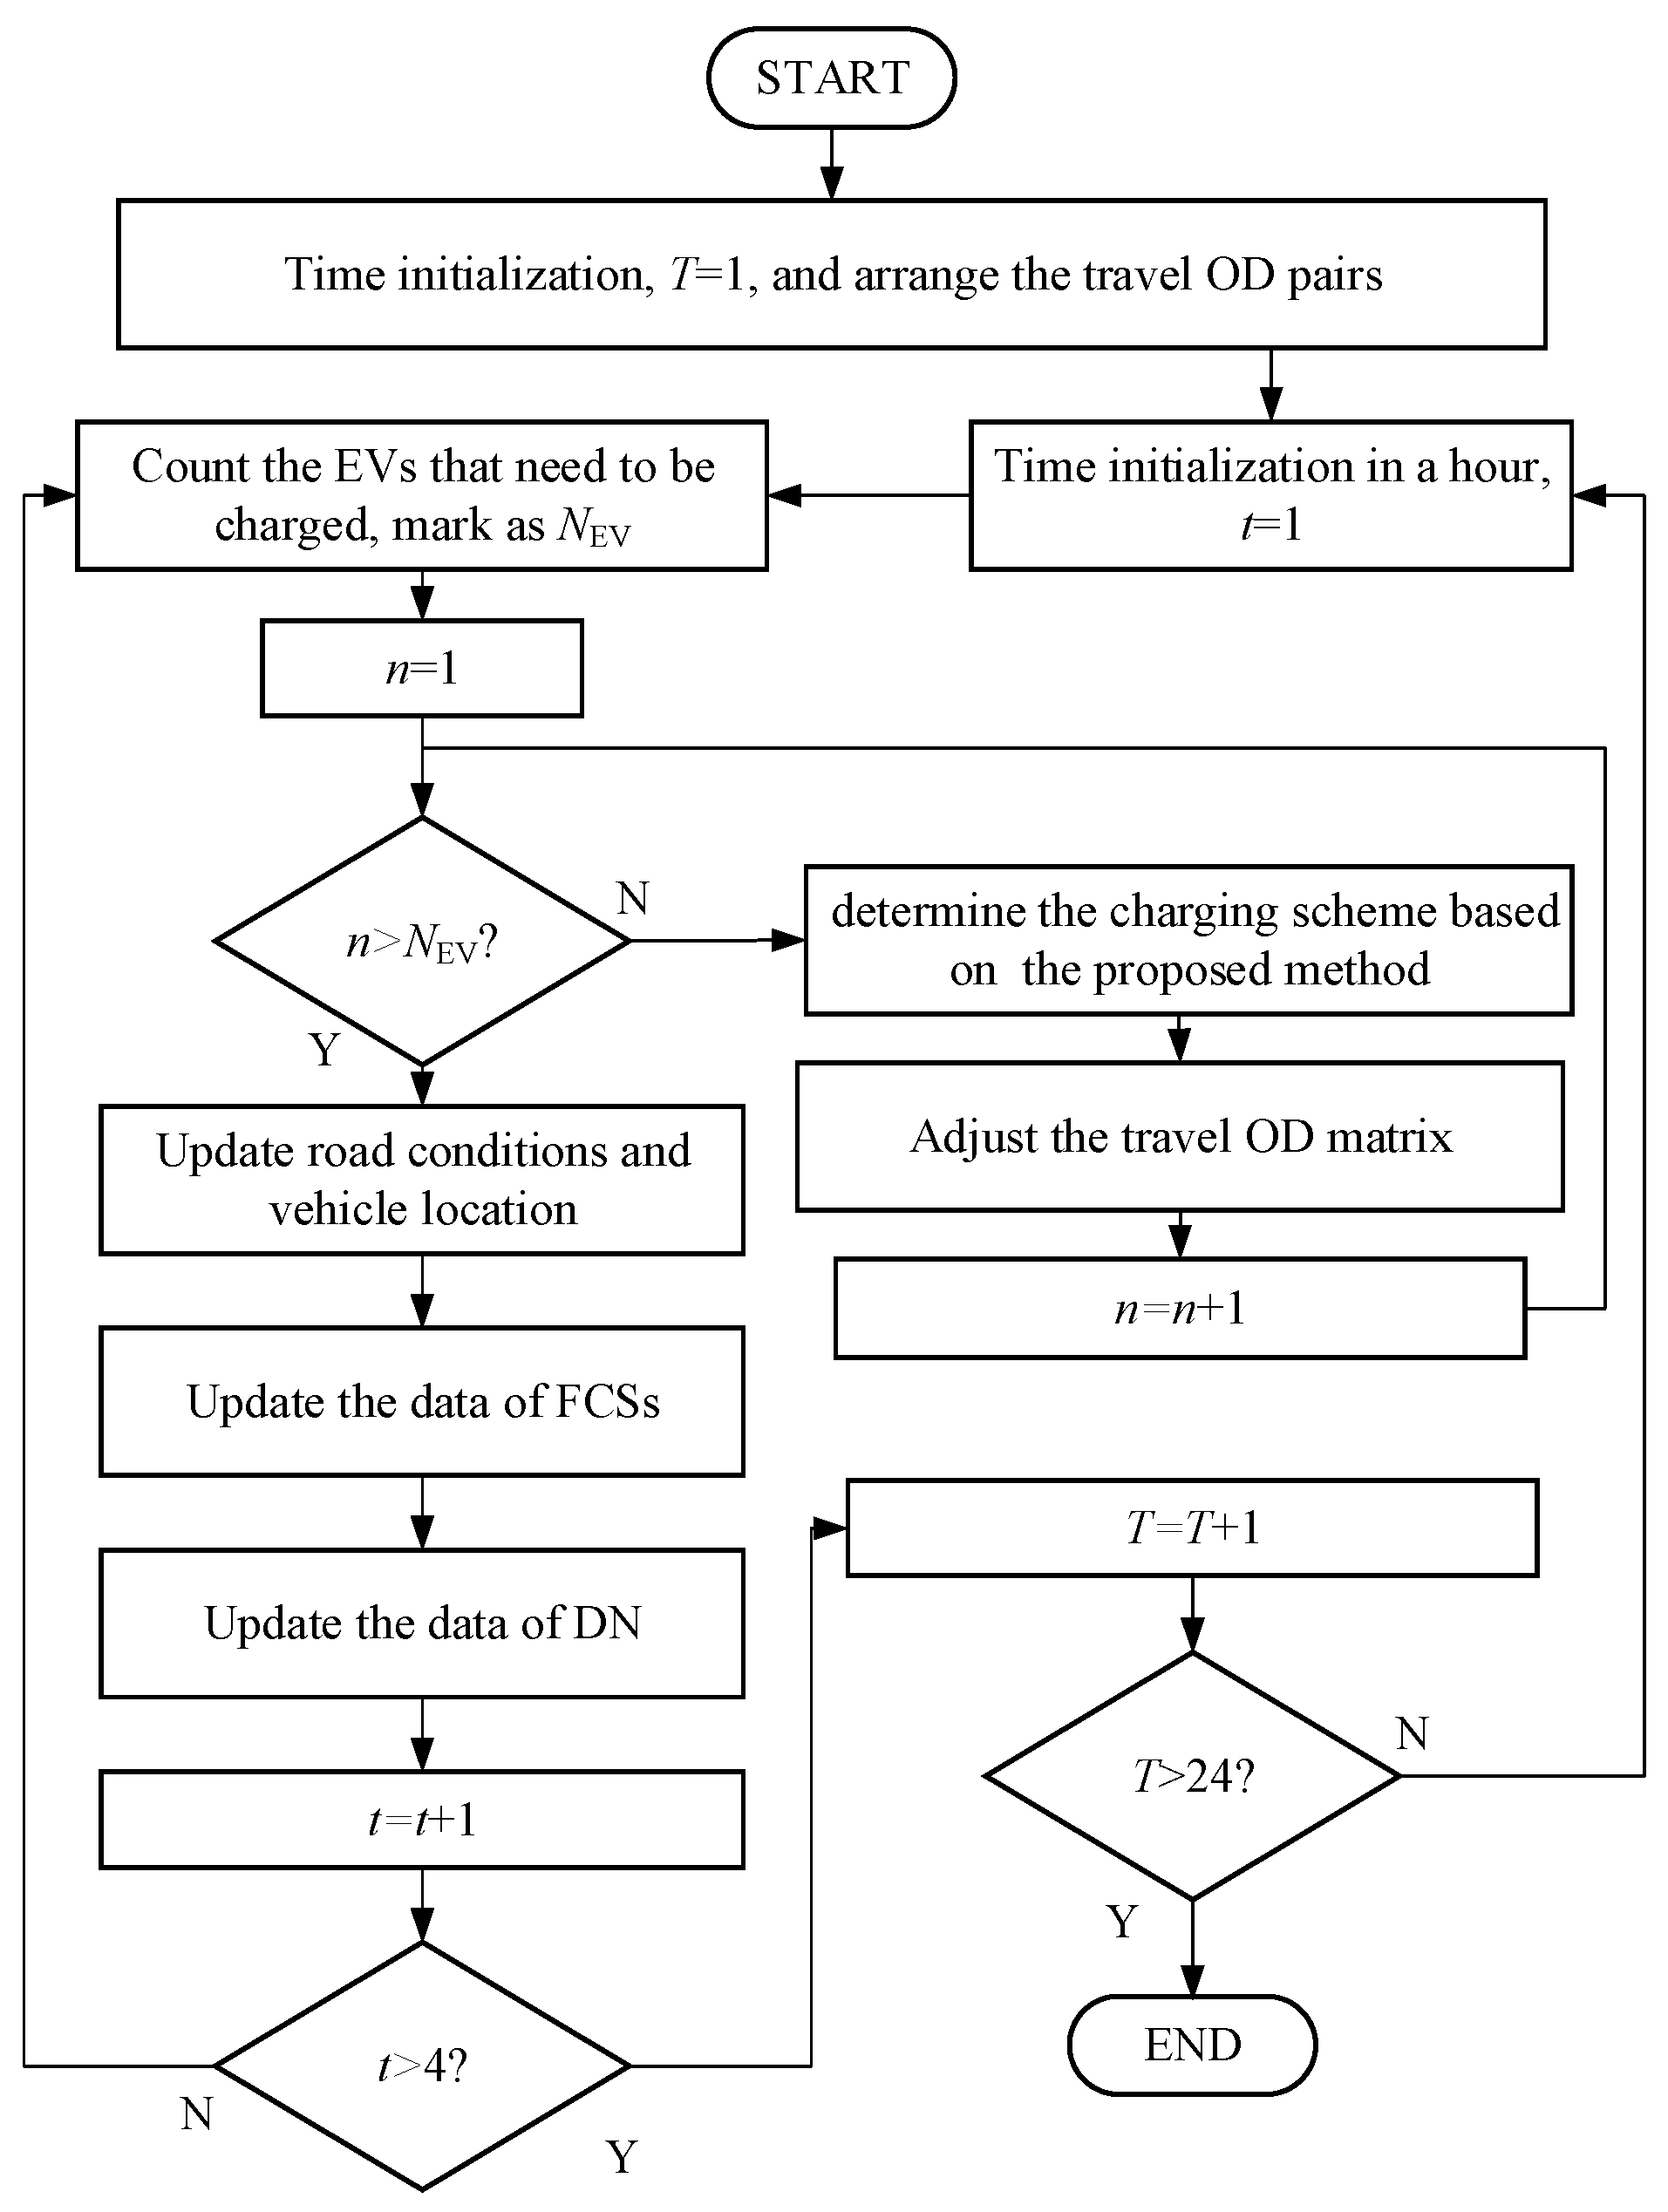
(3) A charging guidance strategy is proposed based on the comprehensive evaluation results. By the application of the proposed strategy, the EVs will be guided to the FCSs which have the highest comprehensive evaluation score. The application of the proposed strategy avoids the occurrence of the extreme operation state in power systems, road networks and FCSs. Compared with the other three strategies, the network-related capability of FCSs is improved.
In the process of strategy development, the proposed strategy is realized based on the operation state of the distribution network, road network, and FCSs. The EVs will be guided to the FCS which has the least impact on the operation of the coupling system. The advantages of the proposed strategy are shown in Table 1. Compared with the strategy proposed in [22], the operation level of the distribution network is improved by the application of the proposed strategy (e.g., voltage violation rate). Compared with the strategy proposed in [23], on the basis of ensuring that the road network is at a high operation level, the operation level of the distribution network is significantly improved by the application of the strategy proposed in this paper. Compared with the strategy proposed in [24], on the basis of ensuring that the road network is at a high operation level, the operation levels of the road network and FCSs are significantly improved by the application of the strategy proposed in this paper (e.g., travel flow, charging waiting time, and utilization rate of FCSs).
The chapter arrangement and relationship of this paper are shown in the Figure 1.
In this paper, the evaluation system for the network-related capacity of fast charging stations will be constructed in Section 2, and the selection principles and calculation methods of evaluation indexes will also be given in Section 2. Section 3 will discuss the network-related capacity evaluation of the fast charging station at different layers. In Section 4, the charging guidance strategy is proposed based on the network-related capacity of FCSs, and the proposed strategy is verified in Section 5.

2. Construction of the Network-Related Capability Evaluation System for Fast Charging Stations

FCSs are a key part of the “vehicle-road-network” coupling system. Therefore, for the evaluation of the network-related capacity of the fast charging station, the operation state of the power system, road network, and FCSs should be fully considered to evaluate the impact of the FCSs on the coupling network under different operating modes. In order to evaluate the network-related capability of the charging station more reasonably, a hierarchical evaluation framework is proposed to evaluate the network-related capability of FCSs. The comprehensive evaluation framework is shown in Figure 2.

2.1. Evaluation Target of the Distribution Network Operation Level

2.1.1. Voltage Offset Rate

The voltage offset rate is the value that the per-unit value of voltage deviates from 1 p. u. when the voltage of the distribution network operates within the normal range. This value reflects the power quality of the distribution network. In this paper, the average voltage offset rate is used as the evaluation target to represent the operation state of the distribution network:
Δ U = t = 1 T i t limit N t limit | U i t limit U ref | t = 1 T N t limit
where Δ U is the average voltage offset rate; U ref is the reference value of the voltage amplitude; t is the time interval; T is the number of time interval; i t limit is the index of the node of distribution network which the voltage is amplitude in the normal range; and N t limit is the number of nodes in which voltage amplitude is in the normal range.

2.1.2. Voltage Violation Rate

The voltage violation rate is the ratio of the number of voltages out of limit nodes in the distribution network. This value reflects the safe operation state of the distribution network. The voltage violation rate is defined as follows:
Δ N = t = 1 T N t unlimit t = 1 T N power
where Δ N is the average voltage violation rate; N t unlimit is the number of nodes in which the voltage is out of limit; and N power is the number of distribution network nodes.

2.1.3. Load Fluctuation

Load fluctuation is the value that the load offsets from the average load. In this paper, the average load fluctuation is defined as follows:
Δ P = t = 1 T | P t P ¯ | T
P ¯ = t = 1 T P t T
where Δ P is the value of the average load fluctuation; P t is the total load of the distribution network; and P ¯ is the average load of the distribution network.

2.1.4. Active Power Loss

The active power loss is generated during the operation of the distribution network, which reflects the economic operation state of the distribution network. It is defined as follows:
P t loss = i branch N branch ( P t i branch ) 2 + ( Q t i branch ) 2 ( U t i branch ) 2 r i branch
where P t loss is the active power loss; i branch is the index of the branch; N branch is the number of the branches; P t i branch and Q t i branch are the value of the active power injection and reactive power injection, respectively; U t i branch is the voltage amplitude; and r i branch is the resistance value of the branch i branch .

2.2. Evaluation Target of the Road Network Operation Level

2.2.1. Traffic Flow

The traffic flow represents the traffic volume passing through the link, which reflects the traffic carried by the link at a certain time. It is defined as follows:
D t i link = i t car = 1 N t car d i t car , i link t
d i t car , i link t = { 0 Not   passing   this   link 1 Passing   this   link
where i link is the index of the link; D t i link is the traffic flow of link i link ; i t car is the index of the vehicles; N t car is number of the vehicles which are traveling in t ; and d i t car , i link t is a binary variable.

2.2.2. Link Travel Time

Link travel time is the time that vehicles drive through the link. In this paper, the BPR function is applied to calculate the link travel time.
θ t i link = θ 0 i link ( 1 + α ( D t i link C i link ) β )
where θ t i link is the link travel time; θ 0 i link the free link travel time; C i link is the actual capacity of the link; and α and β is model parameter. In this paper, we set α = 0.15 and β = 4 .

2.2.3. Road Service Level

The road service level can be divided into six levels to illustrate the road traffic load condition. The traffic flow status is used as the dividing condition. The road service level qualitatively describes free flow, stable flow, saturated flow, and forced flow. The road service level is defined in Equation (9) and Table 2.
ω = D t i link C i link

2.3. Evaluation Target of the FCS Operation Level

2.3.1. Charging Waiting Time

The charging waiting time reflects the congestion status in FCSs. In this paper, the charging completion time is used as charging waiting time. The charging waiting time is defined as follows:
t w = t i FCS end
where i FCS is the index of FCS; t i FCS end is the charging completion time and t w is the charging waiting time.

2.3.2. Utilization Rate of FCSs

The definition of the utilization rate of FCSs is as follows:
k t = i FCS = 1 N FCS i i FCS = 1 N i FCS γ t i i FCS i FCS = 1 N FCS N i FCS
γ t i i FCS = { 0         Idle   state 1   Usage   status
where k t is the utilization rate of FCSs; N FCS is the number of FCSs; i i FCS is the index of charging piles in FCS i FCS ; N i FCS is the number of charging piles in FCS i FCS ; and γ t i i FCS is a binary variable.

3. Comprehensive Evaluation Method for the Network Connection Capability of FCSs

In this paper, the fuzzy comprehensive evaluation method is applied to evaluate the network connection capability of FCSs. The comprehensive evaluation process of this paper is shown in Figure 3.

3.1. Index Layer

In the index layer, the score of each evaluation index is calculated, and the weight coefficient of each evaluation index is calculated; the weight coefficient is divided into an objective weighting part and a subjective weighting part.

3.1.1. Objective Weighting Method

The entropy weight method (EWM) is applied for the calculation of the objective weighting part. The weight of each evaluation index is determined by the entropy value. The calculation process of the entropy weight method is as follows:
Step 1: Standardize the index value. In order to ensure the comparability between indexes, the indexes are divided into positive indexes and negative indexes for standardization. The calculation formula is as follows:
y j m k = x j m k x min j m x max j m x min j m
y j m k = x max j m x j m k x max j m x min j m
Equation (13) is the standardized formula for positive indexes and Equation (14) is the standardized formula for negative indexes. Where j is the index of the rule layer; m is the index of the index layer; k is the index of the indexes; y j m k is the standardized index value; x j m k is the index value before standardization; x min j m is the minimum value of x j m k ; and x max j m is the maximum value of x j m k .
Step 2: Calculate the information entropy of each index.
E j m = s = 1 S y j m k s ln y j m k s ln S
where E j m is the information entropy; s is the index of the guiding strategy; S is the number of guidance strategy; and y j m k s is the standardized index value.
Step 3: Calculate the objective weighting part of the weight coefficient.
w j m o = 1 E j m N j m = 1 N j E j m
m = 1 N j w j m o = 1   ,   w j m o [ 0 , 1 ]
where w j m o is the objective weight coefficient and N j is the number of indexes. The matrix of the objective weight coefficient can be defined as follows:
W j o = ( w j 1 o , , w j m o , , w j N j o ) T

3.1.2. Subjective Weighting Method

Step 1: Construct judgment matrix. The judgment matrix A is a square matrix, which compares the indexes under the same rule layer in pairs and forms a square matrix of N j × N j .
Step 2: Calculate the subjective weighting part of weight coefficient. In this paper, the geometric average method (GAM) is applied to calculate the subjective weight coefficient. The calculation formula is as follows:
w j m b = m = 1 N j a i b m i b = 1 N j m = 1 N j a i b m
m = 1 N j w j m b = 1   ,   w j m b [ 0 , 1 ]
where w j m b is the subjective weight coefficient; a i b m is the element of matrix A ; and i b is similar to m . The matrix of the subjective weight coefficient can be defined as follows:
W j b = ( w j 1 b , , w j m b , , w j N j b ) T
Step 3: Calculate consistent ratio. The consistency ratio is calculated as follows:
C I = λ max N j N j 1
C R = C I R I
where C I is the consistency index of the judgment matrix A ; λ max is the maximum characteristic value of matrix A ; C R is the consistent ratio; and R I is the random consistency index. If C R < 0.1 , matrix A is appropriate; if C R 0 . 1 , the judgment matrix needs to be re-constructed. The value of R I is set as follows (Table 3).
Step 4: Calculate weight coefficient. According to the subjective weight coefficient matrix and the objective weight coefficient matrix, the combined weight coefficient matrix of the index layer is calculated as follows:
W j = ρ W j o + ( 1 ρ ) W j b
where W j is the weight coefficient matrix and ρ is the combination weighting coefficient. In this paper, we set ρ = 0.5 .

3.1.3. Fuzzy Comprehensive Evaluation Method

By the application of the fuzzy comprehensive evaluation method in the index layer, on the one hand the indexes can be scored based on the membership function and scoring matrix; on the other hand, the score of the rule layer can be determined by combining the weight coefficient matrix and the score of the index layer. The calculation process of the fuzzy comprehensive evaluation method is as follows:
F = ( 20   40   60   80   100 ) T
Step 1: Construct membership function. In this paper, the trapezoidal membership function F m is constructed. The distribution form of the membership function is shown in Figure 4.
Step 2: Calculate the fuzzy evaluation matrix of the index layer. The member function is a piecewise function. In this paper, the member function is divided into five parts. Therefore, the fuzzy evaluation matrix H b of the index layer is a 5 × 5 square matrix.
H b = F m ( y j m k )
Step 3: Calculate the index layer score. The scoring results of the index layer can be calculated based on the fuzzy evaluation matrix and scoring matrix of the index layer:
F b = H b F 1
where F b is the score of the index layer.

3.2. Rule Layer

The calculation of the rule layer is divided into the score calculation and the weight coefficient calculation of the rule layer.

3.2.1. Score Calculation of the Rule Layer

The score calculation of the rule layer is based on the scores of the index layer and the combined weight coefficient.
f j = F b j W j

3.2.2. Weight Coefficient of the Rule Layer

The AHP is applied to calculate the weight coefficient matrix W of the rule layer. The calculation process can refer to the relevant parts mentioned above.

3.3. Target Layer

The calculation process of the target layer is divided into two steps:
Step 1: Calculate the score matrix of the rule layer.
F UP = ( f 1 , , f j , , f M )
where F UP is the score matrix of the rule layer.
Step 2: Calculate the score of the target layer.
F end = F UP W
where F end is the score of the target layer.

4. Charging Guidance Strategy Based on the Maximum Comprehensive Evaluation Score

In order to improve the network-related capability of FCSs, a charging guidance strategy based on the proposed evaluation method is suggested. The proposed strategy aims to maximize the target layer score to guide EVs to charge.
F = max { F end 1 F end i FCS F end N FCS }
where F is the objective function; i FCS is the index of FCS; N FCS is the number of FCS; and F end i FCS is the comprehensive evaluation score, when an EV selects i FCS FCS. The calculation process of F end i FCS is consistent with the calculation process mentioned in Figure 2.
According to the calculation result of Equation (31), an EV will be guided to the FCS with the highest comprehensive evaluation score for charging. The calculation flow chart of the guidance strategy is as follows (Figure 5).

5. Case Study

The road network structure is shown in Figure 6. In this paper, there are three distribution networks, and all of them are IEEE 33, which is shown in Figure 7. The case data are shown in Table 4, the strategies are shown in Table 5, and the index type is shown in Table 6.

5.1. Evaluation Results of Index Layer

5.1.1. Evaluation Results of the Distribution Network

In this paper, the entropy weight method is used to standardize the index values, and the fuzzy comprehensive evaluation method is used to obtain the evaluation results of the power grid. The evaluation results are shown in Figure 8.
When the strategy (d) is applied to guide users, the power grid operation has obvious advantages over the other three guidance strategies. When the lowest charging price strategy is applied to guide EVs, EVs will be easy to guide to a single FCS, so the charging load connected to the distribution network is relatively small. The active load in the distribution network is reduced and the active power loss is reduced. Since the charging price formulation process includes the penalty item of the voltage violation part, strategy (d) has a full score in terms of the voltage violation rate. When strategy (a) is applied, the score of the voltage violation rate is 97.17.

5.1.2. Evaluation Results of the Road Network

The evaluation results of the road network are shown in Figure 9.
When strategy (d) is applied to guide users, there are obvious disadvantages in link travel time compared with the other three guidance strategies. Because EVs are guided to a single FCS, the travel time of some links is increased. Due to the diversion effect of centralized guidance, there is no significant impact on the overall service level and road flow of the road network. Strategy (b) and strategy (c) have the least impact on the road network operation, so these two strategies have almost the same score. When strategy (a) is applied to guide EVs, the scoring result is basically consistent with strategy (b) and strategy (c).

5.1.3. Evaluation Results of FCSs

The evaluation results of FCSs are shown in Figure 10 and Figure 11.
In terms of the charging waiting time, the evaluation result of strategy (a) is better than the other three strategies, and the application of strategy (d) will lead to congestion in FCSs. Therefore, the charging waiting time will increase, and its evaluation score is the lowest. The utilization rate of FCSs is a positive index; therefore, the higher the utilization rate of FCSs, the higher the score of this item. When the strategy (d) is applied, the EVs will be guided to the single FCS. The score of the utilization rate of FCSs for strategy (d) is lowest. When strategy (a) is applied, the FCSs will be used reasonably. By the application of the proposed strategy, the number of EVs served by the FCSs can be improved, and the network connection capacity of FCSs can be improved.

5.2. Evaluation Results of the Rule Layer

The evaluation results of the rule layer are shown in Figure 12. At the same time, the calculation results of combined weighting are shown in Table 7, Table 8 and Table 9.
It can be seen from Figure 12 that the evaluation scores of the rule layer are relatively balanced when strategy (a) is applied. Compared with the other three strategies, this strategy comprehensively considers the overall operation state of the distribution network, road network, and FCSs. Strategy (d) only takes the operation state of the power system into account, so the evaluation score of the power system is the highest. Strategy (b) and strategy (c) mainly guide users based on the operation state of the road network, so these two strategies have the highest scores in the comprehensive evaluation of the road network. Because the utilization of charging stations is treated as a positive index in this paper, so the shortest path strategy and the shortest travel time strategy have the higher evaluation scores.

5.3. Evaluation Results of Target Layer

The evaluation results of the target layer are shown in Figure 13.
It can be seen from Figure 13 that the network connection capability of FCSs has been greatly improved when strategy (a) is applied. By the application the proposed method, the score of the target layer is highest. When strategy (d) is applied, the operation state of FCSs and the road network will be ignored. Its score is the lowest.

6. Conclusions

In this paper, an EV charging guidance strategy is proposed to improve the network-related capability of FCSs. The following are some major finding:
(1)
By the application of the proposed evaluation method, the network-related capacity of FCSs can be quantitatively analyzed in multiple dimensions. The network-related capacity of FCSs is evaluated comprehensively based on the state of the distribution network, road network, and FCSs.
(2)
By the application of the proposed EV guidance strategy, the state relationships among the distribution network, road network, and charging station are balanced, and the network-related capacity of FCSs is improved.

Author Contributions

C.Z.: Responsible for resources, software, formal analysis, program compilation, and writing original draft. Q.G.: Responsible for methodology and program compilation. K.P.: Responsible for methodology, project administration, and funding acquisition. Y.J.: Responsible for writing review and editing. All authors have read and agreed to the published version of the manuscript.

Funding

The study in this paper was sponsored by the Project supported by National Natural Science Foundation of China (51807112).

Data Availability Statement

Data can be obtained from https://nhts.ornl.gov/.

Conflicts of Interest

The authors declare that the research was conducted in the absence of any commercial or financial relationships that could be construed as a potential conflict of interest.

References

  1. Zenginis, I.; Vardakas, J.; Zorba, N.; Verikoukis, C. Performance Evaluation of a Multi-standard Fast Charging Station for Electric Vehicles. IEEE Trans. Smart Grid 2018, 9, 4480–4489. [Google Scholar] [CrossRef]
  2. Yuan, L.; Chen, H.; Gong, J. Saving energy and protecting environment of electric vehicles. IOP Conf. Ser. Earth Environ. Sci. 2017, 64, 012051. [Google Scholar] [CrossRef]
  3. Kakillioglu, E.A.; Aktaş, M.Y.; Fescioglu-Unver, N. Self-controlling resource management model for electric vehicle fast charging stations with priority service. Energy 2022, 239, 122276. [Google Scholar] [CrossRef]
  4. Aghapour, R.; Sepasian, M.S.; Arasteh, H.; Vahidinasab, V.; Catalão, J.P. Probabilistic planning of electric vehicles charging stations in an integrated electricity-transport system. Electr. Power Syst. Res. 2020, 189, 106698. [Google Scholar] [CrossRef]
  5. Kumar, Y.A.; Kim, H.J. Effect of time on a hierarchical corn skeleton-like composite of CoO@ZnO as capacitive electrode material for high specific performance supercapacitors. Energies 2018, 11, 3285. [Google Scholar] [CrossRef] [Green Version]
  6. Moniruzzaman, M.; Anil Kumar, Y.; Pallavolu, M.R.; Arbi, H.M.; Alzahmi, S.; Obaidat, I.M. Two-dimensional core-shell structure of cobalt-doped@ MnO2 nanosheets grown on nickel foam as a binder-free battery-type electrode for supercapacitor application. Nanomaterials 2022, 12, 3187. [Google Scholar] [CrossRef]
  7. Wang, H.; Yu, Z.; Li, X.; Bian, J. Comprehensive risk assessment of multiple types of electric vehticles connected to distribution network based on principal component analysis method. Electr. Power Autom. Equip. 2021, 41, 57–65. [Google Scholar]
  8. Chen, W.; Yang, B.; Zhang, Z.; Wen, M.; Chen, X. Distribution networks supportability evaluation and optimization considering electric vehicles charging stations. Trans. China Electrotech. Soc. 2014, 29, 27–35. [Google Scholar]
  9. Wang, J.; Ming, L.; Yu, D. Technical and economic evaluation of the electric vehicle charging network planning scheme. J. Clean. Energy Technol. 2015, 3, 317–320. [Google Scholar] [CrossRef] [Green Version]
  10. Li, D.D.; Duan, W.Y.; Lin, S.F. User guidance based matching strategy for electric vehicle-charging pile in condition of real-time electricity price. Autom. Electr. Power Syst. 2020, 44, 74–82. [Google Scholar]
  11. Ding, Z.; Zhang, Y.; Tan, W.; Pan, X.; Tang, H. Pricing based Charging Navigation Scheme for Highway Transportation to Enhance Renewable Generation Integration. IEEE Trans. Ind. Appl. 2023, 59, 108–117. [Google Scholar] [CrossRef]
  12. Zhao, T.; Li, Y.; Pan, X.; Wang, P.; Zhang, J. Real-Time Optimal Energy and Reserve Management of Electric Vehicle Fast Charging Station: Hierarchical Game Approach. IEEE Trans. Smart Grid 2018, 9, 5357–5370. [Google Scholar] [CrossRef]
  13. Sun, X.; Qiu, J. Hierarchical Voltage Control Strategy in Distribution Networks Considering Customized Charging Navigation of Electric Vehicles. IEEE Trans. Smart Grid 2021, 12, 4752–4764. [Google Scholar] [CrossRef]
  14. Yang, H.; Deng, Y.; Qiu, J.; Li, M.; Lai, M.; Dong, Z.Y. Electric Vehicle Route Selection and Charging Navigation Strategy Based on Crowd Sensing. IEEE Trans. Ind. Inform. 2017, 13, 2214–2226. [Google Scholar] [CrossRef]
  15. Li, X.; Xiang, Y.; Lyu, L.; Ji, C.; Zhang, Q.; Teng, F.; Liu, Y. Price Incentive-Based Charging Navigation Strategy for Electric Vehicles. IEEE Trans. Ind. Appl. 2020, 56, 5762–5774. [Google Scholar] [CrossRef]
  16. Tan, J.; Wang, L. Real-Time Charging Navigation of Electric Vehicles to Fast Charging Stations: A Hierarchical Game Approach. IEEE Trans. Smart Grid 2017, 8, 846–856. [Google Scholar] [CrossRef]
  17. Moghaddam, Z.; Ahmad, I.; Habibi, D.; Phung, Q.V. Smart Charging Strategy for Electric Vehicle Charging Stations. IEEE Trans. Transp. Electrif. 2018, 4, 76–88. [Google Scholar] [CrossRef]
  18. Shi, X.; Xu, Y.; Guo, Q.; Sun, H.; Gu, W. A Distributed EV Navigation Strategy Considering the Interaction between Power System and Traffic Network. IEEE Trans. Smart Grid 2020, 11, 3545–3557. [Google Scholar] [CrossRef]
  19. Jin, Z.; Wu, R.; Chen, X.; Li, G. Charging Guiding Strategy for Electric Taxis Based on Consortium Blockchain. IEEE Access 2019, 7, 144144–144153. [Google Scholar] [CrossRef]
  20. Qian, T.; Shao, C.; Wang, X.; Shahidehpour, M. Deep Reinforcement Learning for EV Charging Navigation by Coordinating Smart Grid and Intelligent Transportation System. IEEE Trans. Smart Grid 2019, 11, 1717–1723. [Google Scholar] [CrossRef]
  21. Xiang, Y.; Yang, J.; Li, X.; Gu, C.; Zhang, S. Routing Optimization of Electric Vehicles for Charging with Event-Driven Pricing Strategy. IEEE Trans. Autom. Sci. Eng. 2022, 19, 7–20. [Google Scholar] [CrossRef]
  22. Eisner, J.; Funke, S.; Storandt, S. Optimal route planning for electric vehicles in large networks. In Proceedings of the AAAI Conference on Artificial Intelligence, San Francisco, CA, USA, 7–11 August 2011; Volume 25. [Google Scholar]
  23. Luo, Y.; Zhu, T.; Wan, S.; Zhang, S.; Li, K. Optimal charging scheduling for large-scale EV (electric vehicle) deployment based on the interaction of the smart-grid and intelligent-transport systems. Energy 2016, 97, 359–368. [Google Scholar] [CrossRef]
  24. Wang, Y.; Wang, X.; Cong, R.; Wang, L.; Huang, Y.; Chen, D. Charging Guidance Strategy for Electric Vehicles Considering the Operation Safety of Distribution Network. High Volt. Eng. 2023. Available online: https://kns.cnki.net/kcms2/article/abstract?v=3uoqIhG8C45S0n9fL2suRadTyEVl2pW9UrhTDCdPD669CjSZCpCUE3OMBkpP_QeqKlNgCewvqYd8Xode39hwyfRmfXyL9CP_&uniplatform=NZKPT (accessed on 30 November 2022).
  25. Technical Standard of High Engineering. Available online: https://xxgk.mot.gov.cn/2020/jigou/glj/202006/t20200623_3312363.html (accessed on 21 February 2023).
Figure 1. The chapter arrangement and relationship.
Energies 16 03113 g001
Figure 2. The comprehensive framework.
Energies 16 03113 g002
Figure 3. The comprehensive framework.
Energies 16 03113 g003
Figure 4. The distribution form of membership function.
Energies 16 03113 g004
Figure 5. Flow chart of guidance strategy.
Energies 16 03113 g005
Figure 6. Topological structure of road network.
Energies 16 03113 g006
Figure 7. Topological structure of power system.
Energies 16 03113 g007
Figure 8. Evaluation results of distribution network.
Energies 16 03113 g008
Figure 9. Evaluation results of road network.
Energies 16 03113 g009
Figure 10. Evaluation results of charging waiting time.
Energies 16 03113 g010
Figure 11. The Evaluation results of utilization rate of FCSs.
Energies 16 03113 g011
Figure 12. The Evaluation results of rule layer.
Energies 16 03113 g012
Figure 13. The Evaluation results of target layer.
Energies 16 03113 g013
Table 1. Comparison of guidance strategies.
StrategySystem Operation Status Considered
Distribution NetworkRoad NetworkFCSs
This paper
Literature [22]--
Literature [23]--
Literature [24]--
Table 2. The road service level [25].
Road Service Level ω Value Road Service Level ω Value
1 ω 0 . 3 4 0.7 < ω 0.9
2 0.3 < ω 0 . 5 5 0.9 < ω 1
3 0.5 < ω 0.7 6 ω > 1
Table 3. The random consistency index.
N j 123456789
R I 000.580.901.121.241.321.411.45
Table 4. Case data.
Table 4. Case data.
FCS IDDistribution Network ID (Node)Rode Network NodeCharging Pile NumberCharging Pile Power (kW)
11 (11)5860
22 (17)12860
33 (21)15860
41 (25)24860
53 (33)31860
Table 5. Guidance strategy.
Calculation ResultGuidance Strategy
(a)The proposed strategy
(b)The shortest path guidance strategy [22]
(c)The shortest travel time guidance strategy [23]
(d)The lowest charging price guidance strategy [24]
Table 6. Index type.
Index NameTypeIndex NameType
Voltage offset ratenegative indexLink travel timenegative index
Voltage violation ratenegative indexRoad service levelnegative index
Load fluctuationnegative indexCharging waiting timenegative index
Active power lossnegative indexUtilization rate of FCSspositive index
Traffic flownegative index
Table 7. Combined weighting coefficient of distribution network.
Voltage Offset RateVoltage Violation RateActive Power LossLoad Fluctuation
Objective weight coefficient0.150.400.300.15
Subjective weight coefficient0.050.480.080.39
Table 8. Combined weighting coefficient of road network.
Link Travel TimeTraffic FlowRoad Service Level
Objective weight coefficient0.350.250.40
Subjective weight coefficient0.160.420.42
Table 9. Combined weighting coefficient of FCSs.
Charging Waiting TimeUtilization Rate of FCSs
Objective weight coefficient0.420.58
Subjective weight coefficient0.750.25
Disclaimer/Publisher’s Note: The statements, opinions and data contained in all publications are solely those of the individual author(s) and contributor(s) and not of MDPI and/or the editor(s). MDPI and/or the editor(s) disclaim responsibility for any injury to people or property resulting from any ideas, methods, instructions or products referred to in the content.

