Article

A Robust Participation in the Load Following Ancillary Service and Energy Markets for a Virtual Power Plant in Western Australia

1
School of Engineering and Energy, Murdoch University, Murdoch, WA 6150, Australia
2
School of Electrical and Data Engineering, University of Technology Sydney, Broadway, NSW 2007, Australia
3
Department of Electrical Engineering, Qatar University, Doha P.O. Box 2713, Qatar
4
Innogreen Technologies Pty Ltd., Perth, WA 6000, Australia
*
Author to whom correspondence should be addressed.
Energies 2023, 16(7), 3054; https://doi.org/10.3390/en16073054
Submission received: 8 November 2022 / Revised: 30 January 2023 / Accepted: 15 March 2023 / Published: 27 March 2023
(This article belongs to the Topic Low-Carbon Power and Energy Systems)

Abstract

:
Virtual power plants (VPPs) are an effective platform for attracting private investment and customer engagement to speed up the integration of green renewable resources. In this paper, a robust bidding strategy to participate in both energy and ancillary service markets in the wholesale electricity market is proposed for a realistic VPP in Western Australia. The strategy is accurate and fast, so the VPP can bid in a very short time period. To engage customers in the demand management schemes of the VPP, the gamified approach is utilized to make the exercise enjoyable while not compromising their comfort levels. The modelling of revenue, expenses, and profit for the load-following ancillary service (LFAS) is provided, and the effective bidding strategy is developed. The simulation results show a significant improvement in the financial indicators of the VPP when participating in both the LFAS and energy markets. The payback period can be improved by 3 years to the payback period of 6 years and the internal rate of return (IRR) by 7.5% to the IRR of 18% by participating in both markets. The accuracy and speed of the proposed bidding strategy method is evident when compared with a mathematical method.

1. Introduction

The emission of greenhouse gases is causing the Earth’s temperature to rise, and if we do not take immediate action, we will see catastrophic consequences. Achieving zero net emissions by 2050 is now a goal for many nations, including Australia, and it will require the use of renewable resources [1]. Renewables such as solar and wind are abundant and can be used without emitting any significant pollution. Such renewable energy sources are becoming more popular, but they cannot always generate power when we need it because the sun is not shining, or the wind is not blowing. This is a problem because we need to rely on renewable energy to help us reduce our reliance on fossil fuels and stop climate change. Energy storage is the key to making renewables reliable [2]. By storing energy when the sun is shining and the wind is blowing, we can use that energy when we need it most and keep our renewable systems running smoothly.
Therefore, the world is moving towards renewable energy and energy storage, but the process is slow. Utilities are also struggling with the technical issues associated with the increase in rooftop PV systems and large renewable plants. Virtual power plants (VPPs) are an effective way of coordinating different sources of energy and attracting private investments, which help make renewables the norm [3]. By investing in VPPs, the investors are not only helping the environment, but they are also obtaining a great return on their investment, i.e., 8.5 years payback for an Australian VPP [4]. An analysis of a VPP in Malaysia, which includes PVs and energy storage, also shows a 10 to 11 year payback period [5]. In addition, a study in Japan shows that the payback period of a VPP can be around 15 years when they obtain a discount on energy storage in a large scale system [6]. Another study shows that heating, ventilation, and air-conditioning units can create a VPP for a residential community [7]. VPPs are becoming more and more popular, especially when investors realize they can increase their revenue by participating in the wholesale electricity market (WEM).
The WEM is a competitive market operated by the Australian Energy Market Operator (AEMO) where generators sell their electricity and services to the grid at a price that will make them the most profit. By participating in the WEM, VPPs can optimize their contributions in different markets to maximize their profits. VPPs can also provide ancillary services such as a load-following service to the grid and get paid for it. This can result in significantly increased profits for VPPs. Different strategies are proposed for optimizing the participation of VPPs in electricity markets, which are different essentially because of the difference in rules of operating markets around the world. For example, information gap theory is utilized for scheduling resources in a VPP [8]. A robust coordination of energy resources is also discussed to consider the uncertainties in electricity prices and renewable resources [9]. Heuristic algorithms such as the grasshopper optimization algorithm are also used for controlling frequency by a VPP [10]. Further, a coordinating system was evaluated for congestion management using multiple VPPs [11]. A two-level robust dispatching of resources in a VPP results in around 20% cost reduction for the VPP [12]. A Dirichlet process mixture model can also be used to robustly optimise the operation of a VPP [13]. A Nash–Harsanyi bargaining solution can also be innovatively developed to fairly allocate the profit of participating in frequency regulation [14]. In addition, participation of a VPP in an ancillary service [15] and the energy market can result in a payback period of around 10 years [16]. However, the engagement of customers in the operation of VPPs is very critical and needs to be considered in a way that is pleasant for the customers; this is not investigated in detail in the literature.
Demand management is considered a source of flexibility within a VPP that increases profit for the VPP [17,18]. However, traditional demand response and management has not been very effective mainly due to financial overhead of running such programs and the lack of consideration for the comfort of participants. Therefore, a gamified approach is studied for customer engagement within a VPP [19]. Using this gamification approach, the customers will participate more in the demand flexibility of the VPP. A robust bidding strategy considering gamified consumer contributions is also studied [19]. Although the participation in the market is discussed in the literature, a detailed framework for a bidding strategy for Western Australia (WA), which includes gamified customer engagement and is fast and understandable for industry, has not previously been provided.

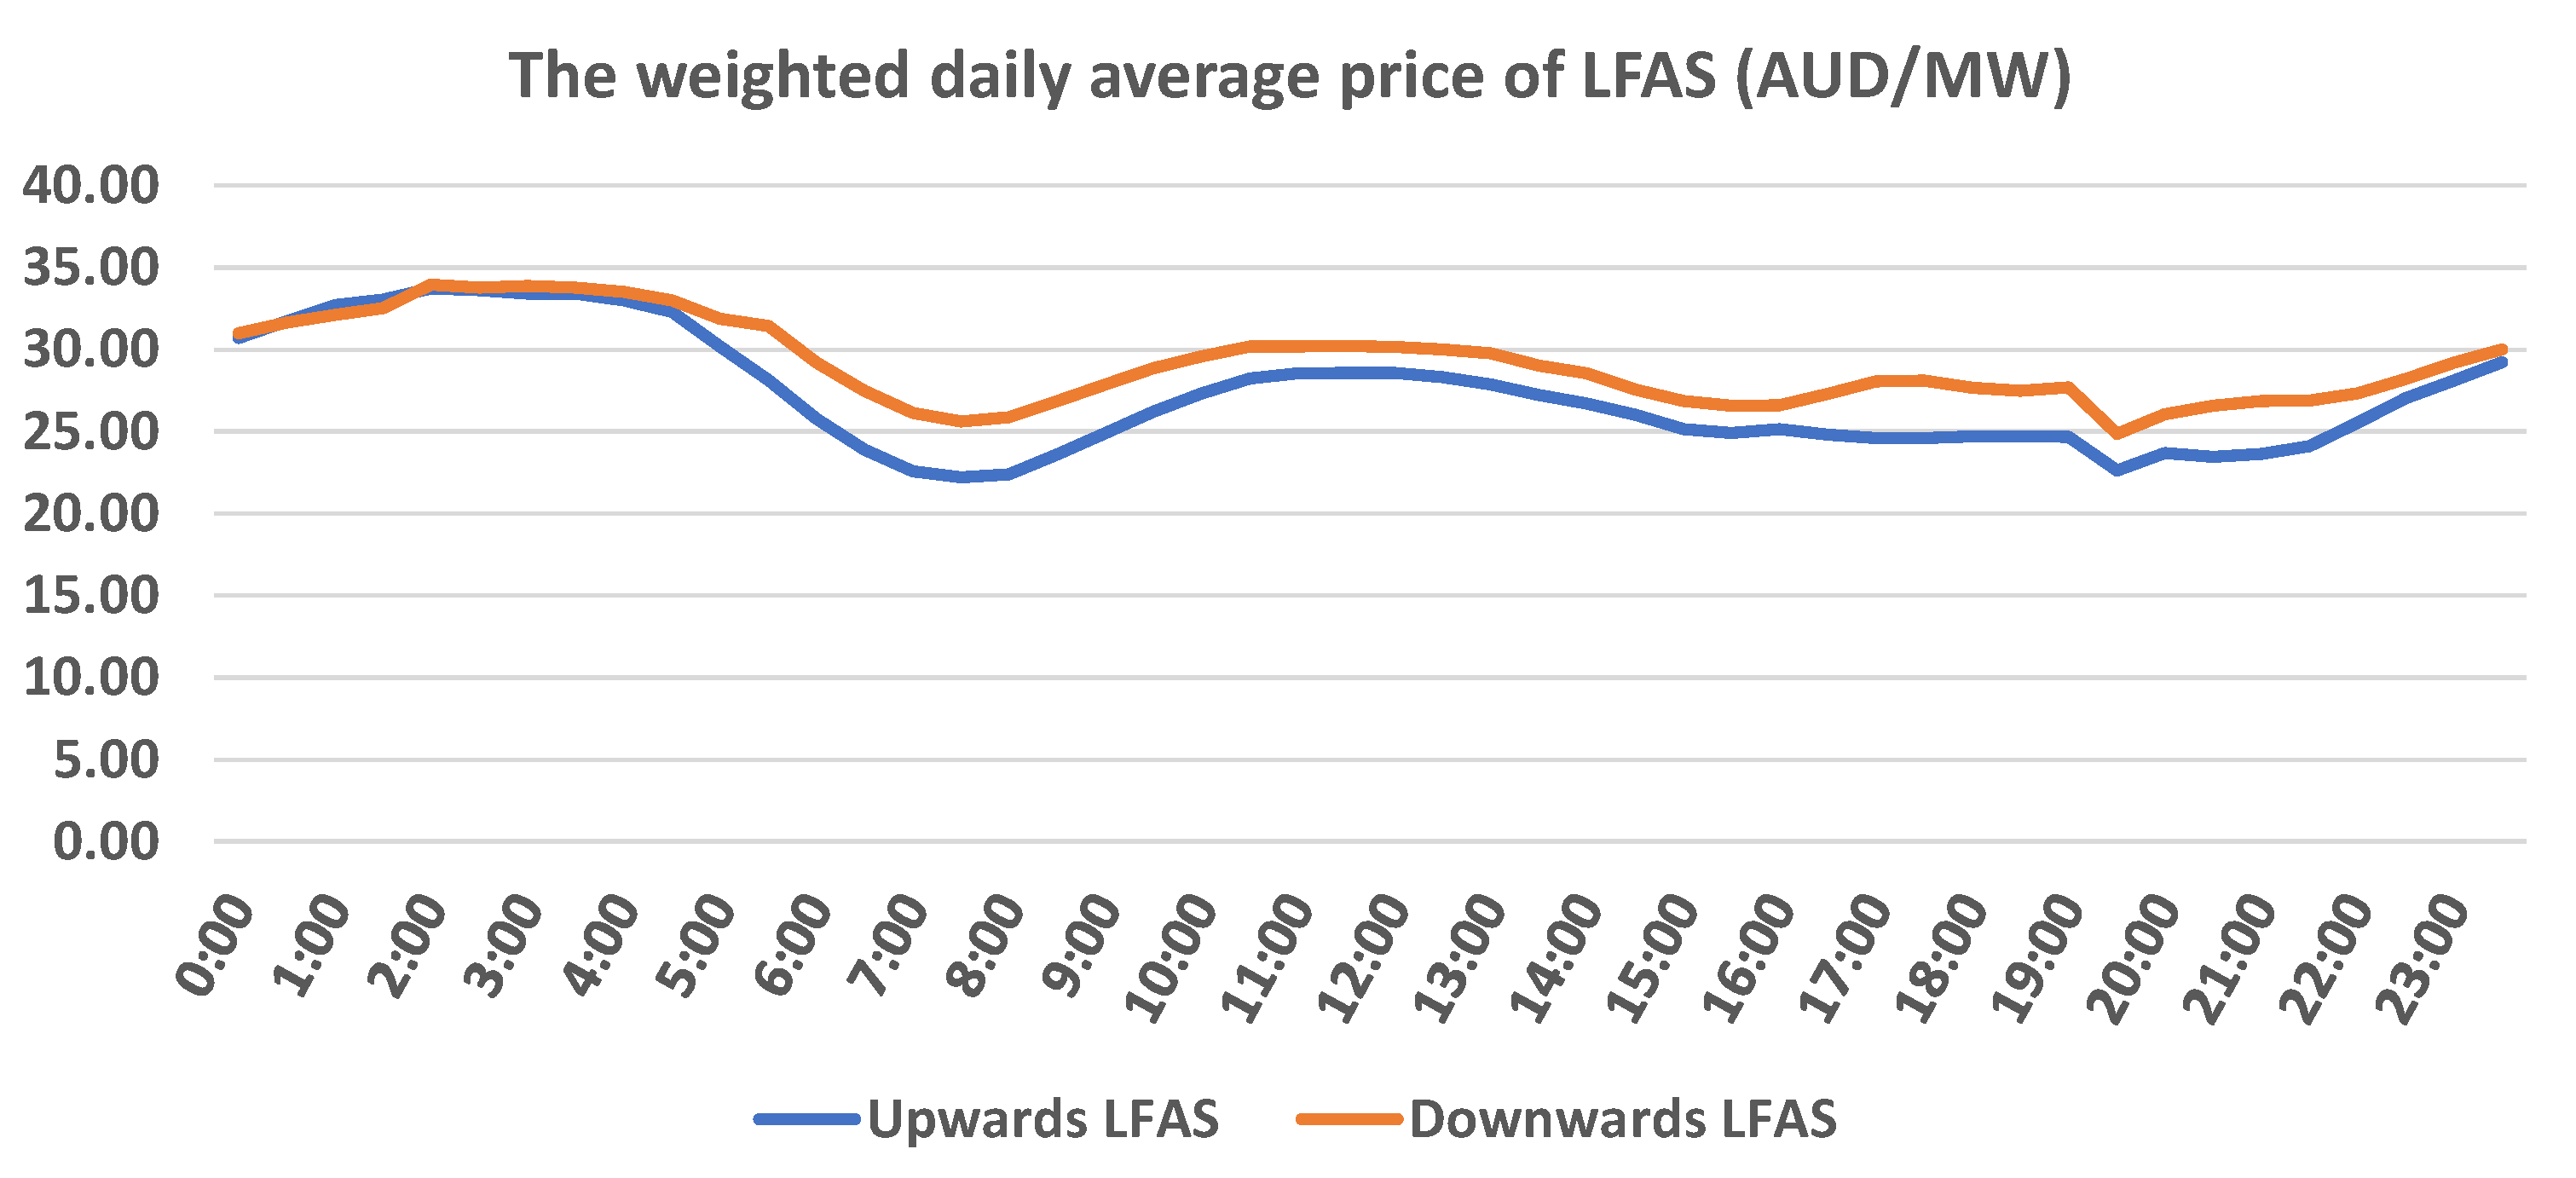
1.1. Ancillary Services in WEM

In addition to the energy market, there are several ancillary services which are being procured by AEMO for the reliable and secure operation of the power grid in WEM. These ancillary services are the load-following ancillary service (LFAS), the spinning reserve ancillary services (SRAS), the load rejection reserve ancillary services (LRRAS), the dispatch support service (DSS), and the system restart service (SRS) as explained in the “wholesale electricity market rules” [15]. Among all these services, AEMO runs the ancillary market only for the LFAS, and other ancillary services are secured using bilateral contracts with large generators, specifically with Synergy. Therefore, in this paper, only participation in the LFAS market is considered for the VPP.
LFAS is the service that continuously balances supply and demand to regulate the frequency of the WEM power grid within the normal range, which is from 49.8 to 50.2 Hz for 99% of the time. To this aim, the participants in the LFAS market can provide two forms of the LFAS: upwards LFAS and downwards LFAS. Upwards LFAS is provided for increasing frequency by increasing the power generation of the participant, while downwards LFAS is provided to decrease frequency. The LFAS is enabled in response to any frequency violations from the normal condition; the power generation of the enabled participant in the LFAS market changes based on commands from an automatic generation control (AGC) system.
As per the WEM rules, the AEMO must forecast the upwards LFAS and the downwards LFAS quantities for each 30 min trading interval in the next trading day; however, these estimates can be modified before the trading interval. A participant in the LFAS market can submit an LFAS amount for their facilities for any or all trading intervals in the balancing horizon and before the gate closure for those trading intervals. The balancing horizon is a 43 h period from 1 p.m. of each trading day to the end of 8 a.m. on the next trading day.
An example of LFAS bidding and enablement over four trading intervals is shown in Figure 1. As can be seen, in trading interval one, the enabled LFAS power is upwards and less than the bidding amount of this participant. In the second interval, the enabled LFAS amount is downwards and near the downwards LFAS bidding. There is no enablement in the third interval. However, in the fourth trading interval, both upwards and downwards are enabled, and the bidding amount for the downwards LFAS is also enabled.
The LFAS requirement approved for the WEM in 2020–2021 has increased to 105 MW (from the planned 85 MW) for upwards and downwards LFAS between 5:30 a.m. and 7:30 p.m., and to 80 MW (from the planned 50 MW) for both upwards and downwards LFAS between 7:30 p.m. and 5:30 a.m. for each trading interval. These increased amounts for LFAS requirements are due to the expected connection of 520 MW of additional intermittent non-scheduled generation, especially roof top PV panels. It is expected that LFAS requirements have increased due to adding more volatile rooftop PVs. The actual average upwards and downwards LFAS quantities enabled between 5:30 a.m. and 7:30 p.m. during 25 September 2020 up to 30 April 2021 are 111 and 117 MW, respectively, which shows some levels of backup LFAS have also been activated [20].

1.2. Contributions and Structure

This paper develops a framework for a bidding strategy which maximizes the profit for the VPP owner, reduces the cost of electricity for the dwellings, and provides a service to the Western Australian grid by provision of energy and load-following ancillary service. The proposed framework also includes the gamified customer engagement model developed by [19]. Based on the best knowledge of authors, there are no publications that jointly consider the gamification approach along with the participation in the LFAS market. Additionally, the proposed method is fast, as it uses an expert method for bidding which enables a VPP to decide on the optimal bidding in a very short time period. Using this strategy, the VPP is also able to change its bidding right before the gate closure to maximize the profit. Another benefit of this higher speed is to reduce the computational effort and the required memory for attaining an optimal bid for a VPP. Furthermore, the logic of the proposed expert bidding strategy is simple and understandable, so it can be easily implemented in different practical platforms.
A realistic VPP is studied in this paper as this is being built in Western Australia, including 67 dwellings, an 810 kW rooftop solar farm, 350 kW/700 kWh vanadium redox flow batteries (VRFB), heat pump hot water systems (HWS), and demand management. The contributions of this paper are as follows:
  • Developing an expert model for a fast and robust bidding strategy in the LFAS and energy markets, considering PV generation, energy storage scheduling and a gamified contribution of consumers to maximize the profit of the VPP and reduce consumers’ energy costs;
  • Analysis of the economic viability of the realistic VPP when participating in the LFAS and energy markets, including the payback period, internal rate of return, cash flow, profit, etc., over the lifetime of the project;
  • Comparison of the proposed fast bidding strategy with a traditional robust mathematical approach to show the effectiveness of the proposed strategy for deciding or changing the bidding values in a short period of time.
The paper is organised as follows: The next section provides the problem formulation for the VPP’s profit. Section 3 develops a robust bidding strategy for participation in the LFAS and energy markets. Section 4 discusses the simulation results. Concluding remarks are provided in Section 5.

2. Problem Formulation

The goal of participation in the WEM and managing customers’ loads is to maximize the profit of the VPP. Therefore, the objective function of the problem is formulated as follows in (1) over a day. In all equations, the indices d, h represent the values of the corresponding parameter at h-th hour of d-th day.
m a x i m i z e   ( R t o t C t o t ) Constraints :   { E n e r g y   s t o r a g e   c h a r g i n g / d i s c h a r g i n g C u s t o m e r   p r e f e r e n c e s   c o n s t r a i n t s   ,
R t o t = R F i x + R V a r = R F i x + h = 1 24 E o u t d , h π d , h + h = 1 24 E R E S d , h τ R E S , E d , h + h = 1 24 P L F A S , U P d , h ζ L F A S , U P d , h + h = 1 24 P L F A S , D O W N d , h ζ L F A S , D O W N d , h ,
E o u t d , h = { E P V d , h E R E S d , h i f   ( E P V y , h E R E S y , h ) > 0 0 o t h e r w i s e ,
C t o t = C F i x + ( 1 + α y ) h = 1 24 E i n d , h π d , h + ( 1 + β y ) h = 1 24 E i n d , h ω d , h + ( γ y + δ y + θ y ) h = 1 24 E i n d , h
E i n d , h = { E P V d , h E R E S d , h i f   ( E P V d , h E R E S d , h ) < 0 0 o t h e r w i s e ,
where R t o t and C t o t are the total revenue and expenses of the VPP, respectively. R F i x is the fixed revenue and R V a r is the variable revenue which includes three terms: the daily revenue from selling E o u t y , h to the electricity energy market ( h = 1 24 E o u t d , h π d , h ) at the market price of π d , h , the daily revenue from selling E R E S d , h to the customers ( h = 1 24 E R E S d , h τ R E S , E d , h ) at the agreed price of τ R E S , E d , h , and the daily revenue from selling P L F A S , U P d , h to the upwards LFAS market ( h = 1 24 P L F A S , U P d , h ζ L F A S , U P d , h ) at the weighted average price of ζ L F A S , U P d , h and selling P L F A S , D O W N d , h to the downwards LFAS market at the weighted average price of ζ L F A S , D O W N d , h . E P V d , h is the energy generated by the PV system and E R E S d , h is the customers’ energy consumption. The electricity tariff for the customer is 94.63 cents/day for the fixed cost and 26.39 cents/kWh for energy usage at any hour, which is provided at a 10% discount compared to the local utility tariff [21]. The actual LFAS prices are not published by the AEMO; therefore, we can only use the weighted average prices for LFAS, which are published by the AEMO. The input data for PV generations, electricity prices, and LFAS prices are adjusted as per the robustness consideration, as discussed in Section 3.3.
C t o t is the total expenses of the VPP for a day; C F i x is the fixed part of the expenses as CAPEX; E i n d , h is the total energy purchased from the WEM at the price of π d , h through a retailer with the margin of α y ; ω y , h are the local utility tariff costs [22]; and γ y   ,   δ y   , and θ y , respectively, are the fees associated with the Clean Energy Regulator, the ancillary service, and the market. The detailed formulation and explanation of costs and expenses is provided in [4].

2.1. The Modelling of Gamification for Customer Engagement

The gamification approach proposed here is based on a virtual home system owned by each dwelling. By increasing the efficiency of this virtual home system, the participants can compete against each other and get more benefits, prizes, badges, etc. The details of the gamified approach for customer engagement are as presented in [21]. Based on this effective approach, the energy consumption by dwellings, E R E S d , h , is
E R E S d , h = E R E S , d e f d , h ϑ h ϱ h E R E S d , h ,
where E R E S , d e f d , h is the default load profile of the dwellings, and ϑ h and ϱ h are the electricity reduction factor and the percentage of customer participation in the gamified approach, respectively.

2.2. The Constraints

The constraint for the energy storage, VRFB, is as follows. In this formulation, it is considered that the energy storage is dedicated to participation in the LFAS market.
0 S O C V R F B d , h S O C V R F B m a x       , d , h , 0 P L F A S , U P d , h P V R F B m a x , 0 P L F A S , D O W N d , h P V R F B m a x ,
where S O C V R F B d , h and S O C V R F B m a x are the state of charge (SOC) at day d and time interval of h and the maximum state of charge, and P V R F B m a x is the maximum charging/discharging power of the VRFB. Since P L F A S , U P d , h is for the upwards LFAS, which is for increasing frequency, the energy storage should inject power to the grid. This reduces the SOC of the energy storage; therefore, P L F A S , U P d , h comes with a negative sign in the SOC calculation. However, P L F A S , D O W N d , h is for the downwards LFAS, resulting in charging the energy storage.
Another constraint is the customer preference constraints, which are pre-defined values by residences to satisfy their comfort levels. Every command for customer participation in demand change can be withdrawn by a customer or programmed by them, i.e., for which times and dates and for which appliances; the VPP commands can or cannot be applied. The detailed formulation of the customer preference constraints is provided in [21].

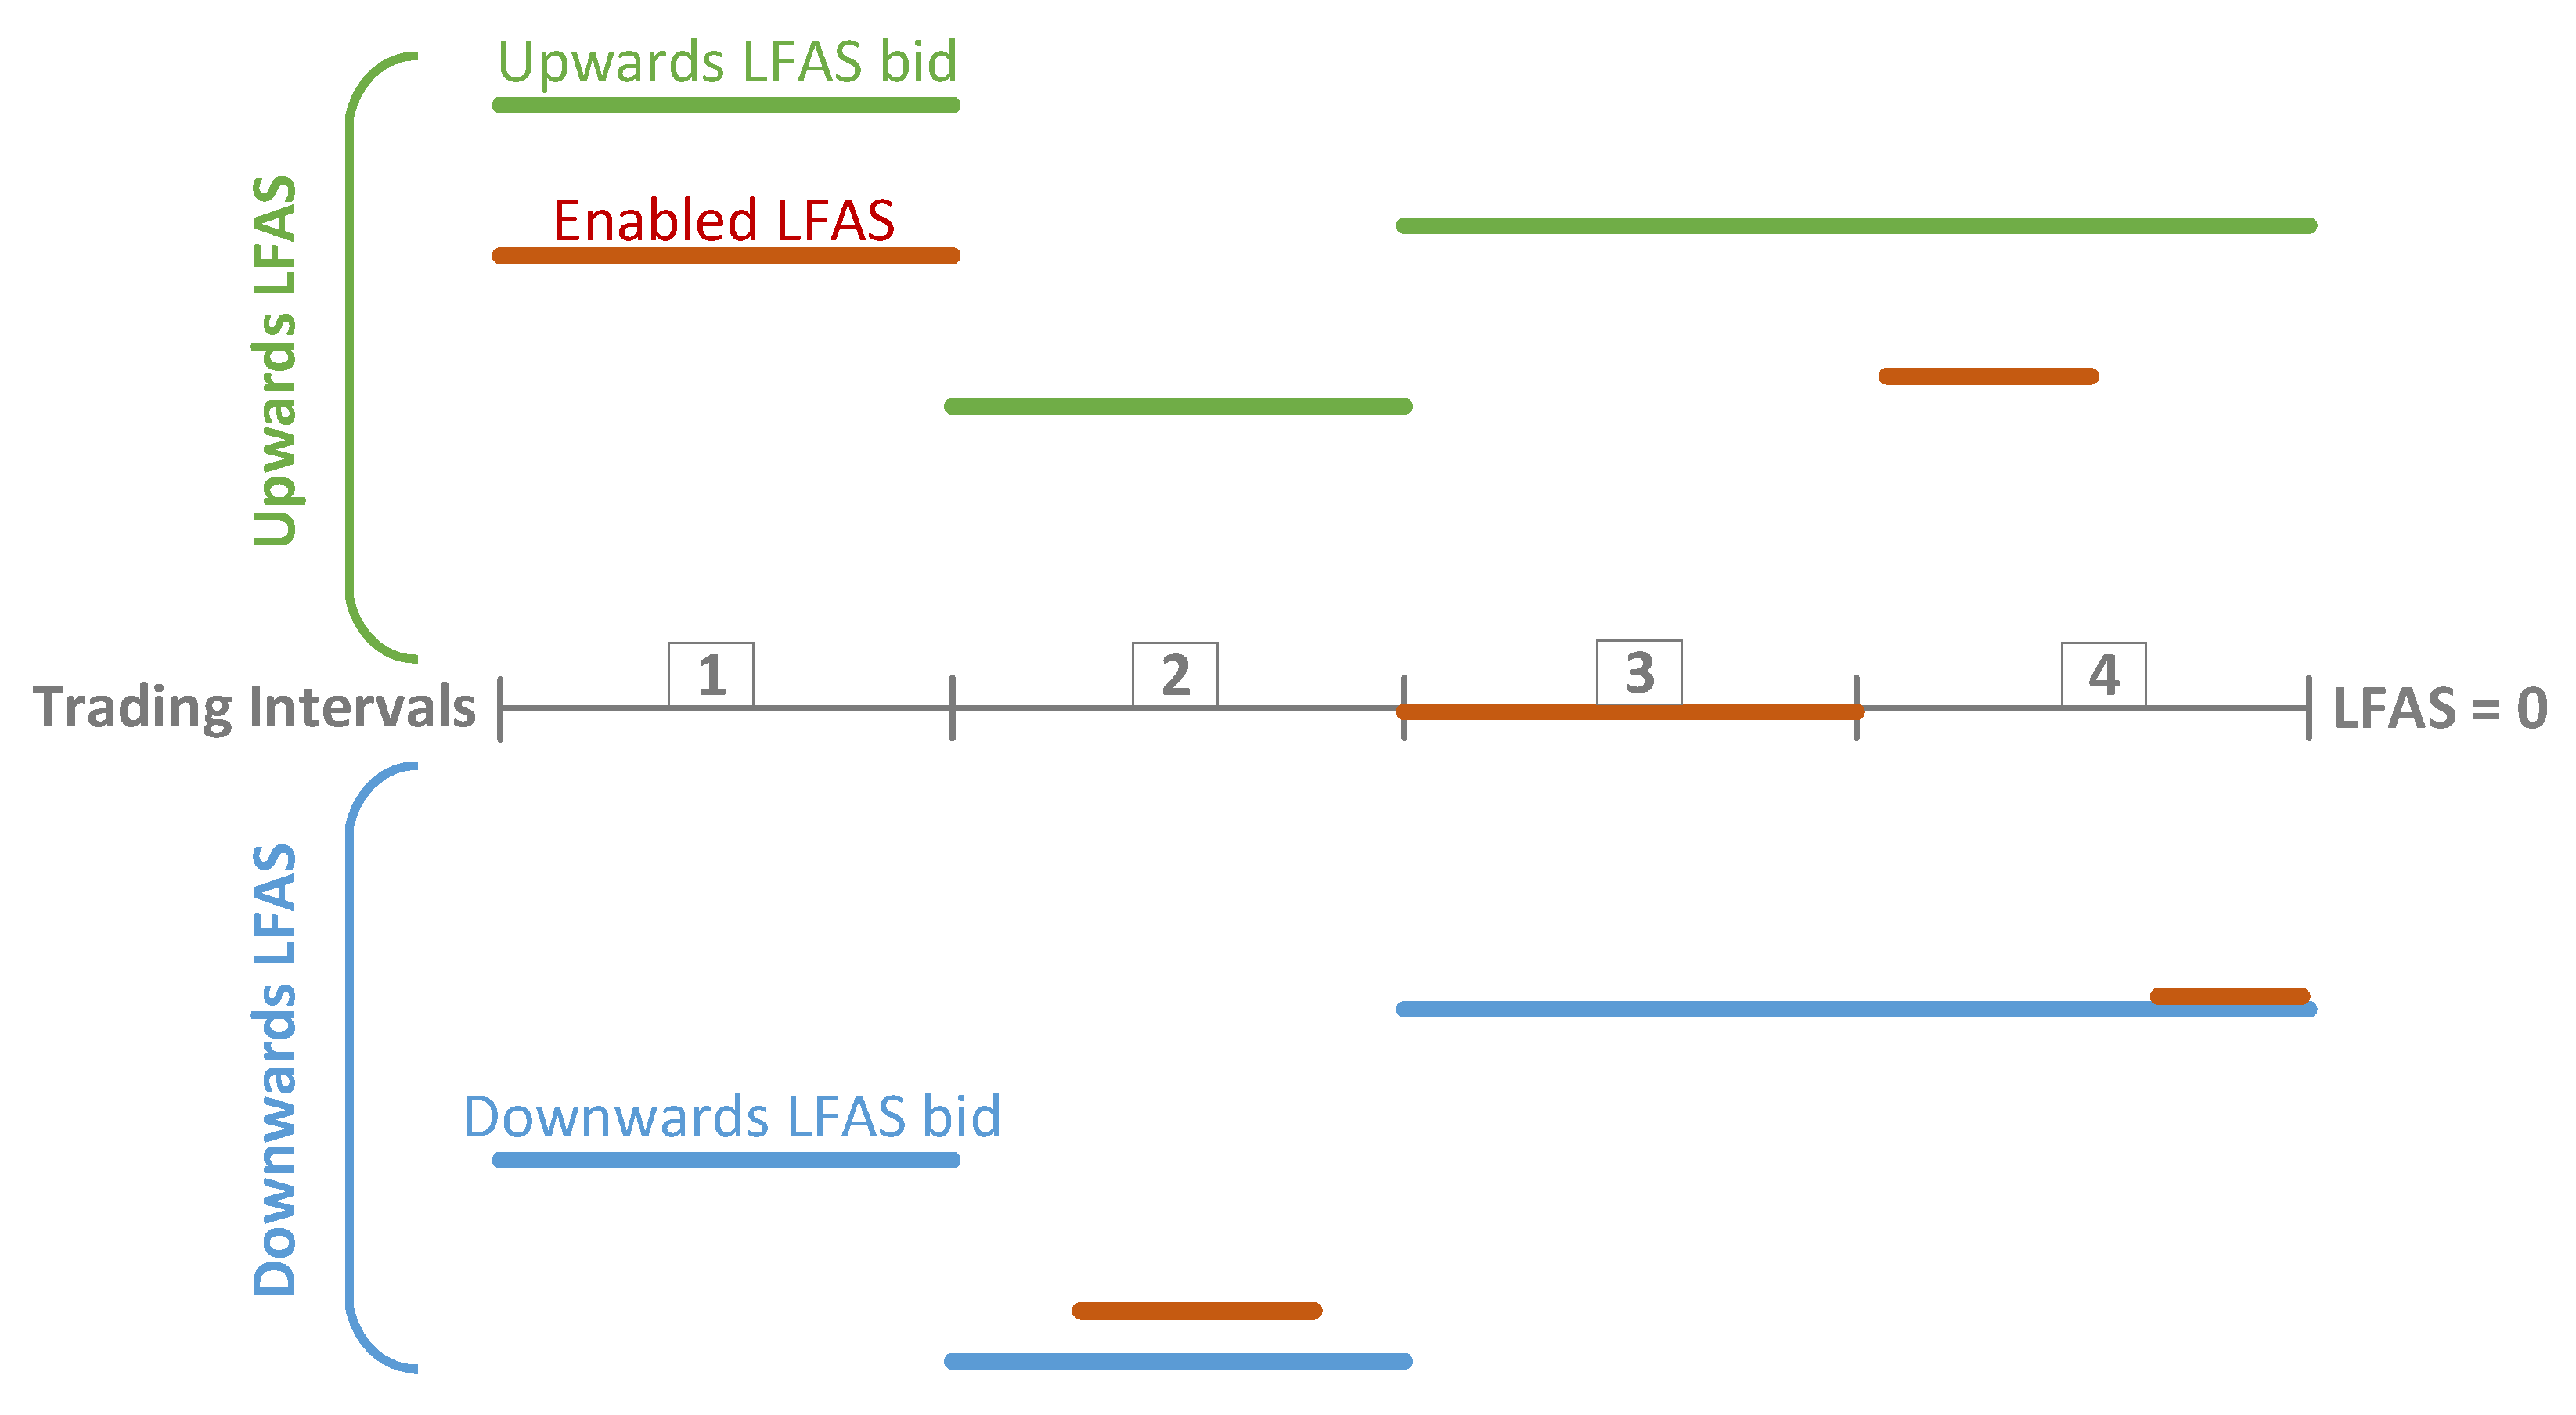
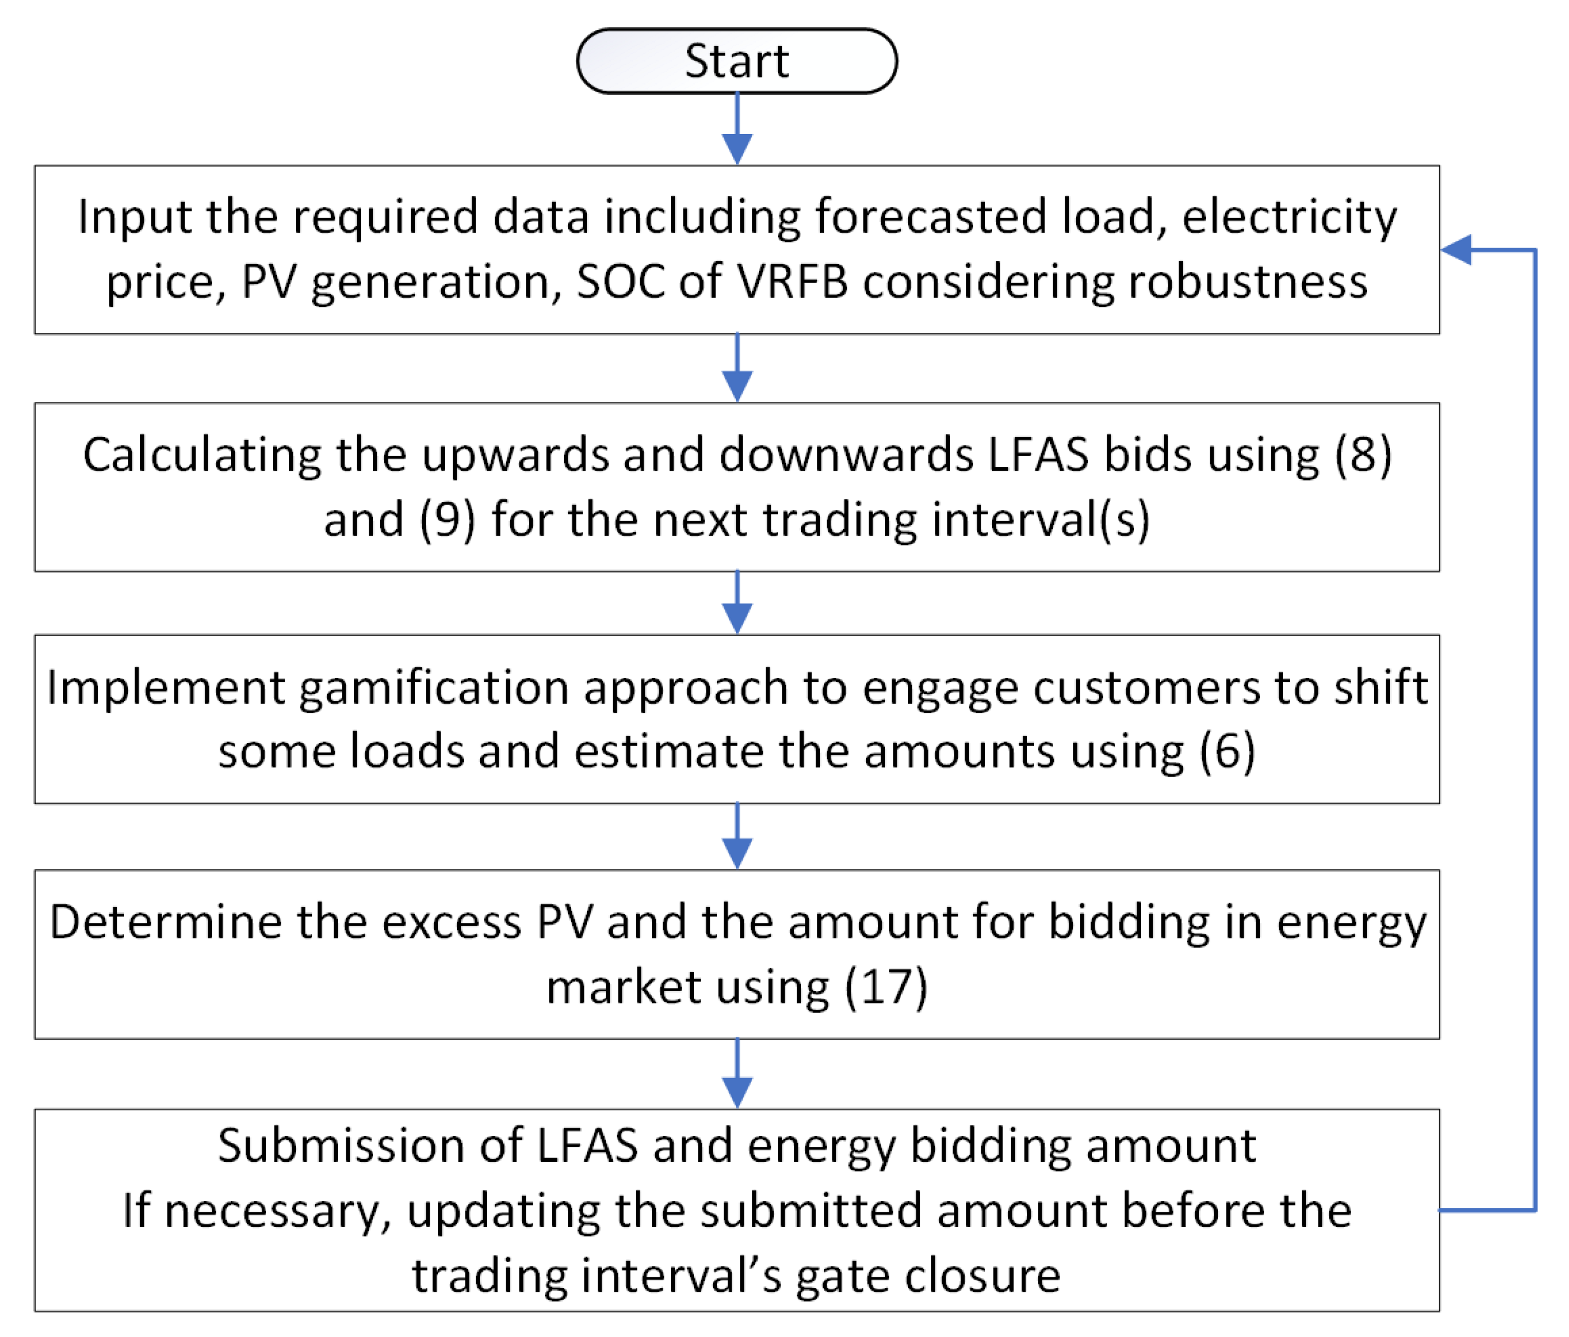
3. A Robust Bidding Strategy for the LFAS and Energy Markets

In the case of the realistic VPP in this paper, which is in the medium-sized range, and considering a size for energy storage of 350 kW/700 kWh and 810 kW for rooftop PVs, the following expert method of bidding strategy is used:
  • The VRFB is dedicated to participating in the LFAS market;
  • The excess PV generation is sold to the energy market after covering the customer’s load during PV generation.
For this bidding strategy, the customer’s load is shifted through the gamification approach from expensive energy hours during non-PV hours to non-expensive energy hours during PV hours to maximize the profit of the VPP, based on the gamification method in [21]. Most major appliances in this VPP such as a heat pump HWS, a dishwasher, a dryer, and a washing machine are controllable and planned to respond to the commands from the VPP controller to run mostly during PV generation as discussed in [4].
This bidding strategy is simple but effective, as it is based on the expert model, which is understandable and accepted by the industry. The rationale behind this strategy is that, at the moment, only scheduled generators, such as the VRFB, are accepted by the AEMO in WA to participate in the LFAS market [15]. The reward for participating in the LFAS market is also higher than participating in the energy market only, most of the time. Therefore, a major part of the flexibility in the VPP, which is energy storage, is dedicated to the LFAS. The overall structure of the proposed bidding strategy method is provided in the flowchart in Figure 2. As seen, after collecting the required data, the bids for the LFAS are obtained. Then, independently, the gamification is run, and the bidding amount for energy is calculated, as discussed in this section.

3.1. Bidding Model in the LFAS Market

The LFAS market is run for each 30 min (trading interval) in the WEM. The bidding into the LFAS market depends on the SOC of the VRFB at the end of the last trading interval and the efficiency of the VRFB. However, the amount of power bidding is also limited to the maximum power. The LFAS bids are proposed as in (8) and (9). The amount of bidding for the upwards LFAS is calculated based on the SOC divided by the trading interval ( T t r a d i n g ) for the LFAS market, multiplied by the roundtrip efficiency ( η V R F B e f f ) of the VRFB, as seen in (8). This bidding amount is capped by the maximum power capability of the VRFB. The efficiency of the VRFB is only considered in conjunction with upwards LFAS, as it is the roundtrip efficiency. Based on a similar concept, (9) provides the bidding value for downwards LFAS. Here, it is assumed that if the AEMO needs LFAS from this VPP, it enables the upwards or downwards LFAS bidding values to be determined as in (8) and (9).
In real life, the downwards and upwards LFAS are enabled for a shorter period of time within T t r a d i n g , which are defined as t L F A S , D O W N d , h and t L F A S , U P d , h , respectively. These times are modelled as random values, as in (13) and (14), because they depend on many parameters at the time of LFAS enablement including grid situation. The duration of LFAS usage depends on the balance of load and generation including roof top PV generation, which is very volatile; therefore, the best modelling for this duration is a random number. There is also a lack of available data on the enablement of the LFAS in each trading interval as they are not published by the AEMO. For the same reason, the command ( C m d L F A S ) by the AGC on the enablement of upwards, downwards, or both LFAS services during the corresponding trading interval, has a random behaviour. Hence, in the simulation, the command for LFAS enablement is generated randomly for each trading interval. For example in (13), if the downwards LFAS is not activated, t L F A S , D O W N d , h is zero, and if enabled, t L F A S , D O W N d , h is a random number uniformly distributed between 0 and T t r a d i n g .
E n a b l e L F A S d , h is the enablement rate of the LFAS service for the VRFB. In practice, the LFAS are not enabled in all intervals, which is modelled as a random variable here. A sensitivity analysis is conducted on the enablement rate in Section 4. The term r a n d o m ( 0 , T t r a d i n g ) is a uniformly distributed random number between 0 and T t r a d i n g , and r o u n d ( ) is the round function.
P r o f i t L F A S d in (11) is the daily profit from participation in the LFAS market. Although there are some costings associated with participation in the LFAS market in the WEM, the detailed costings of the contracts are only available internally to AEMO and not to the public. The AEMO has published the weighted average prices for upwards and downwards LFAS, ζ L F A S , U P d , h and ζ L F A S , D O W N d , h which are used in this paper, as shown in Figure 3 [20]. These prices include the weighted average of all revenue and expenses and can be used as representative of the profit of participation in the LFAS market.
E n e r g y T h r o u g h P u t V R F B d in (12) is the “energy throughput” of the battery for d-th day, which is the amount of energy that can be delivered by the VRFB. Although in some cases, the curve of depth of discharge (DoD) vs. lifetime of energy storages is used for estimating their lifetime, this approach is not very effective when we have volatile PV generation and load. In this paper, we are using the energy throughput parameters for estimating the remaining lifetime of the VRFB. This method is increasingly being adopted by more manufacturers, and they now guarantee the amount of energy throughput for their energy storages [23].
P L F A S , U P d , h = min ( S O C V R F B d , h 1 × η V R F B e f f T t r a d i n g , P V R F B m a x )     , d , h ,
P L F A S , D O W N d , h = min ( S O C V R F B m a x S O C V R F B d , h 1 T t r a d i n g , P V R F B m a x ) ,
S O C V R F B d , h = S O C V R F B d , h 1 + P L F A S , D O W N d , h t L F A S , D O W N d , h / η V R F B e f f P L F A S , U P d , h t L F A S , U P d , h     , d , h
P r o f i t L F A S d = h = 1 24 P L F A S , U P d , h ζ L F A S , U P d , h + h = 1 24 P L F A S , D O W N d , h ζ L F A S , D O W N d , h ,  
E n e r g y T h r o u g h P u t V R F B d = h = 1 24 P L F A S , U P d , h t L F A S , U P d , h ,  
t L F A S , D O W N d , h = { 0 C m d L F A S d , h = U P       o r       N o   c m d r a n d o m ( 0 , T t r a d i n g ) C m d L F A S d , h = D O W N r a n d o m ( 0 , T t r a d i n g / 2 ) C m d L F A S d , h = U P   &   D O W N ,
t L F A S , U P d , h = { r a n d o m ( 0 , T t r a d i n g ) C m d L F A S d , h = U P 0 C m d L F A S d , h = D O W N     o r   N o   c m d r a n d o m ( 0 , T t r a d i n g / 2 ) C m d L F A S d , h = U P   &   D O W N ,
C m d L F A S d , h = { U P R n d _ C m d L F A S d , h = 1 D O W N R n d _ C m d L F A S d , h = 2 U P   &   D O W N R n d _ C m d L F A S d , h = 3 N o   c o m m a n d R n d _ C m d L F A S d , h = 0 ,
R n d _ C m d L F A S d , h = { r o u n d ( r a n d o m ( 1 , 3 ) ) r a n d o m ( 0 , 1 ) E n a b l e L F A S d , h 0 r a n d o m ( 0 , 1 ) > E n a b l e L F A S d , h .

3.2. Bidding Model in Energy Market

As the battery is utilised in the LFAS market in this section, the only source of energy to participate in the energy market is the excess PV generation after covering the demand. E R E S d , h is the demand considering demand management through the gamified approach, as discussed in Section 2.1.
E E n e r g y d , h = E R E S d , h E P V d , h ,
where E E n e r g y d , h is the bidding amount in the energy market and E P V d , h is the PV generation in the h-th hour and d-th day. E E n e r g y d , h is negative when selling to and positive when buying from the market.

3.3. Robustness Consideration

Robust optimization means that the values of the decision variables obtained from the algorithm are optimum for the worst case of uncertain parameters [24]. Therefore, the robust algorithm tries to obtain the optimum results even for the worst-case scenarios which need to be found first. The uncertainty of participation in the LFAS market is the price of upwards and downwards LFAS. The electricity price and PV generation are the uncertain parameters in the energy market. These uncertain input parameters are modelled as variables between a low and high boundary. To satisfy the requirement of robust optimization, the worst-case scenarios are provided in Table 1. It is important to mention that considering the worst-case scenario in the method does not mean that the algorithm is conservative, but it does guarantee the robustness of the proposed method.
It is also assumed that when the LFAS service is enabled in any trading interval, the amount of bidding power for LFAS is used for the period of the LFAS provision, which is considered as the worst case for the use of energy storage.

3.4. A Robust Bidding Strategy for the Energy Market Only

When participating only in the energy market, the energy storage is also utilized for bidding in the energy market. A fast and robust method for this case is detailed in [21], and the strategy is not repeated here. However, in this paper, we provide a comparison against a traditional mathematical-based optimization algorithm to show the effectiveness of this proposed algorithm.

4. Simulation Results

In this section, the simulation results for participation of the VPP in the LFAS and the energy markets in the WEM is discussed. The case study is the realistic VPP, comprising 67 residential homes in South Lake in WA, which includes a 350 kW/700 kWh VRFB and an 810 kW solar system installed on the roofs of the dwellings. The detailed information on the design of this VPP is provided in [4]. Controllable appliances using EEBUS protocol with automatic and manual control platforms based on a cloud are also proposed for each home [25].

4.1. Assumptions

The costings of CAPEX such as solar system, VRFB, inverters, and the coefficient of market expenses are provided in [4]. Other input parameters are provided in Table 2. The uncertainty levels are modelled as a band interval. For example, 10% uncertainty of PV generation means that the PV generation changes within ±10% of the mean value of PV generation at a specific time.

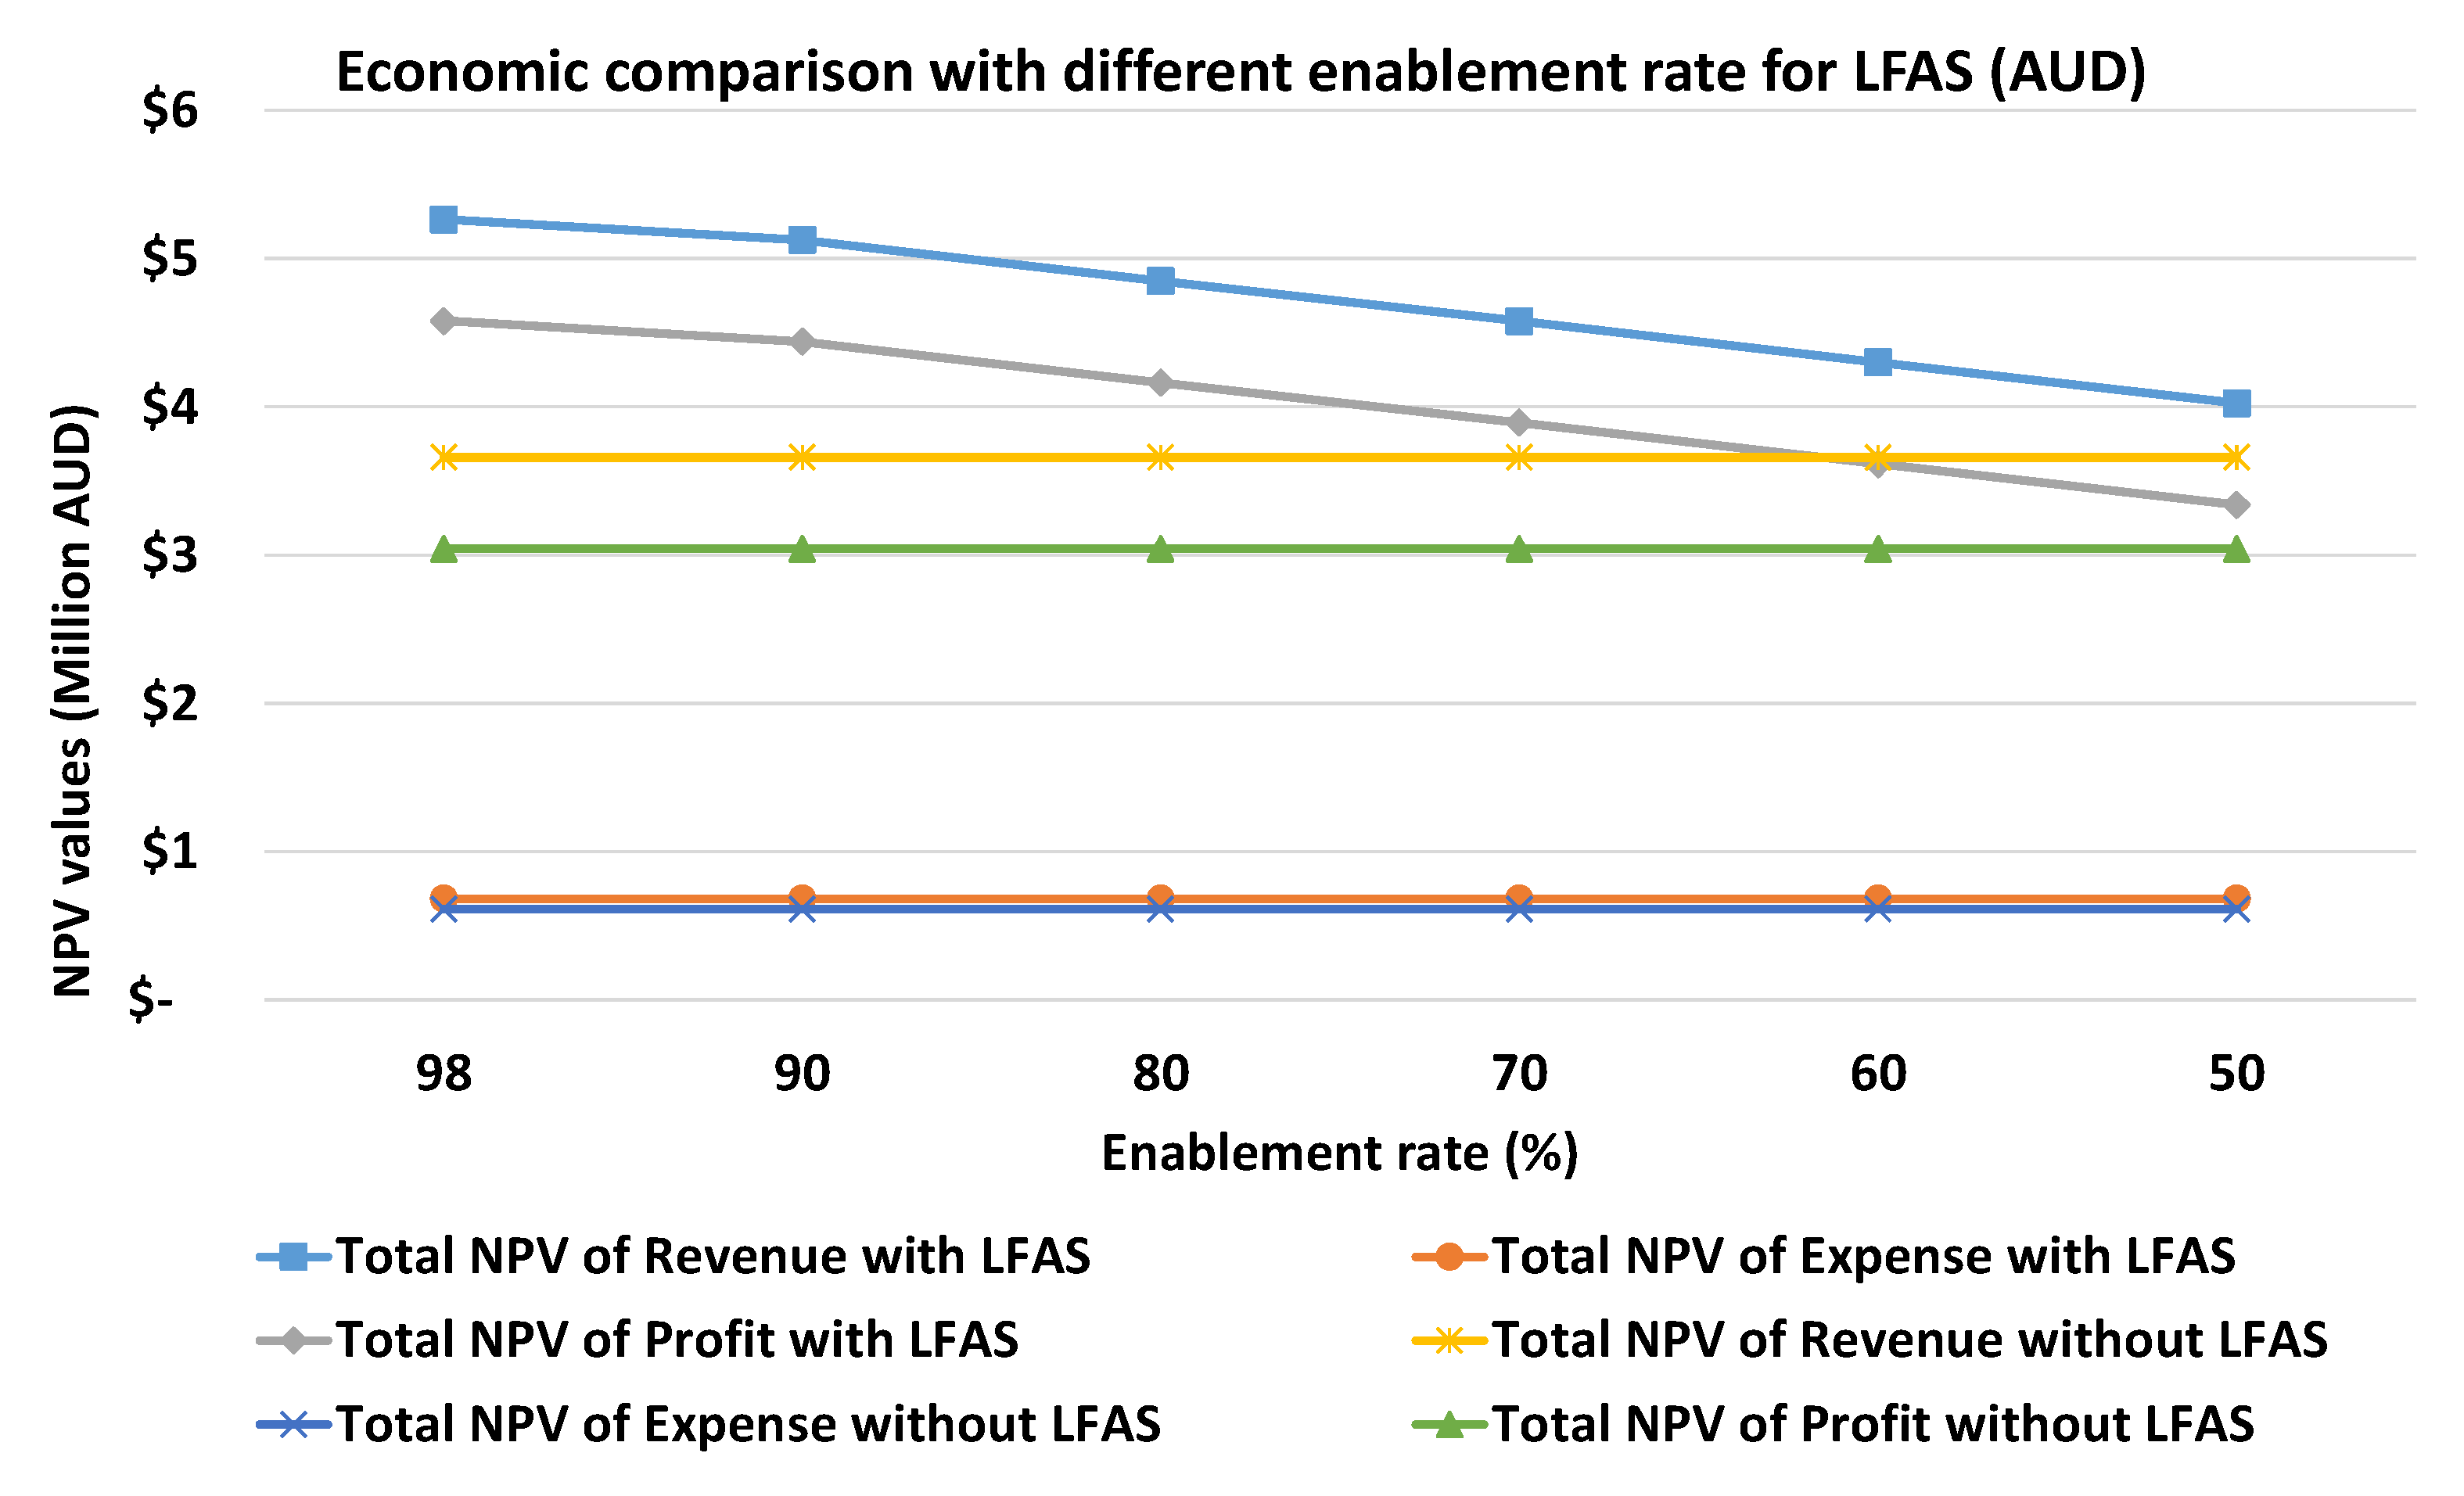
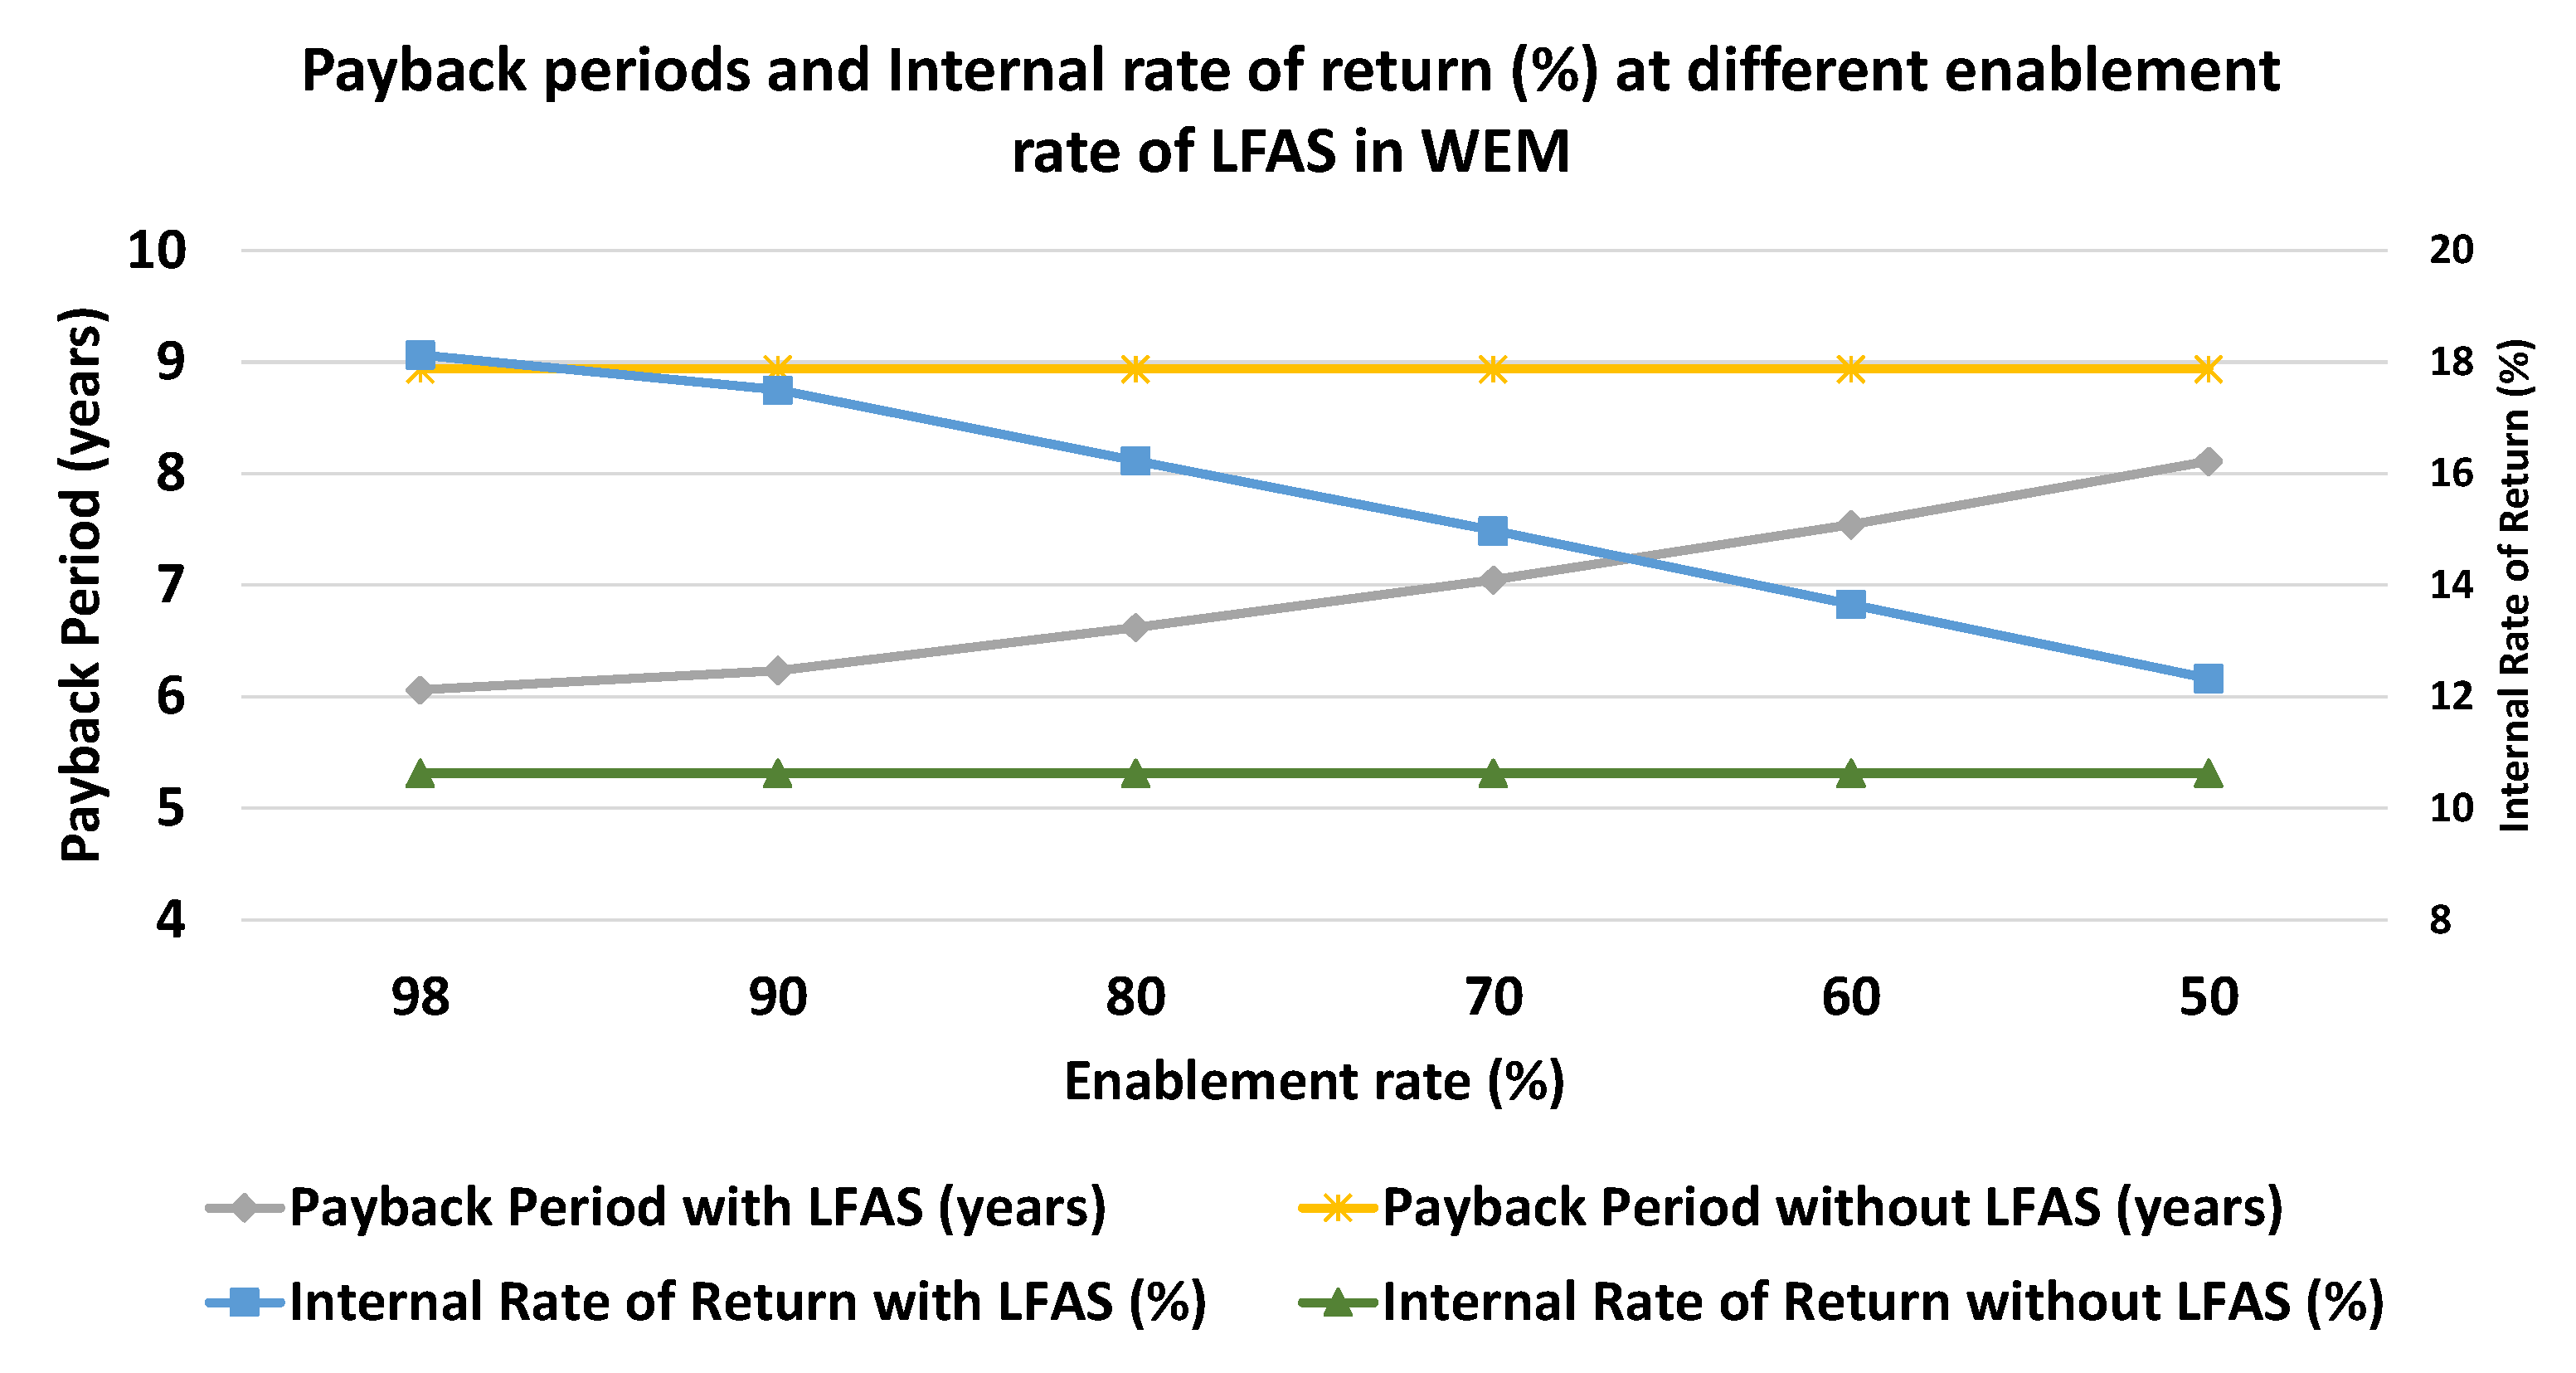
4.2. Economic Comparison

The duration of LFAS bidding when participating in the LFAS market is a random process; in order to have a better understanding of economic parameters such as profit and payback period, a Monte Carlo simulation with 100 runs was used. Each run includes a complete year of simulation for every trading interval. For each trading interval, the bidding values are calculated based on the strategy provided in Section 3. After obtaining the outcome of 100 runs, the mean and standard deviation of parameters are calculated for comparison. The Monte Carlo simulation has been run 1000 times for a case in this paper. The differences between the output data and those from 100 runs is almost negligible; therefore, 100 runs for the Monte Carlo simulation is justifiable.
The net present values (NPVs) of total revenue, expense, and profit for the duration of the project study (20 years) is provided in Figure 4. As seen in Figure 4, the total profit of the VPP is reduced by decreasing the enablement of LFAS service. The profit is about AUD 4.6 M for an enablement of 80% and decreases to about AUD 3.3 M for an enablement of 50%, which is about 28% reduction in the profit of the VPP. In realistic operation, we are expecting an enablement of more than 80%, as there are many volatile rooftop PV generators connected to the grid and they are increasing with time. Furthermore, batteries are much faster than traditional rotating generators, so they can respond to any frequency deviation faster; this means that the LFAS services by the VRFB can be enabled faster and with a higher probability.
Figure 4 shows that the profit of the VPP with the LFAS is higher than the profit without the LFAS and only participating in the energy market. As indicated in Figure 4, the profit with the LFAS at an enablement of 90%, for example, is about AUD 1.4 M higher than the profit when participating only in the energy market. This shows a significant improvement of around 45% in profit by participating in the LFAS market. Figure 4 illustrates that there are no major differences in the NPV of the expenses, as the enablement influences the operation of the energy storage, and the investment is about the same. The standard deviation (SD) of the parameters including the NPV of profit and revenue is around 0.5%, which shows a consistent outcome across 100 different runs of the Monte Carlo simulation.
As shown in Figure 5, the payback periods and internal rates of return (IRRs) for different levels of enablement rate (%) for the LFAS market, and the comparison with the financial parameters without the LFAS market, are presented. As can be seen in Figure 5, the figures for the payback periods and IRRs are much better in the case with LFAS participation. The payback period shows a significant improvement to about 6 years for the enablement of more than 90% of the LFAS, compared to about 9 years without LFAS participation; this is a very good incentive for private investors to invest in VPPs. As illustrated in Figure 5, the IRR is about 18% with the LFAS with an enablement of more than 90%, while the IRR is around 10% when the VPP is designed to only participate in the energy market; this is a major improvement in the financial outcome when considering the LFAS market. As seen in Figure 5, the payback period increases from 6 to 8 years, and the IRR decreases from 18% to 12%, when the enablement rate decreases from 98% to 50%. The main reason is that the revenue from the LFAS market reduces by the decrease in the enablement rate, while the investments on the CAPEX are about the same for both cases.
In Figure 5, the SD of the IRR and payback period is around 0.6%, which shows a robust outcome across all 100 runs of the Monte Carlo simulation.

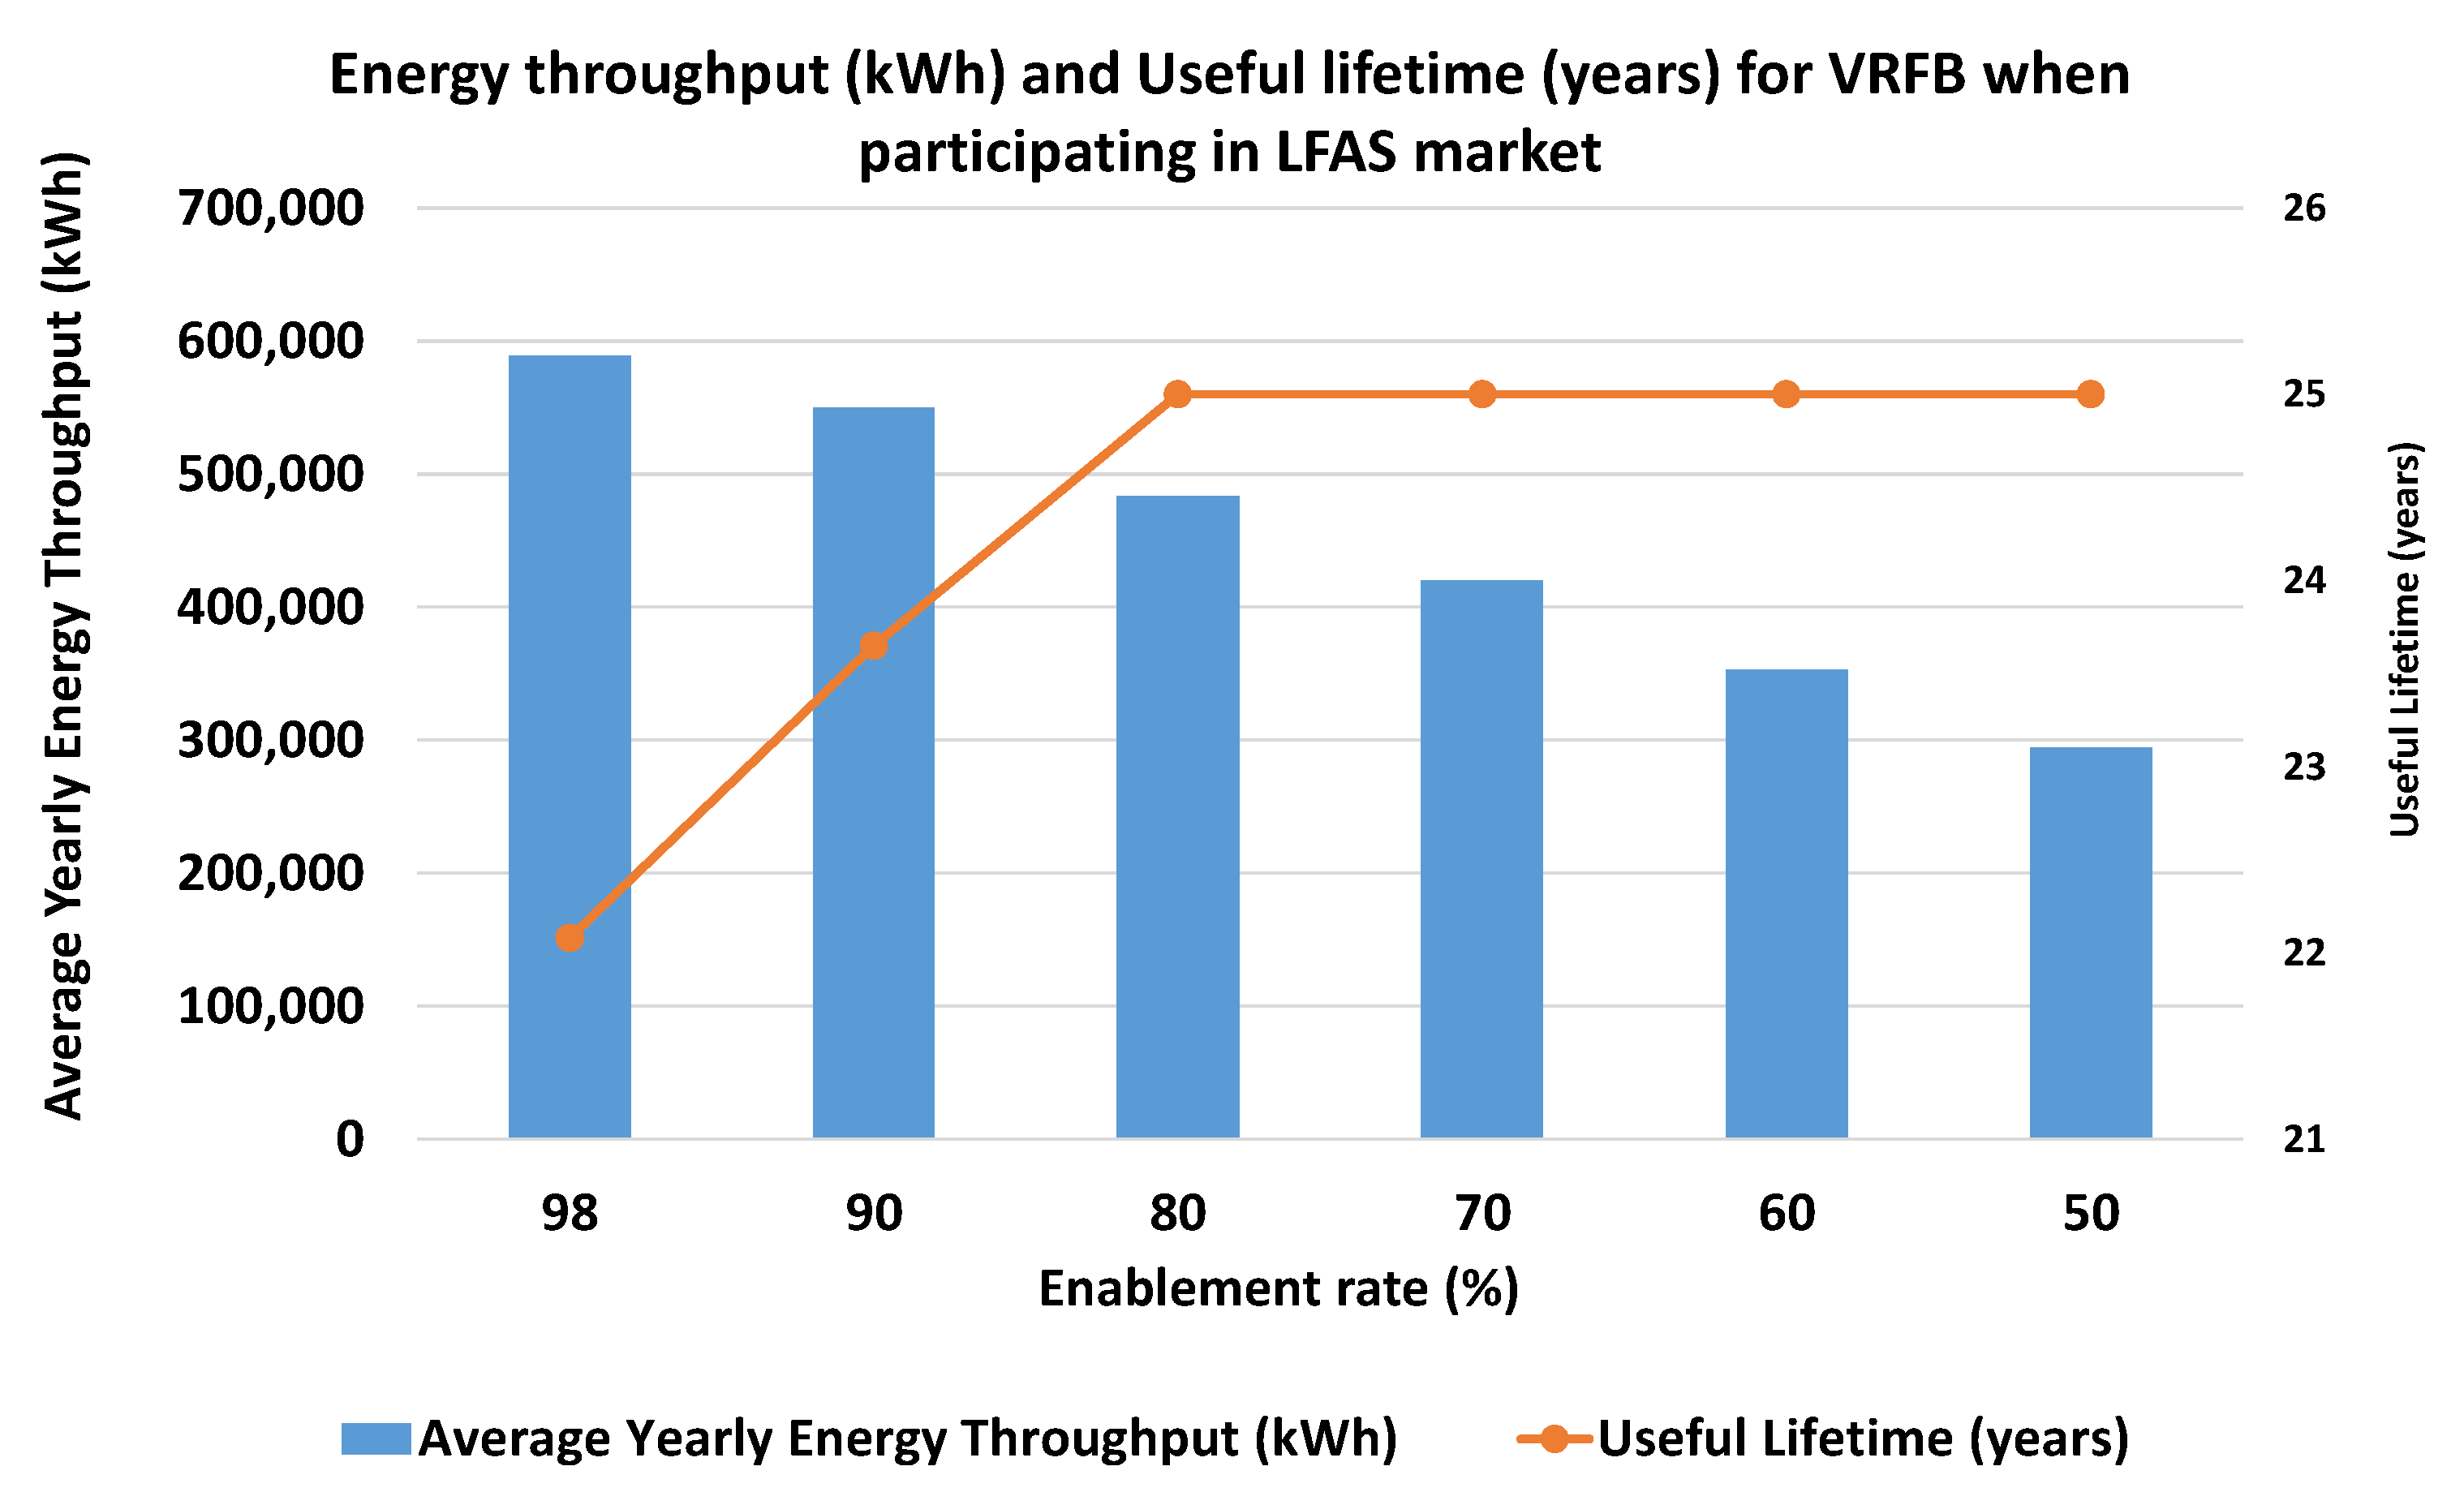
4.3. Energy Throughput and Lifetime of VRFB

When participating in the LFAS market, we charge and discharge the VRFB more often, so we need to investigate the lifetime of the battery at different levels of enablement, as seen in Figure 6. As can be seen in this figure, the energy throughput by the VRFB increases with a higher level of enablement, resulting in a reduction in the useful lifetime of the battery. As shown in Figure 6, if the enablement rate of LFAS is less than 80%, the useful lifetime of the VRFB is its calendar lifetime or 25 years. Figure 6 shows that the useful lifetime of the VRFB is less than 25 years when the enablement rate is more than 80%. However, the useful lifetime of the battery is still more than 20 years when the enablement is higher than 80%, which is more than the horizon year for the analysis of this project (20 years). Therefore, the VRFB can be used at the highest enablement rate, and it is expected to deliver LFAS service during the lifetime of the project. This is another advantage of the VRFB when compared to other types of energy storage.

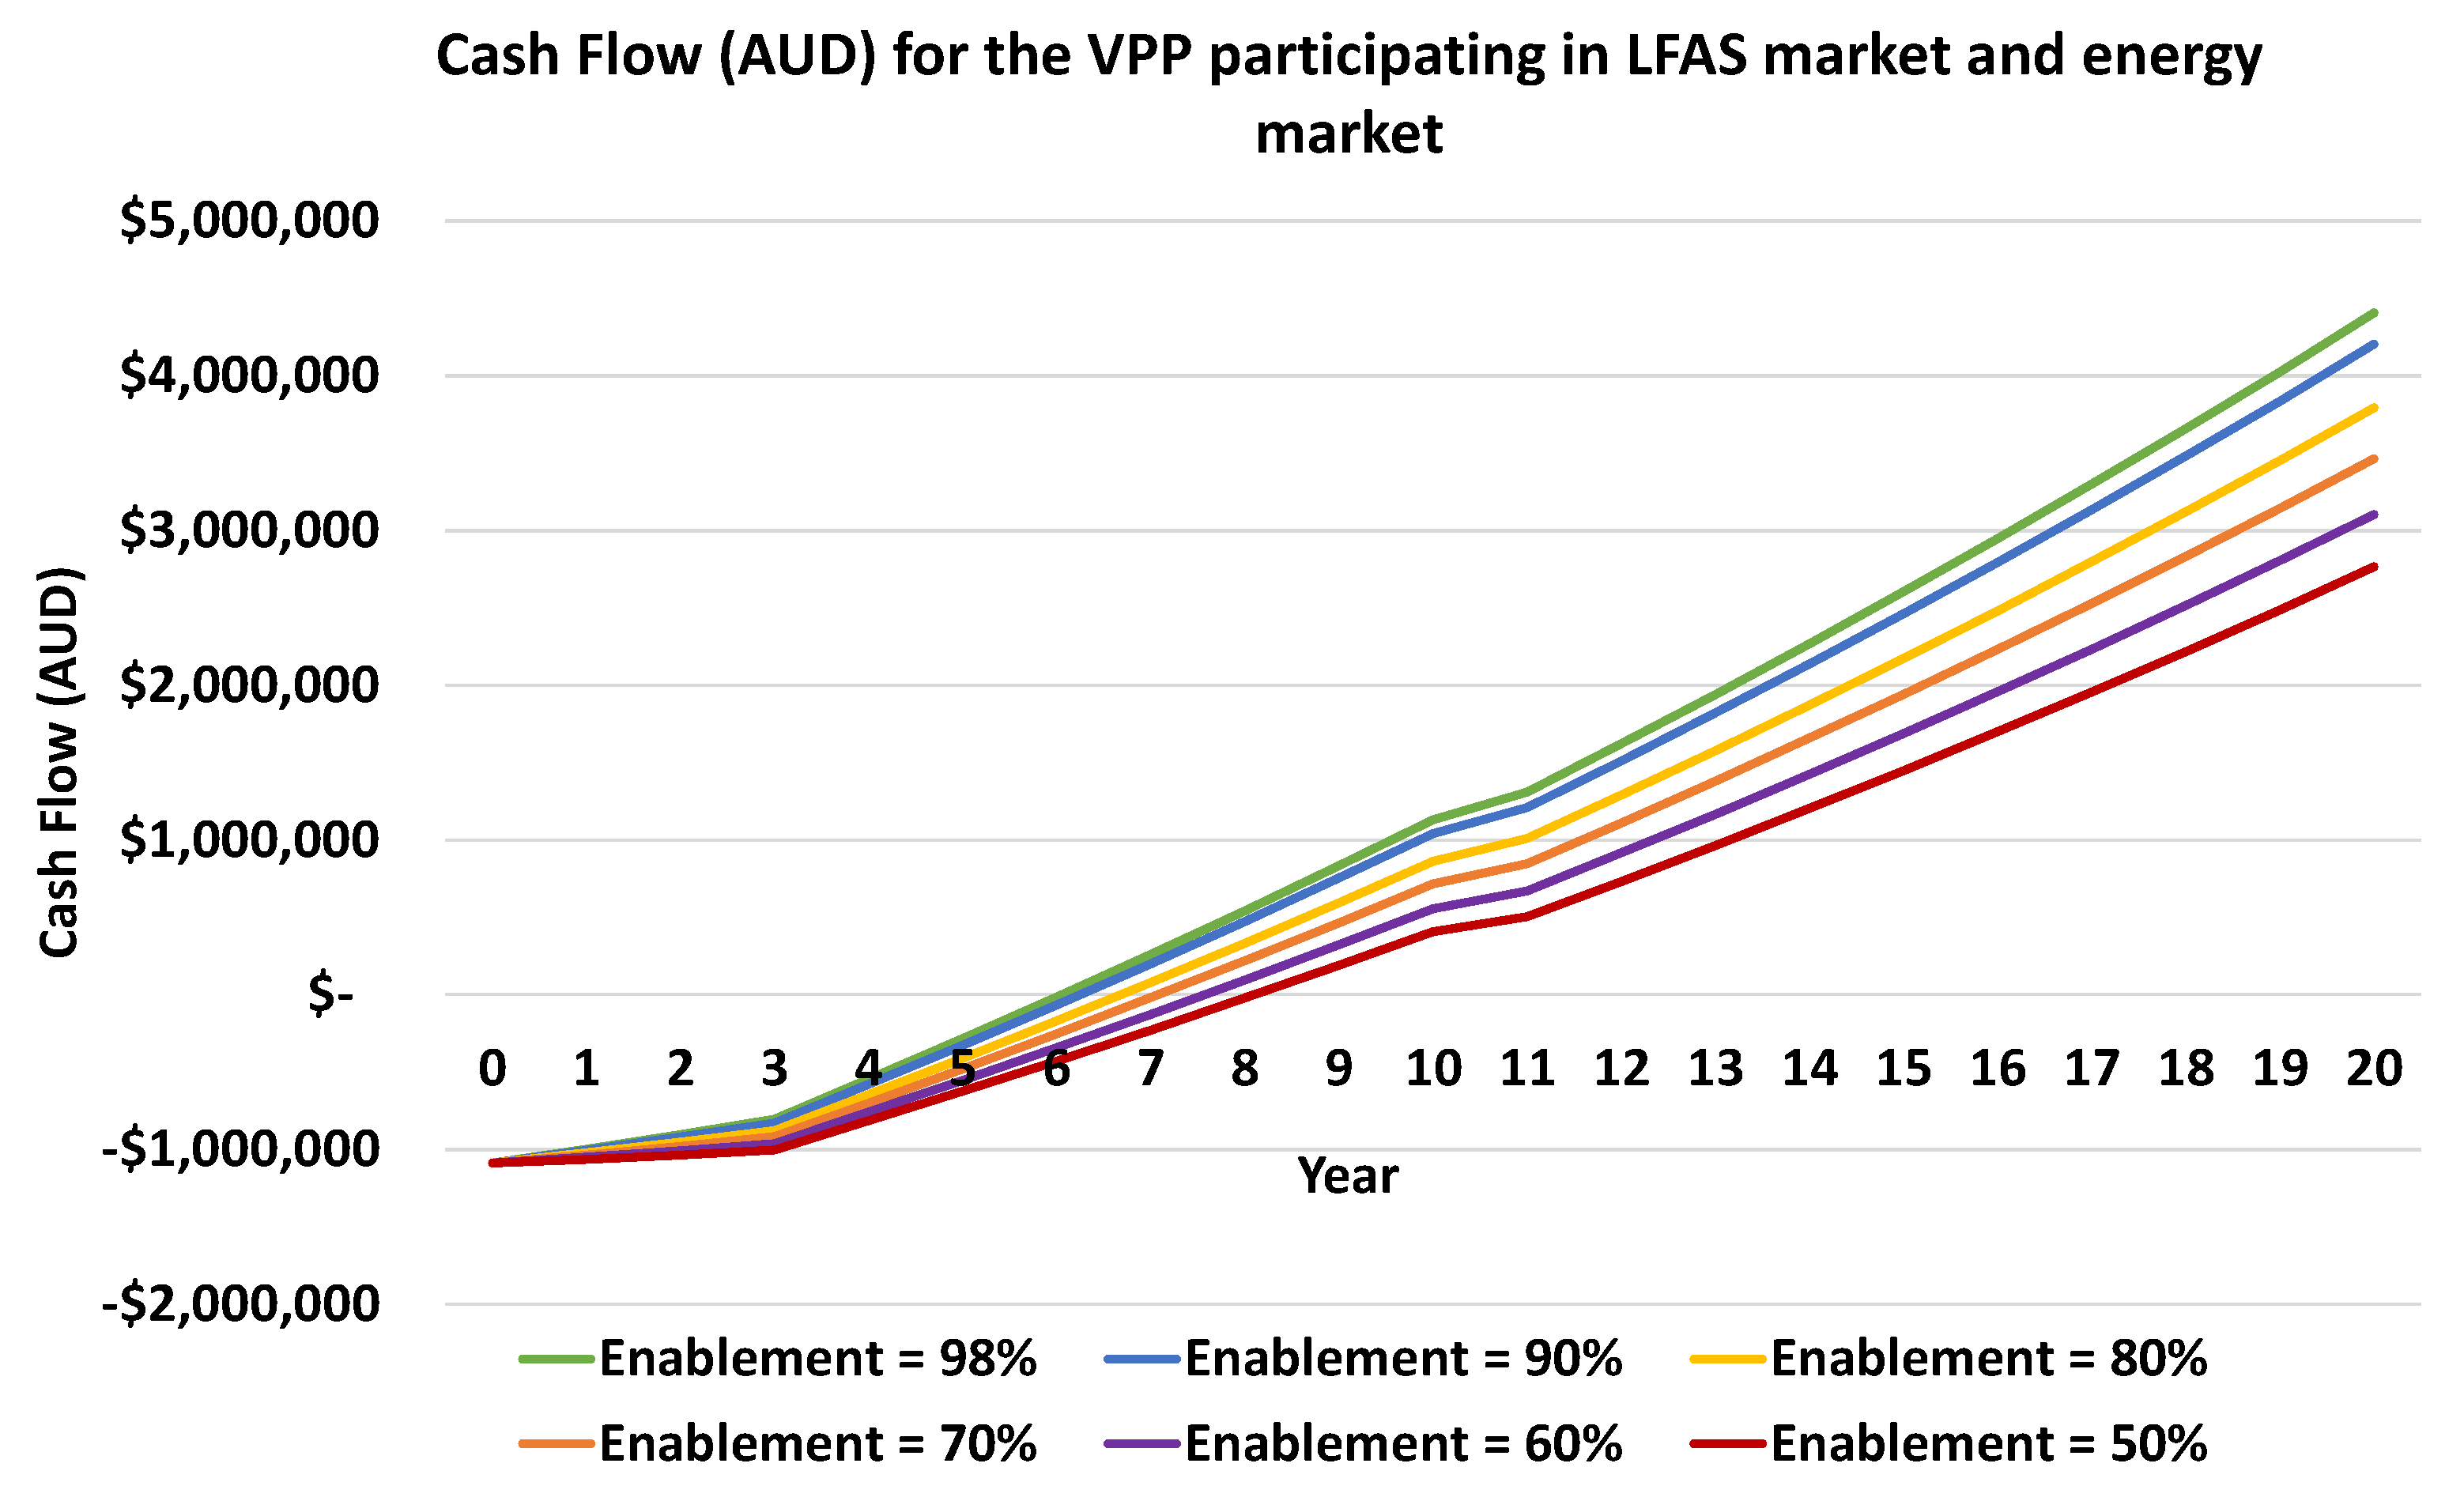
4.4. Cash Flow Analysis

Another financial indicator for a project is the cash flow. As depicted in Figure 7, the cash flow with different enablement rates is provided. As shown in Figure 7, the investment in year 0 is almost the same for all cases of the enablement. However, the amount of income is much higher in later years, when the enablement rate for LFAS activation is higher. Figure 7 illustrates, for example, the cash flow in year 20 with an enablement of 90% is about AUD 1.5 M higher than the case with an enablement of 50%. The cash flow graph shows that the payback period of the cases with the higher enablement is lower, as seen in Figure 7, because the VRFB is participating more in the LFAS market when the enablement is higher.

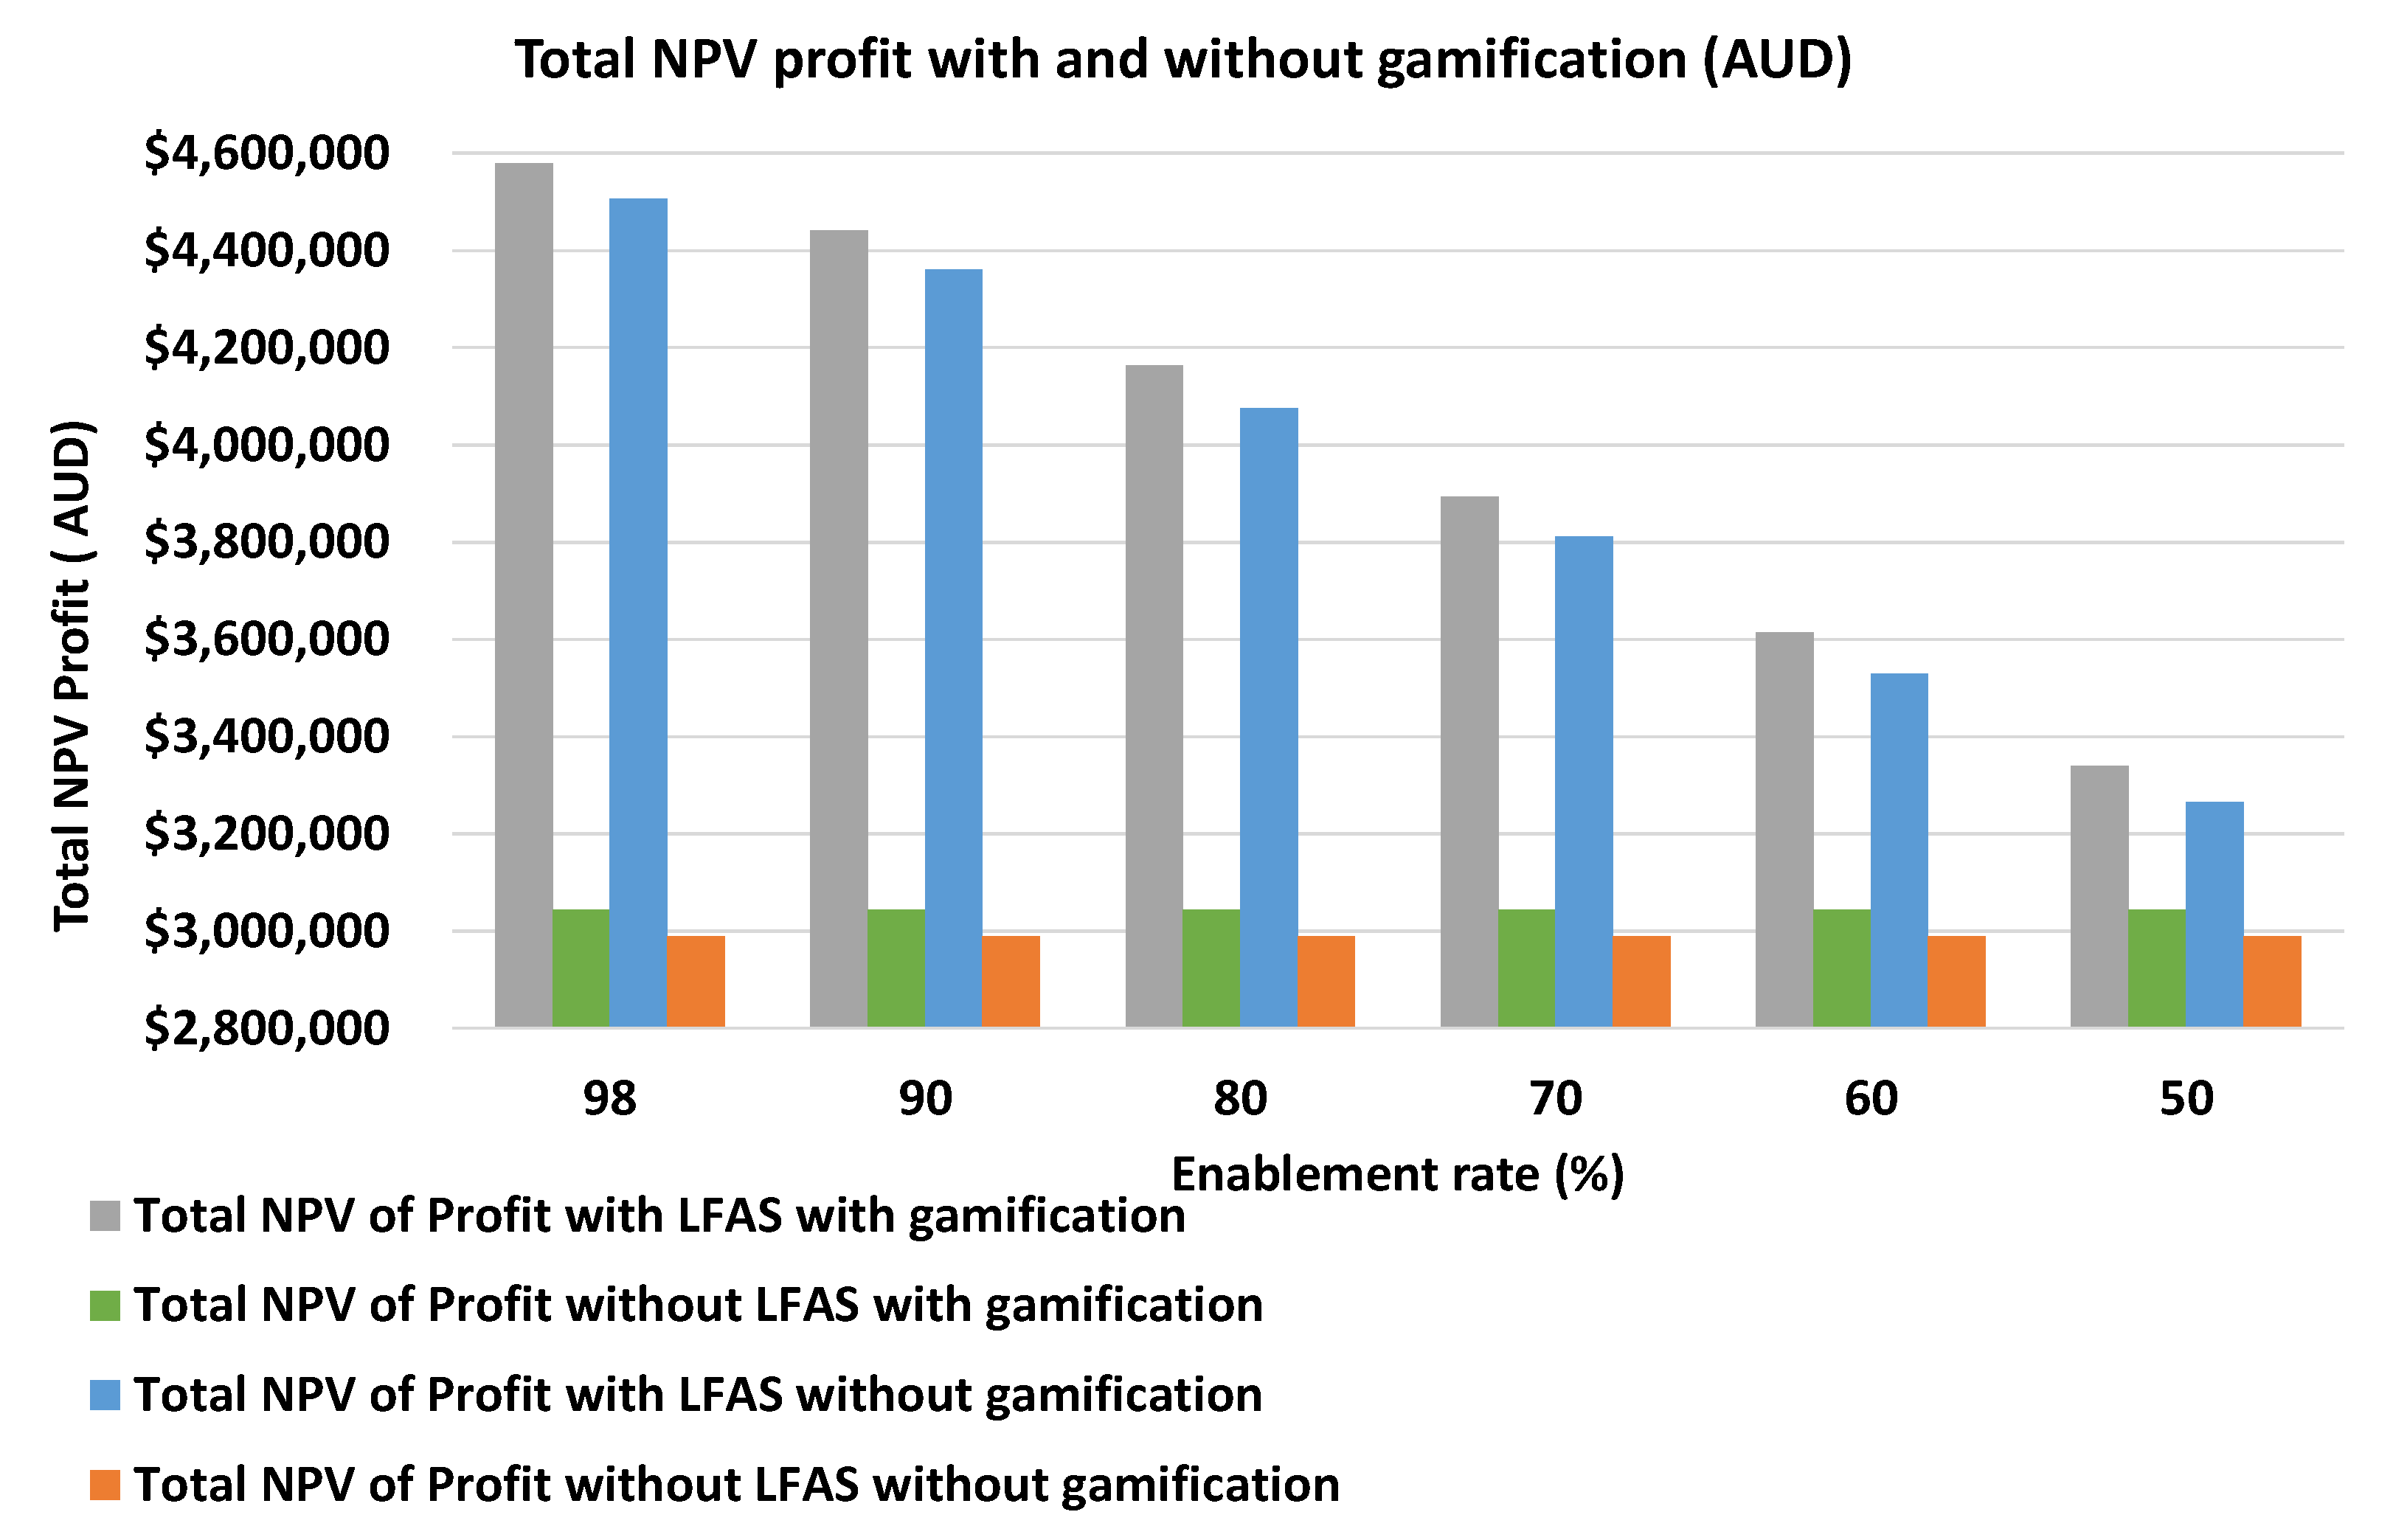
4.5. The Impact of Gamification

It is desirable for the VPP investor to see the impact of gamification for customer engagement on the financial parameters of the VPP. Here, we discuss some aspects of this effect; for example, the revenue and profit at different enablement with and without gamification is provided in Figure 8. As shown in this figure, the total profit is higher with the gamification as this approach encourages customers to participate in demand management through an enjoyable and gamified system, while not compromising their comfort levels. As seen in Figure 8, the increase in the total profit due to gamification when participating in both the LFAS and energy markets is about AUD 80,000, which is an improvement in the total profit. As depicted in Figure 8, if the VPP participates in the energy market only, the improvement is about AUD 54,000 with gamification. This shows that the gamification is also more effective when the VPP is participating in both the LFAS and energy markets, as compared to the case of only the energy market.
Figure 9 shows that the payback period is higher without considering gamification, which is a fraction of a year of improvement with gamification. In this simulation, just one run of the program is considered to show indicative results for the payback periods and profits.
As shown in Figure 9, the improvement of performance due to gamification is not relatively very high as the number of dwellings is not very high and the peak load of the customers (~140 kW) compared to the size of PV (810 kW) and battery capacity (700 kWh) is low. If the VPP expands in the future and includes more customers, this improvement will also be enhanced. To prove this, the simulation is run with five times larger load. In this case, the profit of the VPP increases by about AUD 220,000 with gamification as compared to without gamification. This shows that the number of customers and the level of loading has a great impact on the gamification approach for customer engagement.

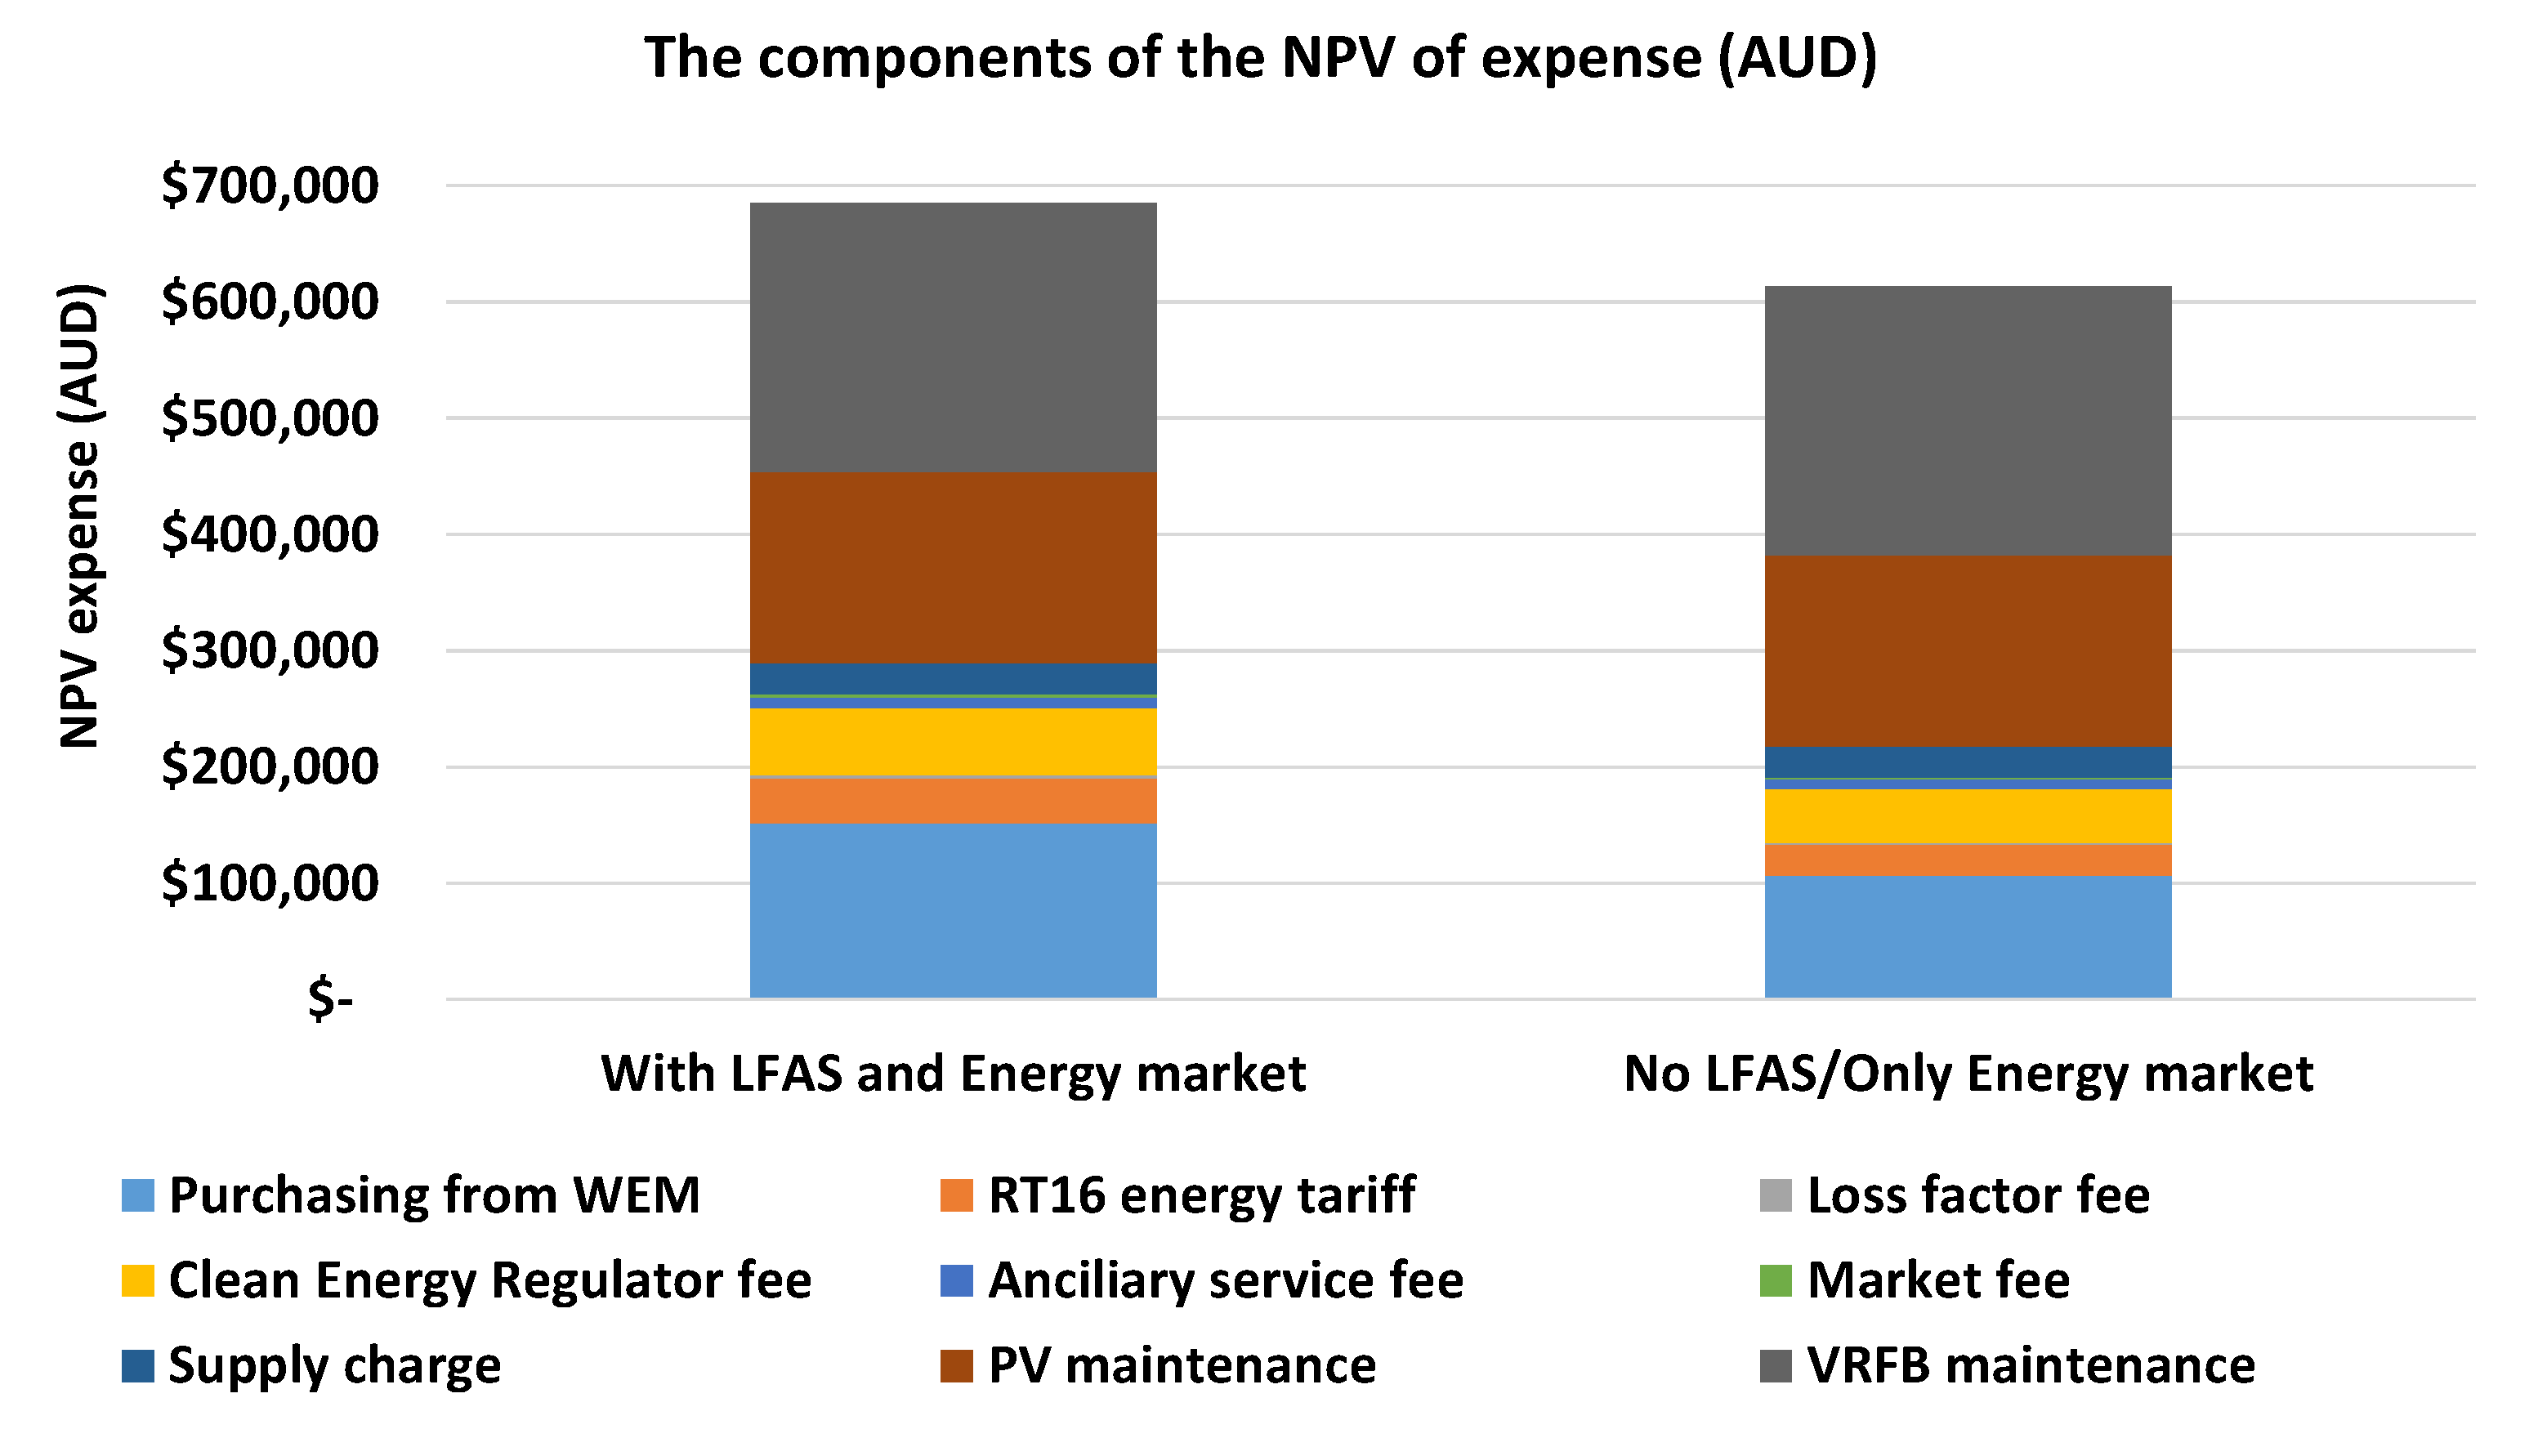
4.6. The Components of the NPV of Revenues and Expenses

The components of revenues and expenses are detailed in this paper and in [4]. Figure 10 and Figure 11 show the components of the NPV of revenue and the NPV of expenses, respectively. As can be seen in the revenue graph, Figure 10, the component of the LFAS revenue decreases by the reduction in the enablement of the LFAS. This LFAS revenue does not exist in the revenue component of the case in which the VPP participates only in the energy market. As seen in Figure 10, the reserve capacity credit is revenue when the VPP is not participating in the LFAS, as the VPP can apply for and receive a credit for the development of capacity in the WEM. However, when the battery is dedicated to the LFAS market, the VPP cannot obtain a measurable reserve capacity credit for it. As shown in Figure 10, the amount of energy sold to the WEM in the case of no LFAS is higher than the cases with the LFAS participation. As in this case, the VRFB is also charged and discharged optimally to sell energy to the WEM. The figures provided in this section were obtained by one simulation run to show indicative values of revenues and expenses.
As shown in Figure 11, the expenses for different levels of the enablement are about the same; only one representative example of the expense components is provided. As can be seen in Figure 11, the amount of energy purchased from the WEM in the case with the LFAS is higher than the case without the LFAS, as energy storage is working towards an optimal energy transaction in the case of no LFAS. It is evident that the major expenses are associated with the maintenance of the VRFB and PV panels.

4.7. Customer Benefit

As discussed in Section 2, the tariff for the customer within the VPP is provided 10% cheaper when compared to the tariff of the local utility. This provides a 10% reduction in the costs of electricity for each dwelling. The average cost of electricity per home within the VPP per year is about AUD 1504 considering the assumptions in this simulation. This electricity cost could be AUD 1671 if the customers are not a part of the VPP. In addition, the customer can benefit from participating in the gamified app to socialize and compete for obtaining more discounts in energy consumption.

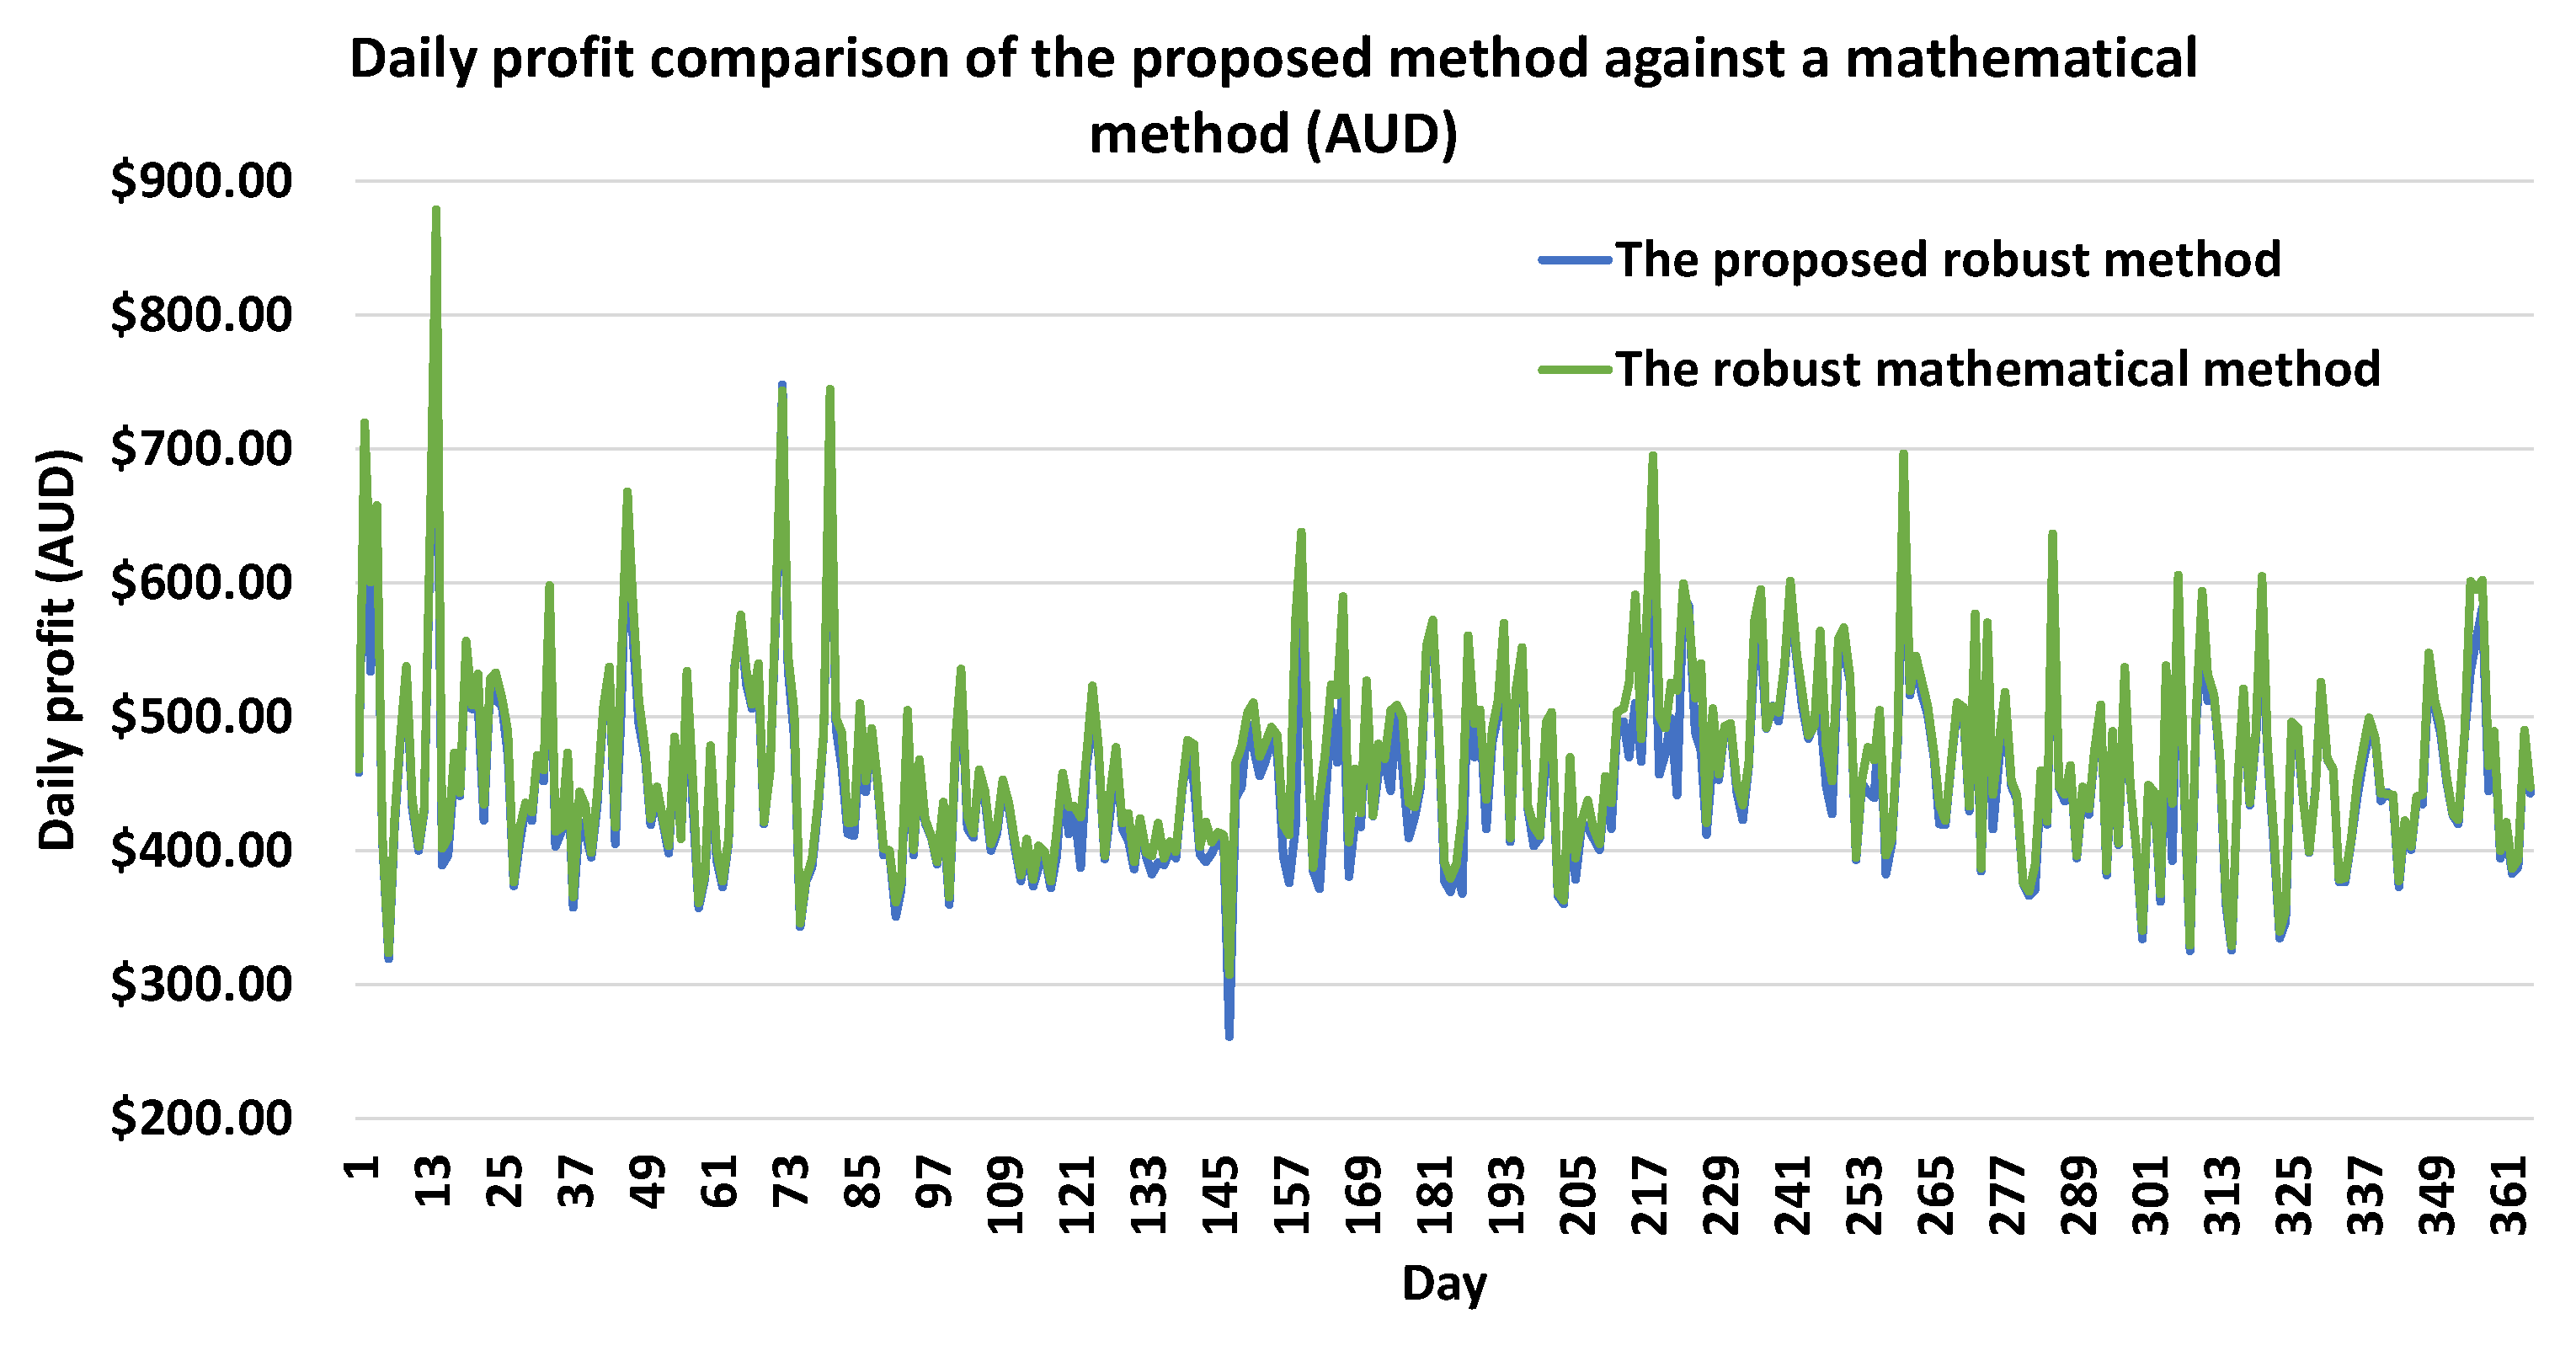
4.8. Comparison with a Robust Mathematical Algorithm

To verify the expert and robust methods provided for the bidding in the energy market only, the proposed approach provided in [21] is compared with a robust mathematical algorithm, detailed in [26].
Figure 12 shows the daily profit optimized using both the proposed robust and the mathematical methods. As can be seen in Figure 12, the difference between the outcome of these two algorithms is very small. As depicted in Figure 12, the average daily error for the profit over a year is 2.7% and the SD of the error is 3.1%; this shows the accuracy of the proposed robust and simple methods.
Figure 13 illustrates the yearly revenue, expense, and profit obtained using the proposed method and the mathematical algorithm. As seen in Figure 13, the difference over a year is also very minor, with an error of 2.9%, 4.1%, and 2.7% for the yearly revenue, expense, and profit, respectively. These errors over a year are very small compared to the benefits of the proposed robust bidding strategy, which are also understandable and fast.
The computational time taken to find a solution with the bidding strategy for 365 runs over a year for 365 days based on the proposed method and another robust mathematical method, is presented in Table 3. As seen in this table, the difference between the running time is significant, which is critical when the VPP wants to evaluate the bidding values upon receiving new data just before the gate closure. In such cases, the VPP can run the bidding strategy to find better values for the bids to improve the profit. In some cases, the VPP is required to run more sensitivity analyses with respect to the uncertainties of input data in a short period of time, e.g., major weather events or a fault in the VPP, to revise the bidding and enhance the reliability and profit of the VPP. In this case, the speed of the proposed expert method is essential. Another benefit of the proposed fast method is that the amount of required memory for the proposed expert method is much less than for the robust mathematical method, as it does not require a lot of iterations to solve the bidding problem.
The abovementioned evidence shows the significance of the proposed method over traditional mathematical methods. The platform for simulating these methods is MATLAB on a machine with a 2.9 GHz CPU and 16 GB RAM.

5. Discussion

The simulation shows that the proposed bidding strategy is a powerful tool for VPPs when they are participating in the energy and LFAS markets. This bidding strategy can exactly determine the bidding values in both markets by considering the uncertainties and the associated constraints. The modelling is based on an expert and robust method considering the WEM rules. This model is validated through comparison with a robust mathematical algorithm.
The financial indicators of the VPP under study improved when it participates in both the energy and LFAS markets. For example, the profit with the LFAS at an enablement of 90% is about AUD 1.4 M higher than the profit when participating only in the energy market. The payback period was enhanced to about 6 years when participating in both the energy and LFAS (with 90% enablement) markets, as compared to about 9 years without LFAS participation. Further, the IRR is about 18% by engaging in both the LFAS and energy markets, while the IRR is around 10% when participating in the energy market only.
Such an improvement in economic parameters encourages investors to invest in private VPPs. However, there are some practical challenges, such as the cost of batteries. To reduce the cost of batteries over the lifetime of the project, in this paper we propose the use of VRFB, which gives us a longer lifetime and lower maintenance and replacement costs.
One of the critical benefits of the proposed algorithm is its high speed and the low computational effort required. The speed of the proposed algorithm for the bidding strategy is critical due to the following reasons:
  • In the electricity market, there is a gate closure moment right before each trading interval [15]. The participants can provide an updated bid for the energy and LFAS markets based on the most recent and up-to-date data and information to maximise their profit. As this period for decision making is very short, many participants cannot effectively use this period due to the higher computational efforts of their bidding algorithm. Therefore, the speed of algorithm needs to be very high to accommodate the need for very quick decision making.
    Although the error of the proposed method is about 2.7%, the speed of the proposed algorithm (about 1435 times faster) enables the participants to maximise their profit by a better bidding value for each trading interval before the gate closure. If the proposed algorithm improves the bidding for each trading interval by as little as 5% (as an indication) on average, the total benefit of participants due to the use of the proposed algorithm would be higher when compared with the other strategies.
  • Sometimes, participants want to analyse uncertainties and different input parameters before the closing gate of each trading interval to find an optimal bid. In such situations, the speed of the algorithm is much more critical. In these cases, the proposed algorithm can attain the opportunity for market participants.
  • In long-term power system planning, we need thousands of iterations with thousands of variables. The inclusion of the electricity market in planning and analysis with a bidding strategy that is not fast enough, results in a huge computational effort in the scale of many days. Therefore, the proposed fast bidding strategy is crucial from the planning perspective. Another benefit of the fast algorithm is the much lower memory required for attaining an optimal bid, specifically in the context of planning.

6. Conclusions

A robust and fast bidding strategy for participation of VPPs in the load-following ancillary service (LFAS) and energy markets in the WEM is proposed. To study the effectiveness of the proposed expert bidding strategy, a realistic VPP comprising 67 dwellings in WA is studied. The simulation results show that participation in both the LFAS and energy markets yields a better financial return, including payback period and internal rate of return (IRR). For example, the payback period of the VPP system is improved from 9 to 6 years, and the IRR from 10.5% to 18%, by participating in both the LFAS and energy markets. This improvement is achieved without compromising the useful lifetime of energy storage to a great extent over the period of the project. This is because the VRFB chosen for this VPP has a longer life and much higher energy throughput when compared to other battery technologies.
In this VPP, the customers are also participating in a demand management scheme by the VPP owner through a developed gamified approach. In this arrangement, the customers accept the command by the VPP through an enjoyable and socialised gaming platform while not compromising their comfort levels. All customers will benefit by participating in the VPP as their electricity costs are at least 10% lower than when not participating in the VPP.
The comparison of the proposed robust bidding strategy with a robust mathematical method shows the effectiveness of the proposed method. The accuracy of the proposed method is very high with a daily average error of 2.7%. However, the computational effort for the proposed method is much lower, i.e., 0.66 s, compared to 947.10 s for the mathematical methods.
Future work could include the trading among multiple VPPs in addition to the WEM. The centralised cooling and heating systems could potentially improve the efficiency of the system if designed carefully and can be used as a thermal energy storage when participating in the WEM. Therefore, this is suggested as future work for researchers who are interested in this domain. Soon, VPPs will be able to participate in multiple ancillary services, not only the LFAS market. Therefore, it is appropriate to develop a bidding strategy to integrate the bidding for the energy market with multiple ancillary services in the WEM. Another technology is the PV/thermal unit that generates PV while generating warm water or air. Such technologies are becoming available and can be used for increasing the temperature of water or air to be used in hot water or air conditioning systems. Evaluating the viability of PV/thermal hybrid units within a VPP is another subject for future research.

Author Contributions

Conceptualization, B.B., A.A. (Ali Arefi), A.G., A.A. (Ali Azizivahed) and P.J.; methodology, B.B., A.A. (Ali Azizivahed) and A.A. (Ali Arefi); validation, B.B. and A.A. (Ali Arefi); formal analysis, B.B., A.A. (Ali Azizivahed) and A.A. (Ali Arefi); investigation, B.B., A.A. (Ali Arefi), A.G. and P.J.; resources, B.B., A.G. and A.A. (Ali Arefi); data curation, B.B.; writing—original draft preparation, B.B. and A.A. (Ali Azizivahed); writing—review and editing, A.A. (Ali Arefi), A.G., P.J., S.M.M. and A.P.; visualization, B.B. and A.A. (Ali Arefi); supervision, P.J., S.M.M. and A.A. (Ali Arefi); project administration, P.J. and A.G.; funding acquisition, B.B., A.G. and P.J. All authors have read and agreed to the published version of the manuscript.

Funding

This research is supported by Yaran Property Group and the Australian Department of Jobs, Tourism, Science, and Innovation through the Science Industry PhD Fellowship Program with the reference number of J0571/202001.

Acknowledgments

The authors acknowledge the support from Yaran Property Group in providing the required data.

Conflicts of Interest

The authors declare no conflict of interest.

Glossary

Abbreviations
AEMO Australian Energy Market Operator
AGCAutomatic Generation Control
AUD Australian Dollar
CAPEX Capital expenditure
CRF Capital recovery factor
DoD Depth of discharge
DSS Dispatch support service
HWS Hot water system
IRR Internal rate of return
LFAS Load-following ancillary service
LRRAS Load rejection reserve ancillary service
NPV Net present value
PV Photovoltaic
SD Standard deviation
SOC State of charge
SRAS Spinning reserve ancillary service
SRS System restart service
TOU Time of use tariff
VPP Virtual power plant
VRFB Vanadium redox flow battery
WA Western Australia
WEM Wholesale electricity market
Variables
R t o t Total revenue of the VPP
C t o t Total expenses of the VPP
R F i x The fixed revenue
R V a r The variable revenue
E o u t y , h The amount of energy sold to the electricity energy market
E R E S d , h The amount of energy sold to customers
P L F A S , U P d , h The bidding power for the upwards LFAS market
P L F A S , D O W N d , h The bidding power for the downwards LFAS market
E P V d , h The amount of energy generated by the PV system
S O C V R F B m a x The maximum SOC of VRFB
E E n e r g y d , h The bidding amount in the energy market
π d , h The energy market price
τ R E S , E d , h The agreed energy price for selling to customers
ζ L F A S , U P d , h The   weighted   average   price   for   P L F A S , U P d , h
ζ L F A S , D O W N d , h The   weighted   average   price   for   P L F A S , D O W N d , h
y , d , h Year, Day, Hour

References

  1. Prime Minister’s Office. Australia’s Plan to Reach Our Net Zero Target by 2050; Prime Minister’s Office: Barton, Australia, 2021. [Google Scholar]
  2. Nallainathan, S.; Arefi, A.; Lund, C.; Mehrizi-Sani, A.; Stephens, D. Reliability Evaluation of Renewable-Rich Microgrids Using Monte Carlo Simulation Considering Resource and Equipment Availability. In Proceedings of the 2020 IEEE International Conference on Power Systems Technology (POWERCON), Bangalore, India, 14–16 September 2020; pp. 1–6. [Google Scholar]
  3. Bhuiyan, E.A.; Hossain, M.Z.; Muyeen, S.M.; Fahim, S.R.; Sarker, S.K.; Das, S.K. Towards next generation virtual power plant: Technology review and frameworks. Renew. Sustain. Energy Rev. 2021, 150, 111358. [Google Scholar] [CrossRef]
  4. Behi, B.; Baniasadi, A.; Arefi, A.; Gorjy, A.; Jennings, P.; Pivrikas, A. Cost–Benefit Analysis of a Virtual Power Plant Including Solar PV, Flow Battery, Heat Pump, and Demand Management: A Western Australian Case Study. Energies 2020, 13, 2614. [Google Scholar] [CrossRef]
  5. Abdullah, W.S.W.; Osman, M.; Kadir, M.Z.A.A.; Verayiah, R.; Aziz, N.F.A.; Rasheed, M.A. Techno-economics analysis of battery energy storage system (BESS) design for virtual power plant (VPP)–A case study in Malaysia. J. Energy Storage 2021, 38, 102568. [Google Scholar] [CrossRef]
  6. Wang, Y.; Gao, W.; Qian, F.; Li, Y. Evaluation of economic benefits of virtual power plant between demand and plant sides based on cooperative game theory. Energy Convers. Manag. 2021, 238, 114180. [Google Scholar] [CrossRef]
  7. Gong, H.; Jones, E.S.; Alden, R.E.; Frye, A.G.; Colliver, D.; Ionel, D.M. Virtual Power Plant Control for Large Residential Communities Using HVAC Systems for Energy Storage. IEEE Trans. Ind. Appl. 2022, 58, 622–633. [Google Scholar] [CrossRef]
  8. Rahimi, M.; Ardakani, F.J.; Olatujoye, O.; Ardakani, A.J. Two-stage interval scheduling of virtual power plant in day-ahead and real-time markets considering compressed air energy storage wind turbine. J. Energy Storage 2022, 45, 103599. [Google Scholar] [CrossRef]
  9. Liu, H.; Qiu, J.; Zhao, J. A data-driven scheduling model of virtual power plant using Wasserstein distributionally robust optimization. Int. J. Electr. Power Energy Syst. 2022, 137, 107801. [Google Scholar] [CrossRef]
  10. Srivastava, A.K.; Latif, A.; Shaoo, S.C.; Das, D.C.; Hussain, S.M.S.; Ustun, T.S. Analysis of GOA optimized two-stage controller for frequency regulation of grid integrated virtual power plant. Energy Reports 2022, 8, 493–500. [Google Scholar] [CrossRef]
  11. Wang, X.; Zhao, T.; Parisio, A. Frequency regulation and congestion management by Virtual Storage Plants. Sustain. Energy Grids Netw. 2022, 29, 100586. [Google Scholar] [CrossRef]
  12. Yan, Q.; Zhang, M.; Lin, H.; Li, W. Two-stage adjustable robust optimal dispatching model for multi-energy virtual power plant considering multiple uncertainties and carbon trading. J. Clean. Prod. 2022, 336, 130400. [Google Scholar] [CrossRef]
  13. Fang, F.; Yu, S.; Xin, X. Data-Driven-Based Stochastic Robust Optimization for a Virtual Power Plant With Multiple Uncertainties. IEEE Trans. Power Syst. 2022, 37, 456–466. [Google Scholar] [CrossRef]
  14. Chen, W.; Qiu, J.; Zhao, J.; Chai, Q.; Dong, Z.Y. Bargaining Game-Based Profit Allocation of Virtual Power Plant in Frequency Regulation Market Considering Battery Cycle Life. IEEE Trans. Smart Grid 2021, 12, 2913–2928. [Google Scholar] [CrossRef]
  15. Wholesale Electricity Market Rules; Government of Western Australia: Perth, WA, Australia, 2021.
  16. Wang, H.; Riaz, S.; Mancarella, P. Integrated techno-economic modeling; flexibility analysis, and business case assessment of an urban virtual power plant with multi-market co-optimization. Appl. Energy 2020, 259, 114142. [Google Scholar] [CrossRef]
  17. Liang, H.; Ma, J. Data-Driven Resource Planning for Virtual Power Plant Integrating Demand Response Customer Selection and Storage. IEEE Trans. Ind. Inform. 2022, 18, 1833–1844. [Google Scholar] [CrossRef]
  18. Wang, Y.; Ai, X.; Tan, Z.; Yan, L.; Liu, S. Interactive Dispatch Modes and Bidding Strategy of Multiple Virtual Power Plants Based on Demand Response and Game Theory. IEEE Trans. Smart Grid 2016, 7, 510–519. [Google Scholar] [CrossRef]
  19. Behi, B.; Arefi, A.; Jennings, P.; Pivrikas, A.; Gorjy, A.; Catalão, J.P.S. Consumer Engagement in Virtual Power Plants through Gamification. In Proceedings of the 2020 5th International Conference on Power and Renewable Energy (ICPRE), Shanghai, China, 12–14 September 2020; pp. 131–137. [Google Scholar]
  20. System Management. Ancillary Service Report for the WEM 2021. AEMO, Western Australia 2021. Available online: https://www.aemo.com.au/-/media/files/electricity/wem/data/system-management-reports/2021-ancillary-services-report.pdf?la=en (accessed on 1 June 2021).
  21. Behi, B.; Arefi, A.; Jennings, P.; Pivrikas, A.; Gorjy, A.; Ghosh, A. A Robust Bidding Strategy for VPPs Including Gamified Customer Engagement. In Proceedings of the 2021 31st Australasian Universities Power Engineering Conference (AUPEC), Virtual Conference, 26–30 September 2021; pp. 1–6. [Google Scholar]
  22. Western Power. 2019/20 Price List. Available online: https://westernpower.com.au/media/3361/price-list-2019-2020.pdf (accessed on 28 February 2019).
  23. INVINITY Energy Systems. INVINITY VS3-022: Six Pack Vanadium Flow Battery; INVINITY: West Lothian, UK, 2021. [Google Scholar]
  24. Moghaddam, S.Z.; Akbari, T. Network-constrained optimal bidding strategy of a plug-in electric vehicle aggregator: A stochastic/robust game theoretic approach. Energy 2018, 151, 478–489. [Google Scholar] [CrossRef]
  25. Behi, B.; Arefi, A.; Jennings, P.; Gorjy, A.; Pivrikas, A. Advanced Monitoring and Control System for Virtual Power Plants for Enabling Customer Engagement and Market Participation. Energies 2021, 14, 1113. [Google Scholar] [CrossRef]
  26. Azizivahed, A.; Razavi, S.E.; Arefi, A.; Lund, C. A Linear-based Model for Multi-Microgrid Energy Sharing- A Western Australia Case Study. In Proceedings of the 2021 31st Australasian Universities Power Engineering Conference (AUPEC), Virtual Conference, 26–30 September 2021; pp. 1–6. [Google Scholar]
Figure 1. An example of LFAS bidding and enablement over four trading intervals. Green: bidding power for upwards LFAS; Blue: bidding power for downwards LFAS; Brown: the enabled power by AGC. Numbers 1 to 4 are representing the trading intervals.
Energies 16 03054 g001
Figure 2. The flowchart for the bidding strategy in the LFAS and energy market.
Energies 16 03054 g002
Figure 3. The weighted daily average price for upwards and downwards LFAS in the WEM.
Energies 16 03054 g003
Figure 4. The average NPV values of total revenue, expense, and profit with different levels of enablement rate (%) for the LFAS market and without the LFAS market.
Energies 16 03054 g004
Figure 5. The payback periods and internal rates of return for different levels of enablement rate (%) for the LFAS market and without the LFAS market.
Energies 16 03054 g005
Figure 6. The energy throughput and useful lifetime of VRFB at different levels of enablement rate (%) for the LFAS market.
Energies 16 03054 g006
Figure 7. The cash flow for the VPP at different levels of enablement rate (%) when participating in LFAS and energy markets.
Energies 16 03054 g007
Figure 8. The total NPV of profit of the VPP project with and without gamification at different levels of enablement rate (%).
Energies 16 03054 g008
Figure 9. The payback period of the VPP project with and without gamification at different levels of enablement rate (%).
Energies 16 03054 g009
Figure 10. The components of the NPV of revenue with and without participation in LFAS market.
Energies 16 03054 g010
Figure 11. The components of the NPV of expense with and without participation in LFAS market.
Energies 16 03054 g011
Figure 12. The daily profit comparison between the proposed robust method and the mathematical robust method for participating in the energy market only.
Energies 16 03054 g012
Figure 13. The yearly revenue, expense, and profit comparison between the proposed robust method and the mathematical robust method for participating in the energy market only.
Energies 16 03054 g013
Table 1. The worst-case scenario for participation in LFAS and energy market.
PV GenerationElectricity PriceLFAS Price
The VPP is selling energy to the energy marketlowlow-----
The VPP is buying energy from the energy marketlowhigh-----
The VPP is participating in LFAS market----------low
Table 2. Input parameters for simulations.
ParametersValue
Uncertainty levels (%)PV generation10%
Electricity price10%
LFAS price20%
Gamification parametersElectricity reduction factor50%
Customer participation80%
VRFBEfficiency (%)85%
Maximum energy throughput13,000,000 kWh
Discount for customers10%
Interest rate5%
Horizon year (years)20
Table 3. Computational Time for 365 Runs.
The Proposed Robust MethodThe Robust Mathematical Method
0.66 s947.10 s
Disclaimer/Publisher’s Note: The statements, opinions and data contained in all publications are solely those of the individual author(s) and contributor(s) and not of MDPI and/or the editor(s). MDPI and/or the editor(s) disclaim responsibility for any injury to people or property resulting from any ideas, methods, instructions or products referred to in the content.

