Article

Numerical Investigation of Pressure Loss in a Rectangular Channel with a Sharp 180-Degree Turn: Influence of Design Variables and Geometric Shapes

1
Regional Leading Research Center, Changwon National University, Changwon 51140, Republic of Korea
2
Department of Mechanical Engineering, Changwon National University, Changwon 51140, Republic of Korea
*
Author to whom correspondence should be addressed.
Energies 2023, 16(7), 3050; https://doi.org/10.3390/en16073050
Submission received: 27 February 2023 / Revised: 20 March 2023 / Accepted: 24 March 2023 / Published: 27 March 2023

Abstract

:
Gas turbine blade cooling typically uses a cooling air passage with a sharp 180° turn in the midchord area of the airfoil. Its geometric shape and dimensions are strictly constrained within the airfoil to ensure both aerodynamic and cooling performance. These characteristics imply the importance of understanding the relationships between the geometric dimensions and the cooling channel performance. In this study, we validated a numerical method using the commercial software, Ansys Fluent 2021 R2, by predicting a total pressure loss coefficient with less than 6% deviation from the experimental results of Metzger et al. for four different Reynolds numbers. Through parameter studies, the divider tip-to-wall clearance was found to be the most significant parameter influencing the pressure loss. Parameter correlations and predictive models between the design variables and the pressure loss were derived by regression analysis using the R language; the regression model predicted the pressure loss to within 2.29% of the numerical method. As the geometries changed, the response surface and the adjoint solver improved the pressure loss by approximately 20.87% and 25.96%, respectively, at the representative Reynolds number of 24,230; this showed that the adjoint solver was a relatively simple and effective method with minimal geometric changes.

1. Introduction

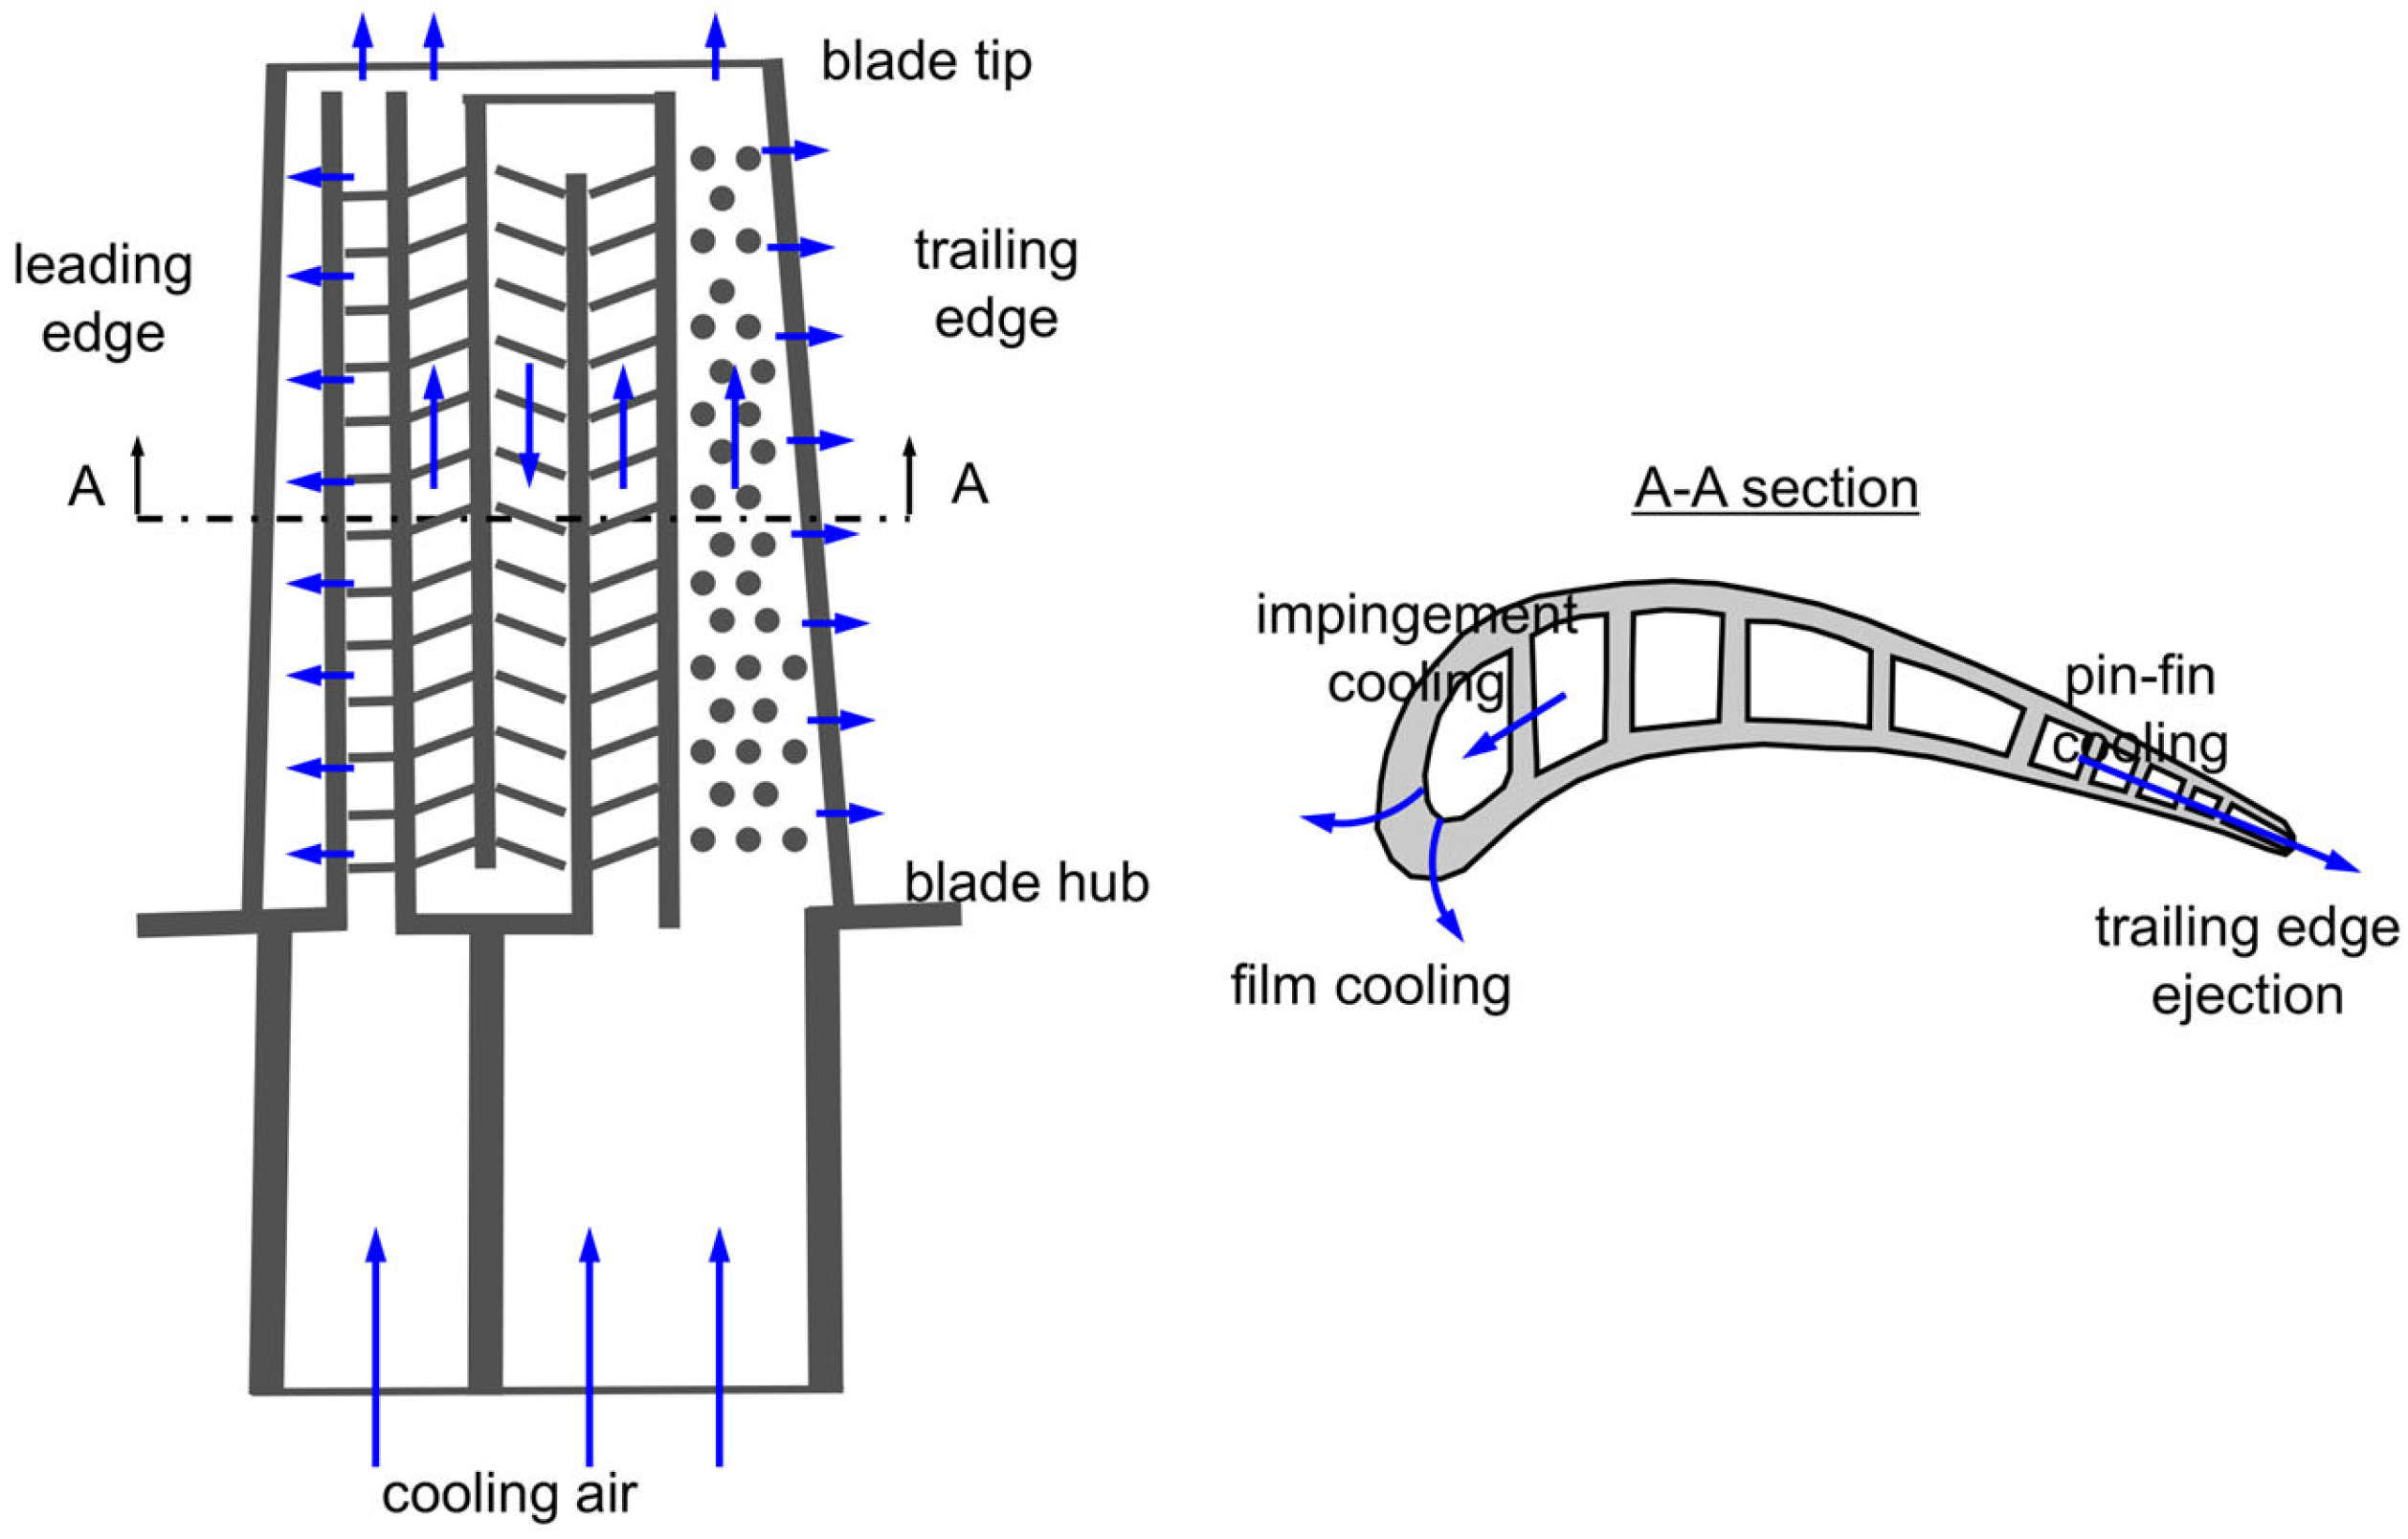
Improving the efficiency of gas turbines, which are widely used in power generation and transport, can reduce the amount of carbon dioxide emissions that accelerate global warming. Many researchers have focused on improving the efficiency by increasing the turbine inlet temperature, thereby using various cooling techniques to keep gas turbine blades below the allowable temperature of the blade materials. In general, gas turbine internal cooling systems draw compressed air from a compressor and deliver it to the blade interior via the hub section of the blade. The internal cooling passage consists of multiple straight channels in the spanwise direction of the turbine blade, and adjacent channels are inter-connected by a sharp 180° turn (Figure 1); this sharp turn causes complex flow phenomena such as flow separation, secondary vortices, and reattachment along the downstream passage [1]. Therefore, the importance of the internal cooling design of turbine blades is to minimize the pressure drop in the internal flow passage and to ensure a uniform temperature distribution over the lifetime of the components.
Many researchers have studied the flow and heat transfer (HT) characteristics for the convection cooling of turbine blades in a rectangular channel with a sharp 180° turn.
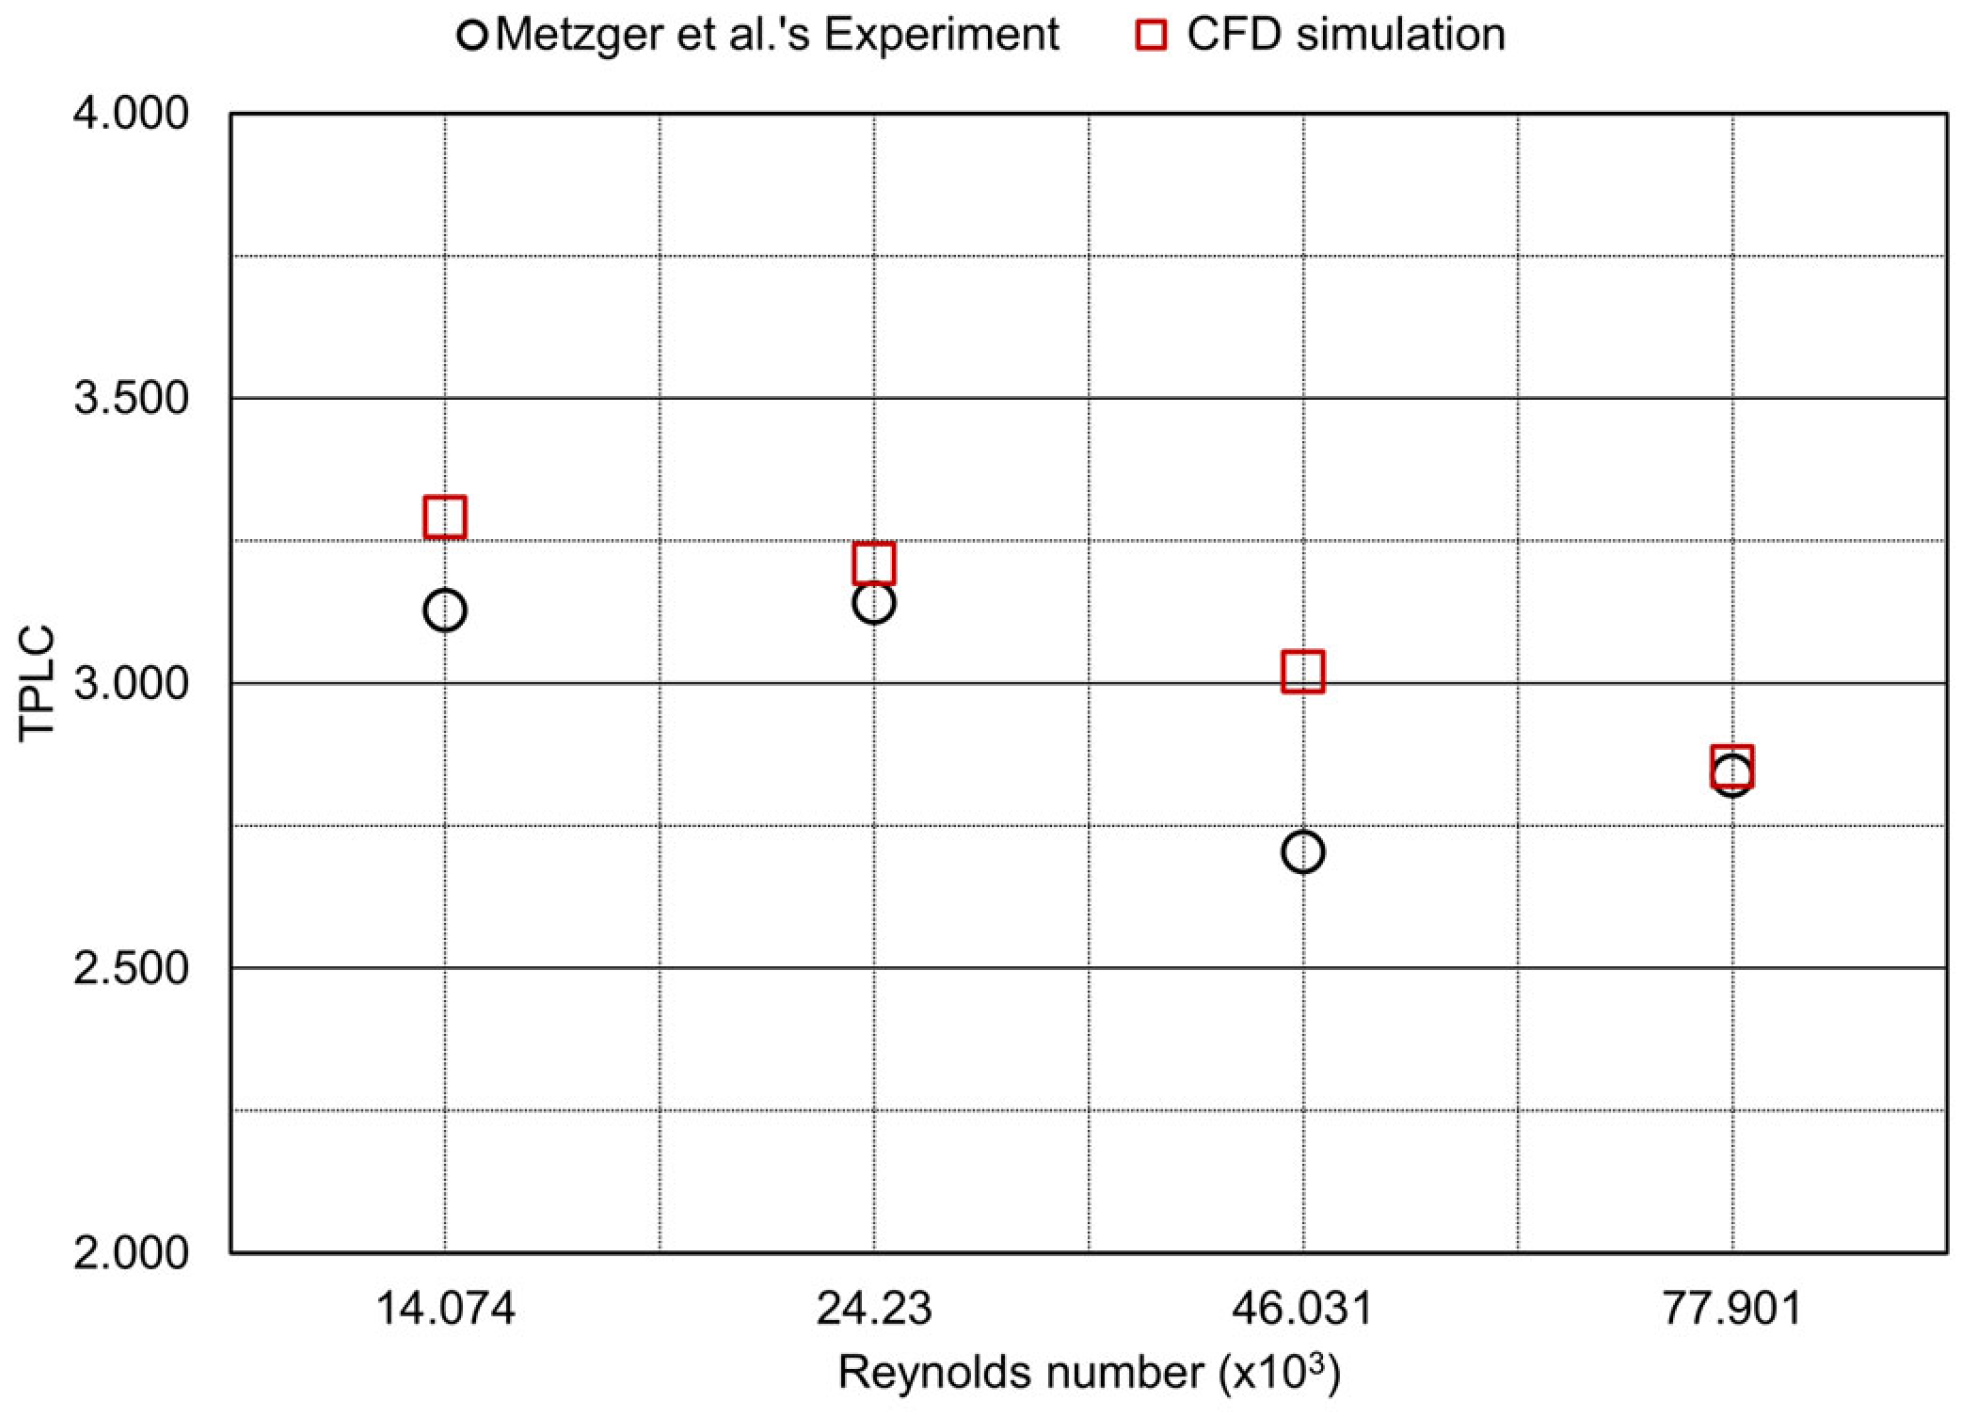
Merzger et al. [2] studied the effects of non-dimensionalized parameters of the channel geometry and Reynolds numbers that ranged from 5000 to 80,000; they showed the relevance of the channel width and the divider top-to-wall clearance of the turn region to the pressure drop, and, in a subsequent study [3], they showed the HT rates for sharp 180° turns based on nine geometries. Fan and Metzger [4] also measured Nusselt numbers within and around sharp 180° turns in a smooth rectangular channel for 27 geometry parameters, and they concluded that increasing the channel aspect ratio (AR) reduced the azimuthal HT and increased the channel HT. Hirota et al. [5] conducted experiments to clarify the local heat transfer in a rectangular channel with a sharp 180-degree turn, which showed that the local mass transfer rate was not uniform and varied significantly near the turn.
Ribbed channels have been studied to improve heat transfer. Han et al. [6] measured the detailed distributions of the local mass transfer coefficient around sharp 180° turns in a smooth and a rib-roughened channel; they showed that the mass transfer around the turn in the rib-roughened channel decreased with increasing rib spacing and increased with increasing rib height. Subsequently, Han et al. [7] studied the combined effects of rib turbulator geometry on the distributions of the local pressure drop for three-pass rectangular channels for a Reynolds number range from 15,000 to 60,000, and they showed that the pressure drop in the first pass was dominant, and the friction factor was correlated. Chandra and Han [8] also investigated the combined effects of a sharp 180° turn and rib configuration in a two-pass square channel with a pair of opposite ribbed walls at Reynolds numbers ranging from 15,000 to 60,000; they compared the HT improvements between the first and second passes with sharp 180° turna and obtained correlations for the friction factors and loss coefficients. Park et al. [9] studied the HT and friction factor for five short rectangular channels with two opposite ribbed walls and showed that the narrow aspect ratio channels had better HT than the wide aspect ratio channels. Mochizuki et al. [10] experimentally investigated the combined effects of a sharp 180° turn and rib patterns in a two-pass channel on the pressure drop performance and the local HT coefficient, thereby showing the interactions between the bend-induced secondary flow and the rib-induced secondary flow. And Zhao et al. [11] investigated the local pressure distribution in a relatively short two-pass smooth and ribbed channel.
Some studies have used the naphthalene mass transfer technique. Chyu [12] investigated the heat transfer distribution for two-pass and three-pass square passages and showed the non-uniform mass transfer coefficients around a sharp 180° turn due to flow separation, reattachment, and impingement, as well as significant pressure loss due to the sharp turns. Syuhada et al. [13] measured the local HT characteristics in rectangular ducts and showed the effect of the flow-inlet condition. Hirota et al. [14] studied the HT/mass transfer (MT) characteristics for turbulent flow in two-pass channels of 50 × 25 mm rectangular cross-sections with a sharp 180° turn under Reynolds numbers of 20,000–60,000; their results showed detailed maps of the local Sherwood number showing the complex and steep changes in the local HT/MT rates in and after the sharp turn, as well as close relationships with the turn clearance and Reynolds number. Subsequently, Hirota et al. [15] investigated the effect of an inclined divider in rectangular cross-sectioned two-pass channels and measured the local HT/MT rates at seven angles of inclination under the Reynolds numbers of 20,000–50,000; they concluded that increasing the turn clearance and inclining the divider wall towards the converging side enhanced HT performance.
Other experimental techniques have also been used to study the flow characteristics within rectangular channels with sharp 180° turns. Cardone and Astarita [16] provided a detailed visualization of the surface flow and convective HT near a sharp turn in a square channel. Schabacker et al. [17] used the particle image velocimetry technique to measure the flow characteristics in a two-pass internal coolant passage with a 45-degree rib arrangement. Additionally, Liou et al. [18,19] used a transient liquid crystal method to study the effect of the divider thickness on the local HT around the sharp turn of a two-pass square channel; they investigated the flow fields in a two-pass square channel with three-divider thicknesses using a non-intrusive laser Doppler velocimeter. Their results showed that the non-dimensionalized width among the geometric parameters affected the flow characteristics after the turn. Astaria and Cardone [20] used infrared thermography to study the HT in a sharp 180° turn channel with channel AR variations and Reynolds numbers varying from 16,000 to 60,000, and they evaluated the convective HT coefficient from the measured data. Nakayama et al. [21] measured the flow characteristics in stationary two-pass channels with a sharp 180° turn using a laser Doppler velocimeter; they focused on the influence of the size of the turn clearance on the flow structure and concluded that the normal wall velocity mainly dominated the HT in the channel, while the parallel wall component locally contributed to the HT after the turn.
The importance of channel geometry has also been investigated. Murata et al. [22] measured the local HT in a 180° turn channel and compared the effects on the pressure drop and heat transfer between a round turn and a sharp turn. Astaria et al. [23] measured the convective HT coefficient near a sharp turn in a rectangular two-pass channel with a square tip and a semi-circular tip, respectively. And Ekkad et al. [24] measured the HT for straight and tapered square channels with the turn region with and without rib turbulators; they showed that the acceleration effect was stronger for the tapered channel than the straight channel at a high Reynolds number, and the HT enhancement was similar for both channels with ribs. Rao and Prabhu [25,26] investigated the effect of several turn treatments, such as single and multiple guide vanes, on the pressure drop distribution in a square, cross-sectioned, rib-roughened channel with a sharp 180° bend for three Reynolds numbers (12,000, 14,250, and 16,500); their results showed that the properly shaped 180° extended guide vanes located at the center of the bend reduced the overall pressure drop by 14–20% compared to that with no guide vanes. The combined effects of the cross-sectional AR of the channel and the angle of inclination of the divider wall against the outer walls on the HT in sharp-turn channels of rectangular cross-sections was investigated by Cai et al. [27]; they showed that two-pass channels with a relatively low AR and a divider wall parallel or slightly inclined to the converging side improved the HT.
Numerical studies have been mainly carried out in the recent past. Wang and Chyu [28] used numerical simulations to study the effects of three turning configurations of a two-pass square duct with a sharp 180° turn; their results showed that the HT in the turning region was generally about 30% higher for the straight- and round-corner turns than for the circular turns; the regional average of the HT from the numerical method agreed well with that from their experiment. Jiang et al. [29] numerically investigated the flow field and heat transfer in a square duct with a sharp bend and showed the increase in pressure loss and heat transfer within the bend section. Walker and Zausner [30] studied RANS-based turbulence models on internal cooling passages and compared them with experimental data from the Von Karman Institute; they also performed calculations on a 180-degree bend and compared them with experimental data from Arizona State University. Shevchuk et al. [31] also validated their numerical results against experiments in an internally ribbed cooling channel with a 180-degree bend and showed good agreement. Schűler et al. [32] also investigated the influence of different turning vane configurations on the pressure loss and the local HT distribution for a ribbed rectangular two-pass channel connected by a sharp 180° turn with a channel height-to-width ratio of two. Their experiments showed that the pressure loss was reduced by about 25%, while the HT in the bend region remained almost the same with a suitable turning vane configuration; they performed numerical simulations using three turbulence models of realizable k-ε, k-w SST, and v2-f models. The realizable k-ε model had the closest pressure loss prediction to the experimental values from their numerical results. Amano et al. [33] also performed a numerical study on a rotating square duct with a low Reynolds nonlinear k-ω and k-ε Reynolds stress model, as well as large eddy simulation models.
From the above literature review, many studies have mainly focused on understanding the flow and HT characteristics through experimental and partly numerical methods; they have shown that flow characteristics such as separation, attachment, and secondary flow that occur during a sharp 180° turn within a rectangular channel increase the HT, but inevitable pressure losses also increase. In particular, stagnation in flow passages can lead to several negative effects, including increased pressure drop, heat transfer degradation, corrosion, and erosion; therefore, some researchers have attempted to reduce the pressure loss and stagnation region by using inclined divider ribs and guide vanes to control the flow characteristics in the turn region.
In general, the internal cooling of the turbine blade adopts these sharp turn structures in the midchord area, and the geometric shape and dimensions of the cooling passage must be constrained to fit into the airfoil of the turbine blade as shown in Figure 1. Therefore, despite many previous studies, the correlation and optimization studies between the geometric parameters of rectangular passages with a sharp 180° turn still need to be investigated to achieve optimal system performance and prevent damage; this study focuses on the study of reducing the pressure drop penalty of a sharp 180° turn channel using correlation analysis and geometry modification. Within the framework of these criteria, the flow phenomena with geometry changes are numerically analyzed, and the relationship between geometry design variables and pressure drop performance is investigated.

2. Geometrical Details and Mathematical Method

2.1. Model Description

The basic model used in this study is adapted from Metzger et al. [2]. Figure 2 shows the three-dimensional (3D) model of a sharp 180° turn in smooth rectangular channels with non-dimensional quantities (width = 1.0, height = 0.5, and depth = 0.2). The test model consists of an inlet section, a turn section with a divider tip-to-wall clearance, a divider, and an outlet section; the total width between the sidewalls is 0.0699 m and the divider width is 0.0064 m; the space at the divider attachment location adjusts the relative widths of the upstream and downstream channels. The non-dimensional quantities are defined as follows [2]:
D = D / W 1 + W 2 ,
H = H / W 1 + W 2
W = W 1 / W 2

2.2. Numerical Method

The governing equations comprise the continuity and momentum components in the computational domain as follows: [34]
Continuity equation:
x j ρ u j = 0 ,
Momentum equation:
x j ρ u j u i = p x j + τ i j x j + x j ( ρ u i u j ¯ ) ,
In this study, the working fluid was air, and the numerical calculations were performed under the following assumptions: (1) steady, (2) incompressible, and (3) constant fluid properties. The finite volume method was chosen to solve the governing equations using the second-order upwind and central difference scheme to discretize the convection and diffusion terms, while the semi-implicit method for the pressure-linked equation algorithm was used for the pressure–velocity coupling. Schuler et al. [32] proved that the realizable k-ε turbulence model with an enhanced wall function, a near-wall modelling method combining the two-layer model, is reliable for a ribbed rectangular two-pass internal cooling channel, so, we used this model.
The boundary conditions were velocity at the inlet, pressure at the outlet, and no-slip and smooth surface at the channel walls; calculations were performed using the commercial computational fluid dynamics (CFD) software, ANSYS Fluent, which solves the fully implicit conservation equations for a turbulent flow using the Reynolds-averaged Navier–Stokes approach. All solutions were considered converged when the residual was less than 10−5.
The hydraulic diameter at the inlet and the Reynolds number based on the hydraulic diameter of the channel is expressed as follows [2]:
D h = 2 W D / W + D ,
R e D h = ρ V D h / μ ,
To evaluate the flow characteristics of the channel flow, the total pressure loss coefficient (TPLC) is expressed as follows [2]:
K = 2 P / ρ V 2 ,
where ∆P represents the total pressure loss between the inlet and outlet [Pa], V denotes the inlet velocity [m/s], and the dynamic head in the denominator uses values at the inlet.

2.3. Grid Sensitivity

It is essential to perform a grid sensitivity analysis to obtain the reliability of the simulation. A hexahedral mesh was generated to reduce the computational cost and numerical diffusion by reducing the number of meshes and aligning the meshes with the flow direction (Figure 3), and the y+ remained at approximately 1.
Four sets of meshes were generated, and the relative deviations of the TPLC decreased as the number of nodes increased (Figure 4), so the second set of 1,597,866 nodes was chosen for efficient computation and to maintain a certain level of reliability.

2.4. Validation of Simulation

The reliability of the simulation must be verified to understand the flow characteristics within a sharp 180° turn in a rectangular channel. The simulation results were compared with the experiment of Metzger et al. [2] using the model described in Figure 2 for four Reynolds numbers (14,074, 24,230, 46,031, and 77,901). Figure 5 and Table 1 show the comparison of the TPLC; in most cases, the percentage difference was less than 6%, except for 11.7% at a Reynolds number of 46,031. We considered the simulation method to be reliable, as it was in good agreement with the experimental results.

3. Parameter and Optimization Study

A parameter study quantifies the effect of design variables on performance and supports decision making based on accurate information; this study investigated the relationship between design variables and performance.
ANSYS DesignXplorer, consisting of design of experiments (DOEs) and response surfaces, was used to explain the relationship between input and output parameters. The DOEs randomly generated 15 sampling points using the central composite design (CCD), which combines a central point, points along the axis of the input variables, and points defined by the fractional factorial design. The response surface provides an understanding of the variation in the output parameter with respect to the input parameters. The Kriging algorithm was used to improve the response quality and the response surface optimization using the screening method, which resulted in two candidate design points satisfying the optimization objectives through the above process [35].
For the parametric study, we selected three design variables—channel width (W2), divider width, and divider tip-to-wall clearance (H)—as the main factors affected by the limited space of an airfoil. The variables varied from −25% to +25% of the initial value (Table 2), and the inlet channel was left unchanged to maintain the same hydraulic diameter.
We also performed a regression analysis to correlate the design variables with the performance variable from the measured data and built a predictive model using R, a language and environment for statistical computing and graphics “https://www.r-project.org. (accessed on 9 January 2023)”.
The adjoint solver in ANSYS Fluent is an optimization tool for improving the performance of existing designs by changing the geometry [34]; it identifies the geometry to be changed and calculates the amount of deformation to achieve the design objectives. Since the optimization of a sharp turn channel involves design variables, the gradient-based method was used to find the optimal geometry with respect to the objective function of minimizing the pressure loss in this region (Figure 6).

4. Results and Discussion

4.1. Basic Study Results

Figure 7 shows, for a representative Reynolds number of 24,230, the velocity contours in the cross section at different heights; the left and right sides of the figure represent the upstream and downstream flows, respectively. In the upstream, as the flow approached the top of the divider, the velocity was highest near the right sidewall, and strong circulation occurred near the left edge in the tip-to-wall clearance region (y = 0.3159 m). In the downstream, the flow accelerated near the left sidewall in the direction of flow, so strong circulation and stagnation were observed near the right sidewall, thereby explaining the flow characteristics of a sharp turn. Widespread stagnation of the flow can cause high pressure drops in the passage; therefore, a change in geometry would be expected to have an effect on the pressure losses.
Figure 8 shows the velocity contour at the center of the x-coordinate. The velocity was at its minimum near the top of the divider and at its maximum near the 1/4 of the passage height, thereby explaining the effect of the sharp turn.
Figure 9 shows the velocity and pressure distribution along the center of the z-direction of the passage at a Reynolds number of 24,230. In the upstream channel, the flow velocity and pressure changed gradually along the flow direction, except near the end wall. Meanwhile, along the outer and inner walls of the downstream channel, the flow velocity increased and decreased sharply, thereby explaining the existence of a strong circulating flow in the inner wall of the channel (Figure 9a), and the pressure distribution reflected the effect of a sharp turn at the top of the divider (Figure 9b). Figure 10 shows the velocity and pressure distribution in the turning region of the tip-and-wall clearance. The corresponding velocity increased with the turning radius of the flow, which affected the pressure distribution; the maximum pressure drop was observed around 1100 Pa near the center line.

4.2. Results of Parameter and Optimization Studies

4.2.1. Response Surface

A total of 15 design points for each Reynolds number were generated by CCD, and the calculations were performed using ANSYS Fluent. Figure 11 shows the local sensitivity, which expresses the effect of the input parameters of the design variables on the output of the TPLC at four Reynolds numbers. Among the three design variables, the divider tip-to-wall clearance had the most significant effect on the TPLC; as the Reynolds number increased, the effect of the channel width decreased, and the divider tip-to-wall clearance increased, but the divider width remained almost at the same level.
To derive suitable design points using the response surface, the objective function was set to minimize the TPLC; a screening optimization based on a simple sampling and sorting was used to find the two most suitable candidate design points. Figure 12 shows the comparison of the TPLC at the design point and two candidate design points for four Reynolds numbers. The first candidate point gave a significant improvement in the pressure loss of around 20%, except for 18.4% at the Reynolds number of 14,074 when compared to the design point; the second candidate point also gave an improvement of around 15%, except for 12.5% at the Reynolds number of 14,074. These clearly explained that the improvement was reduced at a low Reynolds number. Therefore, these results showed that the geometry change using the response surface would contribute to the pressure loss improvement.
Table 3 compares the design variables between the design point and the two candidate points. As the length of the divider tip-to-wall clearance and the channel width increased, the TPLC decreased; the divider width varied over a wide range, and the contribution to the TPLC was less sensitive than others.

4.2.2. Regression Analysis

The correlation coefficient in a regression analysis indicates how closely the variables are related; the closer the correlation coefficient is to 1, the stronger the relationship. Figure 13 shows the strength of the correlation between the design variables and the output variable using the calculated data based on the DOEs for two Reynolds numbers; the TPLC was strongly negatively correlated with the tip-to-wall clearance in the two cases corresponding to two Reynolds numbers, and these trends were the same as those shown in Figure 11.
Table 4 summarizes the correlation coefficients of the variables for different Reynolds numbers. As the Reynolds number increased, the divider tip-to-wall clearance showed stronger relationships, the channel width decreased its correlation, and the divider width remained at the same level. This explained that the most dominant design variable on the output variable was the divider tip-to-wall clearance, regardless of the Reynolds number.
Regression analysis was used to model the numerical relationship between the input and output parameters in R. R-squared measures the proportion of the variability in the response variable that is explained by the regression model, and the closer the R-squared value is to 1, the better the model explains the data. Table 5 summarizes the results of the regression analysis for different Reynolds numbers. Each predictive model had more than 85% of the R-squared and less than 0.05 of the p-values, so these models were found to predict the data with good confidence.
The predictive regression model could be expressed using the design variables, coefficients, and intercept as follows:
T P L C = β 0 + β 1 × channel   width + β 2 × divider   width + β 3 × divider   tip - to - wall   clearance ,
To further improve the regression models, we included the interaction effects of the three design variables in the simple model, which improved the R-squared value. This revealed that our data had nonlinear correlations between the design variables. However, the more complex the interaction terms, the less predictive they were, so less related interaction terms with no significant codes in the analysis were excluded from the improved model. These interaction effects increased the number of coefficients compared to the simple models, so each coefficient and interaction term was added to the regression model. Table 6 compares the R-squared values of the regression analysis with and without the interaction terms for four Reynolds numbers; the inclusion of the interaction term significantly improved the R-squared values by approximately 15%, regardless of the Reynolds number.
Table 7 compares the TPLC prediction between the numerical method and the proposed regression models for the design point and two candidate points. The difference between the obtained CFD and the predictive model reached a maximum of approximately 10% for the model with no interaction terms and 2.4% for that with interaction terms. The regression model with interaction effects showed good predictive performance.
Table 8 shows the comparison of the TPLC prediction between the CFD and the predictive regression models, including the Reynolds numbers and design variables. The difference in the values obtained via the two methods was up to 11.32% without interaction terms and 2.29% with the terms, thus indicating that the regression models with interaction effects were reliable.

4.2.3. Adjoint Method

The adjoint method was used to investigate the effect of the geometry change on the TPLC. The observable value was defined as the total pressure loss between the inlet and outlet, and the morphing was implemented around the sharp turn region; the adjoint calculation for the Reynolds number of 24,230 estimated the TPLC to be 2.377, which was an improvement of 25.96% over the original model. Figure 14 shows the geometry modification using the adjoint solver.
Figure 15 shows the cross-sectional velocity distributions at different heights of the model reflecting the geometry change introduced by the adjoint method at a Reynolds number of 24,230. The geometric change of the divider sidewall at y = 0.295 m resulted in a maximum velocity near the wall, and, at y = 0.3159 m, the location of the maximum velocity was shifted to the center of the x-direction compared to Figure 7; the size of the downstream circulation region after the sharp turn was reduced. It is believed that the geometry change reduced the turning radius and reduced the pressure loss penalty.
Figure 16 shows the velocity contour at the center of the x-coordinate; when compared to Figure 8, the velocity was the lowest near both ends of the top of the divider, and the high velocity region moved closer to the top of the divider.
Figure 17 shows the velocity and pressure distribution along the channel; the maximum pressure drop was reduced by approximately 32% of 350 Pa, and the circulation area was also reduced compared to the original model.
Figure 18 shows the improvement in velocity and pressure distribution compared to the original model in the turning passage of the divider tip-to-wall clearance. These results show the improvement in flow characteristics due to the geometry modification by using the adjoint solver.
Figure 19 compares two geometry modifications for different Reynolds numbers of 24,230 and 77,901; as the Reynolds Number increased, the geometry modification was not significant. The improvement was approximately 11% for the Reynolds Number of 77,901, thus indicating that the geometry modification was more effective at the low Reynolds numbers.

5. Conclusions

In this study, the TPLC prediction in a sharp 180-degree turn with a rectangular channel, widely used in blade cooling system, was investigated using a numerical method. Then, the influence of input variables and geometry changes on the TPLC, data-based prediction models using R, and the effect of minimal geometry change on the TPLC were investigated. The conclusions are as follows:
  • The contribution of the channel geometry design variables to the TPLC at four Reynolds numbers was investigated by the response surface and regression analysis. The influence of the divider tip-to-wall clearance on TPLC prediction was the highest, and this influence increased with an increasing Reynolds number. Two candidate points satisfying the objective function of minimizing the total pressure drop were obtained from the response surface for each Reynolds number, with a maximum improvement in the TPLC of 20.87% at the best candidate point compared to the original model.
  • Regression analysis was used to derive predictive models consisting of design variables and Reynolds numbers based on the data set. The prediction based on the proposed model was improved using the interaction terms. The maximum difference between the predictive model with interaction terms and the CFD was 2.29%.
  • Using the adjoint solver, the TPLC was improved by approximately 26% and 11% when compared to the original model at the representative Reynolds numbers of 24,130 and 77,901 respectively; it was more effective at lower Reynolds numbers than higher Reynolds numbers. The adjoint solver showed more improvement in the TPLC with less computational cost and less geometric change when compared to the effect of the candidate points from the response surface.

Author Contributions

Conceptualization, B.K.; methodology, B.K. and S.K.; software, B.K.; validation, B.K.; formal analysis, B.K.; investigation, B.K.; resources, B.K.; data curation, B.K.; writing—original draft preparation, B.K.; writing—review and editing, B.K. and S.K.; visualization, B.K. and S.K.; supervision, B.K. and S.K.; project administration, B.K. and S.K.; funding acquisition, B.K. and S.K. All authors have read and agreed to the published version of the manuscript.

Funding

This research was supported by the National Research Foundation of Korea (NRF) grant funded by the Korean government (MSIT) through the Regional Leading Research Center [No. 2019R1A5A8083201] and by the Basic Science Research Program through the National Research Foundation of Korea (NRF) that was funded by the Ministry of Education [NRF-2022R1I1A1A01061582].

Data Availability Statement

No new data were created or analyzed in this study. Data sharing is not applicable to this article.

Conflicts of Interest

The authors declare no conflict of interest.

References

  1. Han, J.C.; Dutta, S.; Ekkad, S. Gas Turbine Heat Transfer and Cooling Technology, 2nd ed.; CRC Press: Boca Raton, FL, USA, 2013; p. 20. [Google Scholar]
  2. Metzger, D.E.; Plevich, C.W.; Fan, C.S. Pressure loss through sharp 180 deg turns in smooth rectangular channels. J. Eng. Gas Turbines Power 1984, 106, 677–681. [Google Scholar] [CrossRef]
  3. Metzger, D.E.; Sahm, M.K. Heat transfer around sharp 180-deg turns in smooth rectangular channels. J. Heat Transf. 1986, 108, 500–506. [Google Scholar] [CrossRef]
  4. Fan, C.S.; Metzger, D.E. Effects of Channel Aspect Ratio on Heat Transfer in Rectangular Passage Sharp 180-Deg Turns. In Proceedings of the 32nd International Gas Turbine Conference and Exhibition, Anaheim, CA, USA, 31 May–4 June 1987. [Google Scholar]
  5. Hirota, M.; Fujita, H.; Tanaka, A.; Araki, S.; Tanaka, T. Local heat (mass) transfer characteristics in rectangular ducts with a sharp 180-degree turn. Energy Convers. Manag. 1997, 38, 1155–1168. [Google Scholar] [CrossRef]
  6. Han, J.C.; Chandra, P.R.; Lau, S.C. Local heat/mass transfer distributions around sharp 180 deg turns in two-pass smooth and rib-roughened channels. J. Heat Transf. 1988, 110, 91–98. [Google Scholar] [CrossRef]
  7. Han, J.C.; Zhang, P. Pressure loss distribution in three-pass rectangular channels with rib turbulators. J. Turbomach. 1989, 111, 515–521. [Google Scholar] [CrossRef]
  8. Chandra, P.R.; Han, J.C. Pressure drop and mass transfer in two-pass ribbed channels. J. Thermophys. Heat Transf. 1989, 3, 315–320. [Google Scholar] [CrossRef]
  9. Park, J.S.; Han, J.C.; Huang, Y.; Ou, S.; Boyle, R.J. Heat transfer performance comparisons of five different rectangular channels with parallel angled ribs. Int. J. Heat Mass Transf. 1992, 35, 2891–2903. [Google Scholar] [CrossRef]
  10. Mochizuki, S.; Murata, A.; Fukunaga, M. Effects of rib arrangements on pressure drop and heat transfer in a rib-roughened channel with a sharp 180 deg turn. J. Turbomach. 1995, 119, 610–616. [Google Scholar] [CrossRef]
  11. Zhao, C.Y.; Tao, W. Pressure loss through sharp 180 deg turn in a relatively short two-pass smooth and rib-roughened channel. J. Therm. Sci. 1995, 4, 109–116. [Google Scholar] [CrossRef]
  12. Chyu, M.K. Regional heat transfer in two-pass and three-pass passages with 180-deg sharp turns. J. Heat Transf. 1991, 113, 63–70. [Google Scholar] [CrossRef]
  13. Syuhada, A.; Hirota, M.; Fujita, H.; Araki, S.; Yanagida, M.; Tanaka, T. Heat (mass) transfer in serpentine flow passage with rectangular cross-section. Energy Convers. Manag. 2001, 42, 1867–1885. [Google Scholar] [CrossRef]
  14. Hirota, M.; Fujita, H.; Syuhada, A.Z.; Araki, S.; Yoshida, T.; Tanaka, T. Heat/mass transfer characteristics in two-pass smooth channels with a sharp 180-deg turn. Int. J. Heat Mass Transf. 1999, 42, 3757–3770. [Google Scholar] [CrossRef]
  15. Hirota, M.; Fujita, H.; Cai, H.L.; Nakayama, H.; Yanagida, M.; Syafa’at, A. Heat (mass) transfer in rectangular cross-sectioned two-pass channels with an inclined divider wall. Int. J. Heat Mass Transf. 2002, 45, 1093–1107. [Google Scholar] [CrossRef]
  16. Cardone, G.; Astarita, T.; Carlomagno, G.M. Heat transfer in a 180 deg turn channel, Quant. InfraRed Thermogr. J. 1996, 123–128. Available online: https://www.qirt.org/archives/qirt1996/papers/020.pdf (accessed on 26 February 2023).
  17. Schabacker, J.; Boelcs, A.; Johnson, B.V. PIV Investigation of the Flow Characteristics in an Internal Coolant Passage With 45deg Rib Arrangement. In Proceedings of the International Gas Turbine and Aeroengine Congress and Exhibition, Indianapolis, IN, USA, 7–10 June 1999. [Google Scholar]
  18. Liou, T.M.; Chen, C.C.; Tzeng, Y.; Tsai, T. Non-intrusive measurements of near-wall fluid flow and surface heat transfer in a serpentine passage. Int. J. Heat Mass Transf. 2000, 43, 3233–3244. [Google Scholar] [CrossRef]
  19. Liou, T.-M.; Tzeng, Y.-Y.; Chen, C.-C. Fluid flow in a 180 deg sharp turning duct with different divider thicknesses. J. Turbomach. 1999, 121, 569–576. [Google Scholar] [CrossRef]
  20. Astarita, T.; Cardone, G. Thermofluidynamic analysis of the flow in a sharp 180° turn channel. Exp. Therm. Fluid Sci. 2000, 20, 188–200. [Google Scholar] [CrossRef]
  21. Nakayama, H.; Hirota, M.; Fujita, H.; Yamada, T.; Koide, Y. Fluid flow and heat transfer in two-pass smooth rectangular channels with different turn clearances. J. Turbomach. 2006, 128, 772–785. [Google Scholar] [CrossRef]
  22. Murata, A.; Mochizuki, S.; Fukunaga, M. Detailed Measurement of Local Heat Transfer in a Square-Cross-Section Duct with a Sharp 180-Deg Turn. In Proceedings of the International Heat Transfer Conference Digital Library, Brighton, UK, 14–18 August 1994; Begel House Inc.: Brighton, UK, 1994. [Google Scholar]
  23. Astarita, G.; Cardone, G.; Carlomagno, G.M. Heat Transfer and Surface Flow Visualization around a 180 Deg Turn in a Rectangular Channel. In Proceedings of the International Mechanical Engineering Congress and Exhibition, San Francisco, CA, USA, 12–17 November 1995. [Google Scholar]
  24. Ekkad, S.V.; Pamula, G.; Shantiniketanam, M. Detailed heat transfer measurements inside straight and tapered two-pass channels with rib turbulators. Exp. Therm. Fluid Sci. 2000, 22, 155–163. [Google Scholar] [CrossRef]
  25. Rao, D.V.; Prabhu, S.V. Effect of Guide Vanes on Pressure Drop in a Rib Roughened Square Channel with a Sharp Cornered 180 Deg Bend. In Proceedings of the 1st International Energy Conversion Engineering Conference (IECEC), Portsmouth, VA, USA, 17–21 August 2003. [Google Scholar]
  26. Rao, D.V.; Babu, C.; Prabhu, S.V. Effect of Turn Region Treatments on the Pressure Loss Distribution in a Smooth Square Channel with Sharp 180° Bend. Int. J. Rotating Mach. 2004, 10, 459–468. [Google Scholar] [CrossRef] [Green Version]
  27. Cai, L.; Ota, H.; Hirota, M.; Nakayama, H.; Fujita, H. Influence of channel aspect ratio on heat transfer characteristics in sharp-turn connected two-pass channels with inclined divider wall. Exp. Therm. Fluid Sci. 2004, 28, 513–523. [Google Scholar] [CrossRef]
  28. Wang, T.; Chyu, M.K. Heat convection in a 180-deg turning duct with different turn configurations. J. Thermophys. Heat Transf. 1994, 8, 595–601. [Google Scholar] [CrossRef]
  29. Jiang, Y.; Chen, C.P.; Chyu, M.K. A Numerical Computation of Convective Heat Transfer in Two-Pass Rectangular Ducts with a 180-Degree Sharp Turn. In Proceedings of the 28th Aerospace Sciences Meeting, Reno, NV, USA, 8–11 January 1990. [Google Scholar]
  30. Walker, D.; Zausner, J. RANS Evaluations of Internal Cooling Passage Geometries: Ribbed Passages and a 180 Degree Bend. In Proceedings of the Power for Land, Sea, and Air, Montreal, QU, Canada, 14–17 May 2007. [Google Scholar]
  31. Shevchuk, I.V.; Jenkins, S.C.; Weigand, B.; Wolfersdorf, J.V.; Neumann, S.O.; Schnieder, M. Validation and analysis of numerical results for a varying aspect ratio two-pass internal cooling channel. J. Heat Transf. 2011, 133, 051701. [Google Scholar] [CrossRef]
  32. Schűler, M.; Zehnder, F.; Weigand, B.; Wolfersdorf, J.V.; Neumann, S.O. The effect of turning vanes on pressure loss and heat transfer of a ribbed rectangular two-pass internal cooling channel. J. Turbomach. 2011, 133, 021017. [Google Scholar] [CrossRef]
  33. Amano, R.S.; Lucci, J.M.; Guntur, K.; Song, B. Numerical study of the thermal development in a rotating cooling passage. J. Heat Mass Transf. 2012, 48, 1011–1022. [Google Scholar] [CrossRef]
  34. ANSYS Fluent User’s Guide 2022R1; Southpointe 2600 Ansys Drive Canonsburg; ANSYS, Inc.: Canonsbur, PA, USA, 2022.
  35. ANSYS DesignXplorer User’s Guide 2022R1; Southpointe 2600 Ansys Drive Canonsburg; ANSYS, Inc.: Canonsbur, PA, USA, 2022.
Figure 1. Typical turbine blade internal cooling system.
Energies 16 03050 g001
Figure 2. 3D model of a sharp 180° turn in smooth rectangular channels.
Energies 16 03050 g002
Figure 3. A 3D hexahedral mesh using ANSYS meshing.
Energies 16 03050 g003
Figure 4. Comparison of the TPLC for different numbers of nodes.
Energies 16 03050 g004
Figure 5. Comparison of the TPLC for different Reynolds numbers [2].
Energies 16 03050 g005
Figure 6. Adjoint solver optimization workflow.
Energies 16 03050 g006
Figure 7. Velocity contour at different heights (Re = 24,230).
Energies 16 03050 g007
Figure 8. Velocity contour at the center of the x-direction (Re = 24,230).
Energies 16 03050 g008
Figure 9. Flow characteristics of the upstream and downstream channels (Re = 24,230): (a) velocity distribution; (b) pressure distribution.
Energies 16 03050 g009
Figure 10. Flow characteristics of the turning region (Re = 24,230).
Energies 16 03050 g010
Figure 11. Local sensitivity comparison of four Reynolds numbers.
Energies 16 03050 g011
Figure 12. Comparison of the TPLC between the design point and two candidate points for four Reynolds numbers.
Energies 16 03050 g012
Figure 13. Correlation plot of the data: (a) Re = 24,230; (b) Re = 77,901.
Energies 16 03050 g013
Figure 14. Geometric shape changes using the adjoint solver (Re = 24,230).
Energies 16 03050 g014
Figure 15. Velocity contour using the adjoint solver at different heights (Re = 24,230).
Energies 16 03050 g015
Figure 16. Velocity contour at the center of the x-coordinate using the adjoint solver (Re = 24,230).
Energies 16 03050 g016
Figure 17. Flow characteristics in the upstream and downstream channels by the adjoint solver (Re = 24,230): (a) velocity distribution; (b) pressure distribution.
Energies 16 03050 g017
Figure 18. Flow characteristics in the turning region by the adjoint solver (Re = 24,230).
Energies 16 03050 g018
Figure 19. Geometry modification using the adjoint solver: (a) Re = 24,230; (b) Re = 77,901.
Energies 16 03050 g019
Table 1. Comparison of % error between experimental and simulation results.
Reynolds NumberExperimentCFD% Error
14,0743.1283.2195.220
24,2303.1413.2102.194
46,0312.7043.02011.710
77,9012.8372.8540.574
Table 2. Range of design variables.
Design VariablesValues
LowerInitialUpper
Channel width (m)0.023810.031750.03969
Divider width (m)0.004550.006070.00759
Divider tip-to-wall clearance (m)0.023850.031800.03975
Table 3. Result of the response surface for two different Reynolds numbers.
Design VariablesDesign PointCandidate Point 1Candidate Point 2
Channel width (m)0.031750.039690.03969
Divider width (m)0.006070.007590.00455
Divider tip-to-wall clearance (m)0.031800.039750.03975
Table 4. Summary of the correlation coefficients.
Input ParametersReynolds Number
14,07424,23046,03177,901
Channel width−0.45−0.39−0.37−0.35
Divider width−0.23−0.23−0.22−0.23
Divider tip-to-wall clearance−0.78−0.81−0.82−0.83
Table 5. Summary of the regression analysis in R.
Coefficients forReynolds Number
14,07424,23046,03177,901
Intercept β 0 8.642238.296577.939117.65969
Channel width β 1 −0.04760−0.04116−0.03797−0.03508
Divider width β 2 −0.12993−0.12575−0.11837−0.11839
Divider tip-to-wall clearance β 3 −0.08305−0.08449−0.08387−0.08239
R-squared0.86260.8580.85810.8579
p-value4.82 × 10−55.75 × 10−55.74 × 10−55.79 × 10⁻⁵
Table 6. Comparison of the regression analysis (with and without interaction terms).
Reynolds NumberR-Squared% Difference
No Interaction TermsWith Interaction Terms
14,0740.86260.995115.36
24,2300.8580.990515.44
46,0310.85810.988115.15
77,9010.85790.986314.97
Table 7. Comparison of TPLC prediction between the numerical method and the regression model with design variables.
Design PointsNumerical MethodRegression Model
No Interaction TermsWith Interaction Terms
Design point3.2103.5393.229
Candidate point 12.5622.3502.562
Candidate point 22.7432.7322.677
Table 8. Comparison of TPLC prediction between the numerical method and the regression model with design variables at the design point and Reynolds numbers.
Reynolds NumberCFDRegression Model
No Interaction TermsWith Interaction Terms
14,0743.2913.6463.367
24,2303.2103.5693.231
46,0313.0203.4063.015
77,9012.8543.1662.886
Disclaimer/Publisher’s Note: The statements, opinions and data contained in all publications are solely those of the individual author(s) and contributor(s) and not of MDPI and/or the editor(s). MDPI and/or the editor(s) disclaim responsibility for any injury to people or property resulting from any ideas, methods, instructions or products referred to in the content.

