1. Introduction
The power system network grew significantly in recent years, owing to the ever-increasing demand of industrial and commercial consumers all around the globe. It is essential to maintain reliability, security, redundancy and safety in delivering power to consumers, and it has a massive impact on the economic aspects of society [
1]. One of the significant issues in the power system is the occurrence of congestion in transmission lines, which causes adverse implications in maintaining an acceptable level of system security and reliability. Power flow obstruction arises primarily due to improper network expansion, system abnormalities or heavy changes in the loading levels of the system [
2]. Abnormal conditions of the power system trigger line congestions and endanger the power flow above the thermal limits of the transmission lines. Some of such abnormal conditions include the unscheduled outage of transmission lines during operational malfunctions, lightning strikes or natural disasters due to unexpected weather events, scheduled outages during preventive maintenance or long-term shutdown maintenance of heavy equipment and the severe impact of low-frequency events [
3]. Another major cause of line congestion is the rise in power flow above its allowable range of thermal capacity of transmission lines as the utility generates and transmits more electricity to meet the increased load demand of the consumers.
Moreover, the consideration of economic factors motivates the utilities in deregulated systems to deliver more power for increased benefits, and it may lead to an overflow of energy in some transmission lines leading to congestion which is less likely to occur in the case of regulated systems. The literature survey revealed various impacts of transmission line congestion, such as excessive loading of the system components, failure to fulfil the demand of regional loads and the chance of short-term black-outs in the system. Congestion may also lead to an outage of transmission lines leading to interruption of power delivery to consumers, adversely affecting the reliability and security of the system. The customers may also be affected by economic burden due to line congestion, especially in deregulated scenarios, as they may be required to pay more bills in case of electric power utilization in congested regions of the power grid. This situation demands the formulation of effective congestion management strategies to overcome the adverse effects of line congestion in inter-connected transmission systems [
4,
5].
The credibility of the interconnected transmission system network can be improved when the power system specialist ensures congestion solutions in a fast, economical and efficient manner. One of the basic schemes is to optimize the scheduling of generators in the system such that the TSO controls power flow to reduce the congested lines, so that it does not exceed the thermal limits of the line. The literature survey revealed the adoption of various algorithms such as the Big Bang-Big Crunch (BB-BC) algorithm, the improved version of the particle swarm optimization (PSO) method in the form of hybrid BB-BC(HBB-BC) optimization algorithm, black-hole, meta-heuristic satin bowerbird, strength pareto evolutionary algorithm, artificial bee colony and multi-objective glow-worm swarm method and Harris hawks optimization algorithm for optimum rescheduling of generating stations for congestion relief in power system network [
6]. Previous researchers proposed different algorithms for solving congested lines by rescheduling generators at central stations. The need to introduce changes in generation at significant stations and curtailment of loads creates additional revenue loss and complexity in its realization at inter-connected transmission systems. The generation scheduling approach is less preferred for congestion relief due to economic considerations. Variations in generator power outputs may lead to a restructuring of financial aids among generating companies and consequent economic revenue loss.
Another scheme for congestion relief is the integration of flexible AC transmission (FACTS) devices such as static voltage controllers (SVC), thyristor controlled rectifiers (TCR), thyristor switched capacitors and thyristor controlled rectifiers (TSC-TCR) along with rescheduling of generators in the system [
7,
8,
9,
10,
11]. The FACTS devices provide the required reactive power to loads locally, which avoids energy extraction from central generators through distant lines up to a certain level, and it assists in alleviating the congestion of transmission lines in the system. However, this method exhibits certain demerits such as the requirement of expensive FACTS devices, limits in the capacity of FACTS device integration due to loading limits of the system and provision of complex control and switching strategies for FACTS devices, the requirement of continuous monitoring schemes of FACTS devices for its smooth and fast operation [
12]. The demand response (DR) technique for congestion relief controls power flow along congested lines by effectively controlling consumer load demand during congested periods. The DR technique ensures the customers’ involvement in congestion relief of the system by rescheduling their consumption period from peak hours to off-peak hours, which helps the utility to adjust their load pattern by cutting the peak and filling the valley scenario to manage the congestion issue [
13]. However, the overall power market and increase in system complexity introduce significant difficulty in the practical realization of the DR technique due to the requirement of advanced forecasting technology, communication methods, load monitoring methods and demand control strategies for congestion relief. Previous researchers investigated energy storage technologies and their benefits to enhance the transmission aspects of capabilities of congested transmission networks. Still, the battery storage used to alleviate thermal constraints has not yet been thoroughly ensured [
14].
The demerits of generation scheduling technique, FACTS device integration methods, DR technique and energy storage technologies motivated the authors of this study to investigate the scope of another major scheme which utilized different DG methodologies such as renewable generation (solar and wind) and the use of alternative methods such as gas operated turbines, IC engines and diesel engines, which can also be adapted for congestion management [
15,
16]. Renewable distributed generation is a dependable scheme for alleviating congested transmission lines due to its economic and technical benefits. Various system constraints such as line loss reduction, voltage profile and resilience were addressed and analyzed for better performance [
17]. The optimal siting and sizing of DG units supported the system to reduce power loss and improve voltage profile and voltage stability fluctuation. Its outcome was illustrated profoundly in the reference [
18]. This work conducted voltage performance analysis for high-penetration photovoltaic distribution systems, providing results for improving the system performance [
19]. Improvement in power system resiliency was analyzed with optimal location and placing multiple DGs for evaluating the system’s performance [
20]. Congestion alleviation methodologies for steel mill power systems by distributed generation and DG allocation techniques in primary Distribution networks were analyzed and illustrated in depth in the reference [
21,
22].
The DG sources installed at the load buses will deliver the required active power to the loads in the system, reducing energy extraction from central generators through transmission lines over the long corridor. This scheme gives an insight into realizing effective strategies for alleviating congestion in transmission lines by DG penetration in the power grid. The DG integration scheme offers merits such as flexibility to supply the required power to loads with minimum cost and non-requirement of change in the scheduling of central generators locally [
23]. The DG integration technology may not instruct the additional support of FACTS device integration or load-shedding scenarios as a solution for congested transmission lines. Researchers considered DGs an effective tool for congestion alleviation, meeting power loss minimization and operational objectives of system availability enhancement.
The outage of any one of the transmission lines may trigger other interconnected lines into a stage of overloading. Thus, installing DGs as a solution for congested lines should consider the level of overloading at each line, as the congestion severity relies primarily on the extent and area of the line outage and the system conditions. Integrating DG into the bus will change system parameters, such as values of active and reactive power flows along lines, power loss at lines, bus voltages and currents. The effectiveness of this method relies on the optimum placement of DG units with sufficient power injection capability at an optimal point in the congested system by considering the changes in the power flow, which will ensure the injection of the required amount of power for congestion relief in the system. Thus, it is essential to consider the changes in all the system parameters after the line outage concerning the normal system parameters just before the integration of DGs into the system for congestion relief.
Developing methods for adequate sizing and siting of DGs for congestion relief requires estimating various parameters in the power system network. Such parameters include active and reactive power flows at each line, the magnitude of current at each bar, active and reactive power losses at each line and voltage magnitudes at buses during typical and outage cases with post- and pre-penetration of DGs in the system. Various techniques to determine the capacity and location of DGs integration into the system for effectively alleviating congestion in transmission lines by maintaining different system parameters within their allowable limits were proposed by previous researchers [
23,
24,
25]. The previous studies broadly categorized the methods adopted for optimal allocation of DGs for congestion relief as analytical, optimization techniques, heuristic approaches and various miscellaneous techniques such as the clustering approach, the Monte-Carlo simulation, simulated annealing algorithm and the cuckoo search algorithm [
26,
27,
28,
29,
30].
Heuristic methods include genetic algorithms (GA), ant colony optimization, simulated annealing, tabu search (TS), particle swarm optimization, the artificial bee colony algorithm, the shuffled bat algorithm, GA with point estimate method, modified simulated annealing and harmony search with the differential operator. Population-based heuristic methods were widely adapted in operational and planning studies because they efficiently handled multiple constraint criteria. The researcher detailed the use of heuristic methods for optimal siting and sizing of DGs in radial distribution networks [
31,
32]. The complexity in nature and ample time for computations are some of the demerits of the heuristics approach for optimization. The difficulties employed in heuristic and optimization algorithms motivated the authors to investigate the scope of application of the multi-index-based simulation technique of the load flow estimation approach. This strategy will allow for the evolution of a feasible scheme for the best placing and quantifying of DGs in interconnected transmission systems. The literature survey revealed that the analytical methods used mathematical models of the system to obtain the optimum solution for DG allocation. Primary analytical procedures described in the literature for optimal allocation of DGs in a system have several bases, such as several eigenvalue evaluations, modal analysis, index, sensitivity-based and point estimation methods. Analytical methods face challenges in their application for large and complex power system networks due to the difficulty in obtaining mathematical functions for finding optimal location and capacity. However, the load flow calculation methods such as the Gauss–Seidel method and Newton–Raphson method are reliable mathematical methods to determine the power flows and voltage profiles at each area in a power system network.
As long as the power system planning considers operating the system under the N-1 criterion, the power grid shall be capable of facing an outage of a single transmission line, cable, transformer or generator without causing power interruption to any feeding area of the transmission system operator (TSO). The basic principle of N-1 security in network planning states that network security shall be ensured if a component, such as a transmission line, transformer or generator failure, occurs in a network operating at the maximum energy forecast levels if the system is designed to work under the N-1 criterion. In that case, these criteria will help to ensure system security, reliability, redundancy and safety throughout the system from downstream to upstream. N-1 criterion is the rule according to which the elements remaining in operation within a transmission system operator (TSO)’s control area after the occurrence of a contingency is capable of accommodating the new operational situation without violating operating security limits of the network.
The power system requires only N-1 lines or equipment to deliver the allocated power to all end users satisfactorily during normal system conditions. If one of the lines or equipment fails in the system at any time, the line or equipment will ensure system security, reliability, redundancy and safety throughout the system from downstream to upstream under the N-1 criterion.
This additional installation of one component is essential in generation expansion plan, transmission expansion plan and distribution expansion plan to operate the system under N-1 scenario. Renewable energy sources are available from kW to several thousands of MW, and renewable energy sources can be penetrated in any level of voltage of the system from downstream to upstream. Due to the power quality issues created beyond the allowable range of parameters, such as voltage fluctuation, power factor variation, voltage stability, VAR compensation issues and frequency fluctuations, DGs cannot be considered a permanent remedial measure for N-1 contingency. However, the combined use of system indices, the fast power flow solutions and the investigated scheme’s reliability will motivate the power system specialists to handle this methodology to a certain extent with loss minimization criterion. Renewable energy sources are widely used as distributed generation worldwide to a large extent. Several countries have substantial solar power plants with a capacity of 2200 MW or above extended across several thousands of acres of land in the deserts. Thus, the tremendous growth of renewable energy sources such as solar and wind energy systems triggered present power system policies and scenarios to a profound level of changes all over the globe.
This study proposes to formulate e the system indices allied load flow-based algorithm to obtain the finest solution without any delay in achieving appropriate convergence availing the benefits of a mathematical approach. This work presented a load flow analysis-based method for congestion relief in a 14-bus system of IEEE. The objective of the analysis was to recognize the extremity of interruptions of transmission lines in the power system network. The work also attempted to identify the most critical cases of supply interruptions by analyzing load flow results. The research focused on identifying potential parameters to arrive at the best capacity and bus for DG integration for the solution of congested lines in the system as part of congestion management. This work analyzed power flows in the developed 14-bus IEEE system during line outage events by injecting DG sources of different capacities at several locations. This will help to recognize suitable parameters to propose a reliable scheme to find feasible buses and the capacity of DG to integrate into the system for congestion relief. The analysis focused on selecting the best case of DG penetration, which resulted in a maximum reduction in system loss. This work recognized two system indices to formulate a methodology to best place and quantify the DGs of an interconnected transmission system. This work investigated the applicability of these indices for optimum siting and sizing of distributed generation to inject into the system for congestion relief. As a case study, the research successfully tested the part of the practical system of the supply entity of the state of Kerala, India, using the developed algorithm.
2. Formulation of the Mathematical Problems
Outages of transmission and distribution lines are a critical source of congestion in a power system network, and more investigations on the same are necessary to ensure the feasible and steady operation of the network. Congestion occurs mainly due to the interruptions of feeders and transformers in the power system network. The impact of outages shall be recognized based on the percentage increase in power flow along the lines and are dependent on the area of the line outage and the transmission network configurations. A detailed study of the 14-bus system of the IEEE environment during the interruption of lines at various branches of the system must be conducted to understand the most severe case of line outage, which results in the most congested system conditions in the network. This study is also essential to identify the power flows along the lines for each case of line interruption in the system. As discussed in the previous literature studies, DG penetration is widely recognized as the most feasible scheme for alleviating congestion in the power system network with the following constraints.
where
Vi(
u) is the voltage at bus
i;
u is the set of control variables;
Vi,min and
Vi,max are, respectively, the minimum and maximum allowable voltages at bus
i; and
Bs is the set of all buses.
Since the power flows through those feeder lines and tie switches cannot exceed their corresponding installation capacities, these limitations can be generally expressed as
where
Pl(
u) and
Pl,max are, respectively, the power flow and the maximum allowable power of line l and L
s is the set of all transmission lines.
In addition to the operational bus voltage and line power flow constraints, the power that can be transferred by the individual tie switch is limited by the available transfer capability (ATC) as
where
ATCl is the remained transfer capability in line l for further activity in addition to those already committed, and
where
is the maximum power flow without causing thermal overloads, voltage constraints, or any other system security problem at line l, whereas
is the reserved capability at line l comprising possible uncertainties due to system operational condition changes and contingencies.
When we analyzed the optimal power flow (OPF) scenario, several control variables were incorporated, such as generator voltage, transformer tap position, switched capacitor settings, reactive injection for a static VAR compensator, load shedding and decoupled line flow. The OPF is a very lengthy and very tough mathematical programming problem. The OPF equations can be expressed in terms of a vector of state variables x, vector of control variable u, and vector of fixed parameters p. The associated OPF equations using various methods were obtained as detailed below [
33,
34].
where
is the apparent power flow along the line connecting bus
i and bus
j with line nm out
where
,
,
are the total power generated by the generators, total load connected to the system and total system loss, respectively.
where
is the maximum power flow without causing thermal overloads, voltage constraints or any other system security.
where
is the maximum power flow without causing thermal overload
where each
P represents the generator power, load and loss in MW.
As reported in the literature, the congestion issues shall be alleviated, and other problems which occur during line congestion, such as an increase in power loss, and reduced reliability in system performance, shall also be rectified by integrating DGs. In addition, the advantages of achieving stability and bus voltage reliability of the system shall be fulfilled. Furthermore, the research studies are essential to propose a reliable scheme to determine the optimal size and capacity of the DG, which is to penetrate the system to reduce power loss in an extensive power system network. This demands the estimation and analysis of power flows during line outages and the integration of DGs into the system during outage cases. An intense study of power flows and associated index parameters of the system during the integration of DG’s various capacities is a necessary task in the formulation of a suitable scheme for finding the feasible location ad capacity of DG to be integrated into the system during the outage of a line in the system for congestion relief.
The application of two parameters, namely the Index of Severity (SI) and distributed generation sensitivity factor (SF), is described in this paper for estimating the range of congested lines and finding the best DG placement in the system for alleviating the congestion during the case of a line outage in the system. The definition of the proposed index parameters is described below.
- (a)
Severity Index and Percentage violation of loading
The severity index estimated using active power flow along transmission lines used to find out the worst outage case and to alleviate the congestion in transmission lines were described in [
33,
34]. In this paper, the parameter known as the severity index (SI), estimated using apparent power, is proposed to identify the severity of line outages in the system. It is a dimensionless parameter and is given by,
where the SI severity index will provide the extent of the outage affecting the power system. SI will be small if all flows are within the limit and large if one or more lines are overloaded. The best value for n is identified as 1 or 5 to obtain sufficient information in the solution at the end of the first iteration of the decoupled power flow to obtain favourable SI [
34,
35].
Percentage violation of loading is calculated as given in (11).
where
THL is the thermal limit and
PRL is the present load in the transmission line.
As long as the voltage is incorporated in the SI, the equation will be interpreted as a severity index estimated using apparent power flow along transmission lines, which is used to find out the worst outage case and alleviate the congestion in transmission lines given by (12).
- (b)
Sensitivity Factor
Here, the sensitivity factor is estimated between line l and generator bus i when line
k is an outage.
the difference between the voltage magnitude as solved at outage and base case voltage magnitude. When addressing the bus phase angles
for the obtained set of changes in the bus power injections,
the following mathematical equations will come into the picture using
a,
d and
factors to model the power system in its post-outage state.
where the bus phase angle change
for the obtained set of changes in the bus power injections,
where
is the compensated generation shift sensitivity factor
where
is the compensated generation shift sensitivity factor.
The linear sensitivity factor can be expressed as partial derivatives, as in Equation (22). It demonstrates the flow’s (MVA) sensitivity on lines i to j concerning the power generated at bus k.
where LSF is the linear sensitivity factor. The injection of DGs into the system alters the power flow at each line in the network. The above mathematical equations support the finalization of an index known as distributed generation sensitivity factor (SF), which considered the relative change in apparent power flow along lines concerning the capacity of penetrated DGs and is defined as given in (18). The SF is obtained from the congested lines by power flow change in a transmission line ‘l’, which connects the buses
n and m. In this equation, the apparent flow of power is considered for the estimation of the DG sensitivity factor
considering the influence of reactive power flow.
where
is the change in line flow between node
n and
m, and
δPi is the change in actual power injection at
nth the node by the DG.
3. Optimal Location of DGs for the Solution of Congested Lines
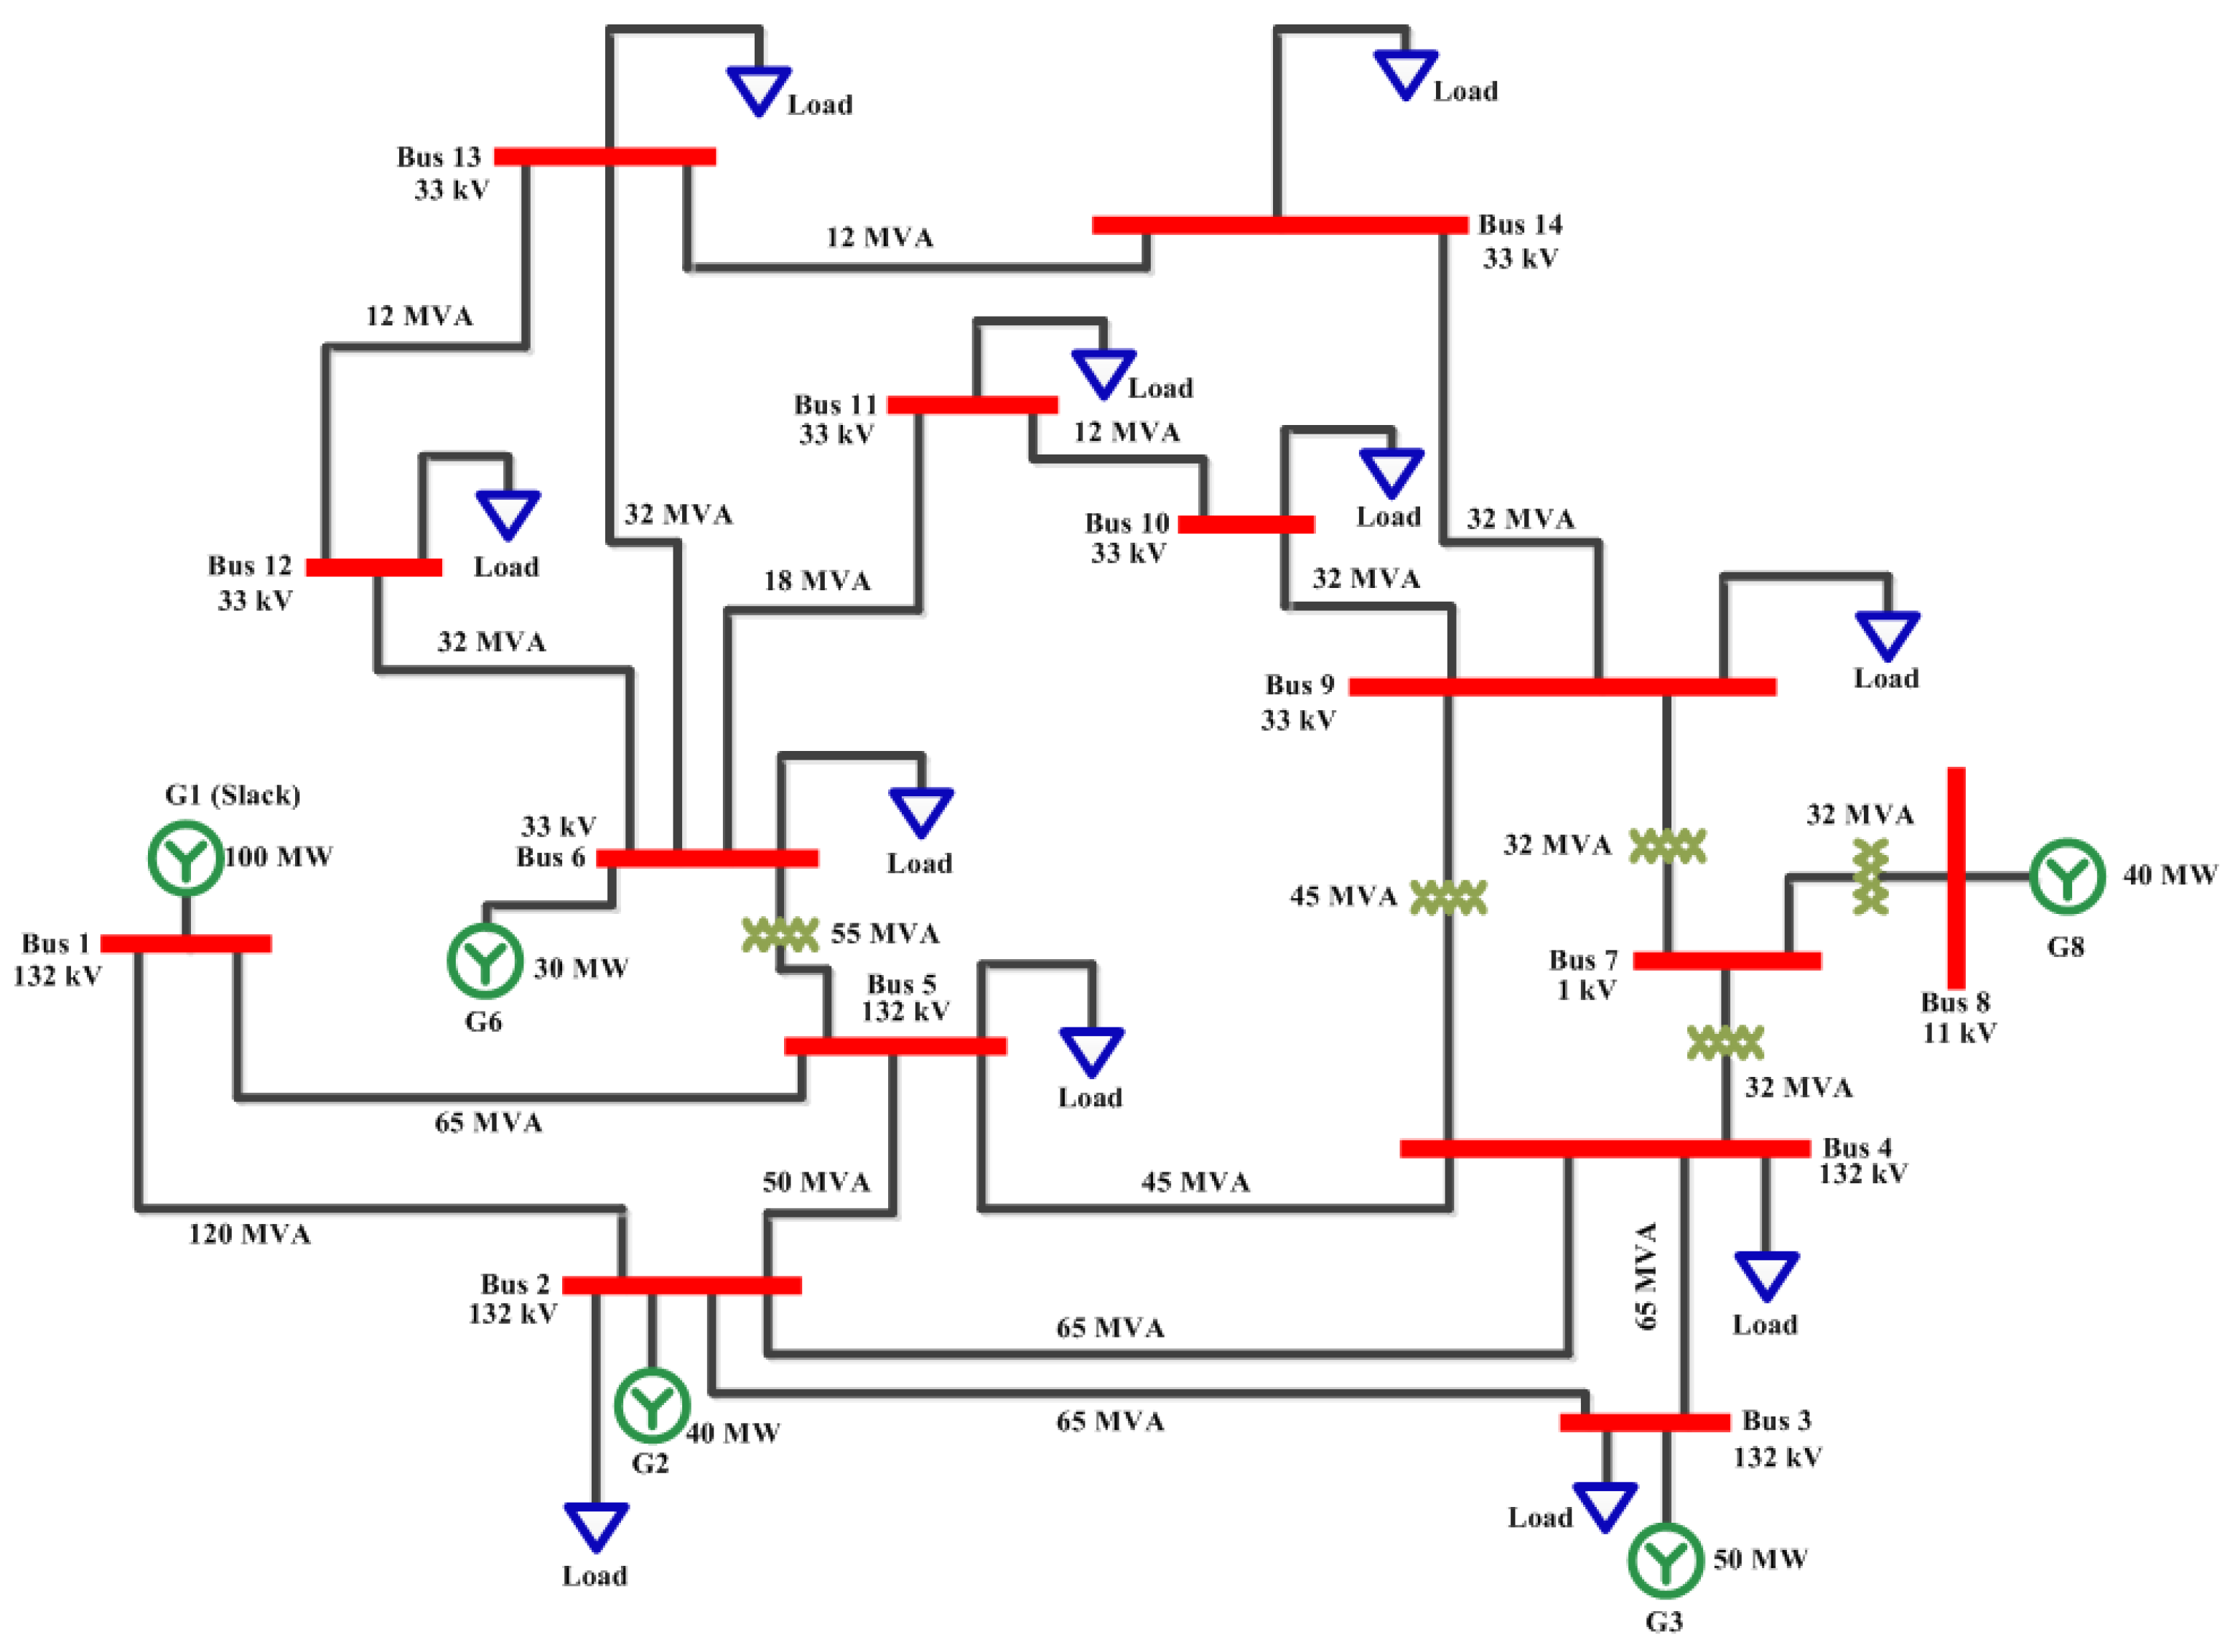
The introduction of DGs with any bus in the power system alters the power flow values along different lines in the system, which may help reduce the power losses along the lines. As a result, the system performance is improved, and the congestion present in the pipes is alleviated. The extent of congestion varies from case to case of line outage, and the optimum DG size and location to ease congestion for each outage case are different. The development of a feasible approach to estimate the extent of each outage case is essential. This case was considered in the analysis to develop a scheme to find the most viable site for DG penetration to alleviate the congestion in transmission lines. A quantitative analysis of the system by conducting load flow analysis for various cases of line interruptions in the power system was carried out in a modified IEEE 14-bus test system to develop feasible schemes to recognize the most severe outage case. The single-line diagram of the modified IEEE 14-bus system is shown in
Figure 1. The IEEE 14-bus system consists of fourteen buses (shown in the red thin bar), five generators (shown in green star connection inserted circle), eleven loads(shown in blue arrow), sixteen lines (shown in black line) and five transformers (shown in parrot green winding).
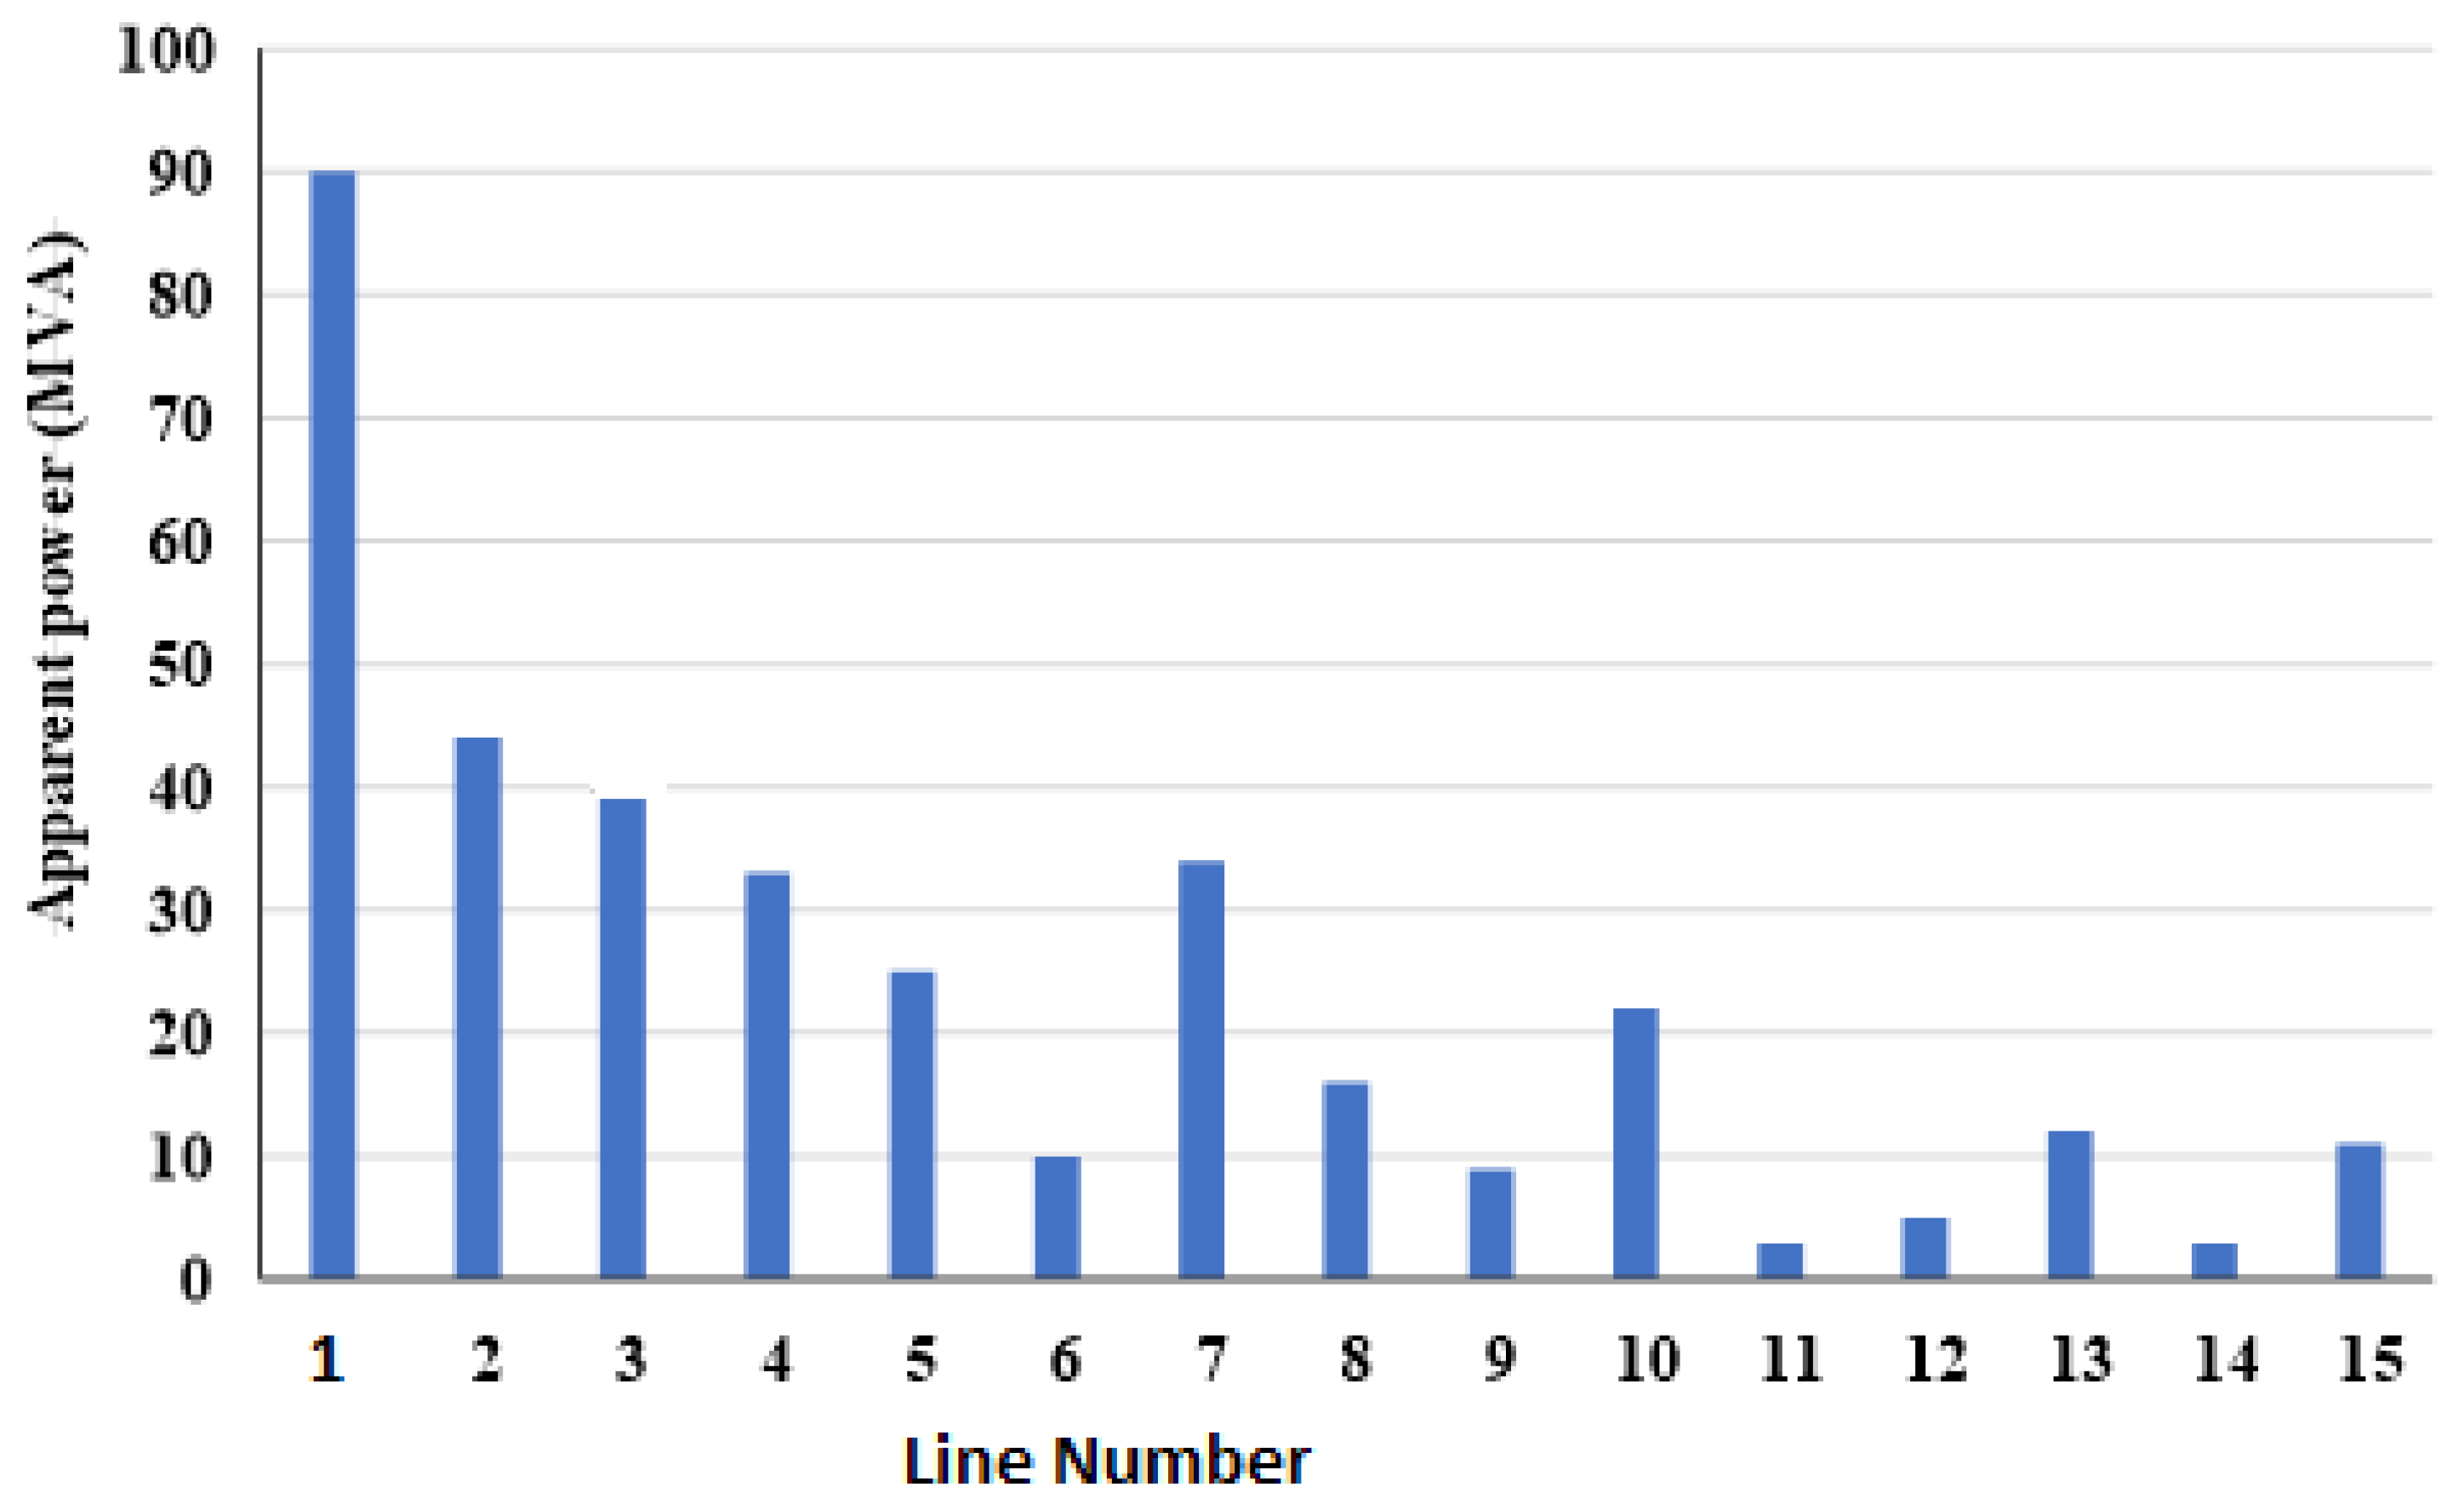
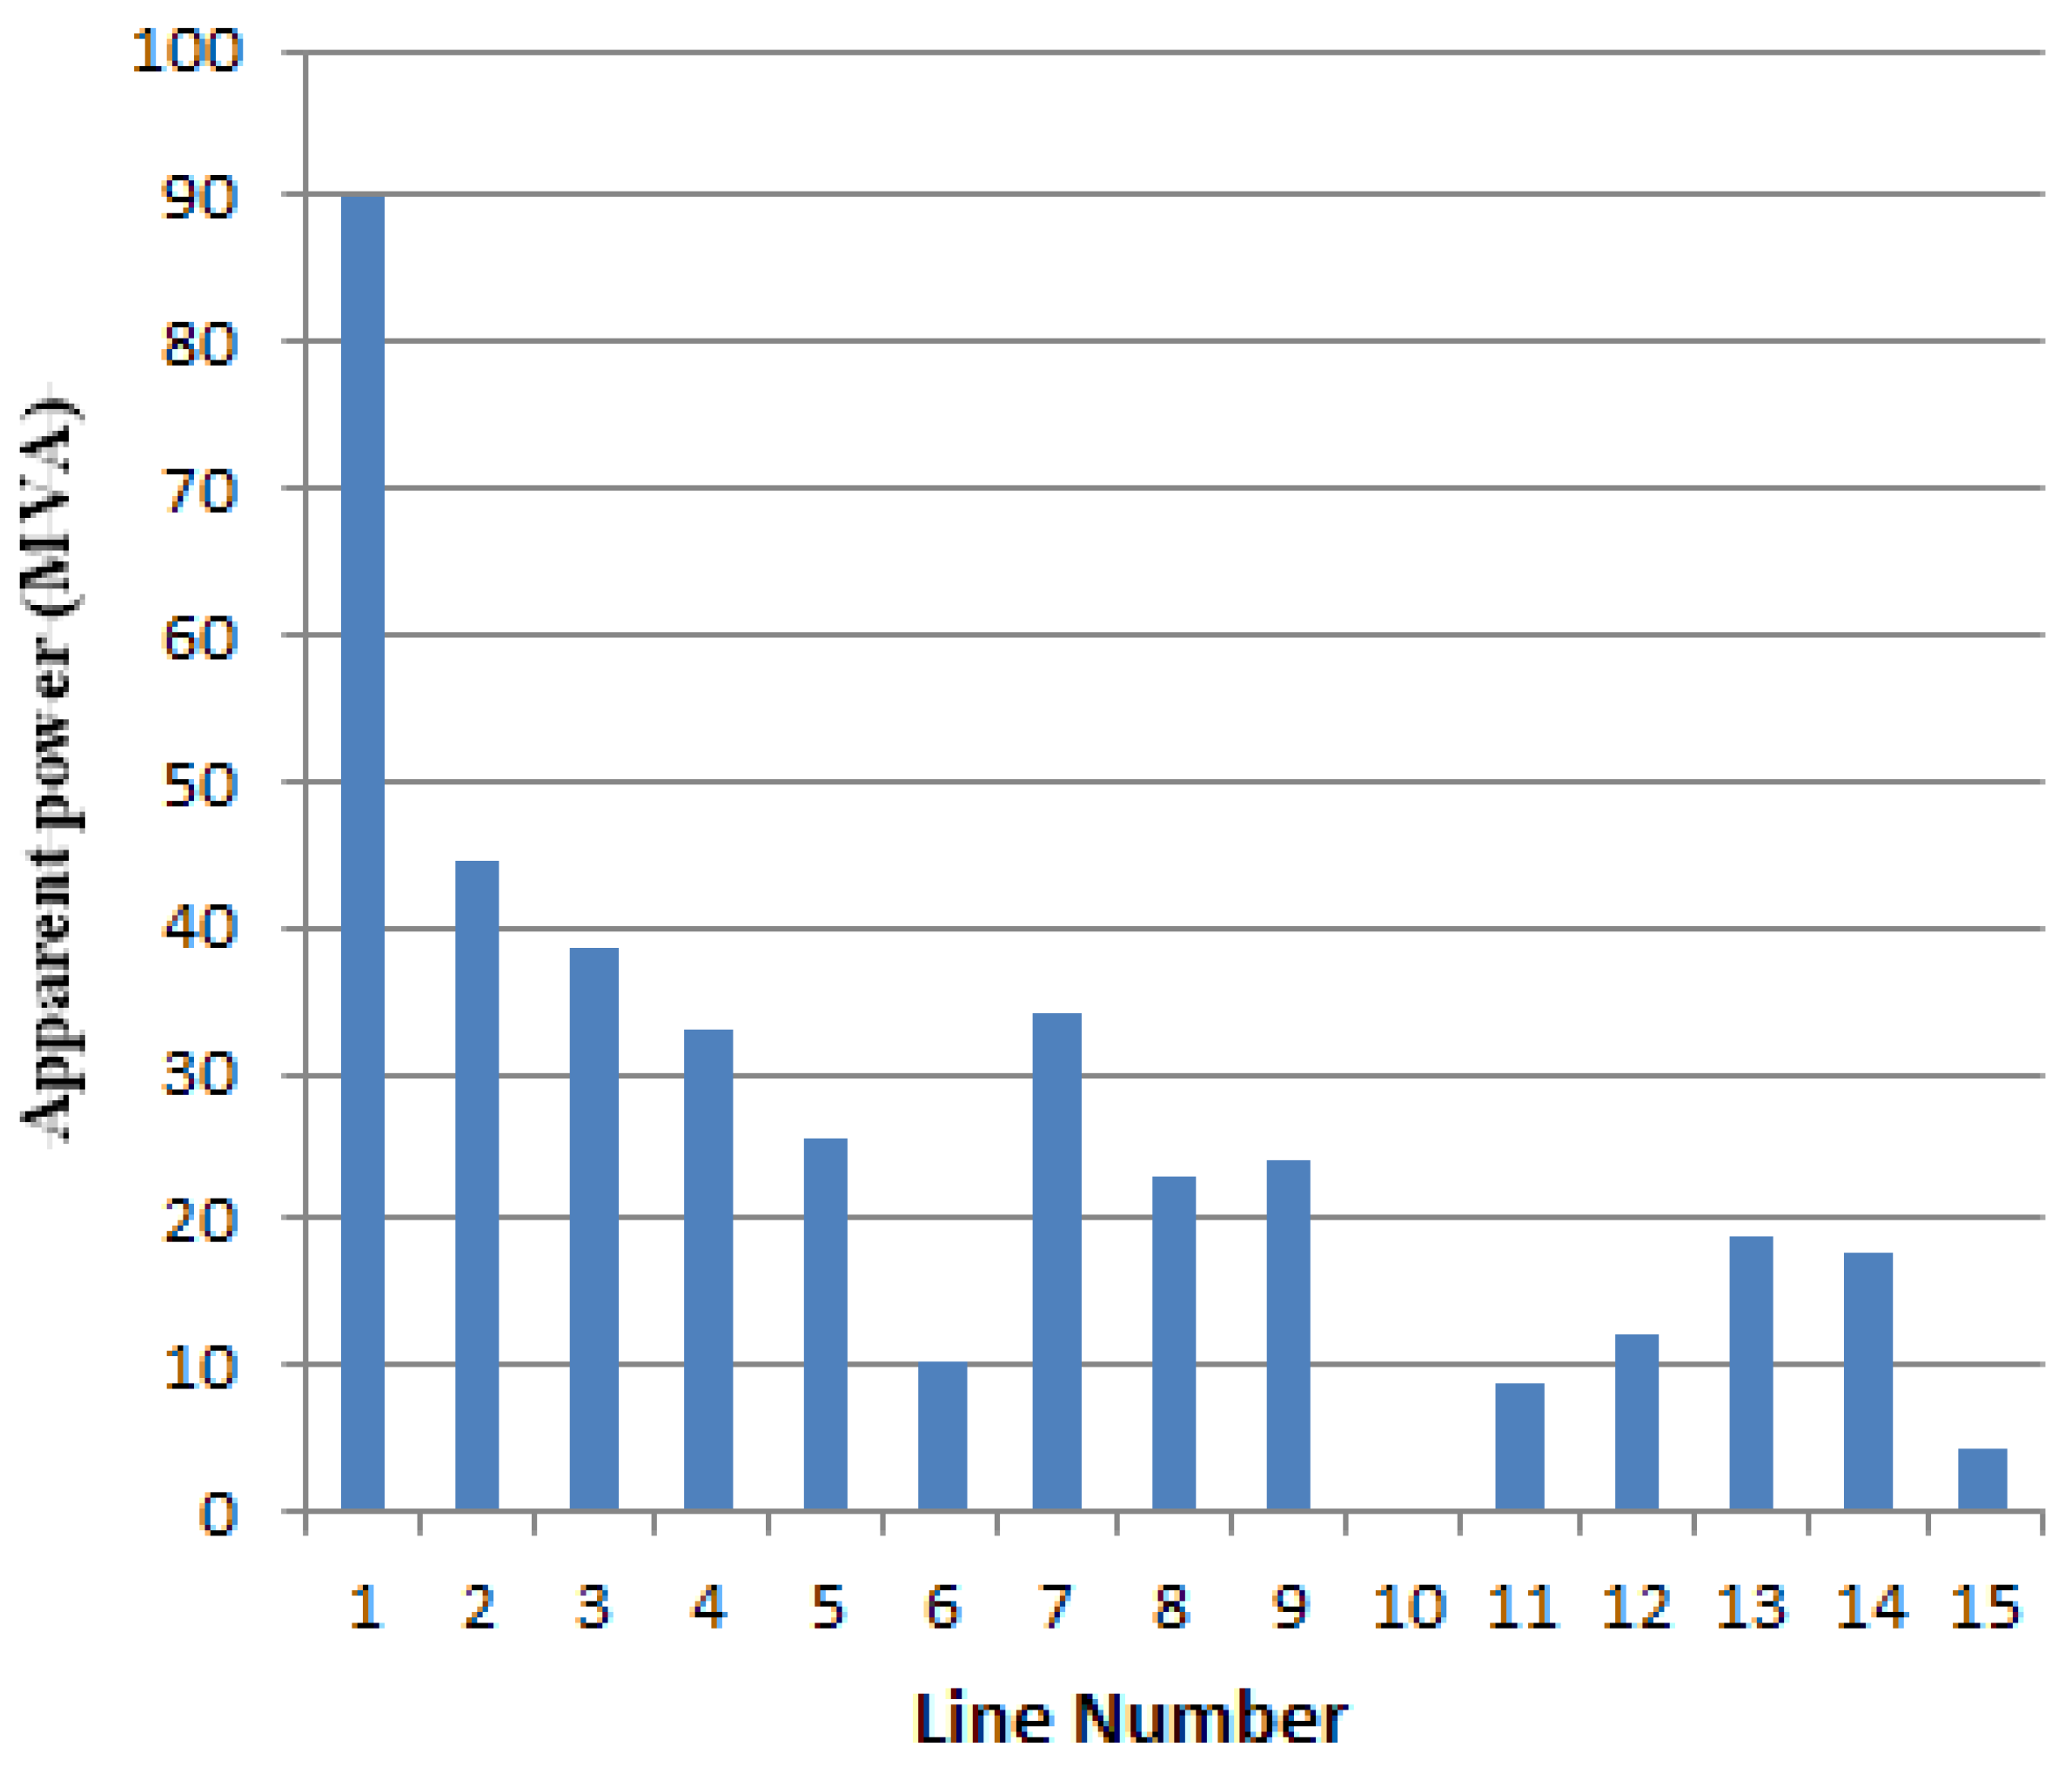
The modified IEEE 14-bus system was implemented in
ETAP®, and a load flow analysis was conducted for the typical load profile, shown in
Figure 2 and
Figure 3. The percentage violation of loading in each transmission line obtained from the simulation is given in
Table 1. This work considered the N-1 contingency analysis by creating an outage of Line No. L6_13 in the IEEE 14-Bus test system. The percentage violation of loading in each transmission line obtained from the simulation is given in
Table 1 under both cases without outage and with outage by conducting an N-1 analysis in the outage case.
Table 1 depicts the magnitudes of percentage violations indicating the level of congestion of each line in the system due to the interruption of lines 6–13. The effect of the outage of a typical line L6_13 on the transmission line congestion was studied using the
ETAP® simulation, and the results are given in
Table 1. During the outage of lines 6–13, the apparent power flow of three lines exceeded their thermal limits at each bar, requiring an immediate solution.
The severity index components of the branches (SICB) of the base system of the IEEE 14-Bus test system were arrived at using the equation SICB =
. The values of the severity index component (SICB) of each branch from the power flow status were calculated and are presented in
Table 1. From the values, it was observed that none of the SICBs was greater than 1 when there was no component outage in the system. Hence, there was no congestion in the base system, whose SI was 8.4, as presented in
Table 1. In observing the outage case in
Table 1, the results indicate that the values of SICB for the lines L6_11, L10_11 and L12_13 as 1.61, 2.49 and 2.22, respectively. Hence, these lines were identified as congested lines due to the outage of L6_13. From the results, it was also inferred that line L10_11 was the most critically crowded compared to lines L6_11 and L12_13.
Repeated N-1 simulation studies were conducted using the
ETAP® simulation for the outage of each component, such as the transmission line, transformer and generator, to observe the congestion by carrying out an N-1 analysis. The number of congested lines and SI obtained for the entire simulation study are given in
Table 2. The outage branches such as generator, transformer and line number, consequent number of congested units and respective SI index values were obtained.
In the normally running base system of the 14-bus IEEE system as configured in
Figure 1, the value of SI = 8.4.
Table 2 shows that all outage branches in
Figure 1 with SI values above 8.4 were treated as congested cases in the system with N-1 analysis, and the number of congested lines in each outage case also showed the importance of the analysis. Being SI a Global Index, in principle it is possible to have congestion cases in which SI is lower than 8.4 in other systems depending upon the configuration of the components. Similarly, the choice of the cases with SI higher than 8.4 is not intended to represent all the possible congestion cases of other systems and it depends upon the components configuration of the system.
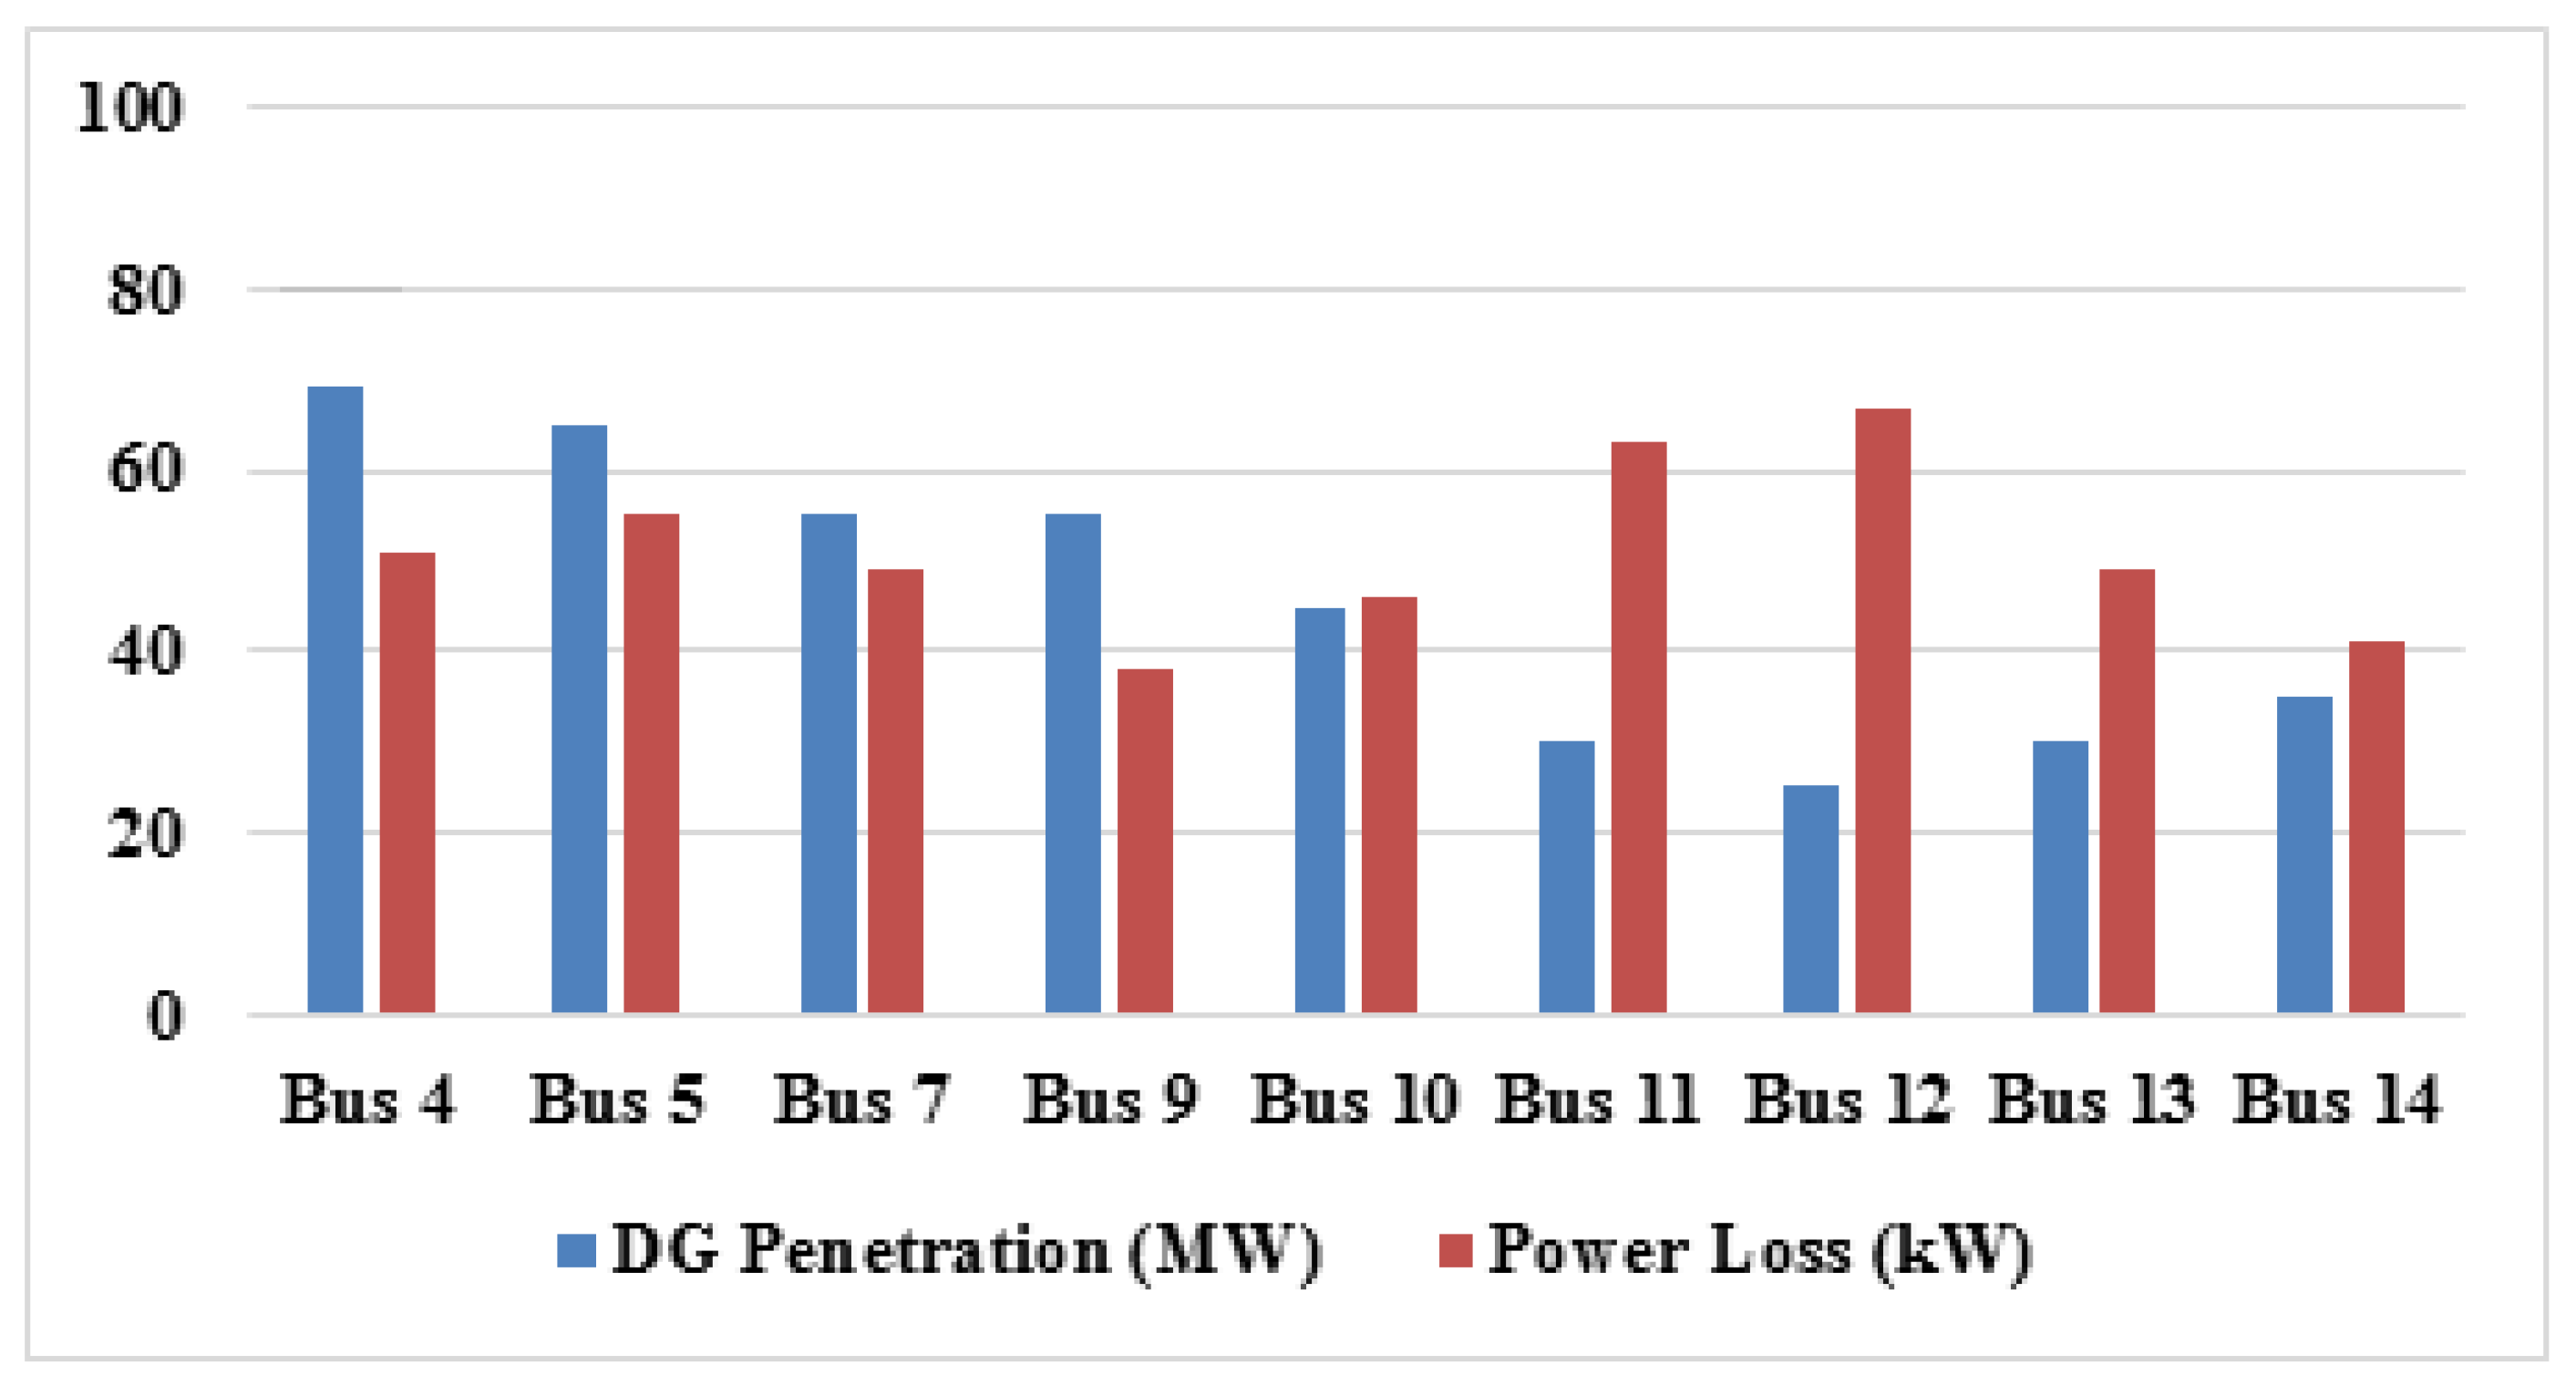
The sensitivity factor (SF) determined the best bus location for the penetration of DG into the system for congestion management in transmission lines. Distributed generation SF for each case of DG penetration of 1 MW at different buses was determined from the load flow results obtained by simulation using ETAP software. It was regarded that the negative values of SF reflected the suitability of that location of the bus for DG placement for managing congestion in the interconnected transmission lines, as shown in
Table 3. The investigation revealed that for the feeder outage (L6_13), the feasibility of all load bus locations of Bus No. 4, Bus No. 5, Bus No. 7, Bus No. 9, Bus No. 10, Bus No. 11, Bus No. 12, Bus No. 13 and Bus No. 14 were considered for managing congestion in the system, as displayed in
Table 3. Thus, different scenarios for congestion relief were obtained by analyzing the system’s power flow for the critical outage case (interruption of feeder L6_13) and the conditions for feasible placing and quantifying of DG integration were determined as given in
Table 3. The simulation results and power flow study in the power system network with penetration of DG revealed that the identified Bus No. 7, Bus No. 9, Bus No. 10 and Bus No. 14 were considered suitable buses for integration of DG sources during the outage of feeder L6_13; thus, DG Bus No. 7, DG Bus No. 9, DG Bus No. 10 and DG Bus No. 14 were treated as feasible buses as shown in
Table 3.
5. Proposed Algorithm for Managing Congested Feeders in Transmission Network
The most crucial step in the development of the algorithm is the design of the accurate power system model, as any error in the system data will adversely affect the simulation results of the actual model of the system to be investigated. The system data, such as resistance, inductance and capacitance of the transmission line, shall be collected and entered correctly to reflect the better performance of the system. It shall be measured and used appropriately. The length of the transmission line and its conductor material shall be considered seriously to obtain accurate simulation results. The transformer specifications, including tap positions, shall be precise while considering the transformer design, and the winding shall be connected with the correct polarity. The type of generators shall be entered explicitly for the appropriate result. The wrong selection of generators may cause a system mismatch while running the algorithm. Utmost care is required to simulate without mismatch. The algorithm’s accuracy depends upon the safe data handling in the system. The identified sensitivity factor (SF) index can be employed to find the feasible location of DGs to be integrated into the system for congestion relief in transmission lines. Using SF in a congested line can minimize the effort to identify the feasible location for DG penetration in an extensive interconnected system. The combined use of load flow analysis and SF is detailed in this section. The combined effect can formulate a feasible approach for finding the best size and bus location for DG placing, thereby managing congested feeders in the transmission network.
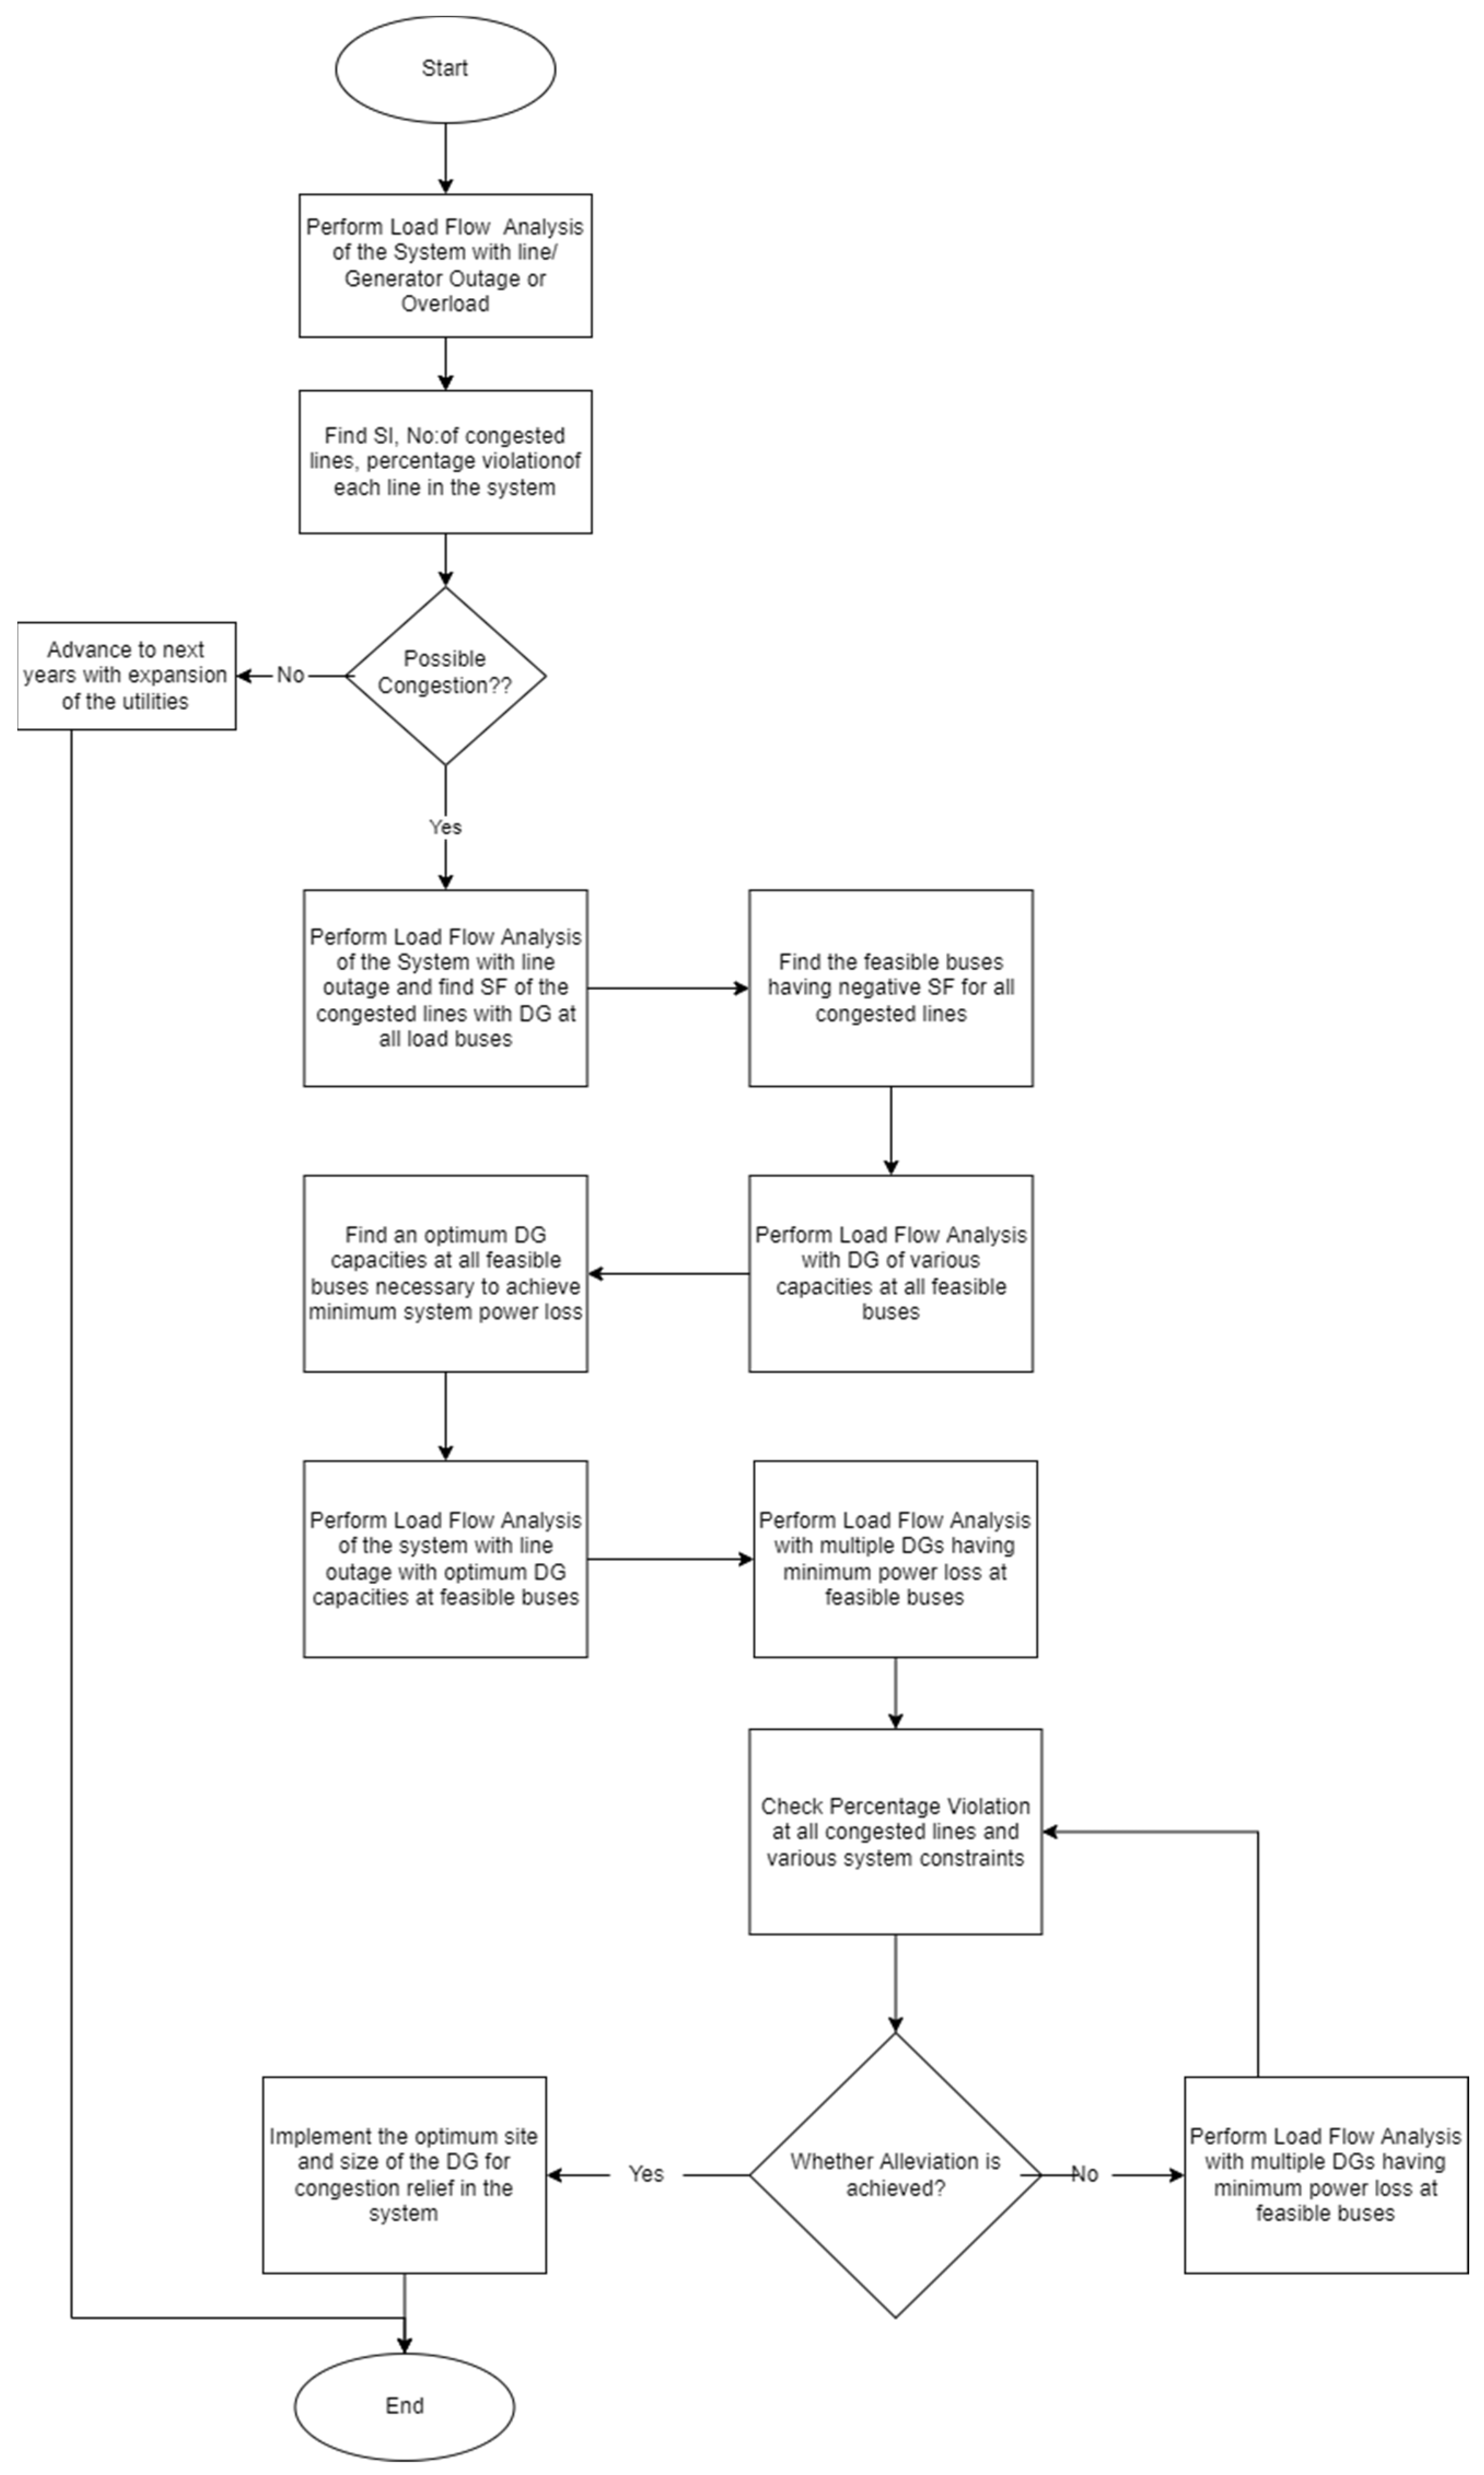
The proposed algorithm for managing congested feeders in the transmission network during an outage of lines is described in
Figure 4. The algorithm proposes the combined application of system knowledge and computer simulation-based load flow analysis of the system for managing congested feeders in the transmission network. The power system expert shall acquire a prior understanding of the practical system’s parameters for applying this algorithm. The developed system parameters shall be used to formulate a load flow model of the system. They can be utilized for assessing the severity level of various line outage cases and estimating the sensitivity factor (SF) for multiple capacities and the location of DG integration into the system for congestion management during outage cases. The proposed algorithm demands the analysis of power flow solutions of the practical system under various line outage cases and the estimation of congestion level in terms of the number of congested lines and severity index for each outage case. This knowledge shall be used to obtain prior knowledge of solutions for congestion relief by DG integration. Thus, by estimating the severity index during each outage case, the system expert will be able to assess the critical impact of a line outage case on the system during its occurrence.
The technical scheme for managing congested feeders in the transmission network during a particular line outage case requires the analysis of the power flow solutions of the developed model of the system with the corresponding outage introduced into the model. The computer-based simulation and analysis of power flow solutions will yield the apparent power flow and power loss at each inter-connected system’s inter-connected lines. The obtained results shall be used to estimate the sensitivity factor (SF), which can be used to find the best bus for DG penetration for managing congested feeders in the transmission network in the corresponding line outage case. The buses which yield negative values of SF for DG integration in the buses shall be regarded as feasible buses for DG integration into the system for managing congested feeders in any IEEE bus system or any practical interconnected system of any entity.
The decisions of feasible buses using SF should be followed by a series of apparent power flow solutions for the study of the system with outage cases by integrating various capacities of DG sources into the system at feasible buses. During the case of DG integration of various capacities at each possible bus, the power loss in the system shall be acquired by simulation. It can be used to determine the best DG penetration bus for managing congested feeders in the transmission network. Integrating a feasible DG capacity at each viable bus will ensure a congestion-free environment in transmission lines. These DG capacity values shall be obtained by power flow solutions of the system with DG penetration of various matters in the feasible buses. A detailed apparent power flow analysis will yield the DG source values, which tremendously diminish the obstruction of power flow identified by checking the system’s severity index (SI). These values will be different at each feasible bus. Thus, the power flow analysis of the transmission network with variable DG capacity at the probable buses yields the DG capacity required at each viable bus for managing congested feeders in the transmission network.
The next task for managing congested feeders in the transmission network with DG penetration is the most favorable selection among the feasible buses and DG capacities. This shall be acquired by the analysis of power loss of the system for each of the DG integration cases at workable buses. The power loss in the system with DG integration of derived values for congestion relief at the workable buses shall be estimated by load flow analysis. The combination of DG size and location, which yield the minimum power loss in the system, shall be regarded as the optimal size and site for DG or local generator integration for managing congested lines for the particular line outage case, as described in the proposed methodology in
Figure 4. This scheme will provide advanced information for the best capacity and location of the local generator to be integrated into the system by estimating the appropriate values of distributed generation sensitivity factor (DGSF). The formulated methodology will provide a proactive indication to arrive at the most favourable buses to eliminate the power flow obstruction in the feeders of the transmission network by the allocation of appropriate local generators or DGs in any interconnected system, using the advanced collection of DGSF in the intermittent step itself of the algorithm rather than moving to the final stage of the scheme.
7. Case Study for Congestion Management Using the Formulated Algorithm in the Practical Interconnected Grid System of the Supply Entity of the State of Kerala, KSEBL, India
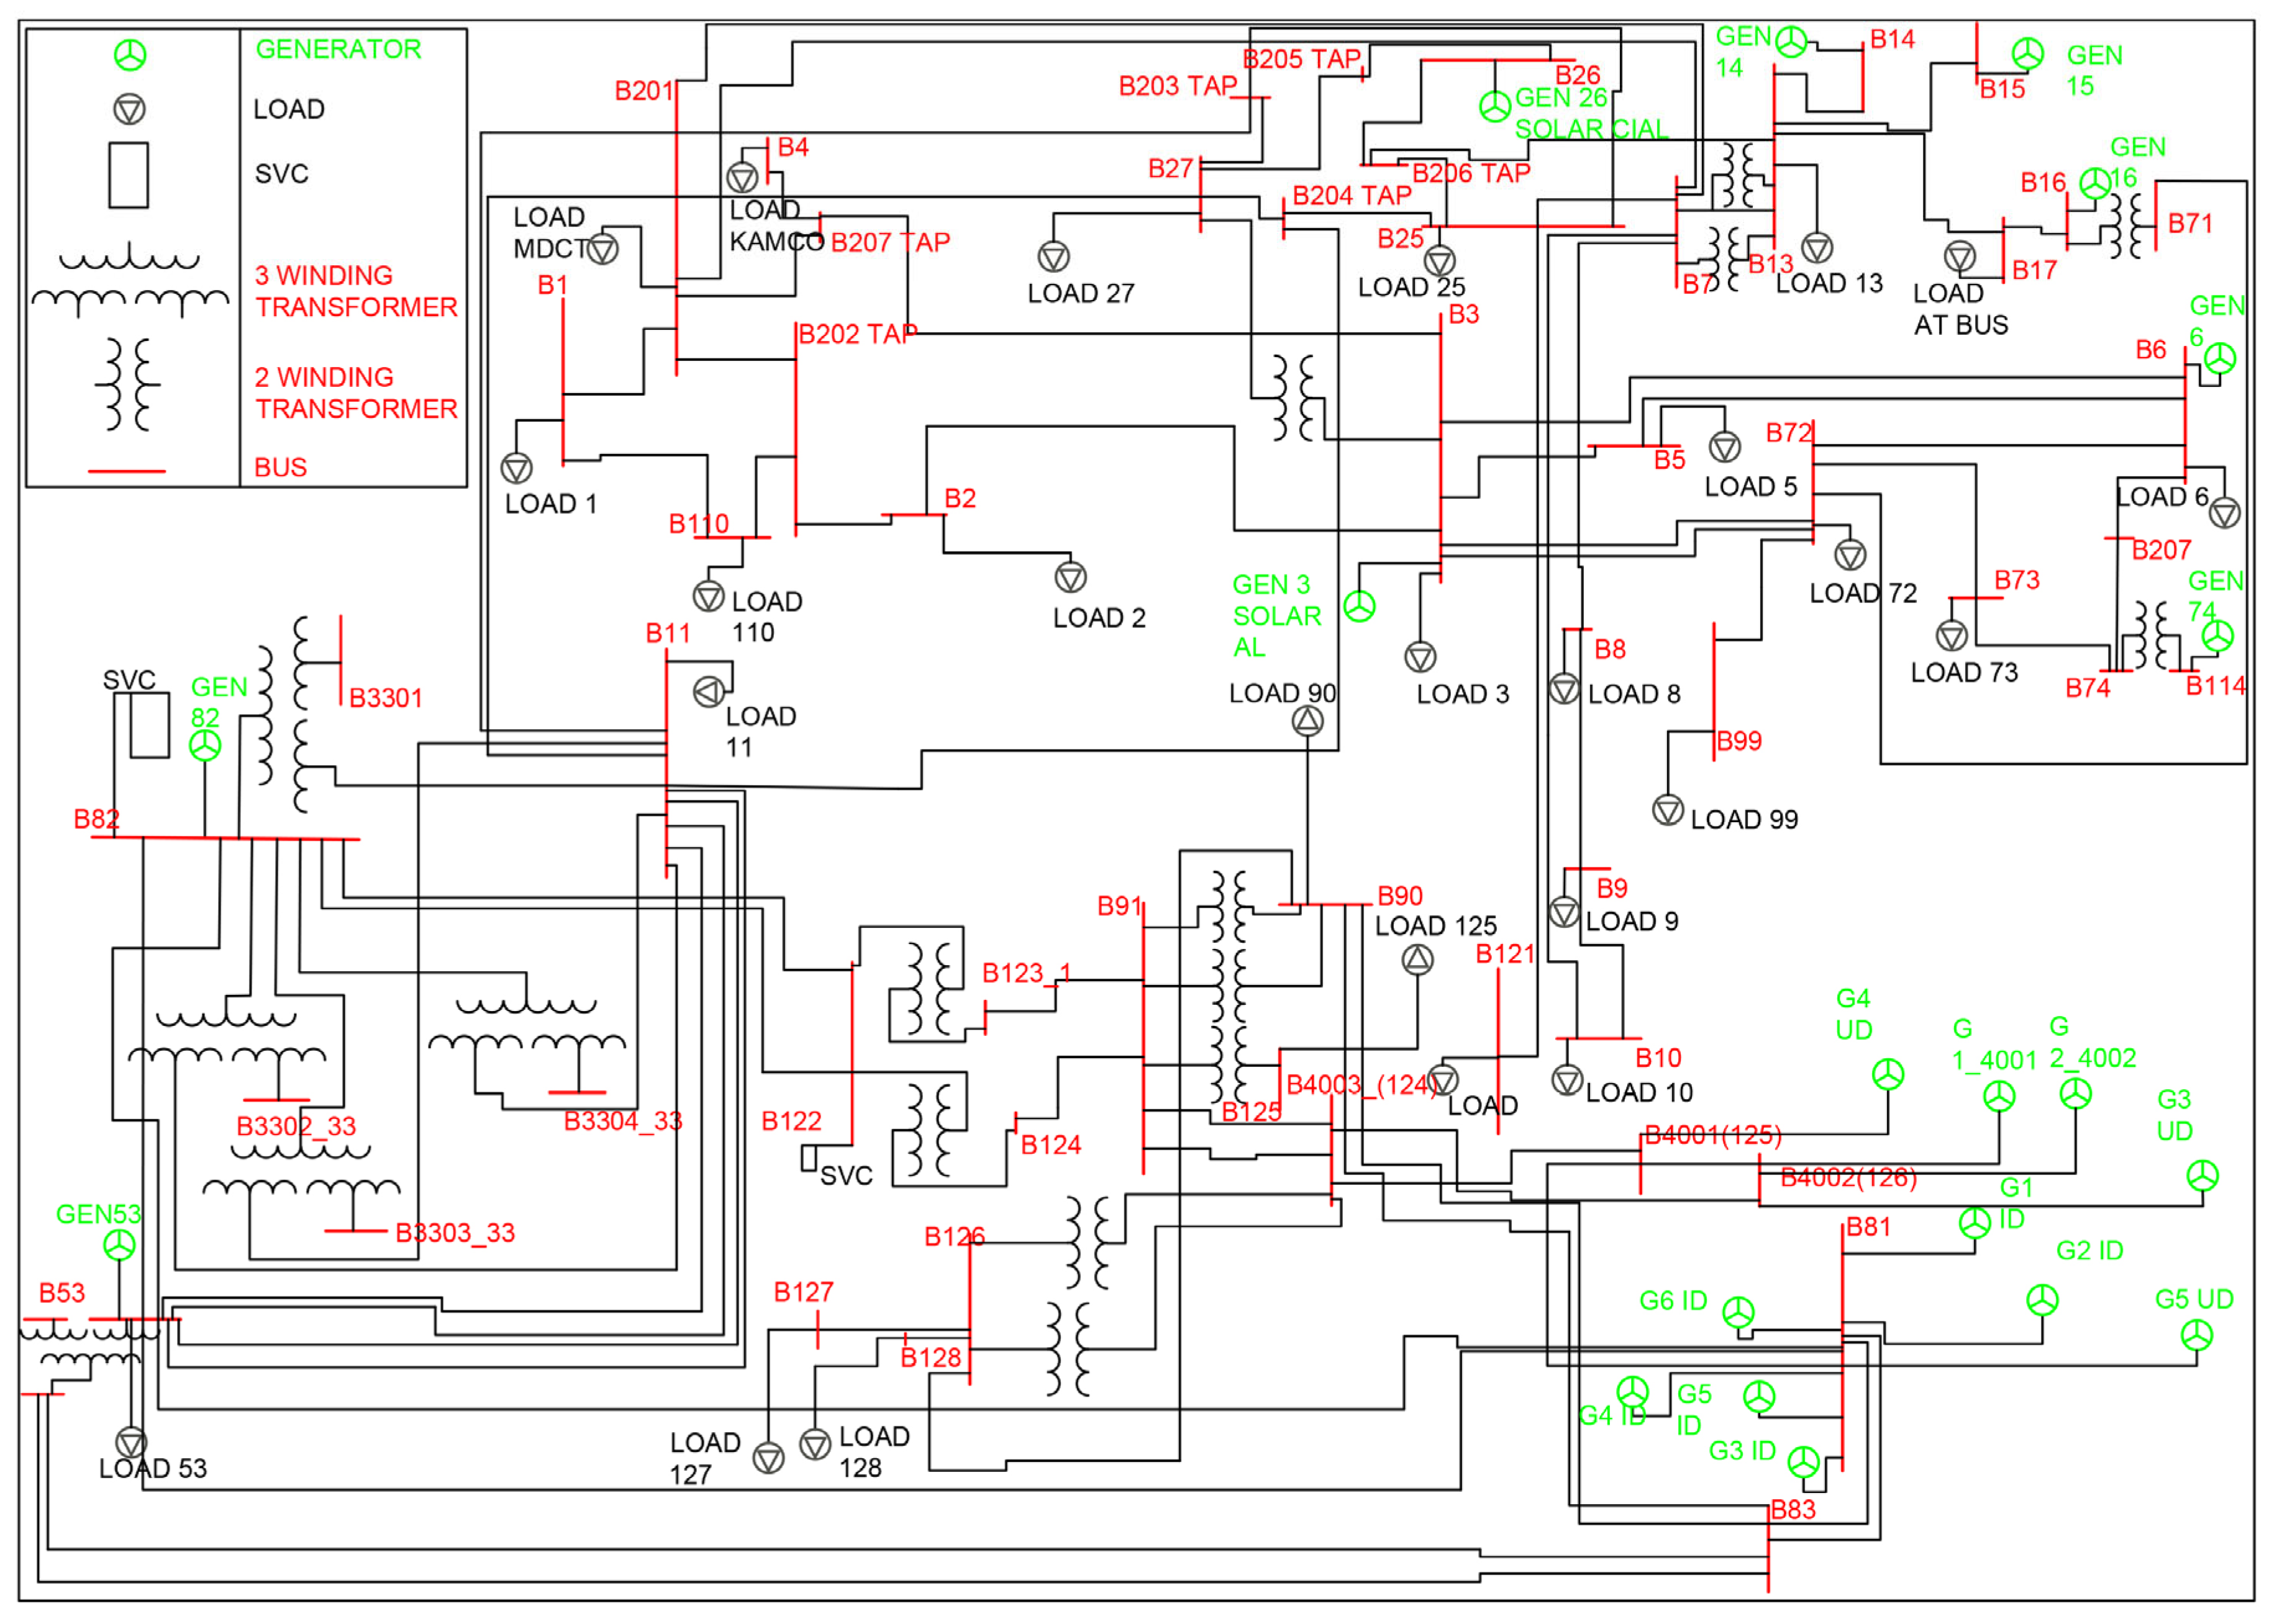
A single-line diagram of the part of the interconnected grid system of the supply entity of the state of Kerala, KSEBL, is shown in
Figure 6. The system consisted of 54 numbers of various buses with voltage levels of 400 kV, 220 kV, 110 kV, 66 kV and 33 kV with 80 branches of transmission lines or connections and 14 generators generating 566.933 MW power delivering 17 loads of various specifications, out of which 543.32 MW was active power and 297.93 Mvar was reactive load, producing a loss of 22.613 MW in the system under normal running conditions without any obstruction of energy flows in the feeders. The practical system was implemented in ETAP
®, an analysis of power flow solutions was conducted for the typical load profile and the percentage violation of the loading in each transmission line was obtained from the simulation. From the values of the thermal limit of each line and the apparent flowing power of the line in MVA, it was observed that none of the lines was overloaded, nor did the line have a severity index component of each branch (SICB) greater than one, and hence, there was no congestion in the system when there was no feeder interruption in the network. The effect of outage of a typical line of 400 kV, L91_4003 transmitting an apparent power of 240.9 MVA in the system was studied using the ETAP
® simulation, and the results are given in
Table 9 for observing the status of the congested feeders L17_16 and L17_13 of the practical grid system. These feeders had SICB values of 3.50 and 2.04 with violation percentages of 87.51 and 42.77, respectively, showing concrete proof of the congestion in the system under the outage of L91_4003.
Repeated simulation studies were conducted using the ETAP
® simulation for the outage of each transmission line to assess the congestion. The sensitivity factor (SF) determined the best sites/buses for integrating local generators or DGs into the system to solve congested feeders in the transmission network. The SF for each case of DG penetration of 5 MW at different buses was determined from the load flow results obtained by simulation using ETAP software. It was regarded that the negative values of SF reflected the suitability of that location for the placement of DGs or local generators for managing congested feeders in the system. The analysis revealed that, for line outage L91_4003, buses 1, 2, 3, 4, 8, 10, 17, 110 and 125 were considered feasible buses for a congestion solution, as shown in
Table 10. The power loss at each line is a critical factor to be considered during the integration of DGs at buses for making the feeders free from power flow obstruction, and this approach was considered in this work to arrive at the best size of DG source for relieving the congested feeders on the occasion of interruption in the network. The capacity of DG size, which, when injected into the system, resulted in minimum power loss, could alleviate the congested feeders, and it was regarded as the best size for the integration of local generators or DGs, as shown in
Table 10. Thus, different scenarios for congestion relief were obtained by power flow solutions of the system for the critical interruption event (interruption of line 91_4003). The conditions for feasible placing and quantifying DG allocations were determined and are presented in
Table 10. The interruption of L91_4003 will create overloading only in the feeders of L16_17 and L17_13, and the loading of these feeders was observed by placing a DG capacity of 5 MW at each load bus. After the interruption of the feeder L91_4003, the MW loss in the practical grid system was observed as 21.644 MW without placing any DG. The events where the apparent flows in feeders L16_17 and L17_13 were reduced during the interruption of L91_4003 than that of the flow during the usual running case, showing that the SF values were least negative. Power flow solutions of the system with DG penetration revealed that the recognized buses 1, 2, 3, 4, 8, 10,1 7, 110 and 125 were considered feasible buses for integration of DG as a remedial solution after the outage of line 91_4003, as these buses had negative values of SF while buses 25, 27,53 and 72 had positive or zero values of SF, providing a proactive indication for not considering these buses for the best solution, as given in
Table 10. The load buses 1,2 and 110 produced minimum losses of 19.58 MW with the allocation of DGs of capacities of 35 MW. Their SF values were investigated and found to be very low compared to other SF values in the group of buses 25, 27, 53 and 72, as given in
Table 10. The load buses 3, 4, 8, 10 and 17 produced losses in the range of 20 MW whose SF values were also negative, but more excellent or nearer to the SF values than the group of buses 1, 2 and 110. The buses 25, 27, 53 and 72 produced losses above 21 MW due to their zero or positive values of SF and, hence, these were not considered for comprehensive optima, as predicted in
Table 10. The 220 kV bus no.125 was regarded for DG allocation due to its high capacity of 100 MW with a minimum loss of 21.644 MW. The analysis revealed that integrating DG sources of appropriate capacity at buses whose SF values were least negative would help to find a solution for the congested feeders in the practical grid system, particularly when line 91_4003 is interrupted in the same system. The power loss at various lines for DG penetration of capacity which offered minimum power loss when injected at different buses was identified, and the optimal capacity of the DG and bus with minimum loss is shown in
Table 11.


