Article

Study on Quantitative Evaluation Index of Power System Frequency Response Capability

1
School of Computer Science and Engineering, Northeastern University of China, Shenyang 110819, China
2
Northeastern Branch of State Grid Corporation of China, Shenyang 110000, China
3
State Grid Liaoning Electric Power Research Institute of China, Shenyang 110006, China
*
Author to whom correspondence should be addressed.
Energies 2022, 15(24), 9423; https://doi.org/10.3390/en15249423
Submission received: 22 November 2022 / Revised: 9 December 2022 / Accepted: 9 December 2022 / Published: 13 December 2022

Abstract

:
Frequency stability is an important factor for the safety and stability of the power system operation. In a traditional power system, the operation stability is ensured by the inertia response, primary frequency modulation, and secondary frequency modulation. In recent years, in order to achieve the goal of carbon neutralization and carbon peaking, China has made great efforts in new energy development. With large-scale new energy connected to the power grid, the proportion of traditional conventional synchronous units has gradually declined. At the same time, a large number of power electronic devices have been used in the power grid, which led to the capability decline of the inertia response and primary frequency modulation. For example, the East China Power Grid has experienced a sharp frequency drop in such an environment. In order to solve the above problems, the operation principle and control mode of various new energy resources are analyzed in this paper. Moreover, the process and principle of power grid frequency response are studied and the evaluation index of frequency response capability is proposed. The research results can quantitatively evaluate the system inertia response and primary frequency modulation level and provides a judgment tool for dispatching operators and system planners.

1. Introduction

Frequency stability is an important factor to ensure the safety and stability of the power system operation. That is, under a larger disturbance, there is a power imbalance between the power supply side and load side and the frequency stability can still be maintained. The frequency response of the power system mainly includes inertia response, primary frequency modulation, and secondary frequency modulation. At the initial stage of frequency recovery, the frequency response depends on the inertia of the power system, which includes the inertia of the rotating machinery of the generator and motor and has the advantages of fast response, high reliability, and strong anti-interference ability. At the middle stage of frequency recovery, the frequency response depends on primary frequency modulation which can eliminate the influence of small disturbances and ensure frequency stability by inertia response and primary frequency modulation.
It is expected that in the future, the power system will be based on renewable energy systems, distributed generations, and power electronics [1]. For example, in Europe, there will be 323 GW and 192 GW of wind and photovoltaic energy installed in 2030, which will cover up to 30% and 18% of the power demand [2]. In China, the government supports clean energy development through laws, regulations, finances, and taxation [3,4]. By the end of April 2022, the installed capacity of new energy is about 700 million kiloWatts, accounting for 29% of the total installed capacity of power generation in China.
With the large-scale new energy resources and DC connected to a power grid, the proportion of traditional conventional synchronous units has gradually declined, and a large number of power electronic devices have been used in the power grid, resulting in the weakening of the inertia response and primary frequency modulation capability [5,6,7,8,9,10], so it is necessary to study and establish quantitative evaluation indexes of system-level frequency response capability to guarantee the stability of power grid frequency. References [11,12] analyze the virtual moment of inertia of wind power plants and propose the virtual inertia estimation method and active power control strategy of wind farms [11,12]. Reference [13] sums up the importance of power system inertia for power system stability and determines the inertia contribution from different power consumer groups [13]. The above references only analyze the equipment-level calculation methods of inertia, lacking the system-level calculation methods. Reference [14] proposes a new network virtual inertia method to evaluate the power oscillation and analyzes the network virtual inertia of power systems with a high penetration rate of renewable energy generation, however, the reference focuses on theoretical analysis, which cannot better guide the actual power grid dispatching operation [14]. For the primary frequency modulation index, reference [15] analyzes the primary frequency modulation from the static point of view, which is reflected in the relationship curve between the power of the prime mover and its speed δ to describe the primary frequency modulation capability, but this method only considers the static characteristics of primary frequency modulation, and does not consider the dead band link [15]. Reference [16] uses the CPS index to measure the overall operating performance of the power grid, but the CPS index is used to evaluate the control effect of AGC (Automatic Generation Control), and there is no single index to evaluate the primary frequency regulation capability of the power grid [16]. There are also some references to improve the control strategy of equipment-level primary frequency modulation, for example, reference [17] combines PI control with internal model control [17], reference [18] improves the primary frequency modulation of energy storage [18], reference [19] proposes a control strategy for large-scale doubly fed induction generators participating in system primary frequency regulation [19], but these methods all lack the system-level calculation methods. Aiming at the problems caused by large-scale renewable energy grid connection, reference [20] proposes to adopt the SWOT analysis method, which constructs 24 internal and external evaluation factors and eight improvement strategies, evaluate the prospect of operation safety of China’s new energy power system, but the SWOT analysis method cannot quantitatively evaluate the factors, and cannot objectively compare the priority between factors [20].
Compared with the above references, the quantitative evaluation indexes of frequency response capability proposed in this paper have the following advantages:
(1)
Based on the actual operation of a regional power grid in China, the paper takes full account of the operation characteristics of data acquisition equipment and dispatching system in the State Grid Corporation of China, to propose indexes that are closer to the actual operation, can be directly arranged in the dispatching system to guide the dispatch operation.
(2)
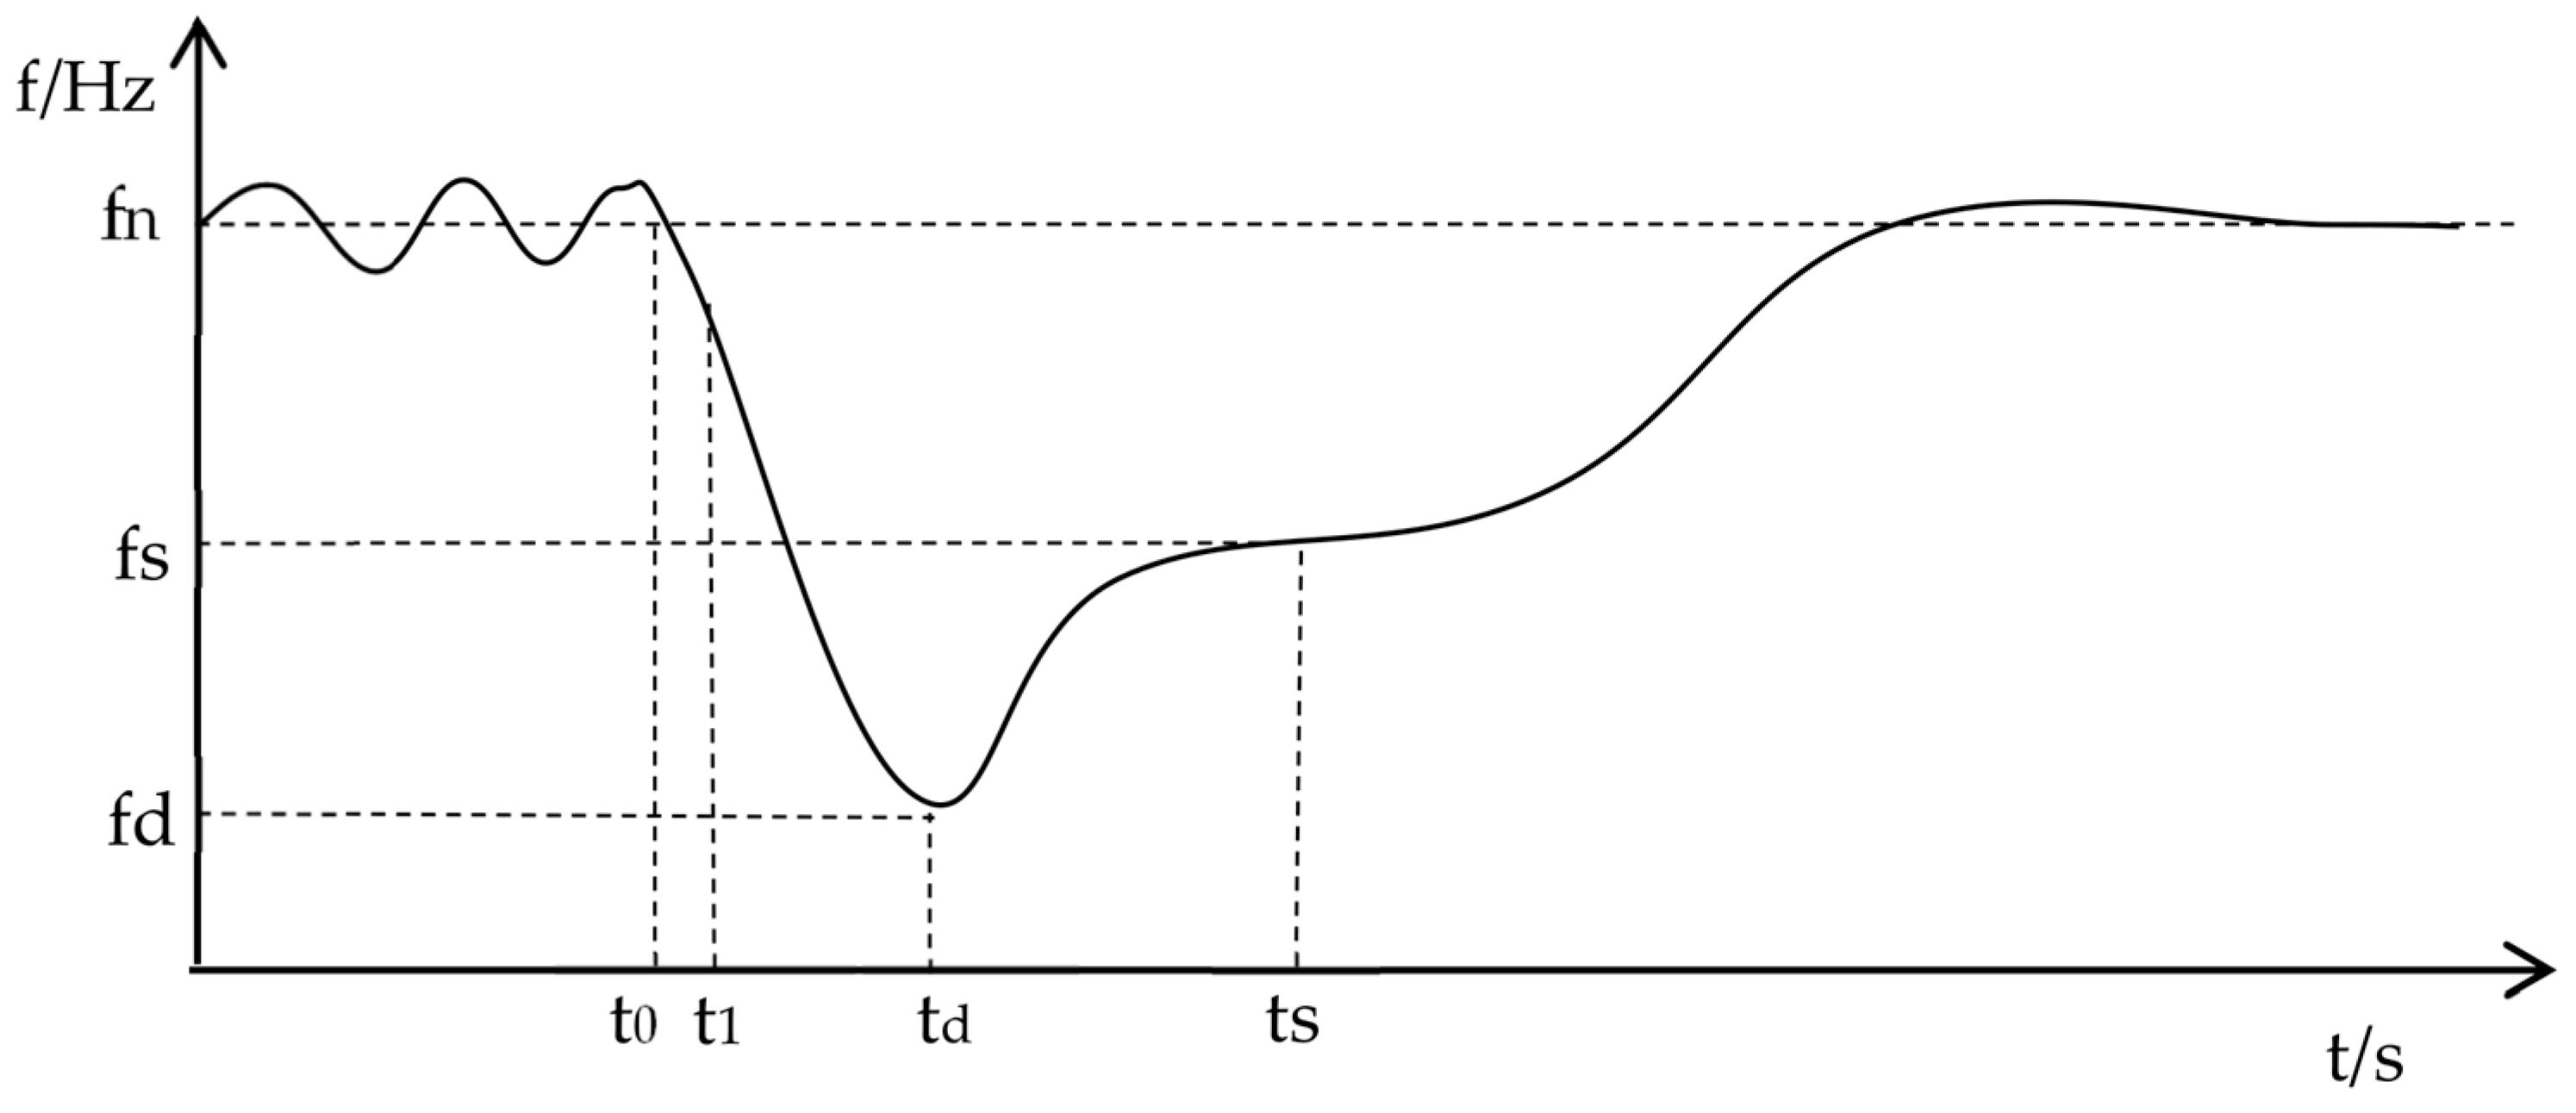
The paper analyzes the operation principle and control mode of various new energy units and studies the process and principle of grid frequency response.
(3)
Through formula derivation, the paper proposes to use the equivalent system energy to seek the equivalent inertia time constant of the system H t o t and the equivalent calculation of the inertia value T , which provides a simple and effective quantitative evaluation index of the system-level inertia index for dispatching operators.
(4)
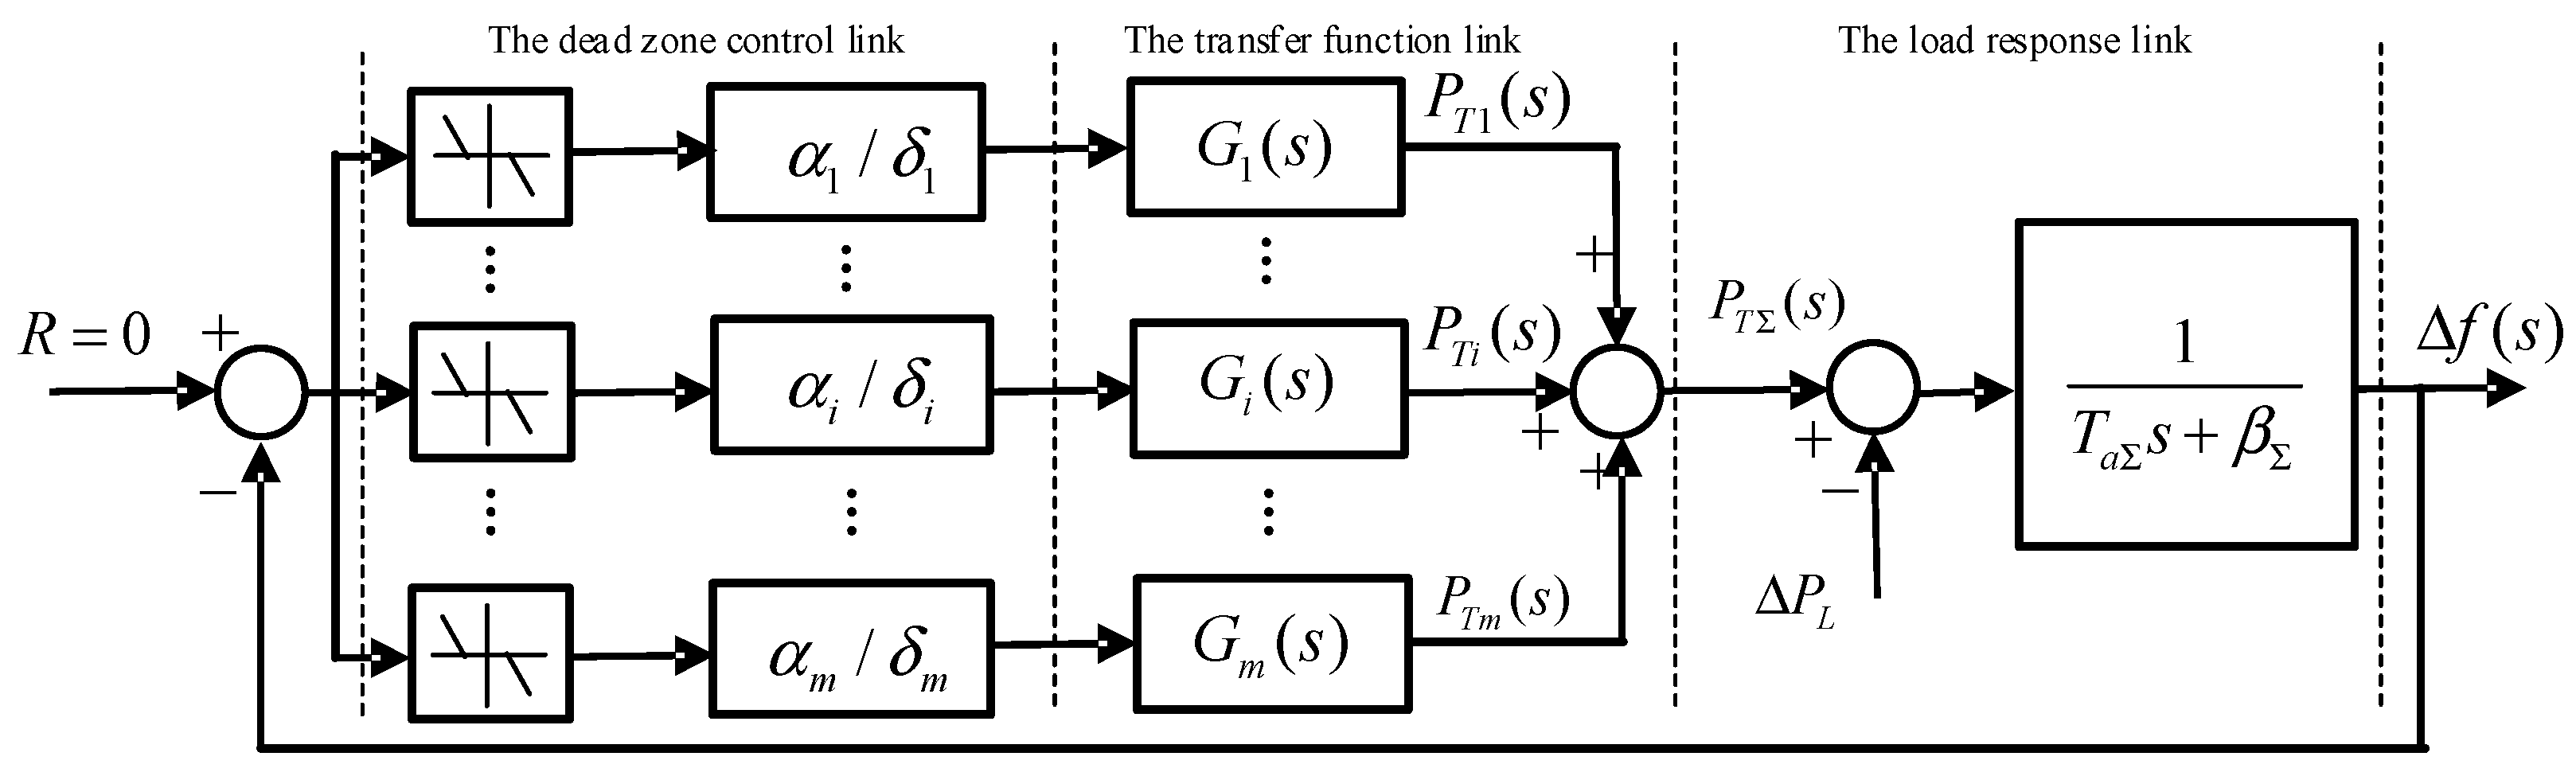
The paper considers the dead band and the maximum amplitude limitation of load adjustment and so on, and analyzes the frequency domain and time domain operation characteristics of all types of units, proposes to use Paseval’s theorem to establish the dynamic index of primary frequency modulation which can quantitatively evaluate the primary frequency regulation level of the power system in real-time.
(5)
The paper uses the actual operation data of the regional power grid in China to calculate the inertia response index and primary frequency modulation index, which proves the feasibility of this method to guide the power grid dispatching operation.

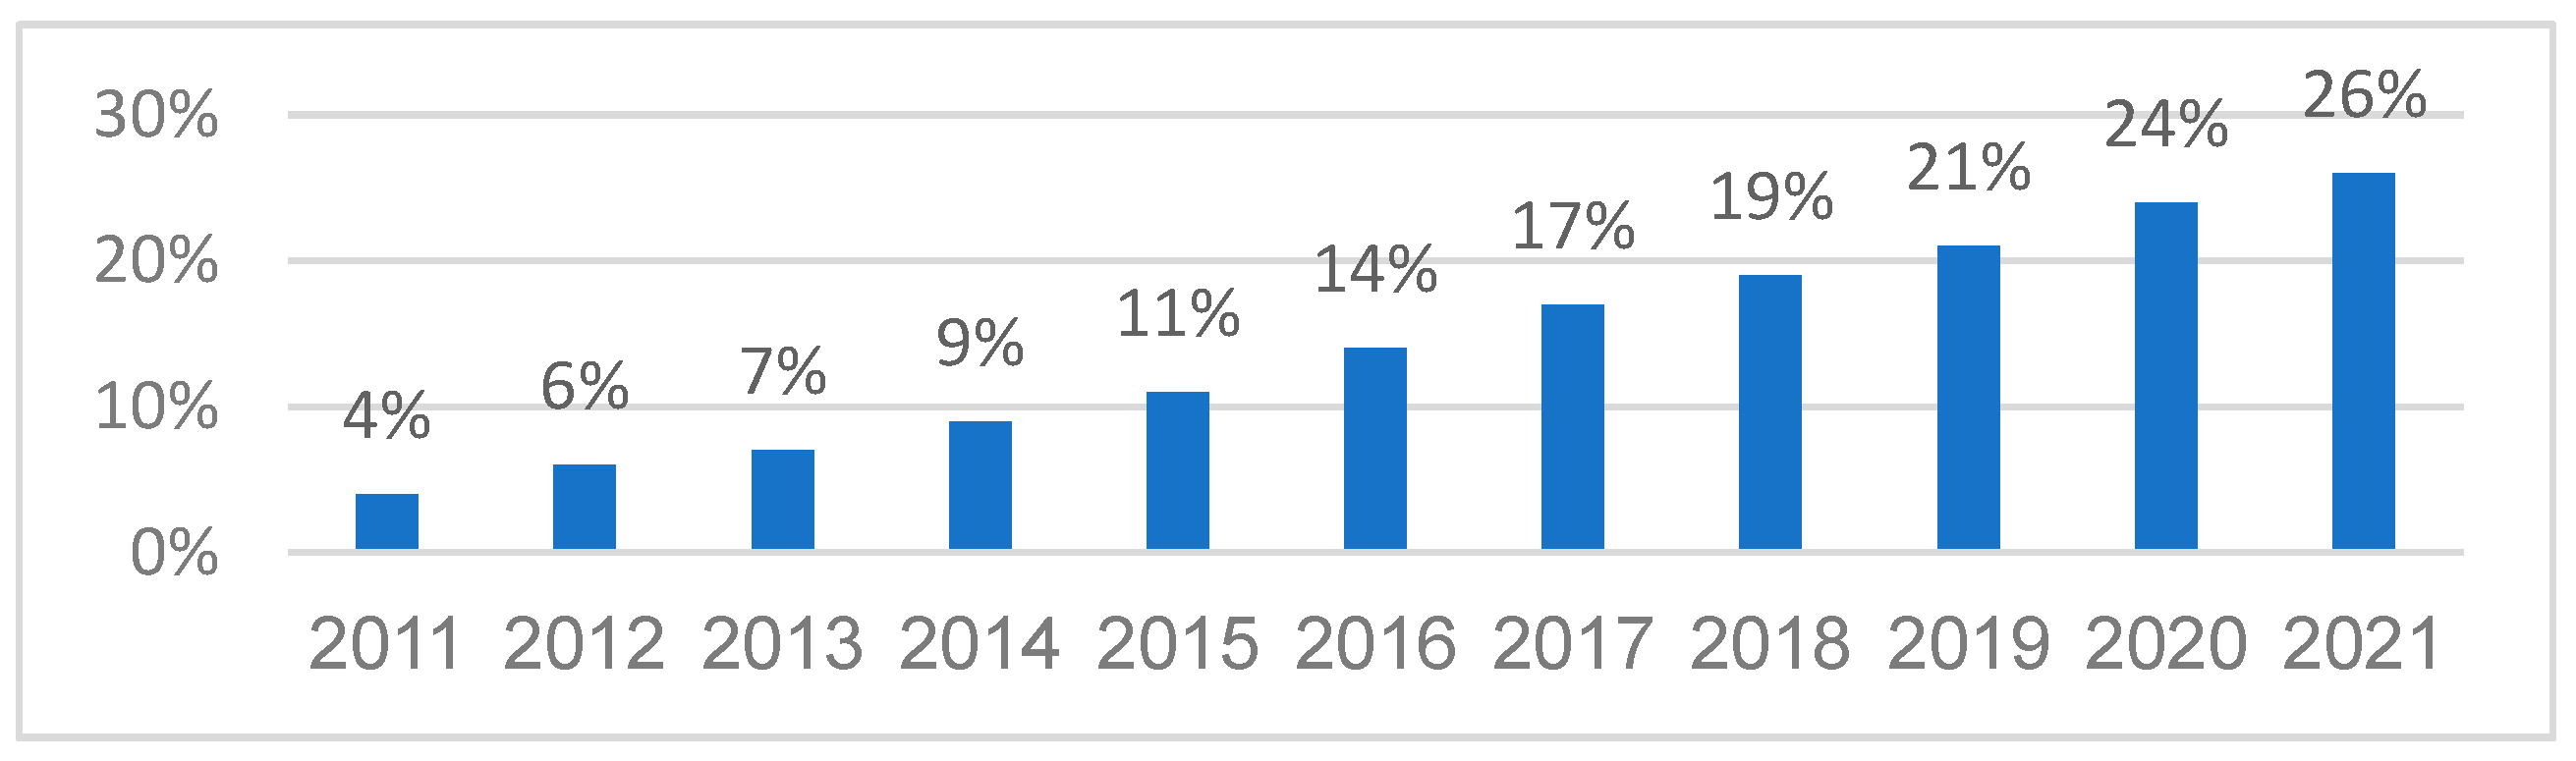
2. China’s Current Situation of New Energy Resources Development and Frequency Response Problem

At present, the power supply structure, power grid structure, and load structure of China’s power system have undergone significant changes. By the end of April 2022, the installed capacity of new energy resources is about 700 million kiloWatts, accounting for 29% of the total installed capacity of power generation in China. The installed capacity of wind power and photovoltaic are the largest in the world. China’s power system has become a large-scale AC/DC interconnected power system and it is estimated that 90% of the power will be used after power conversion in the future in China.
It can be seen from Figure 1 that the proportion of new energy installed capacity in China is growing at an average annual rate of 2.5%, reaching 26% by the end of 2021, which has profoundly changed the operating characteristics of traditional power systems. Over the years, a large number of power electronic devices have been used in the power grid which shows the characteristics of a high proportion of power electronic equipment, in addition, due to the existence of heat and power units in northern China, the power system operation is more complex in winter, it’s necessary to use distributed dispatch of integrated electricity-heat systems to control [21,22], which has led to the weakening of the inertia response and primary frequency modulation capability. For example, the Jinsu DC bipolar lockout accident occurred in East China Power Grid on 19 September 2015. Before the accident, the system load was 138 GW, the system frequency was 49.97 Hz, and the Jinsu DC power was 4.9 GW. There was a large power shortage in East China Power Grid after the accident. As a result, the system frequency dropped to 49.56 Hz at the lowest level after 12 s and recovered to 50 Hz after about 240 s by ACE (Area Control Erroraction) and emergency dispatching. By post-analysis, the accident was mainly due to the inertia response of the system being reduced, and the primary frequency regulation was not as good as expected. It is expected that multi-infeed DC and large-scale grid connection of new energy resources will lead to insufficient frequency response capability of the power system in China, so an evaluation index adapted to the system frequency response level for the safe operation of the power system is very necessary [23].

3. System Frequency Response Evaluation Index

In a power system, the governors and automatic frequency regulators are utilized to regulate the power output of generators and keep the balance between power generation and load side. Thus, the frequency of the power grid is close to the rated value under normal operation is ensured. When an accident occurs, such as big power loss, power system separation, and line tripping, the active power balance of the system is destroyed, and the system frequency drops or rises. The power system will be restored to a new balance by inertia response, primary frequency modulation, or secondary frequency modulation [24]. As shown in Figure 2, the time period from t 0 to t 1 is the system inertia response, from t d to t s is the primary frequency modulation, and after t s is the secondary frequency modulation.

3.1. Inertia Response Evaluation

Compared with primary frequency modulation, the inertia response is a short-time impulse power support, to delay the change of system frequency in a short time.
This paper analyzes the principle of system inertia response characteristics and the inertia response principles of various new energy resources, and the normal operating system becomes a rotating system. Then, taking the equivalent calculated inertia value and the equivalent inertia time constant as the evaluation indexes of the inertia response evaluation system is proposed, and two indicators’ calculation formulas are derived.

3.1.1. The Equivalence Inertia of the New Energy Resources

The Inertia Response of the Synchronous Generators

Most of the traditional thermal power and hydropower plants are synchronous generators, which have a fast inertia response and high reliability. The inertia time constant of synchronous generators usually falls within the range of 2–9 s, which depends on the size, rated power, and type of machines [25].
A single synchronous rotor kinetic energy E k g calculation formula:
E k g = 1 2 J g w r 2 = 1 2 p g J g w c 2
where, J g is the inertia of the generator, p g is the pole number of the generator, w r is the mechanical angular velocity, w c is the synchronous electrical angular velocity.

The Inertia Response of the Wind Turbine Generators

Wind turbine generators are different from synchronous generators, which use the real-time disconnection of power electronic switching devices to control. The switching frequency of wind turbine generators’ switching devices is generally in kilohertz, which is much faster than the dynamics of wind turbine rotor components in time scale, and its control logic is independent of the frequency change in the system. When in case of disturbance and fault, the wind turbine generators will give priority to protecting the units themselves. Then, the wind turbines added a virtual inertial control module to make full use of the dynamic energies [26,27].
The rotor kinetic energy of a single wind turbine generator E k w calculation formula:
E k w = 1 2 p 2 J v w w w 2
where J v w is the virtual inertia of the wind turbine generator, w w is the mechanical angular velocity of the wind turbine generator.

The Inertia Response of the Photovoltaic Power Stations

Photovoltaic power generation devices do not have any rotating parts that can be used as energy buffers to provide inertia to the system, which requires other forms of energy to provide inertia, such as batteries or supercapacitors [18,28].
  • Supercapacitor
In the process of system disturbance, the supercapacitor can quickly adjust the power variation of the system by absorbing or releasing active power. If the available energy of the supercapacitor is equal to the rotational kinetic energy of the synchronous generator at the rated speed, and its remaining margin is similar to the difference between the rotational kinetic energy at the maximum speed and at a rated speed of the synchronous generator, then the supercapacitor can be equivalent to a synchronous generator [29,30].
ρ c = Q N C d u c Q N = Q r Q N
E c = C u c d u c = u c Q c d ( 1 ρ c )
J c w c d w c = u c Q c d ( 1 ρ c ) = u c Q c d ( 1 ρ c ) w c d w c w c d w c
where Q N is the rated charge capacity of the supercapacitor, Q r is the residual charge after discharge, C is the capacitance of the supercapacitor, u c is the real-time voltage of the supercapacitor, E c is the energy stored in the supercapacitor.
It can take supercapacitor energy storage to equate to synchronous generator rotor energy storage, then the energy stored in the supercapacitor is equivalent to the energy of the equivalent synchronous machine. Then the equivalent moment of inertia of the supercapacitor can be expressed as:
J c = u c Q c d ( 1 ρ c ) w c d w c = J g W c d ρ c / ρ c 0 2 E k d w c / w c J g W c k x 2 E k
k = ( Δ ρ c / ρ c 0 ) / ( Δ w c / w 0 )
where J g is the inertia of the synchronous generator, ρ c 0 is the initial charge capacity of the supercapacitor, k is the ratio of charge state change rate of the supercapacitor to generator speed change rate, Δ w c is the equivalent rotational angular velocity variation, w 0 is the initial angular velocity, Δ ρ c is the charge variation of the supercapacitor, W c is the energy stored in a supercapacitor, E k is rotor kinetic energy of the equivalent generator.
b.
Battery
The battery is different from the supercapacitor, frequent charging and discharging will cause battery performance degradation, and the cost of a large-scale battery is high, Therefore, it is applicable to the compensation device used as the compensation capacitor for energy storage [31]. The expression of battery is similar to a capacitor, which can be expressed as:
ρ b = ( Q N i b d t ) Q N = Q r Q N
E b = i b u b d t = u b Q b d ( 1 ρ b )
J b w b d w b = u b Q b d ( 1 ρ b ) = u b Q b d ( 1 ρ b ) w b d w b w b d w b
where, i b is the battery current, Q N is the rated charge capacity of the storage battery, Q r is the battery residual charge, u b is the battery voltage.
J b = u b Q b d ( 1 ρ b ) w b d w b = J g W b d ρ b / ρ b 0 2 E k d w b / w b J g W b k b 2 E k
k = ( Δ ρ b / ρ b 0 ) / ( Δ w b / w 0 )
where ρ b 0 is the initial charge capacity of the battery; k b is the ratio of the charge state change rate of the battery to the generator speed change rate; Δ ρ b is the charge change of the battery; W b is the energy stored in the battery.

3.1.2. The Equivalent Inertia Time Constant of the System

According to the above formula derivation, it is proved that the power system with a new energy grid connected can be equivalent to a rotating system, then the expression of the equivalent calculated inertia value T of the system can be derived from the rolling equation.
T = W k = E k = Δ P × f n 2 ( d f a / d t )
where Δ P is the system power disturbance, f n is the rated frequency, d f a / d t is the system frequency change rate. The equivalent calculated inertia value can be calculated by Δ P hand d f a / d t .
The equivalent inertia time constant of the system can represent the inertia response level of the system. The equivalent system energy E k is the sum of the kinetic energies of the synchronous generator, wind turbine, and the equivalent kinetic energy of the photovoltaic system and other components.
The expression of system inertia time constant H t o t is:
H t o t = E k S = i = 1 n E k g i + l = 1 m E k w l + h = 1 q E k c h + y = 1 z E k b y i = 1 n S k g i + l = 1 m S k w l + h = 1 q S k c h + y = 1 z S k b y
where E k g is the rotor kinetic energy of synchronous generators, E k w is the kinetic energy of wind turbines, E k c is the equivalent kinetic energy of supercapacitors, E k b is the equivalent kinetic energy of the batteries, S is the total rated capacity of the power supply.
H t o t = T S = E k S
It shows that the equivalent inertia time constant of the system H t o t can be obtained by an equivalent calculation of the inertia value T .

3.2. The Primary Frequency Modulation Evaluation

Primary frequency modulation is one of the dynamic means to ensure the balance of active power in the power grid, mainly for the short-term random load. In the past, the primary frequency regulation capability is described by the equivalent regulation rate under static concept and frequency characteristic coefficient of load. However, this description method cannot reflect the influence of the type of generators and the dynamic characteristics of inertia time constant.
The key parameters include the dead band of frequency modulation, the speed inequality, retardation rate, the maximum amplitude limitation of load adjustment, the time requirements of response behavior, and so on, which can affect the primary frequency regulation performance, the most important parameters are frequency modulation dead band and speed inequality [32].

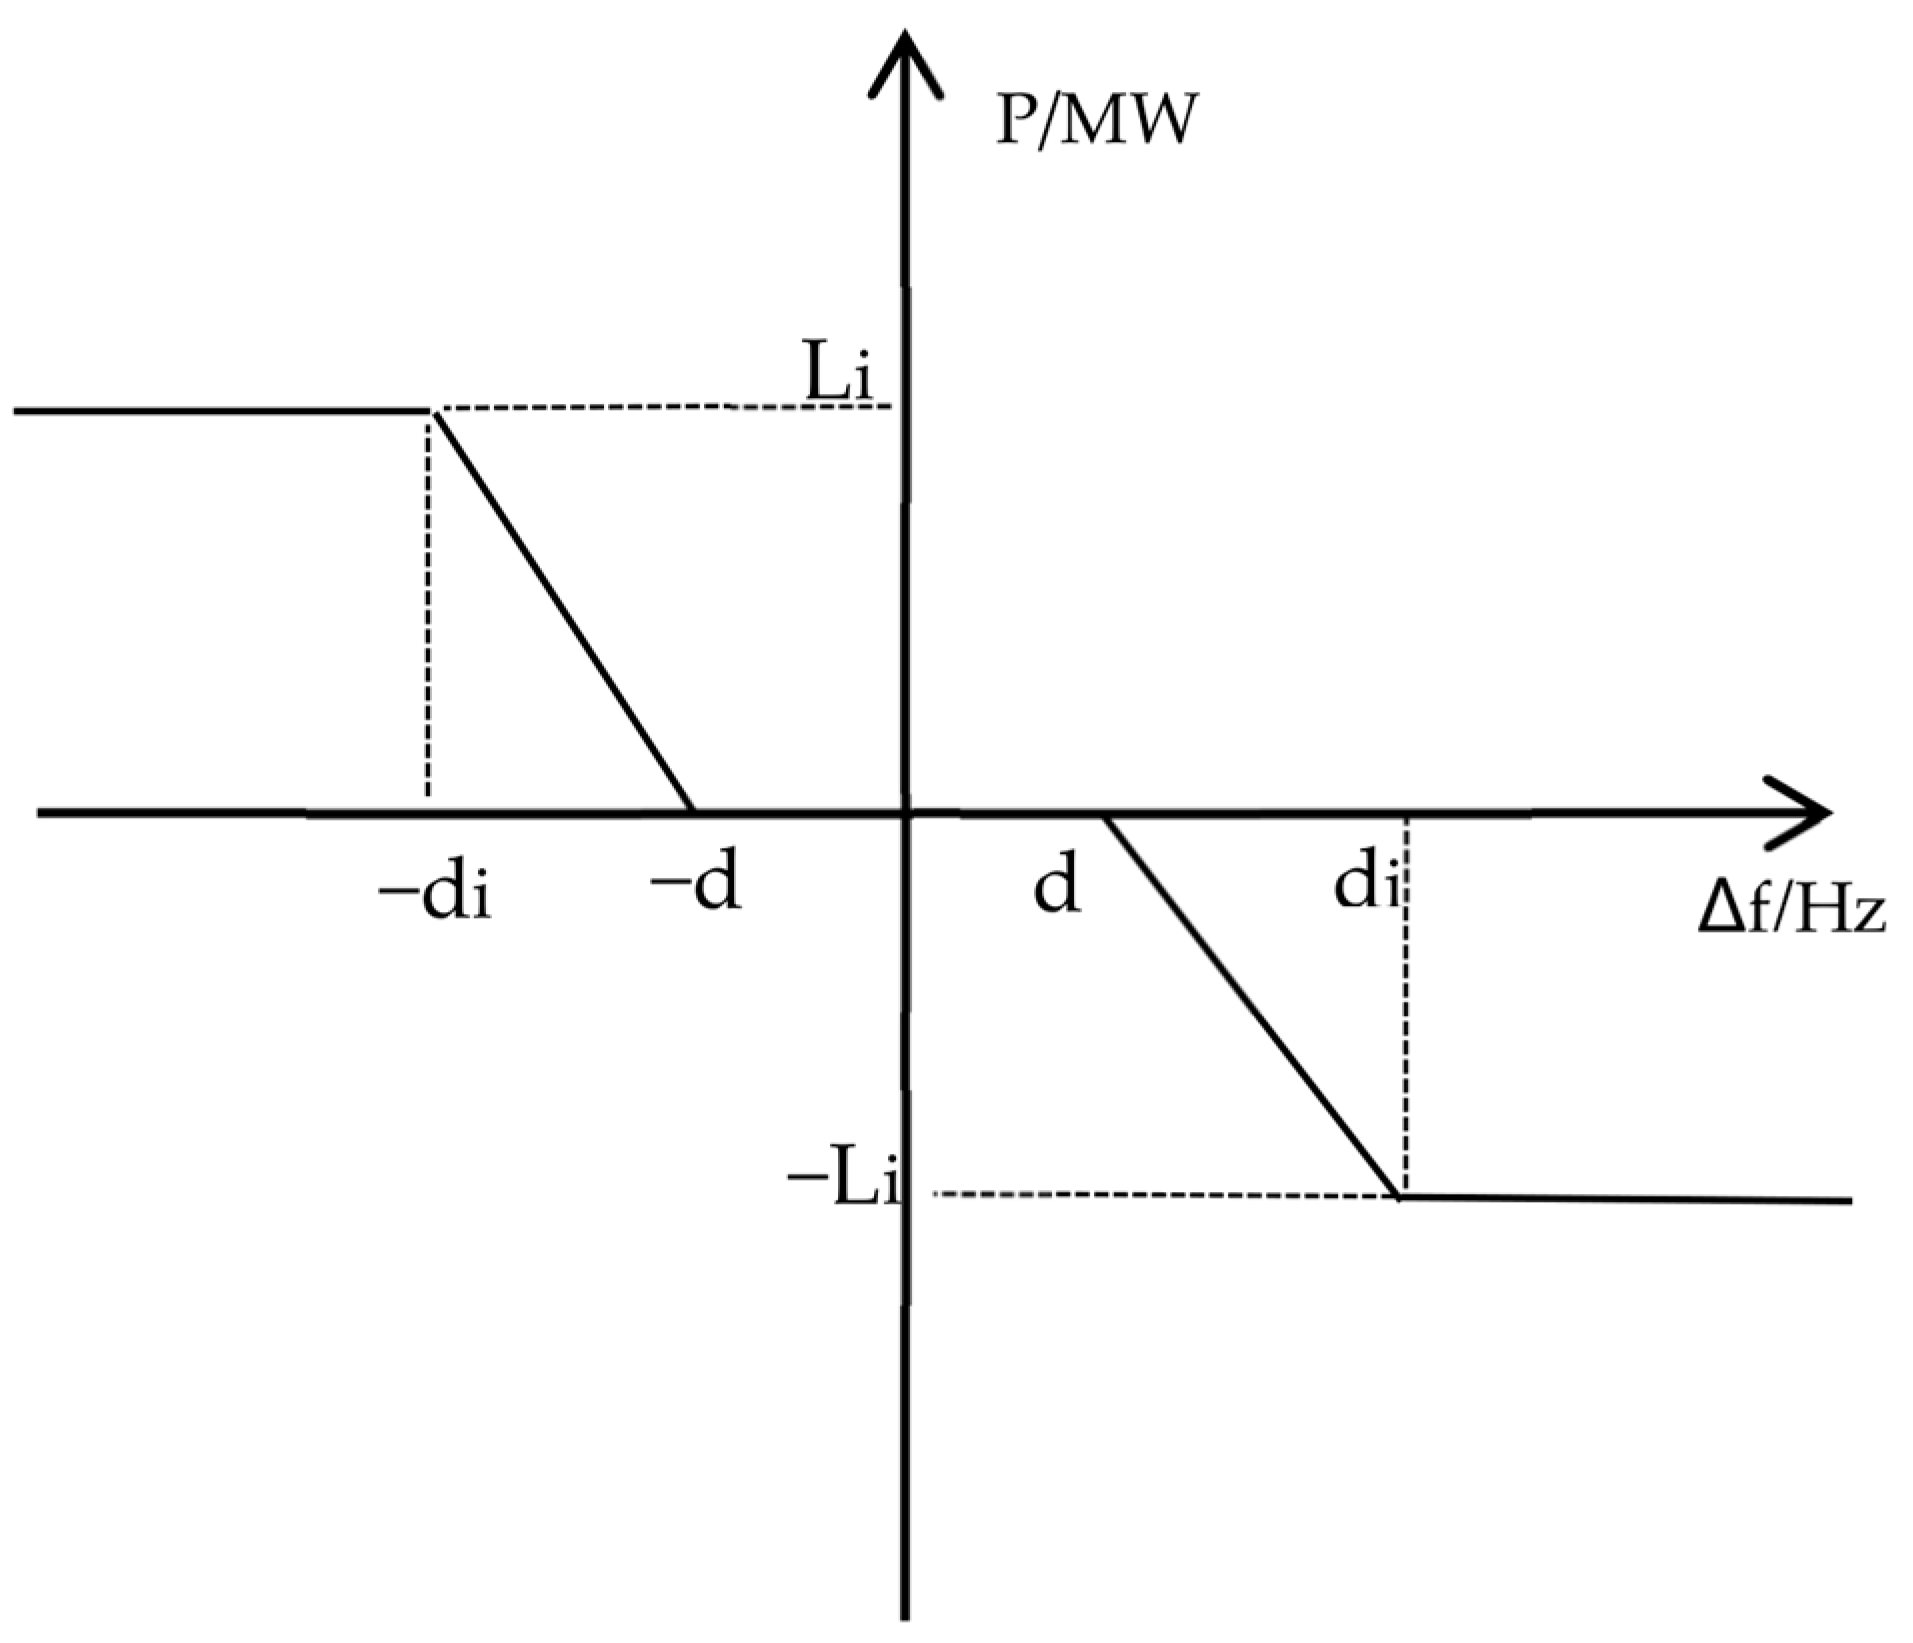
3.2.1. The Dead Band of Frequency Modulation

Figure 3 shows the characteristics of the dead band of frequency modulation, setting the time domain input signal Δ f ( t ) , and time domain output as Δ P ( t ) [17].
Δ P ( t ) = sgn ( Δ f ( t ) ) 1 δ i [ | Δ f ( t ) | d ] ε ( | Δ f ( t ) | d ) + sgn ( Δ f ( t ) ) 1 δ i [ | Δ f ( t ) | ( d + δ i L i ) ] ε ( | Δ f ( t ) | ( d + δ i L i ) )
where d is the dead band of frequency modulation, L i is the maximum limiting of primary frequency response. Derive the formula to the frequency domain, set the time domain input signal as Δ f ( s ) , time domain output as Δ P ( s ) , and the transfer function as H ( s ) .
Δ P ( s ) = H ( s ) Δ f ( s )

3.2.2. The Mathematical Model of Primary Frequency Modulation

Figure 4 shows the mathematical model of primary frequency regulation with m generators running in parallel. Firstly, the change in system load causes the change in system frequency, the control system collects frequency variation Δ f from the real-time data acquisition system, which is inputted to the control system as an input signal. Secondly, because the secondary frequency modulation is not considered (R = 0), so the signal is directly entered into the dead zone control link, if the signal exceeds the maximum limiting of primary frequency response, the system will get preliminary power variation from the output of dead zone control link. Thirdly, the preliminary power variation is entered into the transfer function link which includes the integral link, differential link, amplification factor, etc., the system will get the output variation of each unit. Fourthly, the sum of the output variation of each unit P T add load change Δ P L are entered into the load response link, then the system frequency variation is obtained. With the cycle control carried out continuously, the power system can maintain frequency stability.
Where, R is the setting value of secondary frequency modulation, α i is the ratio of the installed capacity of the ith unit to the installed capacity of the power system, δ i is the inequality rate of the ith unit, G i ( s ) is the transfer function of the ith unit, β is the frequency characteristic coefficient of load, Δ P L is the per unit value of grid load change, Δ f is per unit value of frequency change, T a i is the rotor time constant of the ith turbine. The weighted average of the rotor time constant of each turbine in the power grid is the inertia time constant T a of the power grid.

3.2.3. The Primary Frequency Modulation Index

In fact, the primary frequency regulation of the actual power network is a dynamic and random process, and the power grid cycle is a random variable that changed with time and has different frequency components. The paper uses Paseval’s theorem [33] to define the dynamic index of primary frequency modulation as the ratio of energy of frequency variation W Δ f to energy of power variation W Δ p .
R P F C A = W Δ p W Δ f = + Δ P ( t ) 2 d t + Δ f ( t ) 2 d t = + | Δ P ( s ) | 2 d s + | Δ f ( s ) | 2 d s
According to the above, the relationship between the system frequency variation and the power variation in the frequency domain is as follows:
Δ f ( s ) = Δ P L ( s ) i = 1 M H i ( s ) α i δ i G i ( s ) + T a Σ s + β
Take Formula (19) into Formula (18) for derivation:
R P F C A = + | Δ P L ( s ) | 2 d s + | Δ P L ( s ) i = 1 M H i ( s ) α i δ i G i ( s ) + T a Σ s + β | 2 d s
Formula (20) describes the dynamic characteristics of the primary frequency modulation with the dead zone d of the frequency modulation, the inertia time constant T a i , the unequal rate of speed δ i , and the dynamic delay G i ( j w ) in the process of primary frequency modulation. It shows that when the frequency deviation caused by load disturbance is within the dead zone, the primary frequency regulation of the generator will not act, and the frequency change will be prevented by the effect of load frequency regulation. When inertial regulation is at the initial stage of primary frequency modulation, the system uses the energy stored in the rotor and loads electromagnetic fields to prevent frequency changes.
For a defined grid, the inertia time constant T a i , the proportion of each unit α i , the unequal rate of speed δ i , the dead zone d is known, and the dynamic delay G i ( j w ) , the frequency characteristic coefficient β can be obtained by parameter identification and load modeling, respectively, and Δ P L ( s ) can be obtained by load characteristic modeling, such as decomposing the load in the whole time domain and frequency domain by Fourier decomposition method, then dividing the load into periodic components and random components [34].
Δ P ( t ) = P ( t t 0 ) = a + D ( t t 0 ) + W ( t t 0 ) + L ( t t 0 ) + H ( t t 0 )
where, a + D ( t ) is the daily cycle component of the load, W ( t ) is the week cycle component of the load, L ( t ) is the low-frequency component, which can reflect meteorological factors, H ( t ) is the high-frequency component, which can reflect random load factors.
So far, the primary frequency regulation index formula of a certain power grid can be obtained.

4. Case Analysis

In order to prove the feasibility of the system frequency response evaluation system, the actual operation data of a regional power grid in China are used to carry on the analysis and verification.
The system frequency and frequency change rate data of the regional power grid in China are collected through the PMU system (Phasor Measurement Unit) and SCADA (Supervisory Control and Data Acquisition) system. through which, the system frequency dynamic characteristics and determine the system inertia response and primary frequency modulation capability are analyzed.

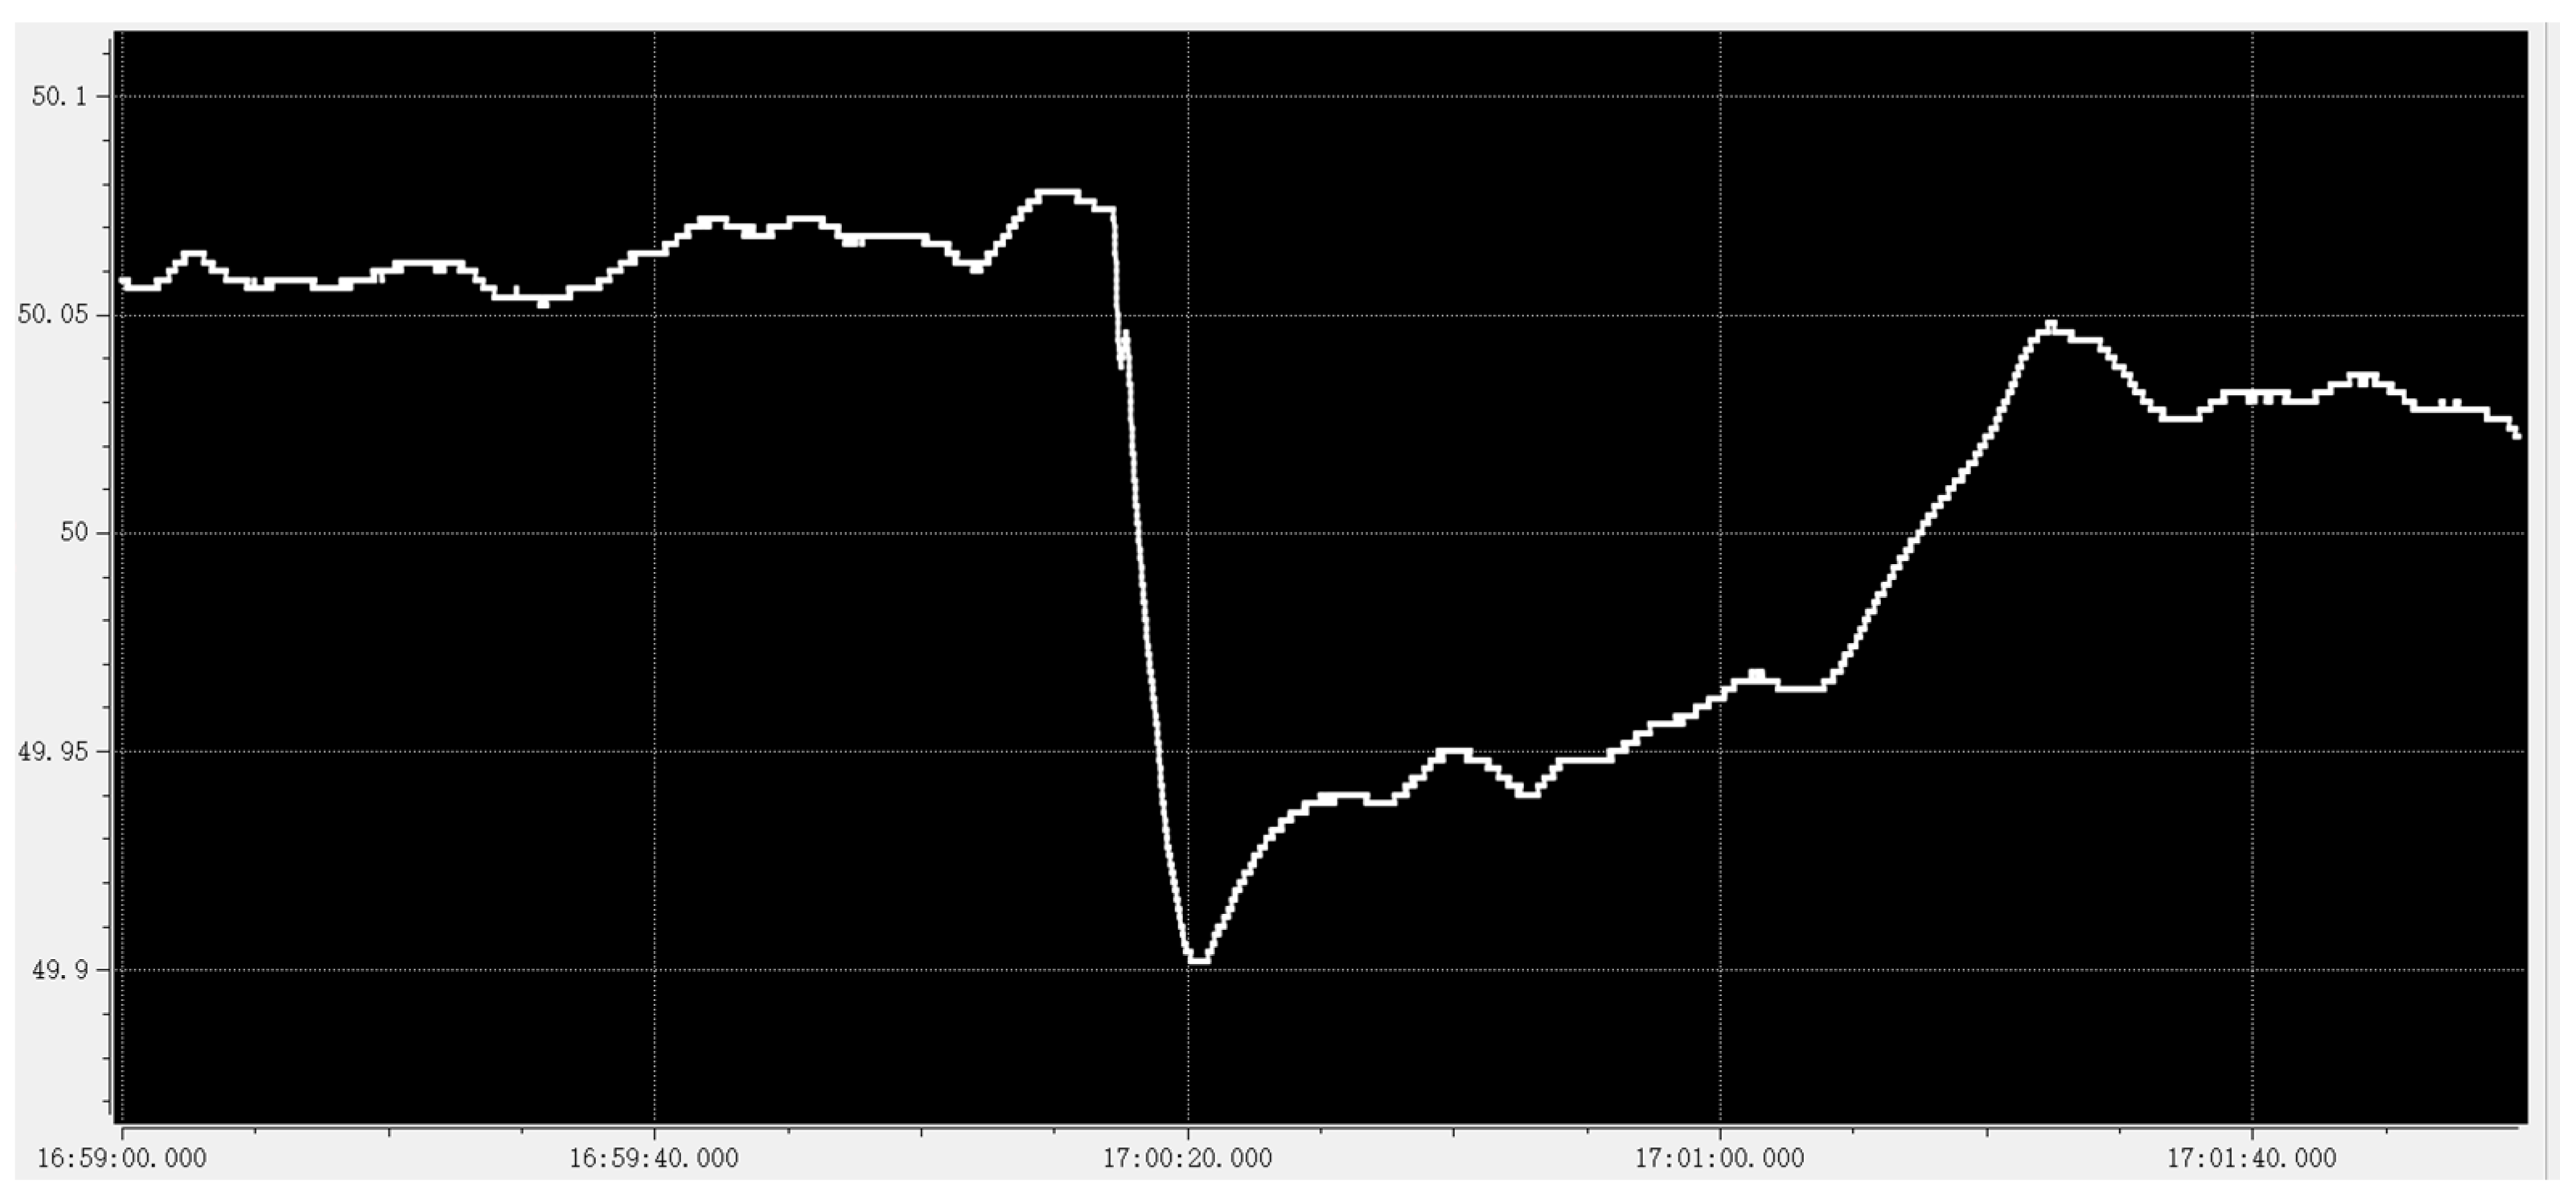
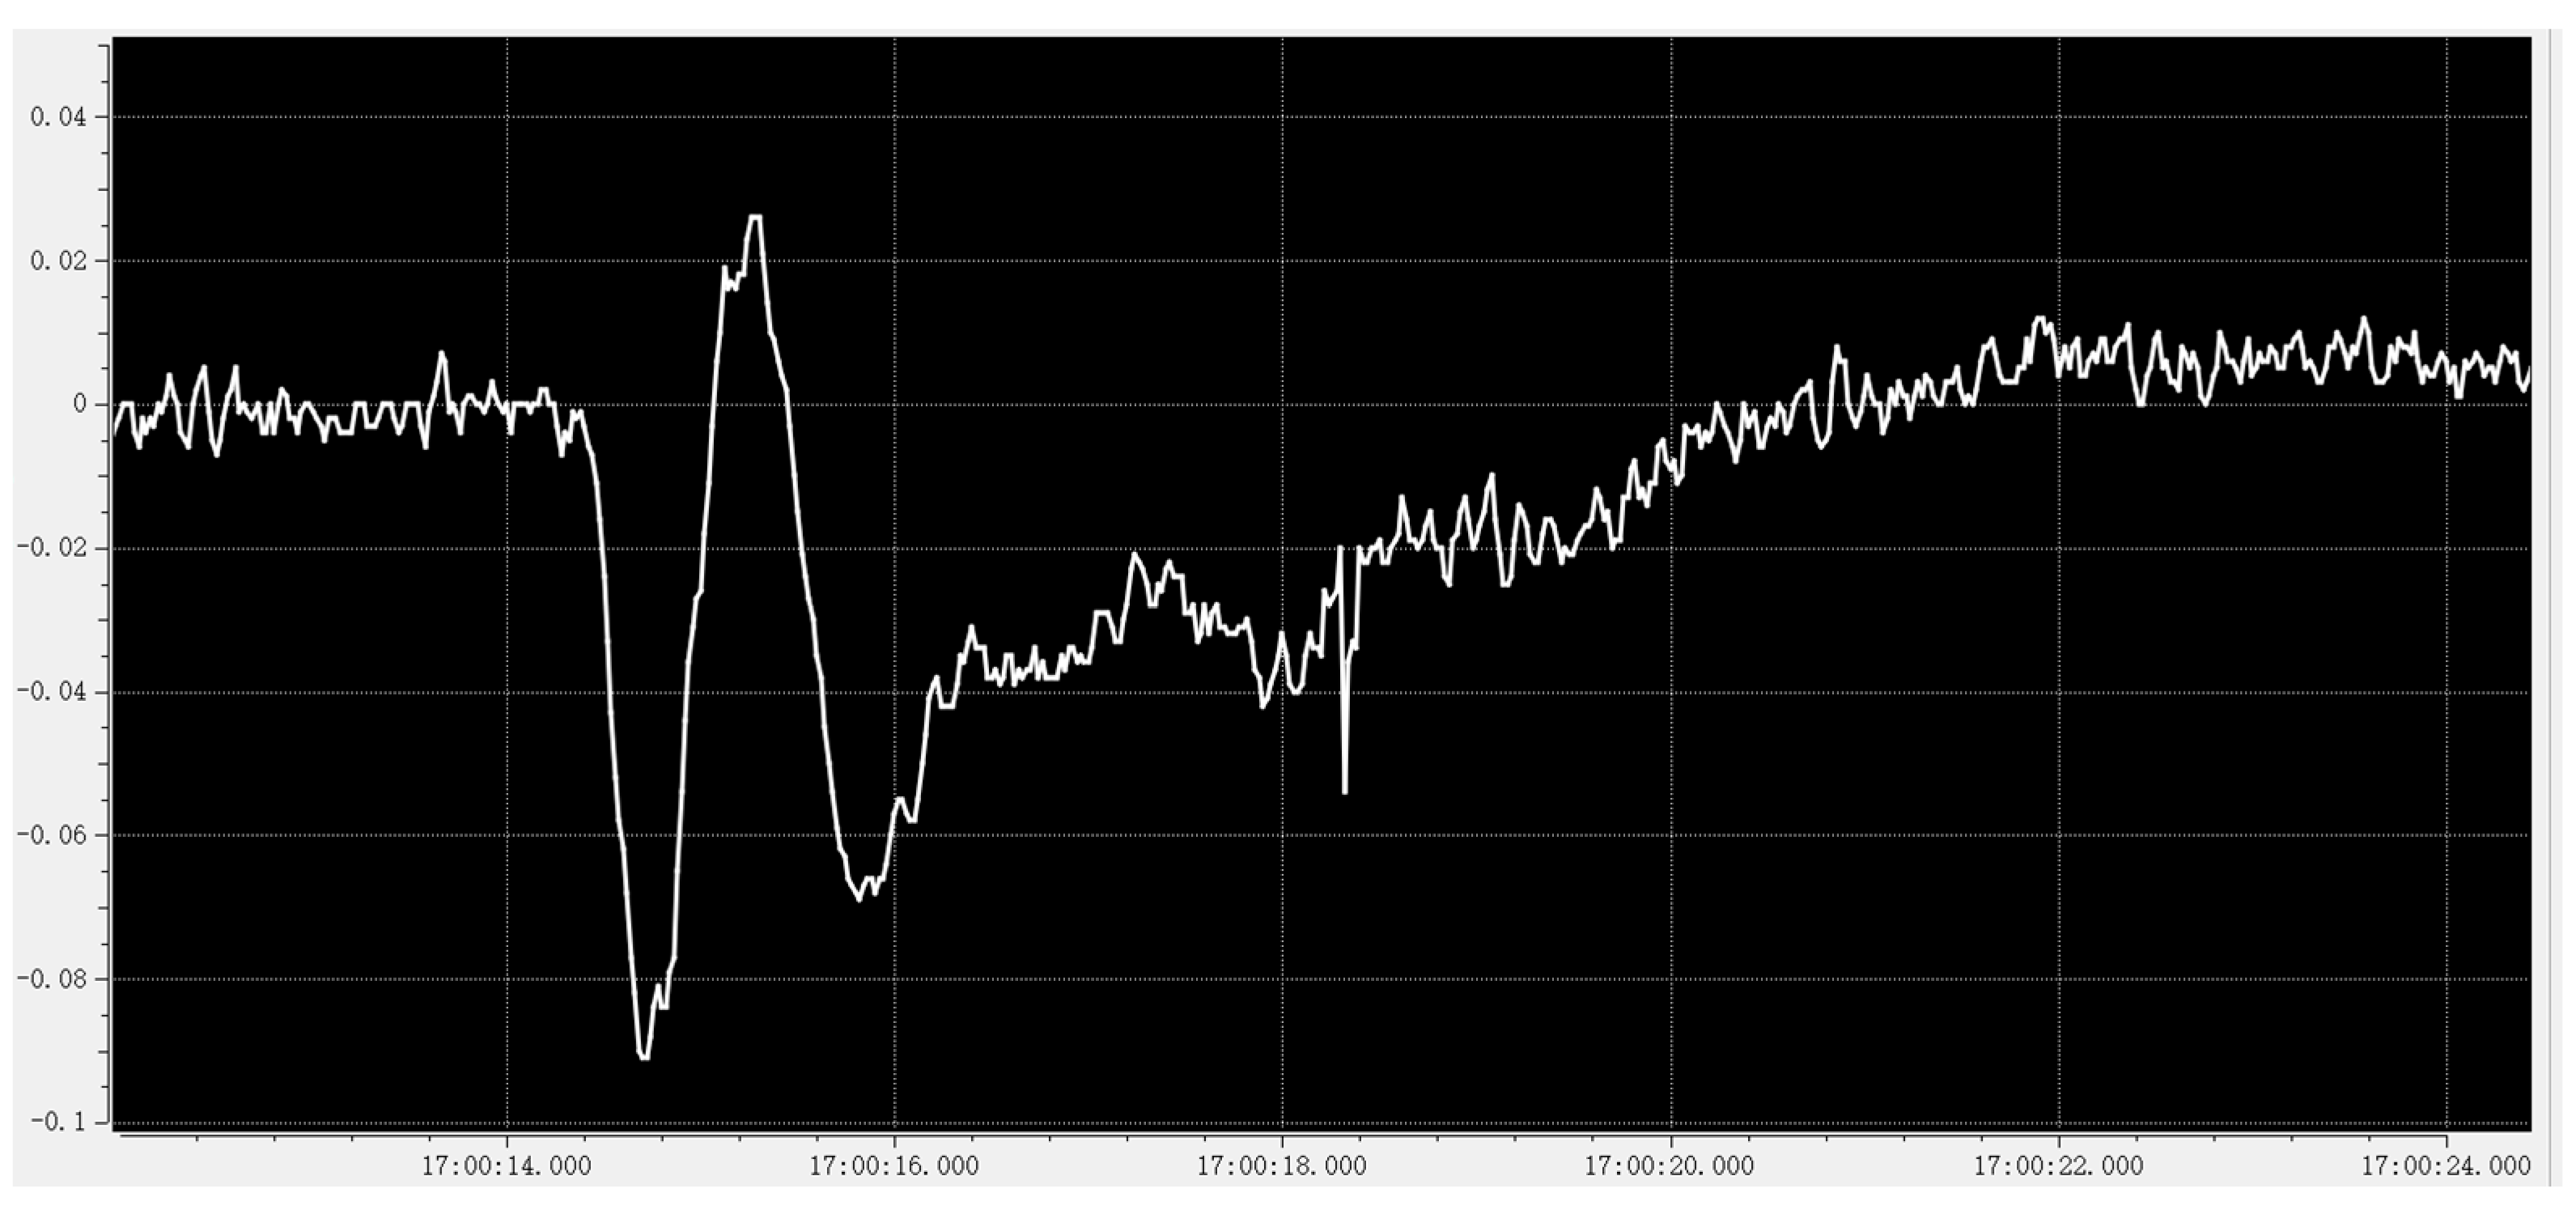
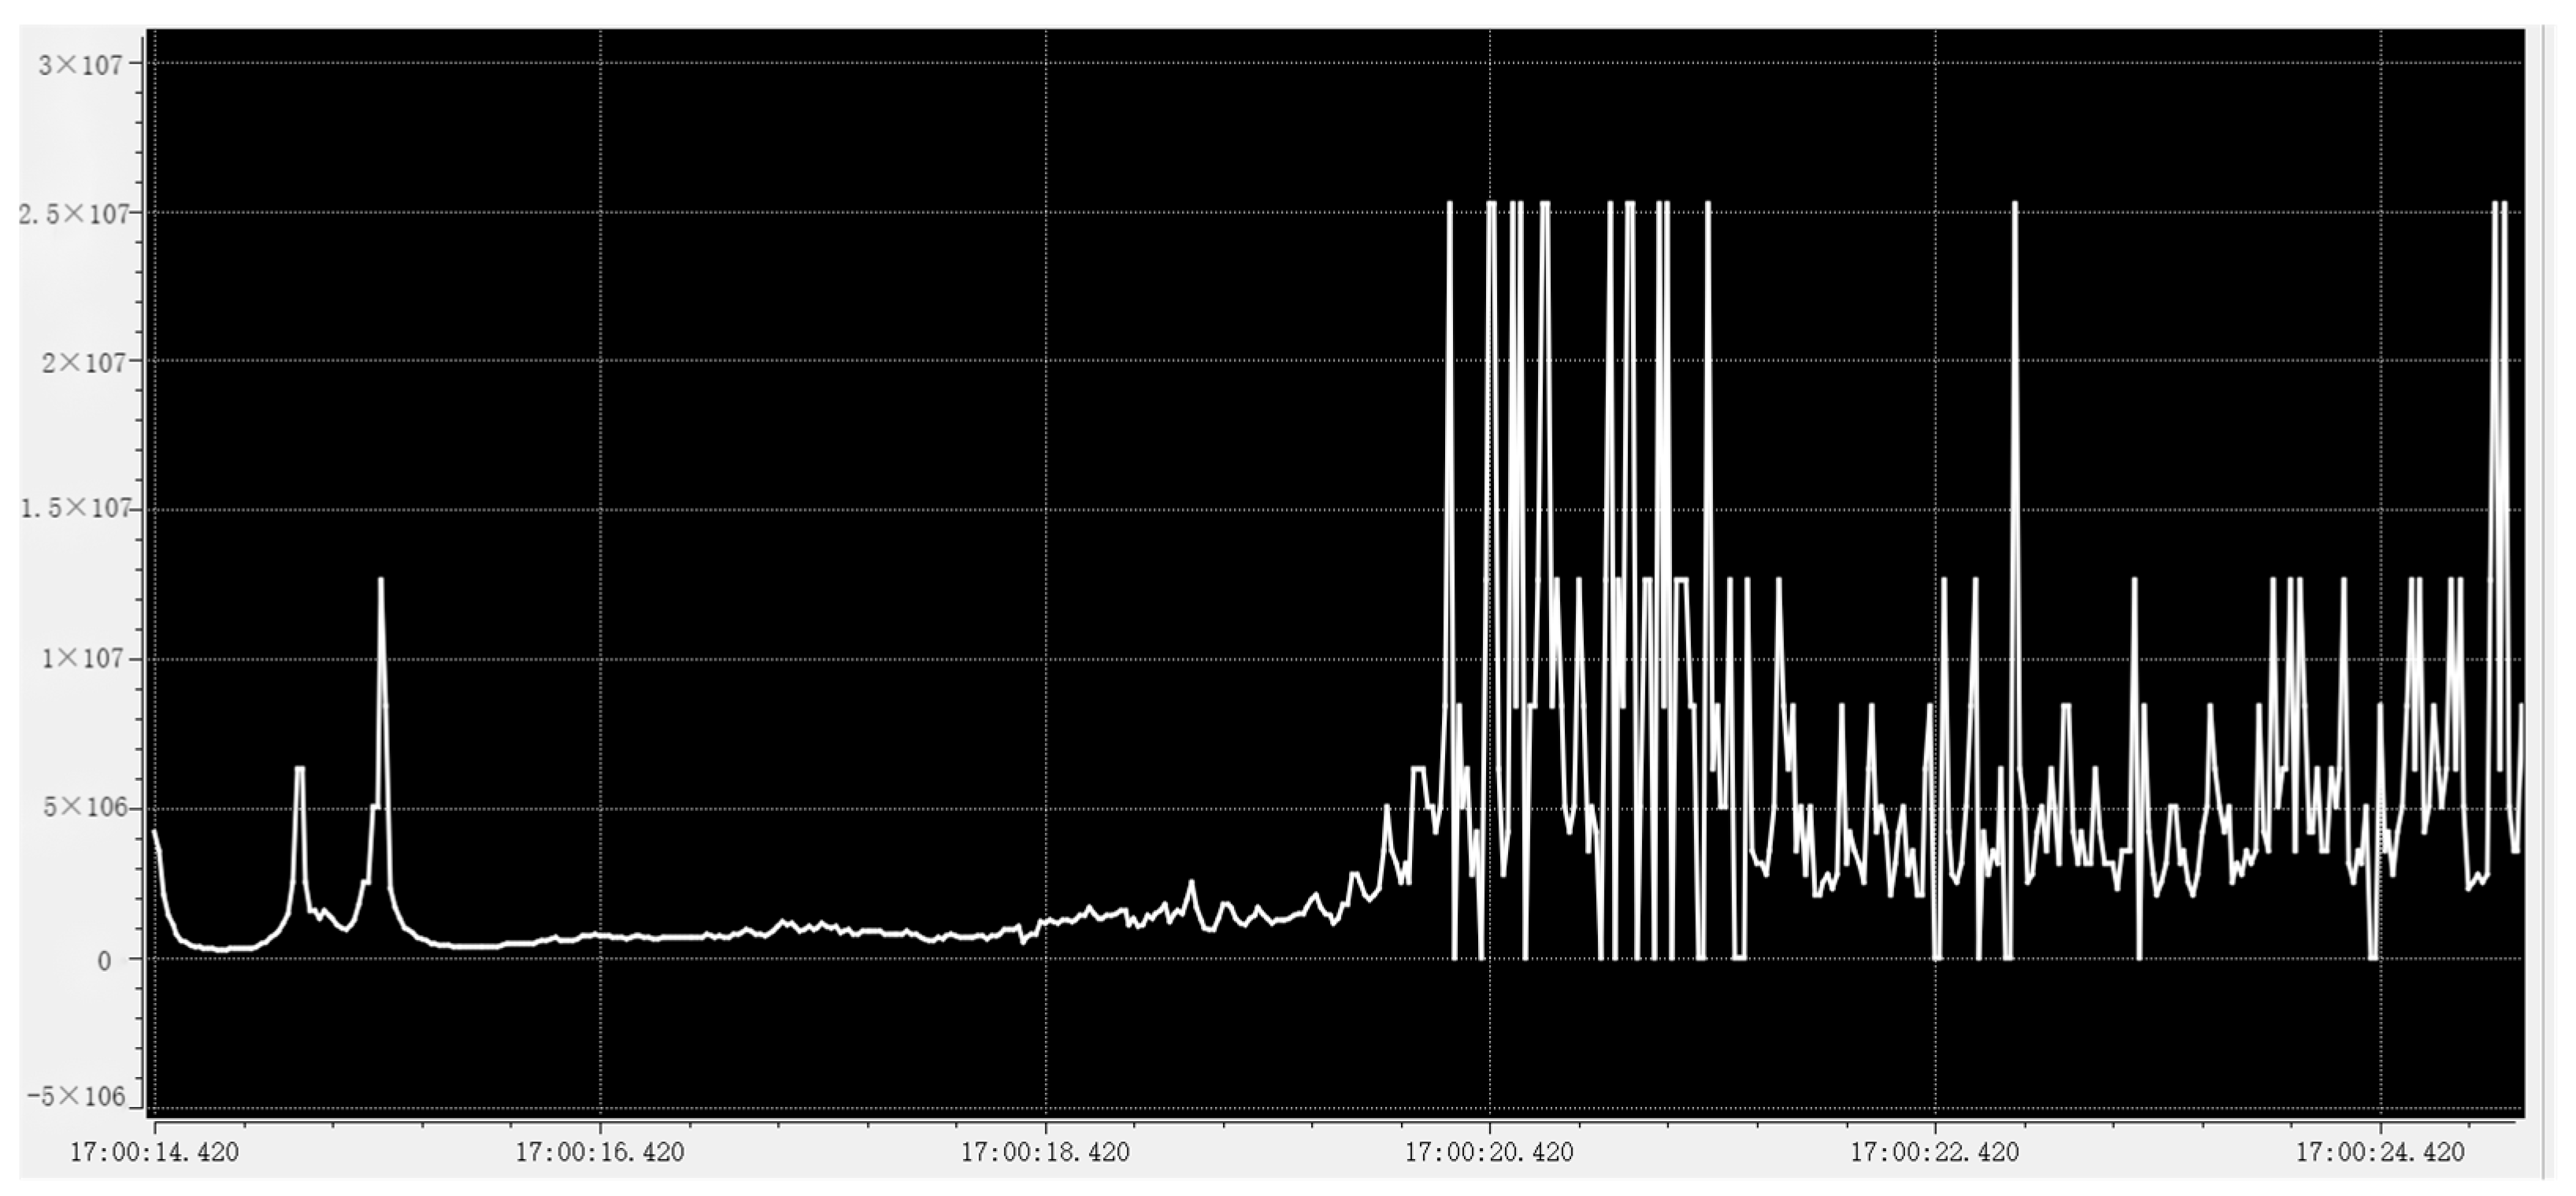
4.1. The Inertia Response Index Calculation

The condition of the regional power grid before the testing:
The grid power generation output is about 55 million kiloWatts. The new energy power generation output accounts for 20.29% of the total power generation output. The transmission power of the ultra HVDC system in the regional power grid is shown in Table 1, and the power between the power supply and load side is in balance.
Then the low-frequency disturbance is tested and about 1.01 million kiloWatts of power supply is cut off. The frequency and frequency change rate data curves collected by the PMU system and SCADA system are shown in Figure 5 and Figure 6.
It can be seen from Figure 5 and Figure 6 that the initial value of the grid frequency is 50.07 Hz, the corresponding time is 14.42 s, the minimum value of the frequency is 49.9 Hz, and the corresponding time is 20.28 s. The frequency takes about 6 s to drop from the initial value to the minimum value. The maximum frequency change is 0.17 Hz, and the extreme value of the frequency change rate is 0.09 Hz/s.
The equivalent inertia curve of a regional power grid is shown in Figure 7 by formula calculation.
Next, the curve data of the system inertia supporting phase are found, and the average value as the result of system inertia evaluation is calculated. Then the equivalent calculated inertia value of the regional power grid which is 665,000 MW·s and the equivalent inertia time constant of the system is 14 s are achieved.

4.2. The Dynamic Index of System Primary Frequency Modulation

According to the dynamic evaluation index of primary frequency modulation of the power system established above, the actual operation data of the regional power grid is taken as an example to verify.
As shown in Table 2, the paper selects the operation data of the power grid at different total power generation output and different proportion of new energy and calculate the primary frequency modulation index of the system under different operating conditions by the calculation formula proposed previously.
By analyzing the data in Table 2, the following conclusions can be drawn:
(1) The system index is mainly related to the regional load level, synchronous generator output, new energy output, and ultra-high voltage direct current (UHVDC) power transmission, and there is a nonlinear relationship between the system index and them. (2) Among all the influencing factors, the largest one is the output of a synchronous generator, and the next one is the load level, such as No. 3 and No. 4 operation data. Although the load level of No. 4 operation data is higher, the output of the synchronous generator of No. 4 operation data is smaller, then the index of No. 4 operation data is smaller. However, the increase in load level alleviates the reduction of the index. (3) The transmission power of UHVDC will affect the power supply size in the region, if only consider the disturbance causing the inertia response and primary frequency modulation action and the new energy output is fixed, the larger the UHVDC transmission capacity is, the greater the synchronous machine output is, then the better the index is, and the stronger the disturbance resistance is.
The main reason for the above phenomena is that in China, there is no requirements for new energy primary frequency modulation in the past, thus the primary frequency regulation capacity of the new energy that has been put into operation is insufficient. In recent years, the proportion of new energy output has increased year by year and large-scale new energy generators have been connected to the power grid. Now the proportion of the maximum output of new energy in the regional power grid has reached 50% and the operating characteristics of the power grid have changed. It is very important to put forward specific requirements for new energy primary frequency modulation capability.
Thus in 2018, the China National Energy Administration issued industry standards “Technical specification for power grid and source coordination” (DL/T1870-2018), and in 2021, the Chinese government issued national standards “Guide for technology and test on primary frequency control of grid-connected power resource” (GB/T40595-2021), which has projected clear requirements for primary frequency regulation of grid-connected power resource. However, the primary frequency regulation capacity of the new energy that has been put into operation is insufficient that needs time for technical transformation. At the same time, compared with thermal power units, new energy generators have the lower anti-interference capability, such as low voltage ride through capability and high voltage ride through capability, and are more susceptible to system disturbance. These will result in new energy generations’ trip-off, which may seriously cause the local inrush flow and frequency fluctuation. What is worse, with the faulted power grids getting worse, international blackouts will occur.
As a result, the primary frequency modulation index in the regional power grid is affected by the proportion of new energy power generation and the output of synchronous generators.

5. Summary

This paper analyzes the development status and problems of new power energy in China and the operation principles and control modes of traditional synchronous units, wind power, photovoltaic, etc., are also analyzed. The process and principle of power grid frequency response propose the evaluation index of frequency response capability is studied including the inertia response indicator and primary frequency modulation dynamic indicator. To verify the feasibility of the method, this paper utilizes the actual power grid operation data through the PMU and SCADA system of a regional power grid in China and the evaluation index of frequency response capability of the regional power grid under different operating conditions is calculated. The reason why the dynamic index of primary frequency modulation is related to the output of synchronous machines and the proportion of new energy output is analyzed. In addition, this paper points out that the region’s power grid needs to carry out the transformation of the primary frequency regulation system of new energy units as soon as possible according to the requirements of the national standard. Otherwise, after more DC and new energy units are connected to the power grid in the future, it is easy to cause fault expansion, which will affect social production and life and cause economic losses. Next, we will continue to conduct research on the index of system frequency response capability and carry out the application in different regional power grids.

Author Contributions

Conceptualization, C.C.; Methodology, C.C.; Software, C.C.; Formal analysis, H.Z.; Investigation, J.H.; Resources, H.Z. and J.H.; Data curation, C.C. and H.Z.; Writing—original draft, C.C.; Writing—review & editing, C.C.; Supervision, H.Z. and J.H.; Funding acquisition, C.C. All authors have read and agreed to the published version of the manuscript.

Funding

This research was funded by general project of State Grid Corporation of China, grant number 5100-202205277A-2-0-XG.

Conflicts of Interest

The authors declare no conflict of interest.

References

  1. Groß, D.; Dörfler, F. On the steady-state behavior of low-inertia power systems. In Proceedings of the 20th World Congress of the InternationalFederation-of-Automatic-Control (IFAC), Toulouse, France, 9–14 July 2017. [Google Scholar]
  2. Wind Energy in Europe: Scenarios for 2030; Wind Europe: Brussels, Belgium, 2017.
  3. Zhang, S.J.; Wei, J.; Chen, X.; Zhao, Y.H. China in global wind power development: Role, status and impact. Renew. Sustain. Energy Rev. 2020, 127, 109881. [Google Scholar] [CrossRef]
  4. Chen, B.; Zhang, H.; Li, W.; Du, H.; Huang, H.; Wu, Y.; Liu, S. Research on provincial carbon quota allocation under the background of carbon neutralization. Energy Rep. 2022, 8, 903–915. [Google Scholar] [CrossRef]
  5. Fernández-Guillamóna, A.; Gómez-Lázaro, E.; Muljadi, E.; Molina-García, Á. Power systems with high renewable energy sources: A review of inertia and frequency control strategies over time. Renew. Sustain. Energy Rev. 2019, 13, 1584–1591. [Google Scholar] [CrossRef] [Green Version]
  6. Li, H.; Ju, P.; Gan, C.; You, S.; Wu, F.; Liu, Y. Analytic Analysis for Dynamic System Frequency in Power Systems Under Uncertain Variability. IEEE Trans. Power Syst. 2018, 34, 982–993. [Google Scholar] [CrossRef]
  7. Lim, S.; Choi, D.; Lee, S.H.; Kang, C.Q.; Park, J.W. Frequency Stability Enhancement of Low-Inertia Large-Scale Power System Based on Grey Wolf Optimization. IEEE Access 2022, 10, 11657–11668. [Google Scholar] [CrossRef]
  8. Arraño-Vargas, F.; Shen, Z.; Jiang, S.; Fletcher, J.; Konstantinou, G. Challenges and Mitigation Measures in Power Systems with High Share of Renewables-The Australian Experience. Energies 2022, 15, 429. [Google Scholar] [CrossRef]
  9. Hadavi, S.; Mansour, M.Z.; Bahrani, B. Optimal Allocation and Sizing of Synchronous Condensers in Weak Grids with Increased Penetration of Wind and Solar Farms. IEEE J. Emerg. Sel. Top. Circuits Syst. 2021, 11, 199–209. [Google Scholar] [CrossRef]
  10. Ramirez-Gonzalez, M.; Castellanos-Bustamante, R.; Calderon-Guizar, J.G.; Malik, O.P. Assessment of inertial and primary frequency control from wind power plants in the Mexican electric power grid. Wiley Interdiscip. Rev. Energy Environ. 2019, 8, e356. [Google Scholar] [CrossRef]
  11. Beltran, O.; Pena, R.; Segundo, J.; Esparza, A.; Muljadi, E.; Wenzhong, D. Inertia Estimation of Wind Power Plants Based on the Swing Equation and Phasor Measurement Units. Appl. Sci. 2018, 8, 2413. [Google Scholar] [CrossRef] [Green Version]
  12. Cai, Y.M.; Li, Z.; Cai, X. Optimal Inertia Reserve and Inertia Control Strategy for Wind Farms. Energies 2020, 13, 1067. [Google Scholar] [CrossRef]
  13. Thiesen, H.; Jauch, C. Determining the Load Inertia Contribution from Different Power Consumer Groups. Energies 2020, 13, 1588. [Google Scholar] [CrossRef] [Green Version]
  14. Liu, C.; Cai, G.W. Power-oscillation evaluation in power systems with high penetration of renewable power generation based on network virtual inertia. IET Renew. Power Gener. 2018, 13, 138–145. [Google Scholar] [CrossRef]
  15. Meng, J.; Wang, Y.; Shi, X.; Fu, C.; Li, P. Control strategy and parameter analysis of distributed inverter based on VSG. Trans. China Electrotech. Soc. 2014, 29, 1–10. [Google Scholar]
  16. Simpson-Porco, J.W. On Area Control Errors, Area Injection Errors, and Textbook Automatic Generation Control. IEEE Trans. Power Syst. 2020, 36, 557–560. [Google Scholar] [CrossRef]
  17. Li, S.; Wang, Y. Dynamic Performance Assessment of Primary Frequency Modulation for a Power Control System Based on MATLAB. Processes 2018, 7, 11. [Google Scholar] [CrossRef] [Green Version]
  18. Meng, G.J.; Lu, Y.; Liu, H.T.; Ye, Y.; Sun, Y.K.; Tan, W.Y. Adaptive Droop Coefficient and SOC Equalization-Based Primary Frequency Modulation Control Strategy of Energy Storage. Electronics 2021, 10, 2645. [Google Scholar] [CrossRef]
  19. Yang, P.; He, B.; Wang, B.; Dong, X.; Liu, W.; Zhang, J.; Wu, Z.; Liu, J.; Qin, Z. Coordinated control of rotor kinetic energy and pitch angle for large-scale doubly fed induction generators participating in system primary frequency regulation. IET Renew. Power Gener. 2021, 15, 1836–1847. [Google Scholar] [CrossRef]
  20. Maihemuti, S.; Wang, W.; Wu, J.; Wang, H. New energy power system operation security evaluation based on the SWOT analysis. Sci. Rep. 2022, 12, 12680. [Google Scholar] [CrossRef]
  21. Zheng, W.Y.; Zhu, J.Z.; Luo, Q.J. Distributed Dispatch of Integrated Electricity-Heat Systems with Variable Mass Flow. IEEE Trans. Smart Grid 2022. [Google Scholar] [CrossRef]
  22. Li, Z.G.; Wu, W.C.; Wang, J.H.; Zhang, B.M.; Zheng, T.Y. Transmission-Constrained Unit Commitment Considering Combined Electricity and District Heating Networks. IEEE Trans. Sustain. Energy 2015, 7, 480–492. [Google Scholar] [CrossRef]
  23. Li, Z.W.; Wu, X.L.; Zhuang, K.; Wang, L.; Miao, Y.C.; Li, B.J. Analysis and Reflection on Frequency Characteristics of East China Grid After Bipolar Locking of “9.19” Jinping-Sunan DC Transmission Line. Autom. Electr. Power Syst. 2017, 41, 149–155. [Google Scholar]
  24. Leiva, D.A.; Mercado, P.E.; Suvire, G.O. System Frequency Response Model Considering the Influence of Power System Stabilizers. IEEE Lat. Am. Trans. 2022, 20, 912–920. [Google Scholar] [CrossRef]
  25. Liu, M.Y.; Chen, J.R.; Milano, F. On-Line Inertia Estimation for Synchronous and Non-Synchronous Devices. IEEE Trans. Power Syst. 2021, 36, 2693–2701. [Google Scholar] [CrossRef]
  26. Xu, Z.X.; Qi, Y.; Li, W.L.; Yang, Y.H. Multi-Timescale Control of Variable-Speed Wind Turbine for Inertia Provision. Appl. Sci. 2022, 12, 3263. [Google Scholar] [CrossRef]
  27. Prakash, V.; Kushwaha, P.; Sharma, K.C.; Bhakar, R. Frequency response support assessment from uncertain wind generation. Int. J. Electr. Power Energy Syst. 2021, 134, 107465. [Google Scholar] [CrossRef]
  28. Wu, F.B.; Yang, B.; Hu, A.P.; Zhang, Y.; Ge, W.C.; Ni, L.H.; Wang, C.Q.; Zha, Y.X. Inertia and Damping Analysis of Grid-Tied Photovoltaic Power Generation System with DC Voltage Droop Control. IEEE Access 2021, 9, 38411–38418. [Google Scholar] [CrossRef]
  29. Jami, M.; Shafiee, Q.; Gholami, M.; Bevrani, H. Control of a super-capacitor energy storage system to mimic inertia and transient response improvement of a direct current micro-grid. J. Energy Storage 2020, 32, 101788. [Google Scholar] [CrossRef]
  30. Yang, Y.C.; Han, Y.H.; Jiang, W.K.; Zhang, Y.Y.; Xu, Y.M.; Ahmed, A.M. Application of the Supercapacitor for Energy Storage in China: Role and Strategy. Appl. Sci. 2021, 12, 354. [Google Scholar] [CrossRef]
  31. Asensio, A.P.; Gonzalez-Longatt, F.; Arnaltes, S.; Rodriguez-Amenedo, J.L. Analysis of the Converter Synchronizing Method for the Contribution of Battery Energy Storage Systems to Inertia Emulation. Energies 2020, 13, 1478. [Google Scholar] [CrossRef] [Green Version]
  32. Xu, Z.H.; Liu, C.; Song, Z.Y. Research on Primary Frequency Modulation Online Monitoring and Assessment Management System Under “Master–Sub” Control Station Model. Front. Energy Res. 2022, 10, 910. [Google Scholar] [CrossRef]
  33. Lu, S.D.; Sian, H.W.; Wang, M.H.; Liao, R.M. Application of Extension Neural Network with Discrete Wavelet Transform and Parseval’s Theorem for Power Quality Analysis. Appl. Sci. 2019, 9, 2228. [Google Scholar] [CrossRef] [Green Version]
  34. Yukseltan, E.; Yucekaya, A.; Bilge, A.H. Hourly electricity demand forecasting using Fourier analysis with feedback. Energy Strategy Rev. 2020, 31, 100524. [Google Scholar] [CrossRef]
Figure 1. The proportion of installed capacity of new energy in China over the years.
Energies 15 09423 g001
Figure 2. Schematic Diagram of System Frequency Response Process.
Energies 15 09423 g002
Figure 3. The characteristics of the dead band of frequency modulation.
Energies 15 09423 g003
Figure 4. The mathematical model of primary frequency regulation with m generators running in parallel.
Energies 15 09423 g004
Figure 5. The frequency change curve of low-frequency disturbance test system.
Energies 15 09423 g005
Figure 6. The frequency change rate curve of low-frequency disturbance test system.
Energies 15 09423 g006
Figure 7. The equivalent calculation inertia value curve.
Energies 15 09423 g007
Table 1. The transmission power of Ultra HVDC System in the regional power grid.
Ultra HVDC SystemTransmission Power
(MW)
Rated Capacity
(MW)
No.1 Ultra HVDC System0 (Planned maintenance)6500
No.2 Ultra HVDC System8503000
No.3 Ultra HVDC System−350750
Table 2. The primary frequency modulation index at different operating conditions.
Operating Data NumberUHVDC Power
Transmission (MW)
Load
(MW)
Total Power Generation Output
(MW)
The Proportion of New Energy Output (%)The Output of New Energies
(MW)
The Output of Synchronous Generators (MW)The Primary Frequency Modulation Index
1875053,25062,00013806053,9401.553 × 106
2875054,25063,00014882054,1801.582 × 106
3875051,25060,0002112,60047,4001.432 × 106
4875052,75061,50033799541,2051.378 × 106
5825045,25053,5003418,19035,3101.144 × 106
6825043,75052,0004121,32030,6801.089 × 106
Publisher’s Note: MDPI stays neutral with regard to jurisdictional claims in published maps and institutional affiliations.

