Article

Capacity Allocation Strategy Using Virtual Synchronous Compensator for Renewable Energy Stations Based on Fuzzy Chance Constraints

1
Xinjiang Electric Power Research Institute, State Grid Xinjiang Electric Power Co., Ltd., Urumqi 830002, China
2
Xinjiang Key Laboratory of Whole Process Simulation for Power System, Urumqi 832003, China
3
State Grid Xinjiang Electric Power Co., Ltd., Urumqi 830002, China
4
School of Electrical Engineering, Xinjiang University, Urumqi 830049, China
*
Author to whom correspondence should be addressed.
Energies 2022, 15(24), 9306; https://doi.org/10.3390/en15249306
Submission received: 14 November 2022 / Revised: 3 December 2022 / Accepted: 5 December 2022 / Published: 8 December 2022

Abstract

:
The uncertainty of high penetration of renewable energy brings challenges to the safe and stable operation of a power system; the virtual synchronous compensation (VSCOM) can shift the demand and compensate real-time discrepancy between generation and demand, and can improve the active support ability for the power system. This paper proposes a novel capacity allocation strategy using VSCOM for renewable energy stations based on fuzzy constraints. Firstly, the basic framework of the VSCOM is constructed with energy storage and reactive power generator (SVG) unit. Secondly, the inertia and standby capacity requirements of high penetration of renewable energy system are modeled; on this basis, a capacity allocation model of each sub unit of the VSCOM is developed, and the investment economy and stable support needs are considered. Thirdly, the uncertainty set of wind power output is defined based on the historical data to find a decision that minimizes the worst-case expected where the worst case should be taken. Finally, the simulation results show that the proposed optimal sizing strategy can effectively take advantage of stability and economy, and the VSCOM can meet the inertia support demand of 98.6% of a high proportion of renewable energy systems.

1. Introduction

In the transition of the power system migrating into higher power electronics and higher renewable penetration, the inverter-based generators (IBGs) are gradually replacing the traditional synchronous generator (SG)-based power plant and becoming dominated [1]. In order to ensure a safe, economical and stable power transmission, the reactive power compensation devices are widely implemented [2,3,4]. Differing to the SG, IBG cannot provide a sufficient reactive power due to its rigid current limitation. Thus, for the purpose of the voltage stability in both static and transient, most of the IBG are implemented FACTS devices at its point of common coupling (PCC) [5].
There are different types of the FACTS devices [6]. Static Var Compensator (SVC) is the most common and the cheapest, and connects to the IBG in parallel and behaves like a susceptance adding on the transmission line impedance [7]. When it reaches its limitation, it becomes a fixed capacitor in which reactive power provision ability decreases linearly with the grid voltage [8]. Static Var Generator (SVG) or Static Synchronous Compensator (STATCOM) has become popular in recent years, and is based on the grid-feeding converter and behaves like a controlled current source. A more functional and flexible control strategy can be implemented in to the SVG; thus, it has a wider operational region and better performance than SVC [9]. However, up-to-date, large-scale IBG in the power system in general are also in the form of the grid feeder or controlled current source, while in a stiffness grid, a certain quantity of the voltage sources has to be maintained [10]. In this context, the concept of the grid-forming converter, such as virtual synchronous generator (VSG) [11], synchronverter [12], virtual oscillation control [13] etc., has been proposed [14]. However, it is not easy and economical to modify the build-up IBG plants into the grid former in a short-term. To confront the problem of the voltage instability attributing to the lack of the voltage source, it is much easier to remold the SVG to be controlled in the grid-forming or voltage source mode and to directly control the PCC voltage; this new device is named a virtual synchronous compensator (VSCOM) [15]. Reference [16] compares the VSCOM with other different FACTS in terms of the voltage support ability, and proves that the VSCOM can regulate the PCC voltage in a fixed value in a normal operation regardless of the stochastics from either the load or the IBG sides and can compensate reactive power much faster than others during the fault operation. The VSCOM uses VSG control and has the ability to provide the inertia and damping, which can also support the frequency in the power system. Reference [17] suggests installing an electrical energy storage (ESS) in the DC side of the VSCOM in order to boost its supporting ability on both voltage and frequency stability. Reference [18] compares the effect of the different type of the storage on the VSCOM performance. Reference [19] proposes a coordinated control between the VSCOM and IBG to make the entire IBG behave like a voltage source even IBG is controlled in grid feeding.
Most of the work on the VSCOM now focuses its control strategy and operational transient stability in the device level. However, economy is one of the most important elements in the power system development. Before widely promoting the VSCOM, we have to evaluate its economics and understand its optimal and economical sizing along with an IBG plant. The IBG with SVG is represented as a PQ node in the power system, while now with VSCOM becomes as a PV node. The model of the VSCOM for the power system planning is lacking by now and has to be developed. New energy (such as wind power and photovoltaic) is a typical representative of IBG application, and the uncertainty of power has a significant impact on optimal allocation and economic operation of IBG with VSCOM; at present, the standby setting method [20], stochastic programming method [21], scenario analysis [22], and robust optimization [23] were proposed to describe the power uncertainty. However, the above methods require a large number of sample data; the results are constrained by the number of scenarios and the uncertainty calculation of multi scenario description is complex. Robust optimization can find the decision scheme under the worst scenario by setting the fluctuation range of uncertain variables. Taking the minimum economy as the goal, [24] proposed an allocation method of ESS capacity based on time of use electricity price by building the uncertainty set of renewable energy output. In [25], the uncertainty set of fault state of multi area distribution lines was constructed, and a distribution network ESS planning method was proposed to ensure uninterrupted power supply of important loads. The traditional robust optimization ignored the economy and made the results too conservative; it is difficult to scientifically balance economy and robustness in ESS capacity allocation. Furthermore, the above studies have improved the consumption of new energy and reduced the fluctuation caused by the grid connection of new energy; however, most studies only considered the output of the power side, the costs and benefits of the active support capability of the system have not considered. On the solution algorithm, the self-organizing multi-objective particle swarm optimization and competitive mechanism based multi objective particle swarm optimization were proposed in [26,27]. However, the constraints of active and reactive power should be considered in the optimal configuration of VSCOM; this optimization problem is nonlinear, and contains complex constraints.
To this end, a capacity allocation strategy of virtual synchronous generator for renewable energy stations by utilizing the fuzzy chance theory is introduced. The following are the contributions:
  • Based on the robust theory, an IBG with VSCOM model for its economical and sizing analysis in the power system planning is proposed;
  • The moth flame optimization algorithm to solve the balance between economy and robustness problem attributing to the stochastics and nonlinearity from the IBG and VSCOM is modified;
  • The benefits of the VSCOM with different storages on the IBG annually economical operation is compared.
The rest of the paper is organized as follows: Section 2 introduces the structure of VSCOM and establishes the model of IBG plant. Section 3 establishes the configuration model of VSCOM. Section 4 proposes a modified moth flame optimization algorithm. The case studies and the result analysis are discussed in Section 5 and the main conclusions are summarized in Section 6.

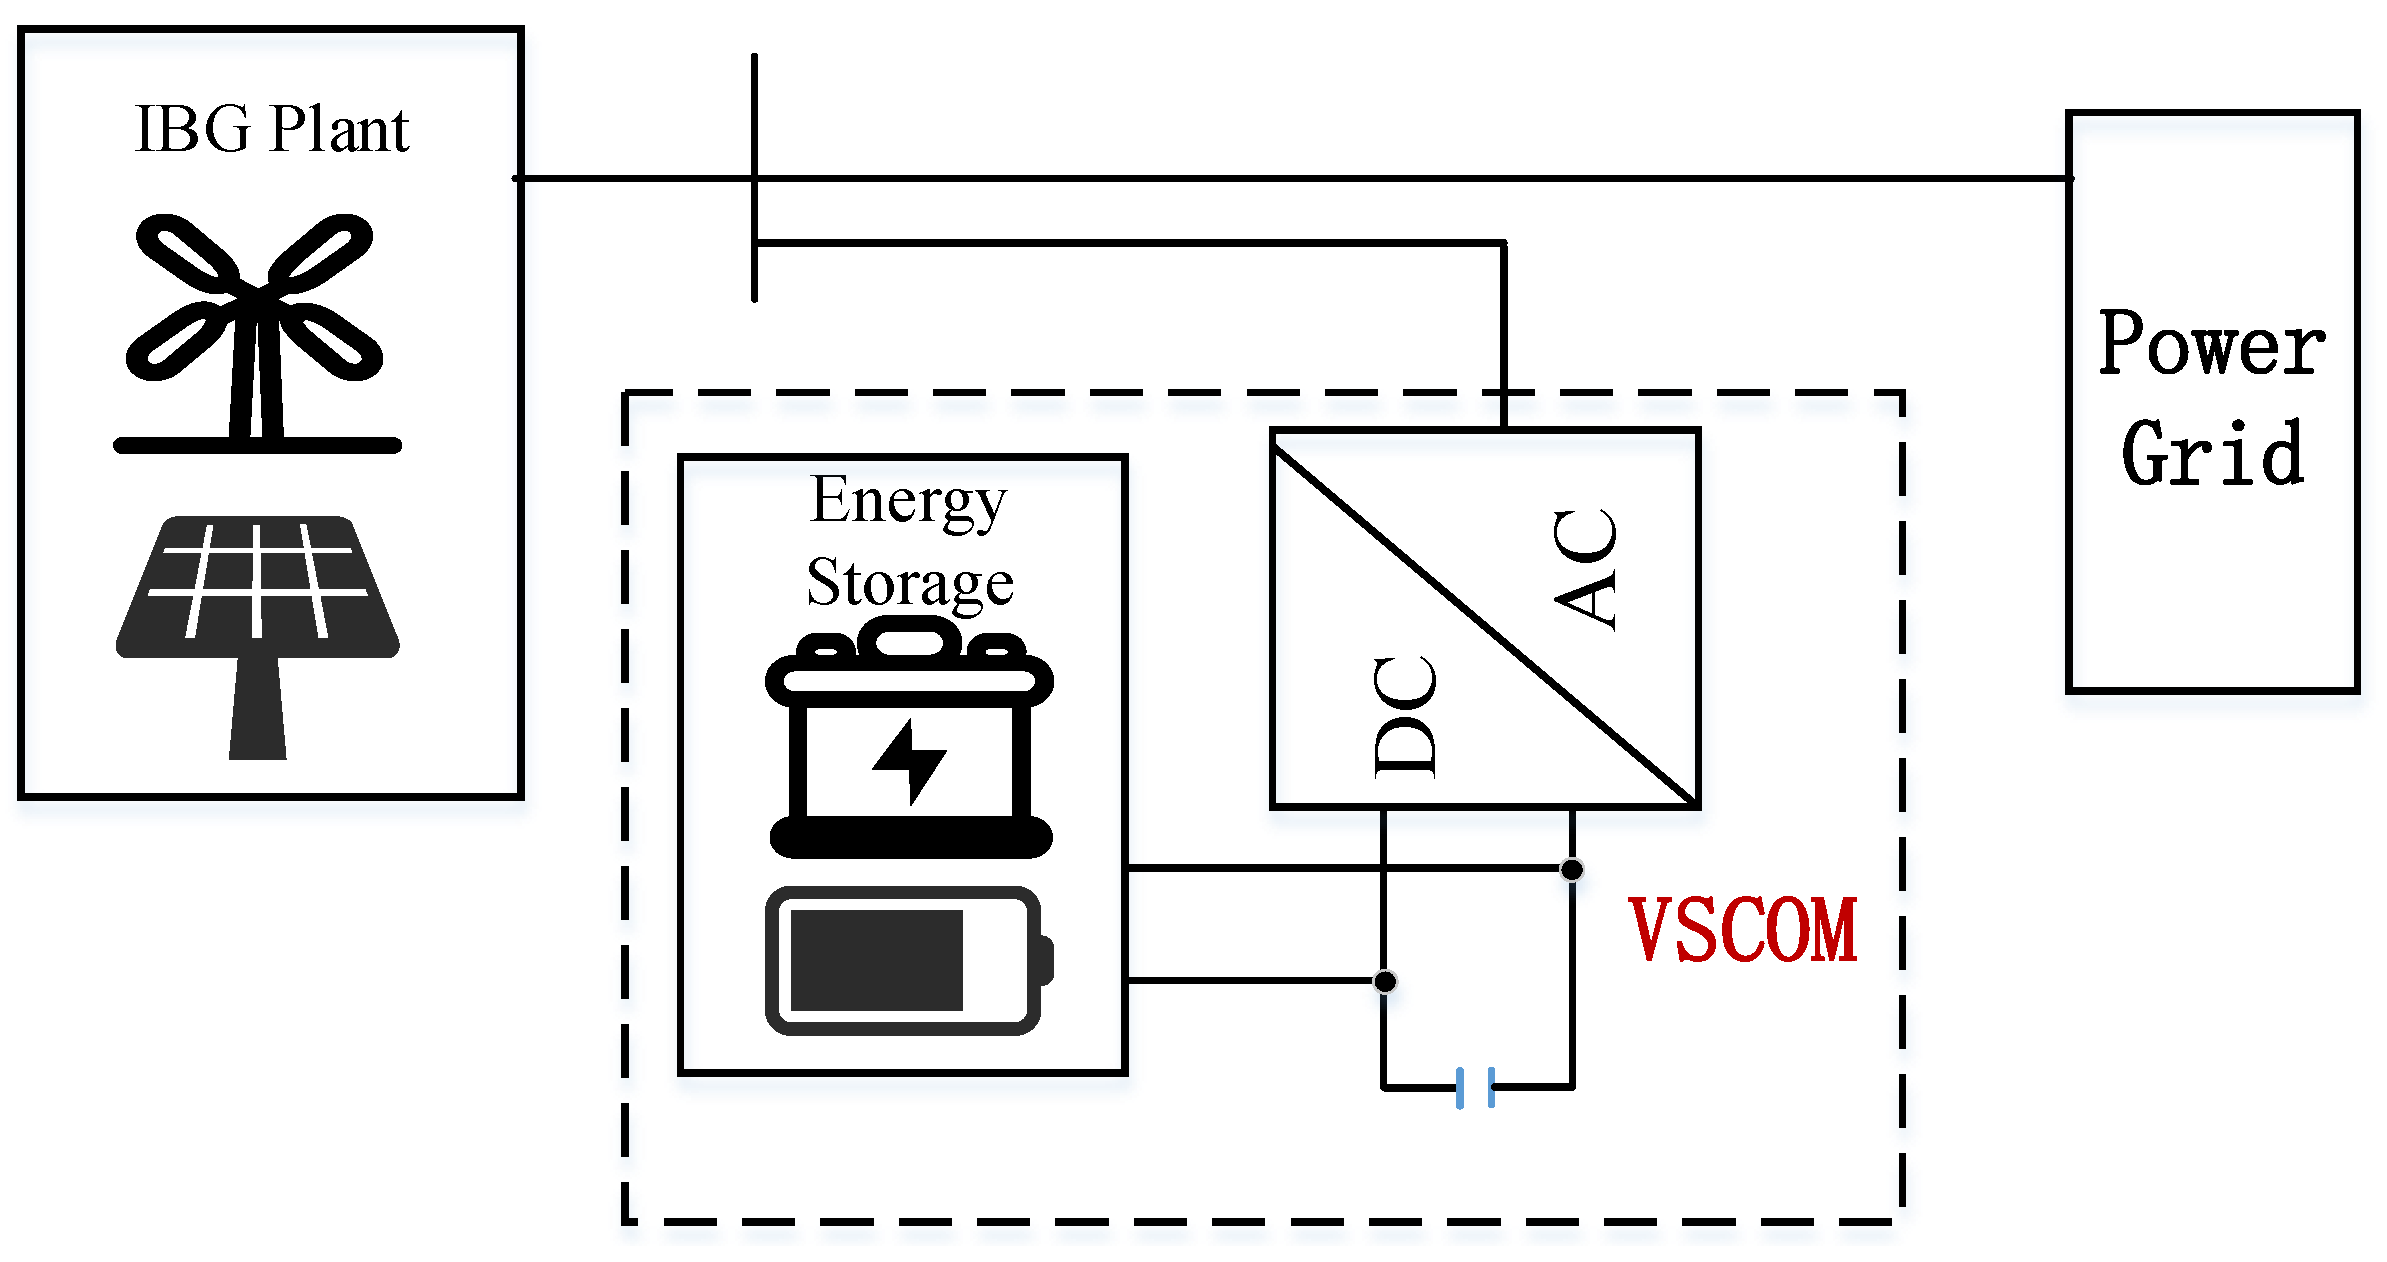
2. The Structure of VSCOM and IBG Plant Model

2.1. VSCOM Structure

The VSCOM used in this paper consists of ESS and SVG, and the ESS is connected at the DC side of SVG.
Figure 1 depicts the structure of VSCOM connecting to an IBG plant (new energy station) at the PCC, the ESS is mainly used to track the setpoint from the IBG operator, compensate the mismatched power during the peak time, and provide inertia support. The SVG meets the reactive power demand and provides voltage support for the power grid. Based on above functions, the VSCOM can support both voltage and frequency stability; hence, the VSCOM have a considerable application prospect in the modern power system.

2.2. IBG Plant Model

ESS has the advantages on dual-directional power regulation and fast support ability, which can track the setpoint of IBG operator and help damp the stochastic power generation. It can also provide fast frequency response after the grid subjecting the frequency disturbance, and, meanwhile, it can also provide the inertia response, where the inertia time constant of ESS can be characterized as [28]:
H t ESS = E t ESS E max ESS P 0 ESS C max
where, the H t ESS represents the equivalent inertia time constant of ESS, E t ESS represents the remaining electric quantity of ESS at t, E max ESS represents the rated capacity of ESS, and P 0 ESS represents reference power. C max represents the maximum charge/discharge ratio of ESS [12].
During the frequency variation, the inertia support power of ESS ( P in , t ESS ) can be expressed as [13]:
P in , t ESS = 2 H t ESS d f d t + 1 δ ESS Δ f P R ESS f 0
where, δ ESS represents the difference adjustment coefficient of ESS, and P R ESS represents the rated power of e ESS. d f / d t represents the system frequency change rate, Δ f represents the frequency deviation, and f 0 represents the reference frequency.
The overall inertia demand in power systems can be expressed by the minimum rotational kinetic energy under the maximum limit corresponding to the maximum frequency change rate, which can be expressed as [29]:
R oCoF = Δ P loss   f 0 2 E sys R oCoF extre
where, R oCoF represents the frequency change rate, R oCoF extre represents the maximum value of frequency change rate, Δ P loss represents the power disturbance, and E sys is the required rotational kinetic energy.
Based on (3), to avoid the unexpected tripping of the relay under the power disturbance, the minimum rotational kinetic energy ( E t , min sys ) can be expressed as [30]:
E t , min sys = H t ESS P R ESS Δ P loss   f 0 2 R OCCF extre
The balanced power flow model in steady state operation can be shown as:
k Ω ( : , i ) AC ( P k i , t AC ( P k i , t AC ) 2 + ( Q k i , t AC ) 2 ( V k , t AC ) 2 r k i ) = P i , t AC + j Ω ( i , : ) AC P i j , t AC , i N AC
k Ω ( : , i ) AC ( Q k i , t AC ( P k i , t AC ) 2 + ( Q k i , t AC ) 2 ( V k , t AC ) 2 x k i ) = Q i , t AC + j Ω ( i , : ) AC Q i j , t AC , i N AC
where, Ω ( : , i ) AC and Ω ( i , : ) AC represent the starting point set of the line with i as the end point and the ending point set of the line with i as the starting point, respectively. N AC represents the set of AC nodes. P k i , t AC and Q k i , t AC represent the active and reactive power of line ki, respectively, and P i , t AC and Q i , t AC represent the active and reactive power of node I, respectively. V k , t AC is the voltage of node k. r k i and x k i represent the resistance and reactance of line ki, respectively.
P i , t AC = P i , t LR P i , t W + P i , t VSCOM Q i , t AC = Q i , t LR Q i , t W + Q i , t VSCOM
where, P i , t W , P i , t LR , Q i , t W , and Q i , t LR represent the actual active, reactive power of wind power and load at node i, respectively. P i , t VSCOM and Q i , t VSCOM represent the active and reactive power of VSCOM, respectively.
The voltage constraints of each node to maintain the system voltage stability can be expressed as:
V t min V i , t V t max , i N AC
where V i , t is the voltage of node i at t. V t min and V t max represent the upper and lower limits of the system voltage, respectively.
The node voltage in the system can be calculated as:
V k , t AC 2 = V i , t AC 2 + 2 r k i P k i , t AC + x k i Q k i , t AC r k i 2 + x k i 2 P k i , t AC 2 + Q k i , t AC 2 V i , t AC 2 , k , i N AC

3. Configuration Model of VSCOM

Considering the uncertainty of the source, load, and the operation constraints of the VSCOM, the model of the VSCOM capacity configuration for the IBG is constructed with the objective of the annually economical operation.

3.1. Objective Function

The capacity of each sub unit in VSCOM is configured based on the operation of typical days and the annual net income of IBGs. The net income includes the electricity sales revenue ( B Sel ), the investment cost ( C VSCOM ), and the penalty cost ( C P ). The C P includes the penalty cost for tracking the setpoint of the IBG operator ( C tra P ) and the penalty cost for the node voltage exceeding the threshold range ( C V P ). The objective function are as follows:
{ max f = B Sel C VSCOM C P B Sel = 365 t = 1 T [ ξ Sel ( P t Sel + P t LR ) ] C VSCOM = 365 t = 1 T [ k t ( E R ESS ξ ESS + Q R SVG ξ SVG ) ] C P = 365 ( C tra P + C V P ) C tra P = t = 1 T { ξ tra P ( P t Sel _ P ( 1 + α ) P t Sel _ P ) , P t Sel ( 1 + α ) P t Sel _ P ξ tra P ( ( 1 α ) P t Sel P t Sel _ P ) , P t SVG < ( 1 α ) P t Sel _ P C V P = t = 1 T i N AC { ξ V P ( V i , t V t max ) , V i , t > V t max ξ V P ( V t min V i , t ) , V t min > V i , t P t Sel = ( P t W _ S + Δ P t W ) P t LR _ S P t VSCOM k t = γ ( 1 + γ ) T vscom ( 1 + γ ) T vscom 1
where, ξ Sel refers to the unit selling price of IBG, and ξ ESS and ξ SVG represent the unit investment price of energy storage and reactive power generator in VSCOM, respectively. E R ESS and Q R SVG represent the rated active and reactive capacity of sub units, respectively. represents the allowable deviation compared to the planned power. P t Sel and P t Sel _ P represent the actual power and planned power of IBGs at time t, respectively. ξ tra   P and ξ V P represent the unit penalty cost for tracking the planed power and voltage deviation of IBGs, respectively. P t VSCOM represents the charging/discharging power of the VSCOM. P t W _ S and P t LR _ S represent the predicted power of wind and load at time t, respectively. Δ P t W represents the power deviation between wind power and load at t. k t represents the asset rate, γ represents the discount rate, and T vscom represents the full life cycle of VSCOM.

3.2. Constraints

During the operation of the ESS, the electric quantity at each time shall be within its upper and lower limits [ E max ESS , E min ESS ]. In addition, based on (4), considering the minimum rotational kinetic energy required at all times, the constraints can be expressed as:
0.1 E R ESS E t , min sys E t ESS 0.9 E R ESS E t , min sys
The electric quantity of each period is not only related to the charge and discharge electric quantity of the ESS at the current time, but also related to the electric quantity of the previous time, which can be shown as:
E t ESS = E t 1 ESS + P t VSCOM
To simplify the calculation, when the self-discharge rate of each energy storage unit is ignored, the charge/discharge rate is approximately considered as 1.
During the operation of the reactive power generator, the reactive power output at each time shall be within its upper and lower limits [ Q min , Q max ], which can be expressed as:
Q min Q t VSCOM Q max
In addition, the IBG system also has transient and steady state constraints which can be seen in (1)–(9).

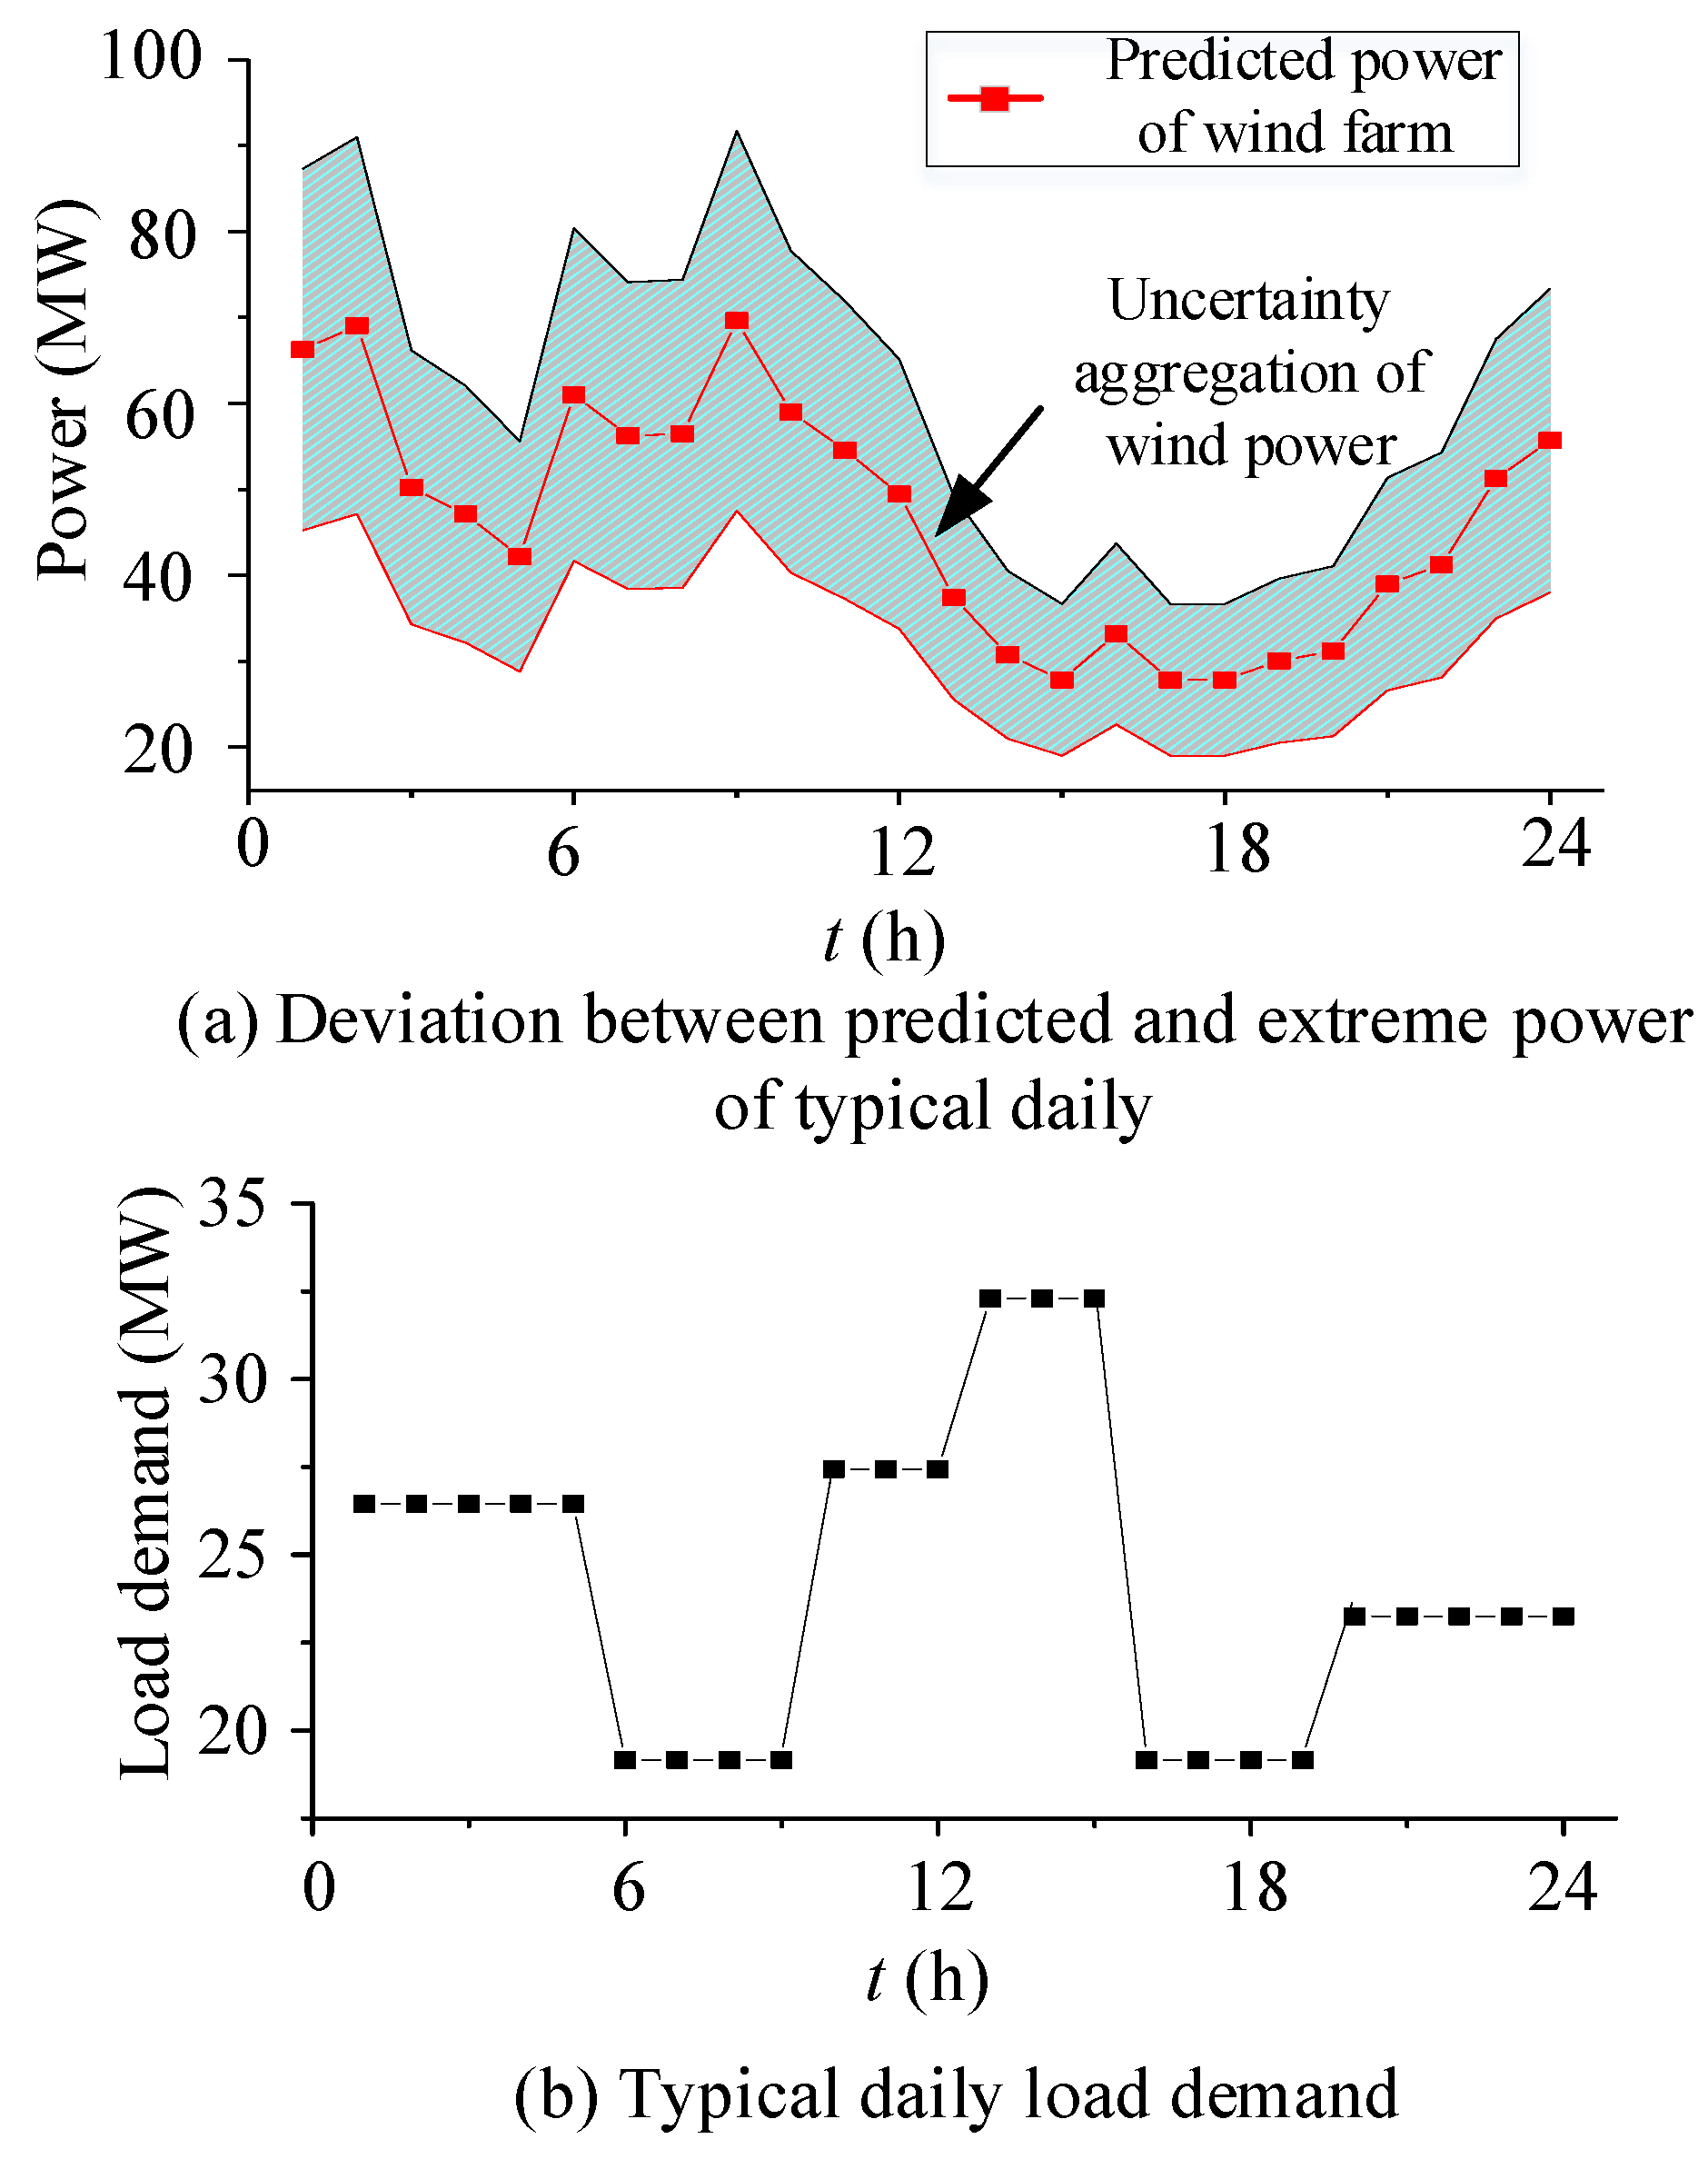
3.3. Analysis of Uncertainty with Wind Power

Based on the typical daily output power under uncertainty of wind power output deviation and robust theory, according to [15], the set containing additive uncertainty is constructed as follows:
{ P t W A = P t W S + γ W Δ P t W max γ w = max | γ w | , γ w 1 = i = 1 N w | γ w | s . t . γ w 1 , γ w 1 Γ W
where, P t W A refers to the actual output of wind power, Δ P t W max refers to the maximum deviation between the prediction and the actual power in the annual historical data, γ w refers to the deviation coefficient of the wind farm, N w refers to the refined number of power generation units in the wind farm, and and 1 represent the infinite norm and perturbation 1-norm constraints, respectively. Based on γ w 1 , the wind farm uncertainty space constraint parameters can be introduced as Γ W , the Γ W can balance the investment economy and system operation robustness by flexibly adjusting the boundary. Based on Lindeberg–Levy central limit theorem, the Γ W can be deduced as:
Γ w = N w 2 σ W 2 π + Φ 1 α w N w σ W 2 2 σ W 2 π
To simplify the calculation, assuming that the wind power output deviation follows the standard normal distribution [31], the prediction accuracy is only 68.27% (it can be obtained through the prediction data and statistical analysis). In (6), σ W is the variance of the deviation, and the distribution of the deviation can be obtained through statistical analysis. σ W represents the confidence probability and the preset value according to the output prediction accuracy. Based on the method proposed in [31], the probability value (POE) of the system operating under extreme conditions is taken as an index to quantify the system robustness. The POE can be expressed as:
POE = exp Γ w 2 2 N W

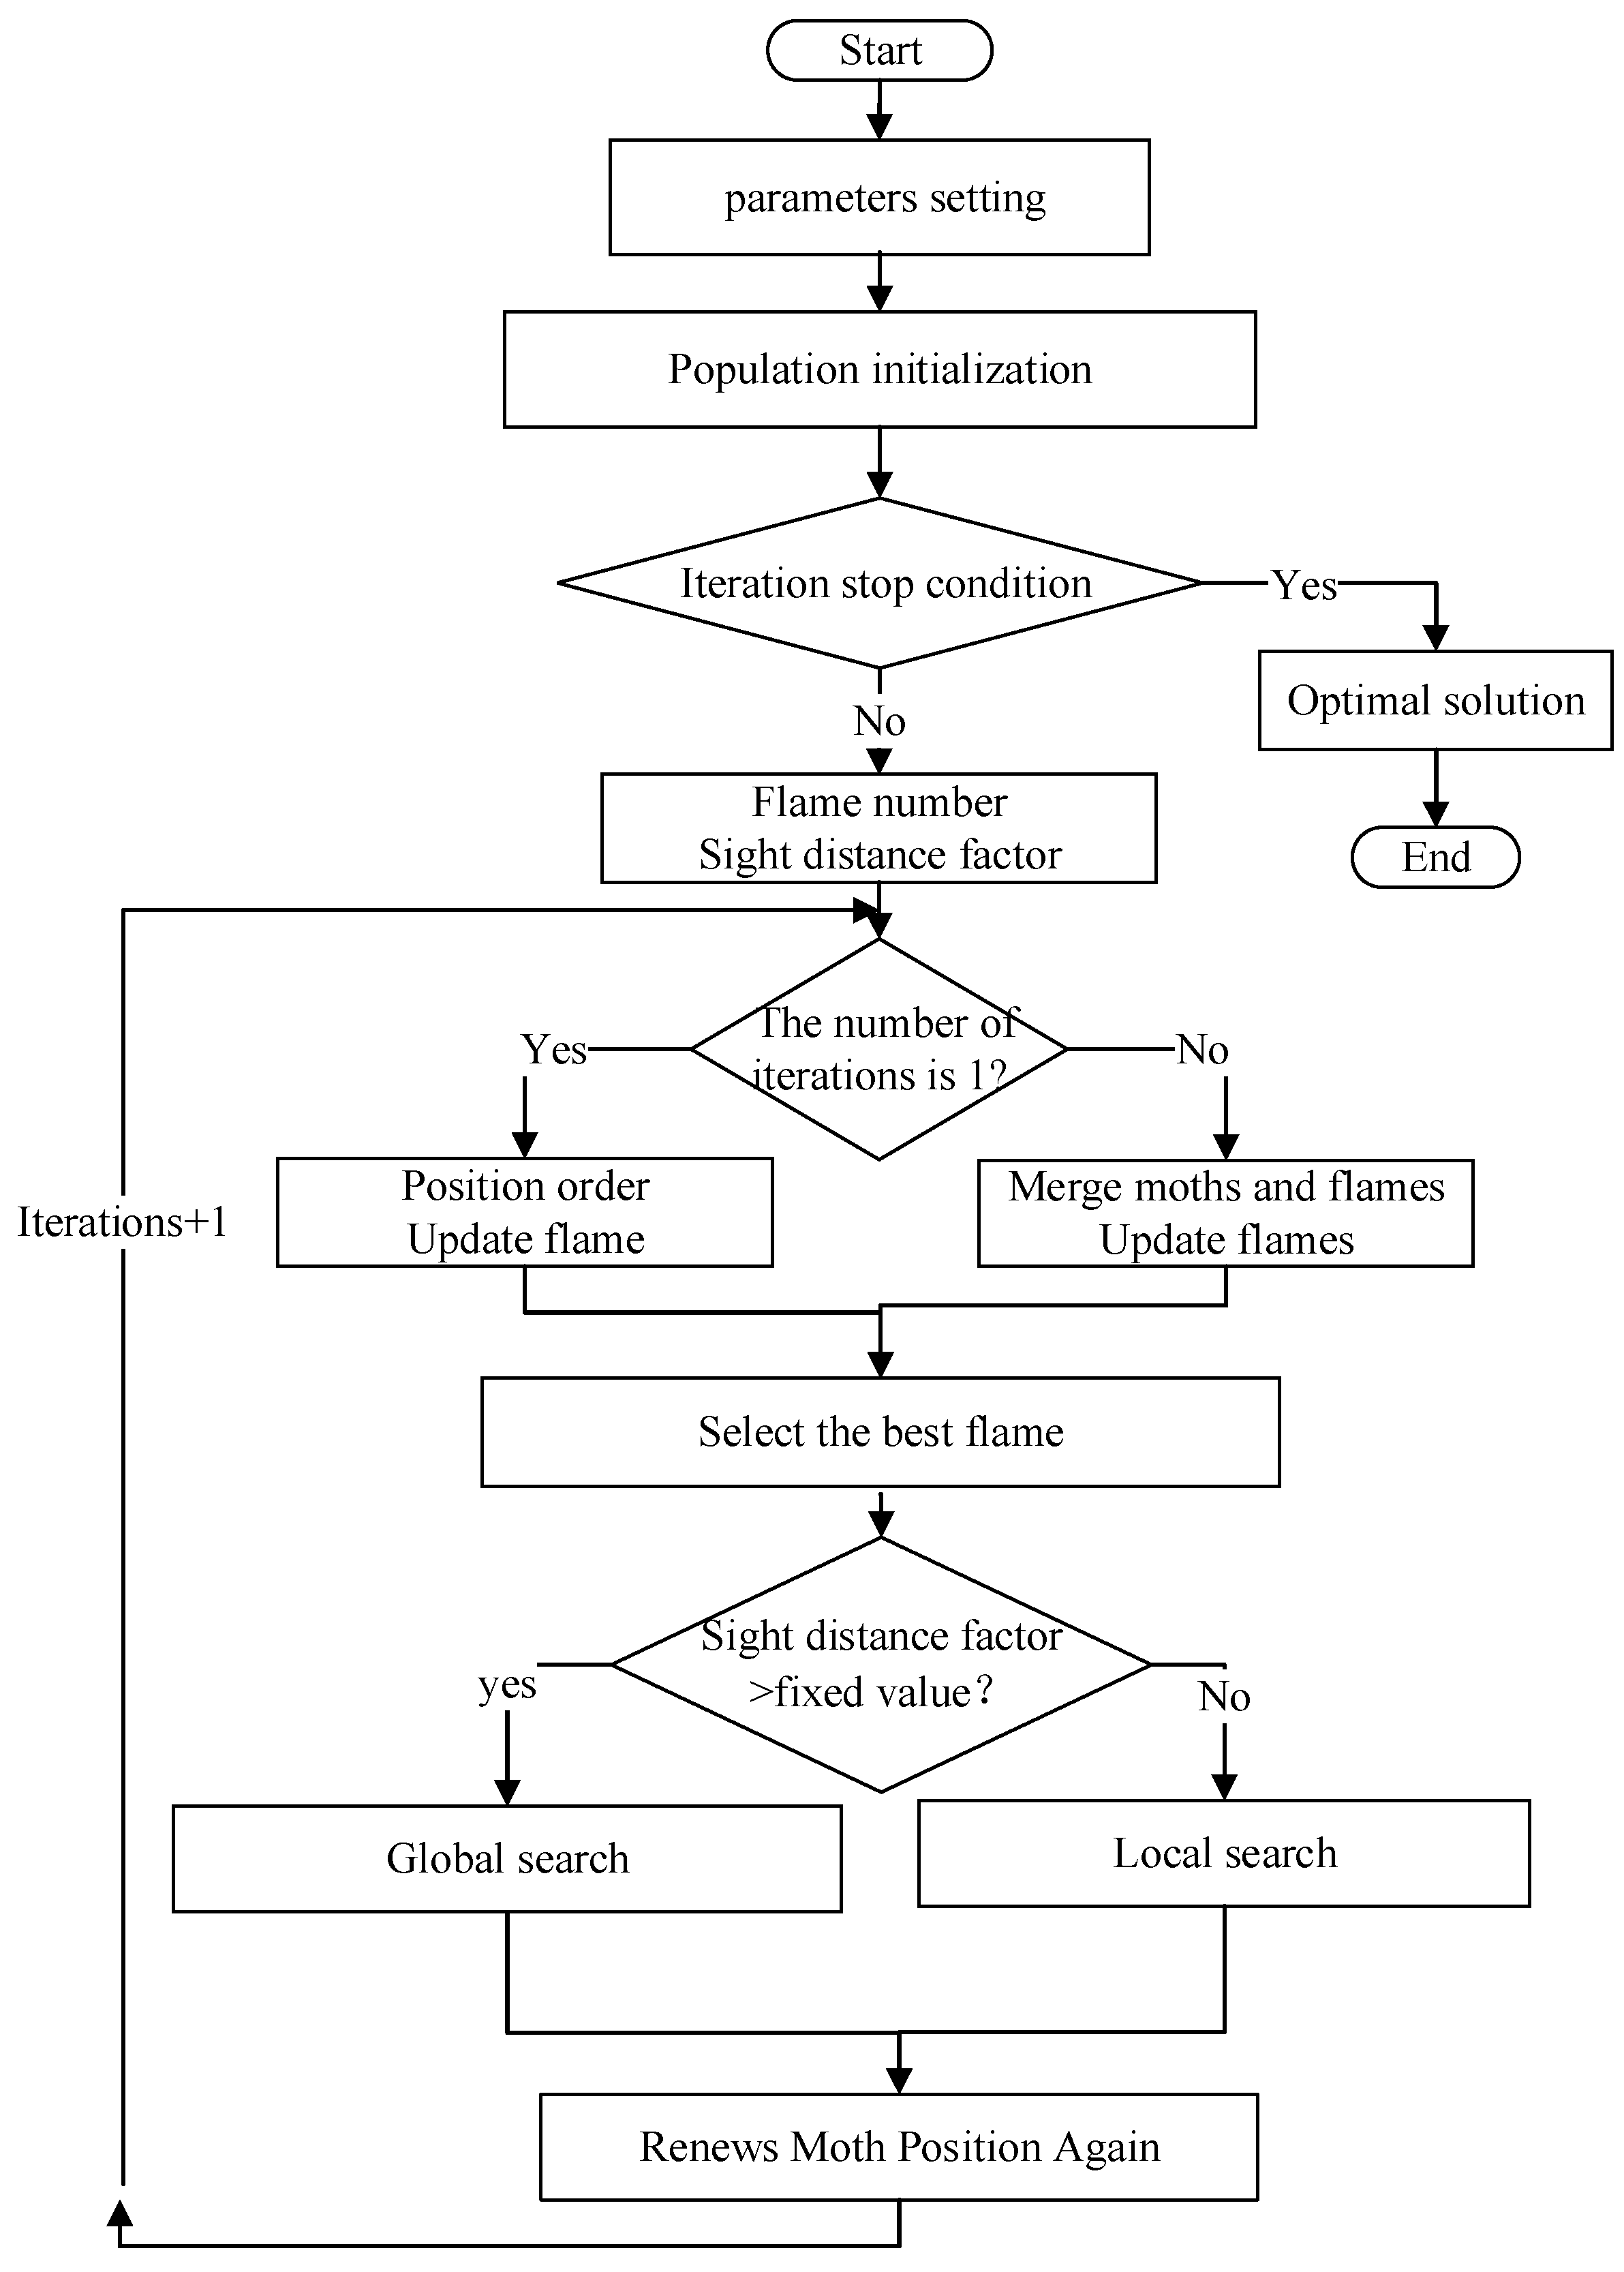
4. The Algorithm for Solving Optimal Configuration Model of VSCOM
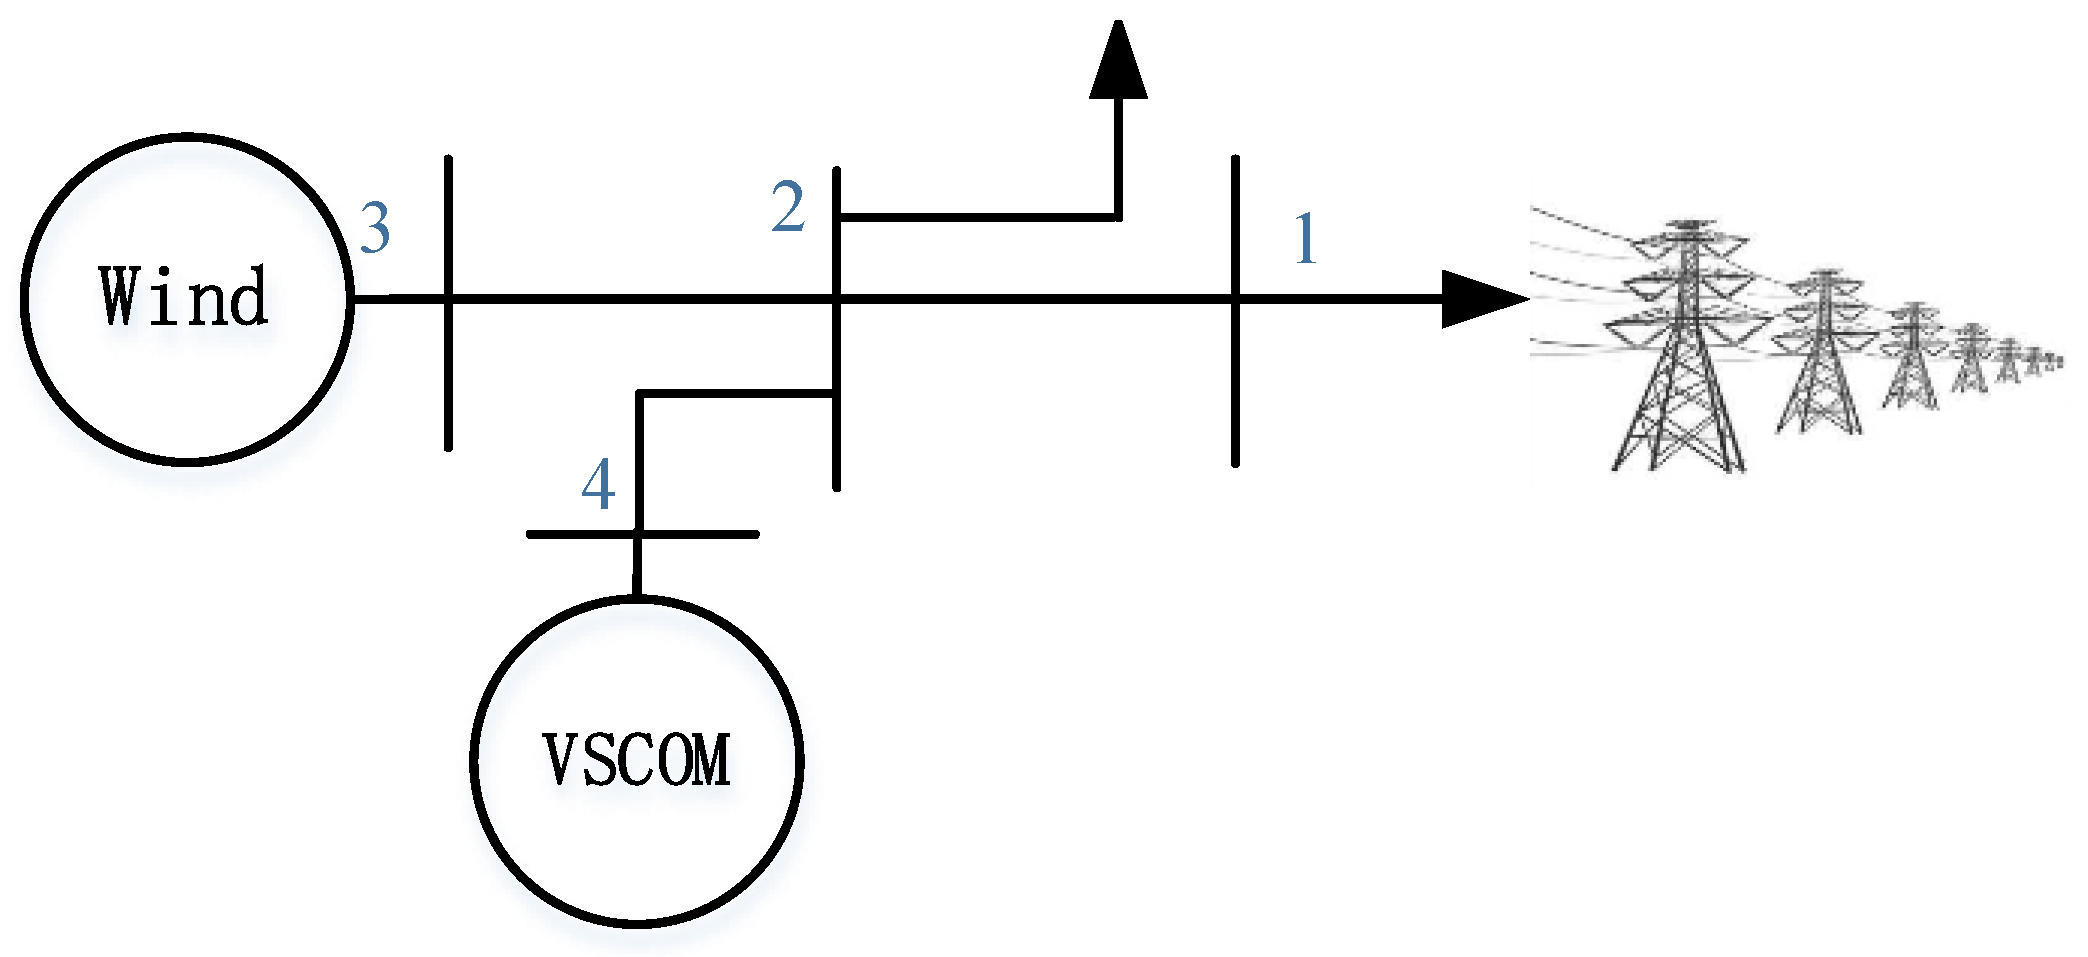
The optimal capacity allocation model of the VSCOM can be seen as a single objective optimization problem with the maximum income. However, this optimization problem is nonlinear, and contains complex constraints, which not the standard form that can be computed by the commercial solver. Hence, the improvement moth flame optimization (IMFO) algorithm is selected to solve it [24]. The IMFO is based on standard MFO, which compared with classical particle swarm optimization and genetic algorithm, the faster convergence accuracy and higher accuracy of MFO has proved in [32]. In addition, MFO has obvious advantages in dealing with optimization problems with complex constraints. The solution process can be seen in Figure 2.
Based on the MatlabR2021a and Windows 7 PC (2.90 GHz, 4 GB RAM), a simulation model is built, and in order to overcome the randomness of IMFO, each optimization is independently calculated for 30 times, and the maximum value is taken as the result for comparison.

5. Case Study

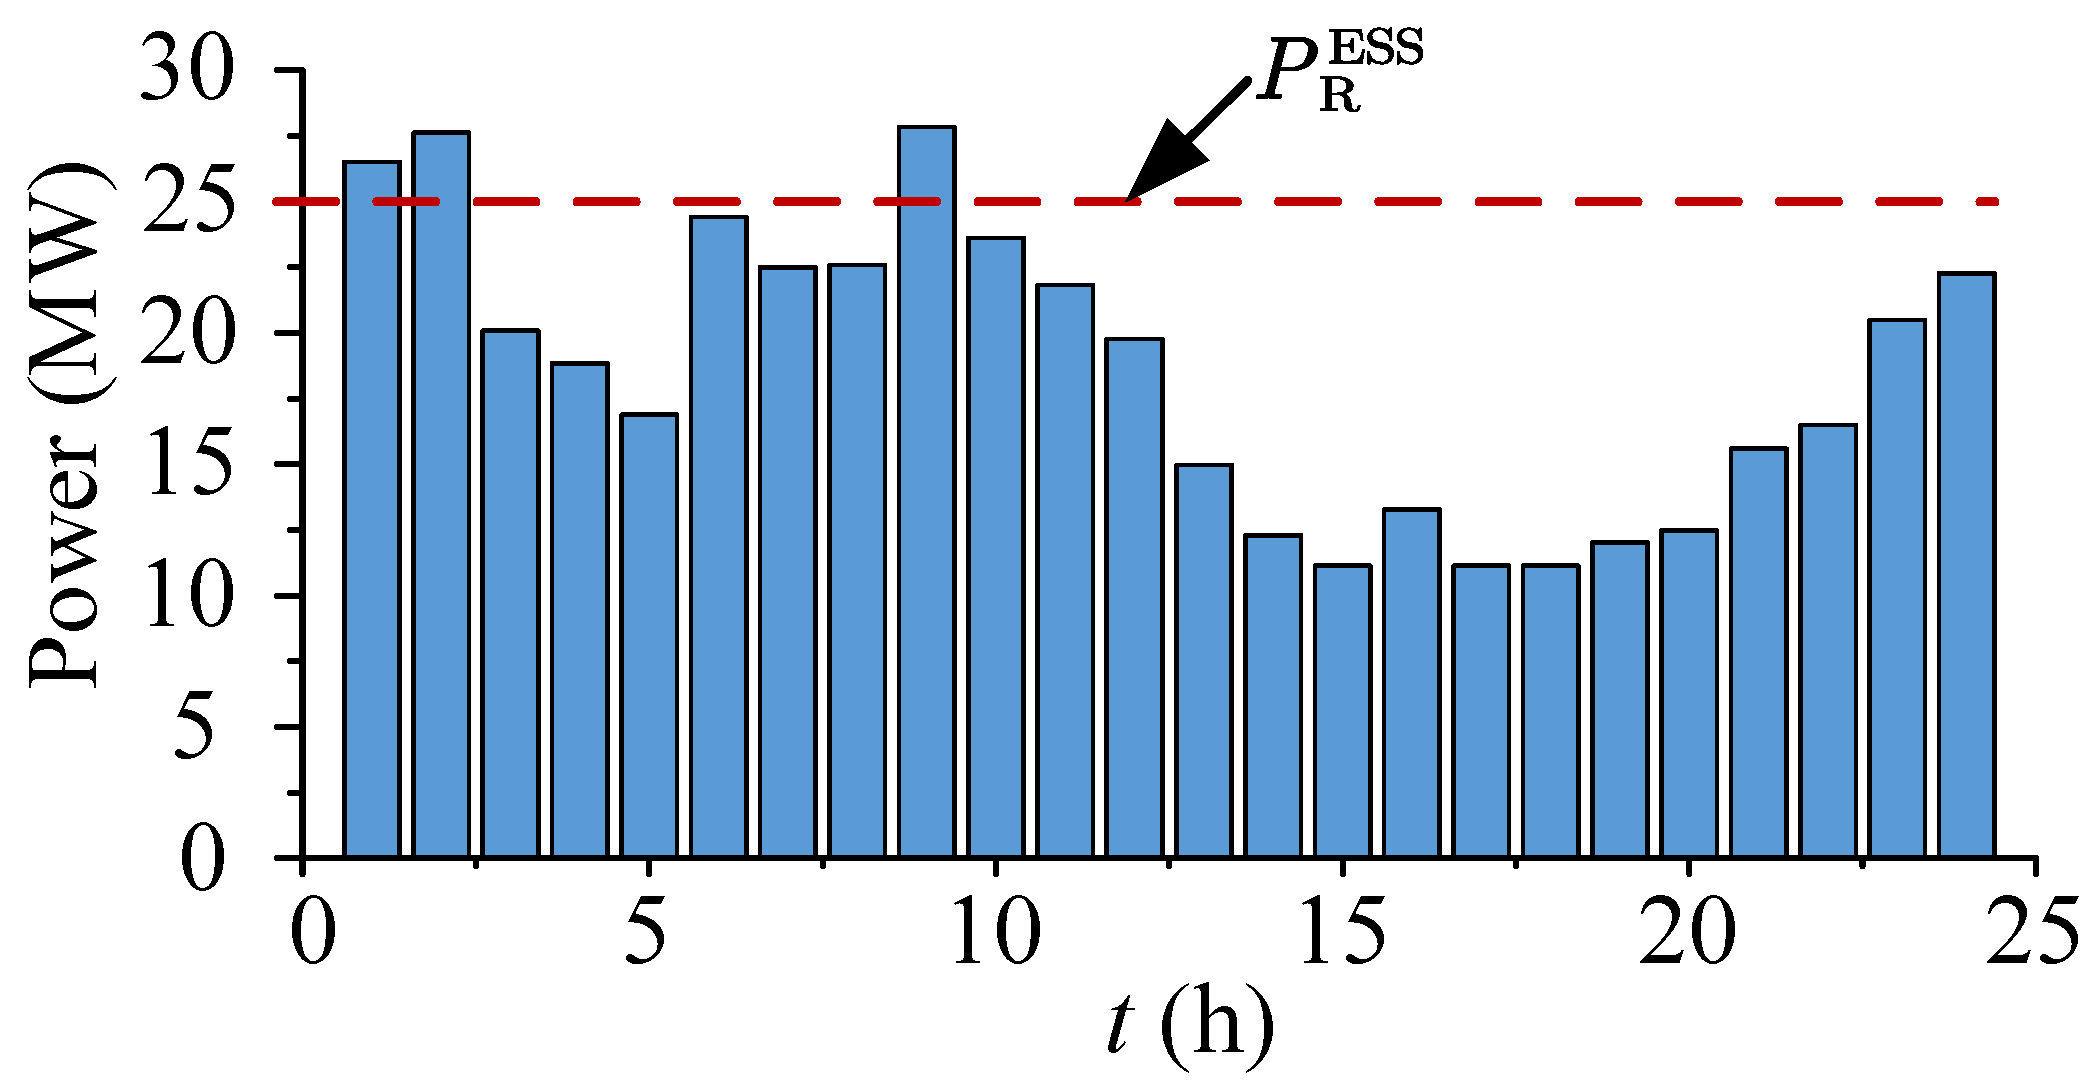
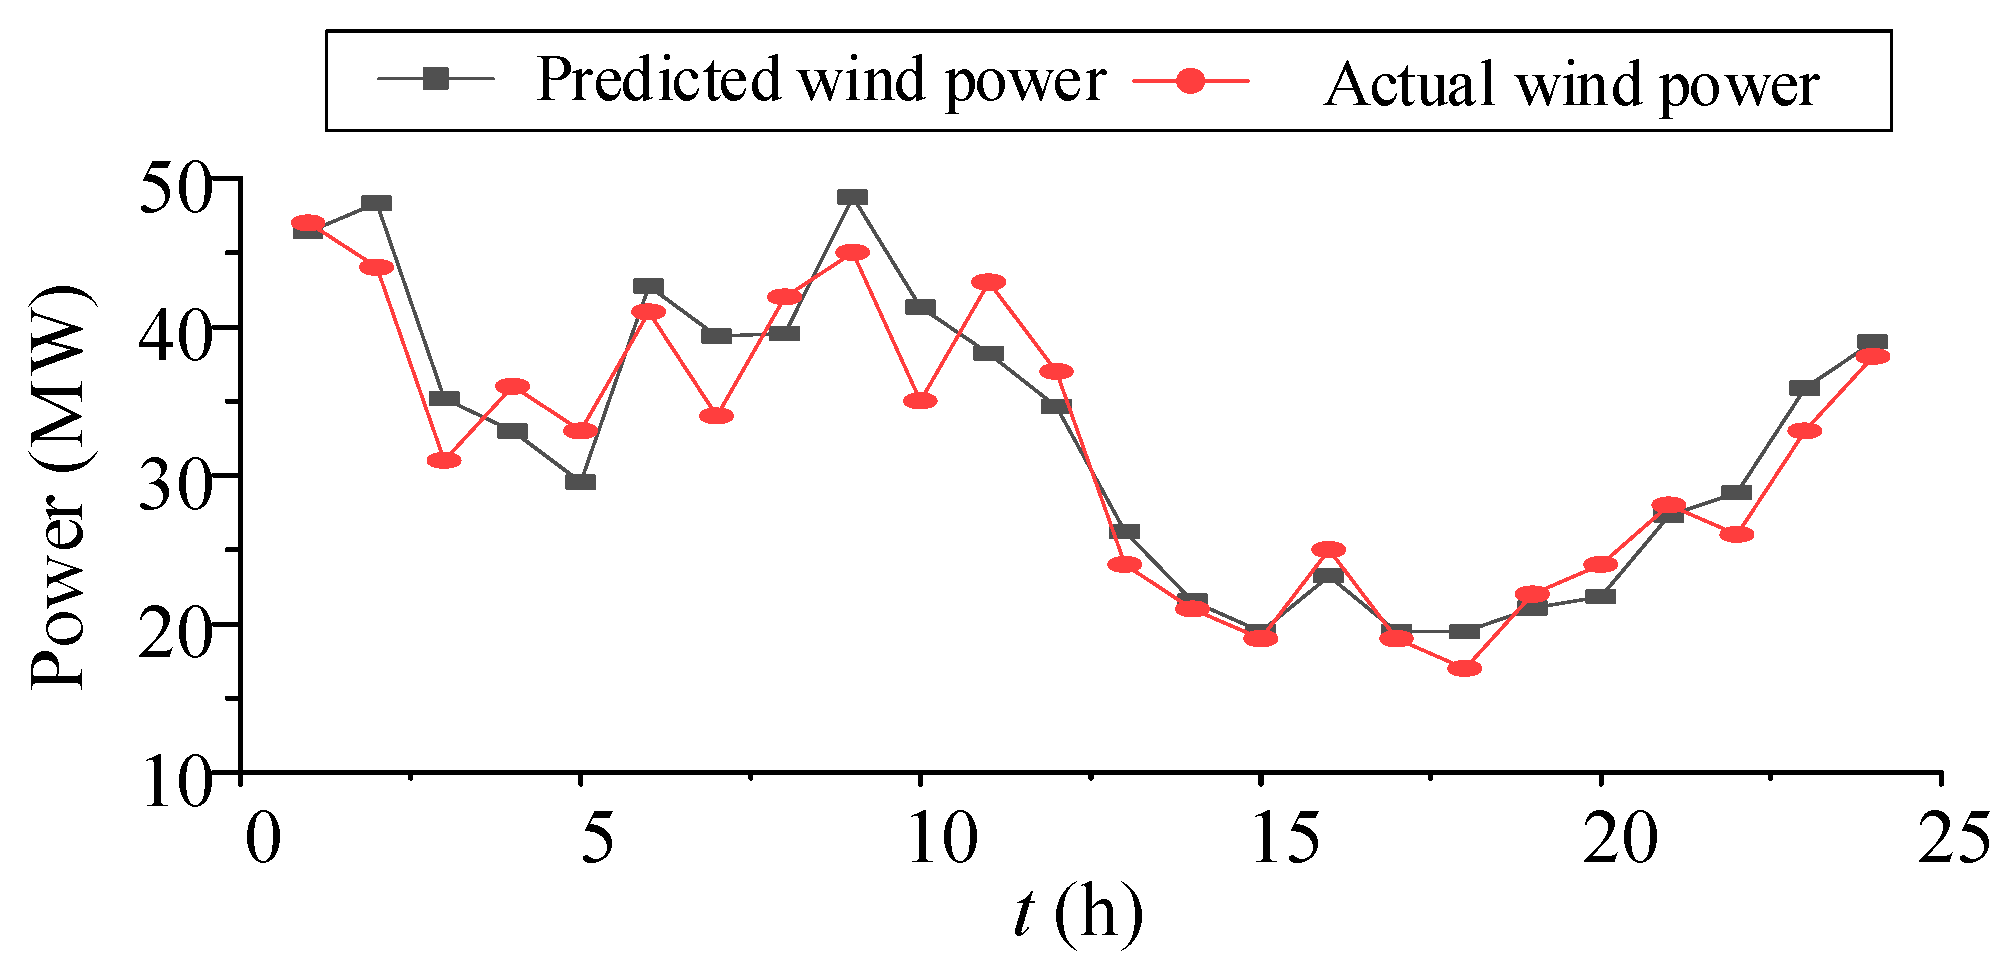
5.1. Basic Parameter Setting of Cases

The modified IEEE 4 nodes system is selected as the simulation cases, and the main grid structure can be shown in Figure 3. The resistance of each branch is set as 0.3 Ω, the reactance is set as 1.5 Ω, the reactive compensation interval of each phase is set as [300, 300] kVar, the line voltage level is set as 35 kV, and the node voltage deviation limit is set as ±5%. Node 1 is the root node connected to the superior power grid, and Node 2 connects a load, the large-scale wind farm (99 MW) is connected at Node 3, and the VSCOM is connected at Node 4.
The new energy grid price is set as RMB550/MWh, and the allowable deviation is set as ±5%. The penalty cost for IBGs is set as RMB200/MWh, the voltage penalty cost is set as RMB600/MWh, and the discount rate is set as 3.24% based on the grid price. The VSCOM parameter can be set as Table 1.
Based on the annual historical data of a wind farm in northwest China, the predicted power of a typical daily wind farm, extreme output deviation of the wind farm, and load demand are selected as the basis for robust configuration of various types of sub units in VSCOM, which can be shown in Figure 4.

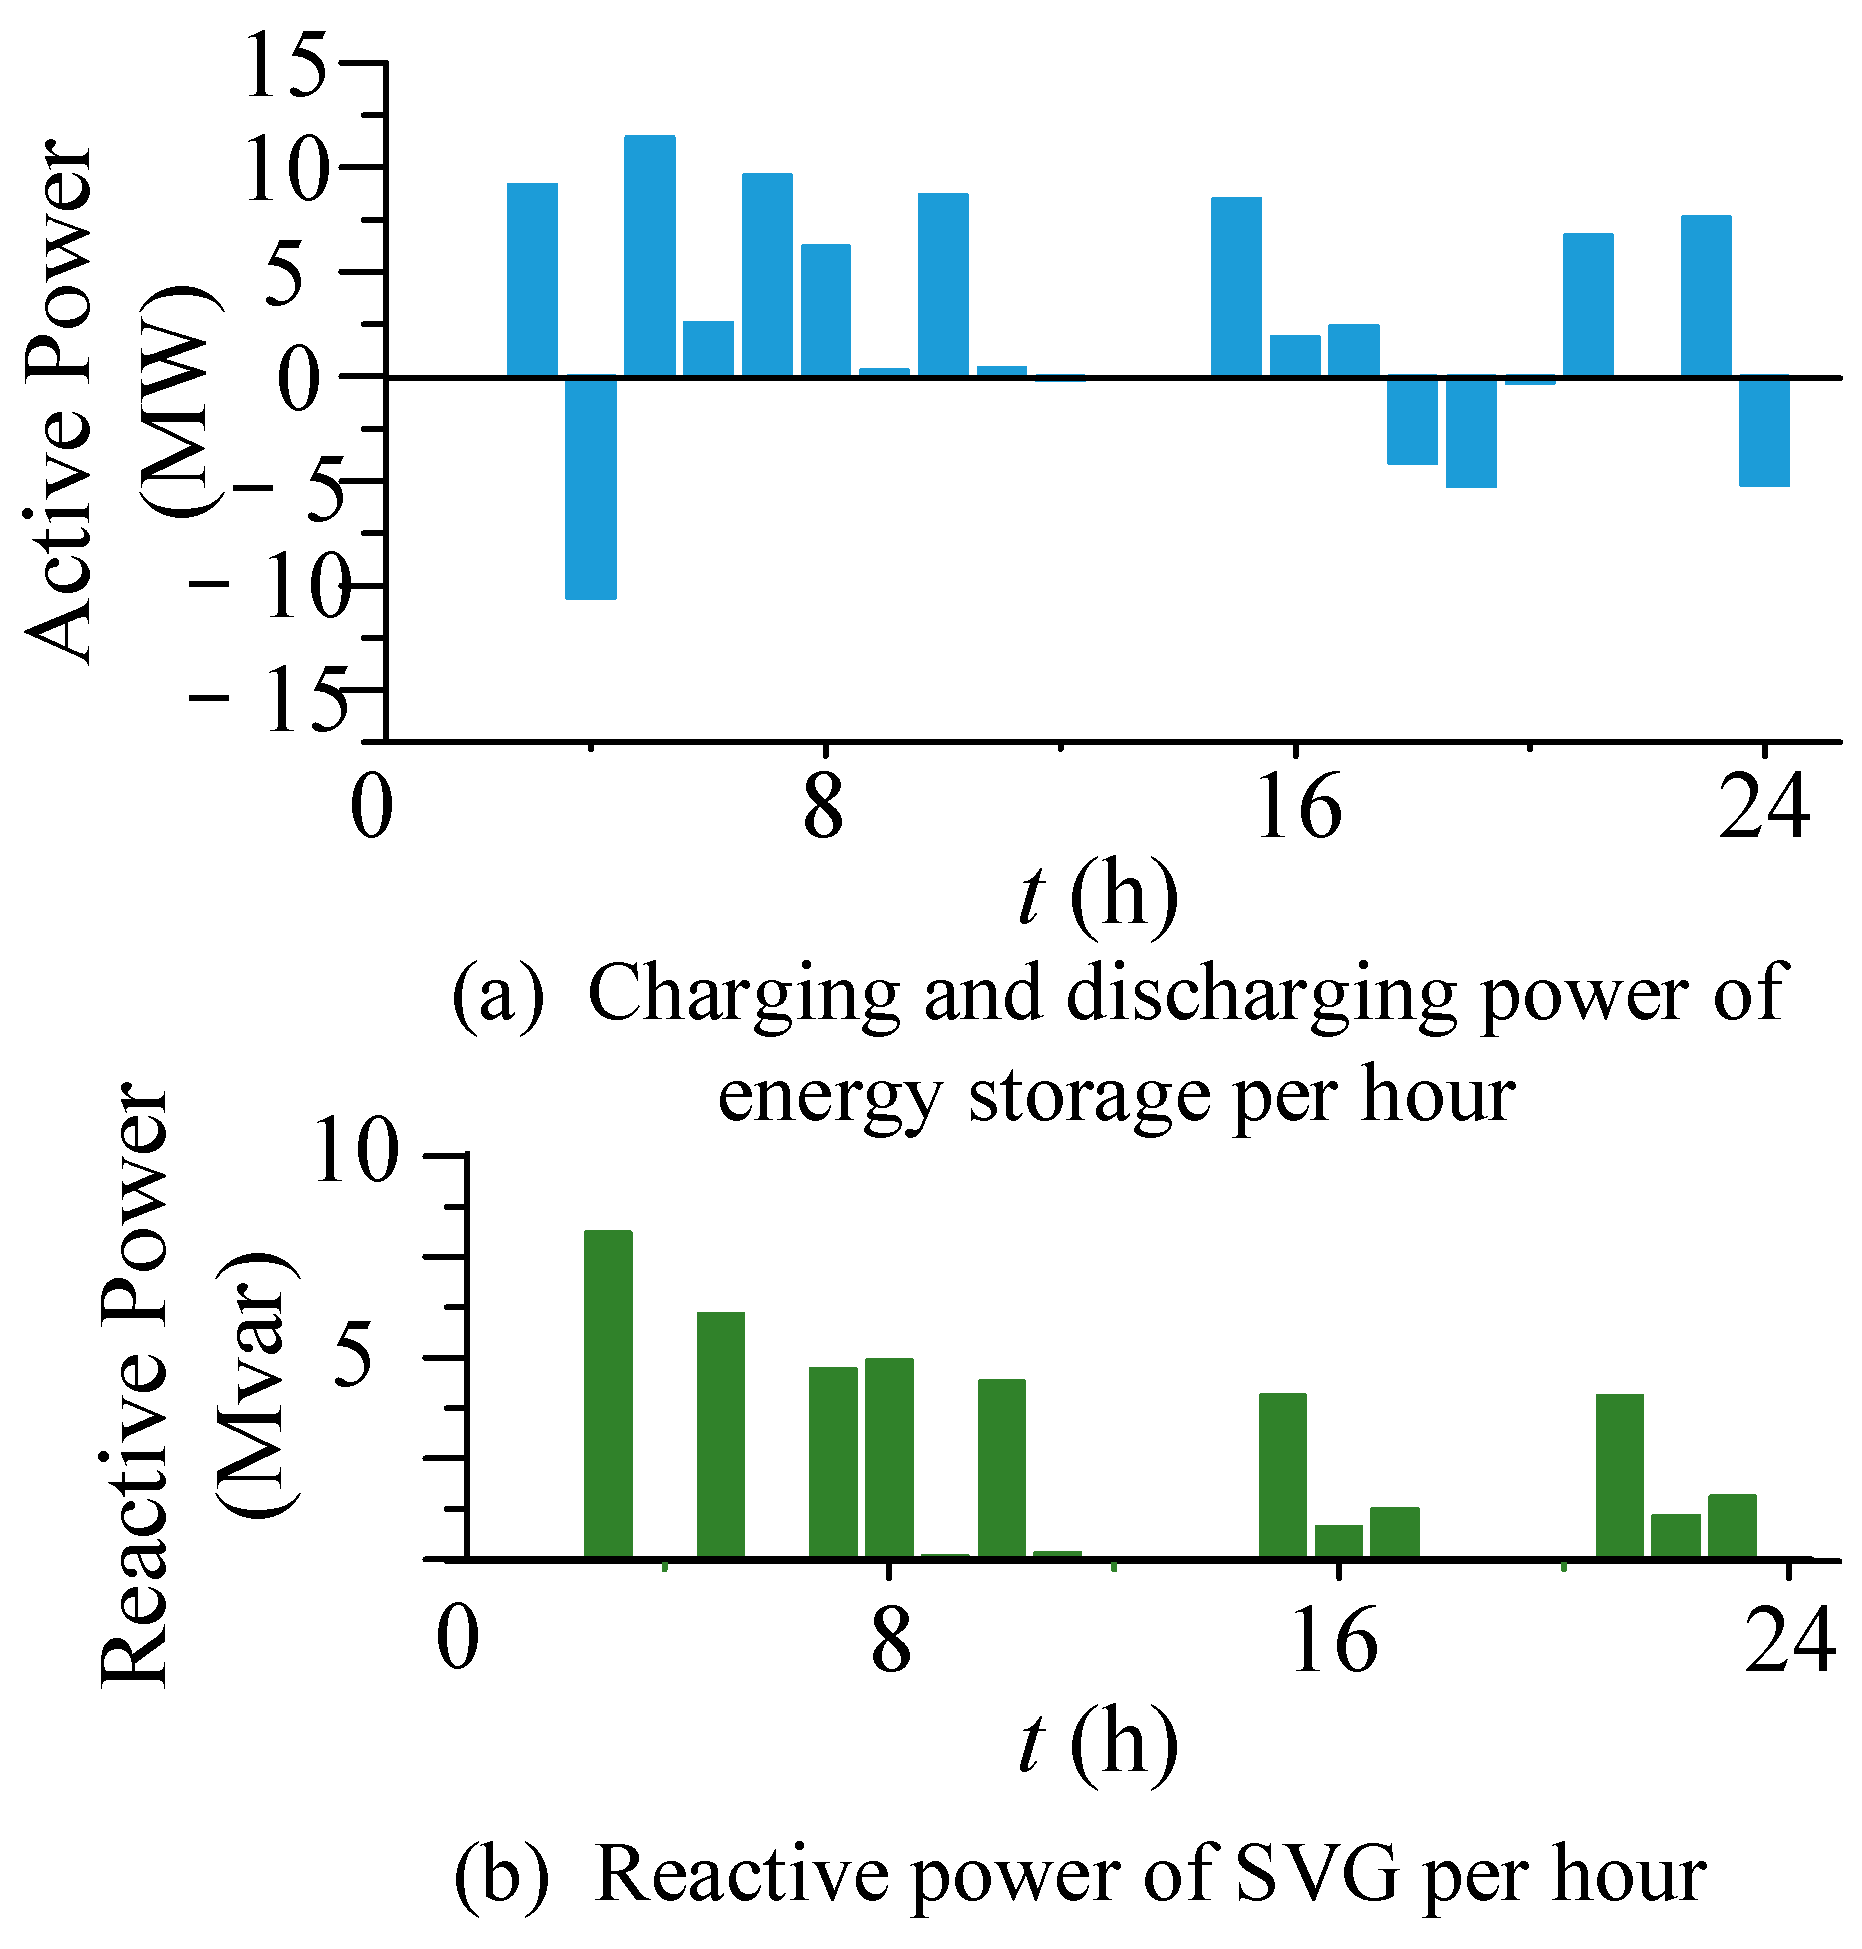
5.2. Result Analysis

For the generation uncertainty, the number of wind farm group subdivisions is set to 10, and the confidence probability is set to 60%. The comparison between the configuration scheme and the annualized income of the VSCOM in the extreme case that the output deviation of the typical daily wind farm is at the upper boundary can be shown in Table 2.
It can be seen from Table 2, due to the increased configuration of reactive power generators, compared with configuring single energy storage, the investment cost of allocating VSCOM is increased by 1.34 million (by increasing 26.33%). Compared with single energy storage, the configured capacity of mixed energy storage will be reduced from 35 MW to 30 MW; hence, the investment cost can be reduced. Moreover, due to the VSCOM can provide voltage support, the penalty cost can be reduced accordingly, thus increasing the overall income of the high proportion of new energy systems, in which the net income increases by 19.19%. Hence, the VSCOM can not only improve the friendly grid connection capability of new energy power generation, but can also improve the overall benefits for a high proportion of new energy systems.
In extreme cases based on historical data, the power corresponding to the minimum spinning reserve kinetic energy possessed by a high proportion of new energy systems can be shown as Figure 5.
By comparing the power corresponding to the minimum spinning reserve kinetic energy with the rated power obtained by the optimization configuration method proposed in Figure 5. Although at 1 h, 2 h and 9 h, the minimum spinning reserve kinetic energy cannot meet with the inertia demand, at other times, it is easy to find that the rated power can meet with the inertia demand on the premise of both economy and robustness at most of a day.
To prove the feasibility of the method proposed in this paper, based on the historical data, the Monte Carlo method is used to simulate the predicted and actual output power of typical daily wind farm stations (Figure 6). On the basis of the above optimized configuration results, the active and reactive power of each sub unit can be shown in Figure 7.
As can be seen in Figure 7a,b, the charging and discharging times of energy storage and the action times of SVG are more frequent, the VSCOM utilization has been improved, which further verifies that the proposed method can balance the economy and robustness of the configuration results. It can also be seen from Figure 7 that the active charging and discharging power and reactive power generation power of energy storage and SVG in VSCOM are within the range of optimal configuration results, and can meet the operation constraints of each sub unit. Therefore, the feasibility of the optimal robust capacity configuration strategy proposed in this paper is verified.

5.3. Sensitivity Analysis

The number of wind farm group subdivisions is set to be 10, and the confidence probabilities (αw) are set to be 98%, 95%, and 80%, respectively. In the extreme case of the upper boundary, the configuration scheme of VSCOM and the annualized revenue are compared as shown in Table 3.
As can be seen from Table 3, the confidence probabilities of different wind power output uncertainties will affect the configuration of each sub unit in VSCOM; in particular, it has a significant impact on the configuration of energy storage subunits. The confidence probabilities (αw) are 98%, 95%, and 80%, respectively, and the storage capacity is 45 MW, 55 MW, and 70 MW, respectively. For the lower αw, it will require more storage and SVG capacity, although the cost of VSCOM will increases; however, considering the benefits of participating in active and reactive power support and regulation, the annualized net profit of a high proportion of IBG systems continues to increase. However, it can also be seen from the Table 3 that with the decrease in αw (from 98% to 80%), the POE increases rapidly, indicating that the robustness decreases rapidly, too.
For a case in which the confidence probability is 97%, the number of wind farm group subdivisions (NW) is set to be 2, 10, and 20, respectively. In the extreme case of the upper boundary, the comparing different VSCOM configurations and the annualized income associated are shown in Table 4.
In Table 4, for the different Nw (from 2 to 20), energy storage (from 48 to 51) and SVG (from 18 to 21) capacity have a little change, which indicates that the number of wind farm group subdivisions the spatial cluster effect of wind power output uncertainty has less significant impact on VSCOM configuration results and system net profit. However, as can also be seen from Table 4, for different Nw, it has a significant impact on the POE. When the Nw is 2, the POE can be reached to 54.4%, and when the Nw is 20, the POE reduced to only 0.13%, which indicates that the system robustness decreases and the system operation will face greater risks with the Nw decreases.

6. Conclusions

To meet the challenges faced by the stable operation in the model power system and promote the coordinated development of new energy and power grids, this paper proposes a basic structure of VSCOM, the VSCOM can flexibly adjust active power, reactive power, and inertia, which greatly improves the comprehensive regulation performance of IBGs. Moreover, an optimal capacity allocation strategy of VSCOM for the IBGs is proposed, which can give consideration to both the economy and robustness of the allocation results, and it can also improve the overall income of high proportion of new energy systems.
To further promote the engineering practicability of the VSCOM, on the basis of this paper, the trading mechanism of the VSCOM, participating in the electric energy market, auxiliary service market, capacity market, and inertia market, can be further researched in the future work.

Author Contributions

Conceptualization, Z.X. and P.S.; methodology, C.Y.; software, P.K.; validation, C.Y., B.Z. and Z.X.; formal analysis, C.Y.; investigation, C.Y.; resources, C.Y. and Z.X.; data curation, P.S.; writing—original draft preparation, C.Y.; writing—review and editing, Z.X.; visualization, C.Y.; supervision, C.Y.; project administration, C.Y.; funding acquisition, C.Y. All authors have read and agreed to the published version of the manuscript.

Funding

This research was supported in part by Natural Science Foundation of Xinjiang Uygur Autonomous Region, China (2022D01C85).

Data Availability Statement

Not applicable.

Conflicts of Interest

The authors declare no conflict of interest.

References

  1. Alam, M.S.; Al-Ismail, F.S.; Salem, A.; Abido, M.A. High-Level Penetration of Renewable Energy Sources into Grid Utility: Challenges and Solutions. IEEE Access 2020, 8, 190277–190299. [Google Scholar] [CrossRef]
  2. Singh, B.; Arya, S.R. Adaptive theory-based improved linear sinusoidal tracer control algorithm for DSTATCOM. IEEE Trans. Power Electron. 2013, 28, 3768–3778. [Google Scholar] [CrossRef]
  3. Srinivas, M.; Hussain, I.; Singh, B. Combined LMS-LMF-based control algorithm of DSTATCOM for power quality enhancement in distribution system. IEEE Trans. Ind. Electron. 2016, 63, 4160–4168. [Google Scholar] [CrossRef]
  4. Badoni, M.; Singh, A.; Singh, B. Adaptive neurofuzzy inference system least-mean-square-based control algorithm for DSTATCOM. IEEE Trans. Ind. Informat. 2016, 12, 483–492. [Google Scholar] [CrossRef]
  5. Farivar, G.; Hredzak, B.; Agelidis, V.G. Reduced-capacitance thin film H-bridge multilevel STATCOM control utilizing an analytic filtering scheme. IEEE Trans. Ind. Electron. 2015, 62, 6457–6468. [Google Scholar] [CrossRef]
  6. Badoni, M.; Singh, A.; Singh, B. Variable forgetting factor recursive least square control algorithm for DSTATCOM. IEEE Trans. Power Del. 2015, 30, 2353–2361. [Google Scholar] [CrossRef]
  7. Zhang, X.; Liu, Y.; Duan, J.; Qiu, G.; Liu, T.; Liu, J. DDPG-Based Multi-Agent Framework for SVC Tuning in Urban Power Grid With Renewable Energy Resources. IEEE Trans. Power Syst. 2021, 36, 5465–5475. [Google Scholar] [CrossRef]
  8. Wan, Y.; Murad, M.A.A.; Liu, M.; Milano, F. Voltage frequency control using SVC devices coupled with voltage dependent loads. IEEE Trans. Power Syst. 2019, 34, 1589–1597. [Google Scholar] [CrossRef]
  9. Singh, B.; Arya, S.R. Back-propagation control algorithm for power quality improvement using DSTATCOM. IEEE Trans. Ind. Electron. 2014, 61, 1204–1212. [Google Scholar] [CrossRef]
  10. Chen, J.; Liu, M.; Milano, F.; O’Donnell, T. 100% Converter-interfaced Generation using Virtual Synchronous Generator Control: A case study based on the Irish System. Electr. Power Syst. Res. 2020, 187, 106475. [Google Scholar] [CrossRef]
  11. D’Arco, S.; Suul, J.A.; Fosso, O.B. A Virtual Synchronous Machine implementation for distributed control of power converters in Smart Grids. Electr. Power Syst. Res. 2015, 122, 180–197. [Google Scholar] [CrossRef]
  12. Zhong, Q.C.; Weiss, G. Synchronverters: Inverters that mimic synchronous generators. IEEE Trans. Ind. Electron. 2011, 58, 1259–1267. [Google Scholar] [CrossRef]
  13. Liu, B.; Zhao, J.; Huang, Q.; Milano, F.; Zhang, Y.; Hu, W. Nonlinear Virtual Inertia Control of WTGs for Enhancing Primary Frequency Response and Suppressing Drivetrain Torsional Oscillations. IEEE Trans. Power Syst. 2021, 36, 4102–4113. [Google Scholar] [CrossRef]
  14. Chen, J.; Milano, F.; O’Donnell, T. Assessment of Grid-Feeding Converter Voltage Stability. IEEE Trans. Power Syst. 2019, 34, 3980–3982. [Google Scholar] [CrossRef]
  15. Li, G.; Ma, F.; Wang, Y.; Weng, M.; Chen, Z.; Li, X. Design and Operation Analysis of Virtual Synchronous Compensator. IEEE J. Emerg. Sel. Top. Power Electron. 2020, 8, 3835–3845. [Google Scholar] [CrossRef]
  16. Xu, Z.; Chen, Y.; Zhai, B.; Chen, G.; Yang, Q.; Chen, J. A Comparative Study of the Virtual Synchronous Compensator on the Voltage Stability Enhancement. In Proceedings of the International Conference on Renewable Energies and Smart Technologies (REST2022), Tirana, Albania, 28–29 July 2022. [Google Scholar]
  17. Li, G.; Chen, Y.; Luo, A.; Wang, H. An Enhancing Grid Stiffness Control Strategy of STATCOM/BESS for Damping Sub-Synchronous Resonance in Wind Farm Connected to Weak Grid. IEEE Trans. Ind. Informat. 2020, 16, 5835–5845. [Google Scholar] [CrossRef]
  18. Vetoshkin, L.; Müller, Z. Dynamic Stability Improvement of Power System by Means of STATCOM with Virtual Inertia. IEEE Access 2021, 9, 116105–116114. [Google Scholar] [CrossRef]
  19. Chen, J.; Liu, M.; Guo, R.; Zhao, N.; Milano, F.; O’Donnell, T. Co-ordinated grid forming control of AC-side-connected energy storage systems for converter-interfaced generation. Int. J. Electr. Power Energy Syst. 2021, 133, 107201. [Google Scholar] [CrossRef]
  20. Li, Y.; Feng, C.; Wen, F.; Wang, K.; Huang, Y. Energy Pricing and Management for Park-level Energy Internets with Electric Vehicles and Power-to-gas Devices. Autom. Electr. Power Syst. 2018, 16, 1–10. [Google Scholar]
  21. Wu, J.; Ai, X.; Hu, J.; Wu, Z. Peer-to-peer Modeling and Optimal Operation for Prosumer Energy Management in Intelligent Community. Power Syst. Technol. 2020, 11, 52–61. [Google Scholar]
  22. Ma, L.; Liu, N.; Zhang, J.; Wang, L. Real-Time Rolling Horizon Energy Management for the Energy-Hub-Coordinated Prosumer Community from a Cooperative Perspective. IEEE Trans. Power Syst. 2019, 2, 1227–1242. [Google Scholar] [CrossRef]
  23. Samira, S.F.; Bleeker, C.; van Wijk, A.; Lukszo, Z. Hydrogen-based integrated energy and mobility system for a real-life office environment. Appl. Energy 2020, 264, 114695. [Google Scholar]
  24. Li, X.; Wang, W.; Wang, H.; Fan, X.; Wu, J.; Wang, K. Energy Storage Allocation Strategy of Wind-solar-storage Combined System Based on Robust Optimization. Acta Energ. Sol. Sin. 2020, 8, 67–78. [Google Scholar]
  25. Guo, Z.; Li, G.; Zhou, M.; Wang, X. A Decentralized and Robust Optimal Scheduling Model of Integrated Electricity-gas System for Wind Power Accommodation. Proc. CSEE 2020, 20, 6442–6455. [Google Scholar]
  26. Li, H.; He, F.; Chen, Y.; Luo, J. Multi-objective self-organizing optimization for constrained sparse array synthesis. Swarm Evol. Comput. 2020, 58, 100743. [Google Scholar] [CrossRef]
  27. Liu, D.; Tan, K.C.; Goh, C.K.; Ho, W.K. A Multiobjective Memetic Algorithm Based on Particle Swarm Optimization. IEEE Trans. Syst. Man Cybern. Part B Cybern. 2007, 37, 42–50. [Google Scholar] [CrossRef]
  28. Anping, H.U.; Bo, Y.A.N.G.; Pengpeng, P.A.N. Study on Inertial Characteristics of Energy Storage System with Power Electronic Interface. Proc. CSEE 2018, 17, 4999–5008. [Google Scholar]
  29. Tan, J.; Zhang, Y. Coordinated control strategy of a battery energy storage system to support a wind power plant providing multi-timescale frequency ancillary services. IEEE Trans. Sustain. Energy 2017, 3, 1140–1153. [Google Scholar] [CrossRef]
  30. Kuang, L.; Lu, Y.; Lu, X.; Lin, X. Frequency Stability Constrained Optimal Dispatch Model of Microgrid with Virtual Synchronous Machines. Proc. CSEE 2022, 1, 71–83. [Google Scholar]
  31. Li, X.; Wang, W.; Wang, H.; Wu, J.; Xu, Q. Robust Optimized Operation Strategy for Cross-region Flexibility with Bilateral Uncertainty of Load Source. High Volt. Eng. 2020, 05, 1538–1549. [Google Scholar]
  32. Mirjalili, S. Moth-flame optimization algorithm: A novel nature-inspired heuristic paradigm. Knowl.—Based Syst. 2015, 89, 228–249. [Google Scholar] [CrossRef]
Figure 1. The structure of VSCOM connected with IBG plant.
Energies 15 09306 g001
Figure 2. Solution process of the optimization algorithm.
Energies 15 09306 g002
Figure 3. Modified IEEE4 system structure diagram.
Energies 15 09306 g003
Figure 4. Typical daily power generation and consumption.
Energies 15 09306 g004
Figure 5. Power corresponding to minimum spinning reserve kinetic energy.
Energies 15 09306 g005
Figure 6. Predicted and actual power on Typical Days.
Energies 15 09306 g006
Figure 7. Active and Reactive Power on Typical Days.
Energies 15 09306 g007
Table 1. Parameter Settings of VSCOM Subunits.
StylesInvestment Cost
(RMB/MWh)
Service Life
(Year)
Charge State
Storage325,000200.1~0.9
SVG10,00020-
Table 2. Comparison of annual income between VSCOM and single energy storage configuration scheme.
Energy Storage TypeConfiguration Capacity/(MW)Income from Grid/(RMB)Investment Cost/(RMB)Penalty Cost/(RMB)Total Income/(RMB)
HybridLithium301.27 × 1087.43 × 1058.28 × 1073.56 × 108
SingleLithium351.17 × 1085.09 × 1059.33 × 1073.36 × 108
Table 3. Comparison of allocation schemes and annualized returns under different confidence probabilities.
α w Configuration Scheme (MW)Net Profit
(Million RMB)
POE
StorageSVG
98%451857.30.02%
95%552564.61.11%
80%703070.224.23%
Table 4. Spatial Cluster Effect Allocation Scheme and the Influence of Annualized Earnings.
N w Configuration Scheme (MW)Net Profit
(Million Yuan)
POE
StorageSVG
2481869.554.4%
10502069.60.76%
20512169.60.13%
Publisher’s Note: MDPI stays neutral with regard to jurisdictional claims in published maps and institutional affiliations.

