Article

Numerical Investigation of the Enhanced Stirring Characteristics of a Multi-Lance Top-Blowing Continuous Converting Furnace for Lance Arrangement and Variable-Velocity Blowing

1
State Key Laboratory of Complex Nonferrous Metal Resources Clean Utilization, Kunming University of Science and Technology, Kunming 650093, China
2
Engineering Research Center of Metallurgical Energy Conservation and Emission Reduction, Ministry of Education, Kunming University of Science and Technology, Kunming 650093, China
3
Southwest Copper Branch of Yunnan Copper Co., Ltd., Kunming 650102, China
*
Authors to whom correspondence should be addressed.
Energies 2023, 16(5), 2412; https://doi.org/10.3390/en16052412
Submission received: 5 January 2023 / Revised: 6 February 2023 / Accepted: 20 February 2023 / Published: 2 March 2023
(This article belongs to the Special Issue Advanced Analysis of Heat Transfer and Energy Conversion)

Abstract

:
Oxygen lances are key equipment for copper converters. The effect of the lance arrangement on the mixing of a gas–slag two–phase is discussed using numerical simulation and experimental verification with a water model, and the stirring characteristics enhanced by variable–velocity blowing are explored. The results showed that the single–row lance arrangement (SA) increased the average velocity in the slag phase by 17.93% and reduced the disturbance to the metal phase by 27.78% compared to the double–row lance arrangement (DA). Compared to the constant–velocity blowing system (CSB), the sine–wave blowing system (SWB) and rectangular–wave blowing system (RWB) increased the average velocity in the slag phase by 24.03% and 13.96%, respectively, and reduced the proportion of the low–velocity area by more than 46.2%. The velocity imbalance in the SA local area enhances the mixing of the gas–slag two–phase. The variable–speed blowing improves the mass transfer and mixing effect.

1. Introduction

Copper is one of the world’s most widely used metals; typical copper–smelting processes include pyrometallurgy and hydrometallurgy [1,2,3]. The pyrometallurgical copper–smelting process consists of four main steps. In the first step, the copper concentrate is smelted into copper matte. The second step further converts copper matte into blister copper. In the third step, blister copper is refined using a pyrometallurgical anode to produce anode copper, and in the fourth step the anode copper is re–refined with electrolysis to produce electrolytical copper [4]. Nowadays, the continuous copper–smelting process has gained more attention. In recent years, China’s ENFI has developed copper–smelting technology with three continuous furnaces in thermal operation: an oxygen–enriched side–blowing smelting furnace, a multi–lance top–blowing continuous converting furnace, and a pyrometallurgical anode refining furnace. This technology achieves continuous copper smelting with low energy consumption and has the advantages of strong adaptability to materials, minor process flow, high overall process efficiency, and low production cost [5]. The process context of this study is a non–submerged top–blowing converter, where a non–submerged top–blowing continuous blowing technology is used instead of the conventional blowing technology in a three–continuous–furnace process.
Due to the high temperature inside the melt bath, the flow characteristics inside the melt bath are currently analyzed mainly with numerical simulations and then verified using the water–modeling method. Song et al. [6] considered that different furnace structures and different gas injection methods would cause different fluid flow phenomena in the furnace, and the use of water models and numerical simulations to study the metallurgical processes is a proven tool. Chibwe et al. [7,8] investigated two aspects of the industrial–scale Peirce–Smith converter model using the volume–of–fluid method (VOF) for two–dimensional (2D) and three–dimensional (3D) numerical simulations and investigated the flow characteristics, mixing, and slag–phase distribution using comparative numerical and physical simulations. The mixing and dispersion characteristics of the system associated with various blowing conditions were predicted. Zhao et al. [9] established a water model with a water model:actual industrial size of 1:10, and subsequently the mixing process under different lance parameters was measured using the conductivity method, where the conductivity was used to determine whether the mixing time was reached and an empirical equation for the mixing time under different parameters was established. Wang et al. [10] designed an experimental method for slag foaming, and using this method, non–submerged top blowing and bottom blowing were investigated stirring on the foaming of composite converter slag. Li et al. [11] used VOF to numerically investigate the interaction of multiple jets with the slag–metal melt bath in a top–blowing converter, in addition to the more significant effects of pressure and oxygen–lance height on the phase interface behavior, cavity shape, and flow characteristics in the melt bath. Dong et al. [12] used VOF to compare the impact effect of a conventional lance and a single–flow secondary combustion (PC) lance on the surface of the slag phase, and the simulation results showed that the PC lance was more favorable to the mixing and stirring of the melt bath. Yang et al. [13] obtained a prediction model for gas-liquid mixing in rectangular channels by experiments as well as algorithms. Wang et al. [14] used the VOF method to compare the effect of gas-liquid mixing in top blowing with different oil-gas ratios, and verified it by water model experiments. Therefore, simulation and water modeling experiments are common analytical methods in the field of metallurgy, and VOF is a more common simulation method in top–blowing converters. In this document, VOF is used to observe the interfacial changes between phases and the development of velocity fields.
Many scholars have studied the oxygen lance and the combined blowing process. Liu et al. [15] conducted a numerical simulation of the energy transfer from the lance nozzle to the molten bath for a 260t industrial steelmaking converter and simulated the top blowing of a six–nozzle oxygen lance to quantify the energy consumed by different parts of the blowing process such as dissipation, molten bath agitation, cavity formation, and splash according to the lance height. Jia et al. [16] investigated the advantages of six staggered oxygen–lance nozzles over conventional nozzles for stirring. The study focused on the deformation of the free surface and the spattering conditions to determine the optimal nozzle angle and flow rate. Hu et al. [17] studied the effect of the angle between the top–blow oxygen lance and the bottom–blow lance in the radial direction on the slag flow characteristics under top–blowing conditions, revealed the principle of fluid dynamics in the top–blow converter, established a mathematical model of the furnace lining being eroded, and studied the erosion characteristics of its furnace lining. Zhao et al. [18] studied the effect of various problems with the lance on the flow field, slag spattering, and wall shear of the lance and furnace body, and listed the factors that limit the service life of the lance. Their simulation results also showed that if the lance works in a bent condition, a large amount of metal slag spatter will be generated, which is not conducive to the metal settling and stirring. Li et al. [19] combined the volume–of–fluid model and discrete–phase multiphase flow model to establish a simulation calculation model of the gas–liquid two–phase flow in the top–bottom combined–blowing steelmaking converter. The effects of the number of air outlets, distribution position, and height of the top oxygen lance of the bottom blowing on the slag–phase flow pattern were studied and the correctness of the simulation was verified using the method of measured results. Seshadri et al. [20] studied the top–bottom combined blowing converter process by means of establishing a geometric model with numerical simulation. Li et al. [21] studied the combined top–bottom-blowing converter, revealed the effect of combined top–blow and bottom–blow conditions on the melt pool flow and mixing behavior, and investigated the mixing from the interaction of the characteristics of the bottom–blow plume with the top–blow oxygen jet and the change in the flow pattern in the furnace. The formation mechanism of the results was investigated in terms of the interaction between the characteristics of the bottom–blow plume and the top–blow oxygen jet as well as the change of the flow pattern in the furnace.
In addition, the process of continuous blowing has been studied. Park et al. [22] performed a sound and comprehensive three–dimensional numerical simulation and industrial field experiments on the Mitsubishi continuous copper–refining process. Lim et al. [23,24] investigated the causes of lance breakage in the smelting furnace of the Mitsubishi continuous–production copper process. Oxygen lances used in industrial production were investigated and thermodynamically relevant analyses as well as experiments were performed.
In contrast to the above investigation of a single oxygen lance, this article applies to a multi–lance continuous converter for copper smelting. This study focuses on the oxygen–lance parameters of the multi–lance top–blow converter, including its oxygen–lance arrangement and jet–velocity control. The stirring characteristics of the single–row arrangement and double–row arrangement are compared, and the momentum transfer effects of fixed–rate blowing and variable–rate blowing are compared. The stirring–enhancement mechanism of the single–row arrangement of oxygen lances and variable–speed blowing is explored with numerical simulation and a water–model experiment, and the arrangement design and working parameters of multiple oxygen lances are optimized.

2. Numerical Model

2.1. Basic Assumptions

(1)
Oxygen is an ideal compressible gas for a gas source.
(2)
Ignore the influence of the charging and discharging ports on the converter flow field.
(3)
Only consider the spray gun’s impact in the oxygen–rich air on the melt and the diffusion of the stirring form.
(4)
Do not consider the chemical reaction inside the melt bath.

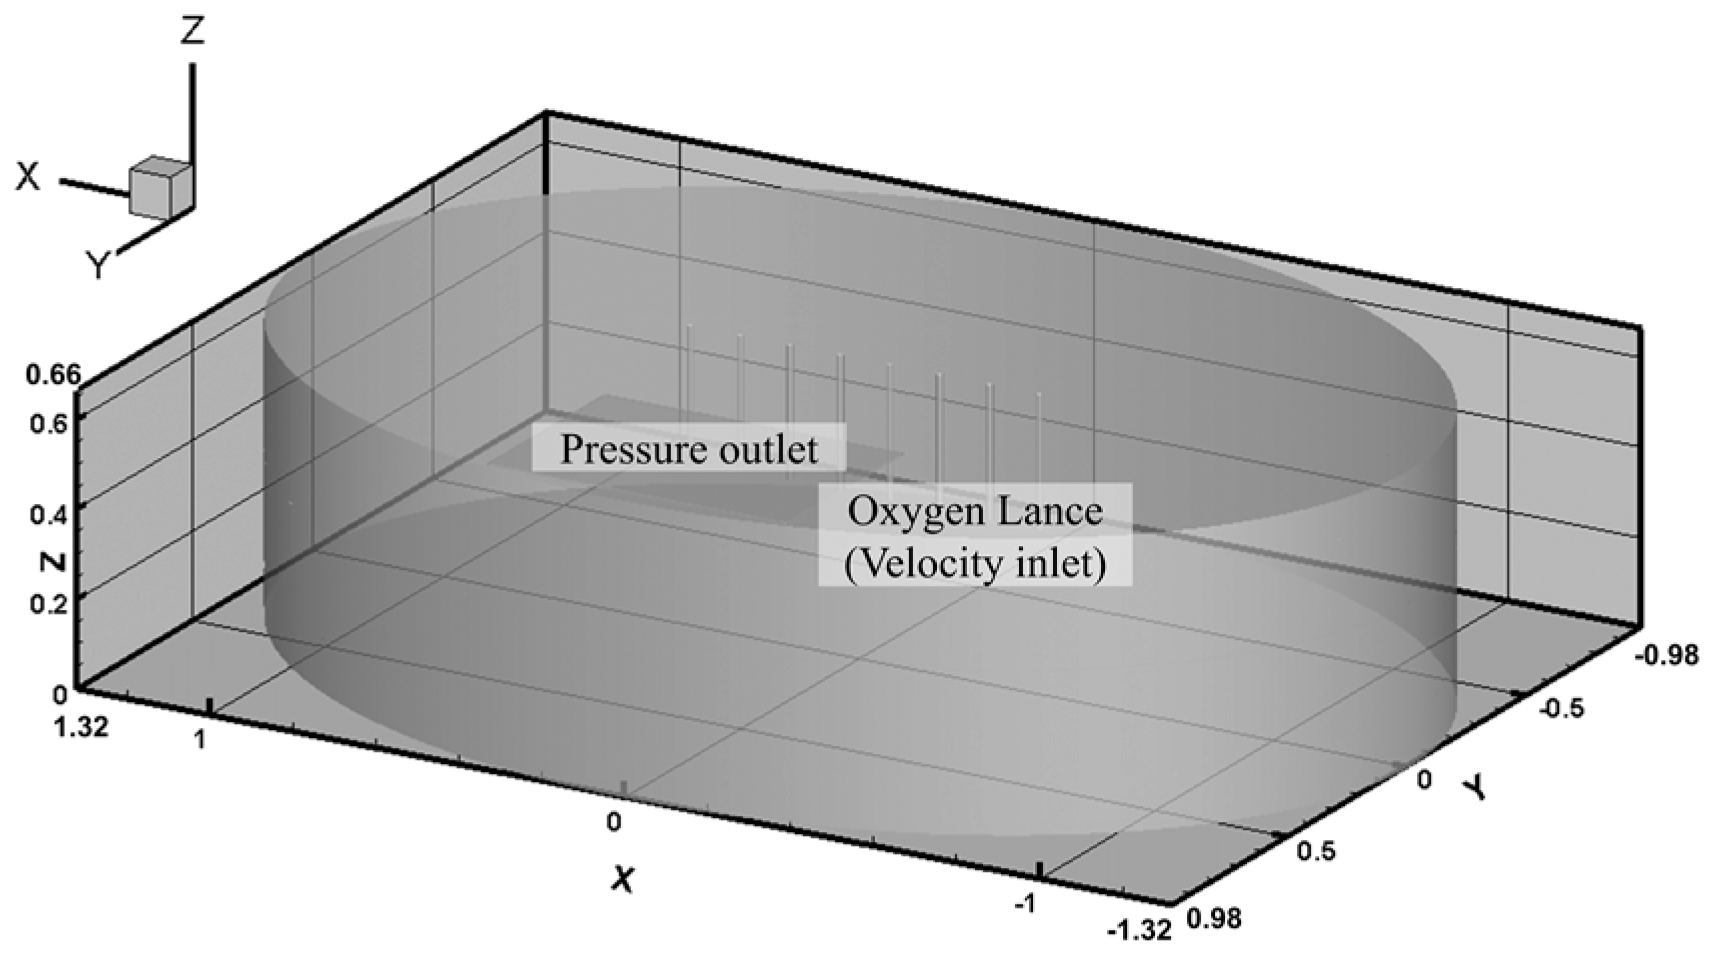
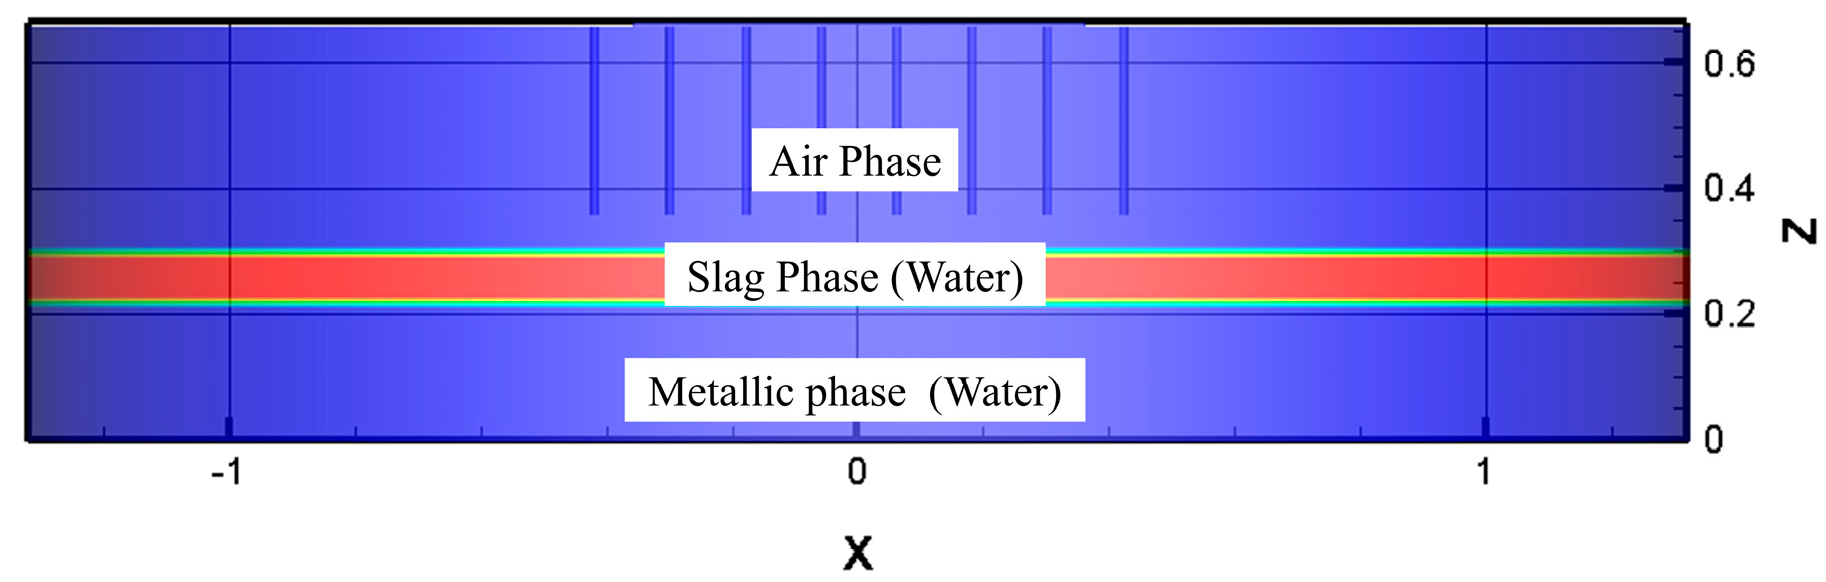
2.2. Model Establishment

In this investigation, the furnace structure is shown in Figure 1, and the blowing furnace used is oval in the horizontal direction, with a major axis length of 2.64 m, a minor axis length of 1.96 m, and a height of 0.66 m. The top–blowing method selected in this investigation is non–submerged top blowing, where the oxygen lance is located above the slag phase, with stirring and reaction caused by the impact of the high–velocity jets on the slag–phase fluid. The inlet velocity of the oxygen lance is 50 m/s, the number of oxygen lances is 8, and the diameter of the oxygen lance is 15.2 mm. The use of multiple top–blow lances is beneficial to match the oval furnace structure. The boundary condition of the furnace cover is set to the pressure outlet and the lower section of the oxygen lance is set to the velocity inlet.
This investigation in the simulation of the physical phase layer is divided as shown in Figure 2. In order to match the water model of the experiment, the copper slag and metal phases are used in the physical parameters of water, but the main object of study of the top blowing is the stirring effect of oxygen–rich air on the copper slag phase, so in the simulation is divided into two phases in the region of water in the furnace.

2.3. Governing Equation

Among many multiphase flow models, VOF is mainly used to capture the phase interface of two or more fluids. The capture of the phase interface is accomplished by solving the continuity equation (for the volume fraction of one or more phases), which has the following form:
1 ρ q [ t ( α q ρ q ) + · ( α q ρ q v q ) = S α q + p = 1 n ( m ˙ p q m ˙ q p ) ]
where m ˙ p q is the mass transfer from p—phase to q—phase and m ˙ q p is the mass transfer from q—phase to p—phase. In general, S α q = 0 .
The volume fraction equation will not be solved for the primary phase; the primary–phase volume fraction will be computed based on the following constraint:
q = 1 n ( α q ) = 1
The standard k–ε model can simulate a more realistic high–viscosity fluid–flow situation with the relevant transport equation:
t ( ρ k ) + x i ( ρ k u i ) = x j [ ( μ + μ t σ k ) k x j ] + G k + G b ρ ε Y M + S k
t ( ρ ε ) + x i ( ρ ε u i ) = x j [ ( μ + μ t σ ε ) ε x j ] + G 1 ε ε k ( G k + G 3 ε G b ) G 2 ε ρ ε 2 k + S ε
In these equation, G k denotes the turbulent kinetic energy due to the mean velocity gradient, G b is the turbulent kinetic energy due to buoyancy, Y M denotes the contribution of nonlinear expansion in compressible turbulence to the total dissipation rate, G 1 ε , G 2 ε and G 3 ε are empirical constant terms, ε is the turbulent dissipation rate, and k and ε are the Prandtl numbers corresponding to the turbulent kinetic energy and turbulent dissipation rate, respectively.
G k = μ t ( u i x j + u j x i ) u i x j
G b = β g i u t P r t T x i
β = 1 ρ ρ T
P r t is the turbulent Prandtl number, g i is the gravitational acceleration component in the i −direction, and β is the thermal expansion coefficient.
Y M = 2 ρ ε M t 2
M t = k / a 2
a = γ R T
M t is the turbulent Mach number, and a is the local sound speed.

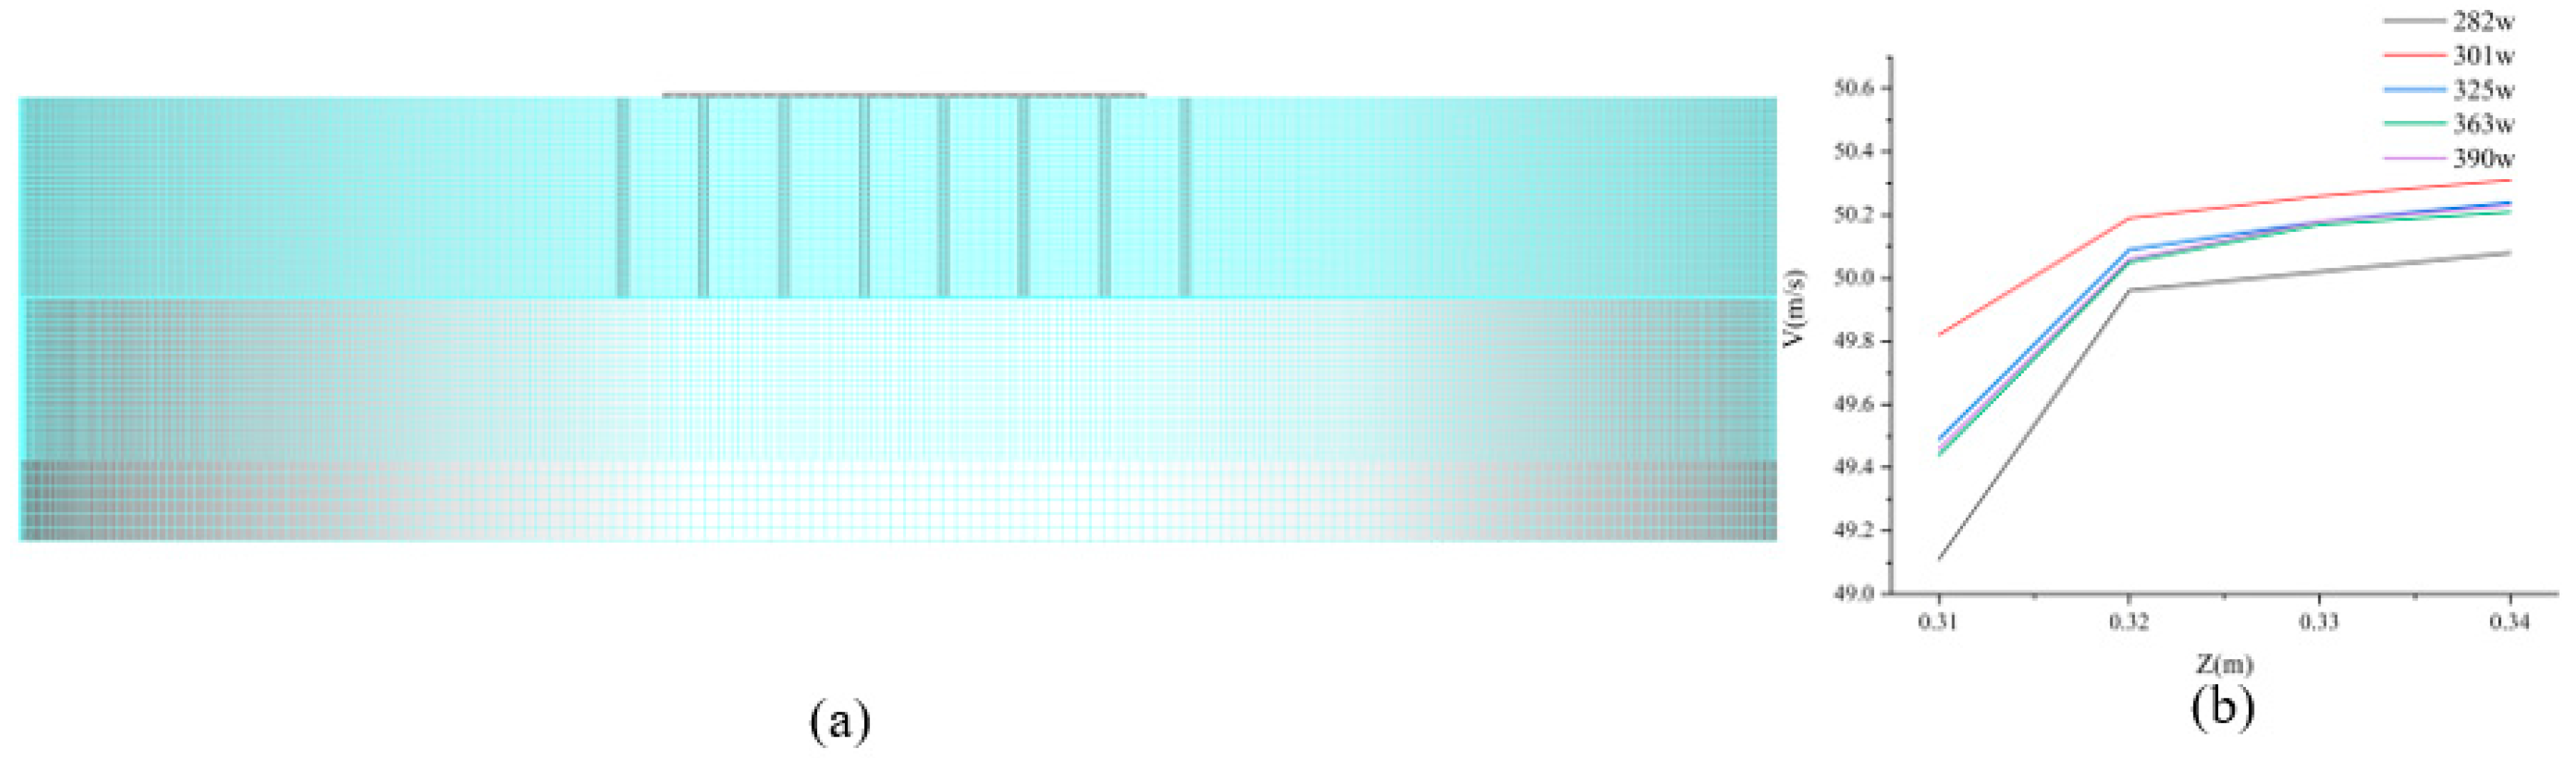
2.4. Mesh Generation

The grid model used to simulate the top–blowing converter and the grid independence verification is shown in Figure 3. Too many meshes will waste computational resources, while too few meshes will lead to less–accurate calculation results. In this study, the hexahedron dominant is used to divide the mesh, and for the area with higher flow velocity, that is, the area from the bottom of the lance to the upper 1/3 of the metallic phase, local encryption is performed, and the mesh is sparse in the area above the lance and the lower 2/3 of the metallic phase. Finally, considering the computational resources and the computational accuracy, a structured grid of 325 w was selected.

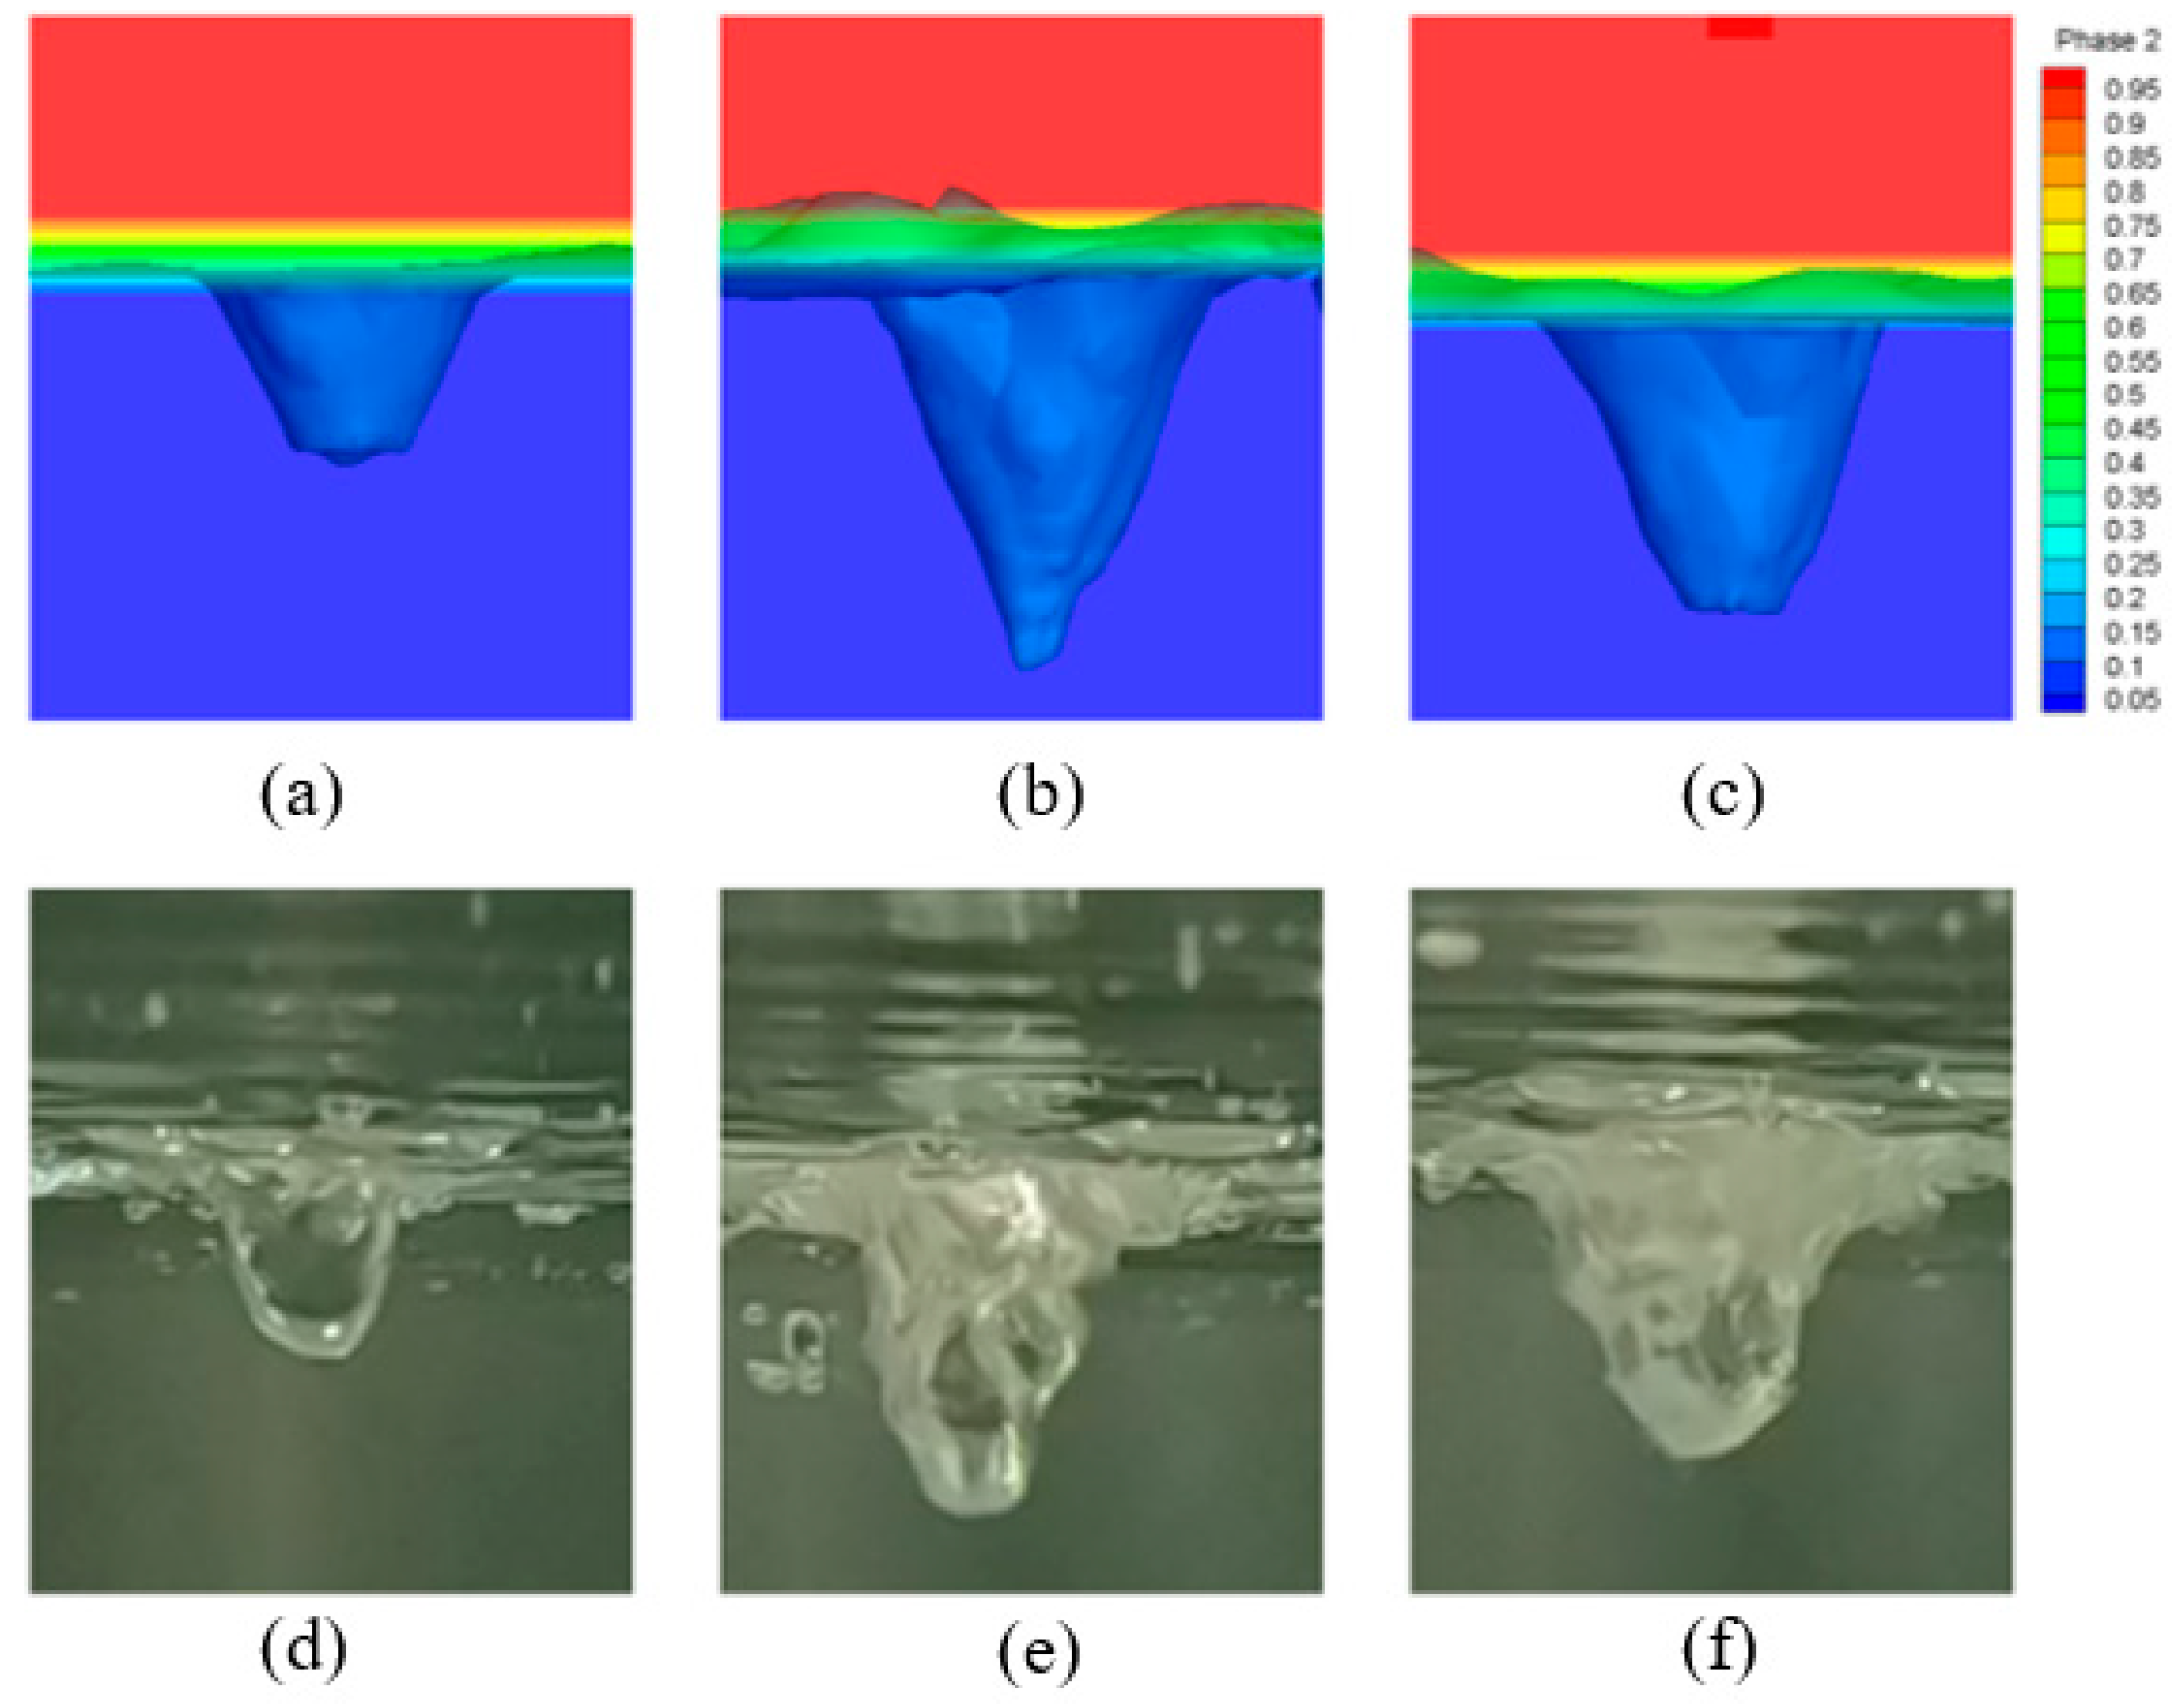
3. Model-Verification Experiment

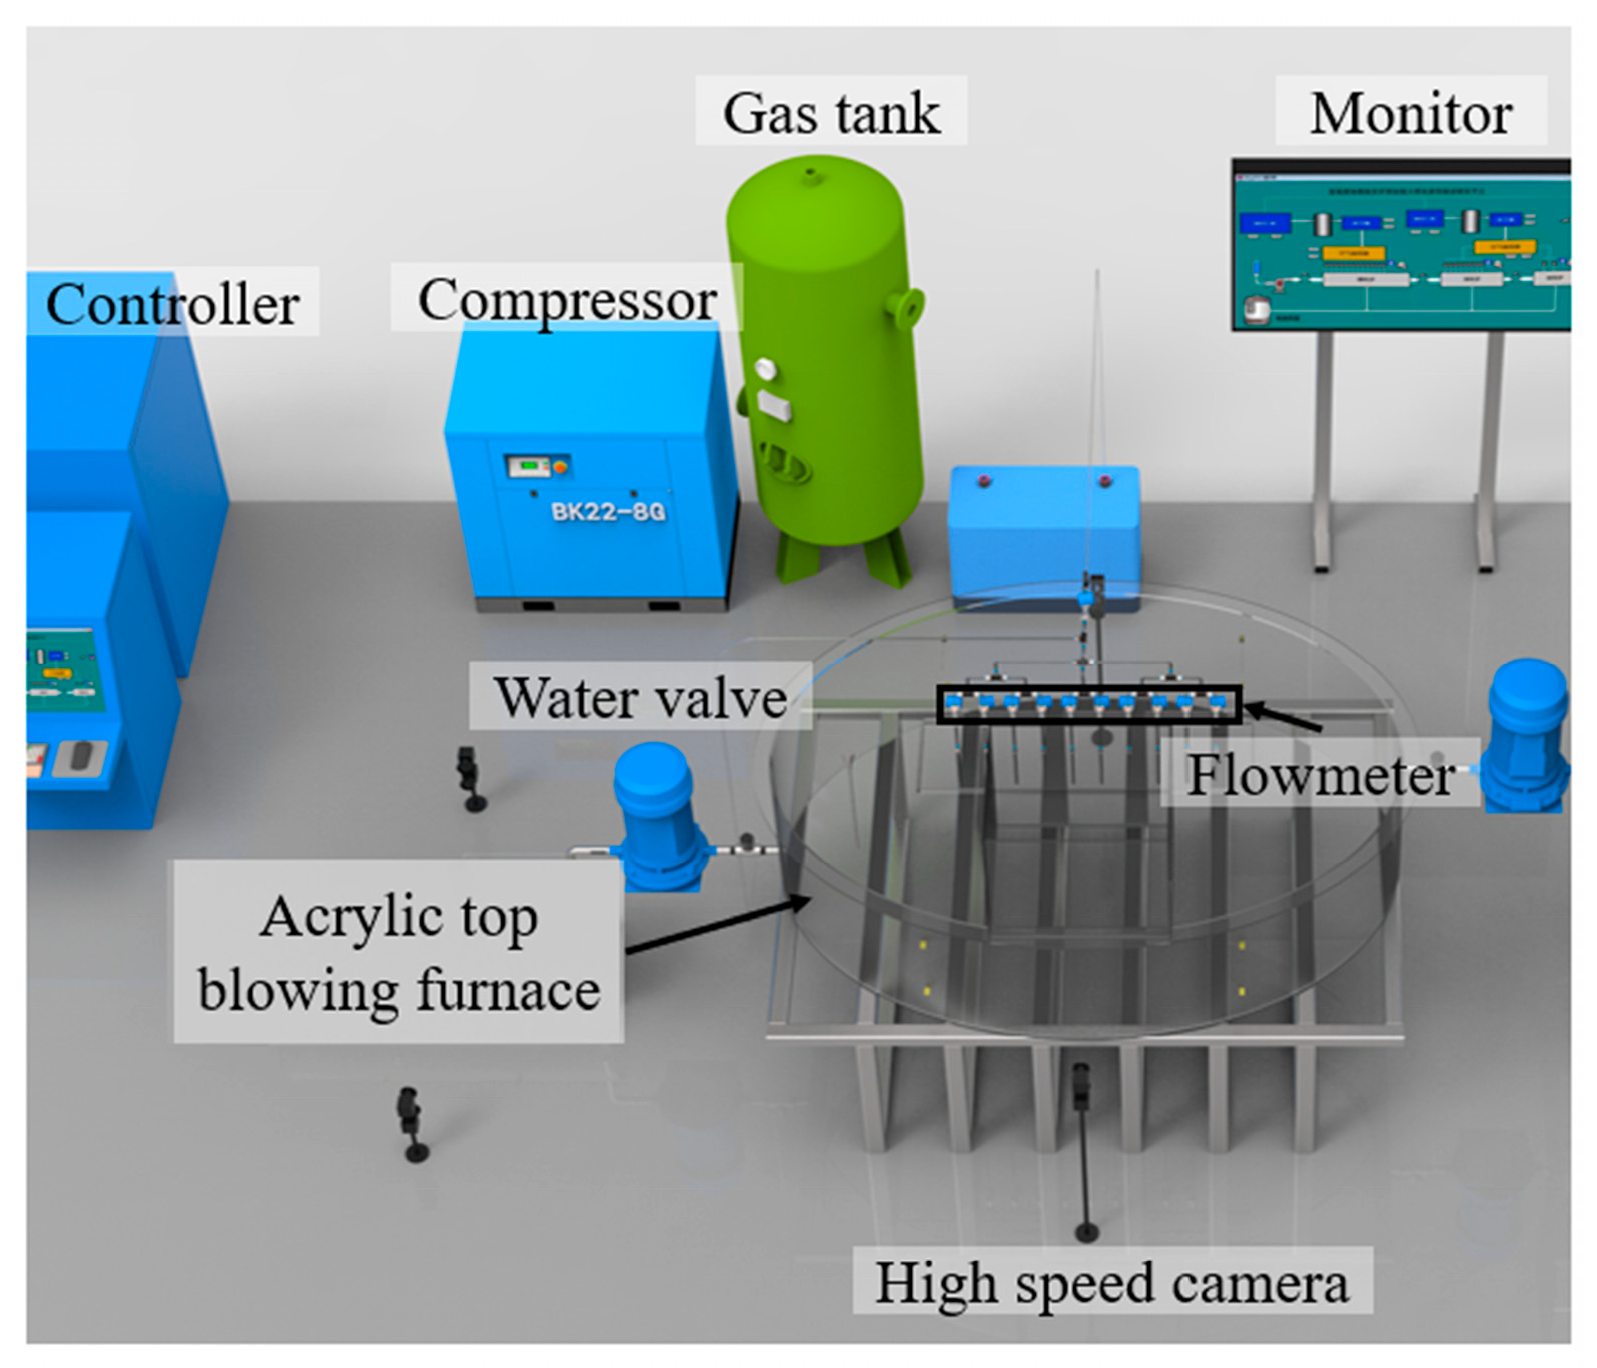
3.1. Experimental Apparatus

The water–model experimental –platform established in this investigation is shown in Figure 4. The main experimental instruments are the controller, compressor, gas tank, monitor, water valve, flowmeter, high–speed camera, and acrylic top–blowing furnace. First, the water is passed into the acrylic top–blowing furnace through the water valve, and the water is supplied with power at the right height. Then the compressor compresses the air in the gas tank, the gas volume input is controlled by the flowmeter through the controller, and finally the flow condition of the water in the top–blowing furnace is filmed with a high–speed camera. The monitor can show the flow curve of the injected gas, and the history of the flow curve can be stored in the computer.

3.2. Experimental Verification

In this section, the simulation results of the cavity shape formed after the jet impinges on the free surface are compared with the experimental results to verify the accuracy of the model used in the numerical simulation. For the convenience of observing the cavity structure, the air phase is selected as the observation object. Figure 5a–c show the pictures of the simulation results, and Figure 5d–f show the pictures in the water model experiments. From Figure 5d to Figure 5e, it is evident that the initial stage of the cavity is mainly a downward penetration process, followed by a stable development to a stable cavity shape with a large aspect ratio as in Figure 5f. The difference between the simulated and experimental results is relatively small, and the difference can be attributed to the fact that the experimental lance carries a slight vibration, which makes the velocity vary in a smaller magnitude. In general, the cavity characteristics and development patterns of the simulated and experimental results are basically identical, verifying the reliability of the adopted simulation model in characterizing the gas–liquid flow in the top–blowing furnace as well as the mixing prediction.

4. Results and Discussion

4.1. The Effect of Lance Arrangement on Stirring Ability

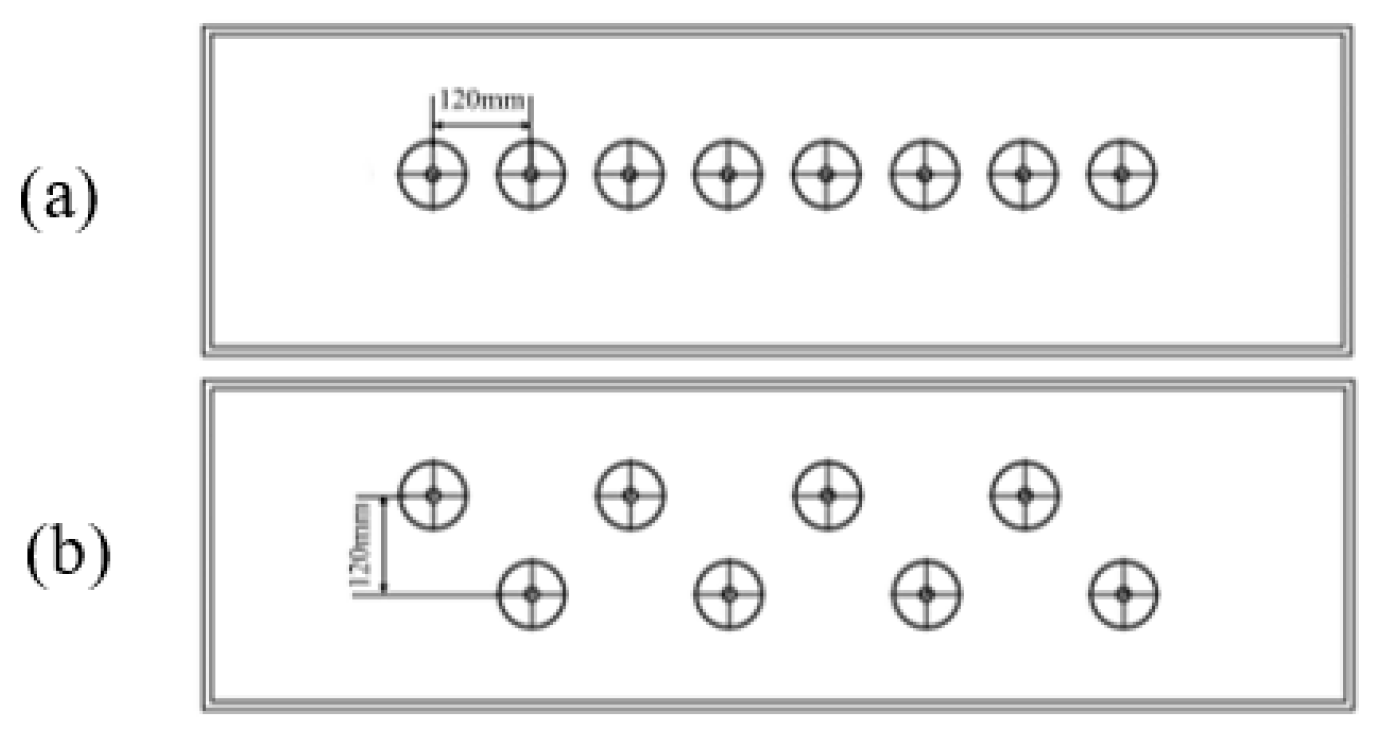
4.1.1. Design of Lance Arrangement Scheme

To investigate the interaction between multiple lances in non–submerged top blowing, two types of multiple–lance arrangements were designed, as in Figure 6a for a single–row lance arrangement and Figure 6b for a double–row lance arrangement. The lance diameter was 15.2 mm, the SA lance spacing was 120 mm, and in the DA of the lances were staggered at a distance of 120 mm.

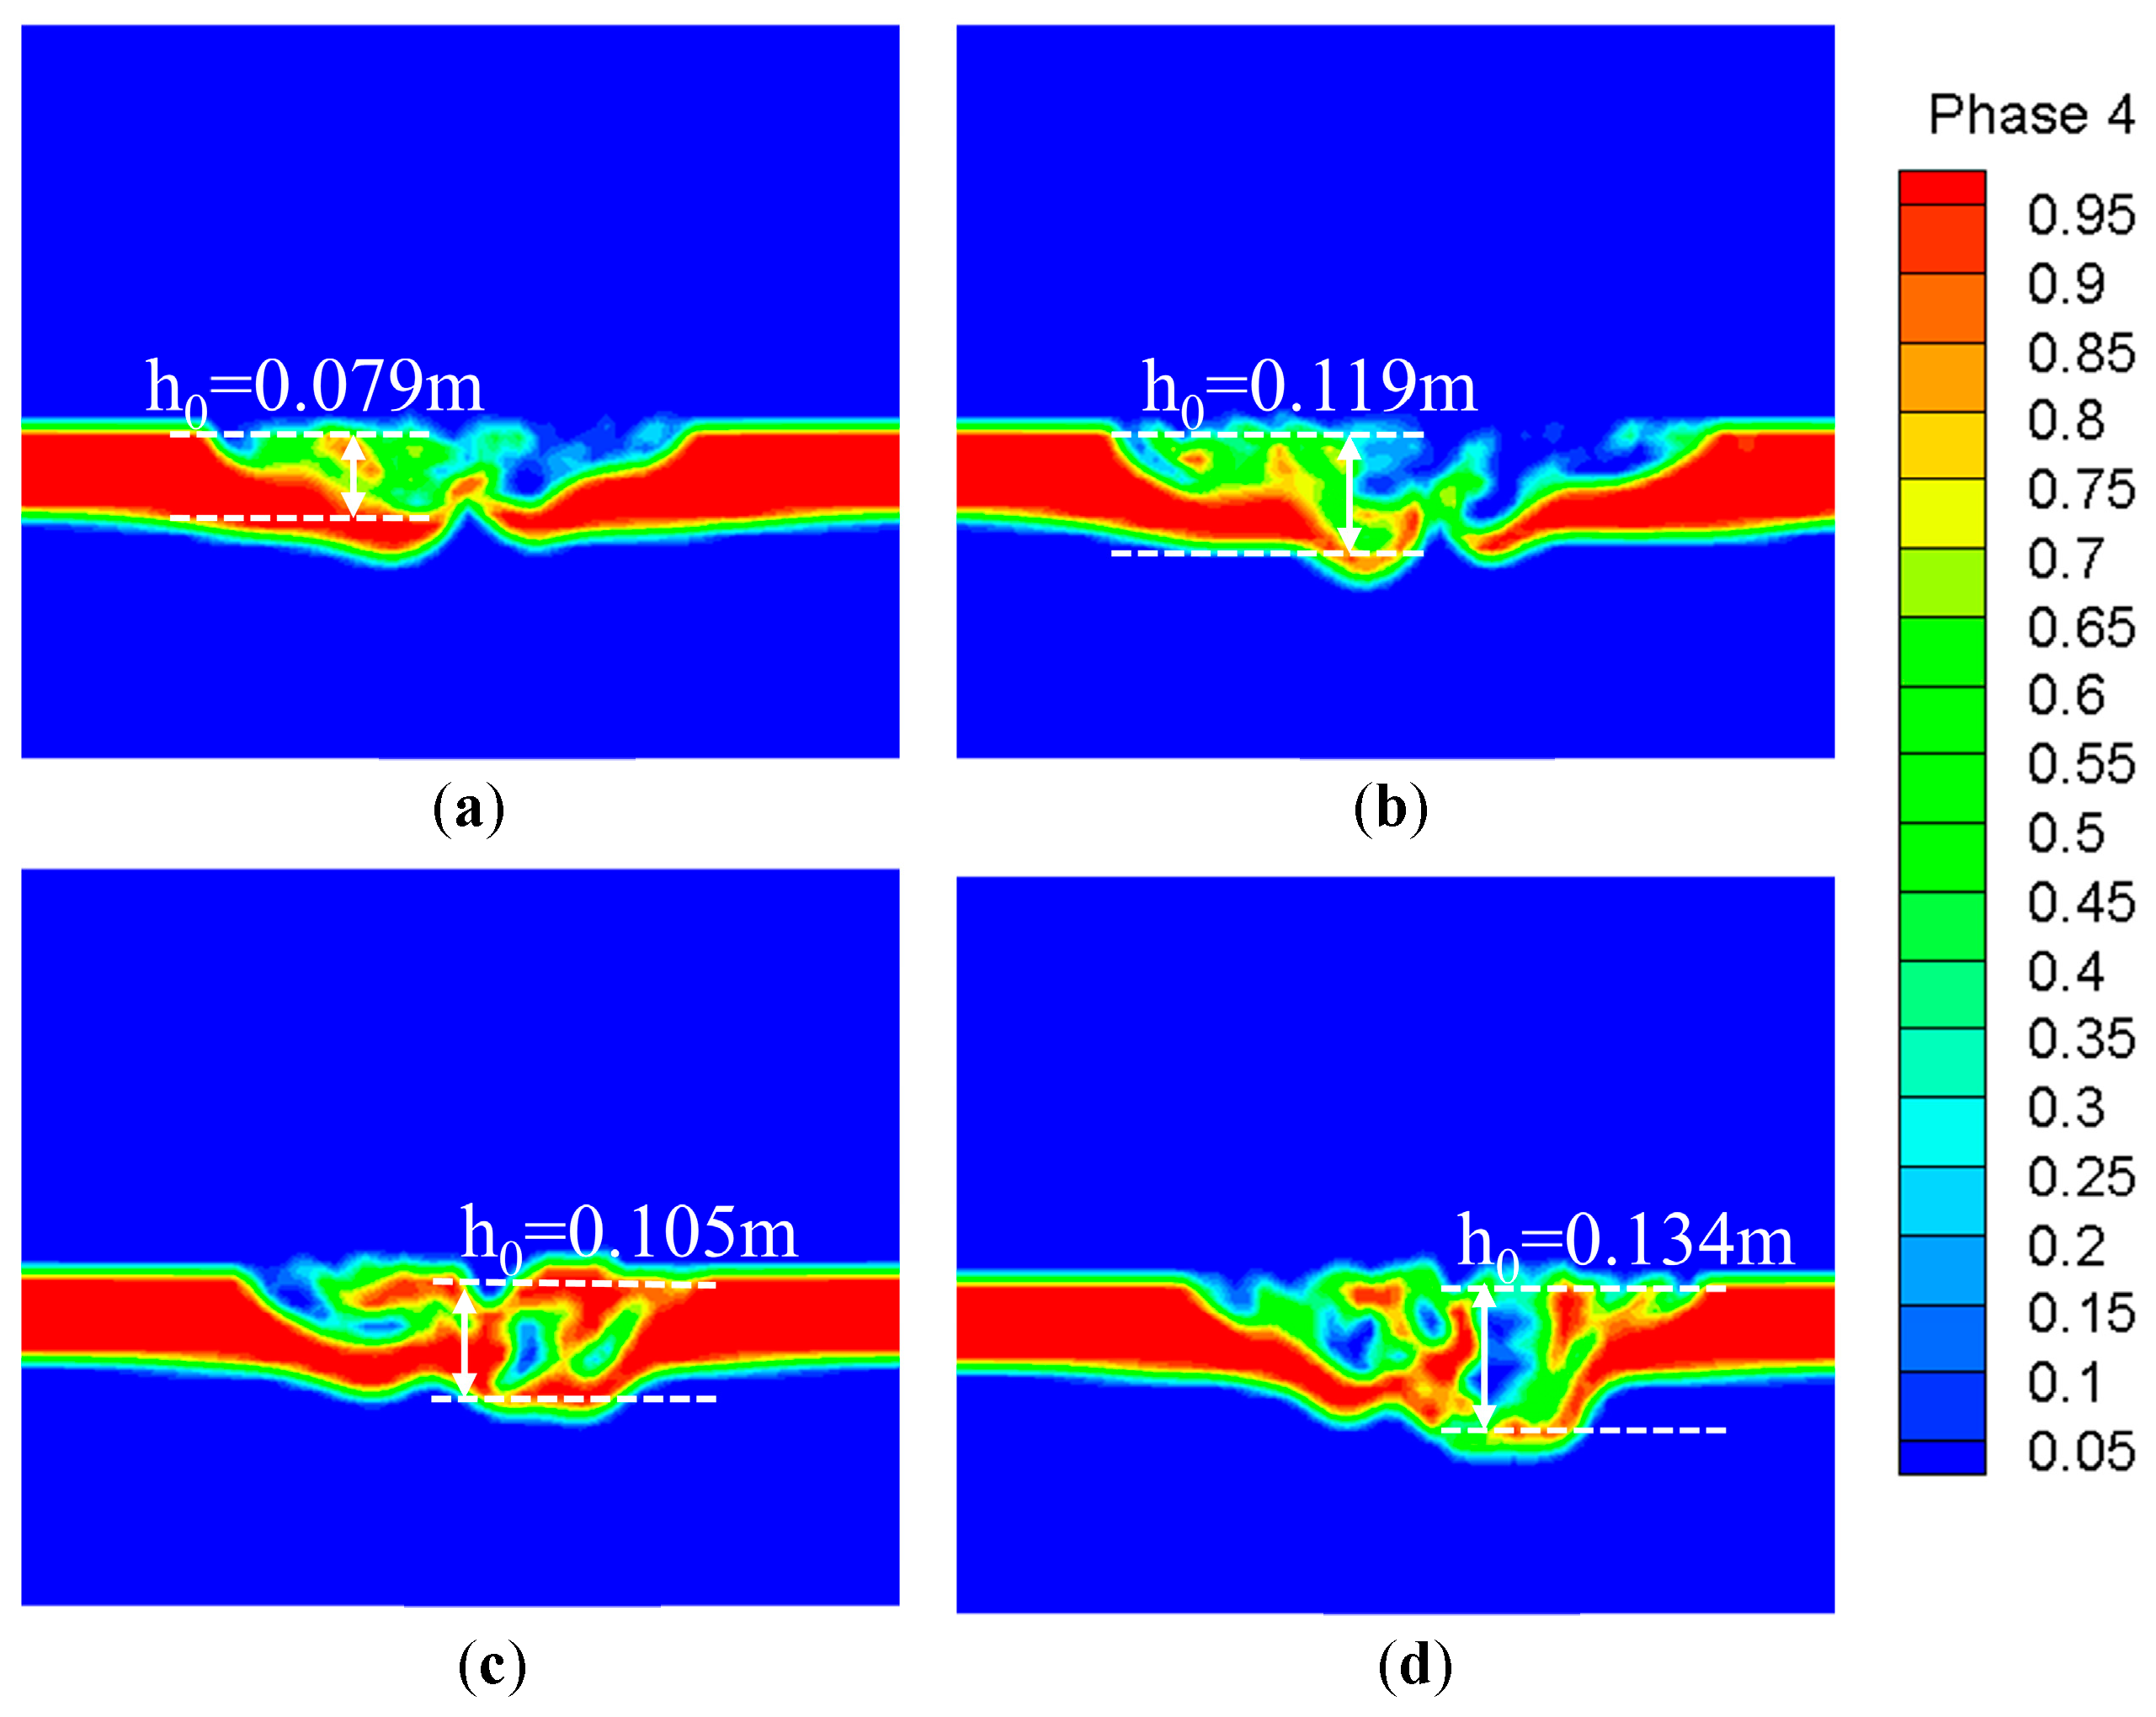
4.1.2. Flow–Field Pattern

Figure 7 selected the minor axis local vertical surface of the oval top–blowing furnace to capture the slag–phase–level fluctuation and interface deformation below the lances. Figure 7a,b shows the phase–interface change of the slag phase after impact by the high–velocity jet under SA conditions, and Figure 7c,d shows the phase–interface change of the slag phase after impact by the high–velocity jet under the DA arrangement. It is observed that the slag phase is penetrated by the high–velocity jet shear and flows to the outside, and as time proceeds, the slag phase is penetrated in both types of arrangement, and the crater development trend is basically the same, gradually developing to the outside and below. There is a large velocity difference between the gas–liquid phase, and the surface of the slag phase has obvious unstable transient characteristics.
From Figure 7c,d shows that the double–row lance arrangement was influenced by the slag–phase cavity. For both sides of the lances directly below the small cavity, there were two small cavities between the phenomenon of mutual collision, the formation of the cavity was more complex and unstable, not conducive to the diffusion of momentum to both sides of the lances, inhibiting the flow of slag–phase fluid to the furnace wall. In addition, in the DA arrangement the slag–phase penetration depth was too large, reaching 167.50% of the thickness of the slag phase itself, which will affect the settlement of blister copper and increase the copper content of the slag–phase area, which is not conducive to the blowing process.
As shown in Figure 8a, to indicate the flow characteristics of the fluid in the top–blowing furnace, seven horizontal surfaces were selected equidistantly in the slag–phase area at 0.1 m intervals to reflect the overall flow effect of the slag phase. In addition, as shown in Figure 8b, three sampling lines were selected, all located on Plane 4 in the middle of the slag phase (Z = 0.26 m). In the central plane of the slag phase, Plane 4 was selected in the vigorous–blowing–motion region of Line 1. The value is susceptible to change due to the decay of the blowing velocity, and reflects the lateral kinetic–energy–transfer capacity of Line 2 and Line 3. The flow intensity in the middle of the slag phase can better reflect the gas into the furnace body after the mixing ability of the fluid.
As shown in Figure 8c–e, on Line 1, in a small area directly below the lance, the DA velocity was greater than that of SA, but at this time, when the gas is directed into the body of the furnace, most of the kinetic energy is only acting below the lance. This area of the slag phase plays a significant role in the agitation, but the slag fluid flow does not promote the greater kinetic energy being used for the spattering of the slag–phase fluid. Overall, the velocity of DA on Line 1 was larger than that of SA, and there was a large velocity inverse, but the velocity of SA on Line 2 and Line 2 was larger, which indicates that SA has a better transverse–momentum–spreading ability in the slag phase. In contrast, on Line 2, the average velocity of DA was about 0.0033 m/s and that of SA was 0.0098 m/s. The average velocity of SA on Line 2 was increased by 196.97% compared to that of DA. The average velocity of SA on Line 3 was increased by 180% compared to DA, the velocity of DA on Line 1 was larger than that of SA, and there was a large velocity inverse, but the velocity of SA on Line 2 and Line 3 is larger, which indicates that SA has a better transverse–momentum–spreading ability in the slag phase. On Line 2, the average velocity of DA was about 0.0033 m/s and that of SA was 0.0098 m/s. The average velocity of SA on Line 2 was increased by 196.97% compared to that of DA. The average velocity of SA on Line 3 was increased by 180% compared to that of DA. The different arrangements of the lances made the influence mechanisms for each lance arrangement different. For SA, the slag–phase selection line fluid velocity was overall larger, especially in the horizontal direction, so the lances directly below the region had an unbalanced shock effect on the surroundings; in the lances directly below the oxygen–rich air and copper slag reaction, the kinetic energy was better transferred to the surroundings, maintaining the fluidity of the copper slag stirring. In DA, there was a detrimental effect between the lances, so that the high–velocity jet impacted the free surface of the slag phase after the formation of the liquid surface fluctuations, which produced hedging, resulting in the dissipation of kinetic energy, not conducive to the mixing of the copper slag.
Figure 9a shows the velocity curves on the seven planes of the slag phase. The velocity of SA in the seven planes had a more than 13.70% increase compared with that of DA, and the velocity in the plane closest to the blister copper had the largest increase of 35.32%, which indicates that the penetration ability of the high–velocity jet of SA on the slag phase was stronger than that of DA. However, combined with Figure 7, the penetration depth of DA was actually greater, which indicates that SA can have a smaller effect on the metallic phase degree while at the same time having a stronger mixing effect. In addition, as shown in Figure 9b, the total average velocity of SA in the seven planes was increased by 17.93% compared with that of DA, and SA had a stronger transverse–momentum–diffusion ability at the same inlet velocity. The high–velocity jet entered the furnace and produced a large impact on the slag phase, and the gas–slag–gold interaction had obvious transient and unstable characteristics. Surface waves were generated in this process, and the propagation of surface waves intensified the instability and irregularity of the gas–slag–gold interface.
To quantitatively analyze the proportions of low– and high–velocity regions in the furnace, the images were digitized using the code as shown in Figure 10. Figure 10c shows the code of each color. The color code #0030FF in this picture is the static area of the melt bath. The velocity in this area is lower than 0.002 m/s; to ensure the momentum diffusion and stirring effect in the melt bath, the percentage of this color block should be decreased. The low–velocity area of DA with color code #0030FF was 70.7% and the low–velocity area of SA was51.1%. Compared with DA, SA had a decrease of 27.72% in the proportion of low–velocity area. The momentum–transfer ability of SA in the middle plane of the slag phase was better than that of DA, which can effectively improve the stirring effect on the slag phase.

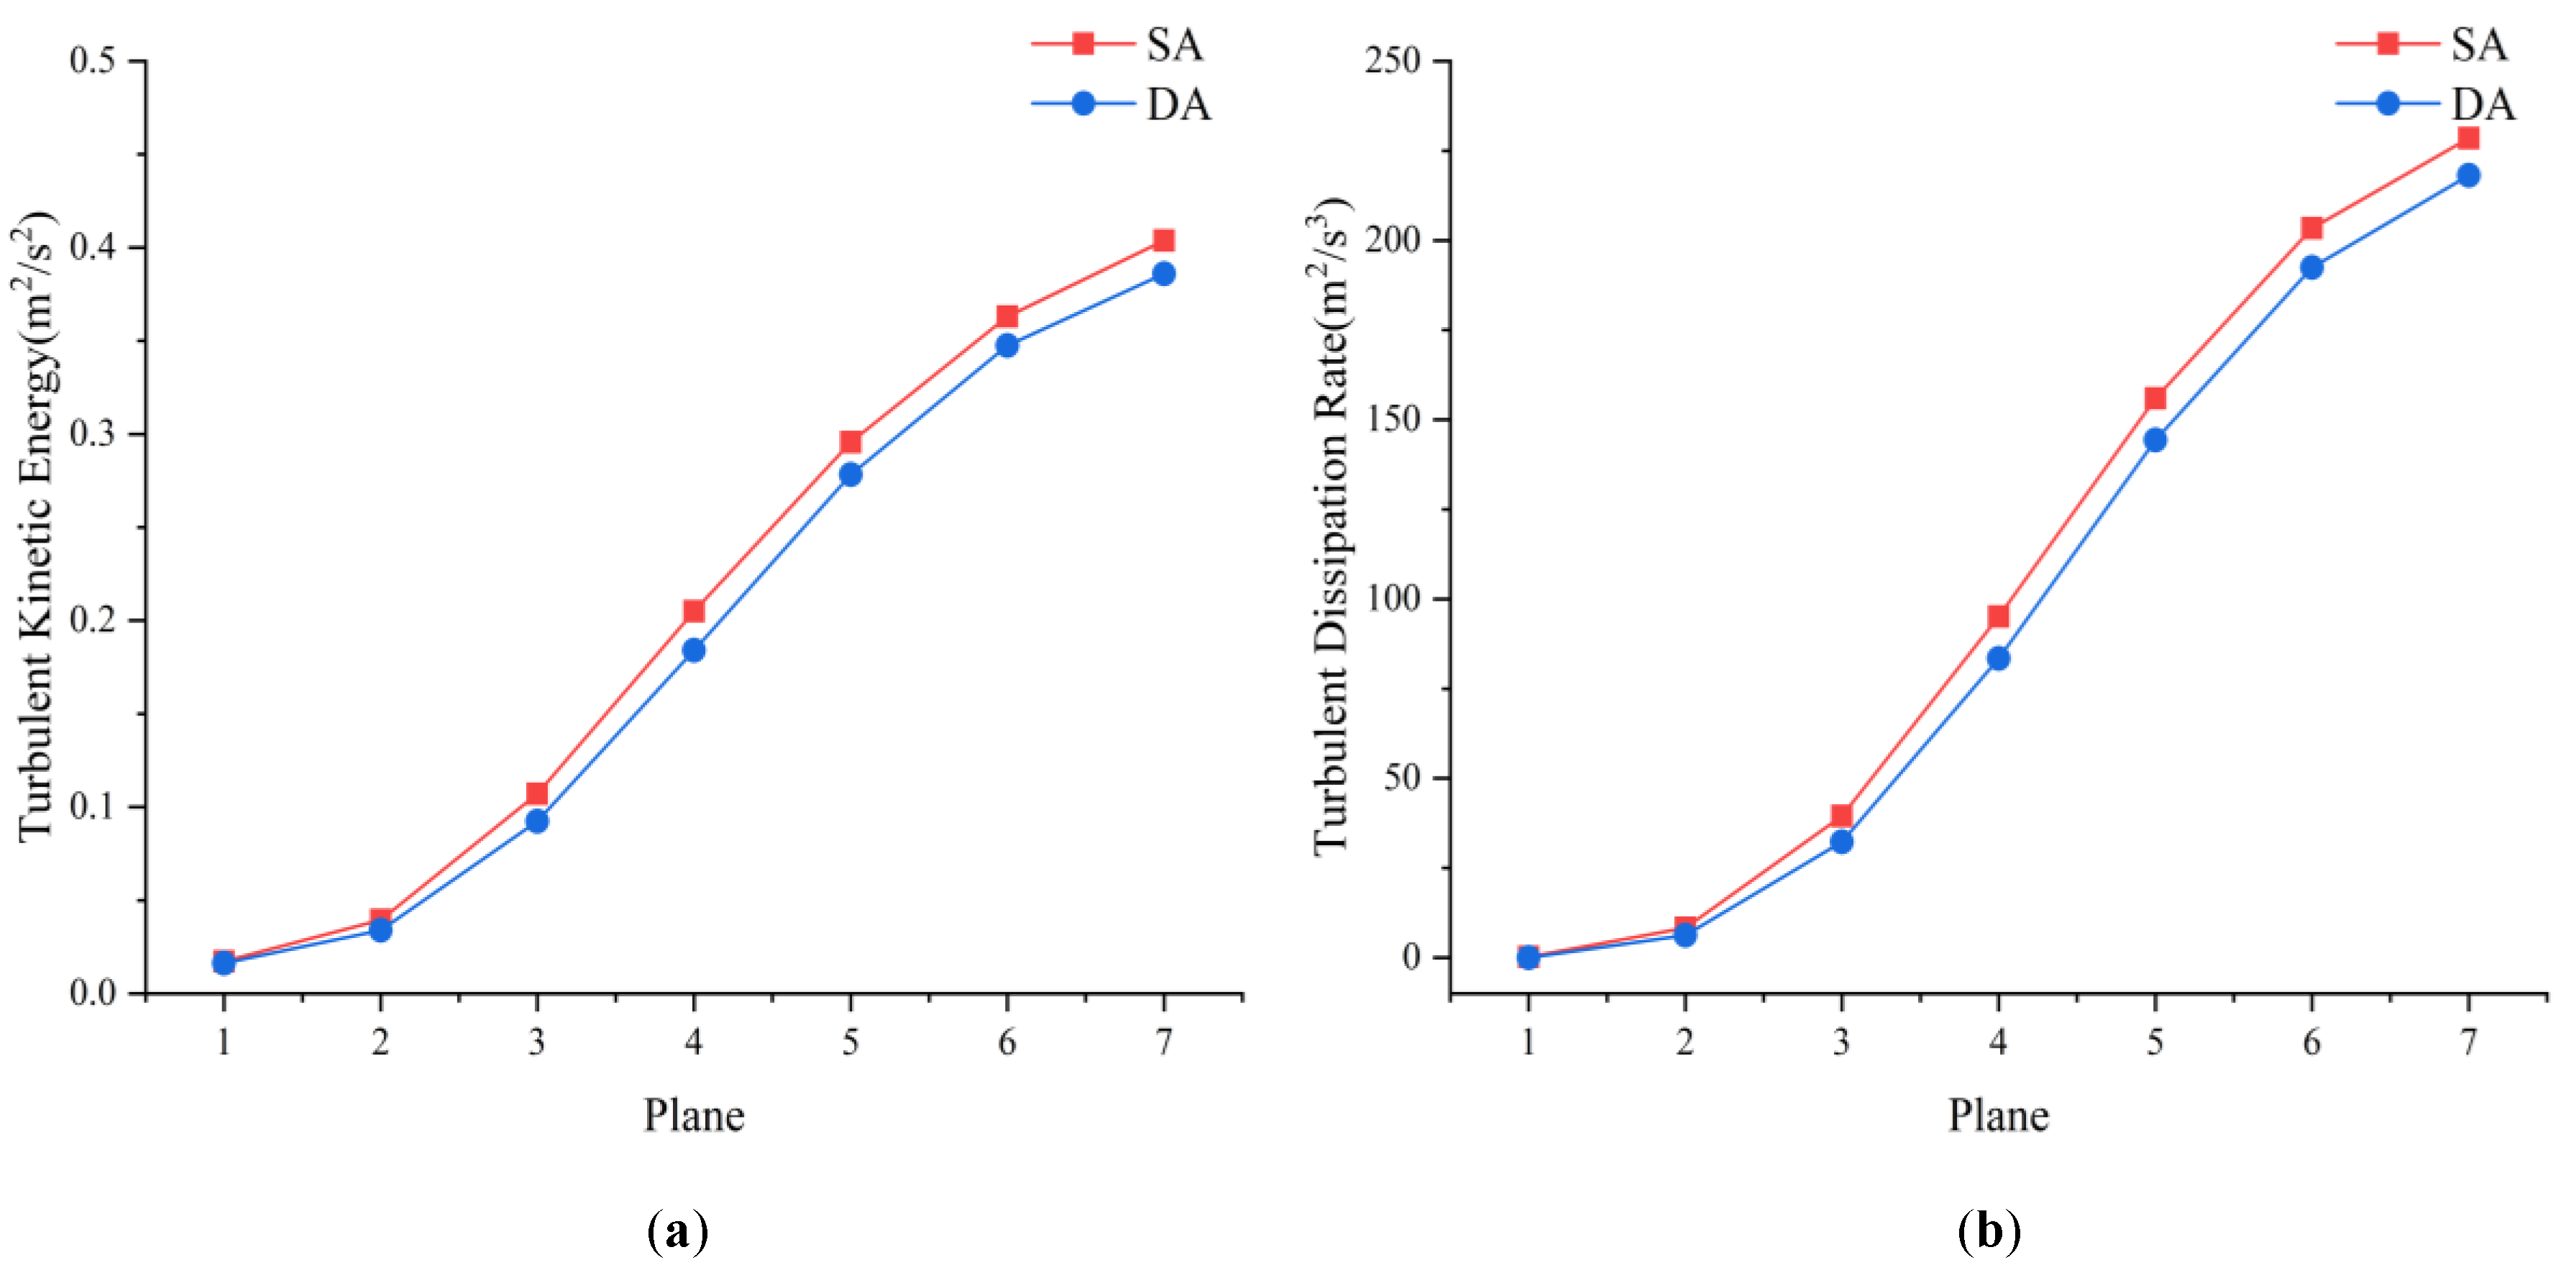
4.1.3. Turbulent Energy Analysis

The actual top–blowing process is a turbulent–flow process with disturbances between the fluids in each phase. Turbulent kinetic energy is a common analog quantity in turbulent–flow processes that can characterize the intensity of turbulent flow strength. As shown in Figure 11, in general, the development trend of the turbulent kinetic energy and turbulent dissipation rate in all planes of the slag phase was similar, and the planes close to the free surface had more turbulent intensity and more obvious microscopic disturbance. The total average turbulent kinetic energy of SA arranged in seven planes increased by 6.97% compared with that of DA, and the total turbulent dissipation rate of SA in seven planes increased by 7.98% compared with 7.98% in DA. The blowing process was carried out by both the momentum–transfer process and the mass–transfer process. The turbulent kinetic energy and turbulent dissipation rate were larger in the turbulent motion of top–blowing SA, which proves that the work for mixing was larger, the macroscopic flow was more intense, and the number of micro–vortices was larger, which reflects to a certain extent that the fluid collision and its motion law are more reasonable for the SA top–blowing system.

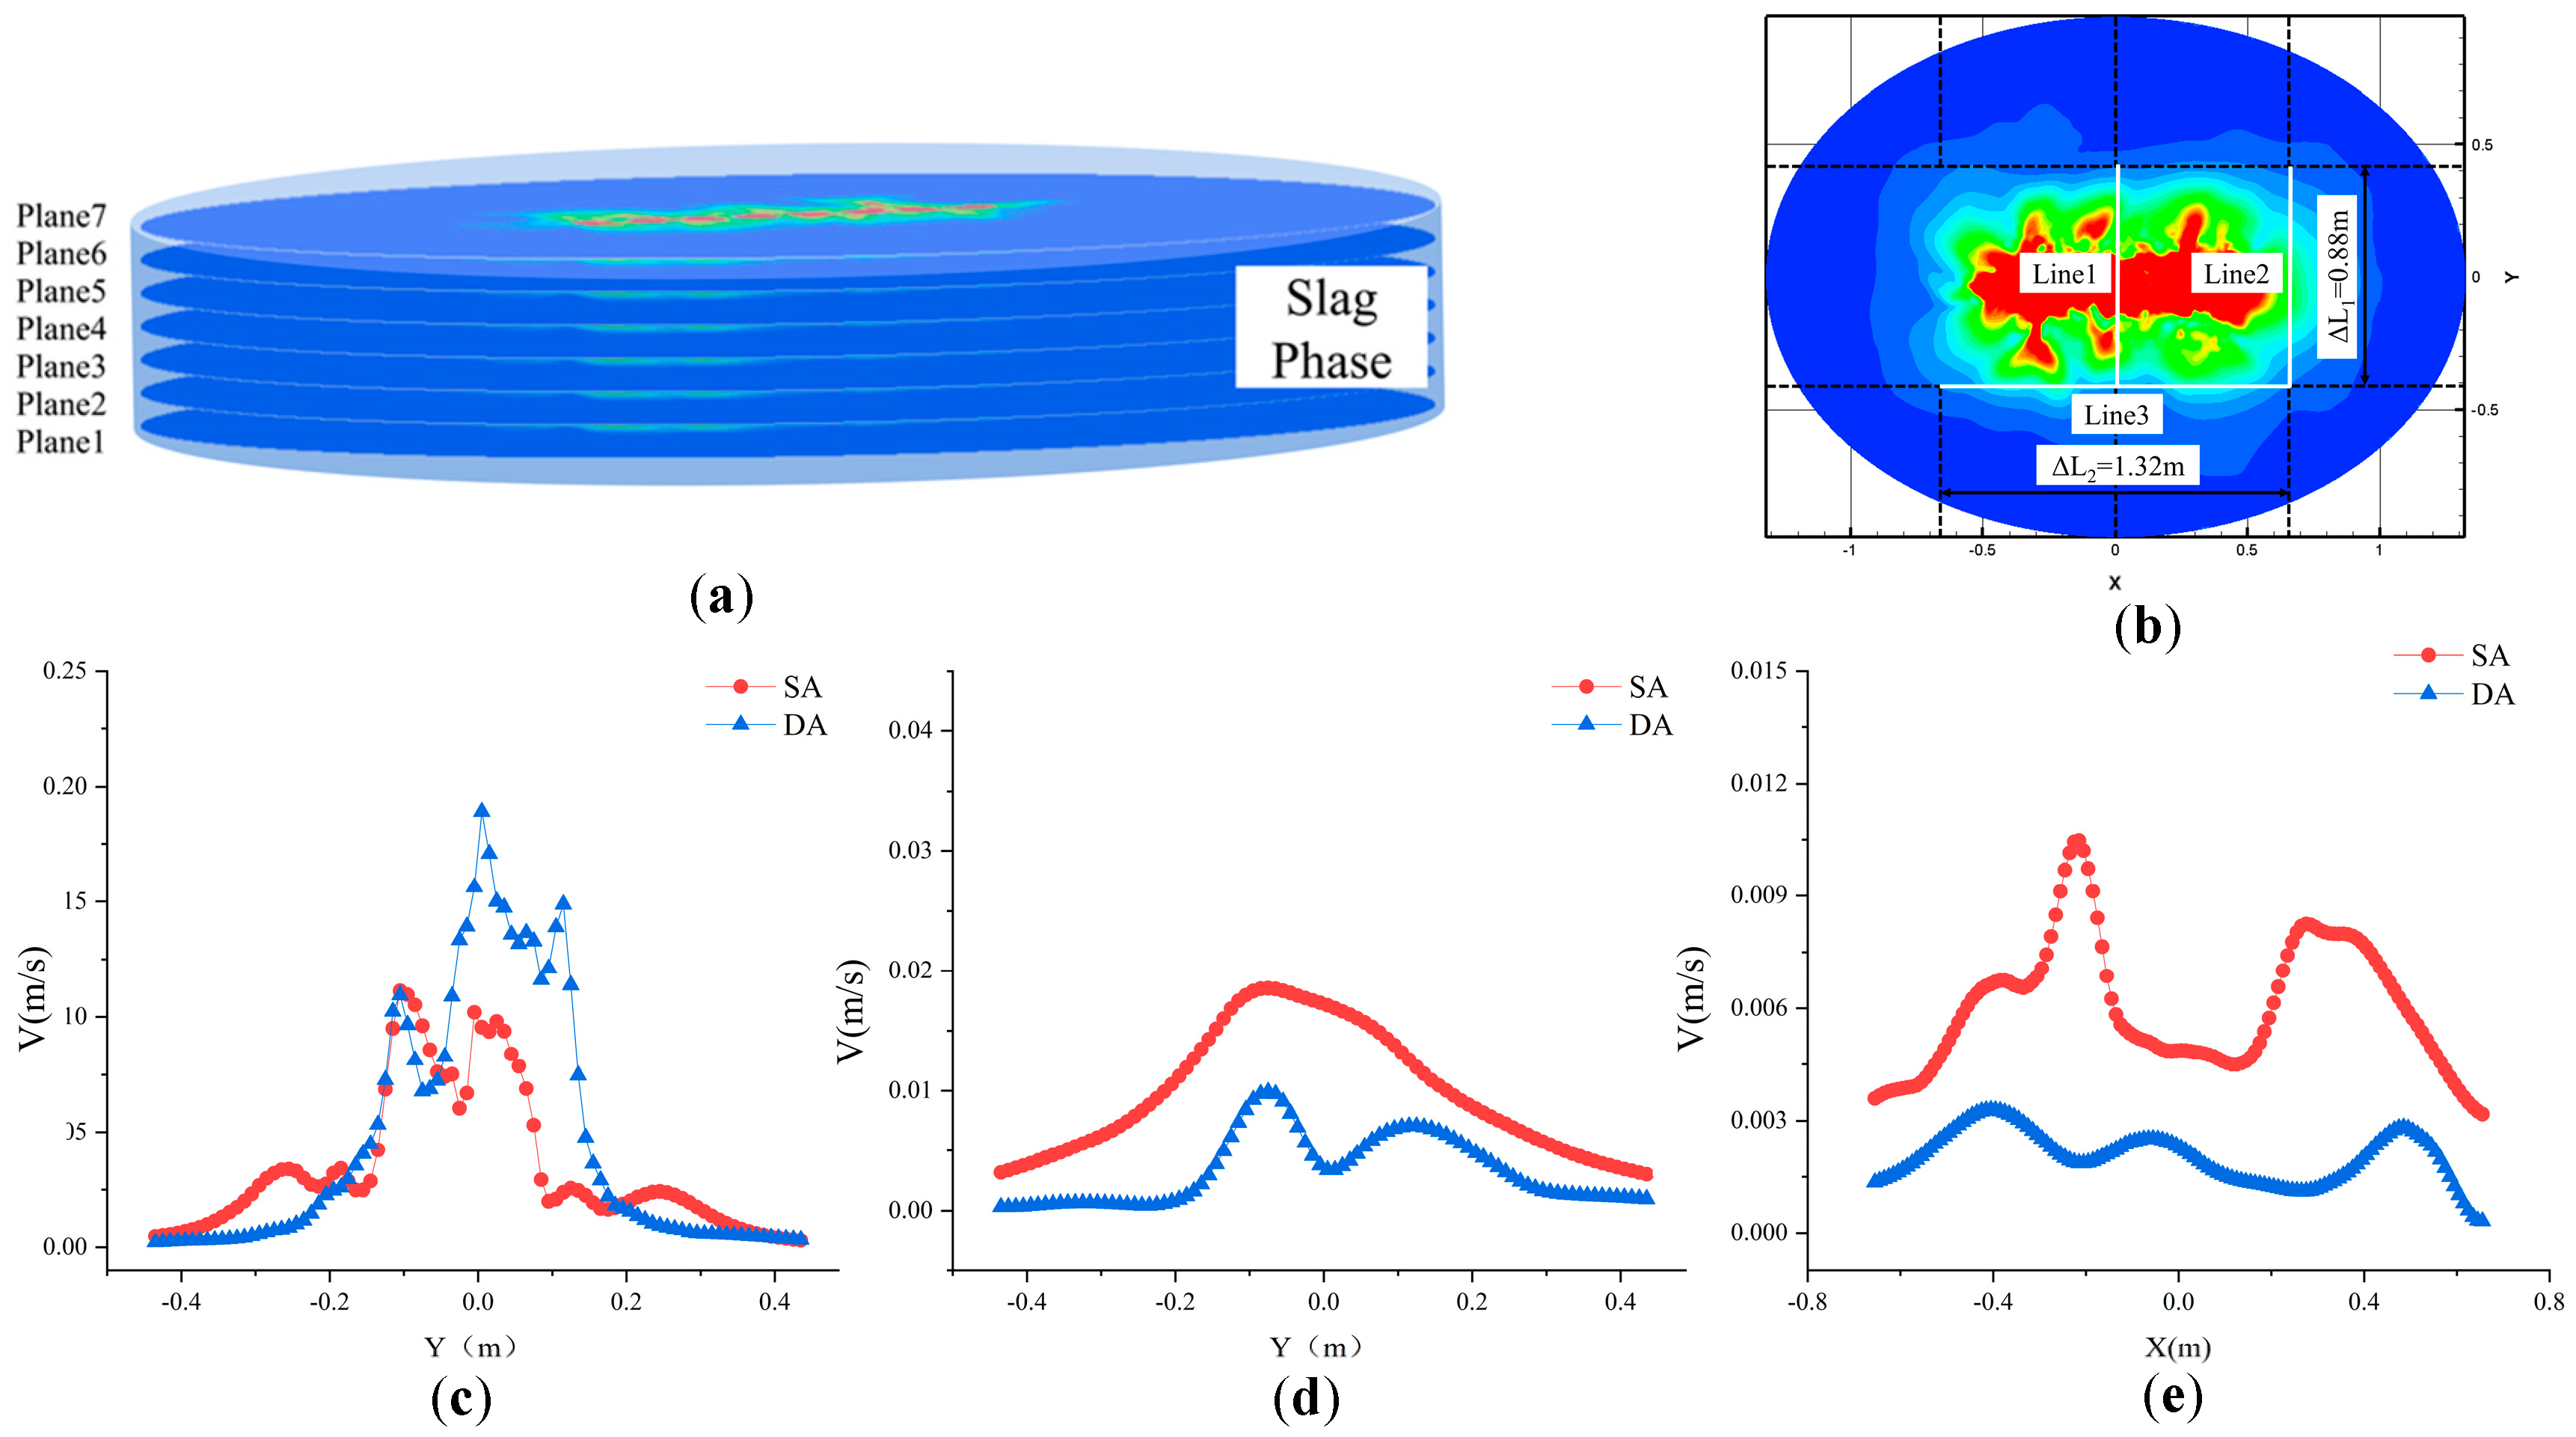
4.1.4. SA Enhanced Mixing Characteristics

As can be seen in Figure 12a,b, the SA traces had a highly regular pattern, from the direction of the elliptical minor axis below the lances relative to the high–pressure position, followed by small vortices in the medium– to high–velocity flow region towards the sides of the lances and the furnace wall. Single–row lances were arranged so that the slag phase below the lance fluid and other locations had an inverse velocity difference. Due to the top–blowing system being in a local state of disequilibrium, the flow rate of the high fluid drove the flow rate of the low fluid, so that the macro flow direction tends to be the same. In addition, as can be seen from Figure 12c, in DA the two rows of lances between the jets interact. The fluid between the two rows of lances collided, but due to the pressure at the jet, the fluid momentum was confined to the local area, and the fluid collision led to energy dissipation that at the same time did not enhance the slag–phase flow mixing effect. In conclusion, the unsteady feature of SA in the local area was favorable to the flow of copper slag, which can effectively improve the reaction rate of oxygen–rich air and copper slag.

4.2. Variable–Velocity Blowing Enhanced Stirring Investigation

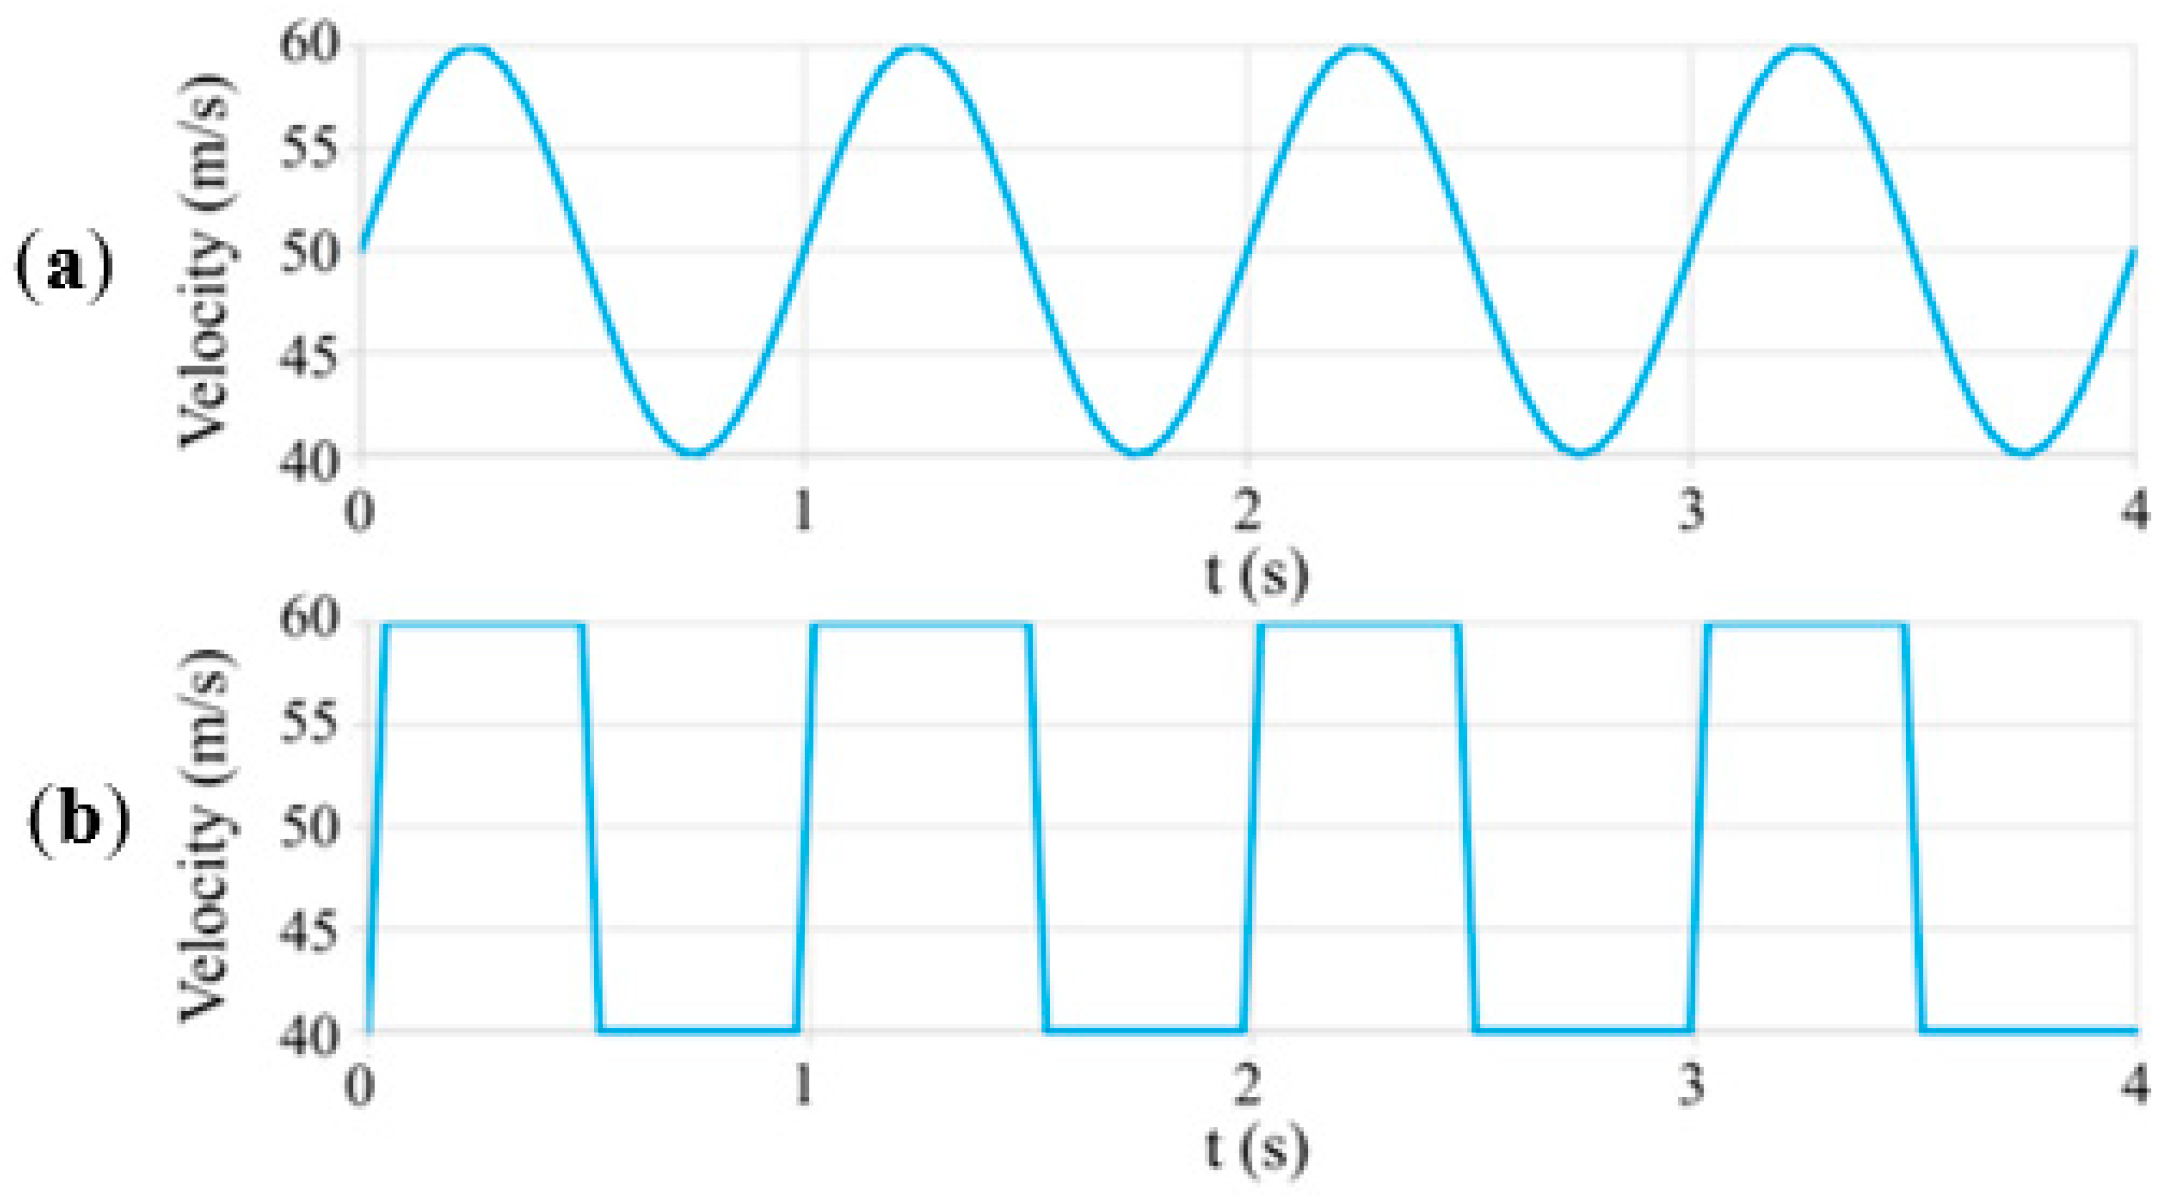
4.2.1. Variable–Velocity Wave–Blowing Scheme Design

As shown in Figure 13, two different variable–velocity function waves were designed to enhance the top–blowing process and were used to solve the problem that the constant–velocity blowing could not break the inherent low–flow–velocity area, using a nonlinear velocity input to provide oxygen–rich air periodically. As shown in Figure 13a, a sine function with smoother velocity variation was selected, and another rectangular–wave velocity input function with larger instantaneous variation was selected as shown in Figure 13b, with a velocity variation of amplitude A = 10 m/s and period P = 1 s. Neither the sine wave nor the rectangular wave changed the total input flow rate in one cycle.

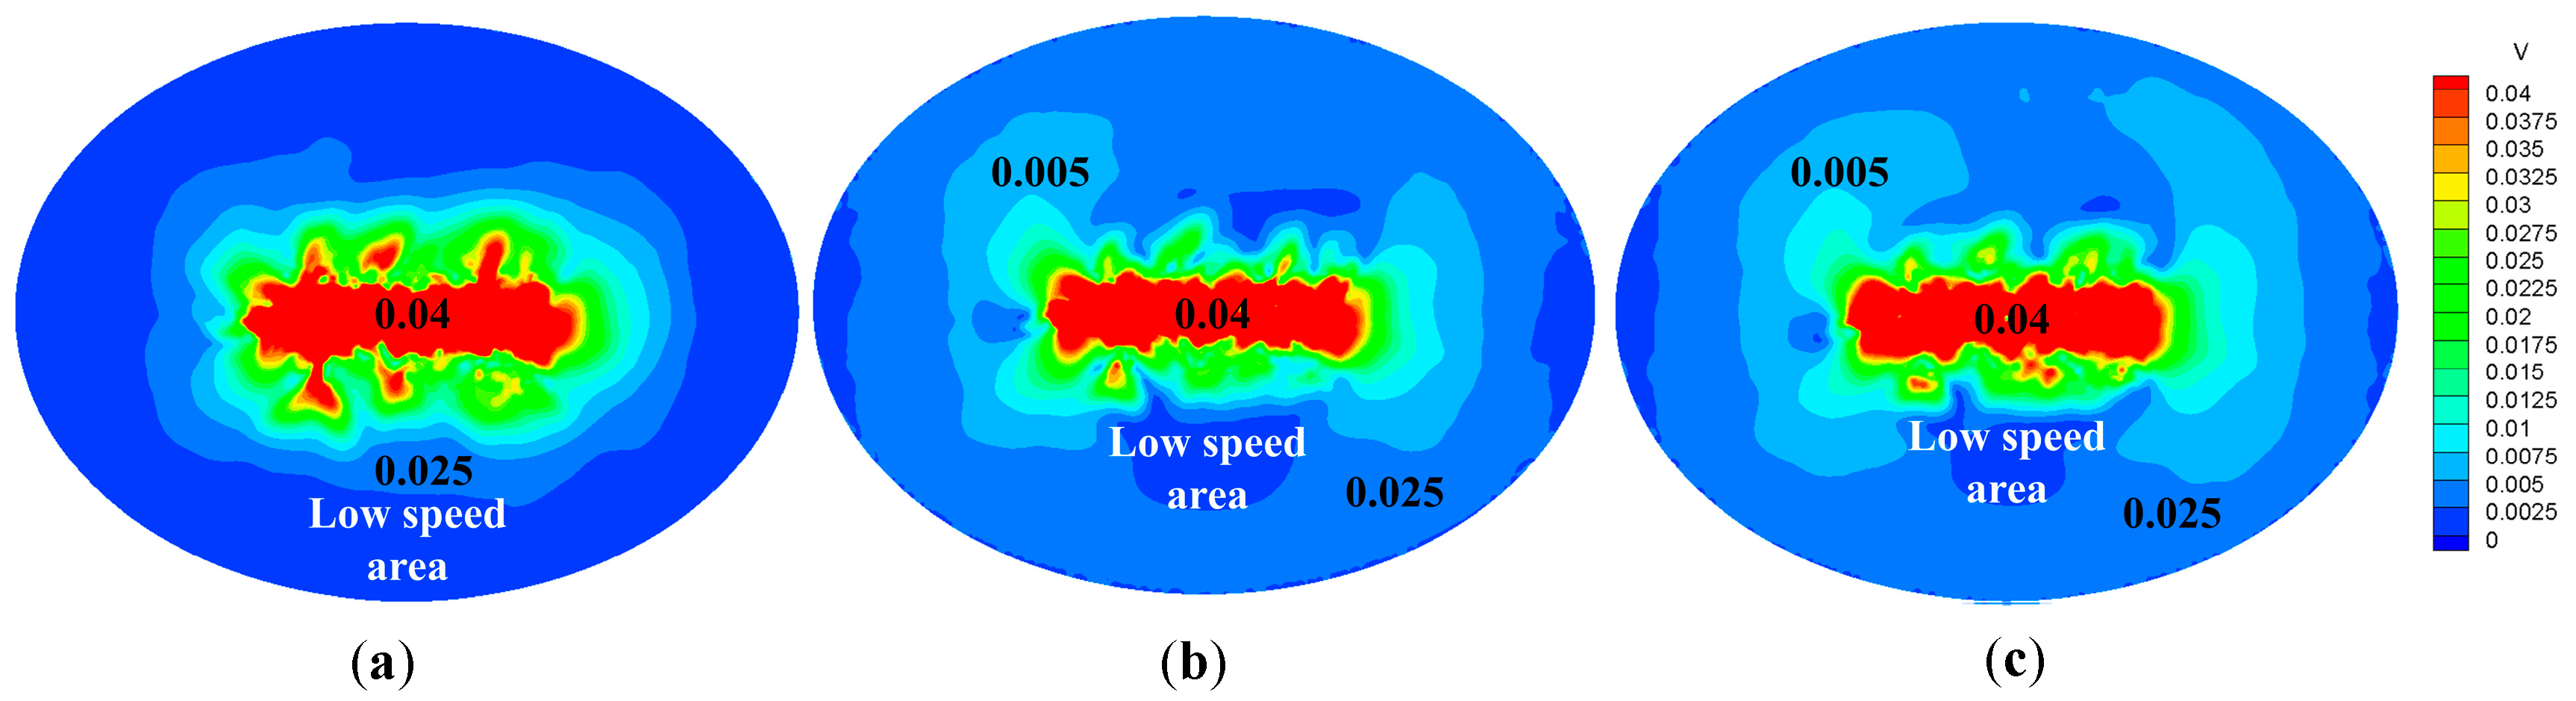
4.2.2. Flow–Field Pattern

To illustrate the flow field in the slag–phase region with variable–velocity blowing and constant–velocity blowing, the average velocity of the surface on Plane 2 (z = 0.24 m), Plane 4 (z = 0.26 m), and Plane 6 (z = 0.28 m) was extracted, and the velocity profile with time is shown in Figure 14. As shown in Figure 14, the velocity distribution curves on the three planes had a similar characteristic to the variation in the input velocity waveform. SWB and RWB had more obvious velocity changes; SWB had a smoother transition due to the sinusoidal waveform, and its velocity change was smoother compared to RWB. The peak velocity of SWB and RWB was basically the same before 2.6 s, and at 2.6 s and later, in the sine function despite its smaller velocity input, the previous high–velocity blowing made the slag phase still maintain a higher–velocity flow. This is conducive to alleviating the reduction in fluid velocity and can effectively stabilize the slag–phase velocity when sudden changes in free surface height occur. SWB was better than CSB and RWB, with the ability to buffer the flow–field velocity’s sharp reduction.
The average velocity of these three planes was selected for calculation. In SWB and RWB compared to CSB, the velocity increased by 24.03% and 13.96%, respectively. In the development stage of the blowing, for variable–velocity blowing of the two working conditions the wave crest and trough difference was large, but in the subsequent time, the periodic variable–velocity inputs from the high–velocity jets gave the slag phase a periodic driving force. The velocity difference between the jet and the slag–phase fluid was also changing at all times, and due to the limitation of the velocity change amplitude, the velocity difference between the jet and the copper slag was not too large to produce a larger spatter. Moreover, this relatively flexible blowing helped reduce the flow of the low–velocity area, and the airflow on the slag–phase stirring mechanism was more reasonable.
Figure 15 shows the velocity distribution contours of CSB, SWB, and RWB in the middle of the slag level Plane 4. Compared to the constant–velocity blowing, the low–velocity area in the variable–velocity blowing tests was significantly reduced, reducing the appearance of the “flow dead zone” in the furnace. The variable–velocity blowing on the elliptical horizontal plane of the major axis direction had a greater impact on the major axis direction at both sides of the lance, with the emergence of “crab pincer” velocity contour lines at a velocity of 0.05 m/s.
Figure 16 shows the digitization results of the velocity distribution contour diagram in Figure 15, and the color code #003DFF is the low–velocity area of the velocity distribution contour diagram. It is shown in Figure 16a that the low–velocity zone of the flow of constant–velocity blowing was larger, accounting for 55.9%. The low–velocity area of variable–velocity blowing was less than 10% for both conditions, and the low–velocity area of SWB was only 9.7%, which is 82.65% smaller than that of CSB. The low–velocity area of RWB was 5.9%, which is the lowest among the three conditions, and, at 89.45% smaller than that of CSB, was significantly smaller. The variable–velocity blowing made the velocity inverse difference between the jet and the slag fluid change; the flow–field uncertainty was greater, and strengthening the velocity field can improve the momentum–transfer effect of the slag phase as well as the mobility of the slag phase.

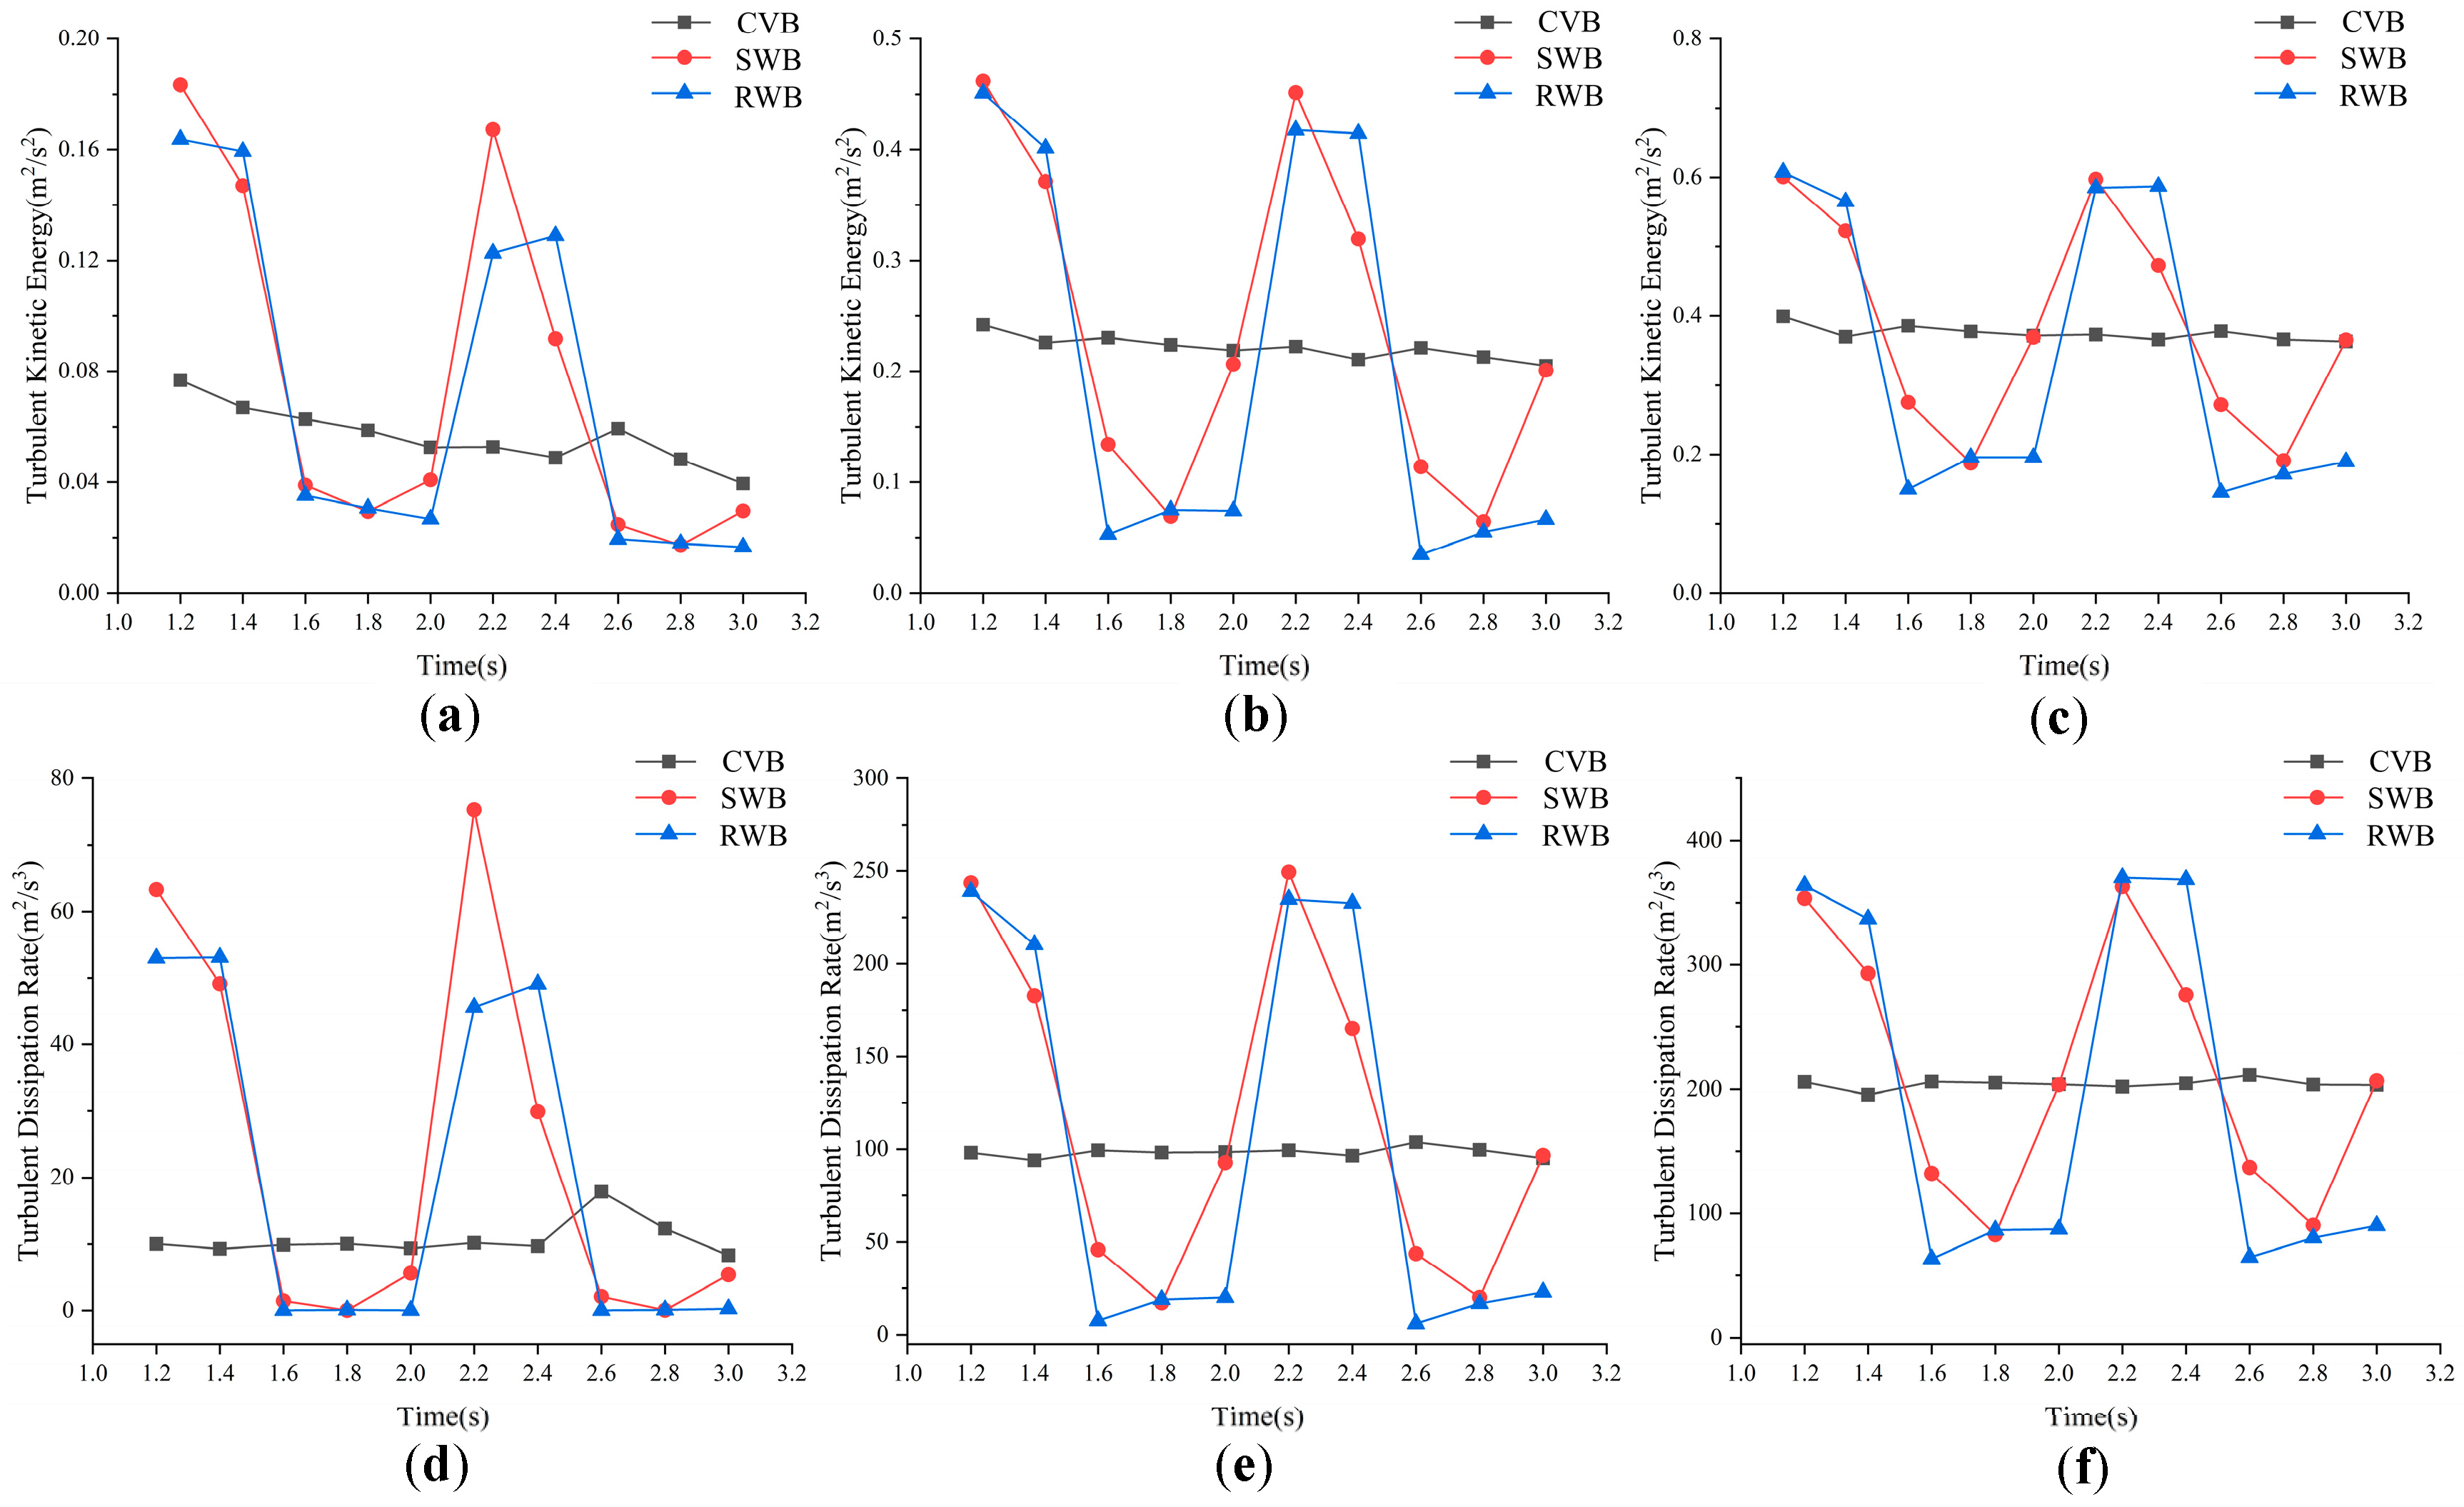
4.2.3. Turbulent Energy Analysis

As shown in Figure 17, the turbulent kinetic energy and turbulent dissipation rate of CSB were essentially stable, while the turbulent kinetic energy and turbulent dissipation rate of SWB were not improved compared to CSB. In contrast, the turbulent kinetic energy of RWB increased by 7.46% and the turbulent dissipation rate increased by 12.59% compared with that of CSB. This shows that the RWB condition has a better performance in the turbulent energy field than the other two conditions. However, according to the previous section, the use of a sine wave with a smoother velocity input is more beneficial to stabilize the flow field and the response of the gas–slag phases.

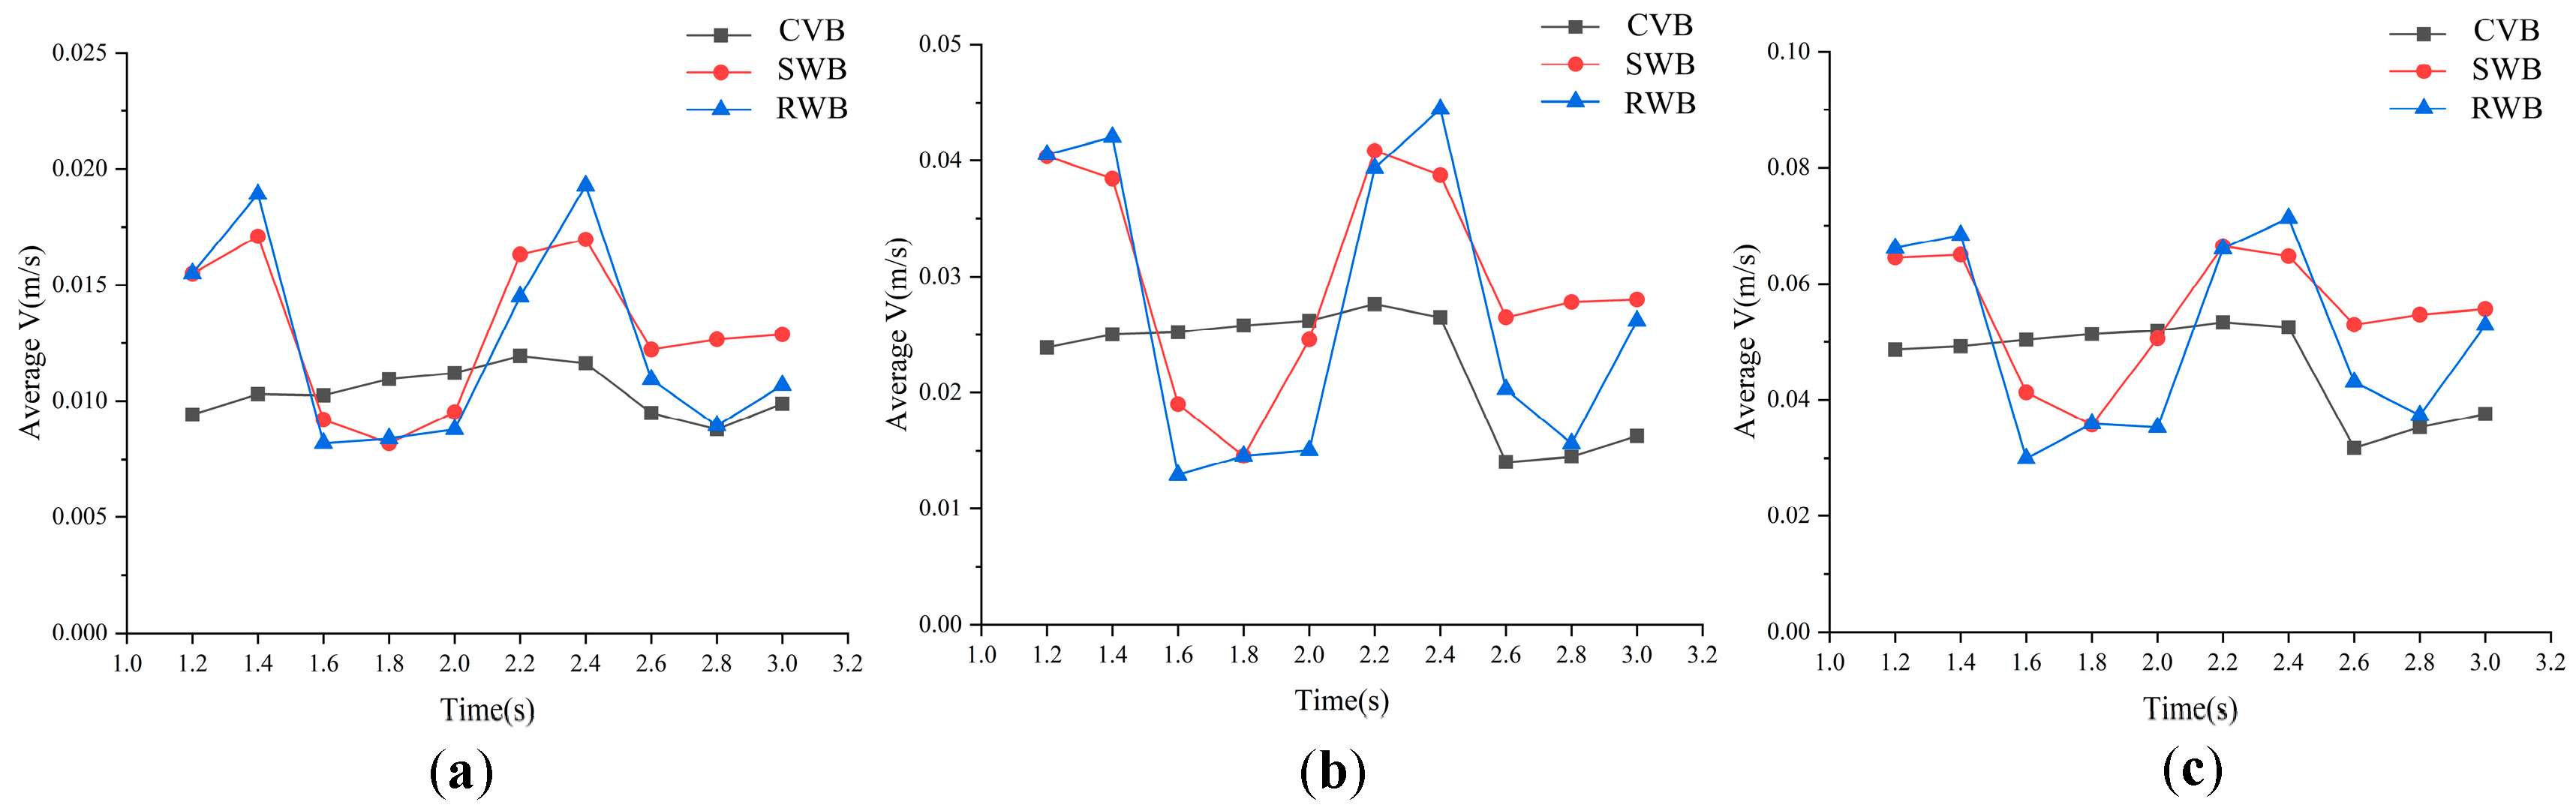
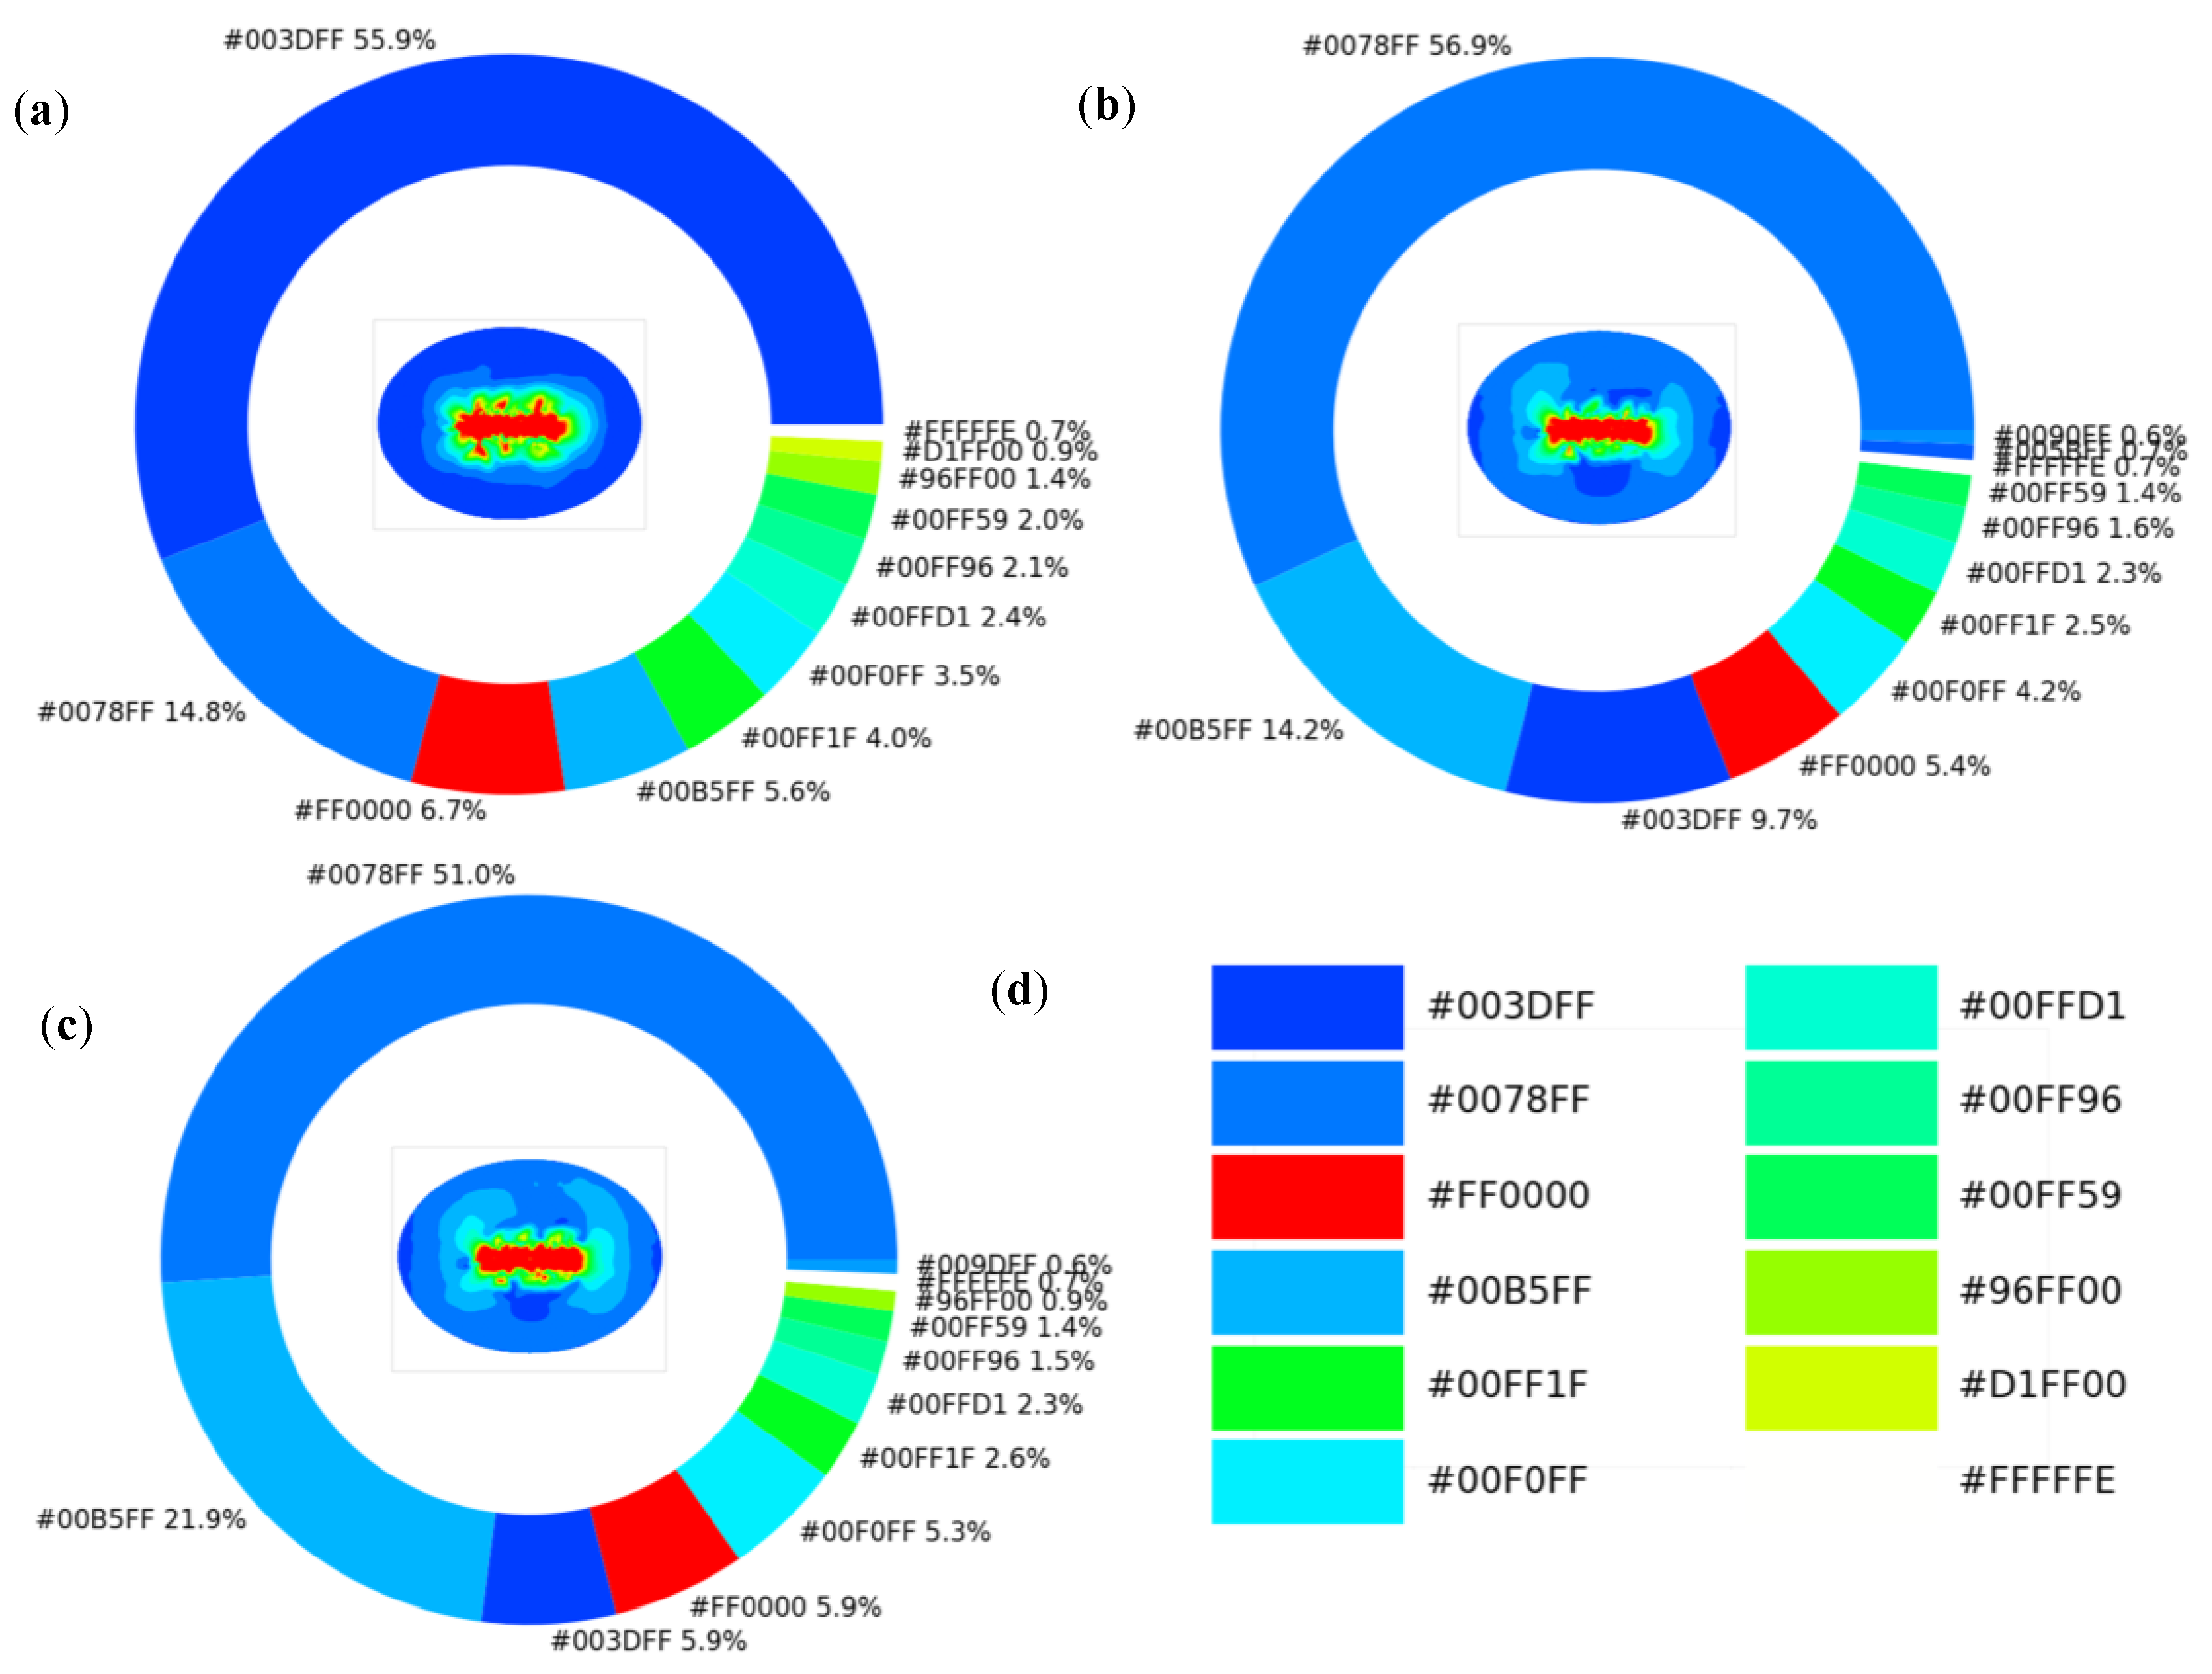
4.2.4. SWB Enhanced Mixing Characteristics

Figure 18 shows the enhanced mixing mechanism of SWB. After the free surface of the slag phase was impacted by the variable high–velocity jet, the fluid motion of the slag phase was intense and the momentum transfer of the slag phase was enhanced. In SWB, when the jet velocity increased, a larger kinetic energy was provided for the slag phase, and the direction of kinetic energy transfer was along the minor axis at this time, which improved the mixing effect in the furnace. Moreover, when the jet velocity decreased, the copper slag along the minor axis still had a large kinetic energy and the high–flow–rate fluid drove the flow of low–flow–rate fluid, so the main kinetic energy transfer direction began to develop along the major axis, while the momentum diffusion range remained increased.
The variable–velocity blowing system SWB provided strong kinetic energy for the furnace fluid when the jet velocity was high and prevented the copper slag velocity from being reduced when the jet velocity was low. SWB played a role in stabilizing the fluid velocity in the furnace, which is conducive to a smooth reaction in the converter.

5. Conclusions

In this investigation, the flow–field characteristics of SA and DA lance displacements were studied with numerical simulation, and the mixing ability of two variable–velocity blowing systems, SWB and RWB, and the CVB constant–velocity blowing system on the slag phase were comparatively investigated. The simulation results were verified using water–model experiments. The mechanism of the difference in the mixing effect and the reason for the enhanced mass transfer in different lance arrangements and constant/variable–velocity blowing systems was elucidated and concluded as follows.
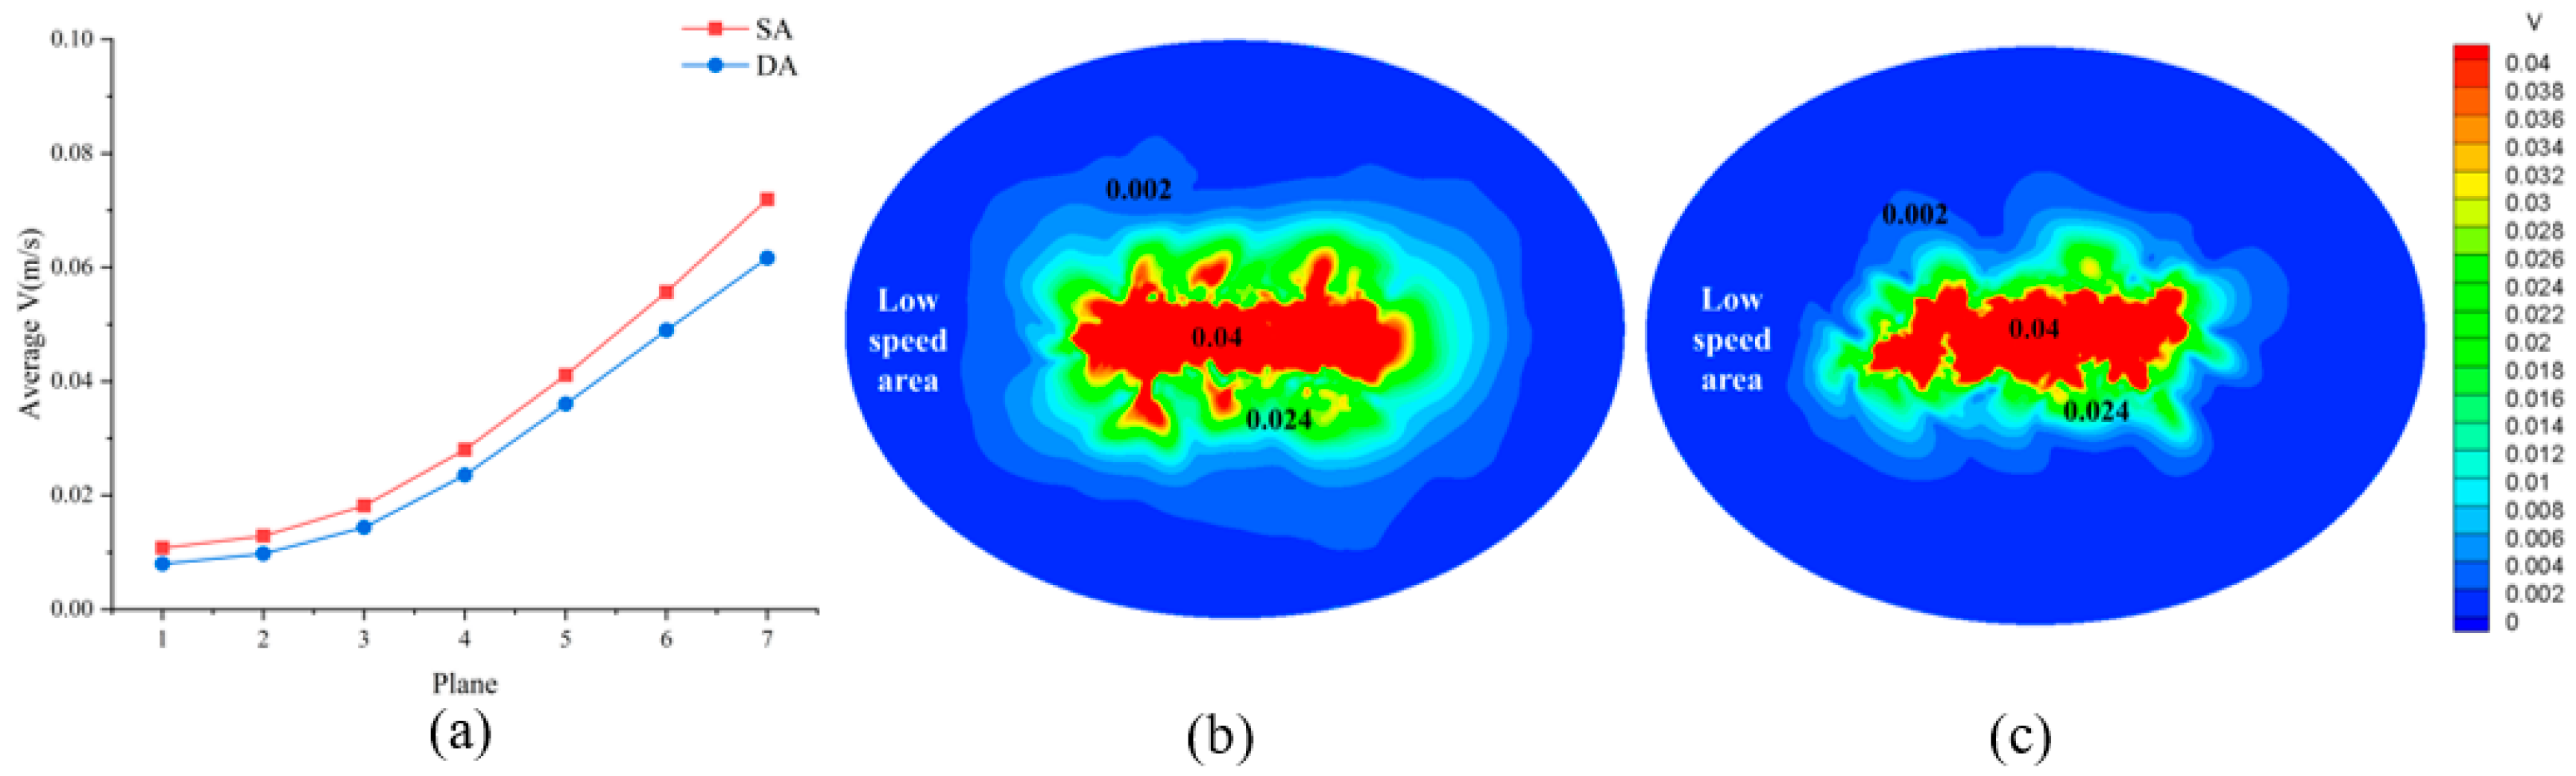
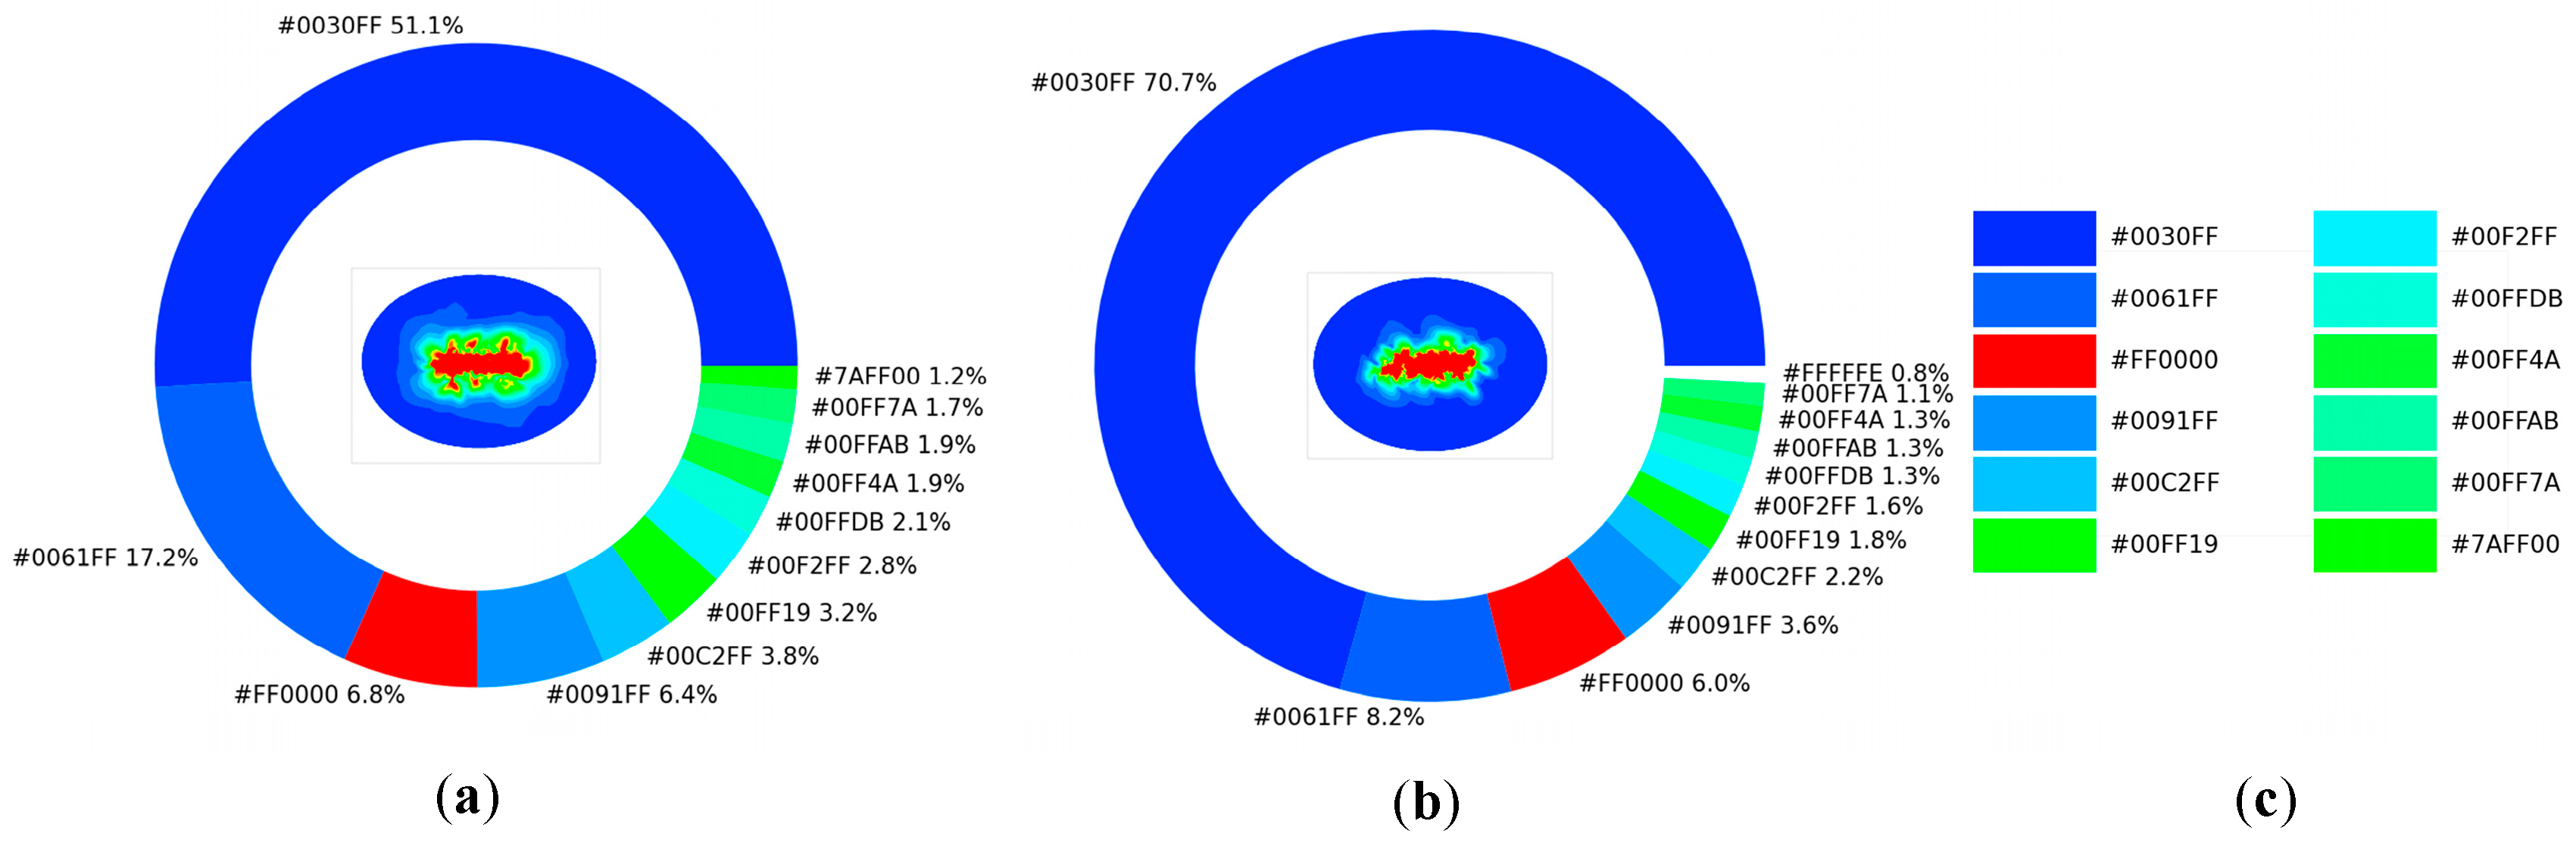
  • Compared with DA, SA can increase the impact area of the oxygen–rich air jet and expand the contact area between the oxygen–rich air and the copper slag. The average velocity of the SA slag phase is 117.93% higher than that of DA, and the percentage of low–velocity area of SA is 27.72% smaller than that of DA. The momentum–transfer ability of SA in the slag phase is better than that of DA, which can effectively improve the stirring effect in the slag phase.
  • There is energy dissipation between the two rows of DA lances, and the local area below the SA lances is in a state of disequilibrium with other locations, making the macro flow direction toward the furnace wall. The unstable feature of the SA local area is conducive to the flow of the slag phase, which improves the reaction rate of oxygen–rich air and copper slag.
  • CVB is unable to break the inherent flow in the low–velocity area. SWB reduced the proportion of the low–velocity area compared to CSB by 82.65%. RWB’s low–velocity area compared to that of CSB was significantly reduced by 89.45%. Variable–velocity blowing makes the jet and slag fluid velocity inverse difference value change and improves the slag mass–transfer effect and fluidity. The variable velocity of SWB, with its smooth waveform velocity control, has the ability to buffer the flow–field velocity’s sharp reduction and is conducive to the smooth operation of the top–blowing furnace.

Author Contributions

W.L. conducted the original manuscript writing; S.W., J.X. and Y.Z. revised the manuscript; J.H., H.W. and Q.X. provided the methodology; D.L. and G.D. confirmed the manuscript. All authors have read and agreed to the published version of the manuscript.

Funding

Support is greatly appreciated from the National Natural Science Foundation of China (No. 52166004), the Natural Science Foundation of Yunnan Province, China(202101AU070031) and the Scientific Research Fund Project of Yunnan Education Department, China (No. 2021J0063).

Data Availability Statement

Data available on request due to restrictions eg privacy or ethical. The data presented in this study are available on request from the corresponding author. The data are not publicly available.

Conflicts of Interest

The authors declare no conflict of interest.

References

  1. Zhou, S.; Guo, X.; Tian, B.; Li, B.; Wei, Y. Investigation on Direct-to-Blister Smelting of Chalcocite via Thermodynamics and Experiment. Metals 2020, 11, 19. [Google Scholar] [CrossRef]
  2. Sokolovskaya, L.V.; Kvyatkovskiy, S.A.; Kozhakhmetov, S.M.; Semenova, A.S.; Seisembayev, R.S. Effect of Reducing Agent on Structure and Thermal Properties of Autogenous Copper Sulfide Concentrate Smelting Slags. Metallurgist 2021, 65, 529–537. [Google Scholar] [CrossRef]
  3. Zhao, B.; Liao, J. Development of Bottom-Blowing Copper Smelting Technology: A Review. Metals 2022, 12, 190. [Google Scholar] [CrossRef]
  4. He, J.; Zhang, M.; Chen, H.; Guo, S.; Zhu, L.; Xu, J.; Zhou, K. Enhancement of leaching copper by organic agents from waste printed circuit boards in a sulfuric acid solution. Chemosphere 2022, 307, 135924. [Google Scholar] [CrossRef] [PubMed]
  5. Li, J.; Ge, X.; Liu, Q. The Development, Industrial Application and Future of Copper Smelting Technology by Three Continuous Furnaces in Thermal Operation which means Oxygen-enriched Side-blowing Smelting Furnace-Multi-lance Top-blowing Continuous Converting Furnace-Pyrometallurgical Anode Refining Furnace. Nonferrous Metall. Equip. 2021, 35, 64–67+75. [Google Scholar]
  6. Song, K.; Jokilaakso, A. Transport phenomena in copper bath smelting and converting processes–A review of experimental and modeling studies. Miner. Process. Extr. Metall. Rev. 2022, 43, 107–121. [Google Scholar] [CrossRef]
  7. Chibwe, D.K.; Akdogan, G.; Aldrich, C.; Taskinen, P. Modelling of mixing, mass transfer and phase distribution in a Peirce–Smith converter model. Can. Metall. Q. 2013, 52, 176–189. [Google Scholar] [CrossRef]
  8. Chibwe, D.K.; Akdogan, G.; Taskinen, P.; Eksteen, J.J. Modelling of fluid flow phenomena in Peirce-Smith copper converters and analysis of combined blowing concept. J. S. Afr. Inst. Min. Metall. 2015, 115, 363–374. [Google Scholar] [CrossRef]
  9. Zhao, H.L.; Yin, P.; Zhang, L.F.; Wang, S. Water model experiments of multiphase mixing in the top-blown smelting process of copper concentrate. Int. J. Miner. Metall. Mater. 2016, 23, 1369–1376. [Google Scholar] [CrossRef]
  10. Wang, R.; Zhang, B.; Hu, C.; Liu, C.; Jiang, M. Physical Modeling of Slag Foaming in Combined Top and Bottom Blowing Converter. JOM 2022, 74, 151–158. [Google Scholar] [CrossRef]
  11. Li, Q.; Li, M.; Kuang, S.; Zou, Z. Numerical simulation of the interaction between supersonic oxygen jets and molten slag–metal bath in steelmaking BOF process. Metall. Mater. Trans. B 2015, 46, 1494–1509. [Google Scholar] [CrossRef]
  12. Dong, P.; Zheng, S.; Zhu, M. Numerical Study on Gas-Metal-Slag Interaction with Single-Flow Postcombustion Oxygen Lance in the Steelmaking Process of a Top-Blown Converter. JOM 2022, 74, 1509–1520. [Google Scholar] [CrossRef]
  13. Yang, K.; Wang, Y.; Li, M.; Li, X.; Wang, H.; Xiao, Q. Modeling topological nature of gas–liquid mixing process inside rectangular channel using RBF-NN combined with CEEMDAN-VMD. Chem. Eng. Sci. 2023, 267, 118353. [Google Scholar] [CrossRef]
  14. Wang, Y.; Wang, S.; Wei, Y.; Zhang, T.; Li, S. Numerical simulation of gas-liquid mixed top blowing to enhance momentum diffusion. Appl. Therm. Eng. 2020, 181, 12. [Google Scholar] [CrossRef]
  15. Liu, G.Q.; Li, J.N.; Xu, D.; Zheng, B. Energy balance between multiple supersonic jets and molten bath in BOF steelmaking. Ironmak. Steelmak. 2022, 49, 726–736. [Google Scholar] [CrossRef]
  16. Jia, H.; Li, Y.; Liu, K.; Feng, L. Study on jet characteristics of a dual-structure converter oxygen lance based on hydrodynamics. AIP Adv. 2022, 12, 075026. [Google Scholar] [CrossRef]
  17. Hu, S.; Zhu, R.; Liu, R.; Dong, K. Research on the Flow Properties and Erosion Characteristics in Combined Blown Converter at Steelmaking Temperature. In TMS Annual Meeting & Exhibition; Springer: Cham, Switzerland, 2018; pp. 159–171. [Google Scholar]
  18. Zhao, H.; Lu, T.; Liu, F.; Yin, P.; Wang, S. Computational fluid dynamics study on a top-blown smelting process with lance failure in an Isa furnace. JOM 2019, 71, 1643–1649. [Google Scholar] [CrossRef]
  19. Li, Y.; Lou, W.T.; Zhu, M.Y. Numerical simulation of gas and liquid flow in steelmaking converter with top and bottom combined blowing. Ironmak. Steelmak. 2013, 40, 505–514. [Google Scholar] [CrossRef]
  20. Seshadri, V.; Rodrigues, E.F.; da Silva, C.A.; da Silva, I.A.; de Castro Lima, B.S.; Mattioli, C.G.; Carmozine Prado, M.T. Modeling and CFD Simulations of Multiphase Melt Flows in Steelmaking Converters under Combined Blow Conditions. In 5th International Symposium on High-Temperature Metallurgical Processing; John Wiley & Sons, Inc.: Hoboken, NJ, USA, 2014; pp. 435–442. [Google Scholar]
  21. Li, M.; Li, L.; Li, Q.; Zou, Z. Modeling of mixing behavior in a combined blowing steelmaking converter with a filter-based Euler–Lagrange model. JOM 2018, 70, 2051–2058. [Google Scholar] [CrossRef]
  22. Park, J.H.; Park, S.S.; Han, X.F.; Yi, K.W. Numerical analysis on fluid flow and heat transfer in the smelting furnace of mitsubishi process for Cu refining. Met. Mater. Int. 2016, 22, 118–128. [Google Scholar] [CrossRef]
  23. Lim, S.M.; Yi, K.W. Copper Penetration of a Lance in a Smelting Furnace of the Mitsubishi Process. Met. Mater. Int. 2022, 28, 907–918. [Google Scholar]
  24. Lim, S.M.; Park, S.S.; Yi, K.W. Extension of Lance Life by Change of Height of Lances in the Smelting Furnace of Mitsubishi Process. Met. Mater. Int. 2021, 27, 3721–3729. [Google Scholar]
Figure 1. Furnace design.
Energies 16 02412 g001
Figure 2. Phase–layer division.
Energies 16 02412 g002
Figure 3. Mesh generation: (a) Mesh division; (b) Gas velocity below the oxygen lance at different grid numbers.
Energies 16 02412 g003
Figure 4. Experimental apparatus.
Energies 16 02412 g004
Figure 5. Comparison of cavity shape in the simulation (ac) and experiment (df).
Energies 16 02412 g005
Figure 6. Lance arrangement design: (a) SA; (b) DA.
Energies 16 02412 g006
Figure 7. The local phase diagram: (a) The penetration depth of SA at t = 1 s; (b) The penetration depth of SA at t = 3 s; (c) The penetration depth of DA at t = 1 s; (d) The penetration depth of DA at t = 3 s.
Energies 16 02412 g007
Figure 8. Data extraction location and velocity distribution of the three sampling lines: (a) Selection of sampling planes; (b) Selection of sampling lines; (c) Velocity distribution on Line 1; (d) Velocity distribution on Line 2; (e) Velocity distribution on Line 3.
Energies 16 02412 g008
Figure 9. Average velocity and velocity distribution of 7 planes: (a) Average velocity of 7 planes; (b) SA on plane 4 velocity distribution; (c) DA on plane 4 velocity distribution.
Energies 16 02412 g009
Figure 10. Digitization of velocity distribution on Plane 4: (a) Digitization of velocity distribution for SA; (b) Digitization of velocity distribution for DA; (c) Color codes.
Energies 16 02412 g010
Figure 11. Turbulent kinetic energy performance on 7 planes: (a) Turbulent kinetic energy of SA and DA on 7 planes; (b) Turbulent energy dissipation of SA and DA on 7 planes.
Energies 16 02412 g011
Figure 12. SA enhanced mixing mechanism: (a) Unbalanced flow field of SA slag phase; (b) streamlines of SA slag phase; (c) Energy dissipation in DA localization.
Energies 16 02412 g012
Figure 13. Variable–velocity blowing wave–design diagram: (a) Sine–wave blowing system SWB; (b) Rectangular–wave blowing system RWB.
Energies 16 02412 g013
Figure 14. Average velocity on plane 2, plane 4, and plane 6 for two periods: (a) Average velocity on plane 2; (b) Average velocity on plane 4; (c) Average velocity on plane 6.
Energies 16 02412 g014
Figure 15. Velocity distribution on plane 4; (a) Velocity distribution of CVB; (b) Velocity distribution of SWB; (c) Velocity distribution of RWB.
Energies 16 02412 g015
Figure 16. Digitization of velocity distribution on Plane 4; (a) Digitization of velocity distribution for CVB; (b) Digitization of velocity distribution for SWB; (c) Digitization of velocity distribution for RWB; (d) Color codes.
Energies 16 02412 g016
Figure 17. Turbulent kinetic energy performance on plane 2, plane 4, and plane 6: (a) Distribution of turbulent kinetic energy on plane 2; (b) Distribution of turbulent kinetic energy on plane 4; (c) Distribution of turbulent kinetic energy on plane 6; (d) Distribution of turbulent dissipation on plane 2; (e) Distribution of turbulent dissipation on plane 4; (f) Distribution of turbulent dissipation on plane 6.
Energies 16 02412 g017
Figure 18. SWB enhanced mixing mechanism.
Energies 16 02412 g018
Disclaimer/Publisher’s Note: The statements, opinions and data contained in all publications are solely those of the individual author(s) and contributor(s) and not of MDPI and/or the editor(s). MDPI and/or the editor(s) disclaim responsibility for any injury to people or property resulting from any ideas, methods, instructions or products referred to in the content.

