Article

Thermodynamic Performance Comparison of CCHP System Based on Organic Rankine Cycle and Two-Stage Vapor Compression Cycle

School of Energy and Environmental Engineering, Hebei University of Technology, Tianjin 300401, China
*
Author to whom correspondence should be addressed.
Energies 2023, 16(3), 1558; https://doi.org/10.3390/en16031558
Submission received: 29 December 2022 / Revised: 25 January 2023 / Accepted: 1 February 2023 / Published: 3 February 2023
(This article belongs to the Special Issue Low Carbon Energy Technology for Heating and Cooling of Buildings)

Abstract

:
Owing to different temperature rages of power generation and refrigeration in the cogeneration system, for the sake of selecting the working fluids that are suitable for both power generation and refrigeration simultaneously, 17 commonly used working fluids are evaluated in this paper, based on an organic Rankine cycle coupled with a two-stage vapor compression cycle system in different geothermal fluid temperatures. The performances of working fluids under different working conditions, and the maximum power generation as well as cooling capacity are analyzed. Additionally, the main parameters are analyzed to optimize the system performance. The results indicate that net power output has a local maximum where it corresponds to the optimal evaporation temperature. Besides, the lower the critical temperature, the greater the thermal conductance, and the pressure ratio decreases with evaporation temperature. Hydrocarbons all have higher total heat source recovery efficiency. R1234yf, propane and R1234ze, R152a have excellent maximum net power output when the geothermal fluid temperature is low and high, respectively. R134a always has better maximum net power output and cooling capacity. The net power output is used for cooling, and the COP is closed, therefore, maximum net power output results in the maximum cooling capacity. In addition, that of propane and R1234yf are excellent until the geothermal fluid temperature are 140 °C and 120 °C separately. R1234ze and R152a are good when the geothermal fluid temperatures are 140 °C and 150 °C, respectively.

1. Introduction

With the vigorous economic development all over the world, fossil energy that is limited is constantly being consumed [1], which will lead to increasingly serious environmental pollution, global warming and ozone layer depletion. The use of clean renewable energy and the improvement of energy utilization rates are effective ways to achieve the aim of the 2015 Paris Agreement. It is reported that geothermal resources are rich and widely distributed in China [2], and has the potential for electricity generation by about 1400 TWh per year by 2050 [3], which would reduce CO2 emissions by about 800 Mt per year [4]. Besides, the key benefit of geothermal energy is stability. However, the temperature of 70% geothermal energy is below 150 °C [5]. As a result, it is significant to utilize the low-middle temperature geothermal fluid through some technologies. With the characteristics of easy maintenance and elementary cycle configuration, the organic Rankine cycle (ORC) is often used in low and medium temperature applications [6,7,8]. It is necessary to study the ORC system driven by low-medium temperature geothermal sources.
To effectively reduce the consumption of fossil energy and the emission of pollutants, combined cooling, heating, and power (CCHP) systems have been widely used to improve energy utilization efficiency. Gu et al. [9] presented an overall review of the modeling, planning and energy management of the CCHP microgrid. Huang et al. [10] proposed a CCHP incorporating cold energy recovery system to utilize both heat and cold energies of liquified natural gas in a cascade way. Jia et al. [11] proposed a novel CCHP system combining ORC and solar collectors with fully considered thermal cascade utilization. Some researchers have investigated the operation characteristics of CCHP [12,13] and proposed methods to improve the system performance. Some scholars proposed new systems combined with the CCHP system [14,15].
The energy consumption and CO2 emissions of can be reduced effectively by using proper alternative refrigerant [16]. Liu et al. [17] proposed to improve the efficiency of cooling system by adopting nano-refrigerants. Vering et al. [18] presented new method to screen suitable refrigerants. Some researchers have proposed the best working fluid that they think is beneficial to the system. Ustaoglu et al. [19] use TOPSIS analysis to decide the optimal refrigerants with cost, safety, environmental and enviroeconomic concerns. The optimal operating parameters, the coefficient of performance (COP) were analyzed under different single-refrigerant pairs by Sun et al. [20]. Malwe et al. [21] studied a multistage multi-evaporator vapor compression cycle (VCC) system, and conducted exergy assessment of 18 refrigerants. The results showed that comparing hydrofluoroolefins (HFOs) refrigerants, R141b, R123, R245ca, R245fa, and R152a showed better thermodynamic performance. However, the disadvantage is the higher global warming potential (GWP) values. R1234ze(E), and R1234yf are environmentally friendly and have a similar performance comparing to conventional refrigerants. Kang et al. [22] studied that hydrocarbons (HCs) have higher COP than other natural refrigerants, and mixing hydrocarbon refrigerants have better heat exchange performance than a single refrigerant. Sulaiman et al. [23] evaluated environmental and thermodynamic characteristics of R245fa, R1233zd, R1336mzz and R601. The results revealed that the COP of the R1233zd, R1336mzz and R601 are 8.32%, 11.68% and 19.61% higher than R245fa, respectively. He et al. [24] compared the thermodynamic performance of mixing refrigerants on a two-stage absorption refrigeration (AR) system. The results showed that the COP of the system can be prompted through an optimal working fluid ratio, and the exergy loss ratios of the heat exchanger are different with the different working fluid pairs and their proportions. Zarei et al. [25] combined solar ejector vapor compression refrigeration cycles with two-stage evaporation which use R1234yf, R600a, and R290 to replace R134a. The results revealed that the maximum efficiency and lowest system exergy destruction of R290 are the best in comparison with other refrigerants. Suresh et al. [26] studied R152a, R440a and four lower GWP HFOs R1234yf, R1243zf, R1234ze to replace R134a in a cooling system, which showed that R1234yf in hybrid mode has the greatest COP. Walid Faruque et al. [27] studied that HCs cannot damage the system performance when they are used in ultra-low temperature occasions.
To evaluate working fluids more comprehensively, some representative working fluids are selected for each type. The GWP of the selected working fluids are all less than 1500. Firstly, hydrofluorocarbons (HFCs), with excellent energy efficiency and environmental protection characteristics, have been rapidly and widely used. Although ozone depletion potential (ODP) is 0, it has a high GWP [28], which does not damage the ozone layer, but has a strong warming effect on climate change. While HFCs have been widely used in the cooling system during the past decades [29], with the elimination of hydrochlorofluorocarbons (HCFCs), the output of HFCs has increased significantly. Therefore, there is still a huge demand space for HFCs. In this paper, five commonly used HFCs are selected to investigate the thermodynamic properties. Secondly, the main problem of HCs is its flammable and toxic physical properties [30]. However, with the introduction and improvement of relevant standards, the risks can be effectively avoided. For example, R600a is widely used in domestic cooling systems in Europe and many parts of the world [31]. More and more compressors of commerce and industry may use R170, R290 and R600a, which are HCs [31]. In addition, HCs are natural and environment-friendly, with zero ODP and low GWP [32]. Therefore, nine of them are selected in this paper. Finally, the new HFOs are environment friendly, and can be rapidly decomposed in the atmospheric environment due to its own special chemical characteristics, so its atmospheric life is extremely low. The greenhouse effect is very small, and the ODP is 0 [32], which is low toxic and non combustible, and three representatives of them are selected.
Based on the above-mentioned researches, fewer papers have studied CCHP driven by geothermal energy compared with CCP and CHP, and few of them further improved the performance of the CCHP system through parameters optimization and working fluid selection simultaneously. In addition, the traditional working fluid that is optimized at a fixed certain heat source temperature, or that is suitable for several heat source temperatures simultaneously, was obtained. However, the influence of the working fluid on the system performance changes with the temperature of the heat source. In this paper, the medium and low temperature heat sources will be divided into zones, in which the optimal working fluids for the cogeneration or separated system performance of each heat source temperature are obtained. Meanwhile, an ORC-TSVCC, a novel CCHP system is proposed. Therefore, the main parameters and 17 common working fluids of all types are studied to optimize the system performance for each heat source temperature.

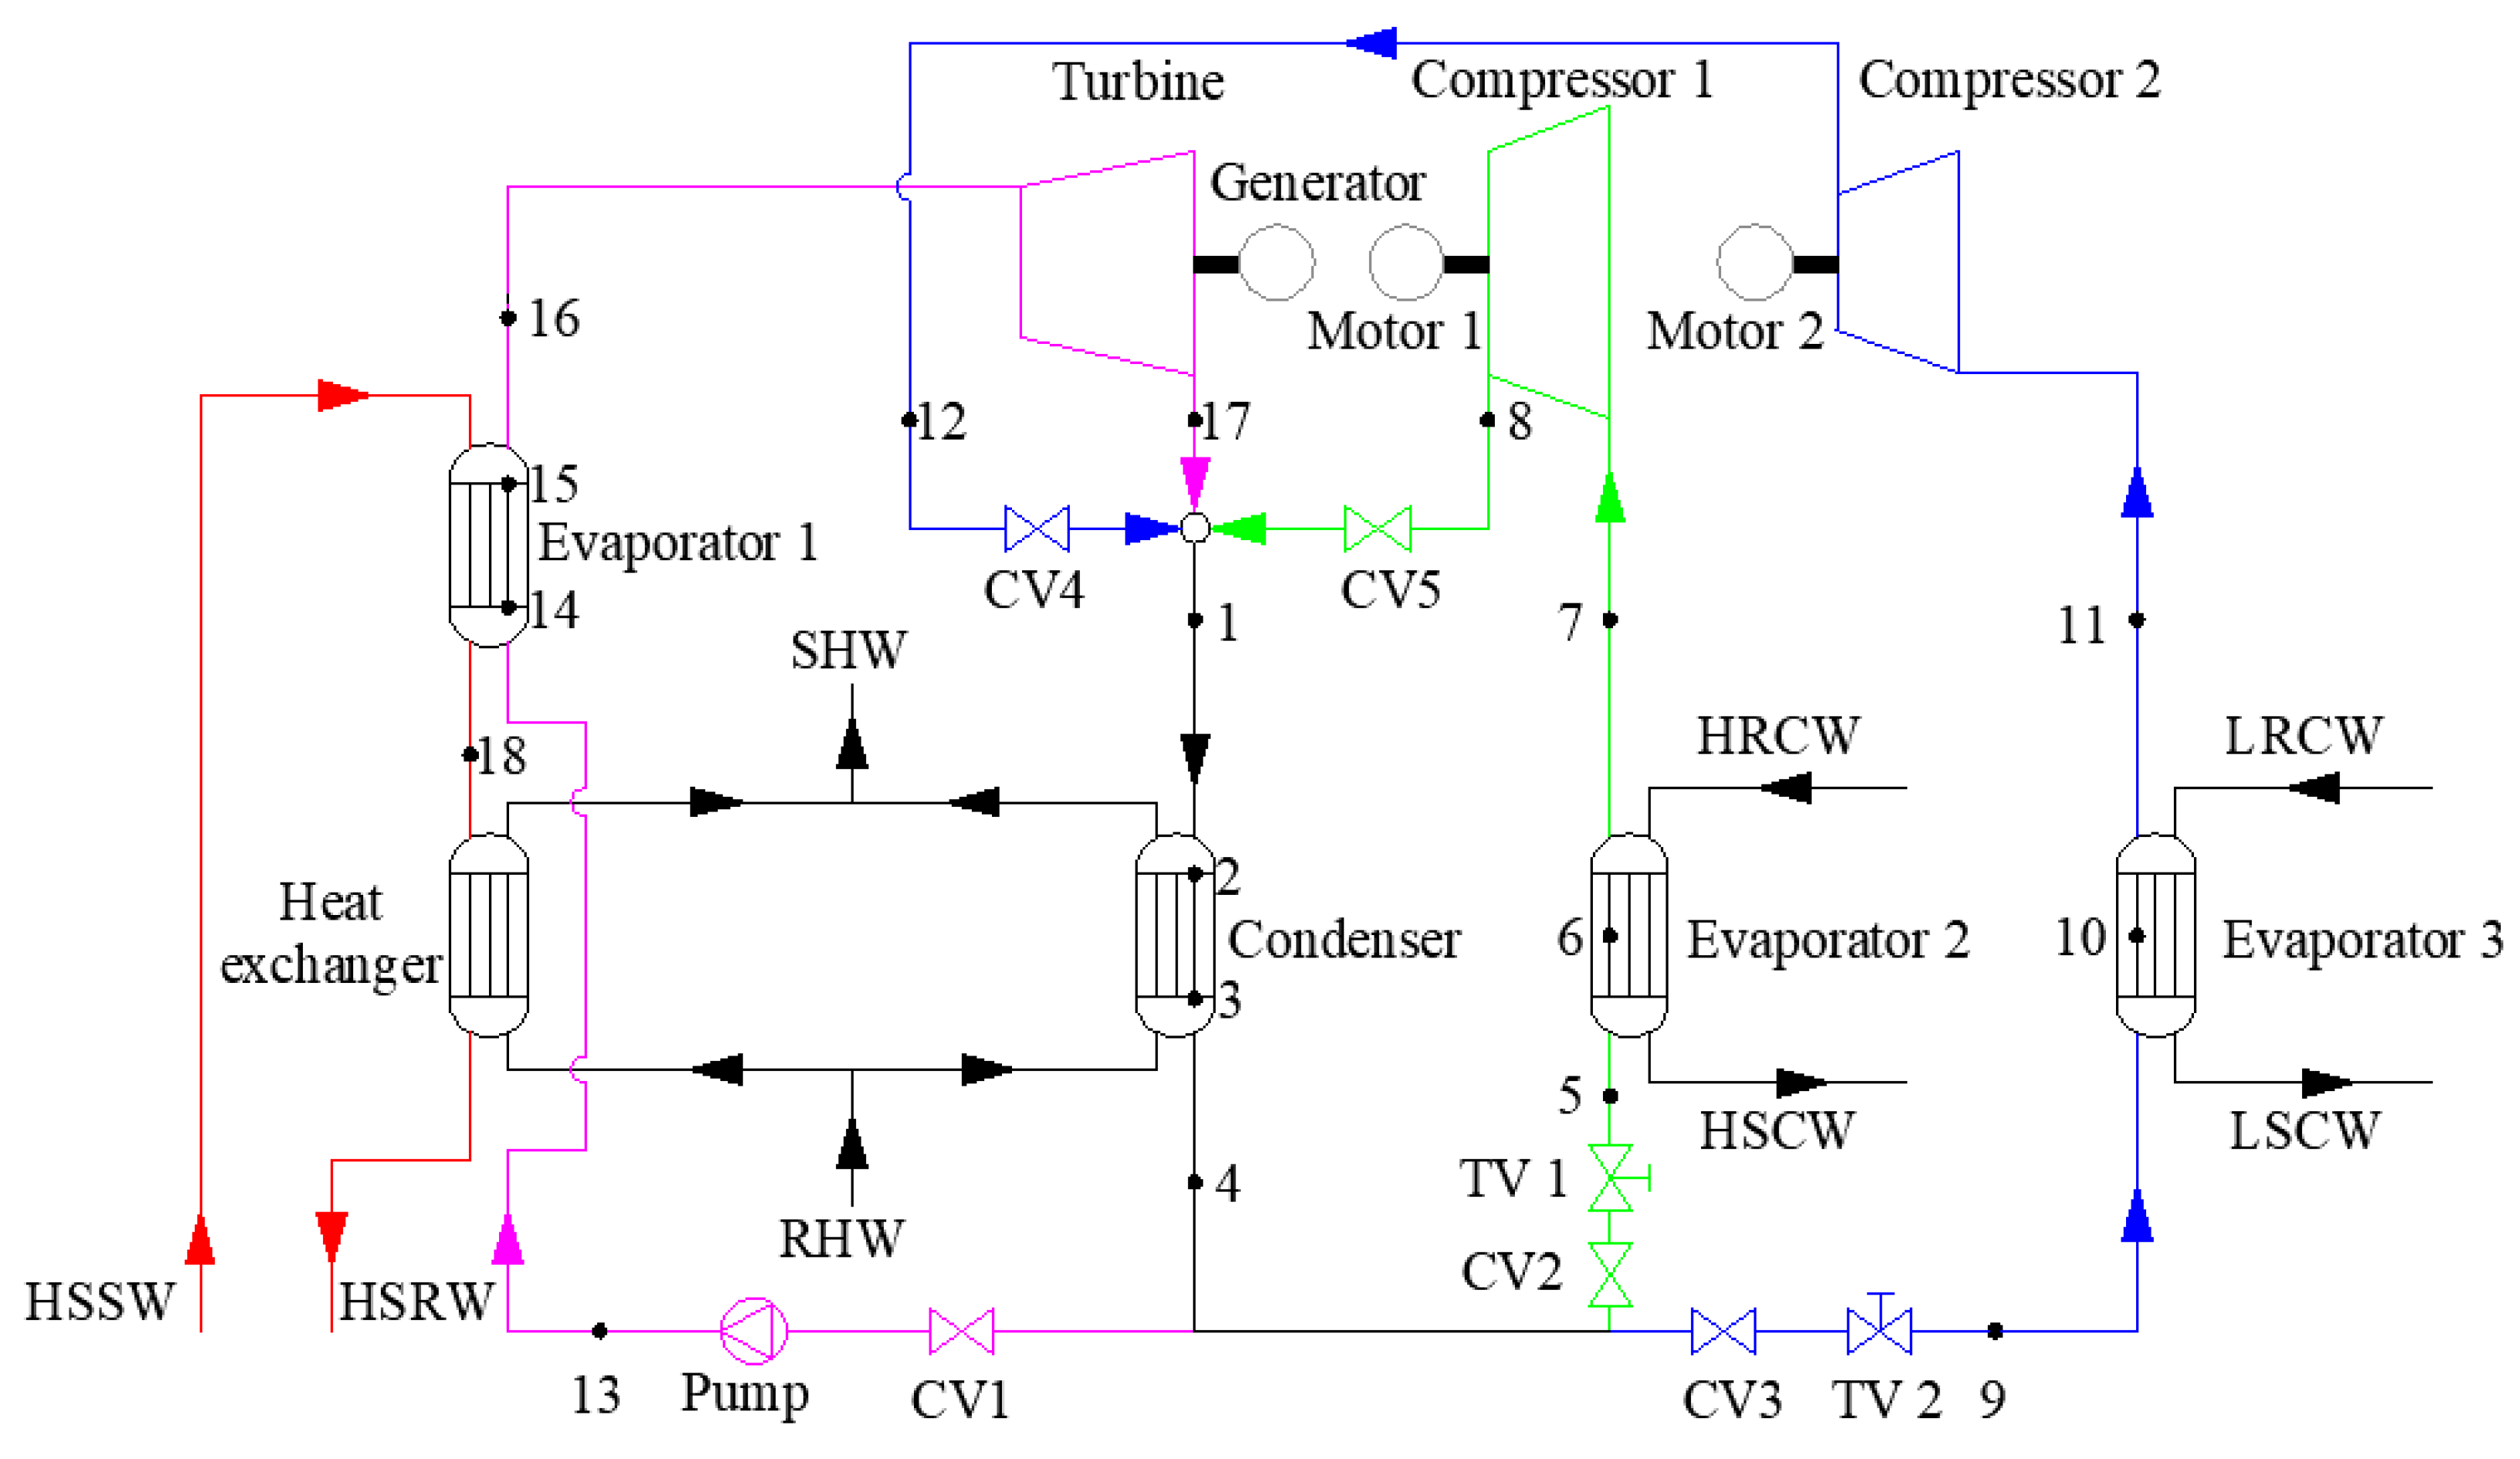
2. System Description

The system can be divided into the power generation subsystem and cooling subsystem. The schematic diagram and T-s diagram of the ORC-TSVCC system are shown in Figure 1 and Figure 2, respectively. In Figure 1, the red and purple line represent geothermal cycle and ORC separately, and the green and blue line stand for the high-temperature and low-temperature VCC, respectively. In Figure 2, the red line indicates the ideal process.
In the ORC subsystem, the geothermal fluid transfers heat to working fluid and turns it into a superheated state in evaporator 1. Next, superheated vapor converts enthalpy drop into power output in the turbine. Then, the exhaust vapor from the turbine outlet enters the condenser to be condensed into a sub-cooling state. Finally, the sub-cooling working fluid enters the pump to be pressurized, and then returns back to evaporator 1 to complete a cycle.
The turbine relies on the generator to output power, which is firstly sent to compressor 1 and 2 to compress vapor, and the rest is connected to the grid.
In the VCC subsystem, one part of the working fluid is cooled and depressurized in the throttling valve 1, then it transfers the cooling capacity to the high-temperature chilled water and turns itself into saturated vapor, which is compressed by compressor 1. The other part is cooled and depressurized in the throttling valve 2, then it absorbs heat from the low-temperature chilled water to be saturated vapor in the evaporator 2. Next, the two parts are mixed in the mixer, then flow into condenser to be cooled into a sub-cooling state, and back to the throttling valve 1 and 2 separately, to complete a cooling cycle. The latent load is processed by the low-temperature chilled water due to a lower dew point temperature. The sensible load is treated with high-temperature chilled water. The COP of the cooling subsystem can be improved due to the increase of the chilled water temperature.
Under the condition that cooling, heating and power are required simultaneously, all control valves are opened, and the system is in full operation. When heating and power are needed simultaneously, there is no refrigeration and the VCC subsystem is disconnected by disconnecting control valve 2, 3, 4 and 5, and only the control valve 1 is open. In terms of the VCC subsystem, the high temperature single-stage refrigeration can be achieved by disconnecting control valve 3 and 4, and the low temperature single-stage refrigeration can be achieved by disconnecting control valve 2 and 5.
The thermophysical properties of the working fluids selected in this paper are shown in Table 1.

3. Thermodynamic Modeling

The system is simulated in MATLAB 9.1 by linking to REFPROP, and the main parameters are calculated based on the first and second laws of thermodynamics in this study. The following assumptions are made to simplify the model:
(1)
The system operates stably [36].
(2)
Expansion and compression processes have specified isentropic efficiencies [37].
(3)
The pressure drops, heat transfer loss and kinetic energy of organic working fluid in the system are ignored [38].
(4)
The pure water properties are used instead of the geothermal fluid [38].
(5)
Five superheated degrees is considered for wet working fluids, and 0 °C is for dry working fluids.
On the premise that the cold and heat sources, pinch point temperature difference and component efficiency are given, the mathematical equations for cycle analyses of the system are as follows:
Q eva 1 = m ORC ( h 13 h 16 ) = m gw ( h gw , in h gw , out )
where the Qeva1 is the heat exchange capacity of evaporator 1; mORC and mgw represent the mass flow rate of ORC subsystem and geothermal fluid; hgw,in, hgw,out are specific enthalpy of geothermal fluid at inlet and outlet, respectively.
h 17 = h 16 ( h 16 h 17 s ) × η t
W t = m ORC ( h 16 h 17 )
where Wt is the power output of turbine, and ηt represents the efficiency of turbine.
m ORC = c m gw ( t gw , in t 14 Δ t p p ) h 16 h 14
where c and Δtpp denote the specific heat capacity and temperature difference between geothermal fluid and working fluid at point 14, respectively.
η p = ( h 17 s h 16 ) / ( h 17 h 16 )
W P = m ORC ( h 13 h 4 ) = m ORC ( h 13 s h 4 ) / η P
where WP is work consumed by the pump, and ηP represents efficiency of the pump.
m VCC = m VCC 1 + m VCC 2
m wf = m ORC + m VCC
where mVCC1, mVCC2 represent the mass flow rate of high and low temperature VCC subsystem, respectively. mVCC, mwf represent the mass flow rate of VCC subsystem and total mass flow rate, respectively.
Q con , ORC = m ORC ( h 17 h 4 )
Q con , VCC = m VCC 1 ( h 8 h 4 ) + m VCC 2 ( h 12 h 4 )
Q con = Q con , ORC + Q con , VCC
where Qcon,ORC, Qcon,VCC and Qcon represent condensation capacity of the ORC subsystem, the VCC subsystem, the whole system, respectively.
m cw = Q con c ( T cw , out T cw , in )
where mcw is mass flow of cooling water, and Tcw,out, Tcw,in represent the temperature of cooling water at the outlet and inlet of the condenser, respectively.
η com 1 = 1 0.04 ( p 8 / p 7 )
h 8 = h 7 + ( h 8 s h 7 ) / η com 1
W com 1 = m VCC 1 × ( h 8 h 7 )
where ηcom1, Wcom1 represent efficient and power consumption of compressor 1, respectively.
η com 2 = 1 0.04 ( p 12 / p 11 )
h 12 = h 11 + ( h 12 s h 11 ) / η com 2
W com 2 = m VCC 2 × ( h 12 h 11 )
W com 1 + W com 2 = W com
where ηcom2, Wcom2 represent efficient and power consumption of compressor II, respectively, and Wcom is power consumption of compressors.
Q eva 2 = m VCC 1 ( h 7 h 5 )
COP 1 = Q eva 2 / W com 1
where subscript eva2 denotes evaporator 2.
Q eva 3 = m VCC 2 ( h 11 h 9 )
COP 2 = Q eva 3 / W com 2
where subscript eva3 denotes evaporator 3.
Q VCC = Q eva 2 + Q eva 3
COP = Q VCC / W com
E X VCC = ( T amb T eva 2 1 ) × Q eva 2 + ( T amb T eva 3 1 ) × Q eva 3
η ex , TSVCC = E X VCC W com
where EX stands for exergy, the subscripts amb, TSVCC represent ambient and two-stage vapor compression cycle system, respectively.
W net = η m η g W exp W p
W e = W net W com
where ηm and ηg represent the mechanical efficiency and power generation efficiency of turbine, respectively; Wnet and We represent net power output of the ORC and ORC-TSVCC system, respectively.
E X gw = m gw ( h gw , in h gw , 18 T amb ( s gw , in s gw , 18 ) )
where EXgw represents the exergy of geothermal fluid.
η ex , ORC = W net E X gw
where ηex,ORC represents the power exergy efficiency of ORC subsystem.
η th , ORC = W net Q EVA 1
where ηth,ORC represents the power generation efficiency of ORC subsystem.
Q hex = m gw ( h gw 18 h gw , out )
η tot = W e + Q eva 2 + Q eva 3 + Q con + Q ex m gw × h gw , in
where Qhex and ηtot are the heat exchange of heat exchanger and total recovery efficiency of system heat source, respectively.
( K A ) EVA 1 = ( K A ) EVA 1 , pre + ( K A ) EVA 1 , eva
where (KA)EVA1 are thermal conductance of the evaporator.
( K A ) EVA 1 = Q EVA 1 / Δ T
Δ T EVA 1 , pre = T gw , out T 6 Δ T EVA 1 , pp ln T gw , out T 6 Δ T EVA 1 , pp
where ΔTEVA1,pre are average logarithmic temperature difference of the evaporator 1 during the stage of preheating.
Δ T EVA 1 , eva = T gw , out T 1 Δ T EVA 1 , pp ln T gw , out T Δ T EVA 1 , pp
where ΔTEVA1,eva are average logarithmic temperature difference of the evaporator 1 during the stage of evaporation.
E L EVA 1 = m wf T amb ( s 16 s 13 ) + m gf T amb ( s in s 22 )
E L EVA 2 = m VCC 1 T amb ( s 7 s 5 ) + m hw T amb ( s hout s hin )
E L EVA 3 = m VCC 2 T amb ( s 11 s 9 ) + m lw T amb ( s lout s lin )
ELEVA1, ELEVA2 and ELEVA3 stand for exergy loss of evaporator 1, evaporator 2 and evaporator 3, respectively. mhw, mlw represent the mass flow rate of high and low temperature chilled water, respectively.
E L t = m wf T amb ( s 17 s 16 )
E L COM 1 = m VCC 1 T amb ( s 8 s 7 )
E L COM 2 = m VCC 2 T amb ( s 12 s 11 )
ELt, ELCOM1 and ELCOM2 stand for exergy loss of turbine, compressor 1 and compressor 2, separately.
E L CON = m wf T amb ( s 4 s 17 ) + m VCC 1 T amb ( s 4 s 8 ) + m VCC 2 T amb ( s 4 s 12 ) + m cw T amb ( s cw , out s cw , in )
E L p = m wf T amb ( s 13 s 4 )
E L CV 1 = m VCC 1 T amb ( s 5 s 4 )
E L CV 2 = m VCC 2 T amb ( s 9 s 5 )
ELCON, ELp, ELCV1 and ELCV2 stand for exergy loss of condenser, pump, control valve 1, and control valve 2, respectively.
E L HEX = m gf T amb ( s gf , 22 s gf , out ) + m HEX T amb ( s cw , out s cw , in )
E L sys = E L EVA 1 + E L EVA 2 + E L EVA 3 + E L CON + E L COM 1 + E L COM 2 + E L P + E L t + E L CV 1 + E L CV 2
ELHEX, ELsys represent exergy loss of heat exchanger, the CCHP system, separately.
Q ARS = c m gw ( t in t out )
where QARS represent heat absorption capacity in generator, tin and tout stand for the temperature of geothermal fluid at the inlet and outlet of generator, respectively.
Q cooling , ARS = Q ARS × η thc , ARS
where Qcooling,ARS and ηthc,ARS stand for cooling capacity and thermal coefficient of AR system, separately.
η thc , VCC = η th , ORC × COP
where ηthc,VCC and ηth,ORC stand for thermal coefficient of VCC subsystem which is equivalent to that of AR system and power generation efficiency of ORC subsystem, respectively.

4. Validation

The ORC-TSVCC system has still remained at the stage of theoretical research up to present, and there is no complete mathematical model of that. The thermodynamic model established in this study was confirmed to be accurate by the actual operation data of an ORC plant [39], which is driven by geothermal fluid at the high water cut period. The data of the actual ORC plant was operated under the heat source temperature of 85 °C with R123. In addition, the initial experimental conditions are input as the initial conditions of the model, and the differences between the calculated results and actual data are compared to analyze the feasibility of the established model in this paper. It can be concluded from Table 2 that the relative errors of net power output, thermal efficiency and exergy efficiency are 2.22%, 1.52%, 2.45%, respectively. It is obvious that the results of this paper are in good agreement with the experimental results. Furthermore, this difference is mainly due to the idealized assumptions made in the model and the measuring instruments in the actual experiment.

5. Results and Discussion

5.1. Changes of Parameters in CCHP System Performance

The trend of parameters that changes with the evaporation temperature are analyzed about R245fa under the condition that the geothermal fluid temperature is 120 °C, as shown in Table 3. With the increase of evaporation temperature, on the one hand, the heat absorption of the working fluid is in a downtrend, resulting in the decrease of mass flow rate, for the temperature difference between geothermal fluid and working fluid descends. On the other hand, the enthalpy of working fluid increases in the inlet of turbine and is fixed in the outlet, which results in the increment of ideal enthalpy difference in the turbine. The pressure ratio (PR) is the pressure ratio between the inlet and outlet of the turbine, and the evaporation pressure is proportional to the evaporation temperature. As the evaporation temperature rises from 55 to 110 °C, the evaporation pressure is up from 462.59 kPa to 1741.69 kPa, which depends on the evaporation temperature. Therefore, it can be concluded that PR is inversely proportional to the evaporation pressure.
Figure 3 shows the variable trend of net power output with the change of evaporation temperature. According to the above analysis about the mass flow rate and specific enthalpy difference in the turbine, the results can be concluded that the net power output has a local maximum where it corresponds to the optimal evaporation temperature. The heat absorption capacity of working fluid increases with the increment of the geothermal fluid temperature, which is eventually proportional to the net power output. Besides, when the temperature of geothermal fluid increases by 10 °C, the optimal evaporation temperature will rise about 5 °C.
Figure 4 indicates the thermal conductance (KA)ORC with the change of evaporation temperature. KA is an evaluation indicator of heat transfer, which is the product of heat transfer coefficient and area. The critical temperature of R1234ze, R134a, and propane are lower at 109.36 °C, 101.06 °C and 96.68 °C, respectively, of which the KA increase with the teva1. The critical temperature of R1233zd, R245fa and isobutane are higher, of which the KA decrease with the teva1. There is a critical value for the geothermal fluid temperature, and the KA of working fluids is greater than that is proportional to the evaporation temperature, while for others less than that is inversely proportional to the evaporation temperature. Consequently, propane with the lowest critical temperature has the maximum KA, and R1233zd with the highest critical temperature has the minimum KA. Therefore, it can be drawn that the lower the critical temperature, the greater the KA.
The trend of (PR)ORC with the change of evaporation temperature is shown in Figure 5. PR, which is the pressure ratio between the inlet and outlet of the turbine, is an evaluation indicator of thermodynamic performance. It can be observed in Figure 5 that teva1 is in inverse proportion to PR, since the outlet pressure which is condensation pressure is constant, and the inlet pressure is directly proportional to evaporation temperature. Moreover, the propane and R245fa reach a maximum and minimum PR, respectively.

5.2. CCHP System Performance of Different Working Fluids

Table 4 illustrates the comparative performance of 17 working fluids at the geothermal fluid temperature of 90 °C. Under the condition that the temperature of geothermal fluid is lower at 90 °C, the power exergy efficiency of all working fluids is basically the same; the difference between the maximum and the minimum value is only 0.3%, which are all closed to 10.9%. Meanwhile, the maximum power exergy efficiency is 11%, which is attained in R1234yf.
For working fluids with higher cooling capacity, the cooling capacity of the low and high temperature cooling cycle are both higher than that of other working fluids. That is, the enthalpy difference between the inlet and outlet of evaporator 2 and evaporator 3 increase, resulting in higher cooling capacity. Besides, the cooling capacity of other working fluids are obviously lower than HCs, which account for the top nine of the 17 working fluids studied, among which the top six are pentane, heptane, octane, nonane, decane, and butane, and the corresponding cooling capacity are 592.00 kW, 591.27 kW, 590.58 kW, 587.32 kW, 584.87 kW, 579.84 kW, respectively. The working fluid with the lowest cooling capacity in HCs is butane, which is 517.37 kW and is 74.63 kW less than the pentane with the highest one. Among all working fluids studied, R1234yf has the lowest cooling capacity, which is 214.89 kW, accounting for only 36.30% of pentane. Futhermore, the power consumption of the compressor of HCs with more cooling capacity is relatively higher. Therefore, the conclusion that the power consumption of the compressor has direct ratio with cooling capacity could be drawn.
Among the working fluids studied, R1234yf has the lowest power consumption of the compressor of about 42.98 kW, of which compressor 1 is 18.40 kW and compressor 2 is 24.58 kW. Decane has the highest power consumption of the compressor of about 154.35 kW, of which compressor 1 and compressor 2 are 66.62 kW and 87.83 kW, respectively. In addition, the higher the COP, the higher the efficiency of the cooling system. It can be seen from Table 4 that butane has the largest COP with 5.43, which is followed by R152a, isopentane, and R1233zd, with 5.41, 5.40, 5.40, respectively. The COP of the last three is occupied by decane, nonane, and octane, which are 3.79, 4.28 and 4.67, respectively, and the COP of others are relatively concentrated between 5.0 and 5.5.
The cooling exergy efficiency is the ratio of the cooling capacity to the power consumption of the compressor. Under the condition that evaporation temperature and ambient temperature of the VCC system are determined, the cooling exergy efficiency is proportional to the cooling capacity. The working fluids with the top three cooling exergy efficiency are R152a, butane, R1233zd, which are 19.15%, 19.14%, 19.01%, respectively, while the last three are octane, none and decane, which are 13.32%, 15.03% and 16.40%, respectively. Additionally, the cooling exergy efficiency of the other HCs are in the range of 17.51–19.14%.
Table 4 illustrates that the heating capacity of HCs is generally slightly higher than that of other working fluids, as the geothermal fluid temperature is 90 °C. The first four working fluids are decane, nonane, octane and heptane in HCs, which show good heating performance, while the highest heating capacity of decane is 8990.60 kW. The highest heating capacity of HFCs is R152a, which arrives at 8799.68 kW, and the highest one of HFOs is R1233zd with 8617.79 kW.
Apparently, Table 4 indicates that the total heat source recovery efficiency of nine working fluids in HCs is basically identical, and is significantly higher than others when the geothermal fluid temperature is 90 °C. The conclusion can be drawn that HCs show better comprehensive performance than other working fluids. The total heat source recovery efficiency of HFCs is all closed to 60%, in which R152a is better than others. Among the three working fluids in HFOs, the highest one is R1233zd.
As the geothermal fluid temperature is 90 °C, the maximum net power output of R1234yf is greater than that of decane, which is smallest at about 2.8%. It can be seen that the maximum net power output of all working fluids are very closed, which all approach to 120 kW. Under the condition that the geothermal fluid temperature is 90 °C, the maximum cooling capacity of each working fluid has little difference, and all are beyond 600 kW, except the decane, nonane, octane, and heptane are lower than others. Though the maximum net power output of all working fluids is closed, the COP of the four is lower, resulting in the lower maximum cooling capacity. To sum up, R1233zd, butane, isopentane, R152a, etc., have a relatively better cooling performance within the range.
Table 5 indicates the comparative performance of 17 working fluids at the geothermal fluid temperatures of 100 and 110 °C. Within the geothermal fluid temperature range studied, R1234yf and R1234ze in HFOs, propane and isobutane in HCs, R134a and R245fa in HFCs have better power exergy efficiency, respectively. It was apparent that the first four power exergy efficiencies are R1234yf, R1234ze, R134a, and propane. The difference between the maximum and the minimum value are 0.89%, 1.86% in the temperatures 100, 110 °C, separately. It can be concluded that with the increase of geothermal fluid temperature, the gaps of the power exergy efficiency among different working fluids are increasing.
When the temperatures of geothermal fluid are 100 and 110 °C, it can be seen that the heating capacity of HCs are obviously higher than other working fluids. The gaps between the maximum and the minimum are 4.7% and 4.3% in 100 and 110 °C, respectively, and decane, nonane, octane, and heptane have a better heating performance. In addition, the cooling performance does not change with the geothermal fluid temperature, therefore, the cooling performance will not be analyzed repeatedly in the following.
The total heat source recovery efficiency of HCs is also basically identical, and is significantly higher than that of others among the selected working fluids as the geothermal fluid temperatures are 100 and 110 °C. The total heat source recovery efficiency of HCs is closed to 66% and 69% in 100 and 110 °C, respectively. The top three total source recovery efficiencies are pentane, octane, heptane, etc. The maximum net power output of R1234yf is greater than the minimum decane, which is about 6.1%, 10.4% in 100 and 110 °C, respectively.
The maximum net power output of all working fluids is close to 200 kW in 100 °C, but the gap becomes increasingly large in the 110 °C. In addition, it can be drawn that decane, nonane, octane and heptane have the worst maximum net power output, and the top three are R1234yf, R134a and R1234ze.
Both the maximum net power output and COP are worse in decane, nonane, octane, and heptane, contributing to the worst minimum cooling capacity. Under the condition that the geothermal fluid temperature is 100 °C, the difference between the maximum net power output of each working fluid is not too far. Therefore, although R1234yf has the maximum net power output, the maximum cooling capacity is not the maximum due to the slightly lower COP. Furthermore, when the geothermal fluid temperature is 110 °C, the gap of the maximum net power output among working fluids gradually appears. At this time, the maximum cooling capacity of R1234yf with the maximum net power output is high. The results could be drawn that when geothermal fluid temperature is 100 °C, the working fluids with the maximum cooling capacity are butane, R152a and R1233zd, while the gap between the maximum and minimum is 33.24%. As the maximum geothermal fluid temperature is 110 °C, the working fluids with the maximum one are R152a, R1234yf and butane, while the gap between the maximum and minimum values is 32.10%.
The comparative performance of 17 working fluids are shown at the geothermal fluid temperature of 120 and 130 °C in Table 6. The difference between the maximum and minimum value are 20.99% and 24.70% in 120, 130 °C, respectively. Compared with 110 °C, the power exergy efficiency has an apparent growing difference, since the geothermal fluid temperature is 120 °C. Under the condition that the geothermal fluid temperatures are 120 and 130 °C, it can be concluded that the last four power exergy efficiency are decane, nonane, octane, and heptane, and the top three are R1234yf, propane and R134a, etc.
As the temperature of geothermal fluid is 120 and 130 °C, it can be seen that the heating capacity of HCs are apparently higher than other working fluids. The gap between the maximum and the minimum are 4.49% and 4.55% in 120 and 130 °C, respectively. Besides, the top four heating capacities are decane, nonane, octane, and heptane, which show a better heating performance compared with other working fluids.
The total heat source recovery efficiency of HCs has little difference, and is significantly higher than that of others among the selected working fluids when the geothermal fluid temperature is 120 and 130 °C. The total heat source recovery efficiency of HCs is closed to 72% and 74% in 120 and 130 °C, respectively, and the top three are pentane, octane, heptane, etc.
The maximum net power output of R1234yf is greater than the smallest decane, which is about 21.00%, 28.49% in 120 and 130 °C, respectively. Besides, it was obvious that decane, nonane, octane, heptane, etc, have the worst maximum net power output, and R1234yf and propane are far higher than other working fluids in 120 °C. Besides, R134a, propane, and R1234yf have a better maximum net power output in turn in 130 °C. Though the maximum net power output of R1234yf exceeds propane a little, owing to its lower COP, its maximum cooling capacity is slightly lower than propane. R134a has the better maximum cooling capacity in HFCs, but it is still 8.89% lower than the greatest propane. As a consequence, propane and R1234yf have a better maximum net power output.
Table 7 illustrates the comparison of performance among 17 working fluids when the geothermal fluid temperatures are 140 and 150 °C. The difference of exergy efficiency power generation between the maximum and the minimum value are 35.62%, 29.51% in 140, 150 °C, respectively.
R134a, propane, R1234ze and R1234ze, R152a, and R134a have a better power exergy efficiency under the condition that the temperature of geothermal fluids are 140, 150 °C, respectively.
When the temperature of geothermal fluids are 140 and 150 °C, the heating capacity of HCs are far higher than other working fluids. The gap between the maximum and the minimum are 7.69% and 4.3% in 140 and 150 °C, respectively. Consequently, the heating capacity of decane, nonane, octane, and heptane which have a better heating performance occupy the top four.
The total heat source recovery efficiency of HCs still has little difference, and is higher than that of others when the geothermal fluid temperature is 140 and 150 °C. The total heat source recovery efficiency of HCs are closed to 76% and 77% in 140 and 150 °C seperately, and the first three are pentane, octane and heptane, which reveal better efficiency of energy utilization.
The maximum net power output of R1234yf is greater than decane, with the smallest about 35.63%, 29.52% in 140 and 150 °C, respectively. Moreover, it can be concluded that decane, nonane, octane and heptane have the lowest maximum net power output. On the contrary, R134a, propane and R1234ze are top three in 140 °C, while R152a, R134a, and R1234ze have a better maximum net power output in 150 °C. The temperature of geothermal fluid is in the direct ratio, with the difference among the maximum net power output of working fluids, resulting in the working fluids of the maximum net power output being far greater than others. Thereby, the strongest cooling capacity of the working fluids corresponding to the working fluids with the maximum net power output are also the maximum. The maximum cooling capacity of R134a, propane, R1234ze, and R152a, R134a, and R1234ze occupied the first three places in 140 °C and 150 °C, separately.
Power exergy efficiency is positively correlated with the net power output, and is negatively correlated with the input exergy of the system. The input exergy depends on the state parameters of geothermal fluid at the inlet and outlet of evaporator 1, and the geothermal fluid temperature is proportional to the power exergy efficiency. Furthermore, the increment of the maximum net power output is higher than that of the input exergy, as a result of the increase of the geothermal fluid temperature.
Under the condition that geothermal fluid temperature is lower at 80, 90 °C, the power exergy efficiency of all working fluids are basically the same, about 10.8%, 13.8% separately. In addition, the gap of power exergy efficiency among working fluids will increase with the increment of the geothermal fluid temperature. As the geothermal fluid temperature is 110–150 °C, the increment of exergy efficiency of decane, nonane, octane and heptane in HCs are basically the same for every 10 °C increase in temperature, and are obviously lower than other working fluids. As the geothermal fluid temperature is 150 °C, the top three power exergy efficiencies are R1234ze, R152a and R134a, respectively, and the last three are R1234yf, decane and nonane, respectively. Overall, with the increment of the geothermal fluid temperature, the power and heating performance are getting better. The decane, nonane, octane, and heptane in HCs always have a worse power generation and cooling performance, but have a better heating performance. The total heat sources recovery efficiency of HCs are the largest. When the geothermal fluid temperature is low, R1234yf has a large maximum net power output, which has no obvious advantage from 140 °C, while R1234ze has a better maximum net power output from 140 °C. Propane has maintained a good maximum net power output at a low temperature, but it has shown a downward trend since 150 °C. Additionally, R134a starts from 130 °C and R152a starts from 150 °C, showing a larger maximum net power output compared with other working fluids.
The results could demonstrate that R1234yf has a better power generation performance when the geothermal fluid temperature is lower. However, when the temperature is up from 130 °C to 140 °C, the increasing extent of the net power output shows a downtrend, which decreases on the contrary when the geothermal fluid temperature is 150 °C. Due to the critical temperature of R1234yf being lower, when the geothermal fluid temperature is higher than the critical temperature and keeps on rising to a certain value, owing to transfer temperature difference increases, the heat absorption capacity of the working fluid augments, and the mass flow rate will scale up. As a result, the large amount of heat absorption capacity makes the temperature at the outlet of evaporator 1 smaller than the heating temperature. Since the heating demands cannot be met, this working condition is omitted, resulting in an increase in the evaporation temperature, and the net power output is reduced instead. Therefore, according to the actual situation, the value slightly lower than the critical temperature of the working fluid is selected as the evaporation temperature.

5.3. Comparison between CCHP System and Separated Output System

Table 8 demonstrates the power generation performance between the CCHP system and the separated power generation system of R245fa at the temperature of geothermal fluid from 90 °C to 150 °C. The separated power generation system, which has a single function, is a way in which geothermal energy is totally used to drive power generation. The schematic diagram is shown in Figure 1, and can be achieved by opening control valve 1, and closing control valves 2, 3, 4 and 5, etc. The separated power generation system has no need to supply heat, resulting in the lower condensation temperature compared to the CCHP system, and the condensation pressure also decreases. As the evaporation pressure remains unchanged, the expansion ratio will increase compared with the CCHP system. As the condensation temperature decreases, the energy used for power generation will increase, and the net power output will also increase accordingly. As the CCHP system needs heating capacity supply, the condensation temperature will be relatively high. As a result, the energy used for power generation decreases, and the net power output will also decrease accordingly. With the increment of geothermal fluid temperature, the power generation of the CCHP system is gradually increasing, and the gap between the CCHP system and the separated power generation system is reduced, from 33.37% of the geothermal fluid temperature of 90 °C to 15.06% of 150 °C. Although the power output of the CCHP system is lower than the separated power generation system, part of the waste heat is utilized, and the CCHP system has complete functions and can meet different energy demands of buildings.
Table 9 indicates the cooling performance between TSVCC of the CCHP system and the AR system. According to the literature [40], when the temperature of geothermal fluid is 95 °C, the outlet temperature of AR system is 85 °C, and the COP is 0.79. If the geothermal-driven CCHP system is adopted, the equivalent thermodynamic coefficient is 0.23, which is 29% of the thermodynamic coefficient of the AR system. The main reason is that the thermal efficiency of the ORC system is too low, and the thermal efficiency of power generation is 4.39% when the temperature of geothermal fluid is 95 °C. The heat exchange capacity in the generator is 1648 kW, and the cooling capacity is 1301.92 kW of the AR system, while the maximum cooling capacity is 1191.39 kW when the TSVCC system is adopted. Although the cooling capacity of the TSVCC system is less than the AR system, it has two levels of evaporation temperature, which can achieve independent control of a sensible load and latent load. This not only improves indoor air quality, but also makes a sensible load originally treated with low temperature water now treated with high temperature water, which improves energy utilization. Additionally, the CCHP system can also meet the power and hot water demand inside the building.

6. Conclusions

In this paper, an organic Rankine cycle powered by a two-stage vapor compression cycle, and a combined cooling, heating, and power system was proposed. Moreover, the system performances are analyzed through the parameters optimization, and the proper working fluids are selected corresponding to each geothermal fluid temperature for cogeneration or a separated system. The main conclusions of this paper are summarized as follows:
(1)
The net power output has a local maximum where it corresponds to the optimal evaporation temperature, which increases by about 5 °C when the geothermal fluid temperature increases by 10 °C, and the increase of geothermal fluid temperature can improve the system performance.
(2)
There is a critical value for the geothermal fluid temperature, and the thermal conductance of working fluids greater than that are proportional to the evaporation temperature, while others less than that are inversely proportional to the evaporation temperature. Besides, the lower the critical temperature, the greater the thermal conductance. The pressure ratio is in reverse ratio to the evaporation temperature, which can be increased to augment the pressure drop of the expander, contributing to the higher net power output.
(3)
The most suitable working fluids for each geothermal fluid temperature divided are demonstrated, which can be selected according to the geothermal fluid temperature and the demand of energy forms in the building. When power supply performance matters, R134a always has a better maximum net power output. R1234yf and propane are excellent when the geothermal fluid temperature is low, and R1234ze and R152a are better since the geothermal fluid temperatures are 140 °C and 150 °C, respectively.
(4)
When the cooling supply performance matters, R134a always has a better maximum cooling capacity. Propane and R1234yf are in good cooling capacity until the geothermal fluid temperature are 140 °C and 120 °C, separately. R1234ze and R152a are better when the geothermal fluid temperatures are 140 °C and 150 °C, respectively.
(5)
When heating supply performance matters, hydrocarbons can be selected, which are all higher in total heat source recovery efficiency as well. The decane, nonane, octane and heptane of hydrocarbons only have good heating performance, resulting in better total heat source recovery efficiency.
(6)
The net power output and cooling capacity generated by the separated system are both more than a cogeneration system, but which can realize a cascade utilization of energy and the simultaneous supply of multiple energies. The gap between the separated power generation system and the cogeneration system decreased with the increment of the geothermal fluid temperature.

Author Contributions

Conceptualization, T.L.; methodology, T.L.; software, J.W.; validation, J.W., Y.Z., R.G. and X.G.; formal analysis, J.W. and Y.Z.; investigation, J.W.; resources, T.L.; data curation, J.W.; writing—original draft preparation, J.W.; writing—review and editing, T.L., J.W. and R.G.; visualization, J.W.; supervision, T.L.; project administration, T.L. All authors have read and agreed to the published version of the manuscript.

Funding

The authors gratefully acknowledge the support provided by the National Natural Science Foundation of China (Grant No. 52176183).

Data Availability Statement

The data presented in this study are available upon request from the corresponding author.

Conflicts of Interest

The authors declare no conflict of interest.

Abbreviations

NomenclatureambAmbient
1–14State points
cSpecific heat (kJ/kg)Acronyms
hSpecific enthalpy (kJ/kg)
mMass flow rate (kg/s)COPCoefficient of performance
PPressure (KPa)GWPGlobal warming potential
QHeat transfer rate (kW)VCCVapor compression cycle
sSpecific entropy (kJ/(kg℃))ORC-TSVCCOrganic Rankine cycle coupled with two-stage vapor compression cycle
TTemperature (K)TSVCCTwo-stage vapor compression cycle
tTemperature (℃)CCHPCombined cooling, heating, and power
WPower (kW)CHPCombined heating and power
Greek lettersCCPCombined cooling and power
HCsHydrocarbons
ηEfficiency (%)HFOsHydrofluoroolefins
SubscriptsHFCsHydrofluorocarbons
HCFCsHydrochlorofluorocarbons
conCondenserCVControl valve
cwCooling waterTVThrottling valve
evaEvaporatorRHWReturning hot water
PPumpSHWSupplying hot water
comCompressorHSSWHeat source supplying hot water
tturbineHSRWHeat source returning hot water
gwGeothermal waterHRCWHigh-temperature returning chilled water
wfWorking fluidHSCWHigh-temperature supplying chilled water
exExergeticLRCWLow-temperature returning chilled water
inInlet of each componentLSCWLow-temperature supplying chilled water
outOutlet of each componentPRPressure ratio
thThermalARAbsorption refrigeration

References

  1. Manzano-Agugliaro, F.; Sanchez-Muros, M.J.; Barroso, F.G.; Martínez-Sánchez, A.; Rojo, S.; Pérez-Bañón, C. Insects for Biodiesel Production. Renew. Sustain. Energy Rev. 2012, 16, 3744–3753. [Google Scholar] [CrossRef]
  2. Guan, Z.; Zhao, P.; Wang, J.; Sun, Q.; Guo, Y.; Lou, J.; Chen, L.; Liu, B.; Li, H. Dynamic Performance and Control Strategy of a Combined Heat and Power System Driven by Geothermal Energy Considering the Building Multi-Load Requirements. Energy Convers. Manag. 2022, 270, 116189. [Google Scholar] [CrossRef]
  3. Mott, A.; Baba, A.; Hadi Mosleh, M.; Ökten, H.E.; Babaei, M.; Gören, A.Y.; Feng, C.; Recepoğlu, Y.K.; Uzelli, T.; Uytun, H.; et al. Boron in Geothermal Energy: Sources, Environmental Impacts, and Management in Geothermal Fluid. Renew. Sustain. Energy Rev. 2022, 167, 112825. [Google Scholar] [CrossRef]
  4. Pan, S.-Y.; Gao, M.; Shah, K.J.; Zheng, J.; Pei, S.-L.; Chiang, P.-C. Establishment of Enhanced Geothermal Energy Utilization Plans: Barriers and Strategies. Renew. Energy 2019, 132, 19–32. [Google Scholar] [CrossRef]
  5. Franco, A.; Vaccaro, M. An Integrated “Reservoir-Plant” Strategy for a Sustainable and Efficient Use of Geothermal Resources. Energy 2012, 37, 299–310. [Google Scholar] [CrossRef]
  6. Meng, N.; Li, T.; Wang, J.; Jia, Y.; Liu, Q.; Qin, H. Synergetic Cascade-Evaporation Mechanism of a Novel Building Distributed Energy Supply System with Cogeneration and Temperature and Humidity Independent Control Characteristics. Energy Convers. Manag. 2020, 209, 112620. [Google Scholar] [CrossRef]
  7. Zhao, R.; Zhang, H.; Song, S.; Yang, F.; Hou, X.; Yang, Y. Global Optimization of the Diesel Engine–Organic Rankine Cycle (ORC) Combined System Based on Particle Swarm Optimizer (PSO). Energy Convers. Manag. 2018, 174, 248–259. [Google Scholar] [CrossRef]
  8. Van Erdeweghe, S.; Van Bael, J.; D’haeseleer, W. Optimal Configuration, Design and Control of a Binary Geothermal Combined Heat-and-Power Plant. Energy Convers. Manag. 2019, 198, 111854. [Google Scholar] [CrossRef]
  9. Gu, W.; Wu, Z.; Bo, R.; Liu, W.; Zhou, G.; Chen, W.; Wu, Z. Modeling, Planning and Optimal Energy Management of Combined Cooling, Heating and Power Microgrid: A Review. Int. J. Electr. Power Energy Syst. 2014, 54, 26–37. [Google Scholar] [CrossRef]
  10. Huang, Z.F.; Soh, K.Y.; Islam, M.R.; Chua, K.J. Digital Twin Driven Life-Cycle Operation Optimization for Combined Cooling Heating and Power-Cold Energy Recovery (CCHP-CER) System. Appl. Energy 2022, 324, 119774. [Google Scholar] [CrossRef]
  11. Jia, J.; Chen, H.; Liu, H.; Ai, T.; Li, H. Thermodynamic Performance Analyses for CCHP System Coupled with Organic Rankine Cycle and Solar Thermal Utilization under a Novel Operation Strategy. Energy Convers. Manag. 2021, 239, 114212. [Google Scholar] [CrossRef]
  12. Zhao, H.; Li, B.; Lu, H.; Wang, X.; Li, H.; Guo, S.; Xue, W.; Wang, Y. Economy-Environment-Energy Performance Evaluation of CCHP Microgrid System: A Hybrid Multi-Criteria Decision-Making Method. Energy 2022, 240, 122830. [Google Scholar] [CrossRef]
  13. Wang, X.; Xu, Y.; Fu, Z.; Guo, J.; Bao, Z.; Li, W.; Zhu, Y. A Dynamic Interactive Optimization Model of CCHP System Involving Demand-Side and Supply-Side Impacts of Climate Change. Part II: Application to a Hospital in Shanghai, China. Energy Convers. Manag. 2022, 252, 115139. [Google Scholar] [CrossRef]
  14. Zhao, J.; Cai, S.; Huang, X.; Luo, X.; Tu, Z. 4E Analysis and Multiobjective Optimization of a PEMFC-Based CCHP System with Dehumidification. Energy Convers. Manag. 2021, 248, 114789. [Google Scholar] [CrossRef]
  15. Kazemian, M.E.; Gandjalikhan Nassab, S.A.; Jahanshahi Javaran, E. Comparative Techno-Economic Investigation of CCHP Combined by GSHP Based on Response Surface Methodology. Therm. Sci. Eng. Prog. 2022, 34, 101386. [Google Scholar] [CrossRef]
  16. Lee, M.; Kim, J.; Shin, H.H.; Cho, W.; Kim, Y. CO2 Emissions and Energy Performance Analysis of Ground-Source and Solar-Assisted Ground-Source Heat Pumps Using Low-GWP Refrigerants. Energy 2022, 261, 125198. [Google Scholar] [CrossRef]
  17. Liu, X.; Patra, I.; Kuzichkin, O.R.; Zaidi, M.; Abdulnabi, S.M.; Mohsen Najm, Z.; Altimari, U.S.; Hadrawi, S.K.; Taheri Andani, M.; Hekmatifar, M. Molecular Dynamics Study of the Effect of External Electric Field Amplitude and Cavity on Thermal Properties of Ammonia/Copper Nano-Refrigerant. J. Mol. Liq. 2022, 365, 120125. [Google Scholar] [CrossRef]
  18. Vering, C.; Kroppa, H.; Venzik, V.; Streblow, R.; Müller, D. Towards an Integral Decision-Making Process Applied to the Refrigerant Selection in Heat Pumps. Renew. Energy 2022, 192, 815–827. [Google Scholar] [CrossRef]
  19. Ustaoglu, A.; Kursuncu, B.; Metin Kaya, A.; Caliskan, H. Analysis of Vapor Compression Refrigeration Cycle Using Advanced Exergetic Approach with Taguchi and ANOVA Optimization and Refrigerant Selection with Enviroeconomic Concerns by TOPSIS Analysis. Sustain. Energy Technol. Assess. 2022, 52, 102182. [Google Scholar] [CrossRef]
  20. Sun, Z.; Quan, J.; Wang, Y.; Li, R.; Peng, J.; Zhang, H.; Xu, J.; Sun, H.; Tian, S.; Dong, S.; et al. Performance Comparison of the Single-Refrigerant Cascade Refrigerating System. Energy Rep. 2022, 8, 8259–8270. [Google Scholar] [CrossRef]
  21. Malwe, P.D.; Shaikh, J.; Gawali, B.S. Exergy Assessment of a Multistage Multi-Evaporator Vapor Compression Refrigeration System Using Eighteen Refrigerants. Energy Rep. 2022, 8, 153–162. [Google Scholar] [CrossRef]
  22. Kang, G.H.; Na, S.-I.; Kim, M.S. Reasonable Performance Comparison for a Refrigeration System Using Different Refrigerants: Case with Propane and Isobutane Mixtures with Several Compositions. Int. J. Refrig. 2022, 135, 41–50. [Google Scholar] [CrossRef]
  23. Sulaiman, A.Y.; Cotter, D.F.; Le, K.X.; Huang, M.J.; Hewitt, N.J. Thermodynamic Analysis of Subcritical High-Temperature Heat Pump Using Low GWP Refrigerants: A Theoretical Evaluation. Energy Convers. Manag. 2022, 268, 116034. [Google Scholar] [CrossRef]
  24. He, Y.; Wu, H.; Liu, Y.; Wang, T.; Wu, X.; Cheng, C.; Jin, T. Theoretical Performance Comparison for Two-Stage Auto-Cascade Refrigeration System Using Hydrocarbon Refrigerants. Int. J. Refrig. 2022, 142, 27–36. [Google Scholar] [CrossRef]
  25. Zarei, A.; Elahi, S.; Pahangeh, H. Design and Analysis of a Novel Solar Compression-Ejector Cooling System with Eco-Friendly Refrigerants Using Hybrid Photovoltaic Thermal (PVT) Collector. Therm. Sci. Eng. Prog. 2022, 32, 101311. [Google Scholar] [CrossRef]
  26. Suresh, R.; Datta, S.P. Drop-in Replacement of Conventional Automotive Refrigeration System to Hybrid-Ejector System with Environment-Friendly Refrigerants. Energy Convers. Manag. 2022, 266, 115819. [Google Scholar] [CrossRef]
  27. Walid Faruque, M.; Hafiz Nabil, M.; Raihan Uddin, M.; Monjurul Ehsan, M.; Salehin, S. Thermodynamic Assessment of a Triple Cascade Refrigeration System Utilizing Hydrocarbon Refrigerants for Ultra-Low Temperature Applications. Energy Convers. Manag. X 2022, 14, 100207. [Google Scholar] [CrossRef]
  28. Yu, W.; Liu, C.; Li, Q.; Xin, L.; Wang, S. Resource Utilization of Waste HFC-134a Refrigerant by Supercritical Gasification Method: A Reactive Molecular Dynamic Study. Process Saf. Environ. Prot. 2022, 168, 399–409. [Google Scholar] [CrossRef]
  29. Pabon, J.J.G.; Khosravi, A.; Belman-Flores, J.M.; Machado, L.; Revellin, R. Applications of Refrigerant R1234yf in Heating, Air Conditioning and Refrigeration Systems: A Decade of Researches. Int. J. Refrig. 2020, 118, 104–113. [Google Scholar] [CrossRef]
  30. Granryd, E. Hydrocarbons as Refrigerants Ð an Overview. Int. J. Refrig. 2001, 24, 15–24. [Google Scholar] [CrossRef]
  31. Abas, N.; Kalair, A.R.; Khan, N.; Haider, A.; Saleem, Z.; Saleem, M.S. Natural and Synthetic Refrigerants, Global Warming: A Review. Renew. Sustain. Energy Rev. 2018, 90, 557–569. [Google Scholar] [CrossRef]
  32. Kasaeian, A.; Hosseini, S.M.; Sheikhpour, M.; Mahian, O.; Yan, W.-M.; Wongwises, S. Applications of Eco-Friendly Refrigerants and Nanorefrigerants: A Review. Renew. Sustain. Energy Rev. 2018, 96, 91–99. [Google Scholar] [CrossRef]
  33. Dawo, F.; Fleischmann, J.; Kaufmann, F.; Schifflechner, C.; Eyerer, S.; Wieland, C.; Spliethoff, H. R1224yd(Z), R1233zd(E) and R1336mzz(Z) as Replacements for R245fa: Experimental Performance, Interaction with Lubricants and Environmental Impact. Appl. Energy 2021, 288, 116661. [Google Scholar] [CrossRef]
  34. Cao, J.; Feng, X.; Ji, X.Y. Review of studies on organic Rankine cycle with zeotropic mixtures. Therm. Power Gener. 2022, 51, 44–51. [Google Scholar] [CrossRef]
  35. Calm, J.M.; Hourahan, G.C. Refrigerant data update. HPAC Eng. 2007, 79, 50–64. [Google Scholar]
  36. Toffolo, A.; Lazzaretto, A.; Manente, G.; Paci, M. A Multi-Criteria Approach for the Optimal Selection of Working Fluid and Design Parameters in Organic Rankine Cycle Systems. Appl. Energy 2014, 121, 219–232. [Google Scholar] [CrossRef]
  37. Sarkar, J.; Bhattacharyya, S. Potential of Organic Rankine Cycle Technology in India: Working Fluid Selection and Feasibility Study. Energy 2015, 90, 1618–1625. [Google Scholar] [CrossRef]
  38. Zhao, Y.; Wang, J. Exergoeconomic Analysis and Optimization of a Flash-Binary Geothermal Power System. Appl. Energy 2016, 179, 159–170. [Google Scholar] [CrossRef]
  39. Li, T.; Zhu, J.; Zhang, W. Cascade Utilization of Low Temperature Geothermal Water in Oilfield Combined Power Generation, Gathering Heat Tracing and Oil Recovery. Appl. Therm. Eng. 2012, 40, 27–35. [Google Scholar] [CrossRef]
  40. Ma, H.; Li, Q.; Wang, D.; Song, Q.; Zhou, S.; Wang, X.; Li, Y. Operating Performance and Economic Analysis of Solar Single/Double-Effect Compound Absorption Refrigeration System. Sol. Energy 2022, 247, 73–85. [Google Scholar] [CrossRef]
Figure 1. Schematic diagram of the ORC-TSVCC system.
Energies 16 01558 g001
Figure 2. T-s diagram of the ORC-TSVCC system.
Energies 16 01558 g002
Figure 3. Effect of geothermal fluid temperature and evaporation temperature of evaporator 1 on net power output of turbine.
Energies 16 01558 g003
Figure 4. Thermal conductance for the geothermal fluid temperature of 140 °C.
Energies 16 01558 g004
Figure 5. Pressure ratio for the geothermal fluid temperature of 140 °C.
Energies 16 01558 g005
Table 1. Properties of selected working fluids.
SubstanceTypeRelative Molecular MassCritical Temperature
(°C)
Critical Pressure
(MPa)
ODPGWPDry/WetSafetyRef
R1233zdHFOs130.5166.53.6201DryA1[33]
R1234ze114.04109.363.6406DryA2L[34]
R1234yf114.0494.703.3804DryA2L[34]
butaneHCs58.12151.983.8004DryA3[34]
isobutane58.12134.663.6304DryA3[34]
pentane72.15196.553.37020DryA3[34]
isopentane72.15187.203.3800–20DryA3[35]
propane44.1096.684.2503DryA3[34]
decane142.28344.552.1030WetA3Refprop
nonane128.26321.402.2810WetA3Refprop
octane114.23296.172.4970WetA3Refprop
heptane100.20266.982.7360WetA3Refprop
R134aHFCs102.03101.064.0601430WetA1Refprop
R152a66.05113.264.520133WetA2[35]
R245fa134.05154.053.6401050DryB1[34]
R245ca134.05174.423.9301340DryB1[34]
R365mfc148.07186.853.270890DryA1[34]
Table 2. Validation results compared with previously published data.
Substancetgw,in (°C)tgw,out (°C)mgw
(kg/s)
tcw,in (°C)tcw,out (°C)mcw
(kg/s)
Wnet
(kW)
ηth
(%)
ηex
(%)
Source
R123110.987.469.442838162.52703.9619.64[39]
R123110.987.469.442838162.52764.0220.13present
Table 3. Parameters varying with evaporation temperature.
teva1 (°C)mwf (kg/s)Δh (kJ/kg)Peva1 (kPa)Pcon (kPa)PR
5557.082.36462.59344.170.74
6053.354.65532.27344.170.65
6549.506.88609.60344.170.56
7045.529.06695.10344.170.50
7541.3911.17789.31344.170.44
8037.1113.23892.78344.170.39
8532.6415.231006.09344.170.34
9027.9617.181129.81344.170.30
9523.0519.071264.57344.170.27
10017.8620.911411.00344.170.24
10512.3322.681569.80344.170.22
1106.4124.401741.69344.170.20
Table 4. Performance comparison of working fluids at temperature of geothermal fluid is 90 °C.
Substanceηex,ORC
(%)
COPηex,TSVCC
(%)
Qcooling
(kW)
WCOM
(kW)
Qheating
(MW)
ηth,CCHP
(%)
Wnet,max
(kW)
Qcooling,max
(MW)
R1234yf11.005.0017.55214.8942.988.5058.32121.540.61
R1234ze10.905.2018.27257.3649.548.5558.89120.400.63
R1233zd10.805.4019.01312.0057.808.6259.62119.320.64
butane10.765.4419.14579.84106.638.9363.17118.880.65
isobutane10.775.3618.85517.3796.498.8662.34118.970.64
pentane10.755.3918.95592.00109.888.9563.33118.750.64
isopentane10.755.4018.96552.79102.468.9062.81118.730.64
propane10.735.1818.28527.94101.878.8862.47118.560.61
decane10.703.7913.32584.87154.358.9963.25118.140.45
nonane10.704.2815.03587.32137.318.9863.28118.190.51
octane10.714.6716.40590.58126.598.9763.31118.260.55
heptane10.704.9817.51591.27118.698.9663.32118.400.59
R134a10.915.2118.39280.7753.868.5859.20120.480.63
R152a10.805.4119.15465.8486.068.8061.65118.760.64
R245fa10.855.3018.67304.7657.478.6159.52119.820.64
R245ca10.825.3018.64328.5462.018.6459.84119.490.63
R365mfc10.805.2118.29307.0858.948.6159.55119.170.62
Table 5. Performance comparison of working fluids at temperature of geothermal fluid is 100 and 110 °C.
100 °C110 °C
Substanceηex,ORC
(%)
Qheating
(MW)
ηth,CCHP
(%)
Wnet,max
(kW)
Qcooling,max
(MW)
ηex,ORC
(%)
Qheating
(MW)
ηth,CCHP
(%)
Wnet,max
(kW)
Qcooling,max
(MW)
R1234yf14.4710.0862.41209.671.0518.0011.6365.71329.511.65
R1234ze14.1210.1462.92204.521.0617.1711.6966.19314.181.63
R1233zd13.7910.2163.59199.821.0816.4711.7766.80301.461.63
butane13.7710.5266.78199.471.0816.4812.0969.70301.631.64
isobutane13.8310.4566.03200.341.0716.6312.0169.02304.261.63
pentane13.7010.5466.93198.511.0716.3312.1169.84298.881.61
isopentane13.7110.4966.46198.641.0716.3612.0669.42299.351.62
propane14.0010.4666.14202.831.0517.2312.0169.10315.381.63
decane13.5810.5866.86196.830.7516.1412.1569.77295.301.12
nonane13.5910.5766.88196.960.8416.1512.1469.80295.561.26
octane13.6110.5666.92197.180.9216.1712.1369.83295.981.38
heptane13.6310.5566.92197.490.9816.2112.1269.84296.601.48
R134a14.1710.1663.2205.331.0717.3311.7266.43317.201.65
R152a13.8110.3965.41200.061.0816.6411.9568.45304.471.65
R245fa13.8810.2063.5201.111.0716.6211.7666.72304.221.61
R245ca13.8110.2363.79200.121.0616.5011.7966.98301.921.60
R365mfc13.7710.2063.53199.481.0416.4311.7766.75300.761.57
Table 6. Performance comparison of working fluids at temperature of geothermal fluid is 120 and 130 °C.
120 °C130 °C
Substanceηex,ORC
(%)
Qheating
(MW)
ηth,CCHP
(%)
Wnet,max
(kW)
Qcooling,max
(MW)
ηex,ORC
(%)
Qheating
(MW)
ηth,CCHP
(%)
Wnet,max
(kW)
Qcooling,max
(MW)
R1234yf23.3013.0868.38523.552.6227.1714.5370.64689.983.45
R1234ze20.1713.2268.87453.002.3523.6514.6971.07638.133.32
R1233zd18.9113.3269.45424.952.2921.1714.8371.65571.193.08
butane18.9813.6372.10426.372.3221.3115.1474.09575.003.13
isobutane19.2413.5571.47432.312.3221.7415.0673.50586.683.15
pentane18.7113.6572.23420.332.2620.8815.1874.22563.423.04
isopentane18.7613.6171.84421.412.2720.9615.1373.86565.513.05
propane22.9013.4671.46514.562.6728.6114.8573.44771.834.00
decane18.4113.7072.17413.631.5720.4615.2374.17551.962.09
nonane18.4313.6872.19414.081.7720.4815.2174.19552.682.36
octane18.4613.6872.23414.821.9420.5315.2074.22553.872.58
heptane18.5113.6772.23415.932.0720.6015.1974.22555.732.77
R134a20.7513.2369.07466.142.4329.2214.5471.19788.334.11
R152a19.3413.4870.95434.572.3522.0314.9873.01594.513.22
R245fa19.1413.3069.37430.122.2821.5014.8271.58580.103.08
R245ca18.9413.3469.61425.552.2521.1914.8571.80571.843.03
R365mfc18.8513.3169.40423.572.2121.0714.8371.61568.592.96
Table 7. Performance comparison of working fluids at temperature of geothermal fluid is 140 and 150 °C.
140 °C150 °C
Substanceηex,ORC
(%)
Qheating
(MW)
ηth,CCHP
(%)
Wnet,max
(kW)
Qcooling,max
(MW)
ηex,ORC
(%)
Qheating
(MW)
ηth,CCHP
(%)
Wnet,max
(kW)
Qcooling,max
(MW)
R1234yf25.8216.1272.61778.893.8919.8317.9074.38690.873.45
R1234ze29.7316.0272.87946.264.9234.0917.3574.431261.686.55
R1233zd23.2916.3273.49741.354.0025.3217.7975.05936.885.06
butane23.5416.6375.75749.214.0725.7018.0877.15951.245.17
isobutane24.2016.5375.20770.354.1326.9017.9676.61995.485.34
pentane22.9016.6775.88728.903.9324.7918.1477.28917.624.94
isopentane23.0116.6275.54732.513.9524.9518.0976.96923.46 4.98
propane32.3316.2575.121029.115.3325.1318.0476.72929.964.82
decane22.3217.2075.84710.432.6924.0318.2177.25889.253.37
nonane22.3516.7275.86711.543.0424.0718.2077.26890.883.81
octane22.4116.7175.88713.383.3324.1518.1977.29893.604.17
heptane22.5016.7075.89716.293.5724.2618.1777.29897.994.47
R134a34.6715.8873.011103.665.7531.0517.5174.681149.235.99
R152a26.7716.3774.68852.254.6132.2417.6676.081193.156.46
R245fa23.7516.3073.42755.834.0125.9217.7574.98959.455.09
R245ca23.3116.3573.64741.833.9325.3117.8175.18936.814.96
R365mfc23.1416.3373.46736.693.8425.1017.7975.02928.874.84
Table 8. Power generation comparison between CCHP and ORC system.
tgw (°C)Wnet,CCHP (kW)Wnet,ORC (kW)Wnet,CCHP/Wnet,ORC (%)Relative Difference (%)
90119.82179.8366.6333.37
100201.11277.6272.4427.56
110304.22397.8276.4723.53
120430.12541.4179.4420.56
130580.10709.6581.7418.26
140755.83904.1383.60 16.40
150959.451129.5884.9415.06
Table 9. Cooling performance comparison between CCHP and AR system.
ParametersAR SystemVCC SystemVCC/AR (%)
Qcooling,max (kW)1301.921191.3991.51
Overall COP0.790.2329.11
Disclaimer/Publisher’s Note: The statements, opinions and data contained in all publications are solely those of the individual author(s) and contributor(s) and not of MDPI and/or the editor(s). MDPI and/or the editor(s) disclaim responsibility for any injury to people or property resulting from any ideas, methods, instructions or products referred to in the content.

