1. Introduction
Following a slight decline in 2020 due to the COVID–19 pandemic, the global electricity demand increased by 6% in 2021, signalling the recovery of the worldwide economy. The demand for 2022 remains pessimistic and is expected to grow by only 2.4% due to higher energy prices spurred by the Ukrainian crisis (IEA, 2022). The recent trends indicate that the continued growth in demand would be further supported by renewable resource-based power generation with more than 10% additional capacity (IEA, 2022). The statistics for the global energy mix for the period between 2010 and 2020 indicate that there is a gradual decline of fossil fuels’ share by 4% in the electricity mix with a greater rate of penetration of 6% by low-carbon and renewable power generation, including hydropower, wind, photovoltaics, and nuclear energy. By 2030, it is anticipated that low-carbon generation technologies will supply nearly 40% of the global electricity mix (IEA, 2020a). Thus, the additional installed capacity using low-carbon technologies is expected to mitigate the negative environmental impacts caused by global warming.
Most nations have ratified the Paris Agreement with specific targets for greenhouse gas (GHG) emission reductions. By 2030, the EU plans to curb carbon emissions by at least 55% of the 1990 levels [
1]. Consequently, low-carbon pathways were developed to migrate vital economic sectors from carbon-intensive to low-carbon production/consumption. In Germany, for example, the roadmap included the migration from coal, natural gas, and nuclear to renewable energy sources of the electricity production sector. Germany’s new renewables share in the electricity mix for 2030 is 65%, with a target to achieve 80% renewables by 2050 [
2].
Similar to the rising electricity demand, the global freshwater market is estimated to increase by 20% to 30% from current levels by 2050 [
3]. In addition to population growth, the main driver for rising water demand is the expanding commercial and industrial activities, including agriculture. Due to the lack of natural freshwater resources worldwide, especially in the hot and arid Arabian Gulf region, seawater desalination was necessary to supply and secure vital freshwater resources. Several desalination technologies for large-scale applications contribute towards the global share: 31% by multi-stage flash (MSF), 59% by seawater reverse-osmosis (SWRO), and 10% by multiple-effect distillation (MED) [
4]. Meanwhile, it is worth noting that nearly half of the global seawater desalination capacity is located in the Middle East and North Africa (MENA) regions [
5].
The integration of power and desalination for cogeneration is widespread in the Arabian Gulf. It offers technical advantages and cost-saving opportunities by exploiting the technological synergies at the systems level. For example, in the case of a combined-cycle gas turbine (CCGT) power plant integrated with an MSF plant, the waste heat from the turbine is used to generate steam, which is used as a thermal energy heat source for the MSF distillation process. In addition, in SWRO, regardless of the power generation technology used, electricity production is augmented by re-utilising the high-pressure waste brine stream. Furthermore, the co-location of facilities plays a vital role since seawater, for example, is used both as a feed stream for the desalination process and a cooling stream for the power plant [
6,
7,
8].
The cogeneration systems based on natural gas-fired power generation offer synergistic design flexibility that fundamentally exploits the opportunity to improve heat energy and water use efficiencies. These systems simultaneously cater to the demand of both the energy and water sectors, thus having more significant value in terms of return on investment (ROI) over the project’s lifetime. However, cogeneration systems pose greater financial risk considering investments in new developments, particularly in deregulated markets where the forecasted demand is not always realised, and prices of inputs (e.g., cost of fuel and operational costs) and commodities become volatile. This has an implication for projects to have greater exposure to multiple price risk factors, making financial planning tools for project valuation, such as net present value (NPV) and conditional value-at-risk (CVaR), insufficient. This is primarily because they do not account for the possible flexibility in investment timing and possible recourse actions, such as deferring investment, expanding production capacities, or shutting down uneconomic projects, considering the dynamic macroeconomic landscape in which they operate.
In this study, the composite price risk related to cogeneration was modelled to conduct scenario-based valuation and assessment for future investments in infrastructure developments under market uncertainty. The outcomes of this study can support stakeholders by enabling them to make robust decisions for hedging against irreversible losses associated with investments under unfavourable conditions.
Section 2 presents the literature review and research gaps identified in the state-of-the-art model. The development of the proposed multidimensional risk-based investment valuation methodology using real options analysis (ROA) approach is presented in
Section 3. The methodology was implemented to evaluate five scenarios consisting of conventional and renewable technologies that are viable for the Arabian Gulf region.
Section 4 and
Section 5 present a case study to assess the expansion of existing cogeneration projects for the state of Qatar.
2. Literature Review
Future uncertainty plays a significant role in defining the critical risk factors for developing power and freshwater cogeneration systems. Recent studies identified several essential factors for addressing the uncertainty in the energy markets, especially their impact on the decision-making process for power infrastructure investments. One of the critical risk factors that were investigated comprehensively is fossil-fuel market price fluctuations. Fossil-fuel prices move up and down in response to worldwide market supply and demand, and experience sudden jumps in reaction to unforeseen global events. Recently, carbon markets were introduced worldwide, and through legislation, the carbon market price is becoming a key component when considering future developments in the sector. The electricity price is the primary source of the cash flow influx to the facility and is regarded as a significant factor for assessing a project’s feasibility. Spark spread, defined as the difference between electricity and fuel prices, is also widely used as a substantial risk factor. Other risk factors include investment and operating costs represented by the levelised cost of energy (LCOE) and power demand fluctuations. Risk factors can be political, technological, economic, and legal [
9].
Traditional project valuation methods do not include the value of the operational flexibility of the project [
10]. Hence, real options valuation began gaining popularity in the decision-making process for hybrid technology portfolios that include renewable energy sources. A binomial lattice model for the real options valuation of four integrated power and freshwater cogeneration configurations with uncertain electricity market prices was examined by Al-Obaidli et al. [
11]. The option-to-prototype, which is critical for assessing newly developed technologies, was reviewed by Lai and Locatelli [
12]. The value of flexibility for delaying PV technology deployment until economic conditions become more favourable was evaluated by Pringles et al. [
13]. A real options model for waste-to-energy implementation in the Philippines was created by Agaton et al. [
14]. A decision-making framework for the real options valuation of long-term electricity market capacity additions was developed by Rios et al. [
15]. The value of flexible operations for a CCGT power plant in Germany using real options methodology was investigated by Glensk and Madlener [
16]. The evaluation of real options under changing market volatility conditions was conducted by Čulík [
17].
Staged development and deployment of unconventional energy technologies (UET) using the real options approach in comparison to the immediate deployment of existing renewable energy technologies was evaluated by Siddique and Fleten [
18]. The firm may expand capacity using existing renewable energy technology at a constant operating cost or UET where operating cost is uncertain. The long-term electricity price and UET operating cost were modelled using geometric Brownian motion (GBM) and were assumed uncorrelated. The decision approach for the UET deployment was now or never. Three cases were developed and evaluated numerically: (1) staged deployment of UET with no existing renewable technology option, (2) existing renewable technology without switching option to UET, and (3) existing renewable technology with switching option to UET. The study found the option to deploy UET brings considerable value. Alternatively, existing renewable energy technologies increase the firm’s value but delay the potential initiation of UET options.
The Black–Scholes real options methodology to evaluate natural gas and renewable energy projects for power and heat production in New York and Texas was employed by Pless et al. [
19]. Four different configurations were identified: business-as-usual (BAU), where both electric and heat energies are purchased from a local supplier; natural gas—combined heat and power (CHP)—only; renewable energy PV only, where heat energy and extra electric energy to meet demand are also purchased, and natural gas and renewable energy hybrids. The case study consisted of two business applications: residential and commercial, and two electricity rates were considered: standard and time-of-use (TOU). Natural gas price was identified as a risk variable and was modelled using a geometric Ornstein–Uhlenbeck stochastic process. The study identified, in general, that natural gas and renewable energy hybrids were more favourable investments than the other non-hybrid configurations, even without including renewable energy government incentives.
Real options methodology to retrofit CCS technology to existing natural gas-fired power plants was deployed by Elias et al. [
20]. The plants operated in a deregulated electricity market where both natural gas and electricity prices were uncertain. A mean-reverting geometric Brownian motion (GBM) pricing model was used for the two risk factors since commodity prices generally follow a mean-reverting process. A two-dimensional binomial lattice model was used for the real options valuation, and market evolution was assumed to be 30% volatile. Separate models were used for the carbon and electricity prices, and two different CCS technologies were modelled and compared: post-combustion and oxyfuel combustion. It was found that post-combustion CCS retrofitting became feasible only when carbon prices hit 140 USD/tCO
2 and that the oxyfuel combustion CCS variant became feasible at a carbon price of 185 USD/tCO
2.
A model for investment decisions to transition from fossil fuels to renewable energy was developed by Zhang et al. [
21]. The study aimed to identify the optimal transition investment time from a coal-based power plant into a PV solar farm. Several factors were considered uncertain and were all modelled as GBM, such as electricity, coal, and CO
2 prices, in addition to PV investment unit cost. Real options methodology was used to identify the optimal investment time under two scenarios with and without a carbon emissions trading scheme. The results show insignificant changes to the project’s value and optimal transition time under the two scenarios. However, the difference is visible at various price and cost volatility levels.
A case study for solar PV energy project valuation with public authority incentives using real options was conducted by Di Bari [
22]. The expanded net present value (ENPV) for the different regional areas in Italy was evaluated using the binomial lattice model. Although several uncertain factors such as meteorological, economic, and political were identified, the methodology lacked concrete modelling steps for these factors, and hence the valuation results were deterministic. The project feasibility is highly dependent on the location and its meteorological conditions.
Solar and wind technology penetration into India’s coal-based power generation base using real options valuation was investigated by Das Gupta [
23]. The study aimed to evaluate the optimal timing of penetration to achieve penetration targets. Only one uncertain variable was used in this study which was coal price. The outcome of the study suggests that the overall policy value of meeting environmental targets is driven largely by promoting incentive policies which help to further reduce the price of wind and solar energies.
The economic incentive for retrofitting CCS technology on existing coal and natural gas power plants was analysed by Sowinski [
24] using real options approach. Two uncertain factors were considered in this study: the cost of CO
2 emissions and the price of electricity. Both were modelled as geometric Brownian motion processes. A comparison between different CO
2 removal technologies were investigated on several coal and natural gas power generation configurations. Specifically, an assessment for a coal-based configuration was performed under different discount rates and emission allowances. It was suggested that a greater risk on the market typically forces the investment decisions to become cautious at higher threshold values of CO
2 emission allowances.
Table 1 provides a comparative summary for these studies regarding their objectives, including the risk factors that generally affect investment decisions for technology selection, timing and value of the investment, and their contributions and limitations.
2.1. Research Gaps
This work differs from earlier studies in the following ways:
Earlier studies failed to investigate the exposure of low-carbon pathways to the joint effect of multiple risk factors, such that variables correlated today might become uncorrelated as markets evolve and some dependencies are subject to change in the future. This potentially affects low-carbon investments negatively, thus making the business-as-usual case more attractive.
Earlier studies did not investigate the “value of flexibility” in cogeneration (power and water) portfolios, considering both: (a) flexibility of portfolios, including those configurations representing varying proportions of fossil fuel and renewable options depending on future demand as the generation project learns over time; (b) flexibility in their implementation (investment timing), although they may have been looked at individually in terms of implementation of single low-carbon technology options via transitioning or switching.
In terms of localisation, earlier case studies have not focused on the Arabian Gulf region, where the power generation market is primarily regulated. Should there be deregulation of the electricity market in the future, it would be essential to evaluate new cogeneration and multigeneration projects subjected to price risks.
2.2. Research Objectives
This study quantifies the “value of flexibility” through the diversification of both low-carbon technology portfolios and the timing of their investment, thereby spreading the joint effects of risks to hedge their impact on the expected long-term project value. The approach suggested could also help identify and set up robust portfolios to attract public financing and investors. Given this, the following are the objectives of the study presented in this paper:
To model the joint price risks, including natural gas price, CO2 price and electricity price, to estimate future cash flow uncertainties of the expansion project using the principal components analysis (PCA) and stochastic time-series simulation approach.
To set up the real options analysis (ROA) model and evaluate the robustness in the financial value of the proposed project expansion options from risk exposure, assuming fixed investment timing for all cases.
To conduct a case study for expanding existing natural gas-fired cogeneration facilities in Qatar based on technically viable options using low-carbon technologies, primarily photovoltaics (PV) and carbon capture and storage (CCS).
3. Methodology
3.1. Available Data and Assumptions
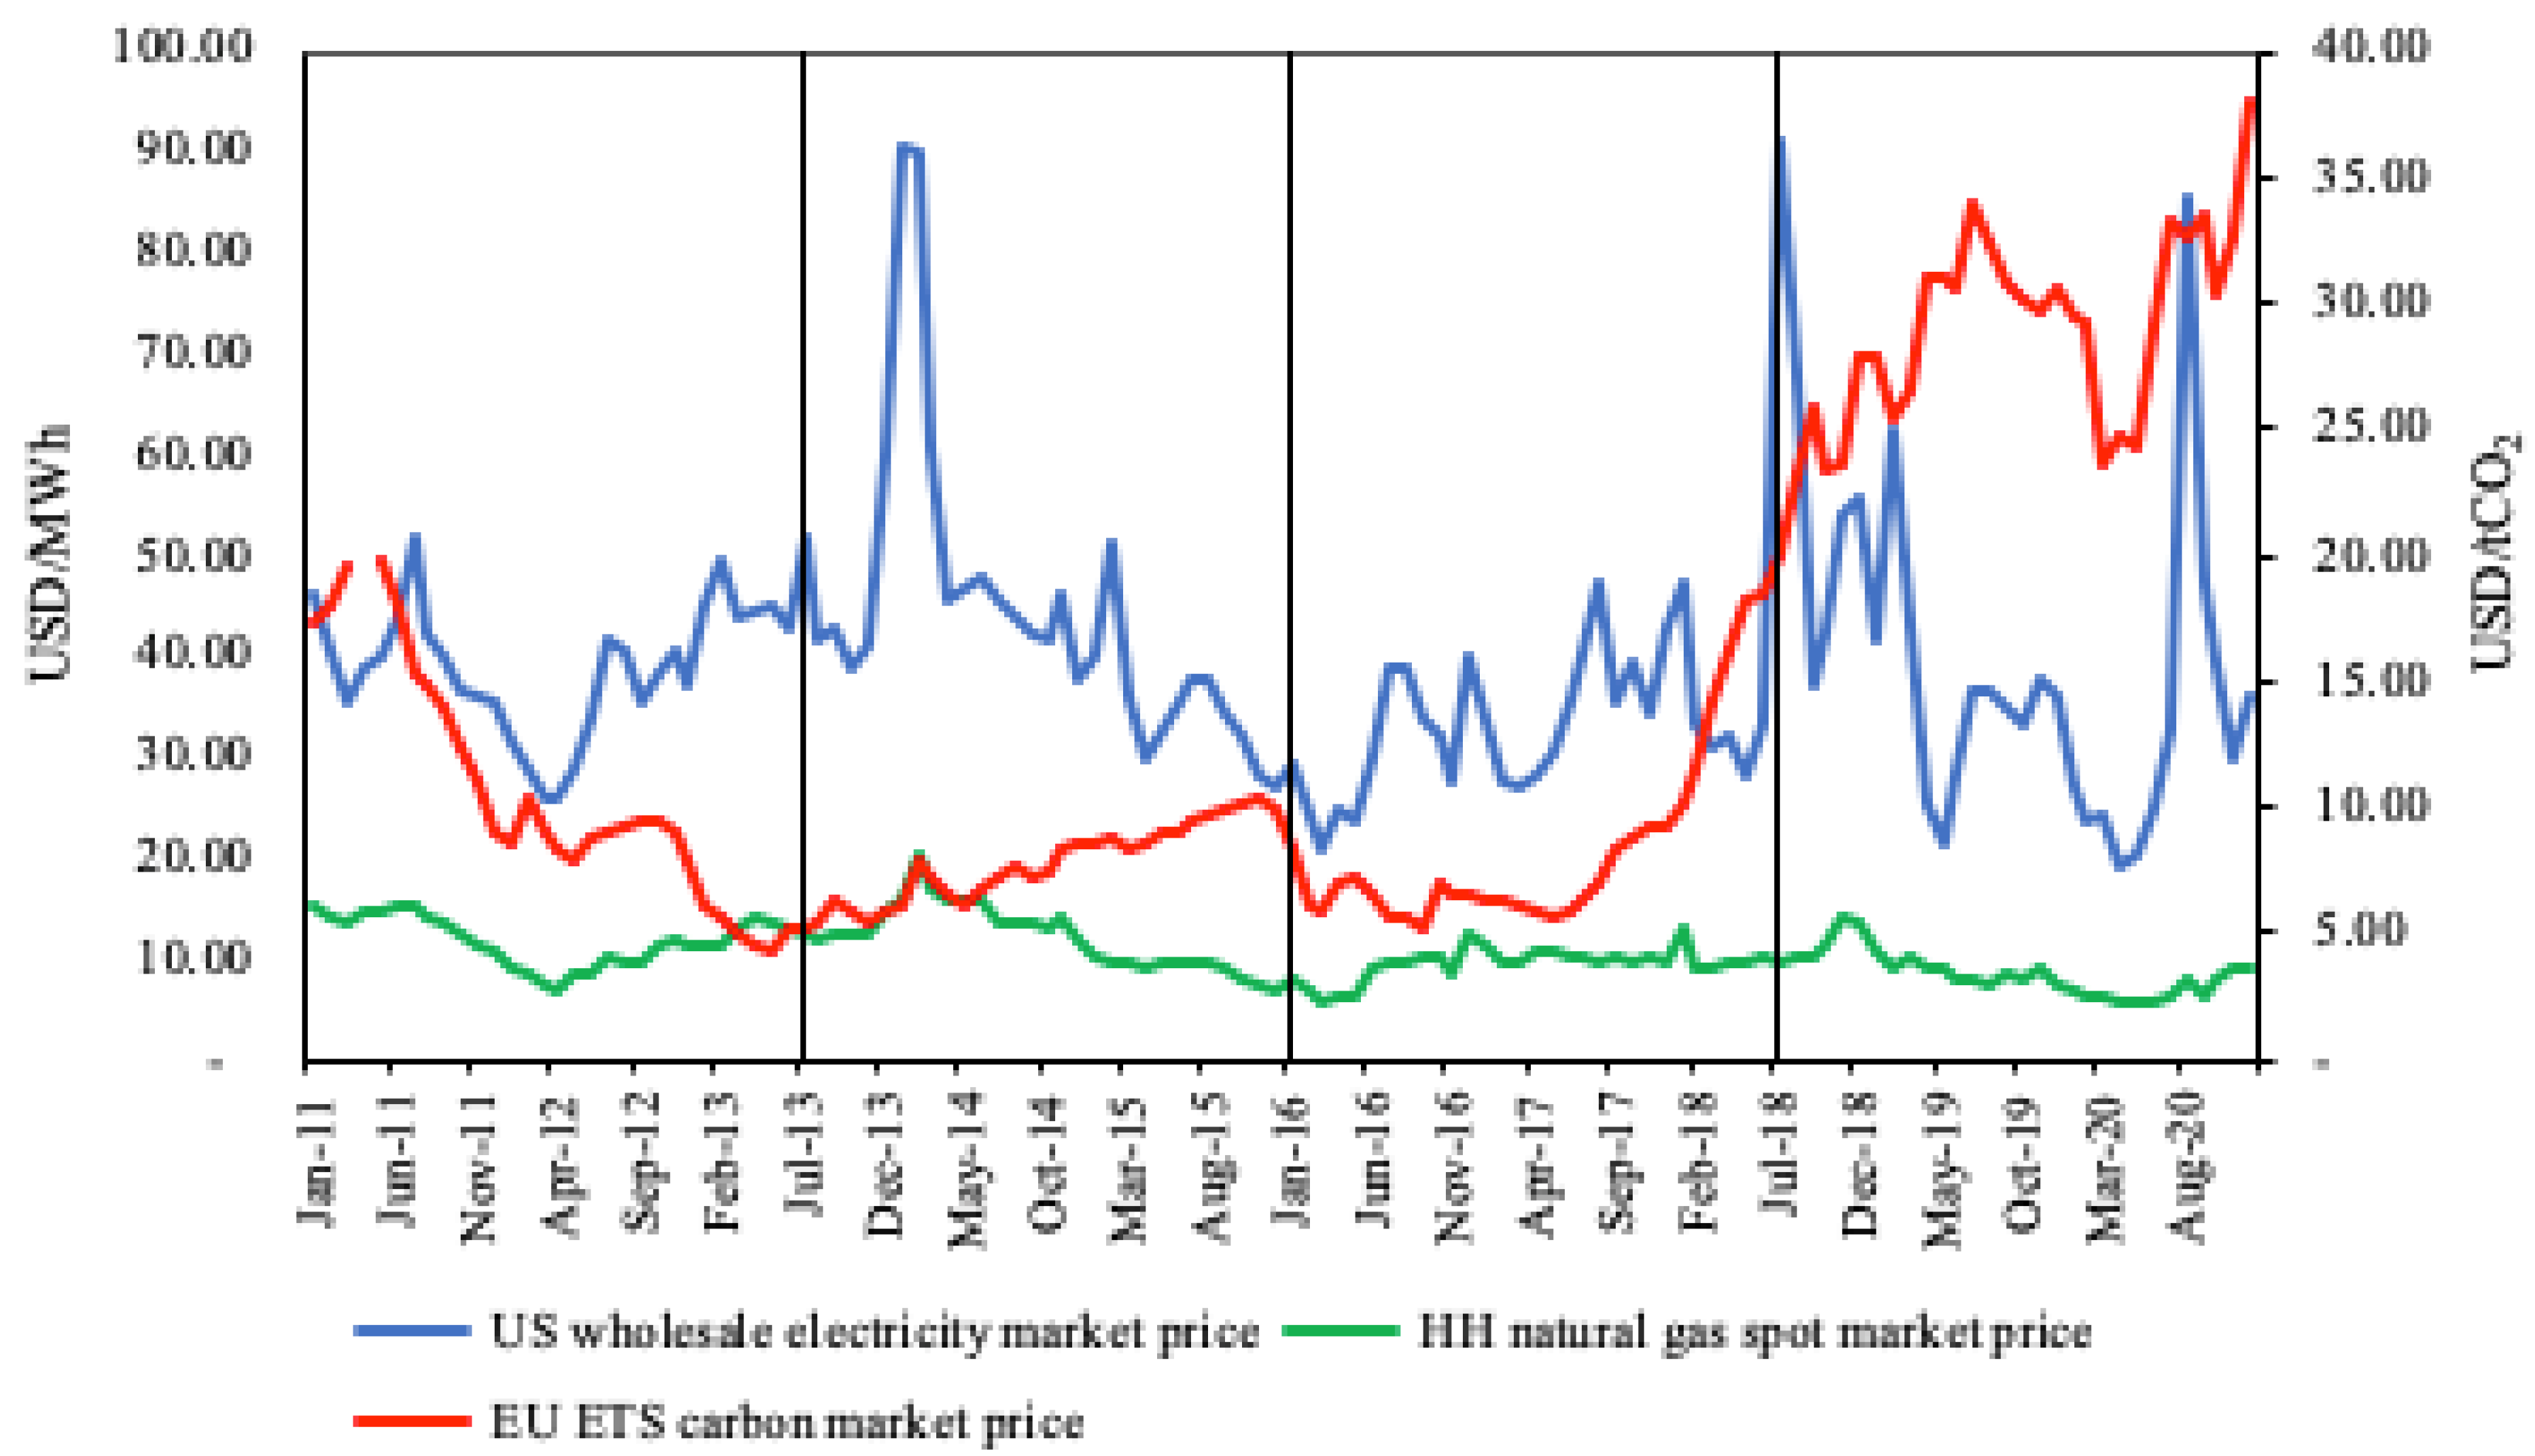
The historical monthly average price data for ten years, starting January 2011 to December 2020, were obtained from the US Energy Information Agency (EIA) and European Union Emissions Trading System (EU ETS) for the following:
the monthly average wholesale electricity market price was calculated using data from eight US electricity hubs, namely ERCOT North, Indiana Hub, Mid–C, Mass Hub, NP–15, Palo Verde, PJM West, and SP–15;
the natural gas prices were obtained from the Henry Hub (HH) spot price database [
25]; and
the EU ETS carbon market price [
26] was chosen over other carbon pricing schemes which are not free-market driven, such as regulatory carbon taxes.
Figure 1 illustrates the plots for the monthly average wholesale electricity, natural gas, and carbon market prices for ten years. The plots were divided into four equal sub-periods, SP–1, SP–2, SP–3, and SP–4, spanning two and a half years each, to assess the stationarity in their statistical properties and distinguish between low and high volatility sub-periods.
The mean values and standard deviations for the price data in each sub-period are listed in
Table 2. This was used to estimate the corresponding confidence intervals and identify the most representative value for the sample mean across different sub-periods.
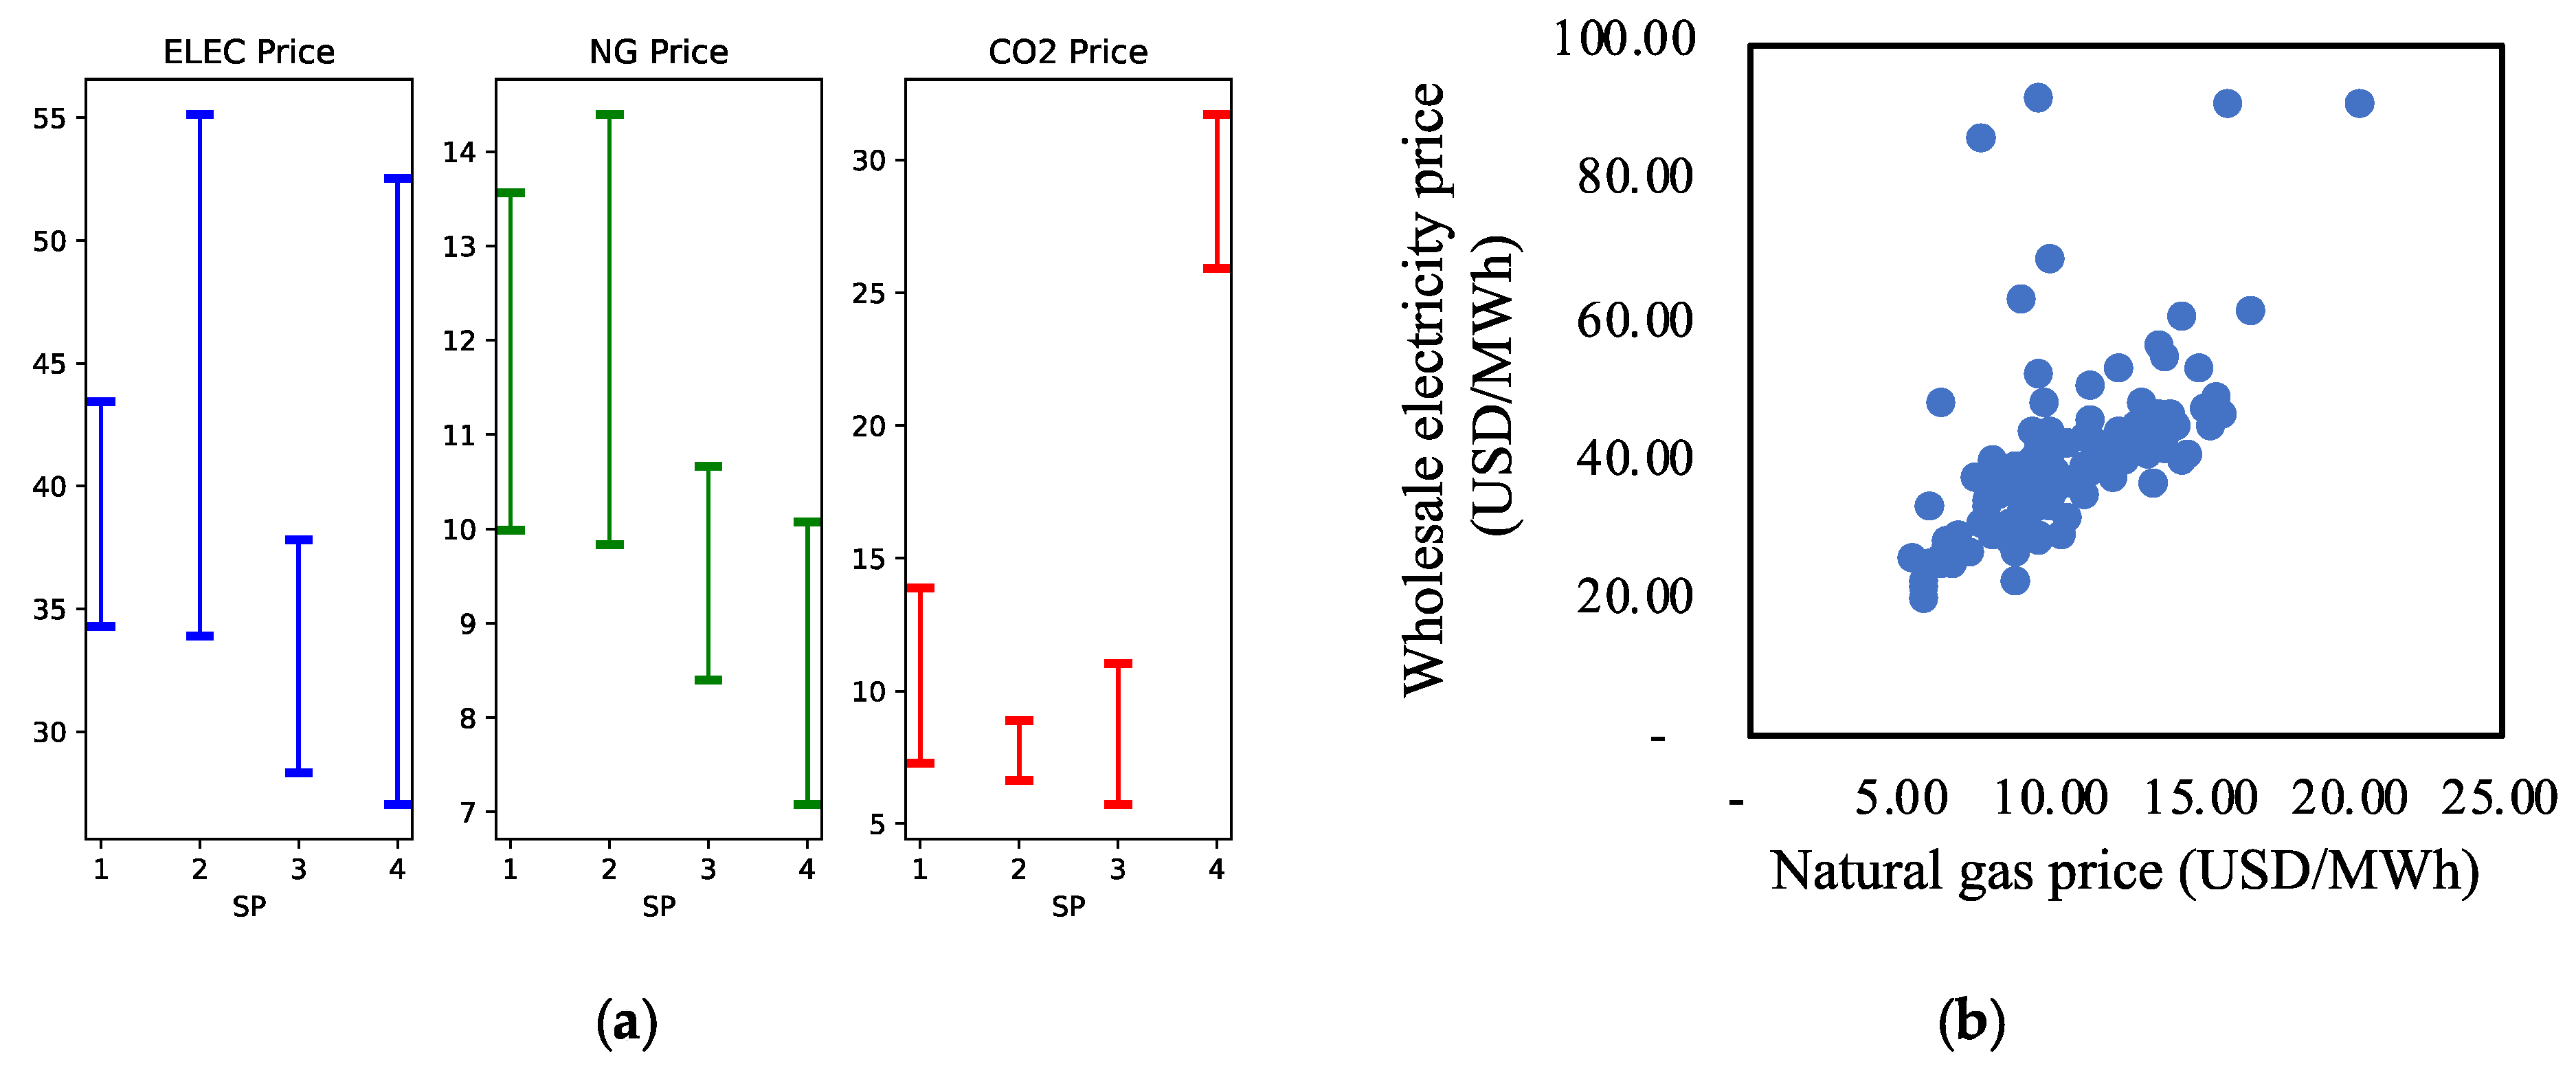
Figure 2a illustrates the confidence interval estimations for the price data across the different sub-periods. It was observed that the estimation for:
wholesale electricity price is likely to fall in the range between USD 35/MWh and USD 40/MWh;
natural gas price is likely to be approximately USD 10/MWh; and
CO2 price with two mean levels: (a) initial level representing SP–1, SP–2, and SP–3, having a mean value of USD 8/tCO2; and (b) a jump in the mean price level to USD 28/tCO2, possibly as a result of increased market activity.
Meanwhile, it is imperative to note that the average US electricity mix for the period under study has been 85% fossil fuel, of which 31% was natural gas and 15% renewable energy, of which only 1% was solar energy [
27]. Hence, the average wholesale electricity price over this period is correlated to natural gas prices, as noted in
Figure 2b. Thus, on average, an increase in natural gas price would drive growth in the wholesale electricity price due to the dominance of natural gas share in the electricity mix.
Table 2.
Mean values for wholesale electricity, natural gas, and CO2 prices for all the sub-periods.
Table 2.
Mean values for wholesale electricity, natural gas, and CO2 prices for all the sub-periods.
| Sub-Period | Wholesale Electricity Mean Price (USD/MWh) | Natural Gas Mean Price (USD/MWh) | CO2 Mean Price (USD/tCO2) |
|---|
| SP–1 | 38.8 | 11.7 | 10.6 |
| SP–2 | 44.5 | 12.1 | 7.7 |
| SP–3 | 33.1 | 9.5 | 8.4 |
| SP–4 | 39.8 | 8.6 | 28.8 |
Figure 2.
(a) 95% confidence intervals for the population mean of all sub-periods; (b) Scatter plot of natural gas and wholesale electricity prices.
Figure 2.
(a) 95% confidence intervals for the population mean of all sub-periods; (b) Scatter plot of natural gas and wholesale electricity prices.
Some assumptions made to aid the development of the methodology include:
prices from different markets were used based on their availability for the period under study since these are the most mature energy markets, and the information is globally representative from an investment decision-making perspective;
monthly-scale prices were considered for modelling since it sufficiently captures the volatility factor for investment decisions typically made over larger five-year look-ahead cycles.
the average low and high values for wholesale electricity prices were assumed to be based on LCOE values derived using: (a) natural gas-fired power generation costs; and (b) 25% to 50% penetration of renewable power generation in the energy mix, respectively; and
The most recent timestep (SP4) was selected since it is the most representative of market conditions with high price volatility, which would further help assess robust expansion options.
3.2. Multivariate Stochastic Approach for Joint Price Risk Simulation
A stochastic time series-based approach was adopted in this study to develop an understanding of the dynamic and time-dependent structure of the statistical parameters derived from the historical price data, namely their trends and volatilities. This provides an advantage to use the correlations to estimate several equally likely correlated price evolution pathways, or simulations, assuming the relationships will hold in the future. This was specifically achieved using the principal component analysis (PCA) technique to perform correlation modelling, followed by time series modelling for the price risk, as the underlying stochastic processes, to estimate of the net present value (NPV) probability distribution. The NPV distribution was subsequently used for the real options analyses to conduct valuation and comparative assessments between multiple low-carbon energy portfolios at the plant/project level as future expansion scenarios. On the other hand, other statistical simulation techniques based on the Monte Carlo approach for scenario analysis typically make independent and identically distributed (i.i.d.)-based stochastic process assumption that fail to capture the time-based correlations potentially leading to the underestimation of the positive or negative impact of the price risk factors on project valuation.
Initially, the PCA technique was used to jointly model the historical price dataset during the sub-period SP–4 indicated in
Figure 1. PCA uses the covariance matrix estimation of the dataset to represent the movement of market prices, which could either be correlated or weakly correlated, as an indicator for future price evolution. The prices were then transformed into a new set of variables called principal component (PC) scores that capture the essential information of the original dataset, such as (a) price trends and monthly-scale volatilities (with high PC1 scores); and (b) other features, including price jumps and noisy characteristics relating to observational errors (with high PC2 and PC3 scores). In this study, only the PC1 scores were considered as they correspond to the highest eigenvalue, describing a significant part of the total variance in the dataset.
The PC1 scores were modelled using the geometric Brownian motion process, containing both the trend and volatility components, defined by the following stochastic differential Equation [
28]:
where
is the average growth rate,
is the timestep size,
is volatility, and
is a simulated Brownian motion variable, following a normal distribution with a mean of zero and a variance of one. The geometric Brownian motion model generally applies to stochastic processes that take both positive and negative values, such as the PC scores described above.
Stochastic simulation was then used to generate 100 realisations (sets) of PC1 scores based on the joint volatility (
) of the three price factors. PC1 scores were back-transformed to obtain stochastic simulations for natural gas, electricity, and CO
2 price paths that were used to subsequently evaluate the net present value (NPV) distribution. The NPV calculations for natural gas-fired cogeneration configuration assumed in this study were based on the cash flow simulations that use a wholesale electricity price of USD 40/MWh with low market volatility of 2.5% (the low-price scenario) since these were the prevailing conditions for the ten years, starting January 2011 to December 2020. On the other hand, the cash flows for all the expansion configurations assumed were simulated using a wholesale electricity price of USD 100/MWh with high market volatility of 25% (the high-price scenario) due to the change in the electricity mix, with greater penetration of renewables and other market-related factors, as observed in
Figure 1. The details of the configurations are presented in
Section 4, which lays the foundation for the case study.
3.3. Real Options Analysis
The recombining binomial lattice model was used to evaluate the possible expansion routes for a given cogeneration project. The lattice model is a mature technique used for evaluating investment decisions. It parallels the classical formalisation of sequential decision-making techniques, such as dynamic programming and the Markov decision process (MDP) implemented in the more modern reinforcement learning approach [
29]. Thus, using the lattice model, it is possible to identify robust investments that influence not only the immediate value of the projects, but also their future value when the prices are possibly not very favourable.
In the lattice modelling approach, the total duration is equivalent to the project’s half-life, which was further assumed to be divided into predefined timesteps. The lattice model essentially shows the evolution from one timestep to the other using “forward induction” paths that follow the exponential Brownian motion [
30], given by:
where
is the upside evolution step in the upward branch of the binomial tree. The downside evolution step
in the downward branch of the binomial tree is given by:
The option value for the upside is determined using the following:
where ‘
’ denotes time step and ‘
’ denotes the branch index. Similarly, the option value for the downside is determined using:
The underlying asset’s cash flow volatility
is assumed to be 10%, and the stepping time
is set to 2 years. The underlying asset value for the expansion trees was determined using the following equation:
where
is the mean stochastic NPV for each of the expansion configurations. When the forward induction reaches the terminal nodes
for the seven expansion trees, the option values for each of the seven nodes were determined using the following equation:
Thus, seven option values were used to perform the backward induction calculations following these equations [
30]:
where
is the risk-neutral probability of the upside branch in the back-propagation process, and the risk-free rate
is set to 6.5%. The risk-neutral probability of the downside branch in the back-propagation process
is given by:
The discount factor
for the back-propagation is determined using the following:
The option values
calculated in the reverse order for the earlier timesteps are given by:
The extended NPV for each scenario was determined as the sum of the scenario option value and the mean stochastic NPV for both the baseline and expansion configurations [
17].
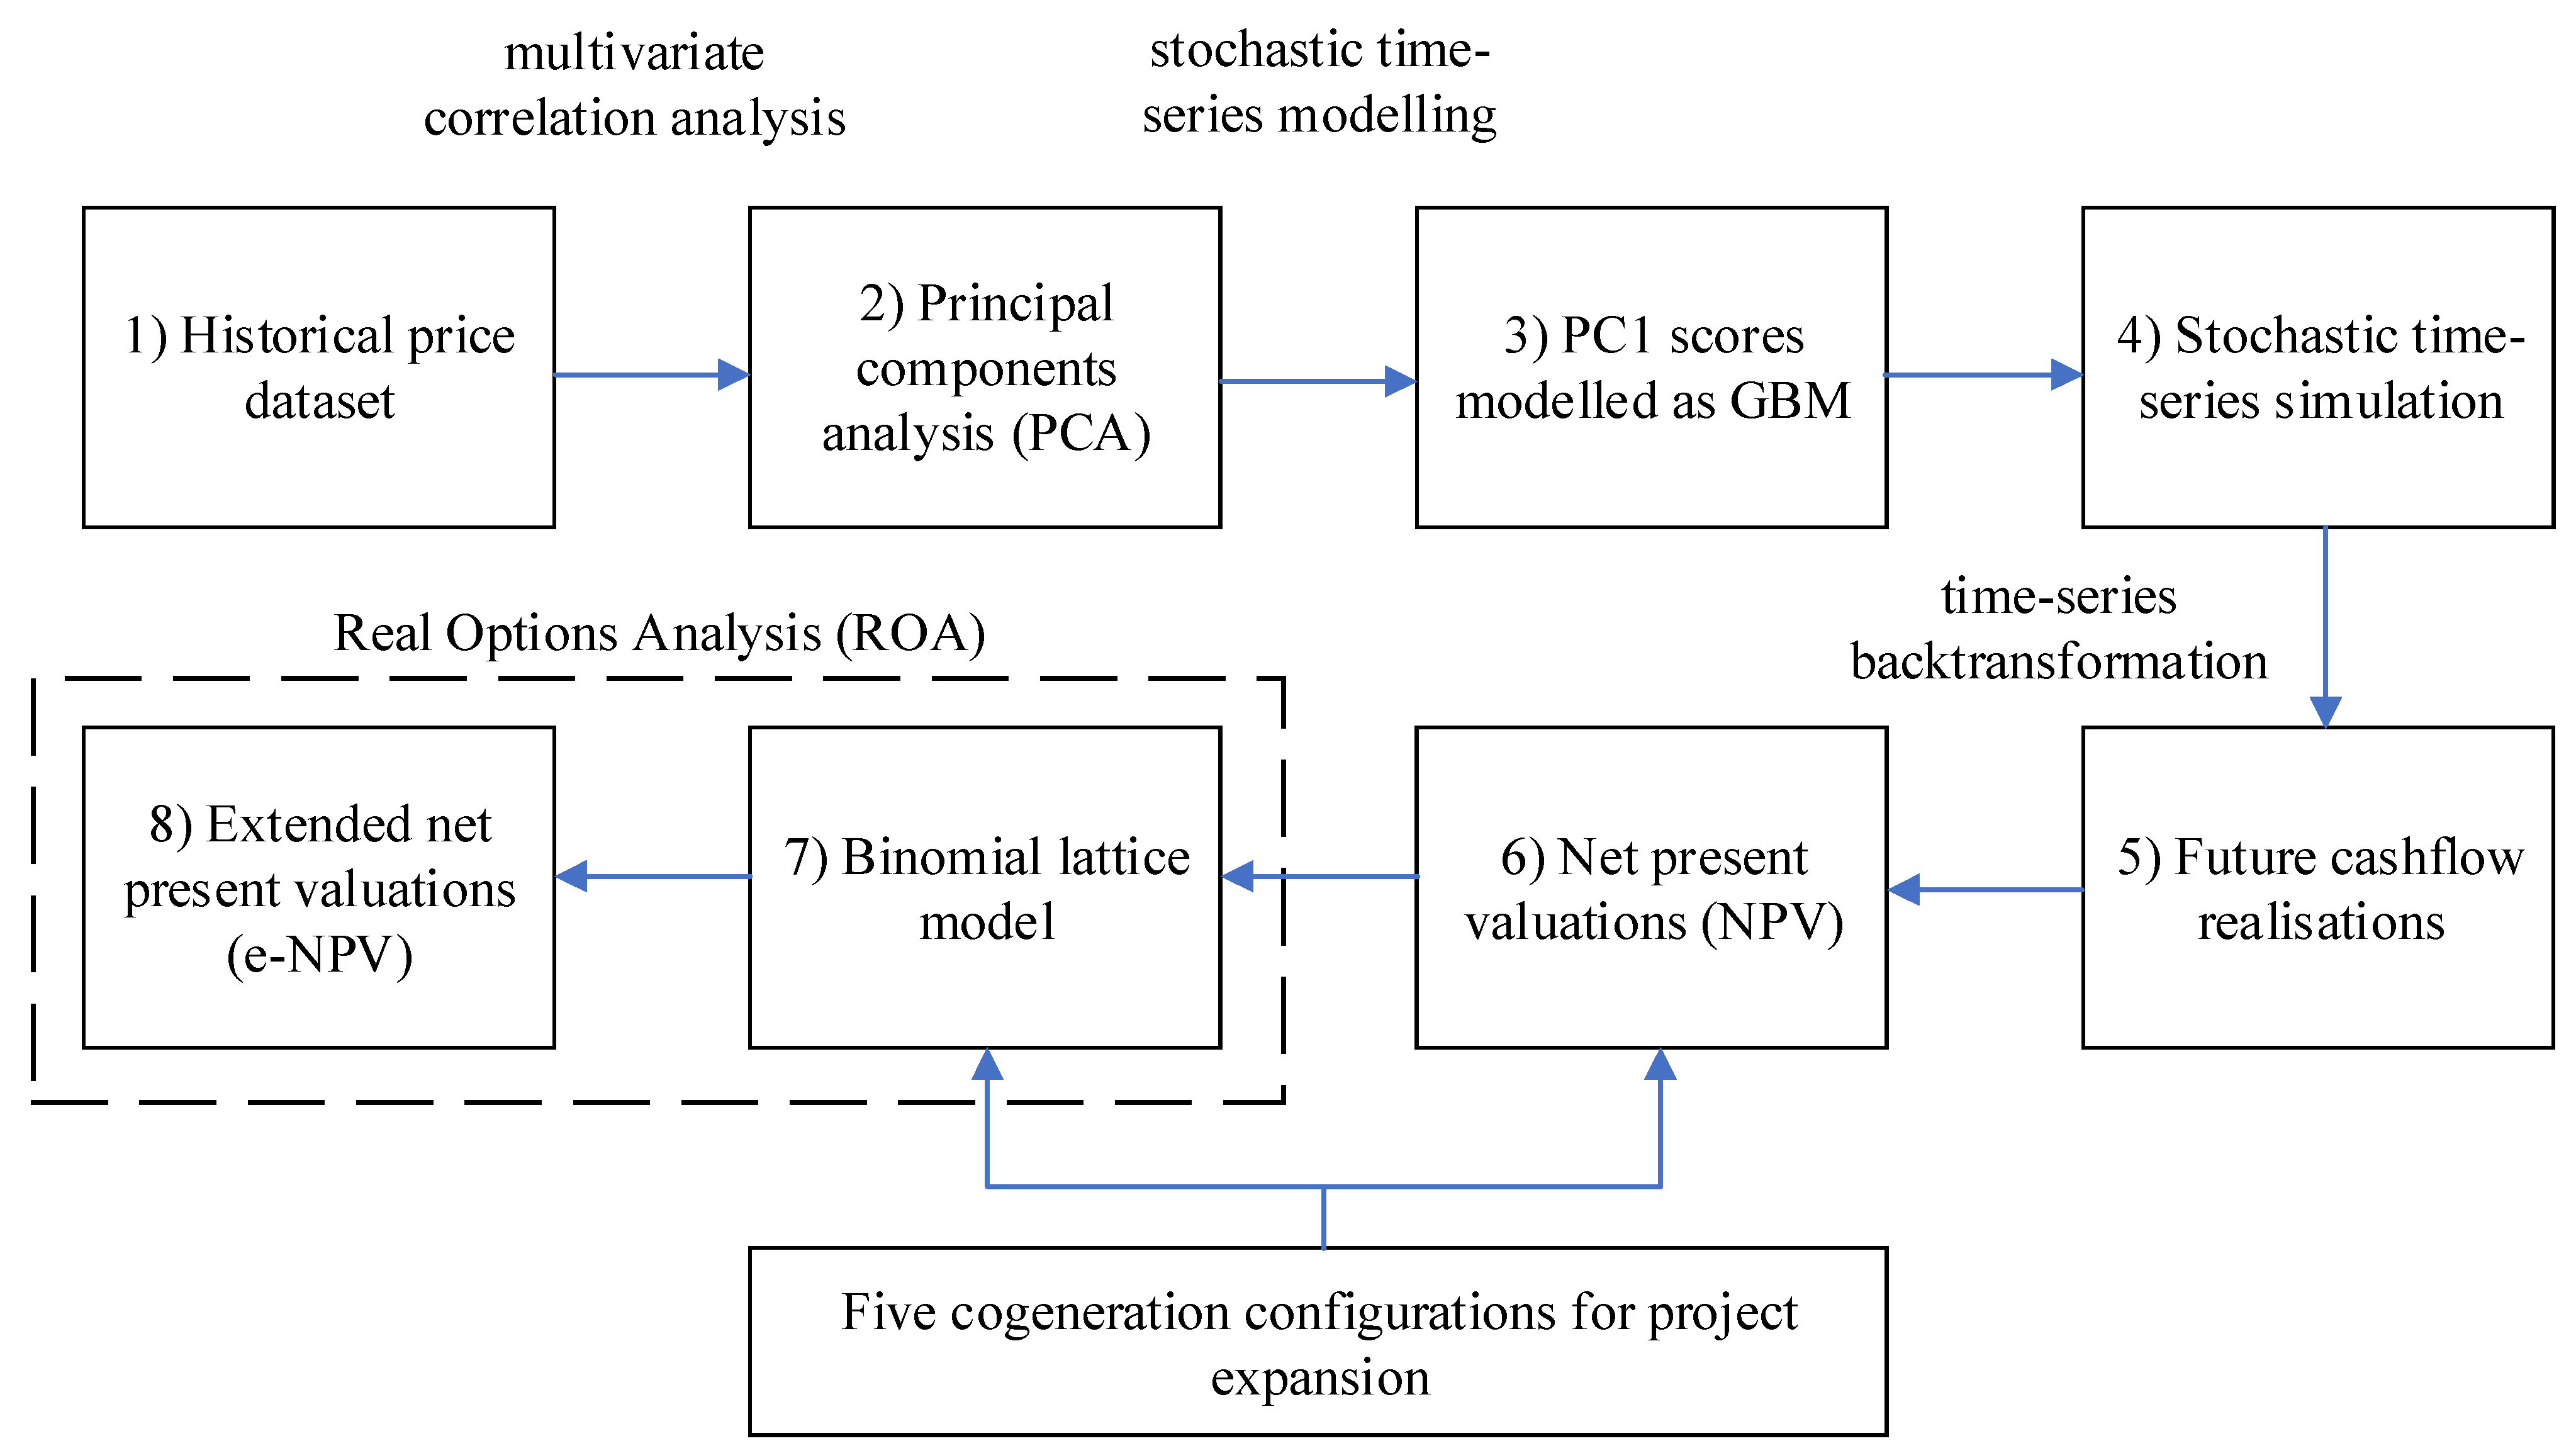
Figure 3 provides a simplified block diagram to illustrate the different steps of the methodology: (1) historical time-series data for the composite risk feed into the multivariate statistical analysis; (2) principal components are developed based on multivariate analysis data; (3) the first principal component scores are modelled as geometric Brownian motion; (4) stochastic time-series simulation is conducted using the five cogeneration configurations from the case study; (5) one hundred future cashflow realisations are generated; (6) stochastic NPV distributions for each configuration are generated; (7) real options valuation using the binomial lattice model is then applied to five different scenarios from the case study; (8) the extended NPV is finally identified for each of the scenarios from the case study.
4. Qatar Case Study
Integrated power and water desalination facilities for cogeneration are designed to meet the increasing demand for freshwater and electricity. A fossil fuel-based power generation block contains several gas turbine units, electric generators, and combined heat-recovery steam generators (HRSG). The water production block includes several seawater desalination technologies, such as multi-stage flash (MSF), where heat recovered from gas turbines evaporates, flashes, and produces distilled water. Seawater reverse osmosis (SWRO) technology recently started to gain popularity due to the technology’s high performance and energy efficiency [
31].
A conventional system is employed for a local community in Qatar. It comprises CCGT and MSF technologies with annual electricity and freshwater demand of 3 TWh and 36.5 Mm
3, respectively. The demand is projected to double around the midpoint of twenty-four years of the facility’s lifetime. Developers and stakeholders use conventional technology to generate 50% of the total lifetime capacity because this technology is proven, and the economics are most favourable. Then, for the planned expansion, after twelve years from operations, other options are considered such that project economics and feasibility could improve when several market risk factors are uncertain. Due to the proven record, three leading expansion technologies are considered: CCS, PV, and SWRO. The specifications for each of the five technologies selected are presented in
Table 3.
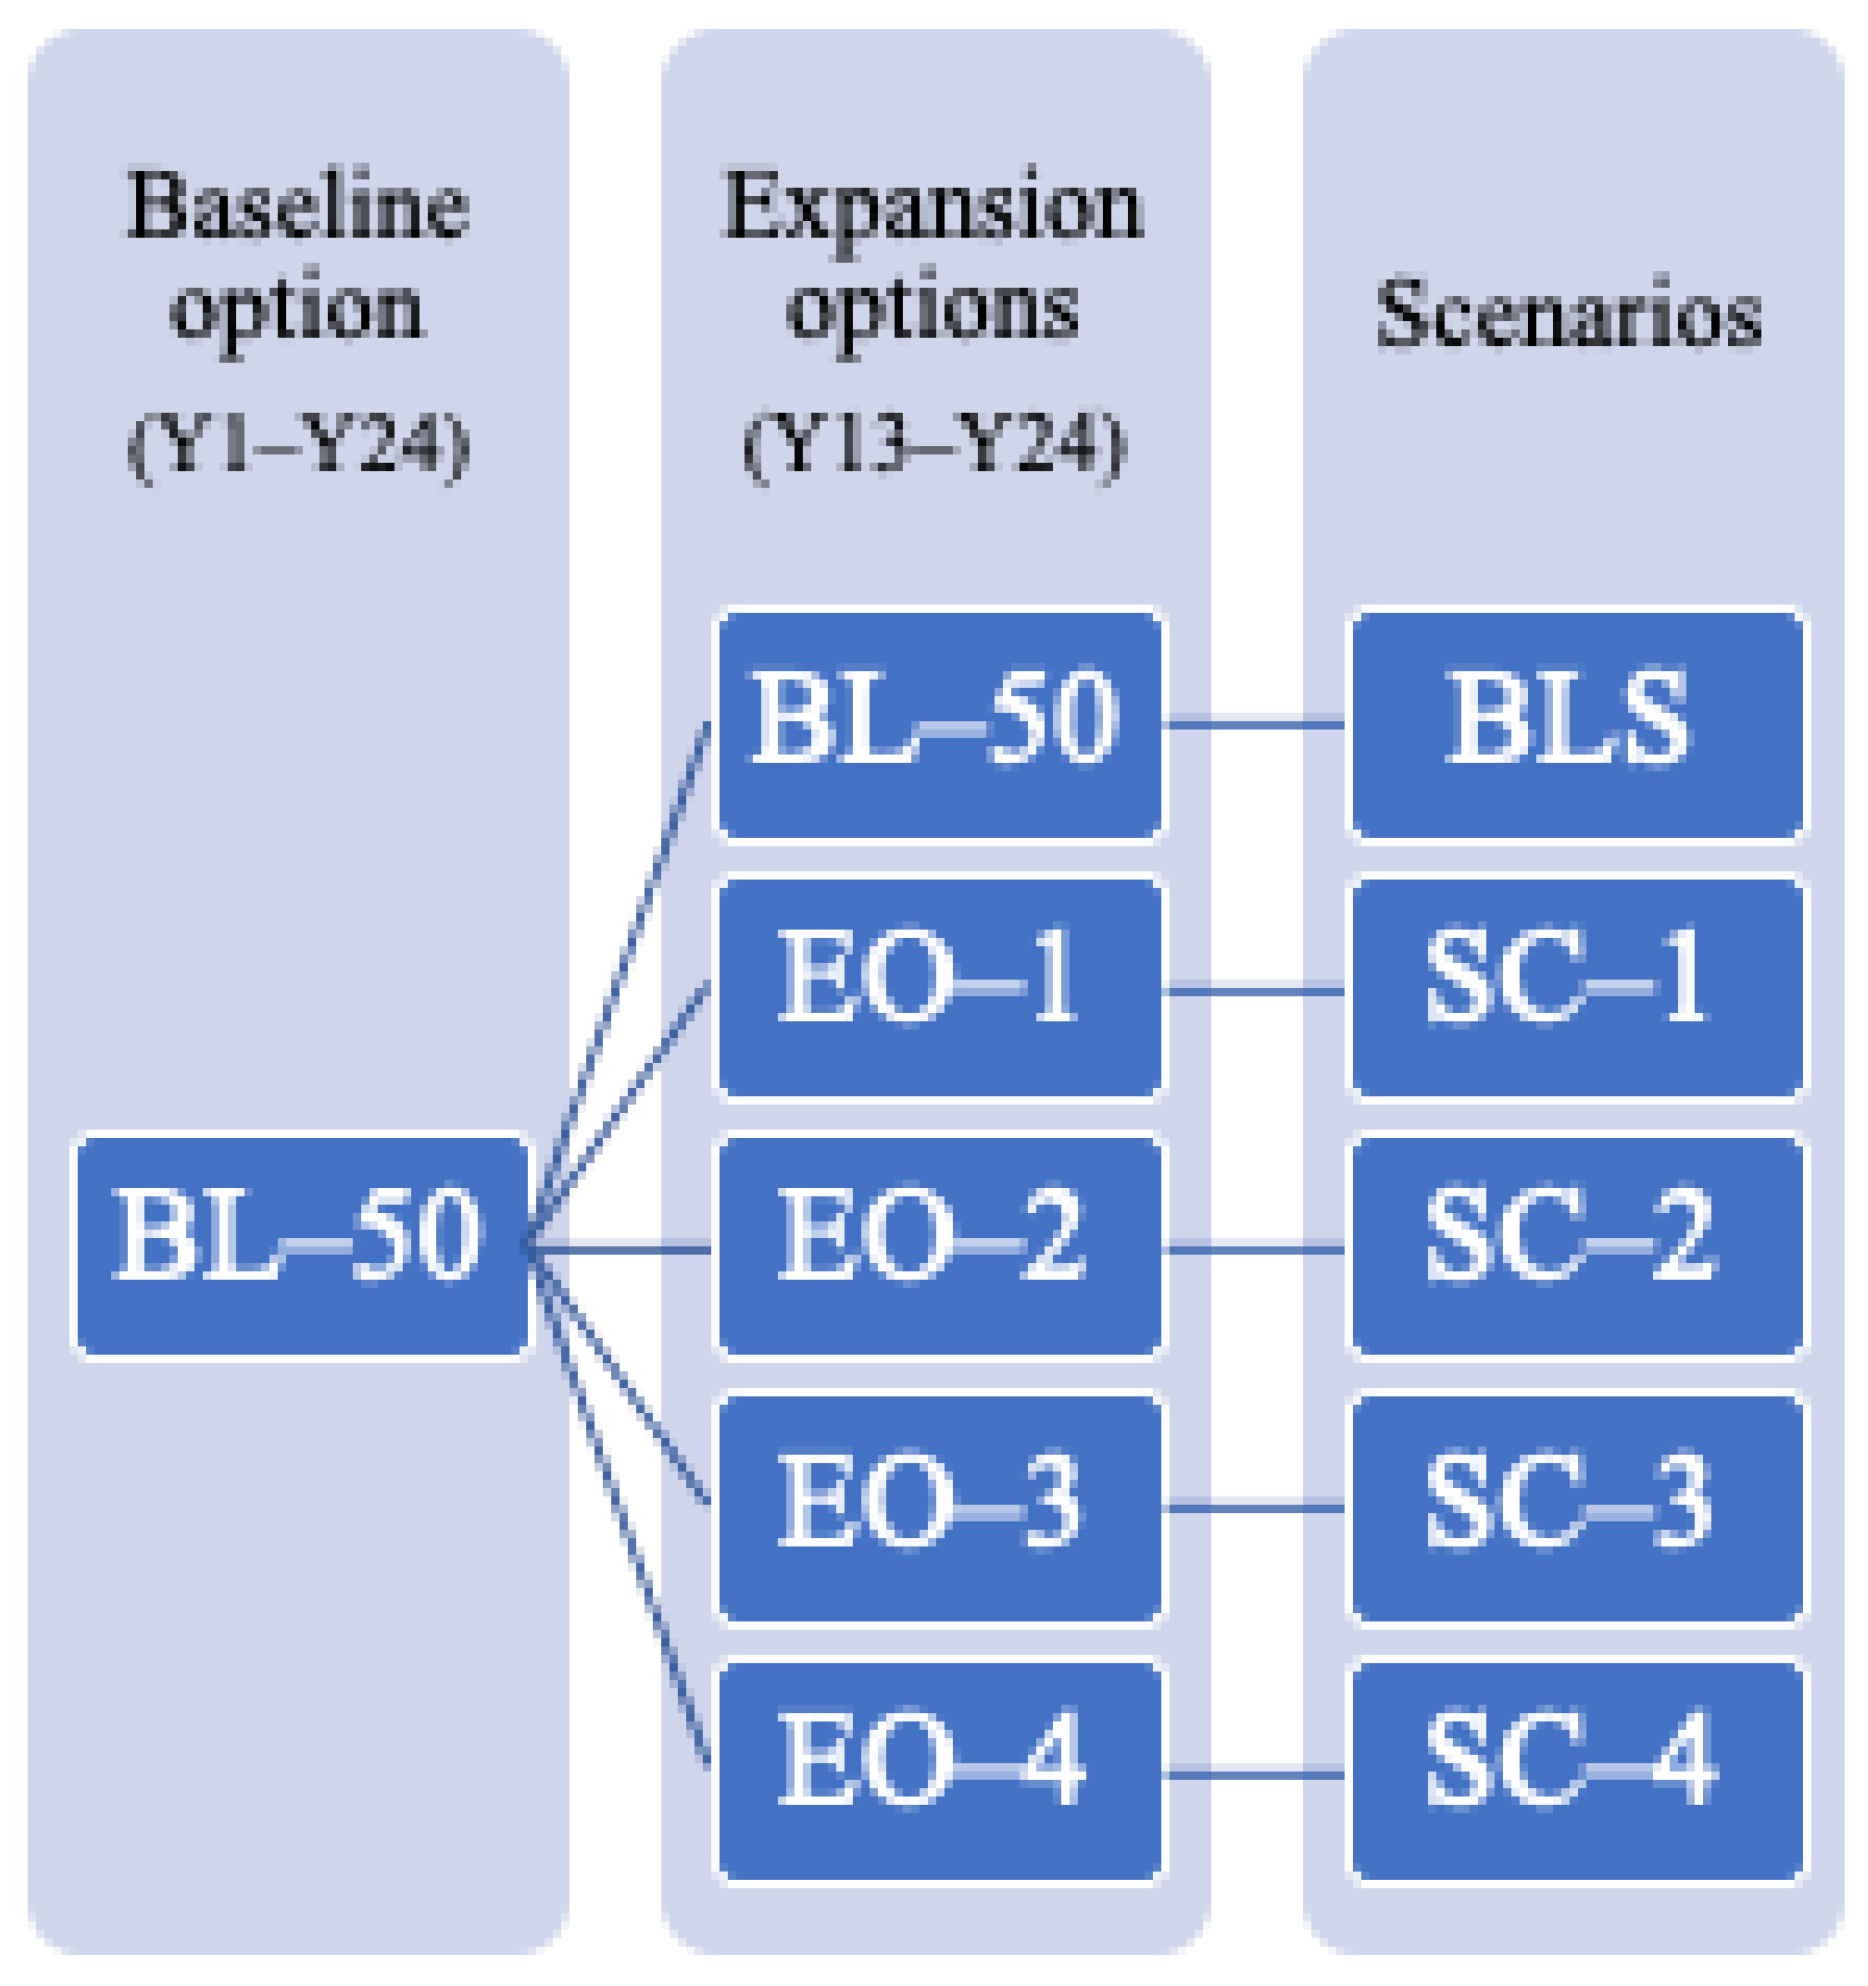
Table 4 presents the specifications of the cogeneration system, both baseline, and expansion, in terms of supply and demand and the different possible combinations or configurations. One baseline configuration was proposed for the initial 50% capacity (CCGT–MSF) as BL–50, and four expansion options were offered for the 50% expansion capacity after twelve years of operation: (CCGT–PV–SWRO) as EO–1, (CCGT–CCS–MSF) as EO–2, (CCGT–CCS–PV–SWRO) as EO–3, and (PV–SWRO) as EO–4.
Four scenarios were developed for the real options valuation with an additional baseline scenario (BLS) which exemplifies the business-as-usual (BAU) case. Each scenario constitutes the baseline and expansion configurations based on four expansion options (see
Figure 4).
Plant capacities for the power block vary from configuration to another because of the different capacity factors used for each technology. Capacity variation between configurations is essential to maintain consistent supply and meet total demand. The capacity factors for each power generation technology are listed in
Table 5 [
32].
The capacity factor for CCGT–CCS was reduced by 14.7% from the CCGT factor [
33]. A 100% capacity factor for the water block was assumed since it is a standard practice in the industry to apply what is known as ‘N+1’ installed capacity (a.k.a. redundancy). It was further assumed that the associated capital and operating expenses for the redundant capacity for the water block are already included in the rates used in this study because the data is based on operational units. The capital and operating cost rates per unit output for all the technologies are listed in
Table 6 [
34,
35].
Capital cost was assumed at current levels throughout the facility’s lifetime; therefore, the potential decrease in capital cost for renewables due to technology improvements was not considered. The operating cost was further divided into fixed and variable costs. The solar PV technology does not incur any variable operating cost by design. The fixed and variable operational expenses for the water technologies applicable for the Arabian Gulf region were estimated from the total operating cost at 28% and 72% for MSF and 39% and 61% for SWRO, respectively [
35].
The average energy intensity for seawater desalination determines the additional electric energy requirement and the total grid demand. It is 4 kWh/m
3 for MSF and 2.5 kWh/m
3 for SWRO [
35]. Due to the integrated nature of the configurations, both the electrical and thermal energies required for the desalination process are provided from the power block to the water block at no charge. Therefore, the following quantities were deducted from the total variable cost for each seawater desalination technology. For MSF, 52% was removed from the total variable cost due to thermal energy synergy and 14% due to electrical energy synergy. SWRO technology does not require any thermal energy input; hence, only 41% was deducted from the total variable cost due to the electrical energy synergy [
35].
At the moment, there is no established wholesale market for freshwater. The average sales price of traded water in the US states of Arizona, California, and Texas between 2009 and 2018 was around 2888 USD/acre-feet, equivalent to 2.34 USD/m
3 (1 acre-foot = 1233 m
3) [
36]. Recently, an index for water trading in the US State of California was established in the Nasdaq stock market (NQH2O), facilitating water as a commodity and tracking the spot price based on market supply and demand. The market has slightly over one year’s worth of data. It is at a very early stage of extracting any market dynamics that can be used for analysis, such as long-term mean and market volatility. The prices reflect the commodity value of water at the source and do not include additional costs associated with transportation or any losses. The situation for water desalination trading is even worse since each facility has its specific breakeven cost of production in addition to a profit margin which also varies from operator to operator.
For this case study, the average cost of desalination plus an assumed profit margin was used.
Table 7 details the financial figures for both MSF and SWRO. The average wholesale price of freshwater from the producer to the network operator was assumed to be 1.8 USD/m
3. This price is typically negotiated regularly; however, this rate will be the long-term mean due to the lack of a better wholesale price indicator.
The suggested configurations are low-carbon options that have not been implemented in the State of Qatar, and this is the first study (to the best of our knowledge) that comprehensively evaluates and reports the improvements over baseline with promise for stakeholder reference and possibly for consideration in future project feasibility studies.
5. Results and Discussion
Multivariate statistical analysis, principal components analysis, geometric Brownian motion modelling, and stochastic time-series simulations were coded using Python. However, net present valuations and binomial lattice modelling were implemented using Microsoft Excel.
5.1. Principal Component Analysis and Stochastic Time-Series Simulation Results
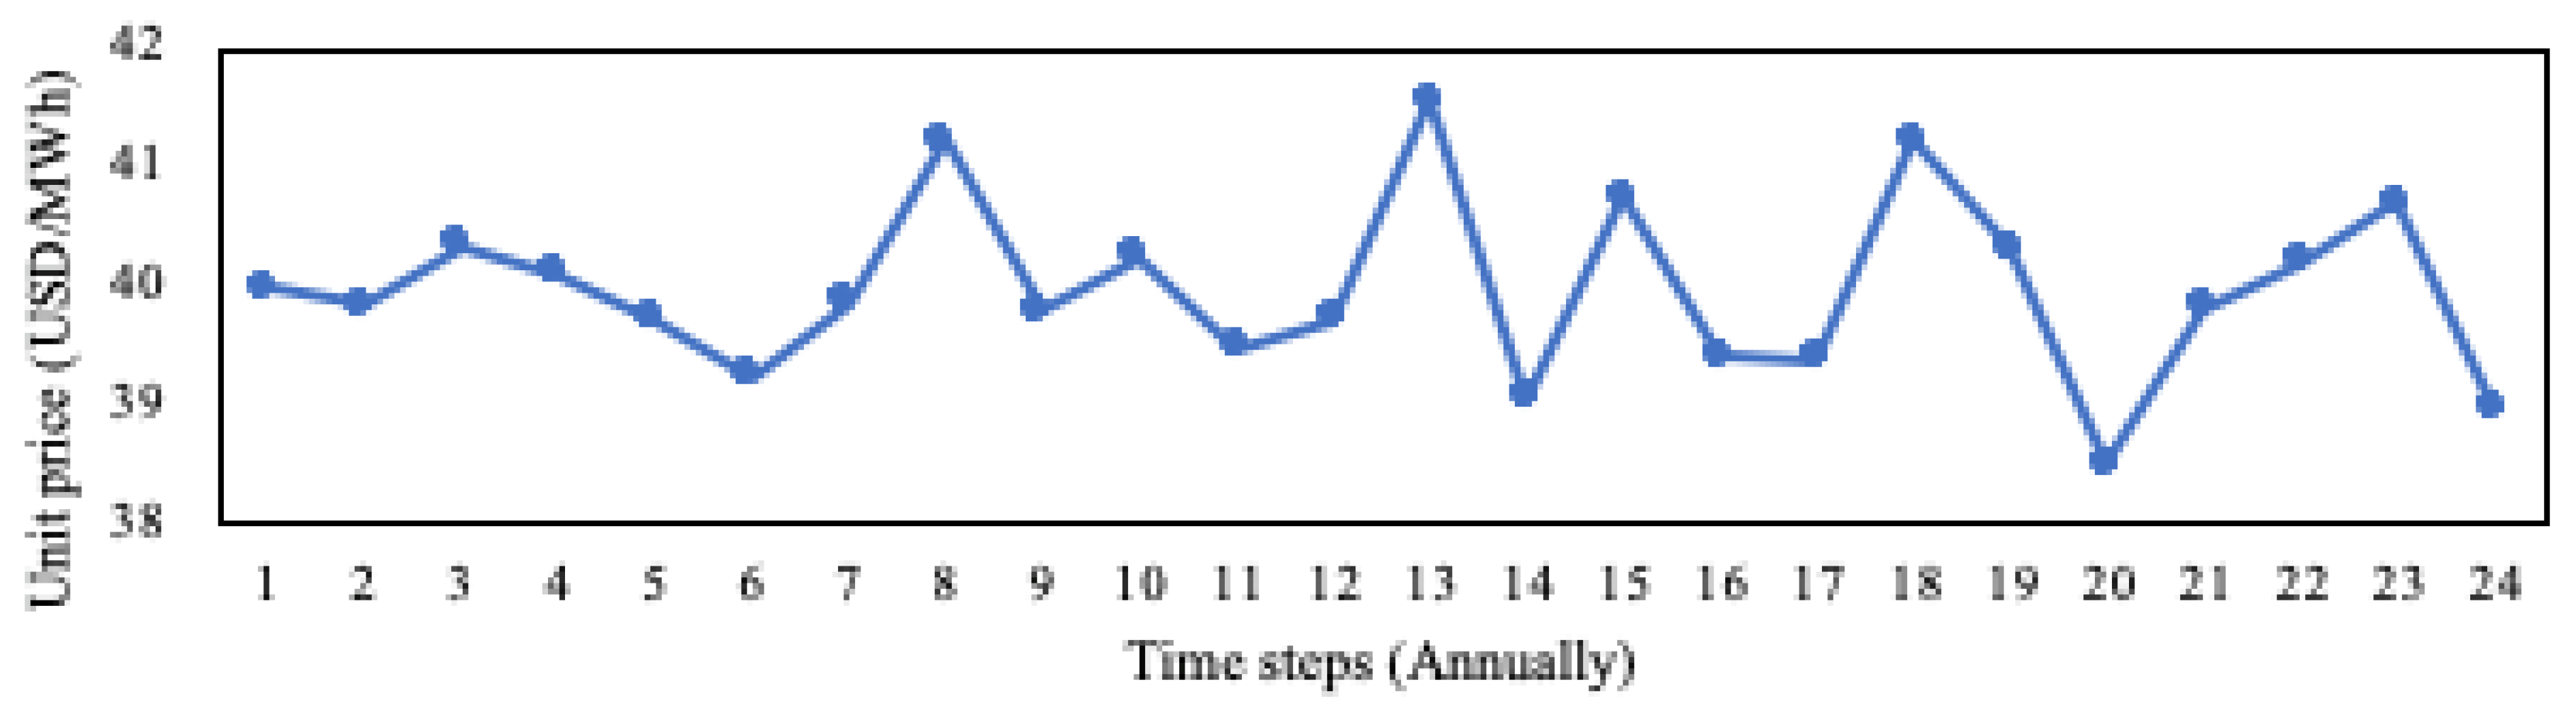
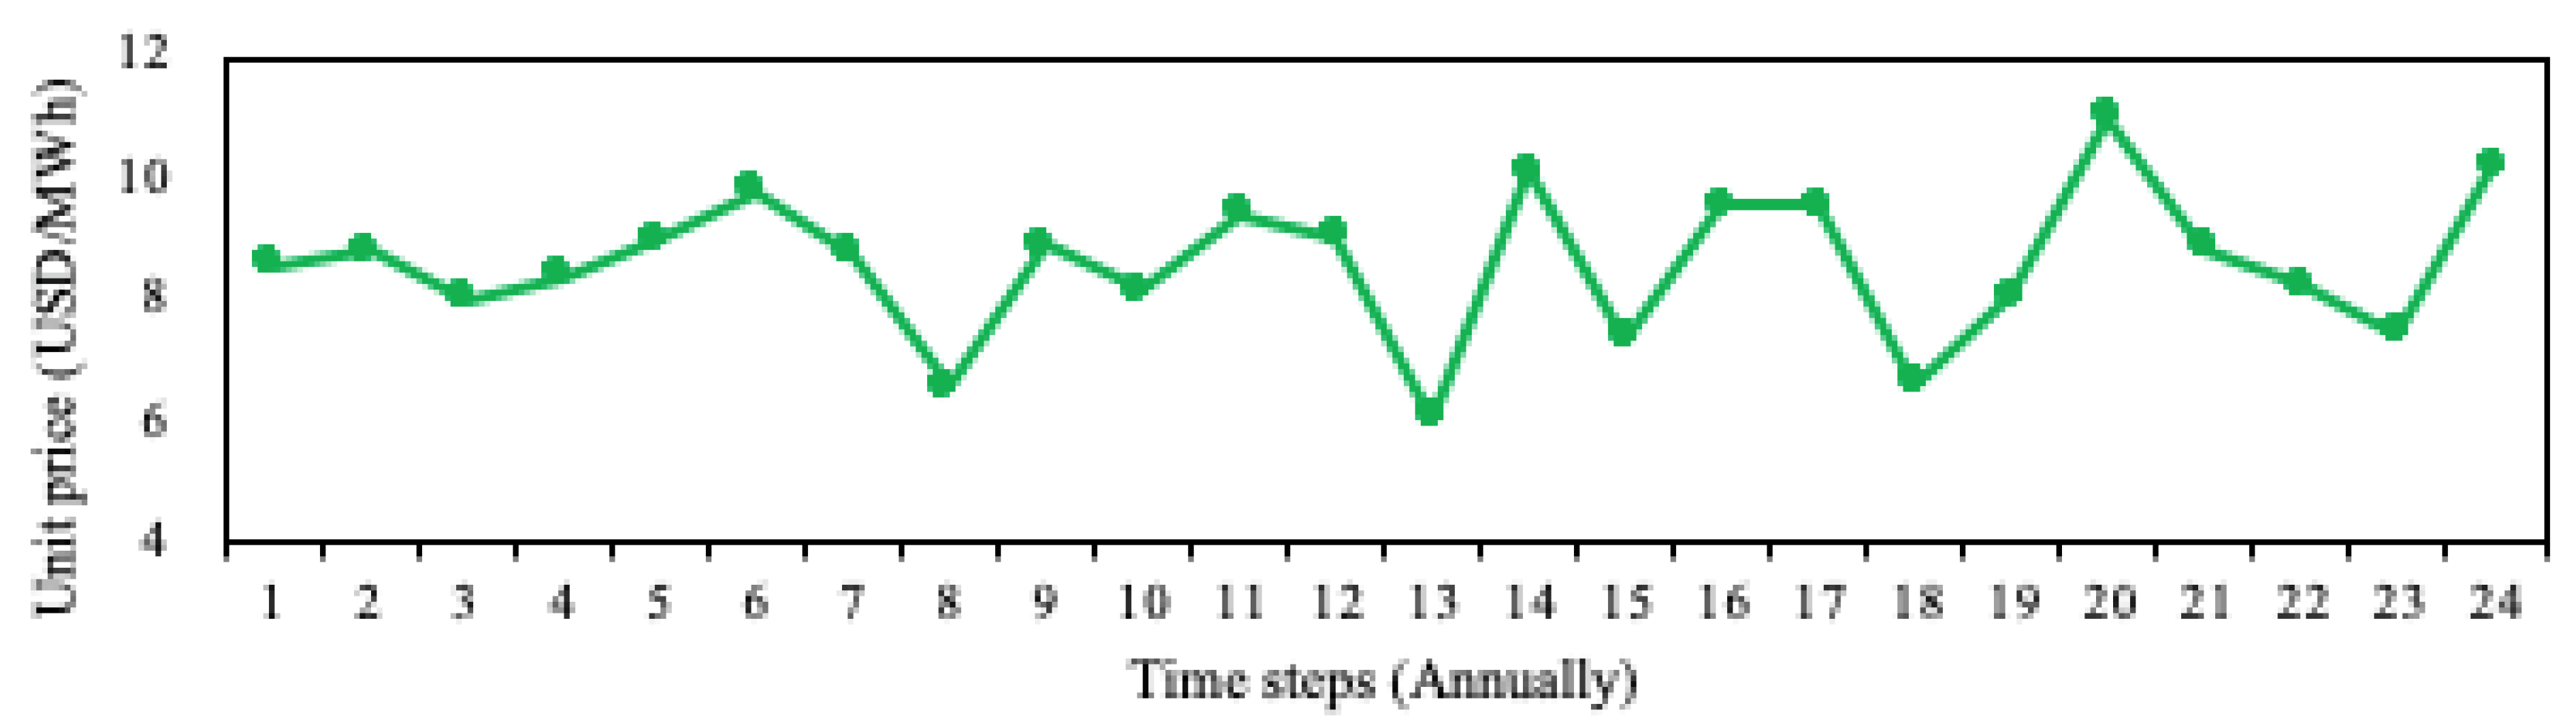
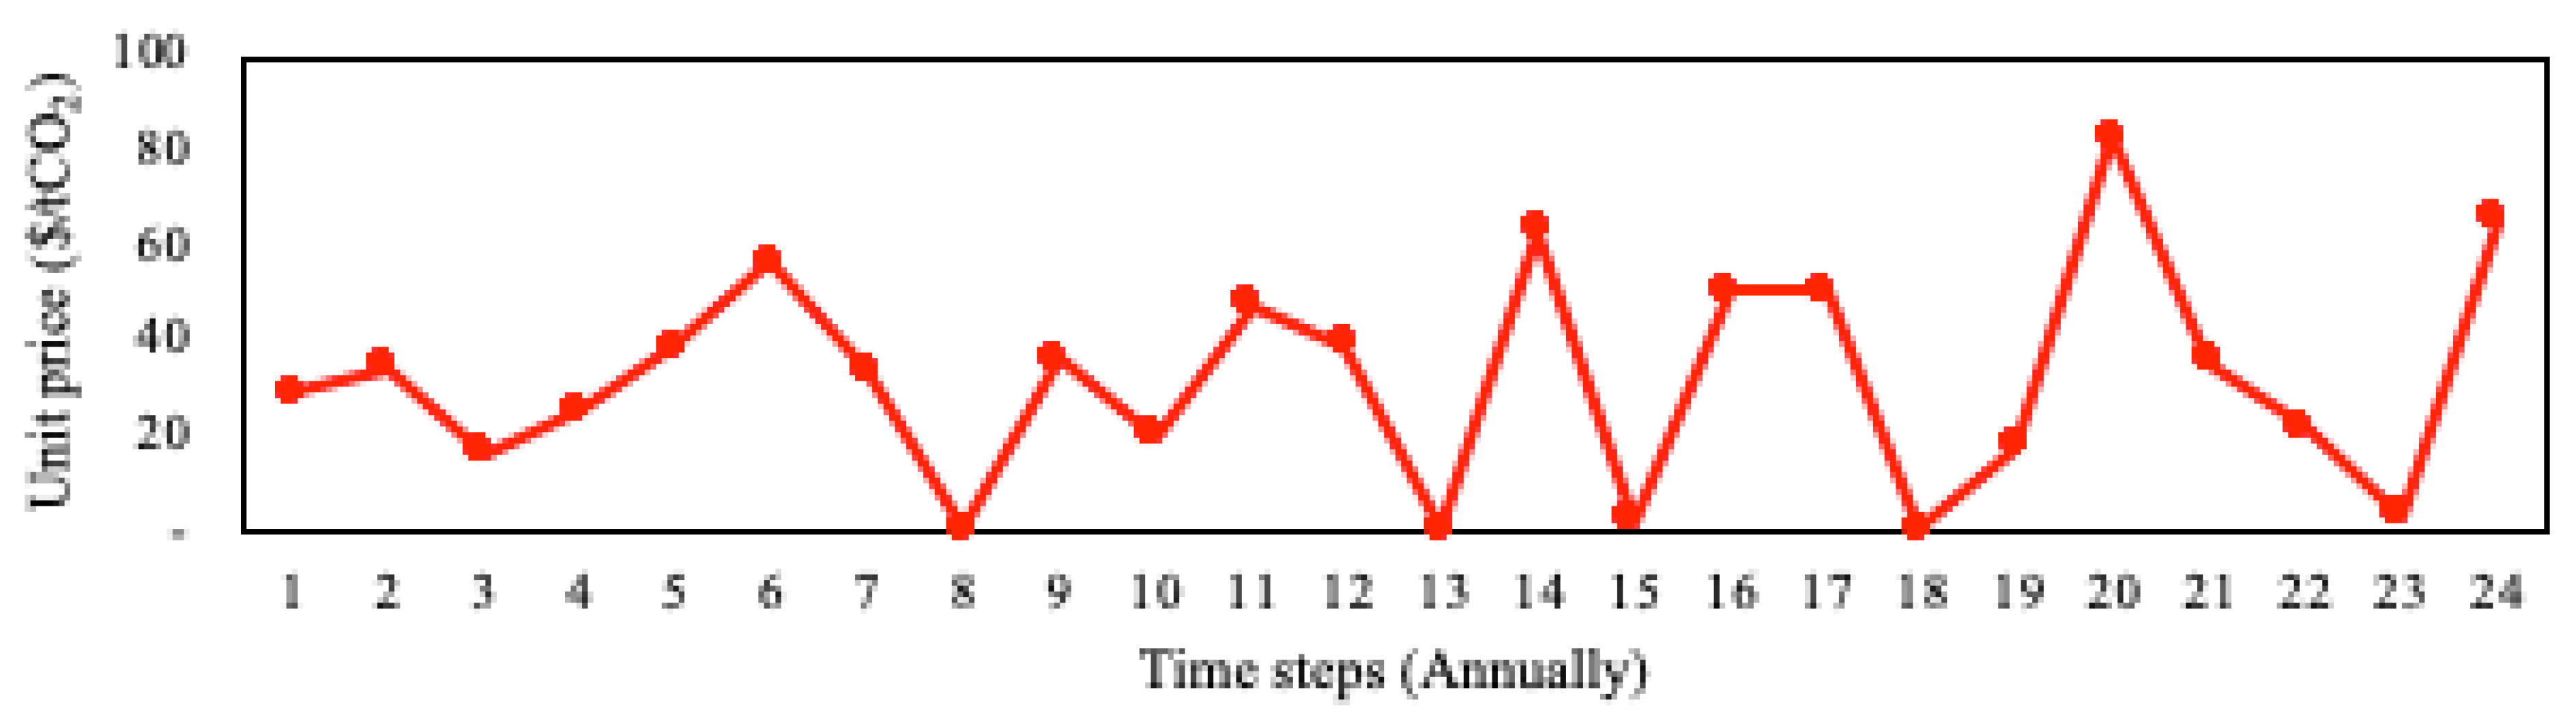
Figure 5,
Figure 6 and
Figure 7 show a single realisation of the back-transformed wholesale electricity, natural gas, and CO
2 price simulations based on PCA and MCS. The forecasted prices capture the correlation of the time series and the joint volatility, which began at low levels and then increased over time.
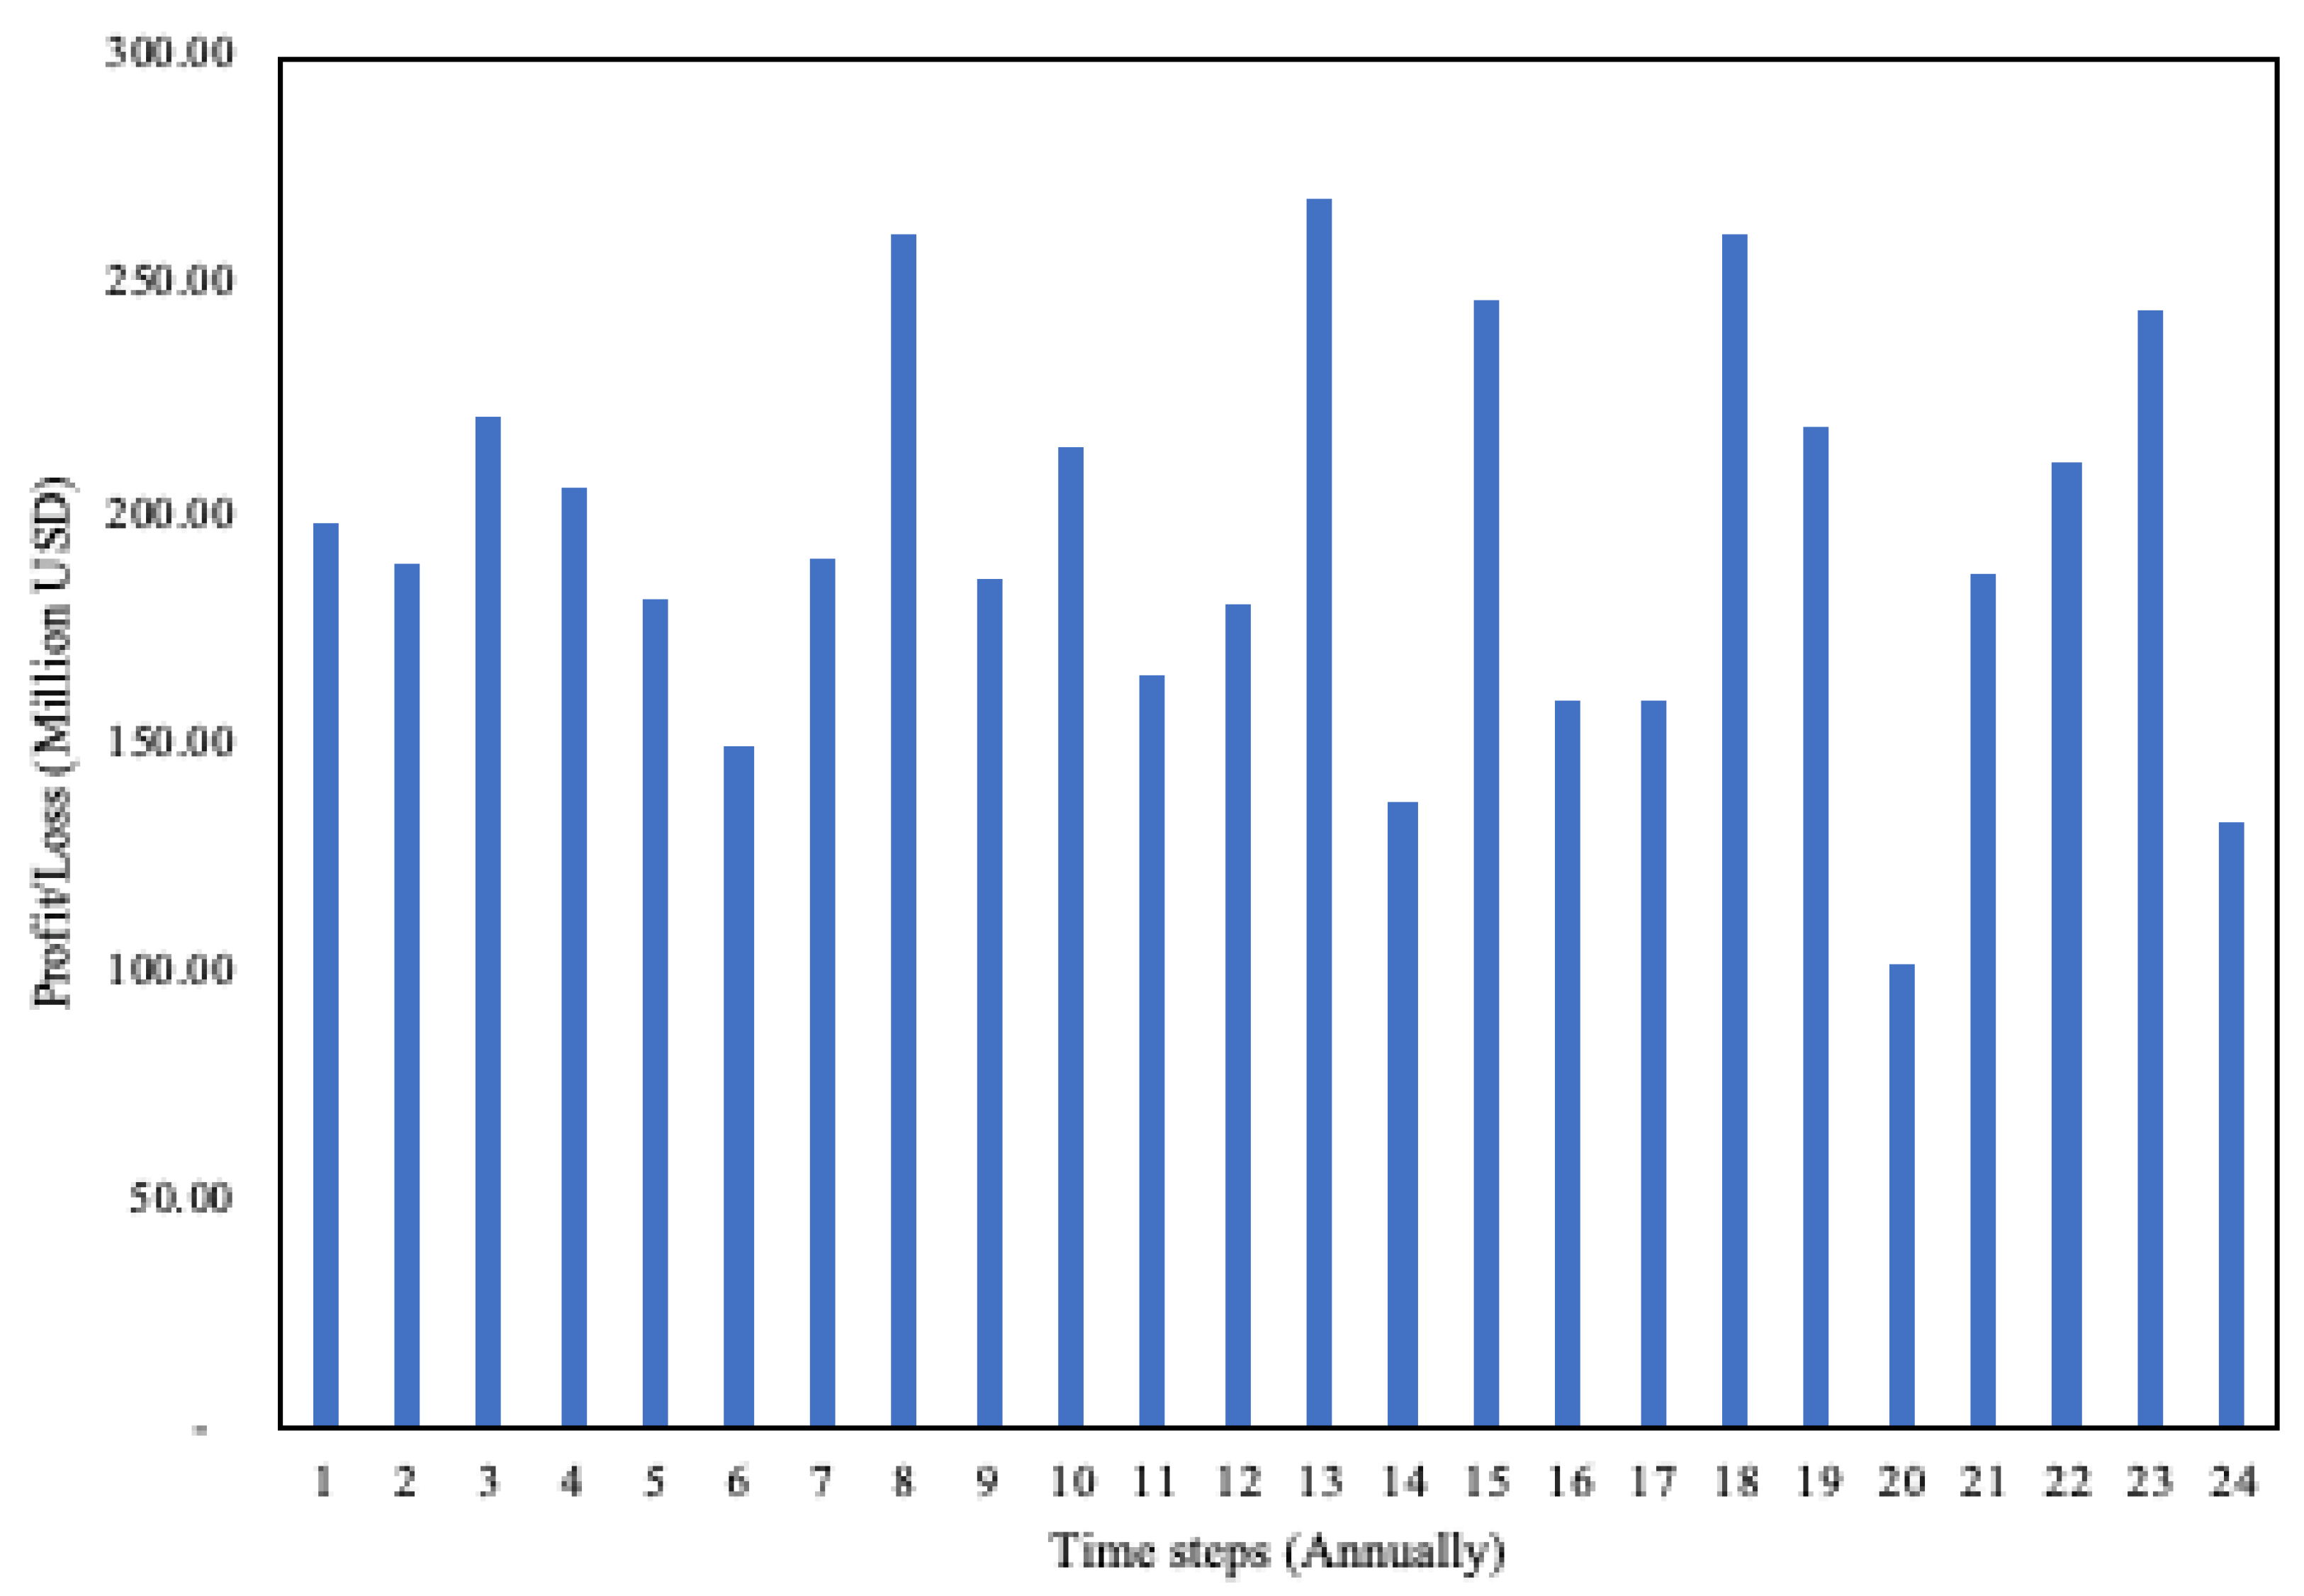
One hundred stochastic time-series simulation cash flow realisations were generated per configuration. One such realisation is presented in
Figure 8, illustrating the uncertainty in future cash flows for configuration BL–50 using SP–4 conditions.
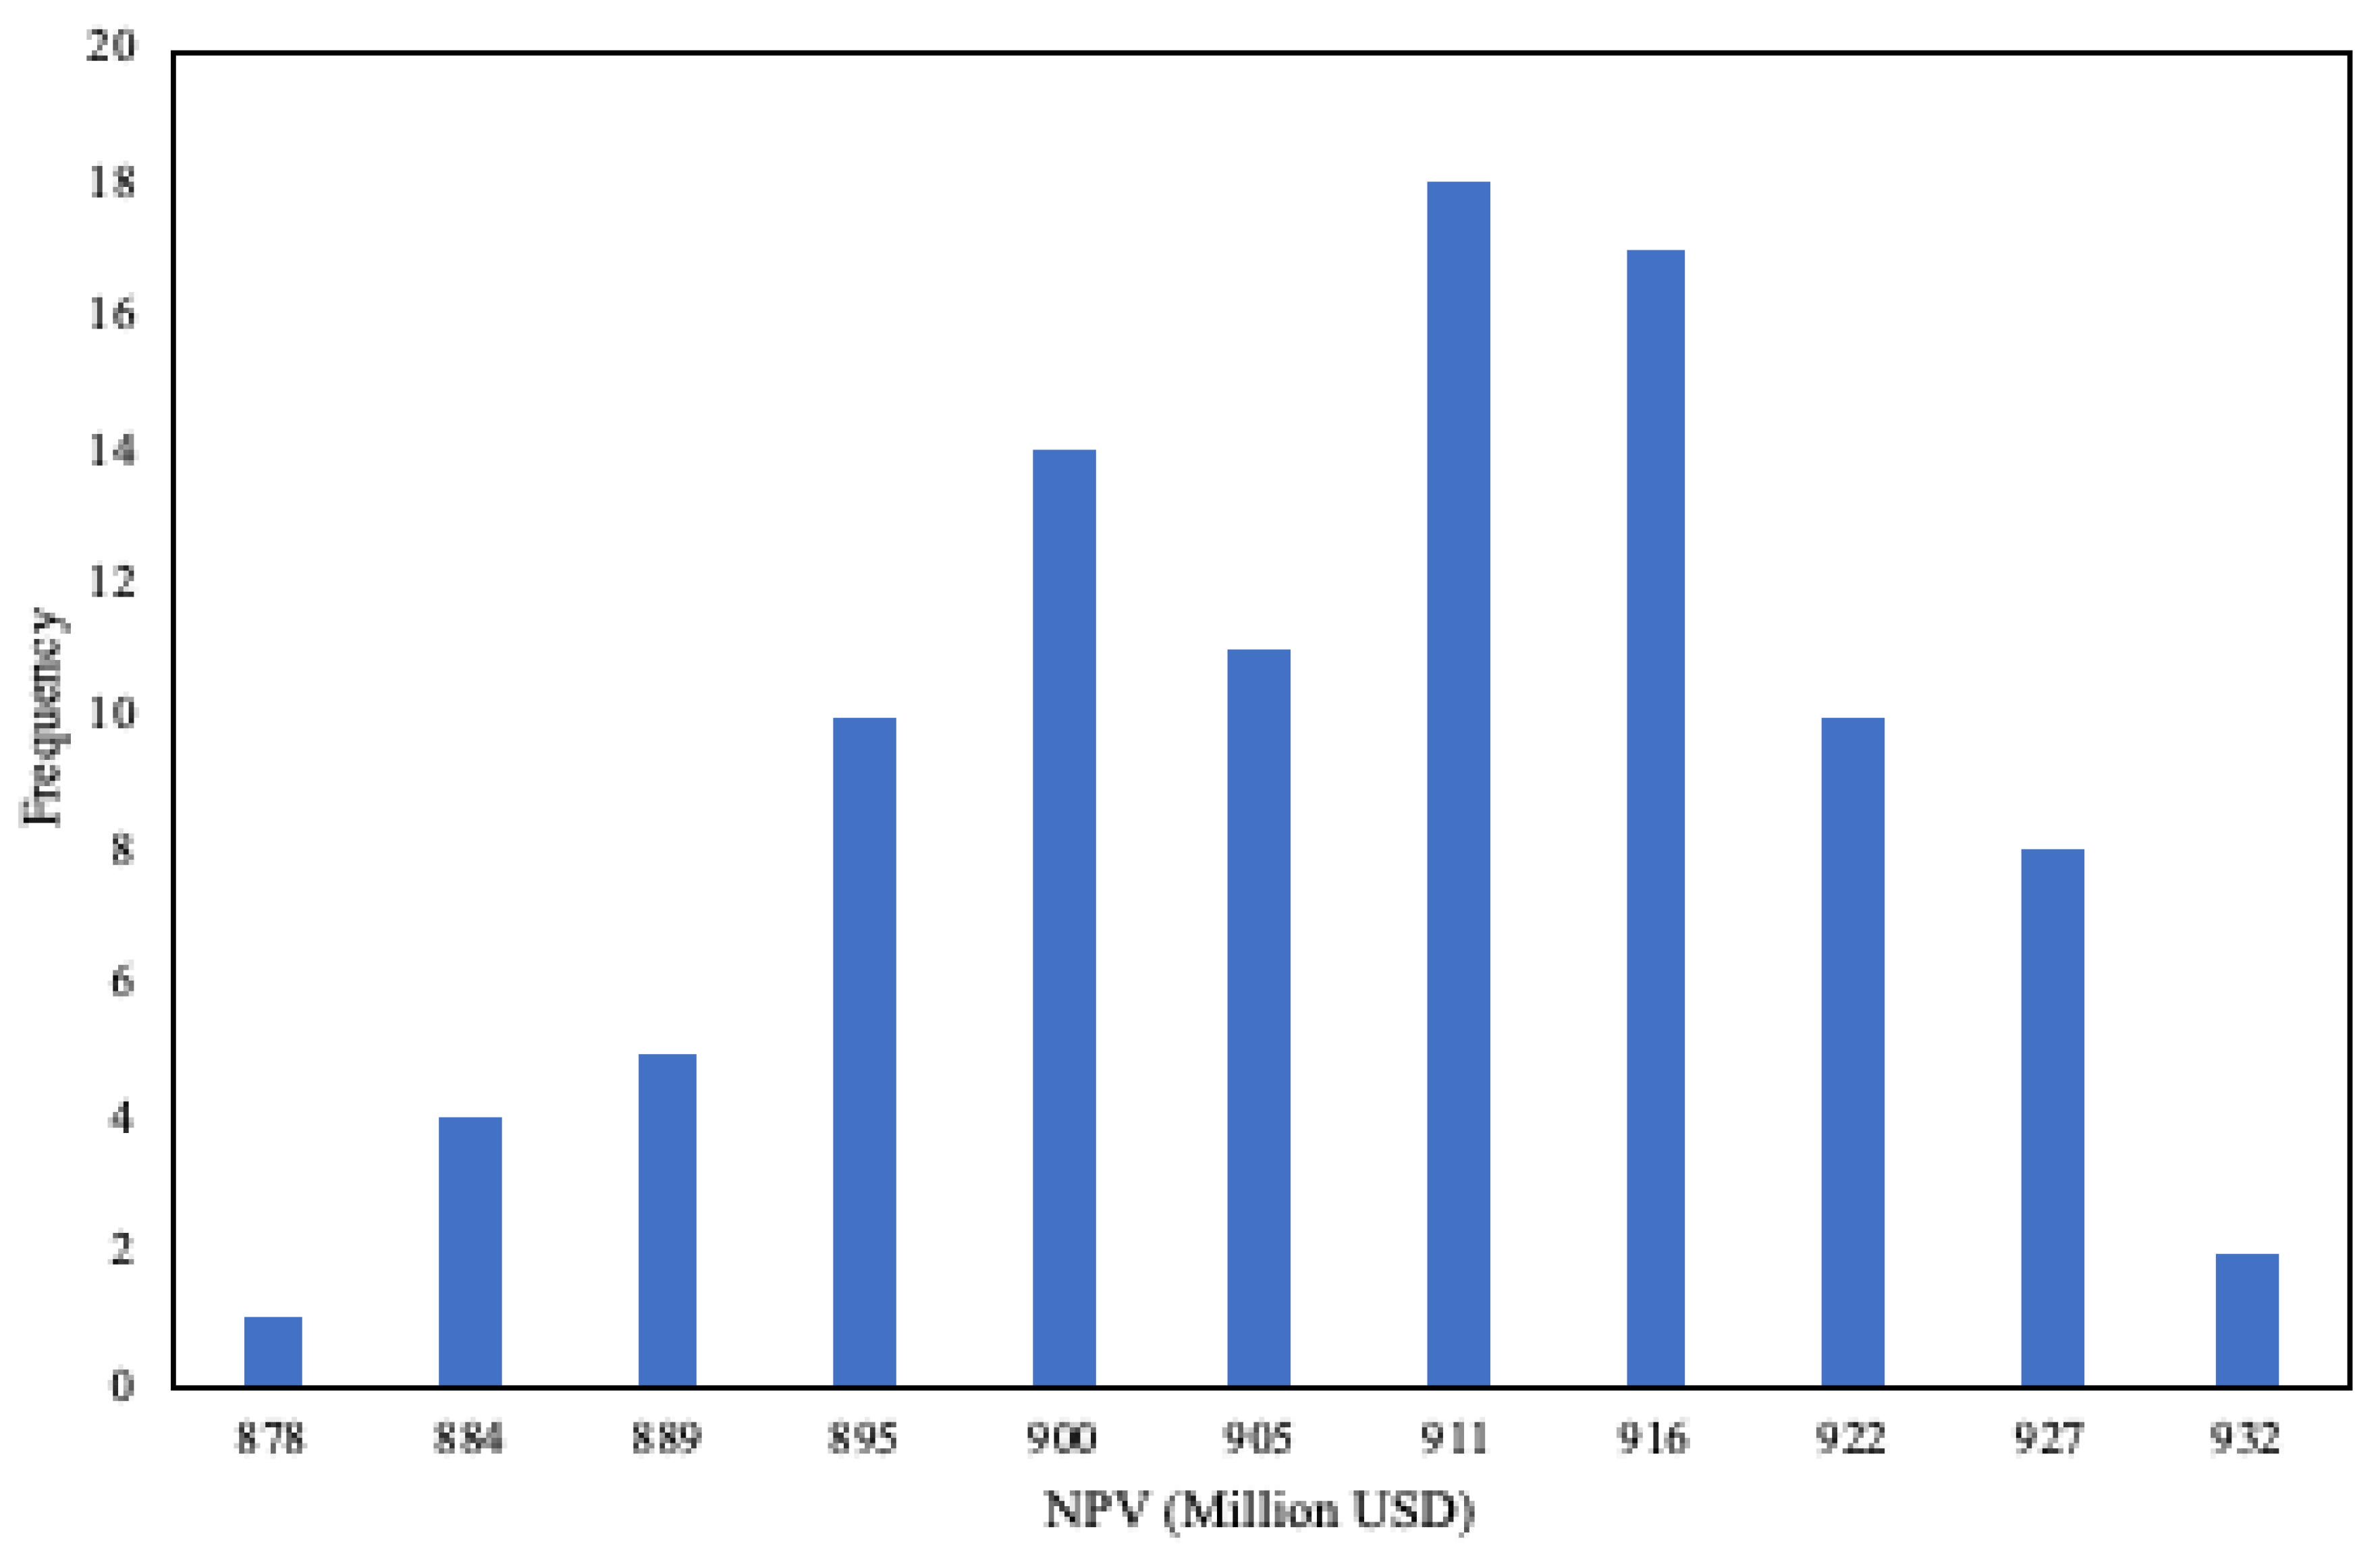
The discounted cash flow data determined the stochastic NPV for each configuration. A histogram for the stochastic NPV for EO–4 is presented in
Figure 9. Furthermore, the preliminary statistical results for all configurations in the stochastic environment are detailed in
Table 8. Based on the data, the mean stochastic NPV per configuration was used for the real options valuation.
The benefit of using principal component analysis is to improve the computational efficiency of the stochastic time-series simulation approach. This contrasts with the alternative approach of fitting the historical natural gas, CO
2, and electricity price data using time series models independently based on their statistical properties and further simulating them without the consideration of possible correlation structures in the data. Instead, in the proposed approach, the PC1 scores were simulated and back transformed to generate the NPV distribution, as illustrated in
Figure 9.
5.2. Real Options Analysis Results
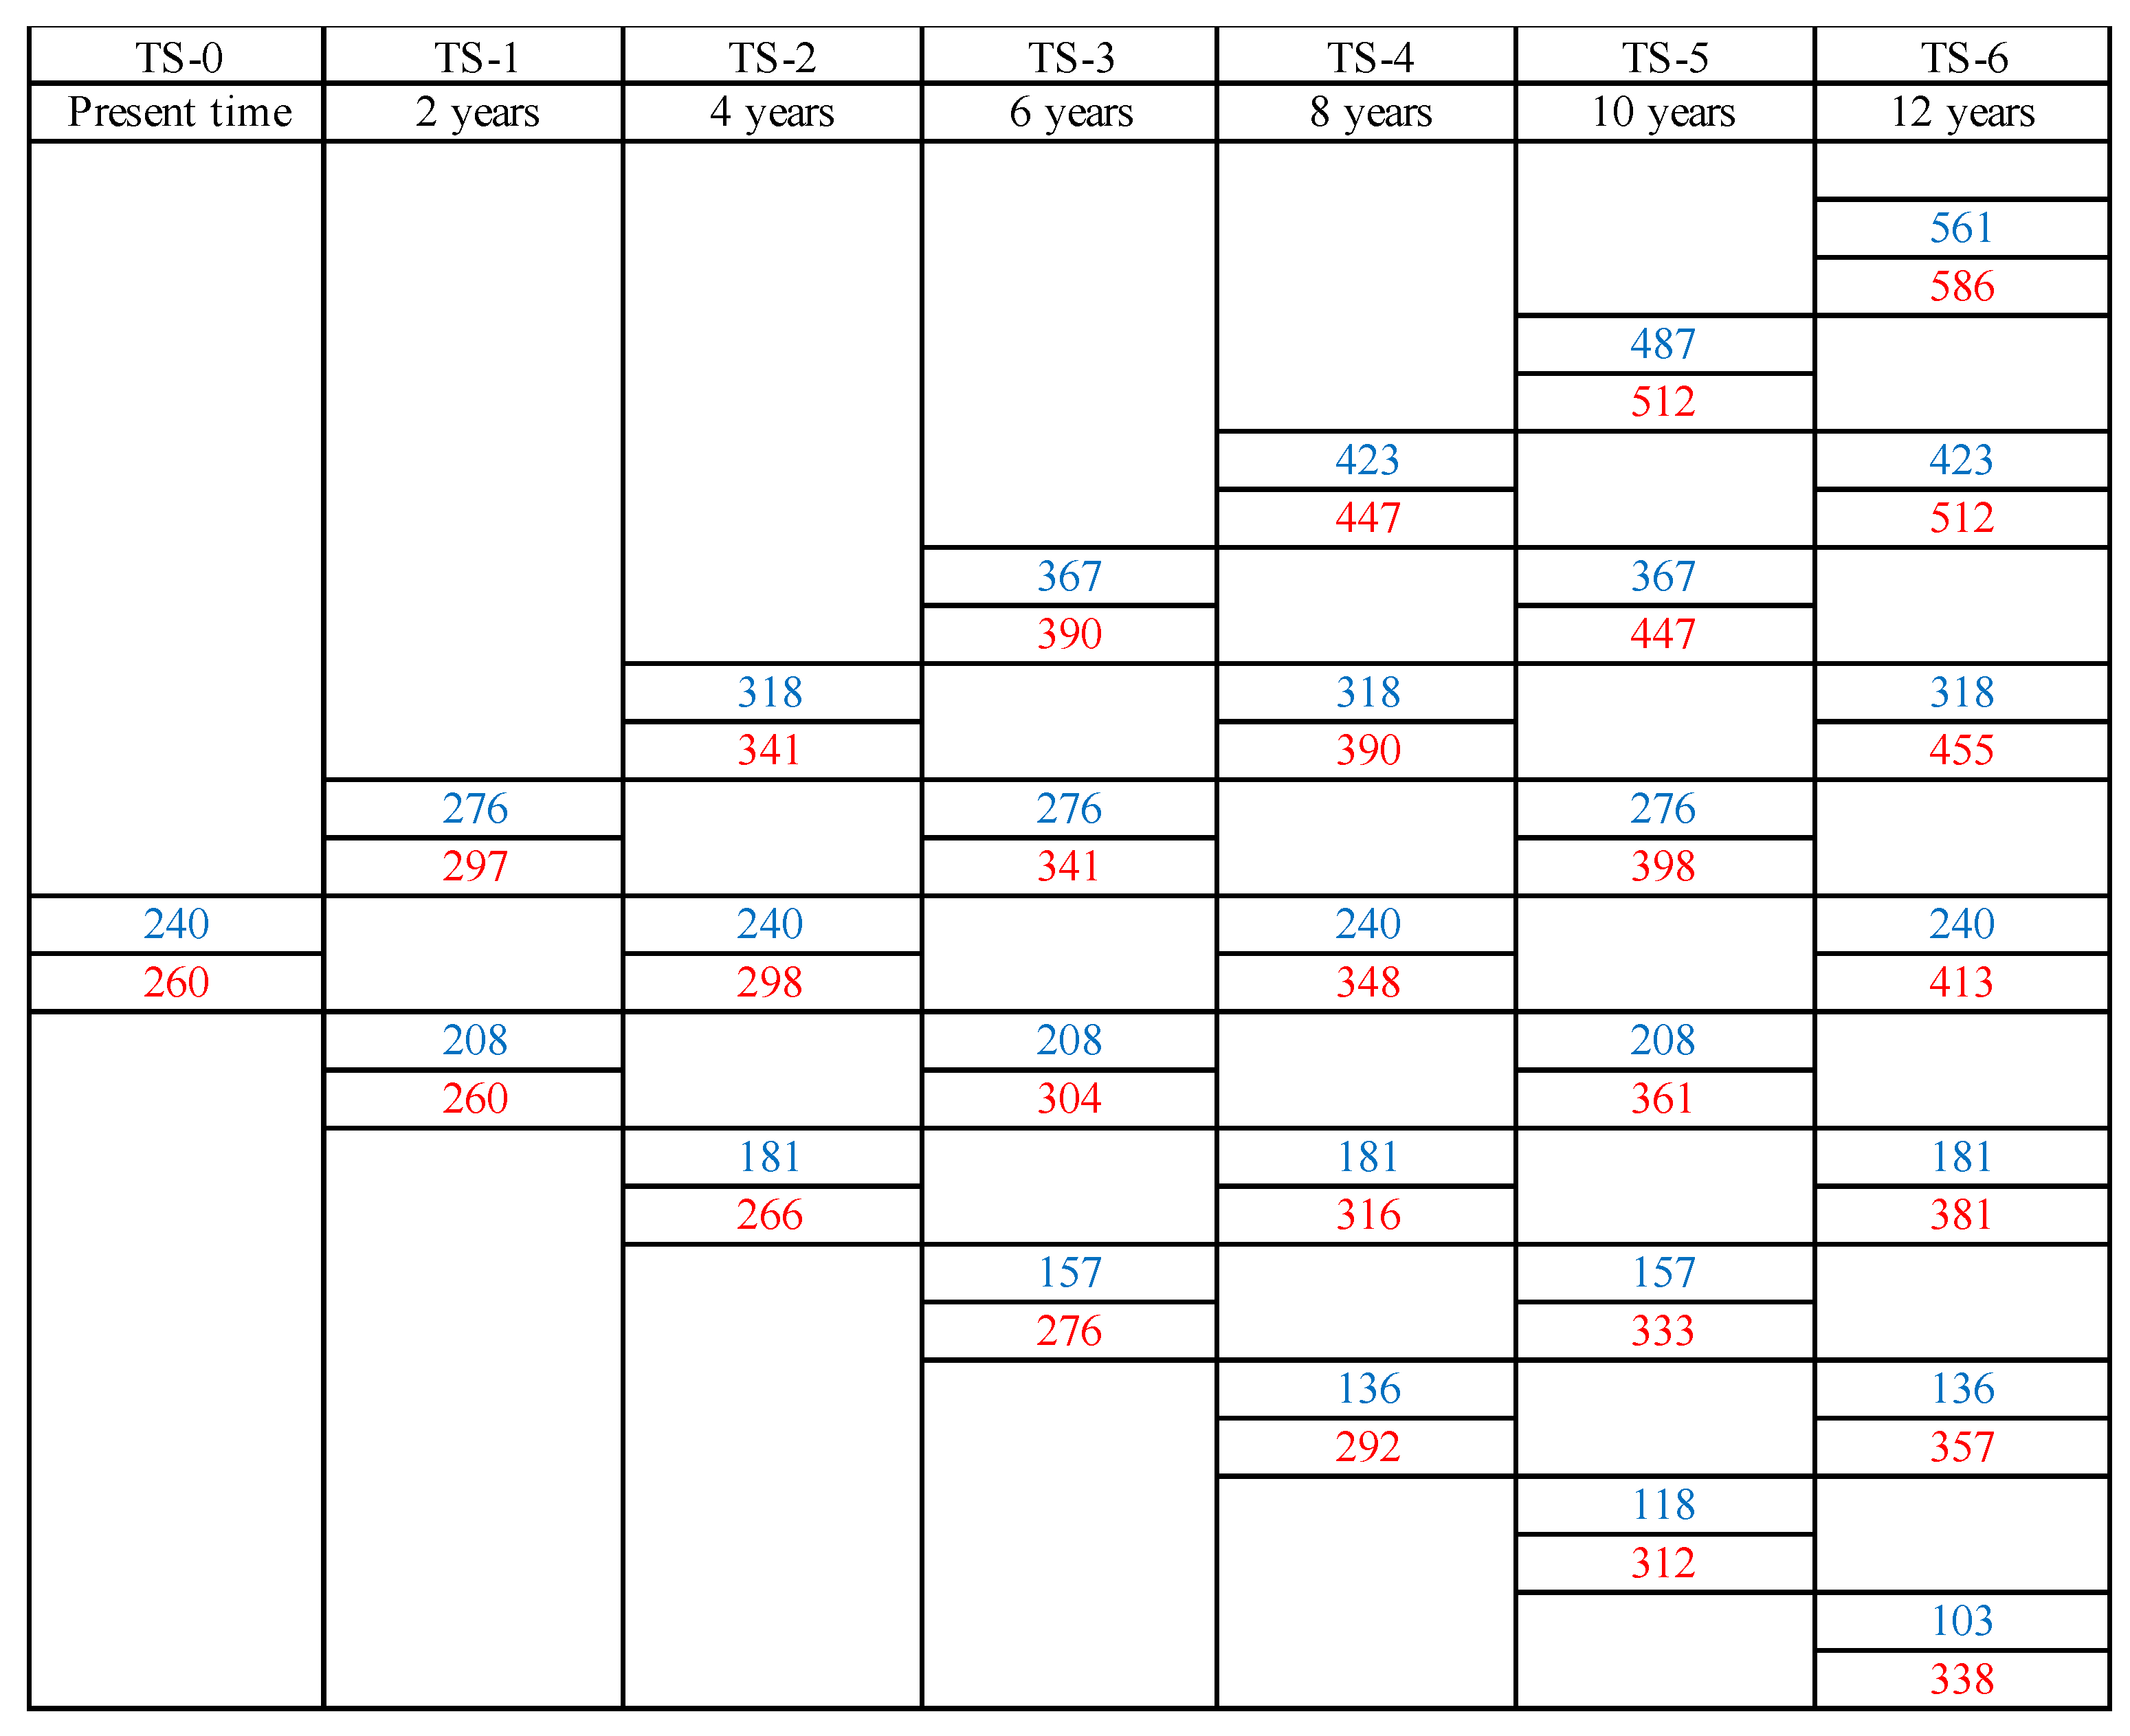
The binomial lattice trees were developed for all the different scenarios. The evolution of the baseline configuration for SC–1 (see
Figure 4) is shown in
Figure 10 for illustration purposes. Similarly, the evolution of the expansion configuration based on the highest future value of the baseline configuration is presented in
Figure 11. Low market volatility was assumed for an extended period, set at 10% for the tree evolution.
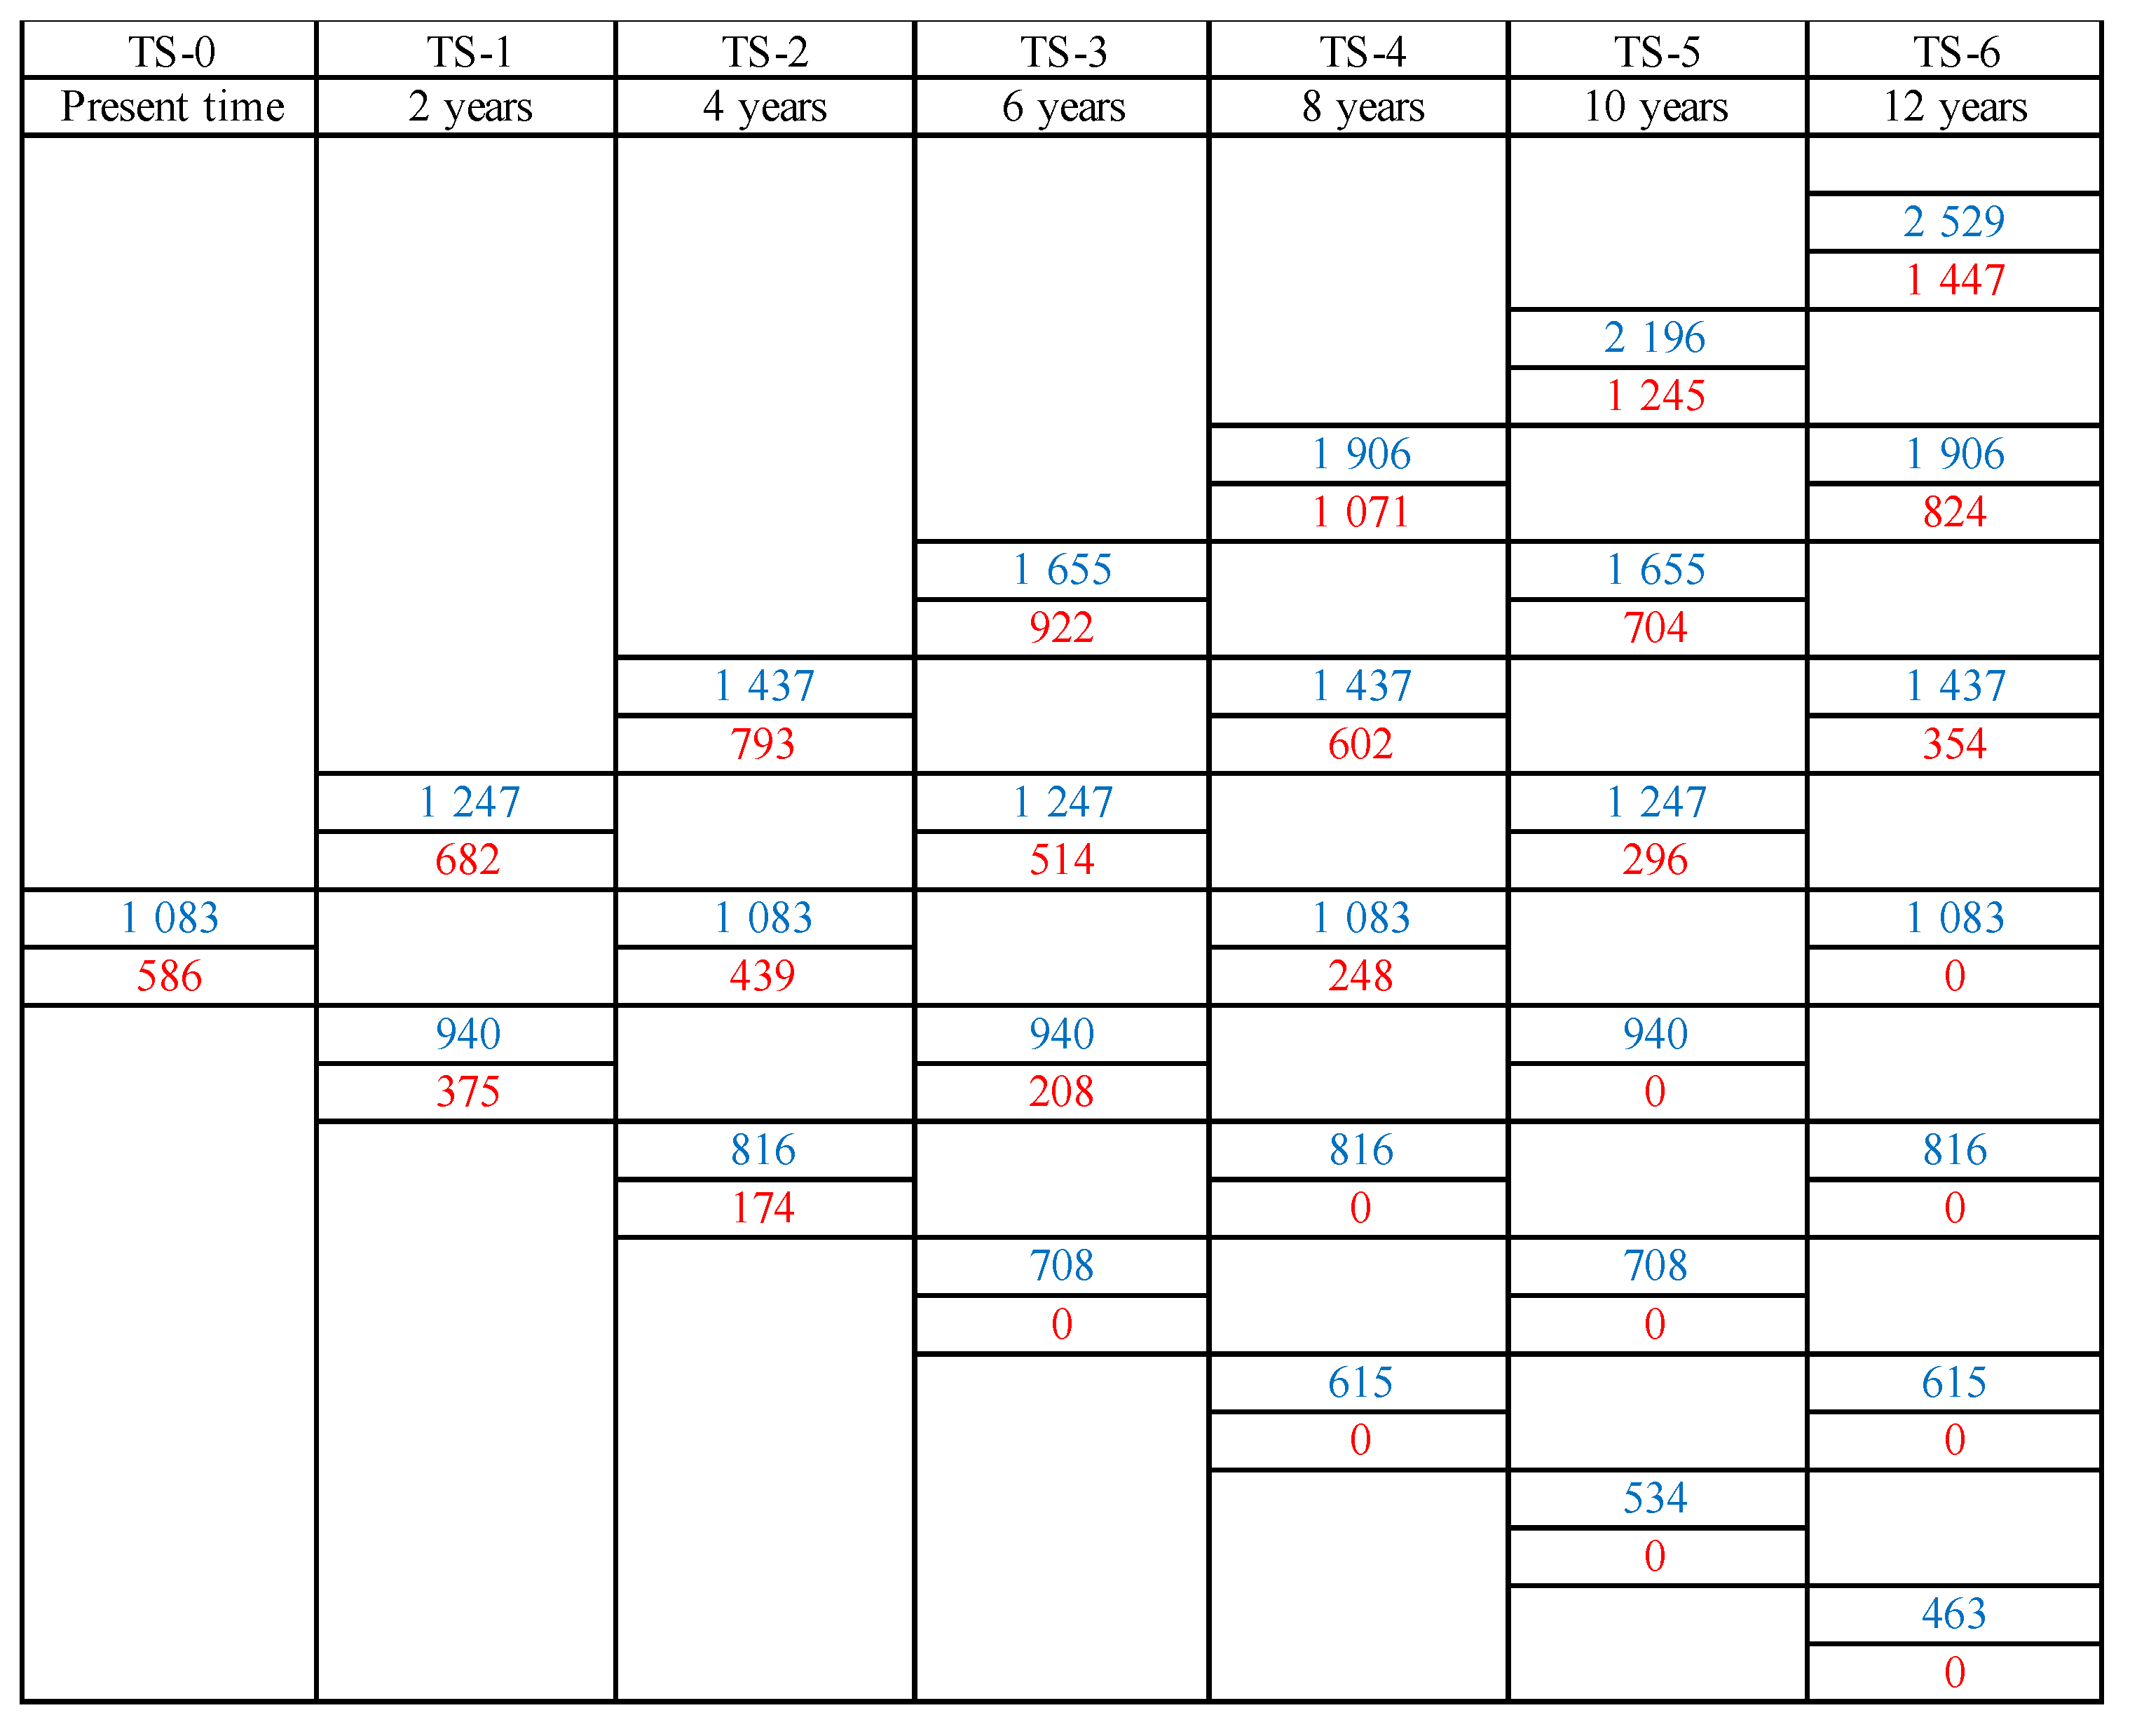
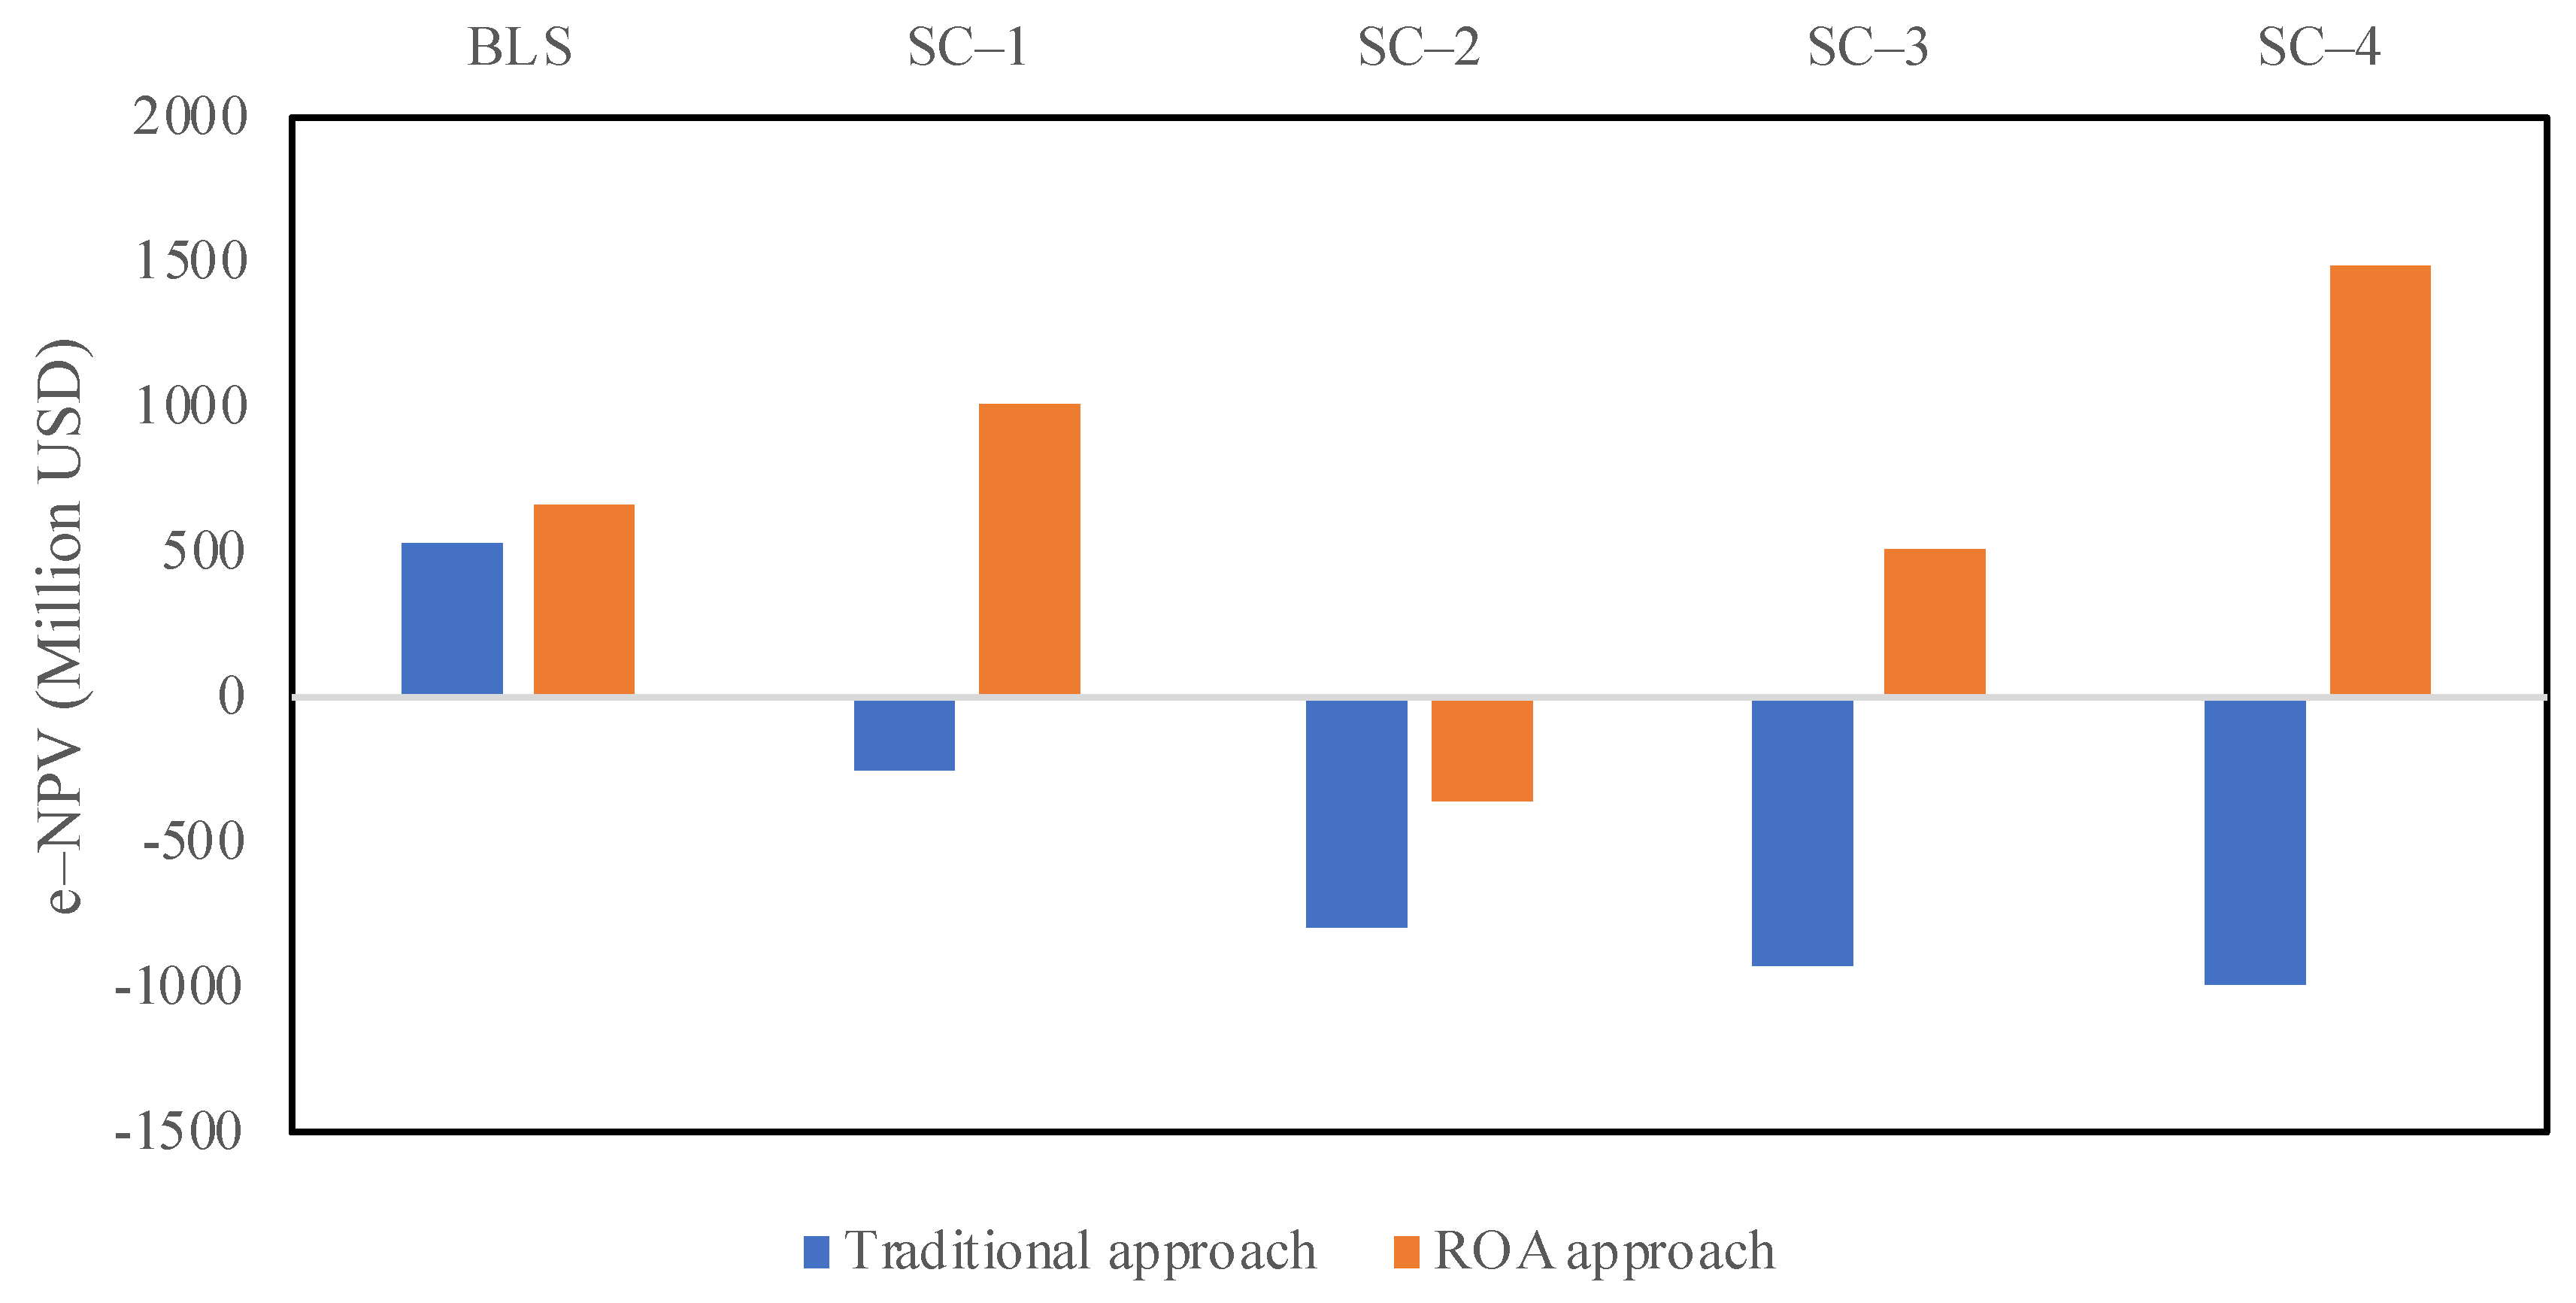
The results of comparative analyses between the traditional and ROA valuation methods is illustrated in
Figure 12 for the extended net present value (e–NPV), i.e., for all the four scenarios when compared to the baseline scenario (BLS) at 10% market volatility. The ROA approach improved the valuation for all the scenarios by: USD 0.13 billion for BLS; USD 1.27 billion for SC–1; USD 0.44 billion for SC–2; USD 1.45 billion for SC–3; and USD 2.49 billion for SC–4 (the values are indicative). It was noted that using traditional valuation approach only the baseline scenario BLS is feasible. In contrast, a staged valuation methodology using the ROA approach indicates that including a share of PV technology in the energy portfolio, even as high as 50% in scenario SC–4, that significantly adds to the CAPEX of the project, turns out to be highly feasible. This is because of three reasons: (a) adding PV technology in the energy portfolio is a valuable hedge against the negative impact of fuel and CO
2 price volatilities; (b) all the energy portfolio investment scenarios considered are spread across time (in two steps, for example, in this study) assumes staged plant capacity increase in-line with the expected rise in energy demand, thereby providing the expected revenues; and (c) allowing the spread of investment over time could have a greater potential to mitigate the risk of losses and positive net returns from the project. Moreover, such decisions based on risk-based models could also promote sustainable performance of energy investments.
It was also noted that all scenarios with PV share in the electricity mixture had positive e–NPV. In the case of SC–2, which is an expansion option using CCS technology, had a negative e–NPV owing to its combined exposure to high volatilities in natural gas and CO
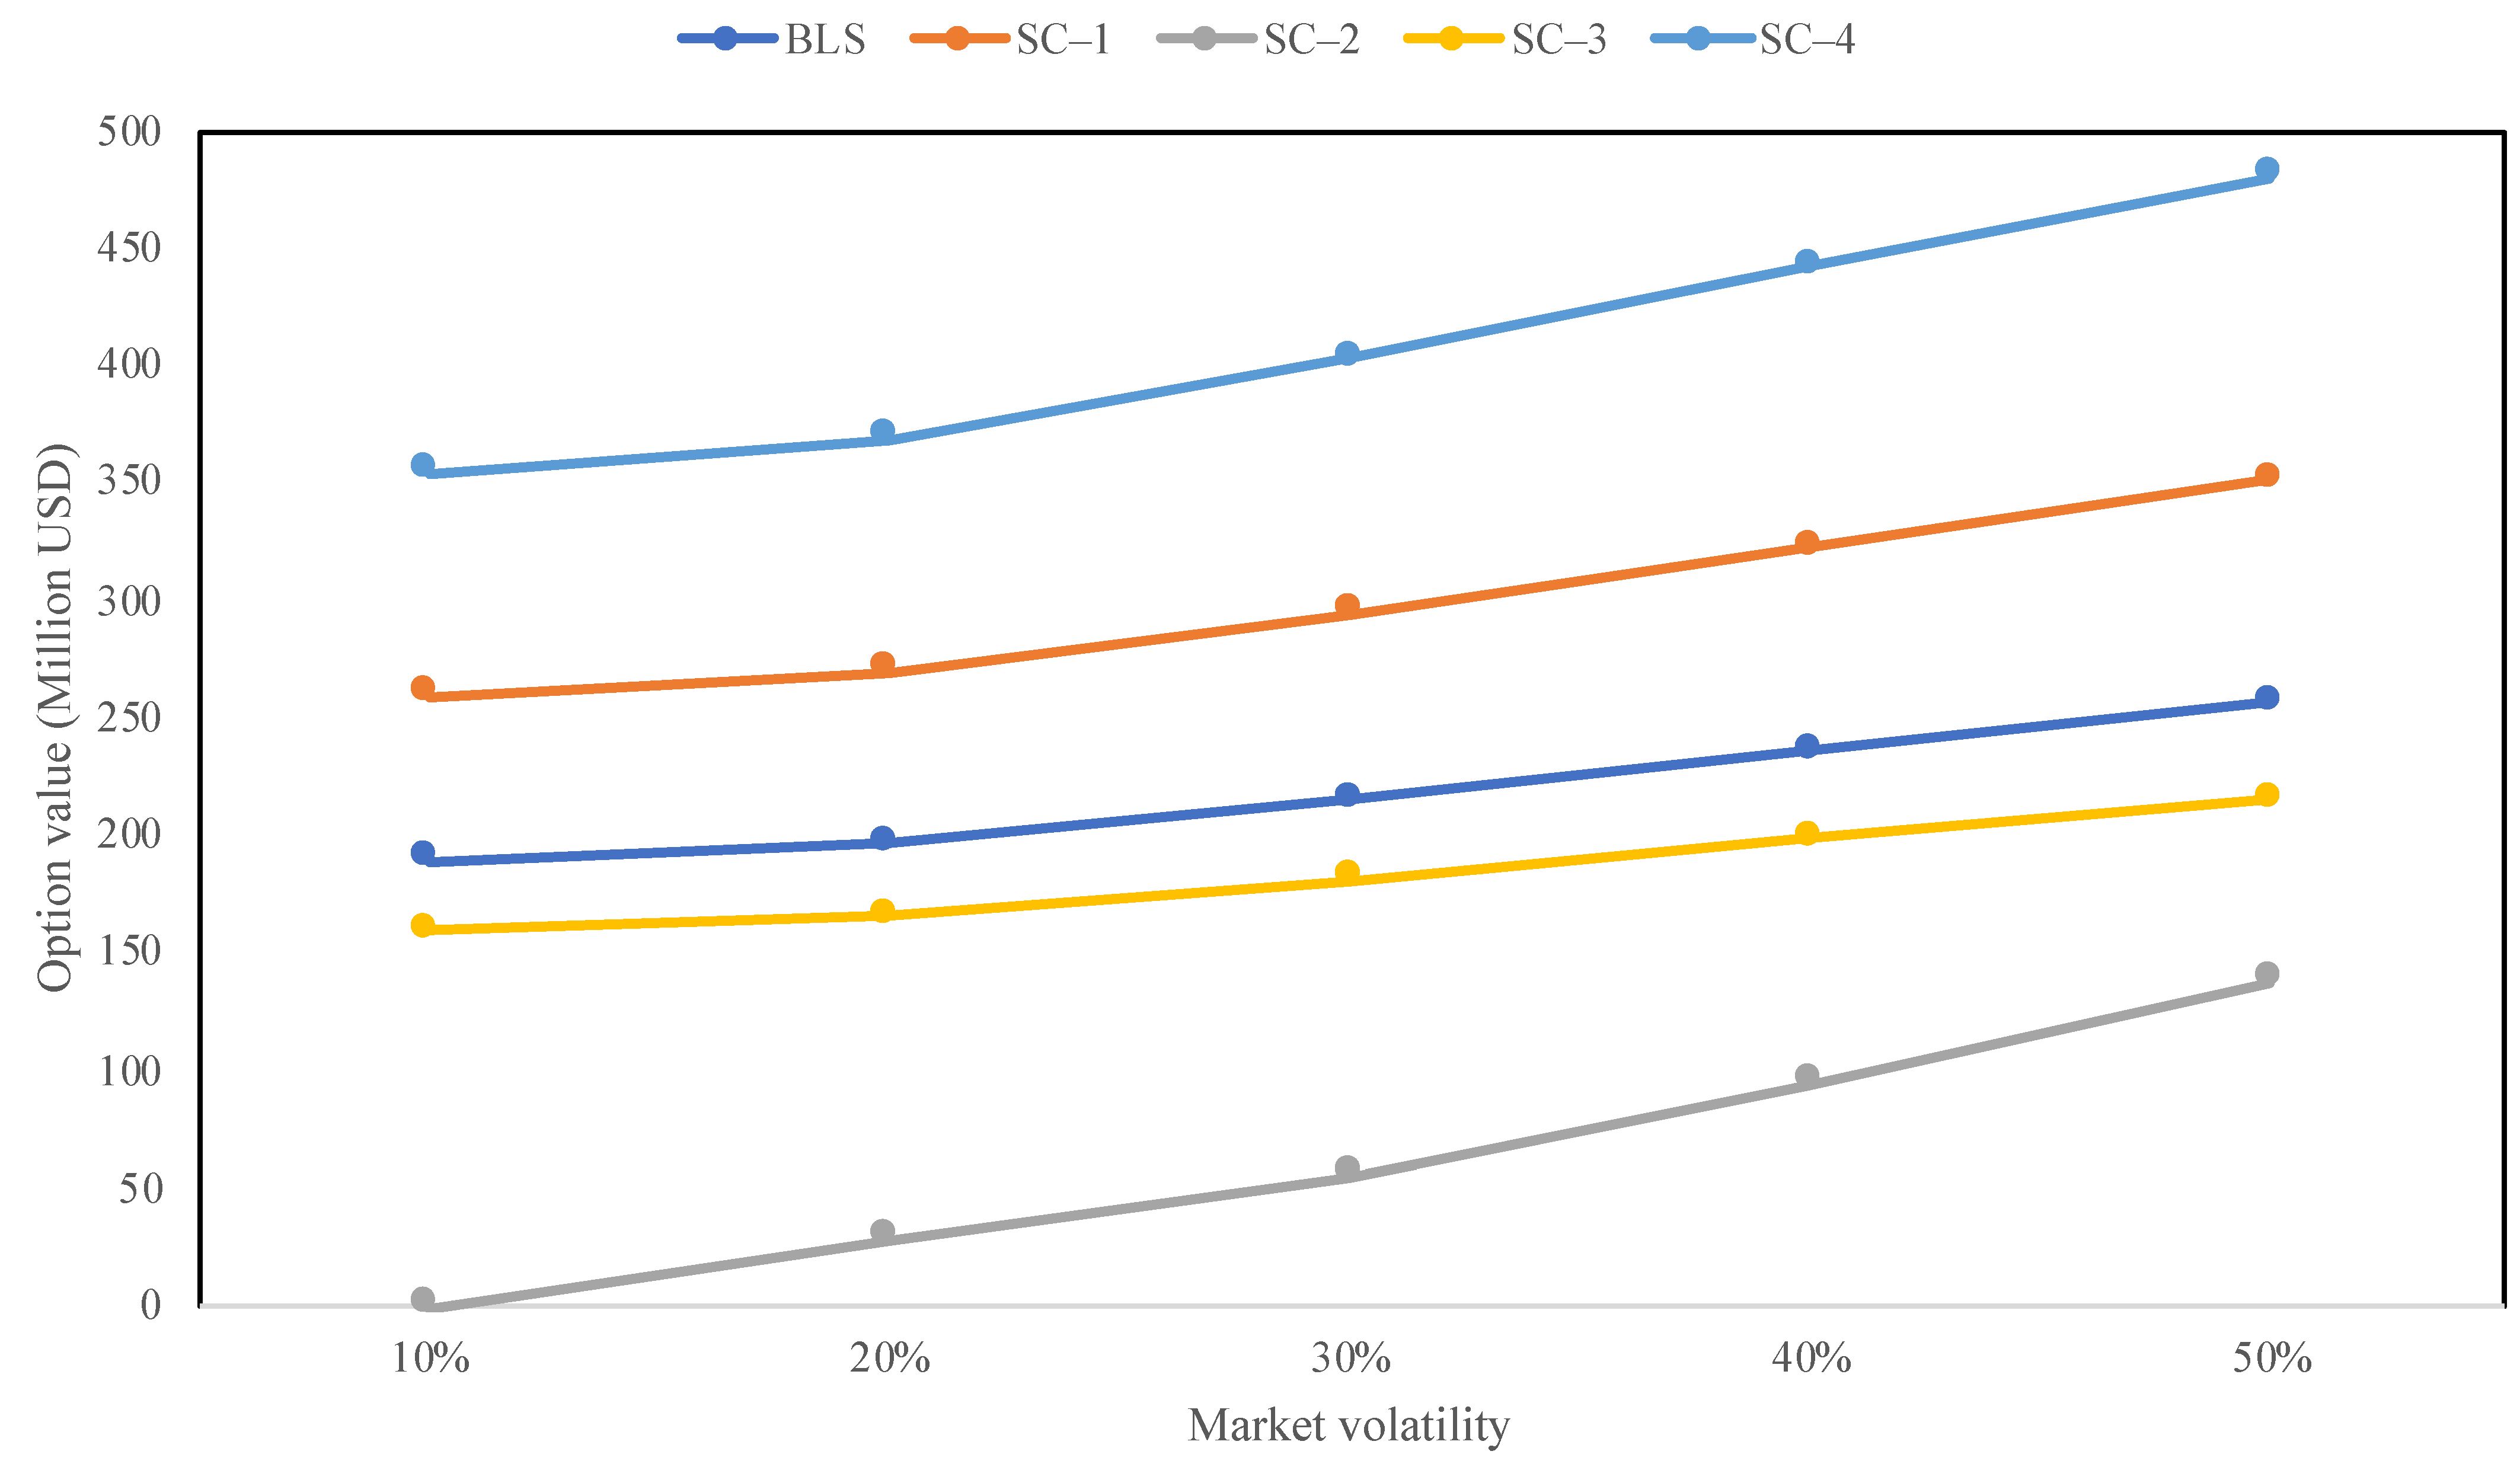
2 prices, which meant that this scenario was not feasible in these market conditions. However, scenario SC–3 which is also based on CCS includes PV technology as a hedging option against future market risks thereby giving a positive e–NPV. Meanwhile, scenarios SC–1 (portfolio including both CCGT and PV technologies) and SC–4 (only PV technology) were 53% and 124% higher than the baseline BLS. On the other hand, based on the assessments for sensitivity of option values to possible increase in future market volatility. As illustrated in
Figure 13, it is noted that for the assumed scenarios (BLS and SC–1 to SC–4), generally speaking, there is improvement in the long-term option values (e–NPV) with the increase in price volatilities.
Overall, the baseline scenario BLS is more favourable at the current average wholesale electricity price due to the lower capital cost and higher energy efficiency. However, in the future, as more renewable energy sources enter the electricity mix, the wholesale electricity price would increase to support the renewable energy transition together with the decrease in capital costs of PV technology the world is already witnessing today. The outcomes of the real options analyses from this study provides a useful indication in terms of planning on how and when expansion of the business-as-usual case for cogeneration in the Arabian Gulf region should be executed in a robust and sustainable manner to cater the growing global demand in the future.
6. Conclusions
Several low-carbon pathways are possible for power and freshwater cogeneration systems, including natural gas, carbon capture, and renewable energy technologies. This study applied the real options valuation for cogeneration systems’ planning and investment in the Arabian Gulf region based on three market risks: wholesale electricity, natural gas, and CO2 prices. A baseline scenario composed of conventional technologies was compared to four other scenarios consisting of a mixture of renewables and carbon capture technologies with different mix shares. Real options analysis (ROA) was conducted using multivariate principal components analysis (PCA) and stochastic time-series simulation to generate various realisations of future market conditions.
The ROA valuation results using a recombining binomial tree lattice method illustrate that while the baseline scenario’s net present value (NPV) was positive, the NPVs for some of the alternative configurations were more profitable in the long-term. Configurations mixed with PV technology were particularly favourable. Those configurations, that use the carbon capture and storage (CCS) technology, PV provides a useful long-term hedging option against future market risks thereby giving a positive extended NPV. Meanwhile, a comparison between scenarios considering portfolio with both CCGT and PV technology mix and that with only PV technology increased the baseline scenario value by 53% and 124%, respectively. This result reasserts that PV technology is potentially risk-free, although the right wholesale electricity price would be required, as its capital cost is significantly higher than that of the baseline technology, i.e., CCGT natural gas power plant.
Generally speaking, due to the higher capital costs for the expansion options considered, natural gas would continue to dominate the power generation sector until other technologies become more cost-effective. As such, the levelised costs of renewable energy sources must continue to decline for greater penetration in the future energy mix. In addition, the CO2 markets would also need to provide a forcing effect through the significant increase in CO2 prices from its current levels, since higher prices would undoubtedly accelerate the transition to low-carbon pathways, as seen from the sensitivity analysis.
The available time series dataset used in this study, including historical natural gas, CO2 and electricity prices, are currently limited in terms of both duration (10 years) and time resolution (monthly scales). As such, the study assesses the long-term benefits for project investment, and hence it was considered more beneficial to capture the relevant macro-features in the prices, including trends, seasonality, and anomalies (jumps), to perform real options analysis. On the other hand, it would still be considered insufficient for the accurate estimation of price volatilities, particularly in the wider investment field. Moreover, for the application of more modern approaches for project valuation and investment, such as machine learning and artificial intelligence tools that are becoming increasingly popular in the literature, extensive data would be required for the purposes of model selection, hypothesis testing, model training, validation of predictions, and their interpretation under possible energy policy scenarios that could arise in the future. In terms of the multivariate analytic approach that was adopted in this study, exhaustive test cases for the comparative analyses, e.g., with and without the application of the principal component analysis (PCA) technique, was not thus far conducted. Such investigations could provide further insight into the joint effect of multiple risk factors, and the relationship between their evolving correlation states and market conditions that are also dependent on the energy policies.
The binomial tree was applied as a real options analysis tool to assess only certain pre-defined energy portfolios in this study. This is a limitation considering the possibility of greater flexibility and synergy of cogeneration systems. Future work will investigate the optimisation of energy portfolio mixes and the timing of their investment to potentially improve the profitability of project expansions under the same multidimensional risk conditions. The proposed methodology, however, could consider any additional sources of risk, such as the wholesale freshwater prices and the impact of future introduction of hydrogen energy for large-scale utility applications.
Author Contributions
Conceptualization, H.A.-O., R.G and T.A.-A.; methodology, H.A.-O. and R.G.; software, H.A.-O. and R.G.; validation, H.A.-O., R.G. and T.A.-A.; data curation, H.A.-O.; formal analysis, H.A.-O. and R.G.; writing—original draft preparation, H.A.-O.; writing—review and editing, R.G. and T.A.-A.; visualization, H.A.-O.; supervision, T.A.-A. All authors have read and agreed to the published version of the manuscript.
Funding
This research received no external funding.
Institutional Review Board Statement
Not applicable.
Informed Consent Statement
Not applicable.
Data Availability Statement
No new data were created or analysed in this study. Data sharing is not applicable to this article.
Acknowledgments
The authors acknowledge the support provided by Hamad Bin Khalifa University, Qatar Foundation for supporting this research.
Conflicts of Interest
This research did not receive any specific grant from funding agencies in the public, commercial, or not-for-profit sectors. The authors declare no conflict of interest.
References
- Jäger-Waldau, A.; Kougias, I.; Taylor, N.; Thiel, C. How Photovoltaics Can Contribute to GHG Emission Reductions of 55% in the EU by 2030. Renew. Sustain. Energy Rev. 2020, 126, 109836. [Google Scholar] [CrossRef]
- IEA Germany 2020-Energy Policy Review; IEA: Paris, France, 2020.
- Boretti, A.; Rosa, L. Reassessing the Projections of the World Water Development Report. npj Clean Water 2019, 2, 15. [Google Scholar] [CrossRef] [Green Version]
- Khawaji, A.D.; Kutubkhanah, I.K.; Wie, J.-M. Advances in Seawater Desalination Technologies. Desalination 2008, 221, 47–69. [Google Scholar] [CrossRef]
- Jones, E.; Qadir, M.; van Vliet, M.T.H.; Smakhtin, V.; Kang, S. The State of Desalination and Brine Production: A Global Outlook. Sci. Total Environ. 2019, 657, 1343–1356. [Google Scholar] [CrossRef]
- Al-Obaidli, H.; Namany, S.; Govindan, R.; Al-Ansari, T. System-Level Optimisation of Combined Power and Desalting Plants. Comput. Aided Chem. Eng. 2019, 46, 1699–1704. [Google Scholar] [CrossRef]
- Al-Obaidli, H.; Bicer, Y.; Al-Ansari, T. Performance Comparison of a Natural Gas and Renewable-Based Power and Desalination System for Polygeneration. Greenh. Gases Sci. Technol. 2020, 10, 678–702. [Google Scholar] [CrossRef]
- DEG Desalination in the GCC: The History, the Present & the Future. Available online: https://www.gcc-sg.org (accessed on 27 June 2021).
- Mayer, C.; Breun, P.; Schultmann, F. Considering Risks in Early Stage Investment Planning for Emission Abatement Technologies in Large Combustion Plants. J. Clean. Prod. 2017, 142, 133–144. [Google Scholar] [CrossRef]
- Cruz Rambaud, S.; Sánchez Pérez, A.M. The Option to Expand a Project: Its Assessment with the Binomial Options Pricing Model. Oper. Res. Perspect. 2017, 4, 12–20. [Google Scholar] [CrossRef]
- Al-Obaidli, H.; Govindan, R.; Al-Ansari, T. Statistical Decision-Theoretic Risk Management for Planning Renewable Energy Pathways. Comput. Aided Chem. Eng. 2021, 50, 1795–1801. [Google Scholar] [CrossRef]
- Lai, C.S.; Locatelli, G. Valuing the Option to Prototype: A Case Study with Generation Integrated Energy Storage. Energy 2021, 217, 119290. [Google Scholar] [CrossRef]
- Pringles, R.; Olsina, F.; Penizzotto, F. Valuation of Defer and Relocation Options in Photovoltaic Generation Investments by a Stochastic Simulation-Based Method. Renew. Energy 2020, 151, 846–864. [Google Scholar] [CrossRef]
- Agaton, C.B.; Guno, C.S.; Villanueva, R.O.; Villanueva, R.O. Economic Analysis of Waste-to-Energy Investment in the Philippines: A Real Options Approach. Appl. Energy 2020, 275, 115265. [Google Scholar] [CrossRef]
- Rios, D.; Blanco, G.; Olsina, F. Integrating Real Options Analysis with Long-Term Electricity Market Models. Energy Econ. 2019, 80, 188–205. [Google Scholar] [CrossRef]
- Glensk, B.; Madlener, R. The Value of Enhanced Flexibility of Gas-Fired Power Plants: A Real Options Analysis. Appl. Energy 2019, 251, 113125. [Google Scholar] [CrossRef]
- Čulík, M. Real Options Valuation with Changing Volatility. Perspect. Sci. 2016, 7, 10–18. [Google Scholar] [CrossRef] [Green Version]
- Siddiqui, A.; Fleten, S.-E. How to Proceed with Competing Alternative Energy Technologies: A Real Options Analysis. Energy Econ. 2010, 32, 817–830. [Google Scholar] [CrossRef] [Green Version]
- Pless, J.; Arent, D.J.; Logan, J.; Cochran, J.; Zinaman, O. Quantifying the Value of Investing in Distributed Natural Gas and Renewable Electricity Systems as Complements: Applications of Discounted Cash Flow and Real Options Analysis with Stochastic Inputs. Energy Policy 2016, 97, 378–390. [Google Scholar] [CrossRef] [Green Version]
- Elias, R.S.; Wahab, M.I.M.; Fang, L. Retrofitting Carbon Capture and Storage to Natural Gas-Fired Power Plants: A Real-Options Approach. J. Clean. Prod. 2018, 192, 722–734. [Google Scholar] [CrossRef]
- Zhang, M.M.; Wang, Q.; Zhou, D.; Ding, H. Evaluating Uncertain Investment Decisions in Low-Carbon Transition toward Renewable Energy. Appl. Energy 2019, 240, 1049–1060. [Google Scholar] [CrossRef]
- Di Bari, A. A Real Options Approach to Valuate Solar Energy Investment with Public Authority Incentives: The Italian Case. Energies 2020, 13, 4181. [Google Scholar] [CrossRef]
- Das Gupta, S. Using Real Options to Value Capacity Additions and Investment Expenditures in Renewable Energies in India. Energy Policy 2021, 148, 111916. [Google Scholar] [CrossRef]
- Sowinski, J. Application of Real Options Approach to Analyse Economic Efficiency of Power Plant with CCS Installation under Uncertainty. Energies 2022, 15, 1050. [Google Scholar] [CrossRef]
- EIA Wholesale Electricity and Natural Gas Market Data. Available online: http://www.eia.gov (accessed on 27 June 2021).
- EMBER Daily EU ETS Carbon Market Price (Euros). Available online: http://www.ember-climate.org (accessed on 27 June 2021).
- EIA Electricity Net Generation: Electric Power Sector. Available online: http://www.eia.gov (accessed on 29 July 2021).
- Clewlow, L.; Strickland, C. Implementing Derivatives Models; John Wiley & Sons, Inc.: Hoboken, NJ, USA, 1998; ISBN 978-0-471-96651-7. [Google Scholar]
- Sutton, R.S.; Barto, A.G. Reinforcement Learning: An Introduction, 2nd ed.; The MIT Press: Cambridge, MA, USA, 2018; ISBN 978-0-262-19398-6. [Google Scholar]
- Mun, J. Real Options Analysis: Tools and Techniques for Valuing Strategic Investments and Decisions; John Wiley & Sons, Inc.: Hoboken, NJ, USA, 2002; ISBN 0-471-25696-X. [Google Scholar]
- Ihm, S.; Al-Najdi, O.Y.; Hamed, O.A.; Jun, G.; Chung, H. Energy Cost Comparison between MSF, MED and SWRO: Case Studies for Dual Purpose Plants. Desalination 2016, 397, 116–125. [Google Scholar] [CrossRef]
- EIA Electric Power Monthly. Available online: http://www.eia.gov (accessed on 14 July 2021).
- Leung, D.Y.C.; Caramanna, G.; Maroto-Valer, M.M. An Overview of Current Status of Carbon Dioxide Capture and Storage Technologies. Renew. Sustain. Energy Rev. 2014, 39, 426–443. [Google Scholar] [CrossRef] [Green Version]
- EIA Capital Cost and Performance Characteristic Estimates for Utility Scale Electric Power Generating Technologies. Available online: http://www.eia.gov (accessed on 18 July 2021).
- WBG The Role of Desalination in an Increasingly Water-Scarce World; WBG: Washington, DC, USA, 2019.
- Schwabe, K.; Nemati, M.; Landry, C.; Zimmerman, G. Water Markets in the Western United States: Trends and Opportunities. Water 2020, 12, 233. [Google Scholar] [CrossRef] [Green Version]
Figure 1.
Monthly average wholesale electricity, natural gas, and carbon market prices from January 2011 to December 2020.
Figure 1.
Monthly average wholesale electricity, natural gas, and carbon market prices from January 2011 to December 2020.
Figure 3.
A flowchart depicting the multidimensional risk-based valuation methodology for the cogeneration system configurations assumed in this study.
Figure 3.
A flowchart depicting the multidimensional risk-based valuation methodology for the cogeneration system configurations assumed in this study.
Figure 4.
Baseline and expansion options scenarios.
Figure 4.
Baseline and expansion options scenarios.
Figure 5.
A single realisation of wholesale electricity price simulation.
Figure 5.
A single realisation of wholesale electricity price simulation.
Figure 6.
A single realisation of natural gas price simulation.
Figure 6.
A single realisation of natural gas price simulation.
Figure 7.
A single realisation of CO2 price simulation.
Figure 7.
A single realisation of CO2 price simulation.
Figure 8.
A single realisation of the cash flow series for baseline configuration BL–50.
Figure 8.
A single realisation of the cash flow series for baseline configuration BL–50.
Figure 9.
Stochastic NPV distribution of expansion option EO–4.
Figure 9.
Stochastic NPV distribution of expansion option EO–4.
Figure 10.
Binomial lattice model of SC–1 baseline configuration (Million USD).
Figure 10.
Binomial lattice model of SC–1 baseline configuration (Million USD).
Figure 11.
Binomial lattice model for the highest future value node of SC–1 expansion configuration (Million USD).
Figure 11.
Binomial lattice model for the highest future value node of SC–1 expansion configuration (Million USD).
Figure 12.
Comparative analysis of extended net present value (e–NPV) using both traditional and ROA approaches.
Figure 12.
Comparative analysis of extended net present value (e–NPV) using both traditional and ROA approaches.
Figure 13.
Option value sensitivity to increased market volatility.
Figure 13.
Option value sensitivity to increased market volatility.
Table 1.
Comparative summary of valuation methodologies for the transition towards low-carbon energy based on the Real Options Framework.
Table 1.
Comparative summary of valuation methodologies for the transition towards low-carbon energy based on the Real Options Framework.
| Research/Study | Objective | Contribution | Limitation |
|---|
| Siddiqui and Fleten (2010) [18] | Evaluation of investment timing and value of deploying unconventional energy technologies (UET) and/or renewable energy considering different switching options. The stochastic variables considered were UET O and M cost and the electricity price. | Incorporating an enhancement step to include unconventional energy technology that reduces the operation costs, which are uncertain. | The operation of renewable energy and unconventional energy systems are assumed to be mutually exclusive, hence there exists a possible limitation in terms of potential investment value from a portfolio of shared energy systems. |
| Pless et al. (2016) [19] | Quantification of investment value of hybrid natural gas and variable renewable energy systems in contrast to single-technology options. The stochastic variable considered was the natural gas price. | Evaluation of hybrid natural gas and renewable energy portfolios for project-level business case studies with the consideration of technology performance and operational risk profiles at hourly timescales. | The consideration of scaling-up of valuation method from residential to commercial applications. |
| Elias et al. (2018) [20] | Evaluation of investment value of retrofitting carbon capture technologies to existing natural gas-fired power plants, such as oxyfuel combustion and post-combustion capture, based on the ‘clean-spark spread’ approach. The stochastic variables considered were the natural gas price and electricity price. | Comparative evaluation between retrofitting CCS technologies with natural gas plants based on techno-economic conditions. | The cost assumed for storage and transportation of captured CO2 does not consider the location, e.g., transportation via pipeline or shipping. The cost also assumes a constant CO2 tax as the emission reduction policy. |
| Zhang et al. (2019) [21] | Evaluation of investment timing and value for the low-carbon transition of a coal-fired power plant into PV technology. The stochastic variables considered were the coal price, CO2 price, PV investment cost, and the electricity price. | Development of a complex model for investment decisions at microcosmic scales, i.e., for enterprise and project levels. | The choice of pre-defined alternative renewable energy systems; the study also lacks the consideration of power generation efficiency of these systems. |
| Di Bari (2020) [22] | Valuation of solar energy (PV) investment considering uncertainties due to meteorological/geographical, economic and political factors. | Valuation based on merging of the climatic, tax and political aspects of PV projects. | The consideration of PV panels’ profitability on the basis of different manufacturing characteristics, such as efficiency, material, and value of money. |
| Das Gupta (2021) [23] | Evaluation of optimal investment timing and value for solar and wind penetration into coal-based energy markets. The stochastic variable considered was the coal price. | Finding the value of policies for capacity additions and research expenditures for solar and wind technologies, including the determination of trigger price for investment. | The uncertainties in the contributions of coal, hydro, and renewables energy (solar and wind) towards the base and peak loads; however, the share of natural gas is assumed to be constant. Electricity price was assumed to be deterministic. |
| Sowinski (2022) [24] | Valuation of addition of CCS installation to an existing coal power plants considering price of CO2 emission allowance and the cost of electricity generation as uncertain factors | Investigation of multiple CO2 removal techniques with coal and natural has power plant technologies | The cost for storage, transportation and utilisation of captured CO2 are not considered. The assumption for the emission trading scheme is also subject to future changes. |
Table 3.
Specifications for selected technologies.
Table 3.
Specifications for selected technologies.
| Technology | Specifications |
|---|
| CCGT | on a single shaft. |
| CCGT–CCS | on a single shaft with 90% post-combustion carbon capture. |
| PV | Solar PV with single-axis tracking arrays and battery storage. |
| MSF | Two multi-stage flash systems are considered: once-through and recycle. |
| SWRO | Two-pass seawater reverse-osmosis configuration with two stages for the second pass. |
Table 4.
Cogeneration capacities for baseline and expansion options configurations.
Table 4.
Cogeneration capacities for baseline and expansion options configurations.
| Technology | BL–50 | EO–1 | EO–2 | EO–3 | EO–4 |
|---|
| CCGT | 630 MW | 310 MW | - | - | - |
| CCGT–CCS | - | - | 740 MW | 370 MW | - |
| PV | - | 730 MW | - | 730 MW | 1460 MW |
| MSF | 100 km3d−1 | - | 100 km3d−1 | - | - |
| SWRO | - | 100 km3d−1 | - | 100 km3d−1 | 100 km3d−1 |
Table 5.
Capacity factors per power generation technology.
Table 5.
Capacity factors per power generation technology.
| Technology | Capacity Factor |
|---|
| CCGT | 57.3% |
| CCGT–CCS | 48.9% |
| PV | 24.3% |
Table 6.
Capital and operating cost rates for all production technologies.
Table 6.
Capital and operating cost rates for all production technologies.
| Technology | Capital Expense Rate | Fixed OPEX Rate | Variable OPEX Rate |
|---|
| CCGT | 1084 USD/kW | 14.10 USD/kW | 2.55 USD/MWh |
| CCGT–CCS | 2481 USD/kW | 27.60 USD/kW | 5.84 USD/MWh |
| PV | 1755 USD/kW | 31.27 USD/kW | - |
| MSF | 2282 USD/m3d−1 | 30.00 USD/m3 | 76.00 USD/m3d−1 |
| SWRO | 1651 USD/m3d−1 | 89.00 USD/m3 | 138.00 USD/m3d−1 |
Table 7.
Freshwater price economics [
35].
Table 7.
Freshwater price economics [
35].
| Parameter | MSF | SWRO |
|---|
| Cost of production (USD/m3) | 1.44 | 1.38 |
| Profit margin (%) | 30 | 25 |
Table 8.
Basic statistics of the stochastic NPV distribution for all configurations (Million USD).
Table 8.
Basic statistics of the stochastic NPV distribution for all configurations (Million USD).
| Statistic | BL–50 | EO–1 | EO–2 | EO–3 | EO–4 |
|---|
| Min | 197 | (396) | (1652) | (409) | 878 |
| Max | 279 | 989 | 361 | 502 | 932 |
| Mean | 240 | 522 | (600) | 119 | 906 |
| Median | 240 | 542 | (593) | 132 | 907 |
| Mode | 235 | 553 | (351) | 92 | 912 |
| Disclaimer/Publisher’s Note: The statements, opinions and data contained in all publications are solely those of the individual author(s) and contributor(s) and not of MDPI and/or the editor(s). MDPI and/or the editor(s) disclaim responsibility for any injury to people or property resulting from any ideas, methods, instructions or products referred to in the content. |
© 2023 by the authors. Licensee MDPI, Basel, Switzerland. This article is an open access article distributed under the terms and conditions of the Creative Commons Attribution (CC BY) license (https://creativecommons.org/licenses/by/4.0/).


