1. Introduction
The increase in the proportion of decentralized renewable electricity supply is transitioning the power systems to a paradigm where the focus is on the prosumer at the edge of the grid. The challenge of coordinating this growing amount of distributed energy resources (DERs) could be better dealt with locally, where the prosumer takes active participation in operating their owned DERs [
1].
One of the promising approaches for local coordination of DERs is local peer-to-peer (P2P) energy markets. Local P2P energy markets are defined as a trading scheme where each connected user (for example, a smart home, a solar rooftop, an electric vehicle, or a storage owner) can engage in electricity trade with one another, negotiating a transaction at the distribution level [
2]. Such electricity markets, when properly designed, have the potential to tap into the consumption and generation flexibility of the participants and combine individual interests with grid operation objectives.
The framework and design of local P2P energy markets have attracted significant research attention in the past few years [
3]. It is already well established in the literature that P2P local energy markets (LEMs) are technically feasible and bring benefits to the prosumer [
4,
5,
6].
From the utility’s point of view, there is a competition between business interests involved in the mass penetration of DERs and prosumerism [
7]. Utilities focusing on centralized generation sales face prosumers as a threat due to net revenue losses caused by a decrease in electricity sales.
Yet, prosumerism is already systemically tolerated by utilities in the form of self-consumption and net-metering regulatory schemes. Regarding its economic impacts on utilities, the available literature on the impact evaluation from mass penetration of distributed energy resources focuses on these current regulatory frameworks [
8]. On the other hand, local P2P trading still needs to be widely adopted. This could be primarily due to the uncertainty of impacts on the stakeholders involved, namely power distribution utilities. To carry out a regulatory reform to implement P2P trading, better quantification of its effects must be understood.
What would motivate the utility to adopt peer-to-peer energy markets instead of the business-as-usual prosumer integration? An integrated view of technical and economic aspects of the impacts on both the utilities and retailers, especially in comparison to current self-consumption and net-metering regulation frameworks, is yet to be conducted. It is necessary to understand the mechanisms that could positively influence the utility as a primary stakeholder in the process and assess the risks and misunderstandings.
This study proposes to contribute in this direction by providing a systematic and comprehensive evaluation of P2P local energy markets’ impacts on power distribution utilities and retailers as primary stakeholders and quantifying the challenges and opportunities for utilities in adopting P2P local energy markets. A qualitative roadmap is delineated, considering the challenges and advantages of adopting peer-to-peer energy markets by utilities, based on a review of up-to-date literature. Considering the outlined roadmap, this study further provides a framework for quantifying the impacts of the adoption of peer-to-peer transactive markets by the DSOs. A comprehensive set of scenarios is organized to investigate the impacts and opportunities for utilities in adopting P2P local energy markets in a comprehensive framework. A co-simulation framework connecting a market model to a power flow model is set up, which is then used to evaluate and quantify the stakeholders’ revenue performance and grid operation performance. The stakeholders’ technical and economic performances are quantified under the presence and variation of network fees, variation in the number of agents, PV, and storage penetration. The results are discussed according to a specific set of criteria guiding to support policy markers’ decisions.
1.1. Literature Review
This review highlights two bodies of literature consisting of the peer-to-peer LEM’s feasibility from the prosumers’ point of view and the impacts and feasibility of DER deployment under market operation from the utility point of view.
1.1.1. Feasibility of Peer-to-Peer Energy Markets for the Prosumer
So far, the foundation and motivation for research of P2P energy trading have been the feasibility for prosumers. Local markets are studied to analyze the benefit to the small-scale participants, while ensuring a balanced supply and demand coordination. In previous reviews [
3,
9], P2P energy trading mechanisms are analyzed. The general conclusion is that the primary motivation of “peer-to-peer energy” is empowering the prosumer with market freedom and demand flexibility. It was demonstrated in [
9] that by establishing decentralized energy markets, prosumers aim to better utilize their DERs as opposed to individual energy management approaches.
Although the P2P trading value proposition for prosumers goes beyond the monetary benefits, large-scale adoption from the prosumer’s side cannot ignore the economic aspects. With better utilization of their resources, prosumers can “make electricity less expensive” [
7] than in a business-as-usual scenario. Many studies focusing on market mechanisms’ development had the increased economic welfare for the prosumers as a prerequisite for market modeling [
10]. This expectation that participation in P2P energy markets would lead to lower energy bills was achieved in several studies that explicitly calculate the economic impact on prosumers [
11,
12]. The P2P markets’ economic benefits for prosumers were also shown in pilot projects [
13,
14].
Considering P2P energy as not being the only one of the possible regulation frameworks to increase the penetration of DERs, up-to-date research has also been dedicated to evaluating the rise of prosumers in different business models [
15,
16]. For example, ref. [
15] studied the enablers and barriers to the increased participation of small consumers in power systems. The main barriers explored in this work were a lack of regulations to define better prosumers’ rights and obligations, technology-related issues such as the mass roll-out of infrastructure for real-time data and privacy concerns, high upfront investment price of the necessary equipment for energy generation, and finally a lack of information and awareness of the meaning of being a prosumer.
This last barrier is more deeply explained in [
17], as the feelings of the end-users towards new technologies and what they mean in their daily lifestyle and decision-making. This study quantifies these barriers to adopting local energy and flexibility markets, focusing on the prosumer.
Going back to [
15], the authors also argued that the feed-in-tariffs, self-consumption, and net-metering frameworks were important to initially enable the growth of the domestic PV prosumer. Now that the technology is well established, countries are beginning to move away from subsidies. A potential substitute business model is the market-driven mechanisms (also presented by [
18]).
In summary, since P2P markets have been considered a potential solution to DER integration, the research has comprehensively understood the impacts on prosumers.
1.1.2. Feasibility of Peer-to-Peer Energy Markets for the Utility
Once it was clarified that peer-to-peer markets benefit prosumers, another part of adopting such markets is the technical and economical feasibility of the utility.
From the grid operation perspective, previous studies have already tackled concerns regarding P2P energy impacts. This is relevant because positive effects on the power system operation could reduce the utility’s cost. In [
19], for example, a co-simulation methodology was presented for impact evaluation. In [
20], the possible network issues associated with the P2P energy trading market were highlighted by addressing the exact market mechanism with and without network constraints. It found that voltage levels were violated, and power losses were burdened onto the utility without proper financial return. However, a detailed financial analysis was not its focus. In [
21], a similar comparison was made, this time addressing the same grid operation with and without P2P trade.
Furthermore, a broad review of the impacts of LEMs in the power system layer was presented in [
22,
23]. It covered different studies dealing with grid operation impacts to understand impacts on the control, operation, and planning of power systems. It concluded that the extent of impacts, or if they are positive or negative, depend primarily on the market mechanisms employed—papers that focus on designing market mechanisms had a positive impact on the grid, meaning that negative consequences could be avoided by design. An example of it can be found in [
9], where under- and over-voltage was avoided using a power flow algorithm to verify whether scheduled P2P transactions would overload the grid.
Regarding the economic impacts on utilities, most of the literature on the impact evaluation from DER deployment focused on the current regulatory frameworks. In [
8], a set of concepts and directions were given to elaborate the tariff and revenue impact analysis studies regarding distributed PV. It elaborated a methodology that aims to quantify the expected changes in revenue collection, operational costs, and expenditures that served partly as a basis for this current study. It is a useful guide, but it primarily focuses on current regulation frameworks such as self-consumption and feed-in tariffs. It does not mention DER deployment in market-driven regulation schemes.
In [
24], a study on DSO income effects and grid tariffs’ feedback effects on grid development in the presence of LEMs was performed. Grid tariffs were varied with the objective function of minimizing and recovering costs with the DSO income. It concluded that the LEMs defer some investment in infrastructure, although too big of a tariff increase can motivate the neighborhood to disconnect from the grid altogether. The study in [
24] is related to this present study regarding the variety of scenarios in the DER deployment profiles. However, it focused on the effects on grid tariffs in the presence of LEMs, assuming that the grid costs are proportional to peak imports and exports from the market outcome. The present work analyzes the grid operation through power flow analysis, while giving more attention to revenue impact on the economic aspect.
Finally, most P2P analyses assumed a given penetration of DER, which provides a static framework. This limits utilities from establishing plans taking different levels of DER in their networks, where real-world LEM deployment is known to happen throughout a planning horizon with varying DER penetrations. An exception is [
21], which performed an analysis on variable storage penetration. However, it focused exclusively on loss quantification and does not include variations of other DERs.
In [
25], original work analyzing the role of retailers in decentralized trading is established. It discusses the feasibility of retailers’ involvement in peer-to-peer energy markets. It proposes a form of inclusion of the retailers into the market, enabling the feasibility for retailers in such a regulatory framework with a revenue discussion.
1.2. Knowledge Gap
The literature already established P2P markets’ economic benefits for the prosumers only. In [
17], the barriers for prosumers are envisioned to be overcome but leaves explicitly open the questions on the cost allocation of DSOs for further investigation. In [
18], the need for quantifying economic potential and impacts not only from renewable generation owners’ perspective but also from “new actors” providing energy services is stated.
Attention was also given to local markets’ grid impacts with a focus on grid operation, and control [
22,
23].
Further, the economic implications for utilities in a P2P regulatory framework have been conjectured or approached qualitatively in previous studies. Ref. [
24] made a quantitative analysis in the variety of scenarios and DER deployment profiles; however, it focused on a different objective of studying the effects of varying grid tariffs in the presence of local energy markets. However, a key aspect is still a gap in the literature: quantifying these impacts in a broader framework integrating technical and economic aspects on a multiple-stakeholder view.
This overall view of the role of utility in the presence of decentralized market regulation and how this compares to the DER deployment in other regulation scenarios is still uncertain.
1.3. Contributions
The overarching objective of this paper is to provide a roadmap for adopting P2P local energy markets by providing a comprehensive evaluation of both economic and technical impacts from multiple stakeholder perspectives. Considering the above-mentioned literature gaps, a set of scenarios is organized to investigate the impacts and opportunities for utilities in adopting P2P local energy markets. With it, we aim to answer the following research questions:
How do P2P markets compare to net-metering/self-consumption in economic and technical performance?
What are the economic impacts of grid and transaction fees as lost revenue adjustment mechanisms in peer-to-peer market schemes for utilities and prosumers?
How do variations in DER penetration impact P2P markets in comparison to net-metering/self-consumption?
Finally, and most importantly, are there scenarios where both utility and prosumers benefit more from peer-to-peer markets than from net-metering?
This study results in:
Defining different structures for the operation between prosumers and DSOs, specifically net-metering and market operation.
Evaluating how adopting network fees can help recover the utility revenue loss due to DER implementation.
Analyzing how different levels of DER penetration (i.e., different proportions of PV and storage) affect the utility income in P2P market scenarios.
Pointing to directions where P2P market implementation benefits all stakeholders involved, prosumers and utilities alike.
The achieved results contribute as first steps toward comprehending how the utilities could embrace the approach of peer-to-peer energy markets as a feasible and profitable solution for grid coordination challenges while keeping prosumers’ benefits and sovereignty. These first steps can already provide initial directions to the policymakers, but they also open a set of new questions, which must be taken upon by further research.
To carry these analyses through, an evaluation framework and a co-simulation platform that connects a local P2P market model and power flow model are set up and detailed in
Section 2. The model is then used to evaluate and quantify the stakeholders’ technical and economic performance from a P2P local energy market compared to a net-metering regulatory framework, outlined in
Section 3. The results are discussed in
Section 4 according to the posed research questions aiming to support policy markers’ decisions in different aspects. Finally,
Section 5 concludes with closing remarks and future work suggestions.
2. Materials and Methods
2.1. Research Strategy
The strategy to answer the research questions is outlined in this section, with an overview and explanation of the steps to achieve the answers sought. To provide a comprehensive evaluation of P2P energy markets, the current research relies on the approach described in the sequence.
First, an evaluation framework is developed by listing a set of potential barriers and opportunities for utilities identified during the literature review. To evaluate whether these P2P market’s potential barriers and opportunities (fully detailed in
Section 2.2) apply to utilities, a quantification method is needed. With that purpose, a set of criteria is gathered and assigned to quantify each potential barrier and opportunity.
The established evaluation criteria comprehend both the economical aspects of revenue generation by the market and the technical aspects of its impacts on grid operation. All criteria can be calculated and quantified through the modeling and analysis of a P2P market operating on a distribution network. The construction of this model is the following step of this research. A co-simulation platform is built, which can couple the model of a designed P2P market to the actual power flows across a low-voltage distribution network (detailed in
Section 2.3. Power flow and market models rely on standard procedures from the literature.
After the simulation model overview description, the rest of this chapter is dedicated to describing the features, particularities, and limitations of both market and grid models.
The setting up, quantifying, and analyzing these criteria in an integrative manner through a multi-stakeholder perspective provide the novelty of this work.
2.2. Evaluation Framework
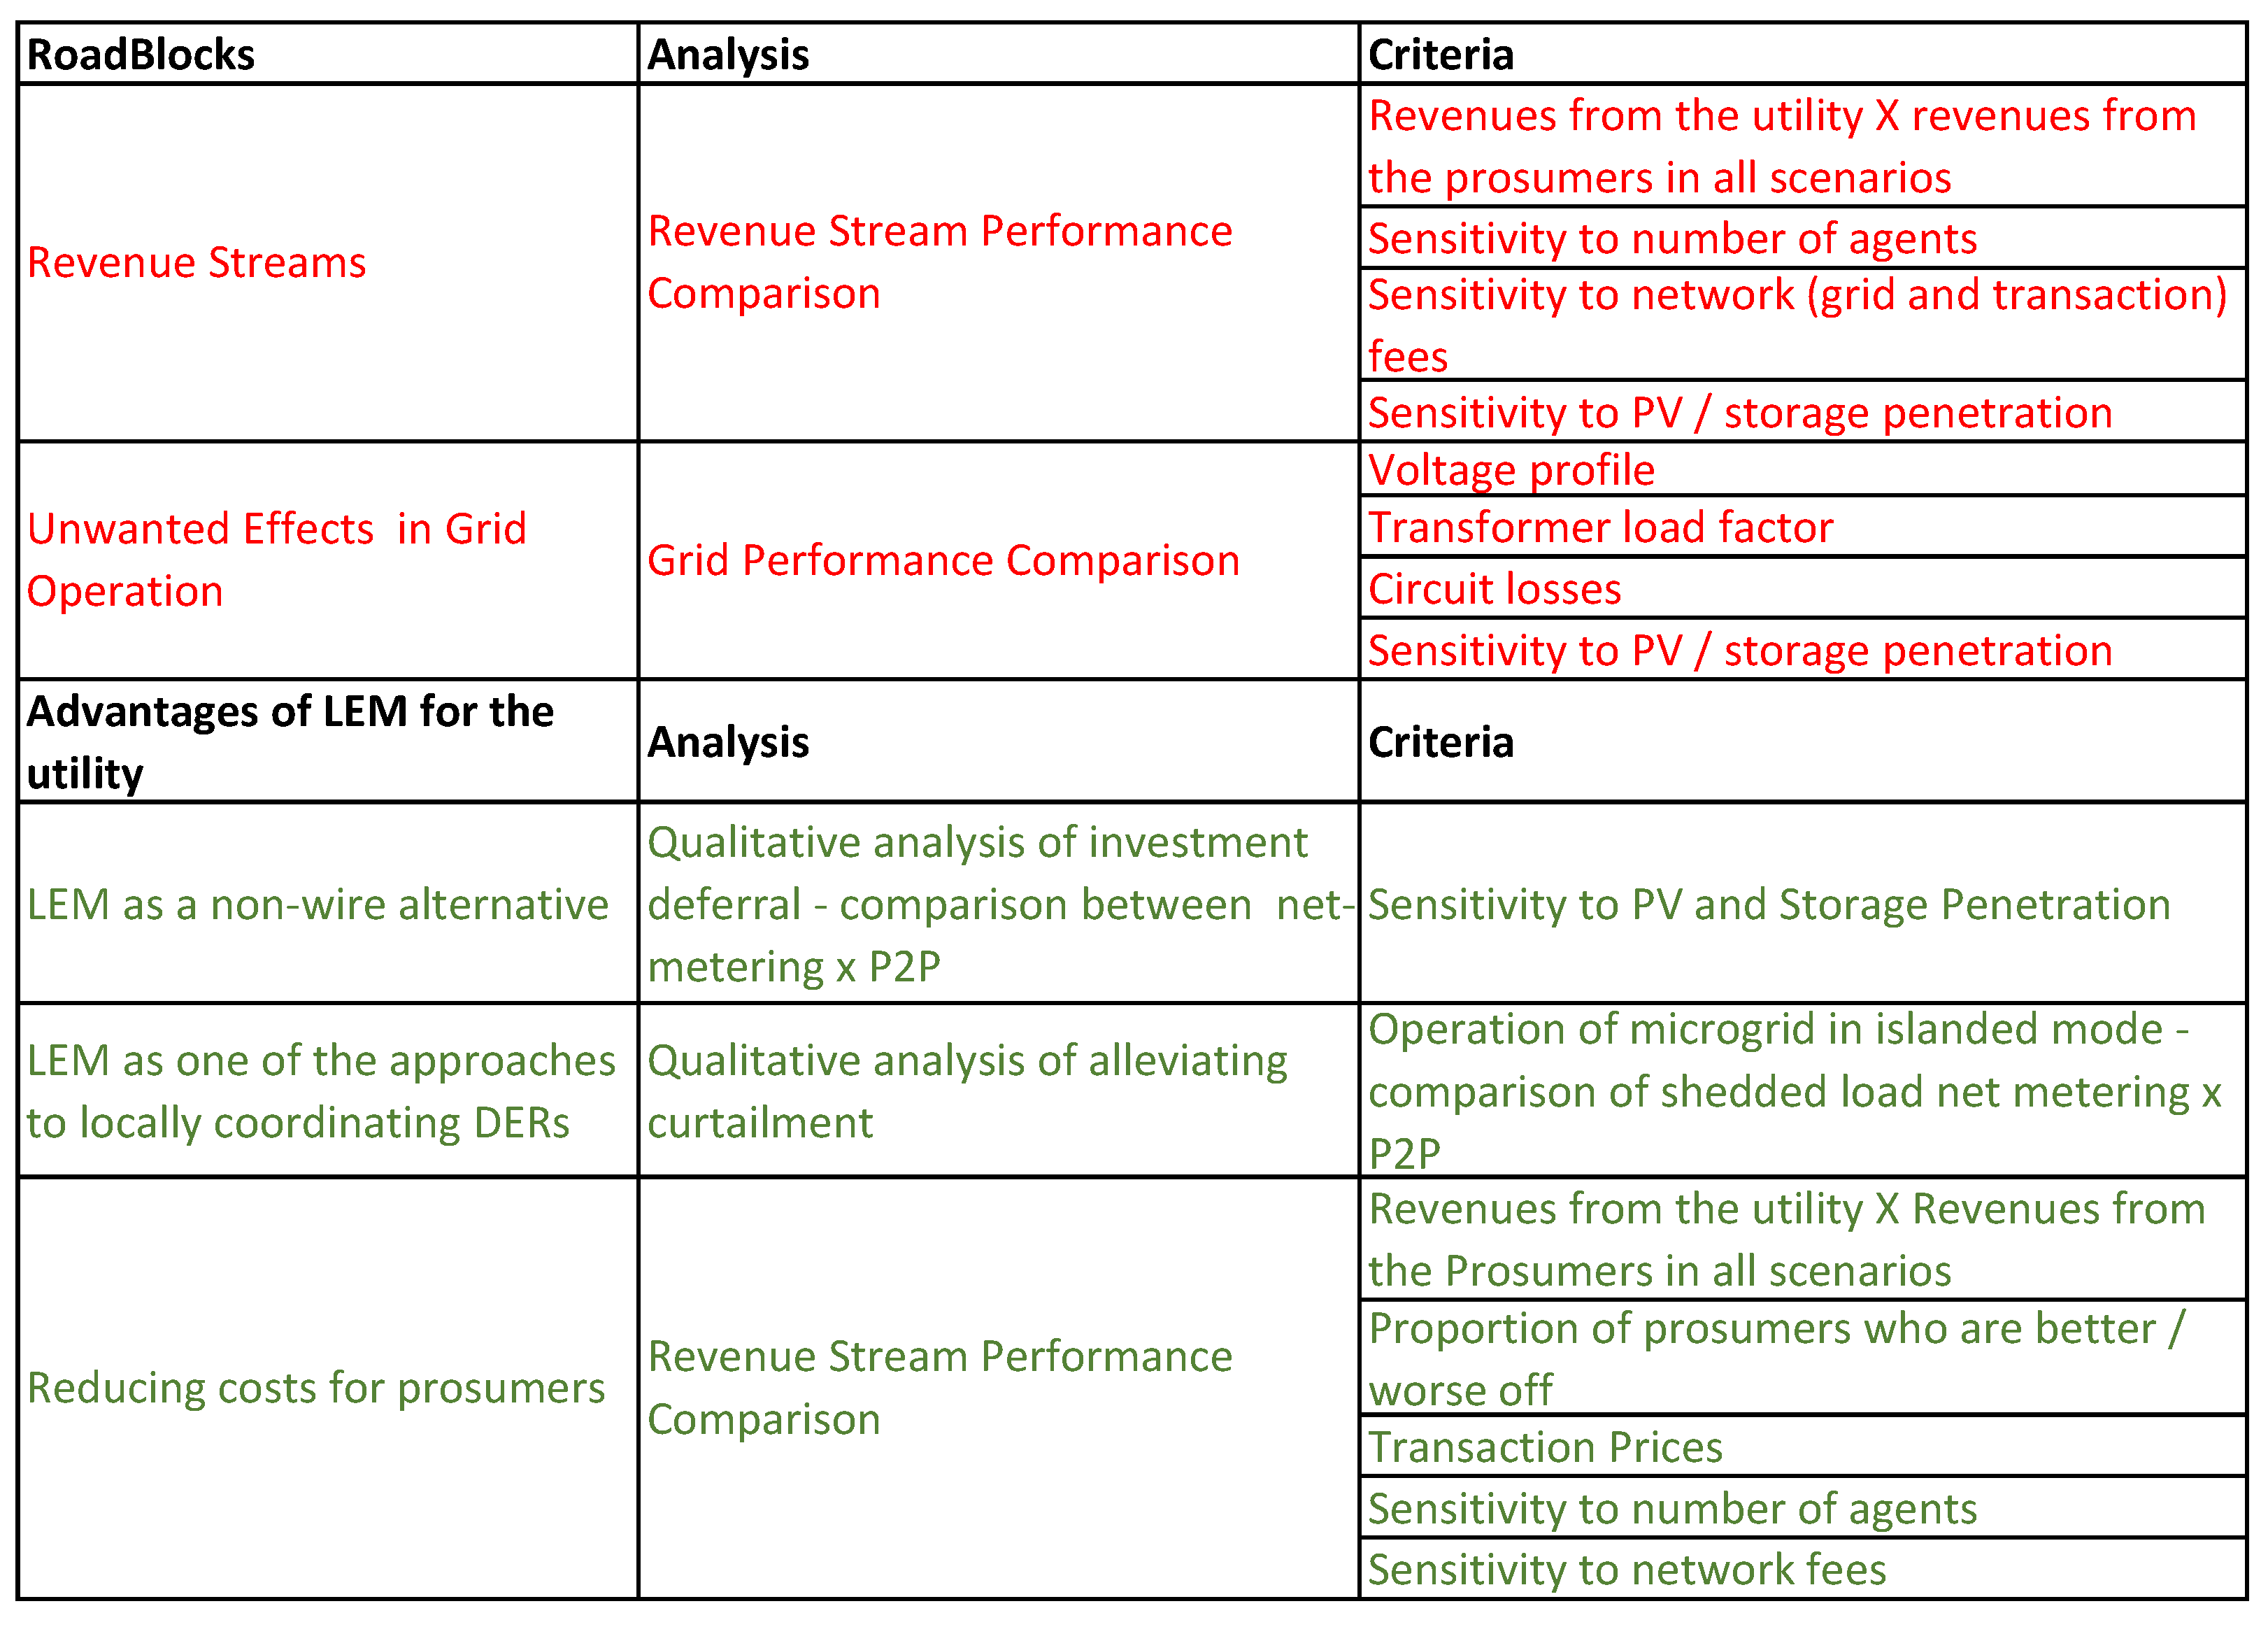
This study focuses on two of the main roadblocks related to grid operation for the adoption of P2P energy markets by the utilities. Firstly, what is the economic impact of P2P markets on utilities’ revenue? The large-scale use of DERs in LEMs may negatively impact revenue due to a decrease in energy sales, but quantifying this effect is still an open question. Secondly, what are the technical impacts and unwanted effects on the network operation? In other words, how will the grid performance be affected by the DERs operating in markets as opposed to their operation in current regulatory frameworks? Other roadblocks could be identified, such as the investment in ICT infrastructure needed to cover and implement P2P local energy markets. However, since they are not directly related to the energy market operation, we leave adding more aspects for future studies.
In terms of advantages for the utilities, this study envisions three. The first is using LEMs as a “non-wire alternative” to improving electricity infrastructure. If LEMs could positively impact network usage, this could lead to investment deferral in grid reinforcements. The second is using LEMs as a promising approach to local coordination and operation of DERs, which could bring benefits such as avoiding interruptions and reducing the thermal stress on grid components. The third is to provide additional benefits for the prosumers as a way of discouraging these prosumers from defecting the grid, which is also interesting for utilities.
Based on the above-mapped opportunities, this study presents an analysis and evaluation framework designed to quantify each roadmap element with specific criteria. This framework is shown in
Figure 1.
2.3. Simulation Model Overview
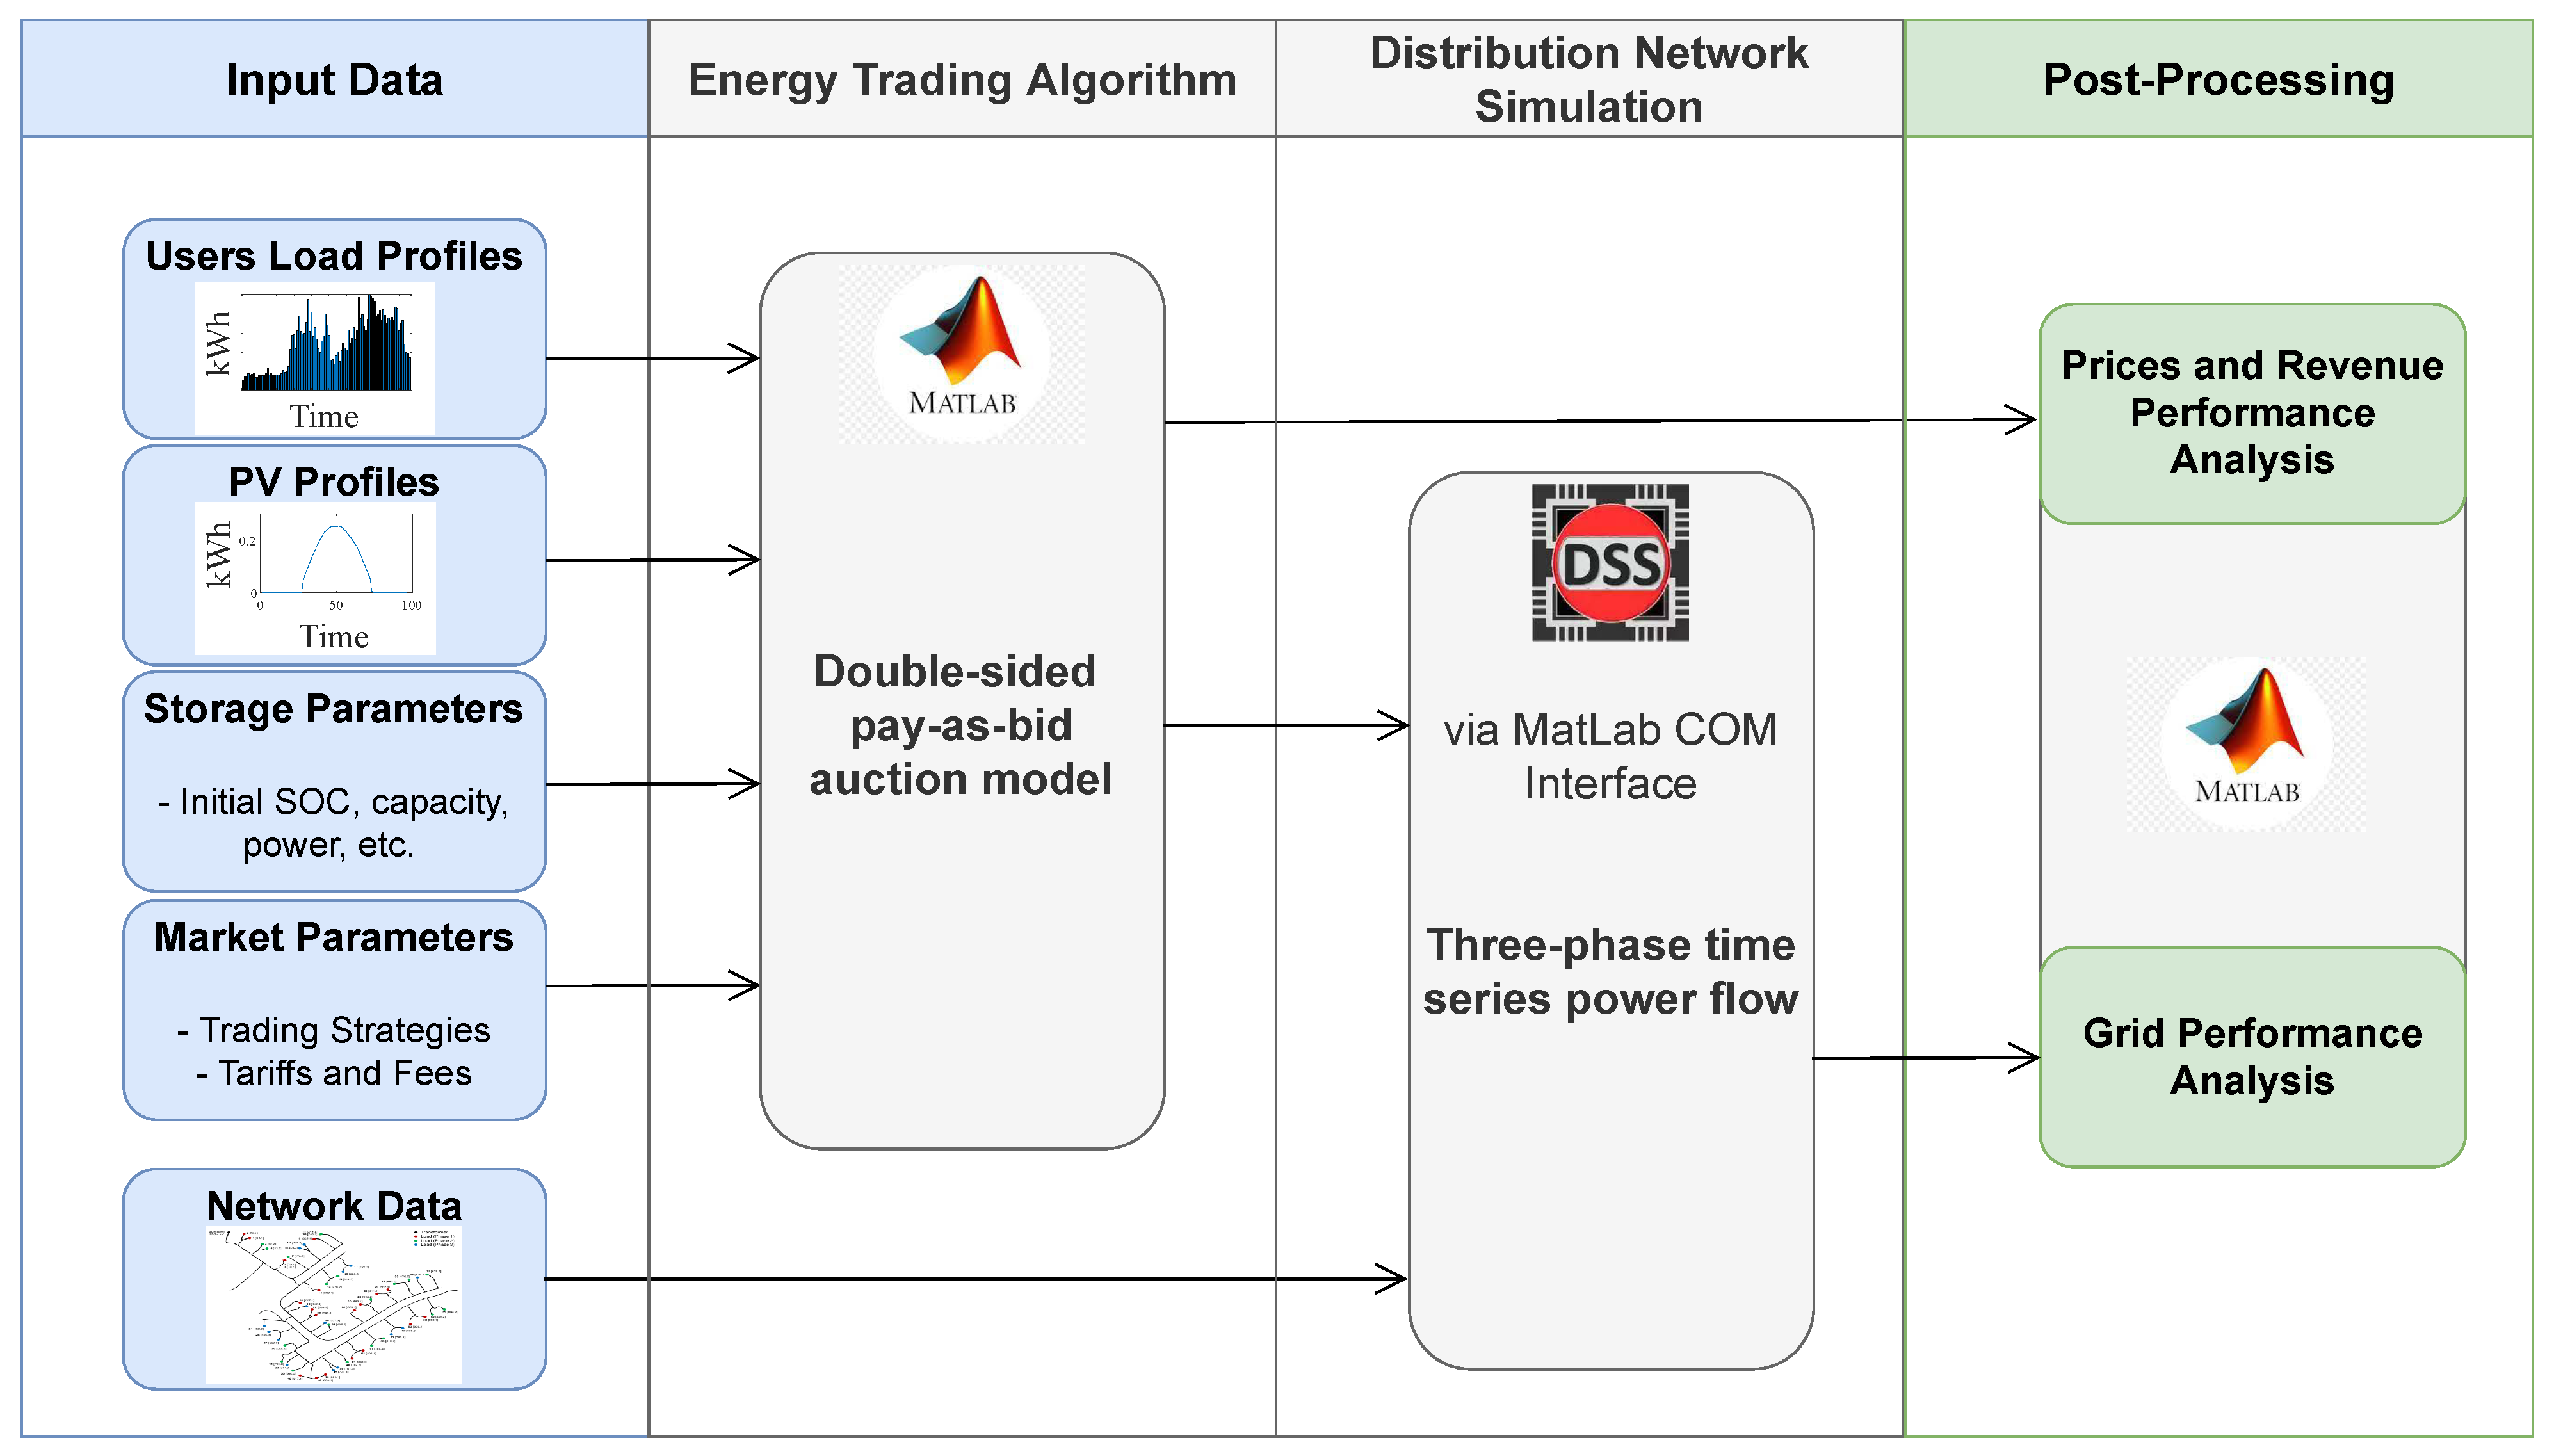
The presented criteria are evaluated through the developed simulation framework, which consists of an energy trading algorithm connected to a power flow calculation model.
The energy trading model consists of a double-sided-pay-as-bid auction scheme implemented in the MatLab environment. The power flow calculation is carried out as a three-phase steady-state time series using the OpenDSS distribution network simulator. Open Distribution System Simulator (OpenDSS) [
26] is an open-source, comprehensive electrical system simulation tool for electric utility distribution systems. It is capable of modeling three-phase networks in LV e MV in detail. Many of the features found in the program were originally intended to support the distributed generation analysis needs.
The implemented framework is a co-simulation approach, shown in
Figure 2. In the first step, a market simulation is run with an energy trading model for the desired time interval. The input data for this market simulation are load profiles, PV generation profiles, storage limits and dimensions, size of market time steps, users’ trading strategies, and utilities tariffs and fees. The simulation results are traded energy amounts for each connected participant. They are fed as input data for the OpenDSS simulation via the COM interface inside the MatLab. The OpenDSS also receives the network model data as input. The time-series power flow calculation results are returned to MatLab for post-processing. A similar approach can be observed in [
19].
2.4. Peer-to-Peer Energy Market Mechanism
The implemented peer-to-peer energy market consists of a continuous two-sided pay-as-bid auction mechanism based on the Grid Singularity Exchange’s technical approach [
27].
2.4.1. Market Timing
The selected market mechanism is a spot market, where short-term trades are made for immediate or near-term delivery.
The energy quantities are divided and defined by 15-min time slots, or market slots, within which the market opens and closes, and transactions can occur. In a one-day simulation, there are 96 market slots. Each slot is further divided into market ticks. For the chosen tick of 15 s, each market slot is made up of 60 ticks. Each market tick allows the participants to place or renew their bids and offers.
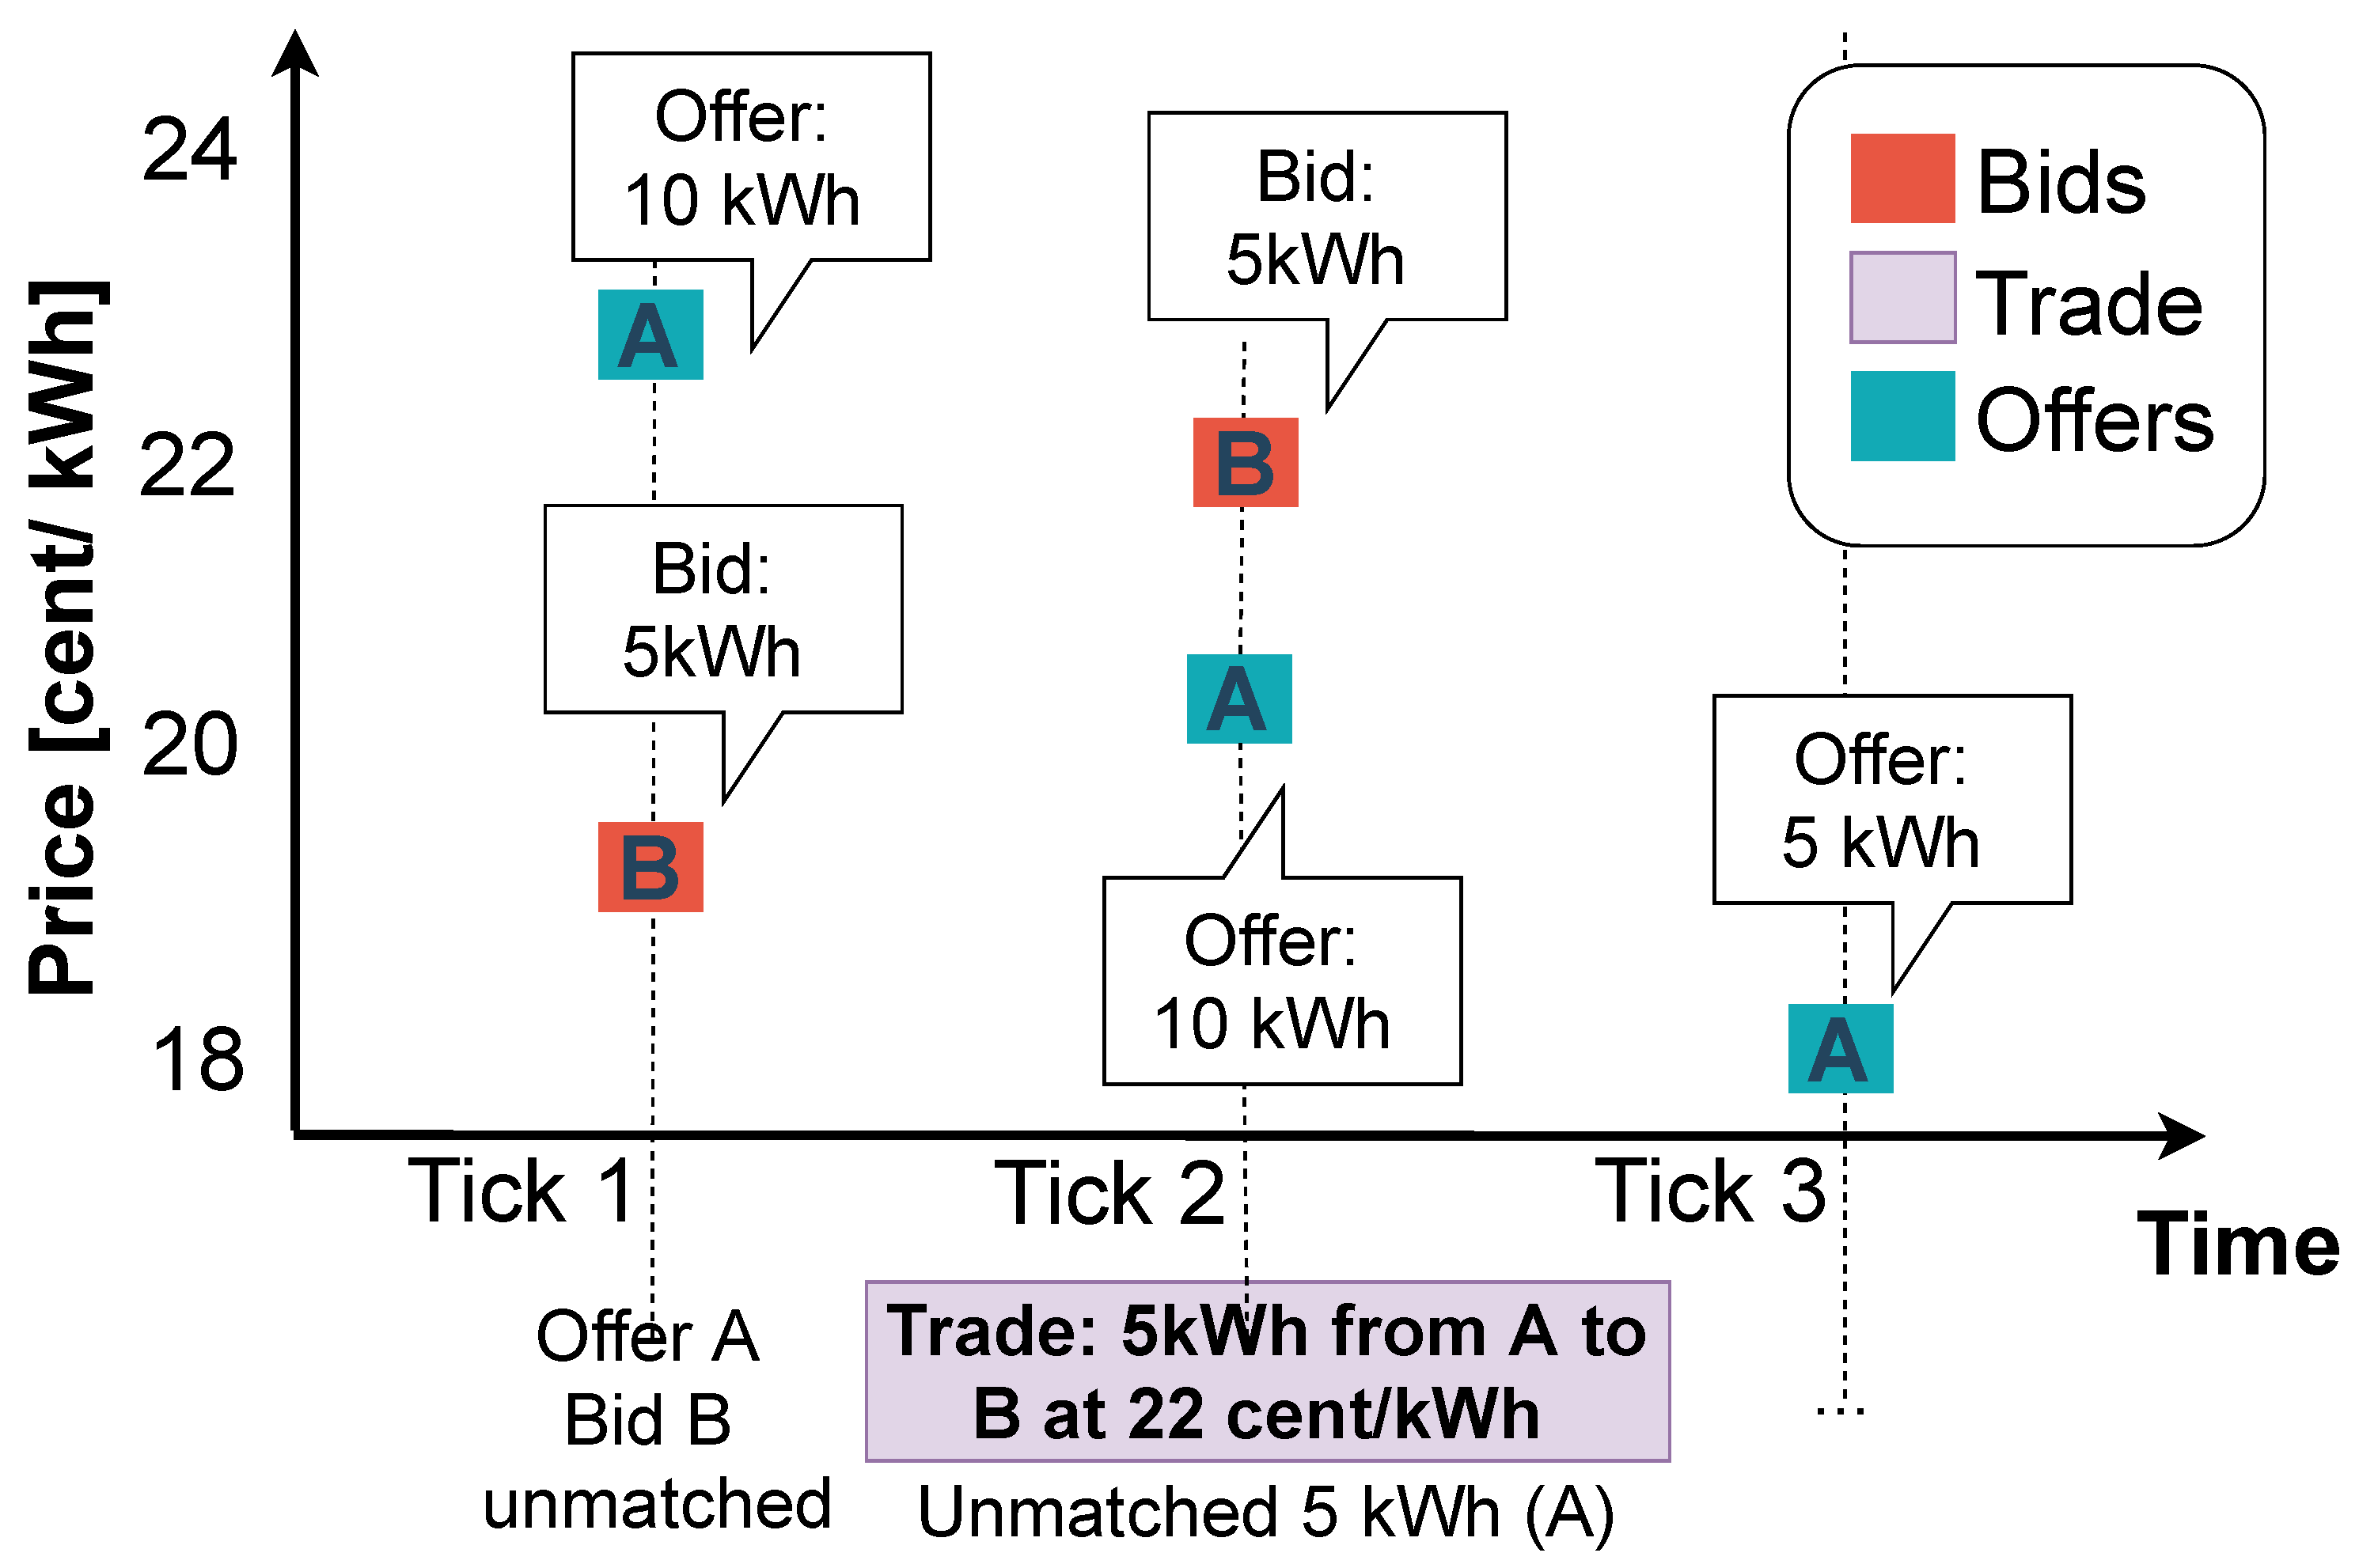
2.4.2. Two-Sided Pay-as-Bid Auction Mechanism
In the Two-Sided Pay-as-Bid market, buyers can place bids alongside the offers set by sellers. The market matches bids and offers issued by the trading agents. The auction is continuous, so the market will immediately trigger a clearing if a bid is matched to an offer in the current tick. The clearing price is the bid price. If the bid/offer is not matched, or if some of the bid/offered energy amount remains available, a new bid/offer must be made at the next market tick; in case remaining energy amounts are left unmatched after the last tick at the end of the market slot, they will be annulled. For example, any unmatched amount of PV generation will be curtailed, or an unmatched amount of load will be shed. This is shown in
Figure 3.
2.4.3. Bidding/Offering Strategy
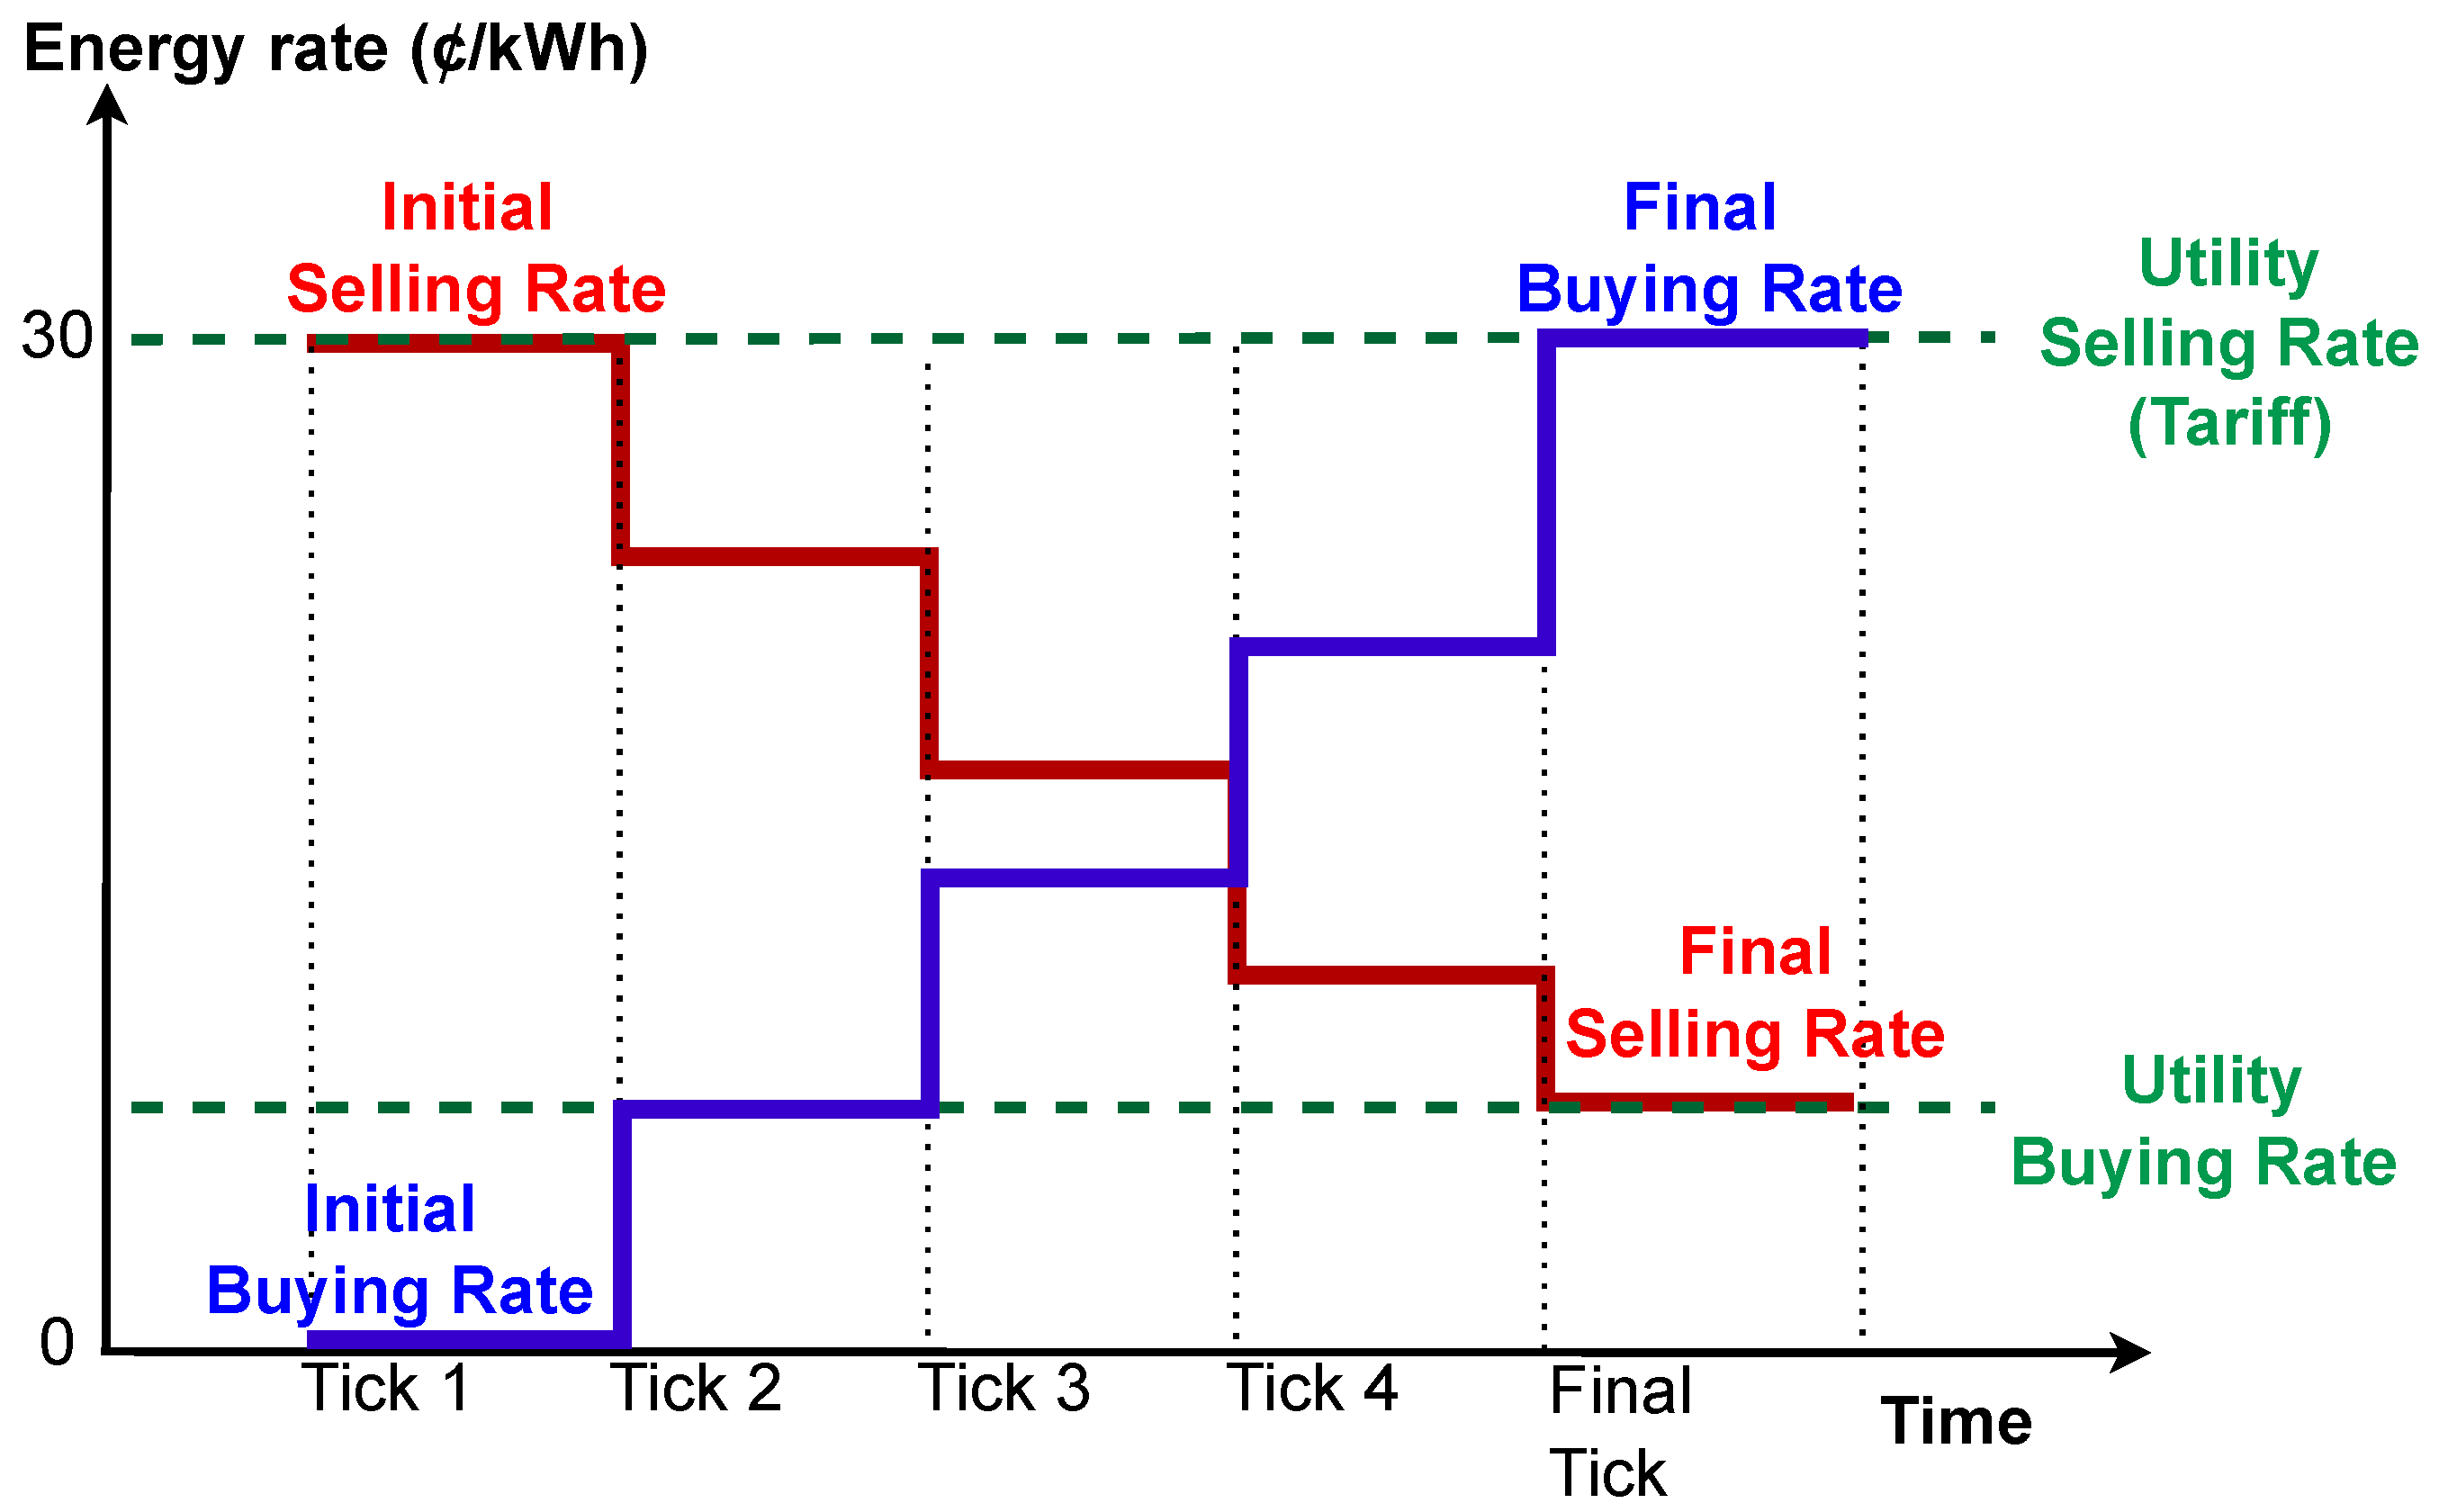
The implemented bidding/offering strategies are linear and deterministic. Each consuming asset will try to buy at a low price, and if not cleared, they will linearly increase their bids during the market slot. Producing assets will try to offer at a high price and, if not cleared, will reduce their offer rate until a minimum is achieved.
For the bids, the following parameters must be given: initial buying rate and final buying rate. Then, a rate increase is calculated to adjust the buying rate at each tick linearly, setting the initial and final rates limits to the first and last market ticks, respectively. Similarly, the offering agents will provide initial and final selling rates. From these values, a rate decrease is calculated to fit the time limit of the market slot.
The utility acts as a price maker negotiating agent, keeping the bidding and offering prices constant during the whole market slot. All three bidding strategies are shown in
Figure 4.
2.4.4. Trading Process
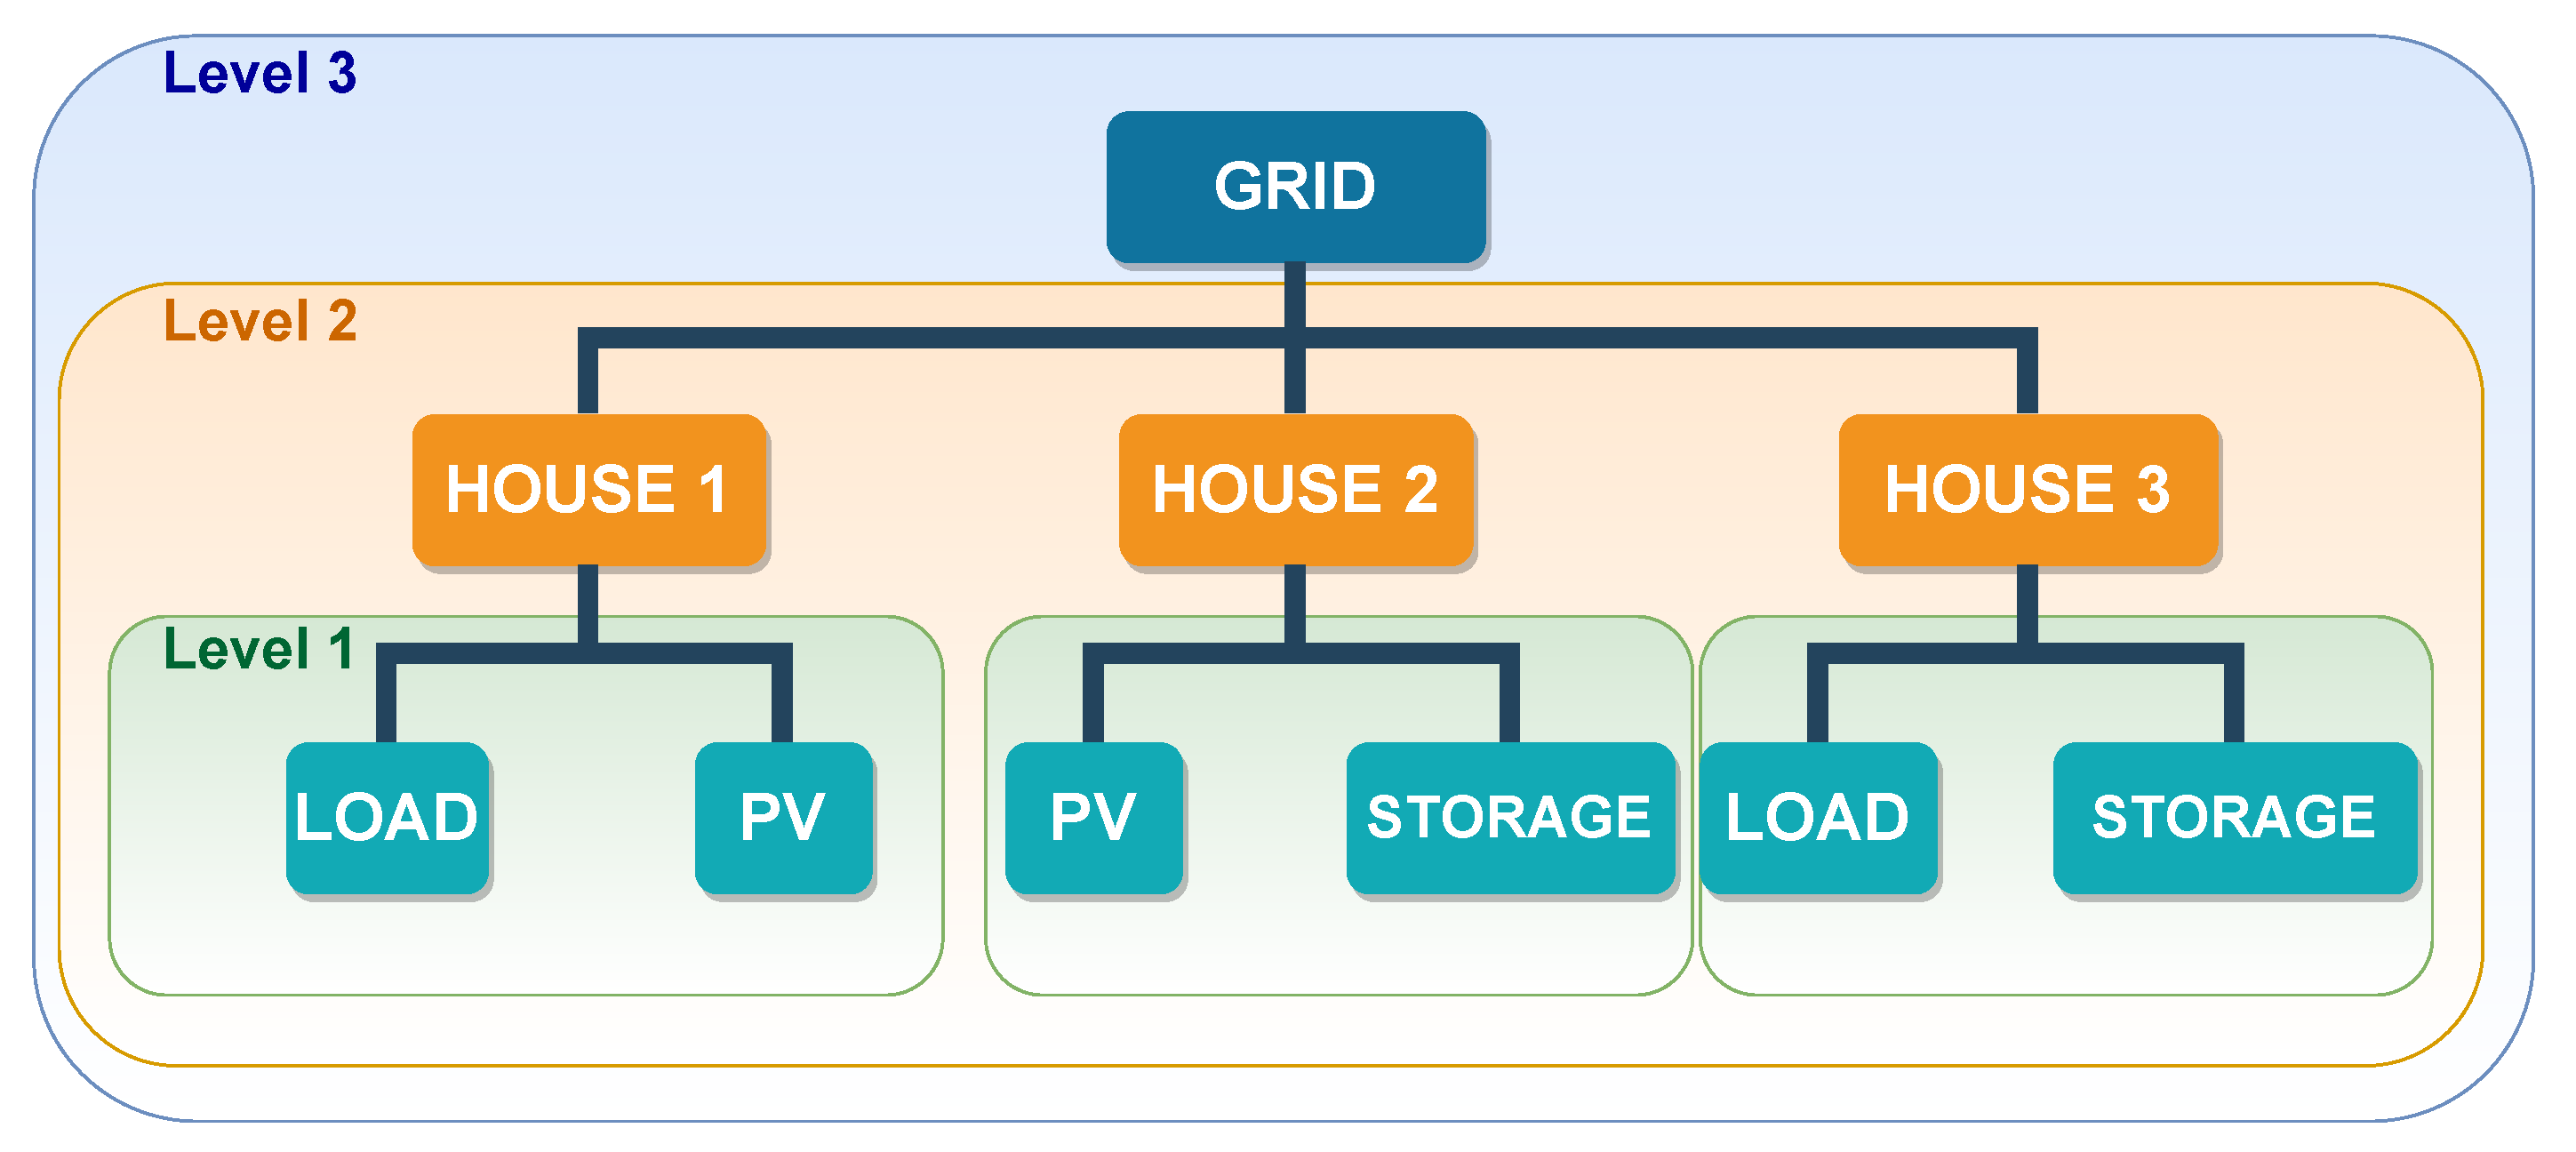
Once the market slot opens, the bids and offers are put in each tick for the negotiation and bilateral trades start to happen when there is a match. When more than one match is possible for the same bids or offers, the market engine must prioritize the most local trades. A three-level market hierarchy is developed to process this prioritized matching of bids and offers. The first level is the negotiation between assets of the same household. The second level is negotiating between households within the same low-voltage network. The third level is the negotiation between the households and the grid. This is shown in
Figure 5.
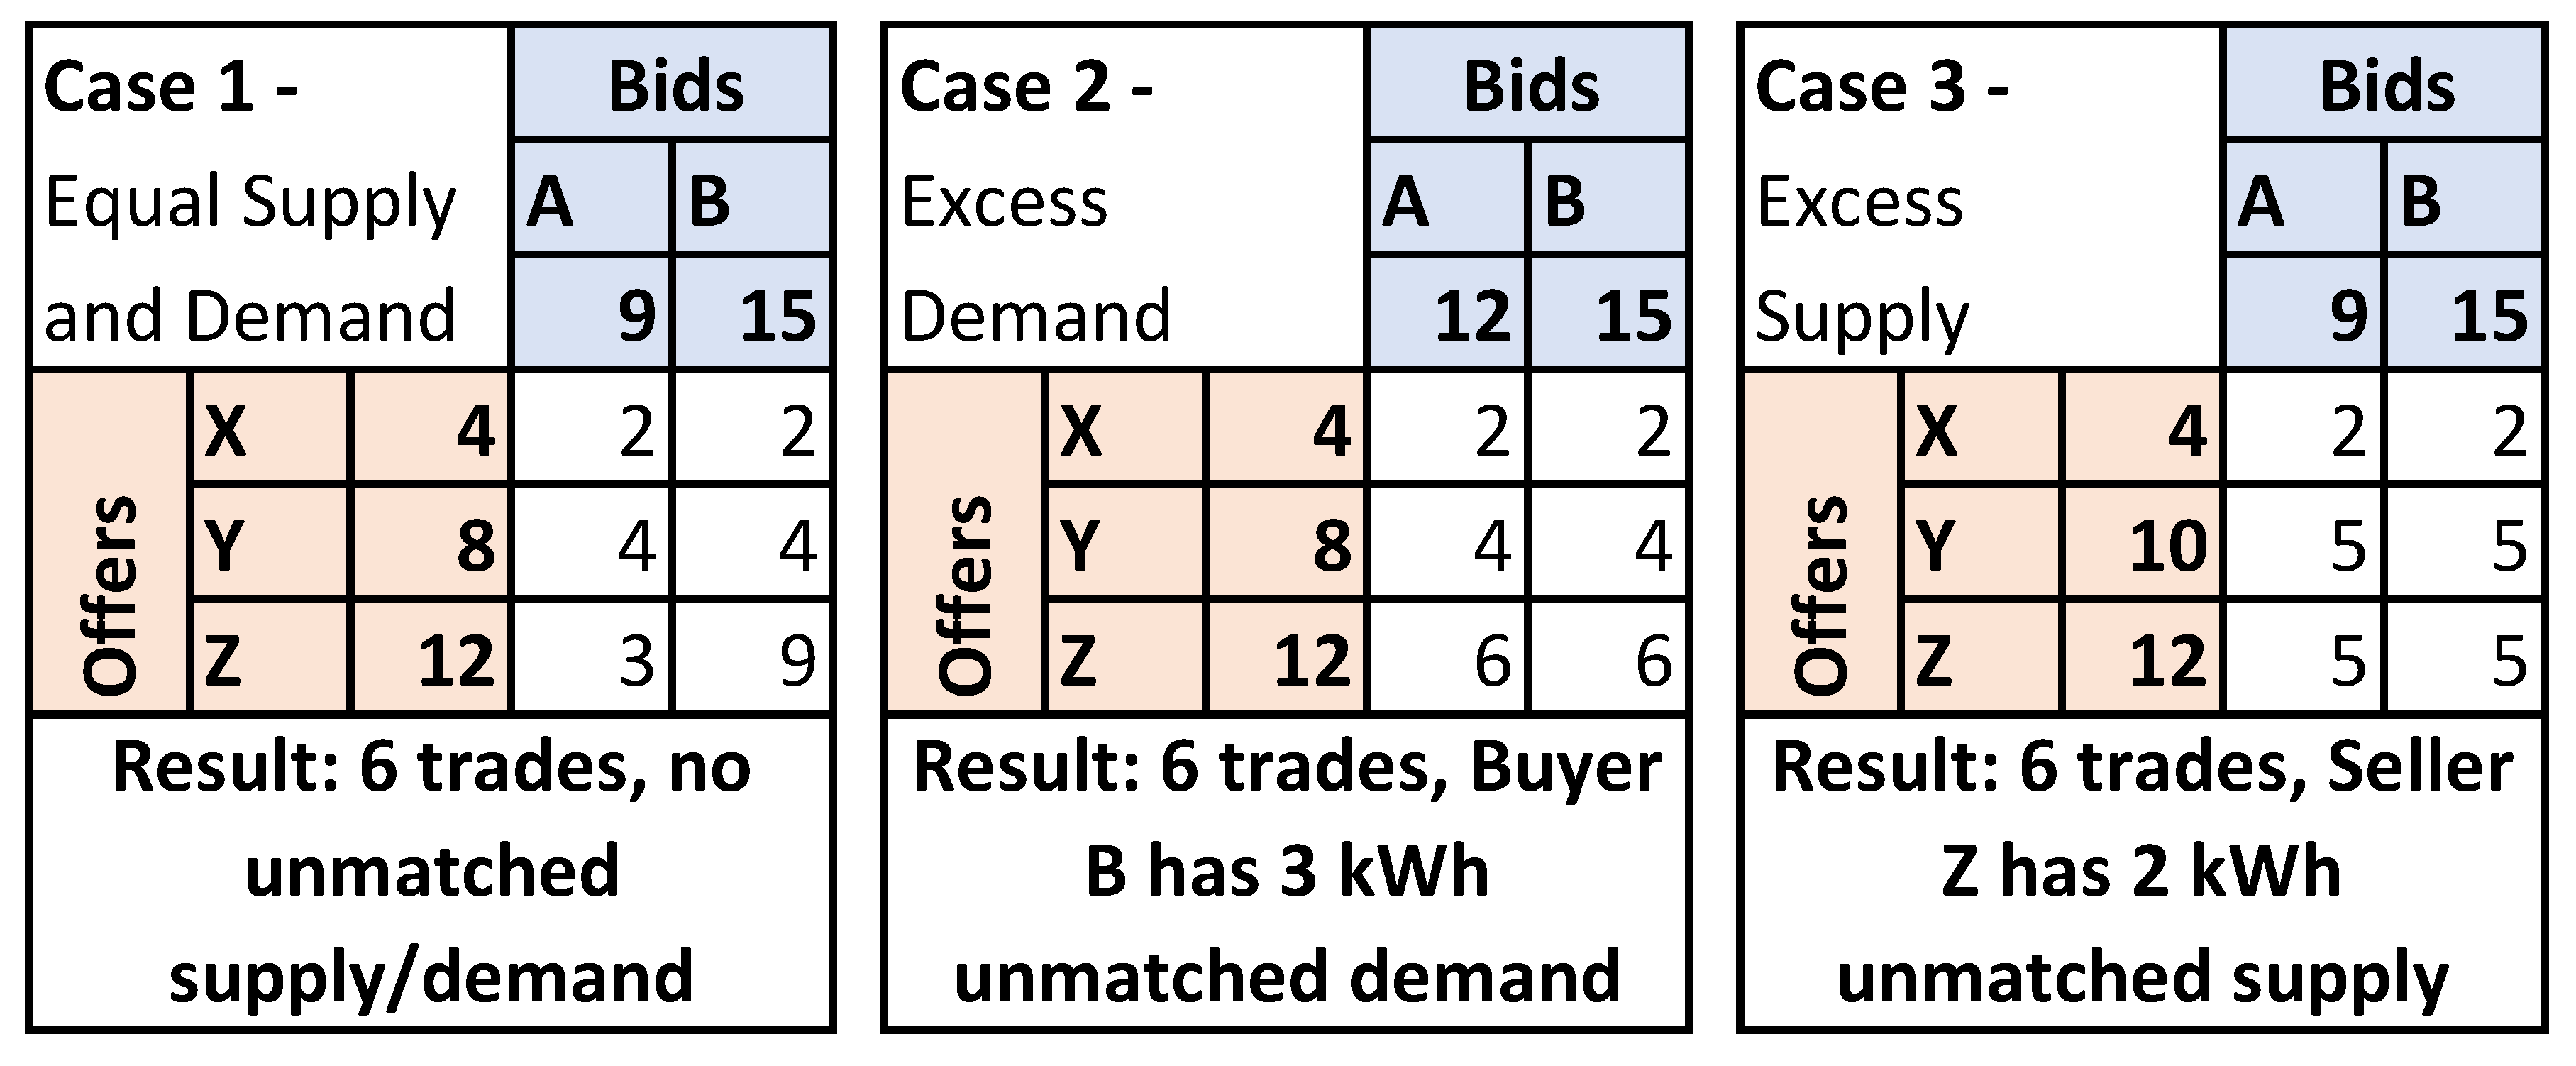
If multiple matches per buyer or seller happen inside the same trading level at the same tick. An allocation procedure takes place for equal distribution of the matched bids/offers into a series of bilateral trades. An example of the allocation procedure is given in
Figure 6.
2.5. Grid Fee Calculation
The grid fee calculation is based on the D3A market engine [
27]. The adopted grid fee is a percentage grid fee, where the fee rate is calculated based on a percentage of the negotiated transaction price.
In the first level of the market hierarchy setup, no grid fees are involved, as the trades happen between assets of the same household. If a bid propagates to the second level, a modification in bid and offer price is necessary to ensure an agent will never receive less than offered or never pay more than the bid. When entering the next level, market fees are added to offers and subtracted from bids according to the grid fee ratio
, as observed in Equations (
1) and (
2) [
27]:
When there is a match between the new bids
and offers
, the actual fee rate of this transaction will be [
27]:
The actual paid price rate for the energy is equal to the original bid from the buyer, since this is a pay-as-bid model.
The actual revenue rate
for the seller is the original price discounted from the fee rate [
27]:
By this procedure, the grid fee accounting ensures that the buyer does not pay more than what they bid, and the seller does not receive less than what they offered.
The grid fee rate is not applied for transactions between market participants and utilities at tariff prices.
2.6. Transaction Fee Calculation
To compensate for the expenses incurred by establishing a P2P local energy market, such as ICT and transaction platform infrastructure and maintenance, a transaction fee is included in the analyzed scenarios. This per-transaction fee is implemented as a flat fee, the same fixed charge for every transaction no matter the amount of energy traded.
In the developed model, the transaction fee will be subtracted from the seller’s revenue and added to the buyer’s cost once a transaction
T is established. If the revenue
R of a possible match is lower than the sum of the per-transaction fee
and the grid fee (
8), this transaction will not take place and the unmatched energy quantities
e will be carried on to the next market tick. This is implemented to make sure the revenue of a transaction is never negative:
2.7. Case Study and Scenarios
2.7.1. Simulated Circuit Model and Input Data
The evaluations proposed by this study are carried out through a case study using the IEEE European Low Voltage Test Feeder [
28]. This model consists of a radial distribution feeder with a base frequency of 50 Hz and a voltage level of 416 V (phase-to-phase). The model provides load shapes with a one-minute resolution for 24 h for time-series simulation.
In the developed case study, 55 households are connected to the grid and participating in the market, each with a static load profile, a rooftop PV, and a battery. The load curves are present in the IEEE LV test feeder data. The radiation profile is given as a sunny day at a subtropical latitude. Each agent has 1 kWp of PV installed. Details of the storage system are given in
Table 1. Further configuration details of the market model are shown in
Table 2.
2.7.2. Description of Simulated Scenarios
Five cases have been proposed for the analyses:
Base 1: base model of the IEEE test feeder, where the agents have only loads and no DERs present. Households buy energy from the utility at a tariff price.
Base 2: in this scenario, each household possesses a PV system and a storage system working in self-consumption mode. The respective household’s PV surplus can only charge each storage system. The storage system only discharges to feed the household’s energy demand. When there is surplus energy from the PV that surpasses both load and storage charging, it will be fed into the grid at a feed-in-tariff price.
Market 1: in this scenario, the DERs can exchange energy with each other and the grid according to the P2P LEM rules described previously.
Market 2: P2P LEM operation with grid fees.
Market 3: P2P LEM operation with both grid and transaction fees.
3. Results
3.1. General Simulation Results
For each scenario, the sum of demanded energy by the loads remained the same, meaning the load demands were always met, and none of the variations in operating the DERs caused load shedding. The scenarios do not differ in terms of prosumers’ comfort or convenience.
The same is valid for the PV operation. Regardless of the operation scenario, the total available energy was not curtailed. This is important for the PVs’ economic feasibility, which relies on maximizing the PV energy yield.
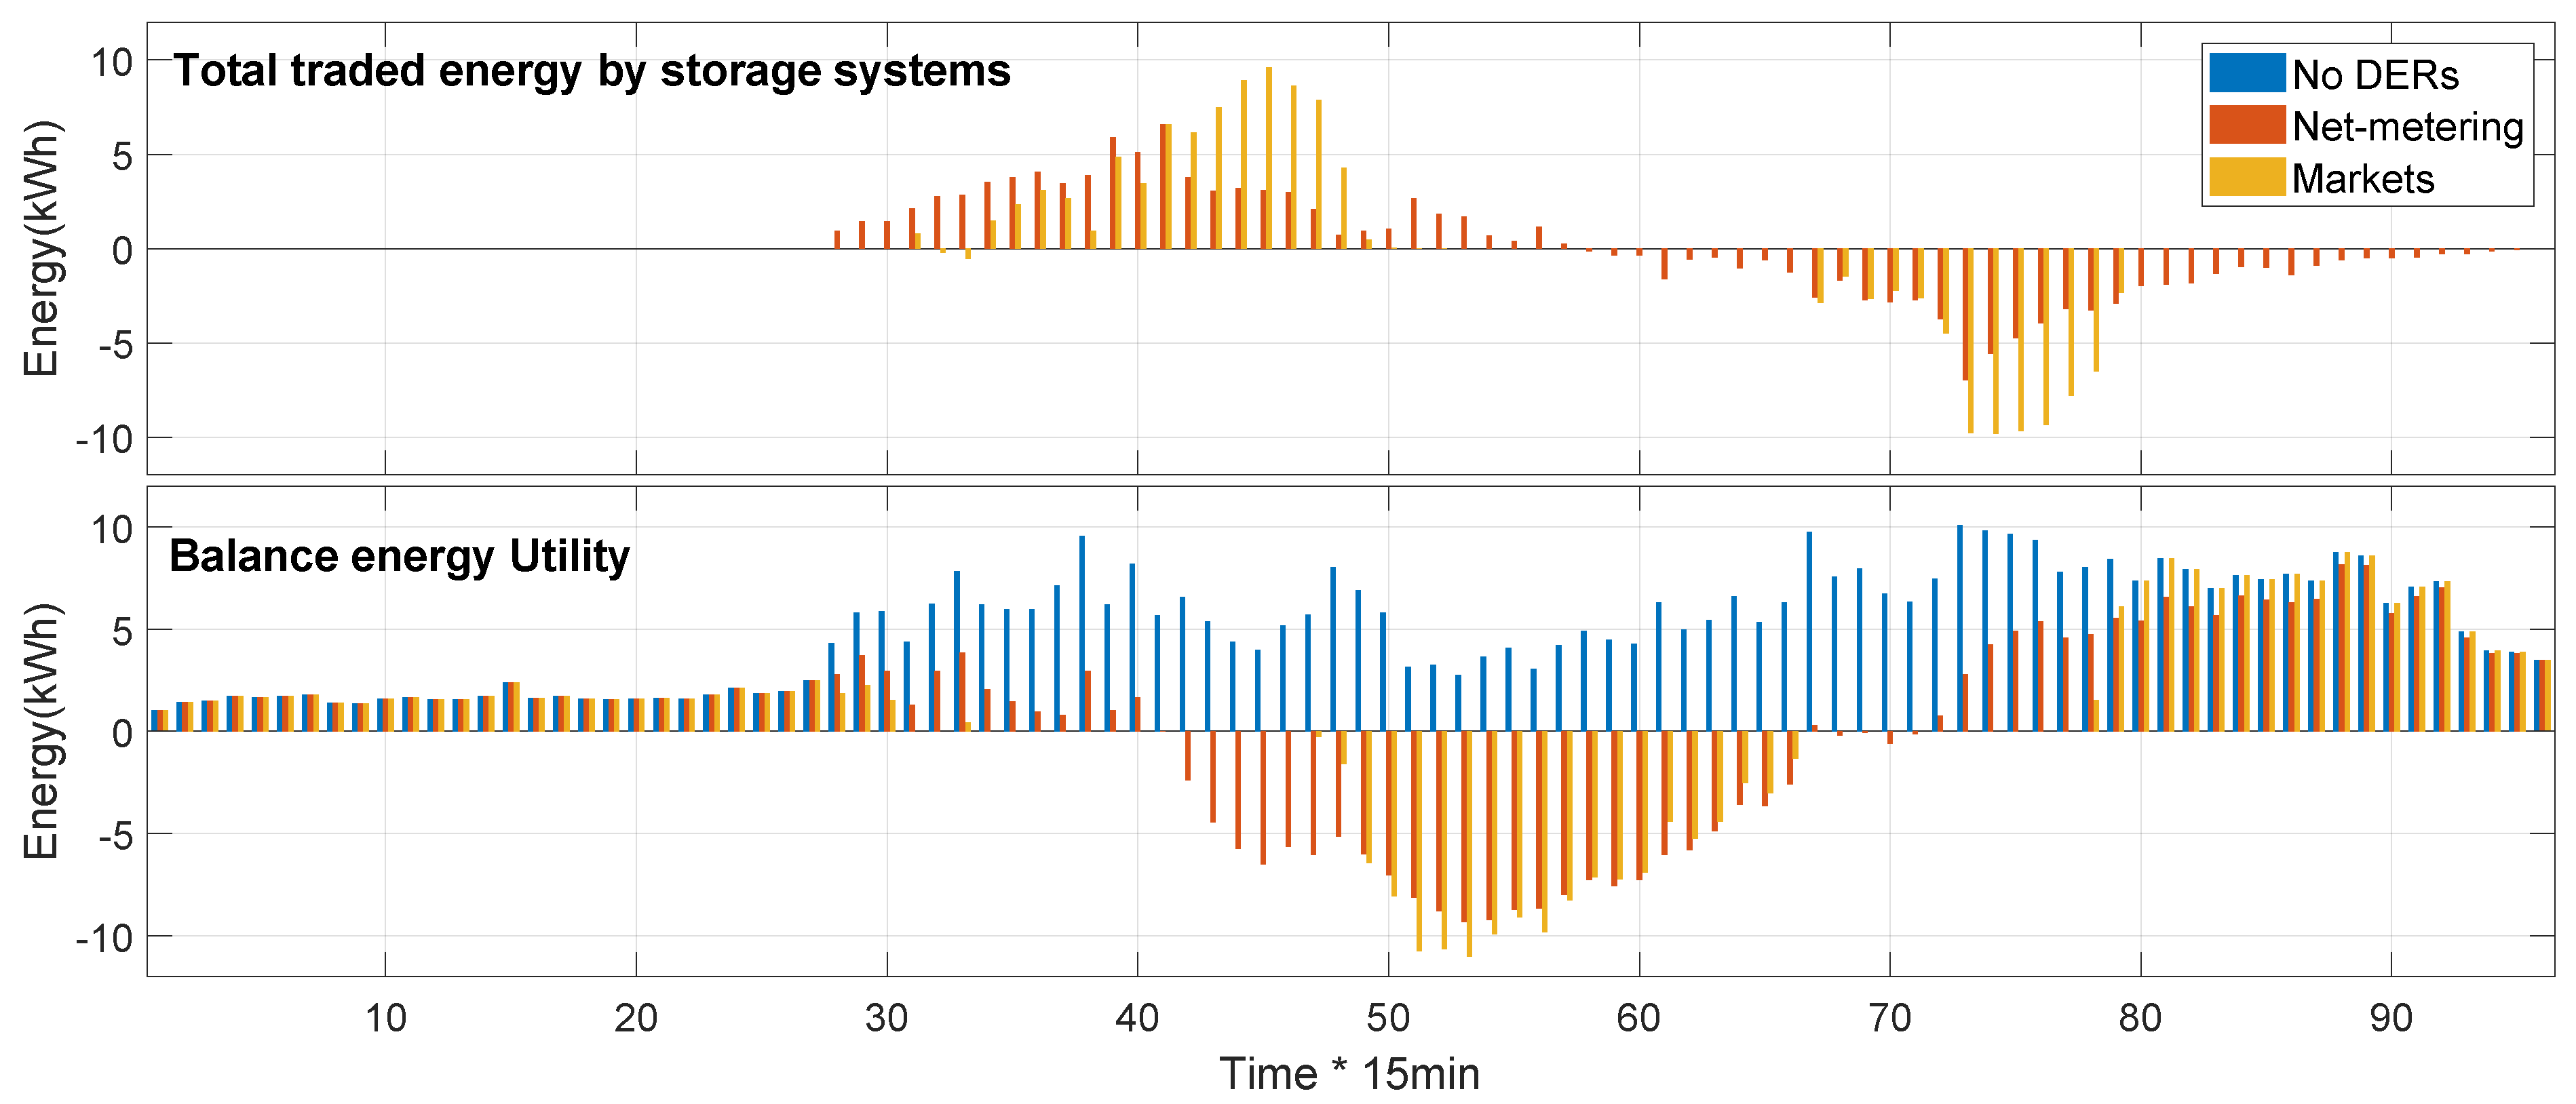
On the other hand, the storage system offers the flexibility needed to change the aspects of grid operation according to the rules in each scenario [
9]. The sum of the battery’s exchanged energy in each operation step during the day is shown in
Figure 7. During the sun hours in the net-metering scenario (Base 2), the batteries start charging as soon as there is a PV surplus from each agent, as only self-consumption is allowed. In the market scenarios, the PV surplus is firstly exchanged between agents, and only when there is a systemic PV surplus will the storage systems start charging, but then at a higher rate.
Free from restricting to self-consumption (Base 2), the agents can enter into a form of collective self-consumption, which is a desired feature and one of the motivations for market operation. In the evening when PV production stops, there is a spike in demand. In the net-metering scenario, the batteries discharge at a lower rate once they can only supply to their respective household. In the market scenarios, the storage systems contribute to eliminating a net demand at peak consumption time by enabling consumers to exchange their energy. This collective self-consumption effect is not derived from any schedule or optimization method but is defined by market rules.
3.2. Revenue Stream Performance Comparison
Table 3 shows the calculated revenue net gains or losses expressed as a percentage of the difference from the revenue in scenario “Base 2”, as stated in the equation below:
There is a significant decrease in revenue for the utility by DER deployment, from the no-DERs scenario (Base 1) to the presence of DERs in net-metering mode (Base 2). The market furthers this revenue loss in energy sales (Market 1). In the market scenarios, the revenue for energy sales was as much as 23% further reduced for the utility in reference to net-metering (Base 2).
This happens due to the collective self-consumption effect created by the market rules, which can allocate more effectively the energy exchanged by the DERs through the interaction of the market participants, at better prices.
The network fees are introduced as a way for the market participants to absorb these revenue losses from the utility associated with the market-based operation. In this case study, the introduction of grid fees can alleviate revenue loss by up to 10% in regard to the net-metering revenue. The further introduction of the transaction fee can even reverse revenue loss, positively impacting utility revenue compared to the net-metering scenario.
Looking merely at income and revenues, the market-based operation is a “zero-sum game” in regard to net-metering. If the prosumer benefits in revenue gains compared to the net-metering scenario, then the utility will suffer greater revenue loss. On the other hand, if the utility tries to recover its extra revenue loss by allocating fees to prosumers heavily, each prosumer perceives no motivation in joining a local energy market as opposed to staying in a net-metering regulation. Studies [
29,
30] also observe how the economic benefits for prosumers affect the system operators negatively and speak for a “golden mean” where the profits are divided; however, they do not evaluate other possible advantages for the utility as a form of compensation for the revenue loss in a more comprehensive analysis.
Even in a scenario where the prosumers perceive the market economically as less advantageous than net-metering, it does not mean that this market implementation is not beneficial for the prosumer. A complete net present value analysis could still render positive for the prosumer if the upfront investment costs for DER installation are balanced with the benefits in energy bills for the analyzed period. This analysis is out of the scope of this current study and is suggested for future research.
3.2.1. Sensitivity to Number of Agents
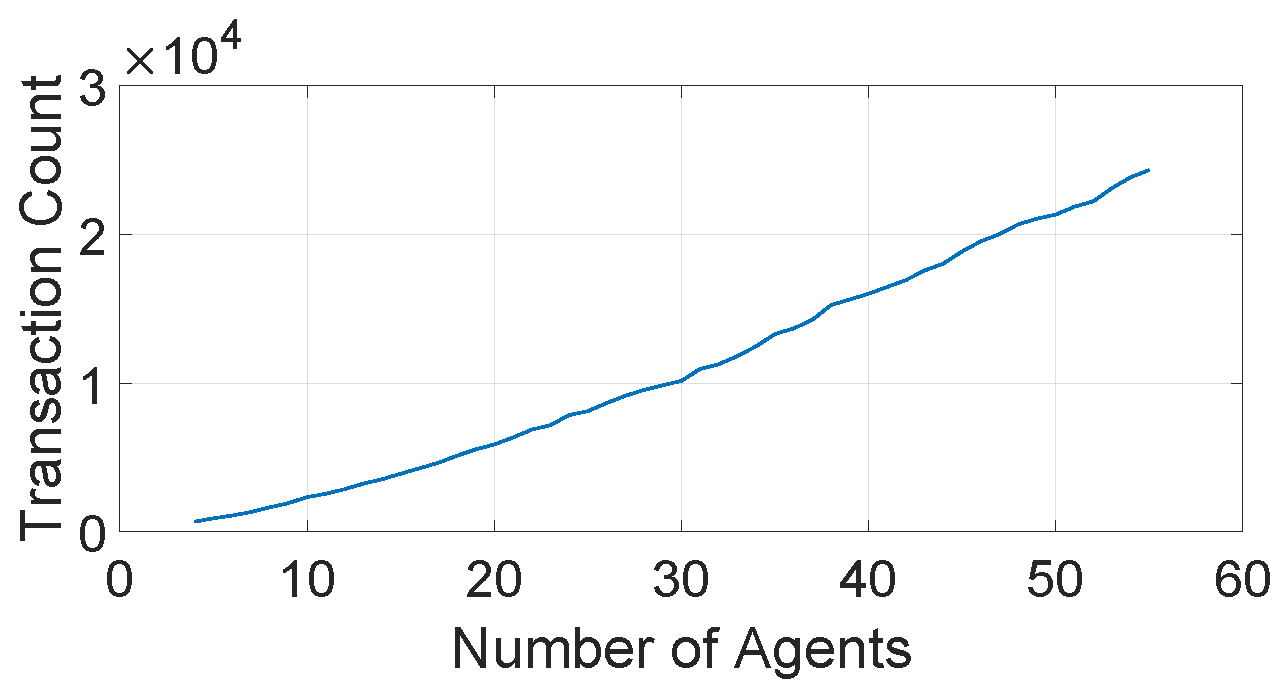
The number of market participants varied from 4 up to 55 agents.
Figure 8 shows that the number of transactions growth rate accelerates with the increase in participating agents. This can be explained by considering that the more agents participate in the market, the bigger is its liquidity.
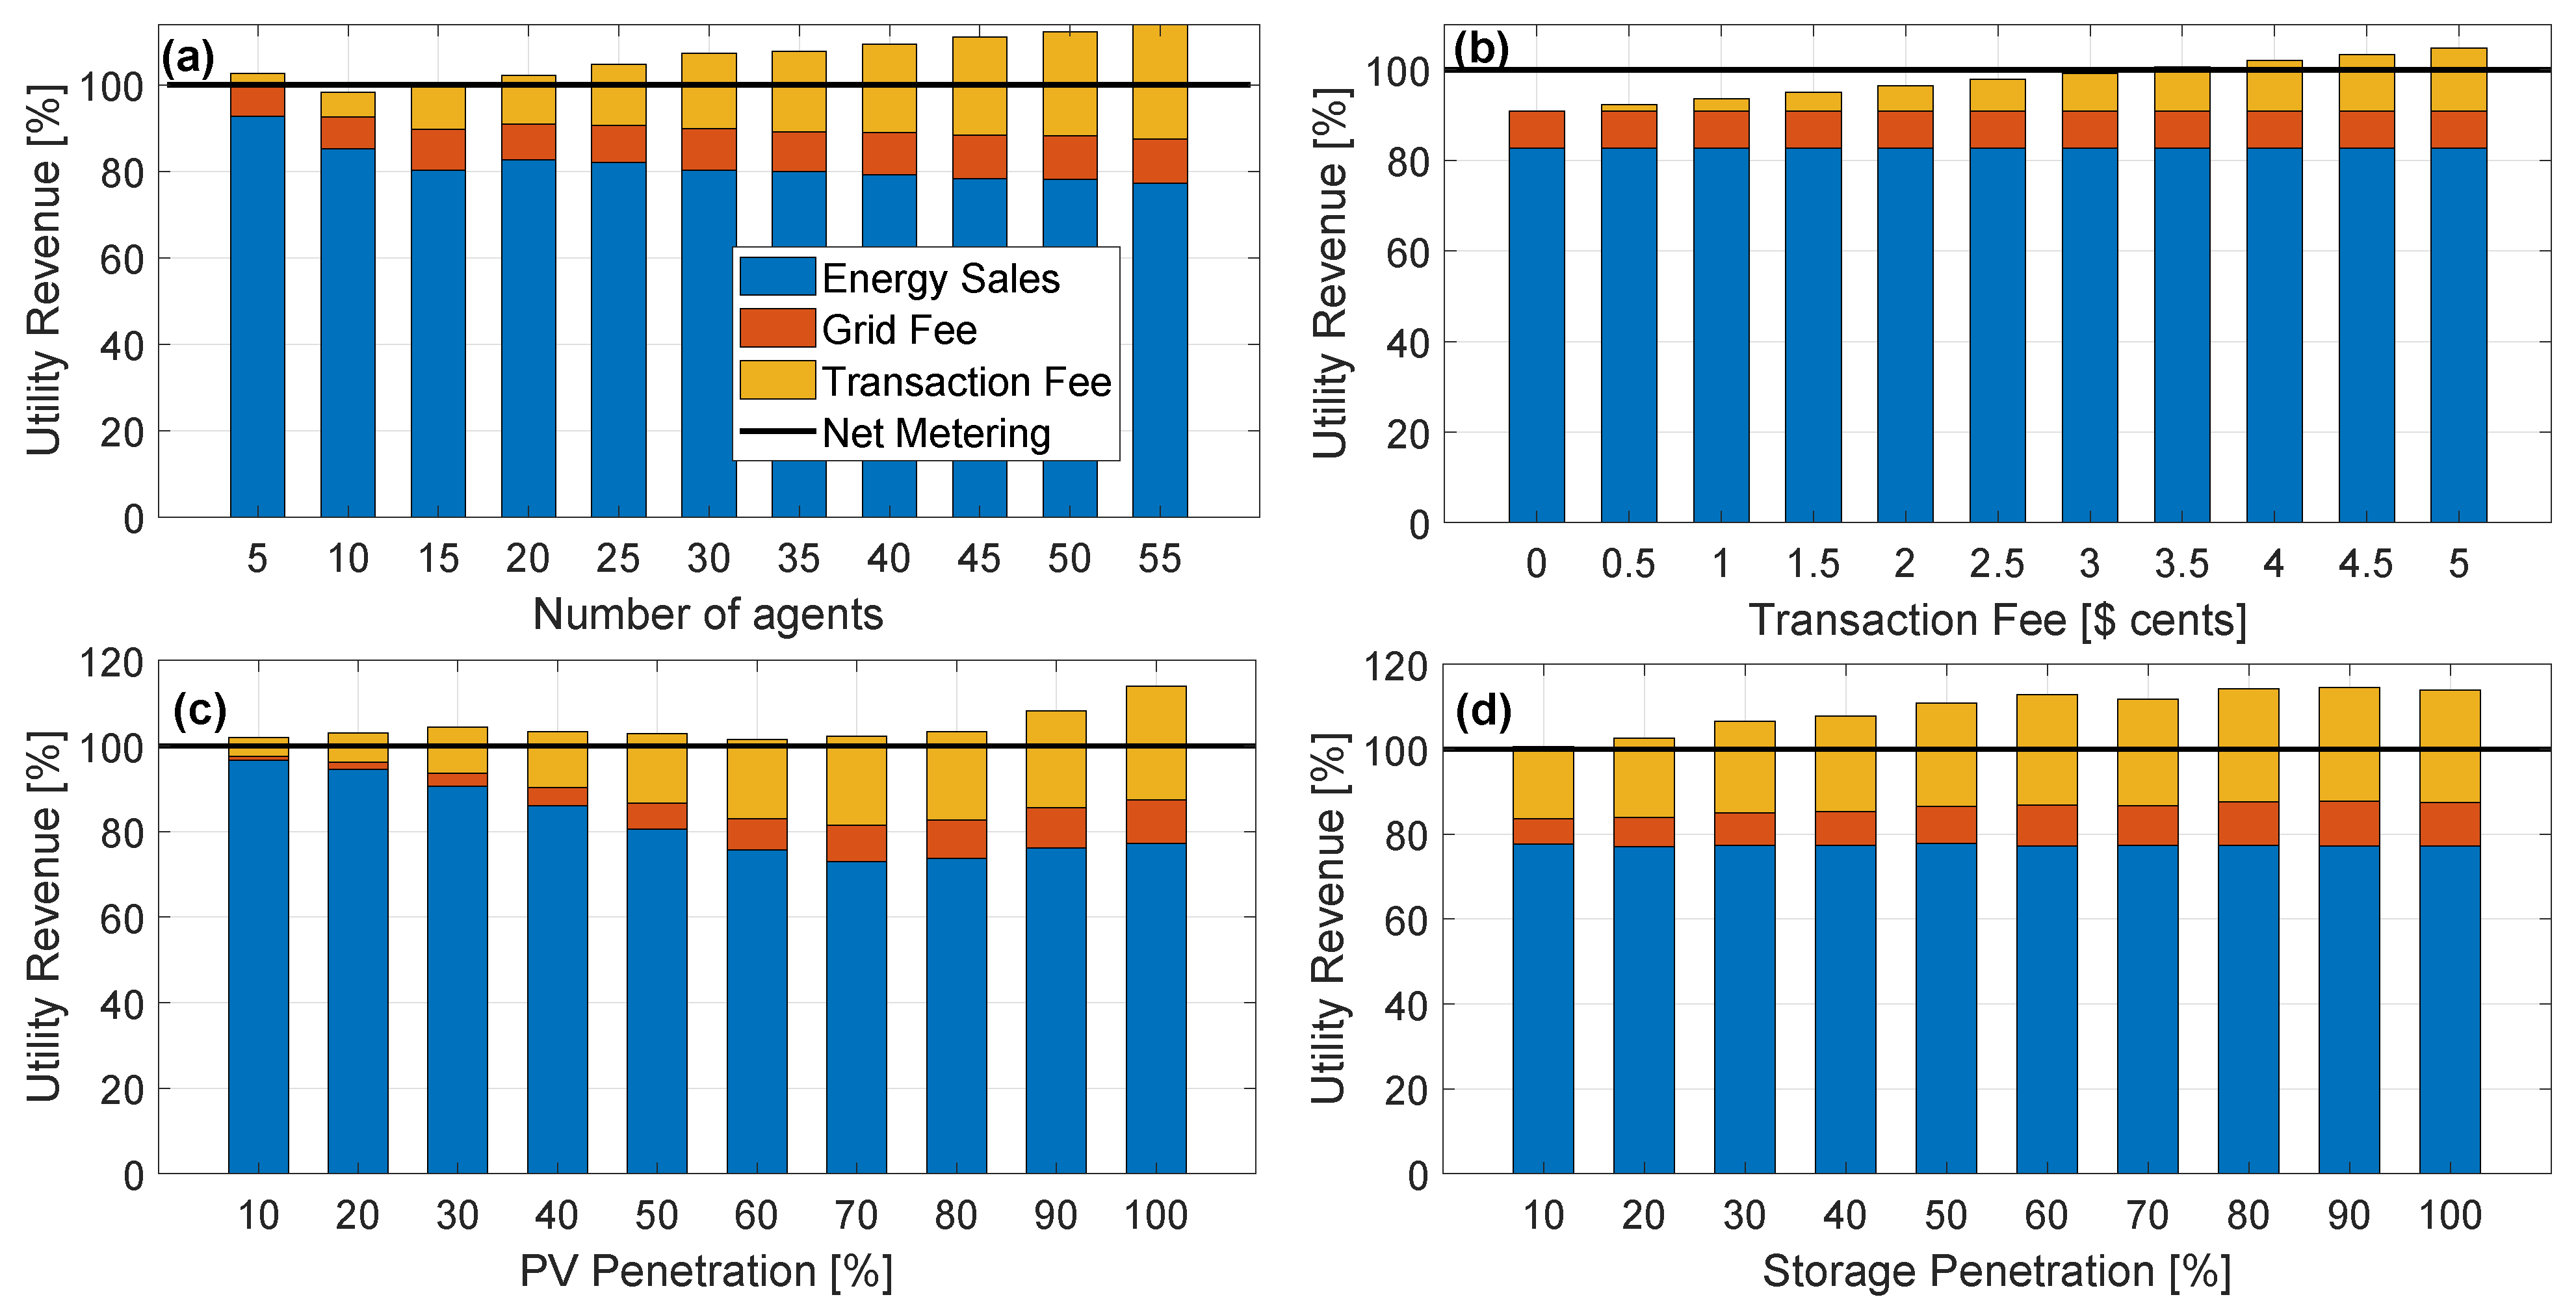
The increase in transaction count leads to an increase in transaction fee revenue, as shown in
Figure 9a, which shows the percent variation of utility revenue from the net-metering scenario as a function of the number of agents. The utility revenue from energy sales decreases with the number of participants because there are more opportunities for the agents to consume collaboratively. Still, the total revenue is increased due to the higher collection of transaction fees.
The impact of the number of participants in the transaction fee revenue could suggest to the policymakers that, in local market regulations, transaction fee values could suffer adjustments as the number of market participants increases to balance economics for all stakeholders.
3.2.2. Sensitivity to Transaction Fees
Figure 9b shows utility revenues percent variation from a net-metering scenario as a function of transaction fees. There is a specific transaction fee price from where the global income surpasses net-metering earnings.
3.2.3. Sensitivity to PV Penetration
The PV penetration varied from 10% to 100% of the participating agents having a PV rooftop, shown in
Figure 9c. As the PV proportion increases up to 70%, a decrease in energy sales revenue for markets compared to net-metering for the same amount of PV is perceived, after which it increases again. This points to a certain optimal quantity of PV/storage ratio deployment, where the market is the most economically efficient for the prosumers. This is because the dependency from the grid is minimized at this point, and after which, the further gains in increasing local PV generation depend mainly on the energy export.
With fees being able to counter the revenue loss from increasing PV deployment, the increasing PV could be observed as positive by the utility.
3.2.4. Sensitivity to Storage Penetration
Figure 9d depicts that the storage amount variation does not affect energy sales revenue in market scenarios. When comparing the net-metering to market operation by the reduced presence of storage, the grid does not perceive much difference in operation, and the utility suffers revenue loss in energy sales. When storage deployment is increased, there is an increase in revenues from fees and more flexibility in operation. This suggests to the utility that the presence of storage is to be motivated.
The comparison of revenue impacts showed that the market is a strictly competitive game between prosumers and utility. However, an economically balanced solution for both can be conducted by carefully implementing network and market fees. These fees should be dynamically regulated as a function of the number of market participants and DER penetration. This could motivate the utility to implement peer-to-peer local energy markets, provided that other non-financial aspects of this implementation are beneficial.
3.3. Unwanted Effects in Grid Operation
3.3.1. Voltage Profile
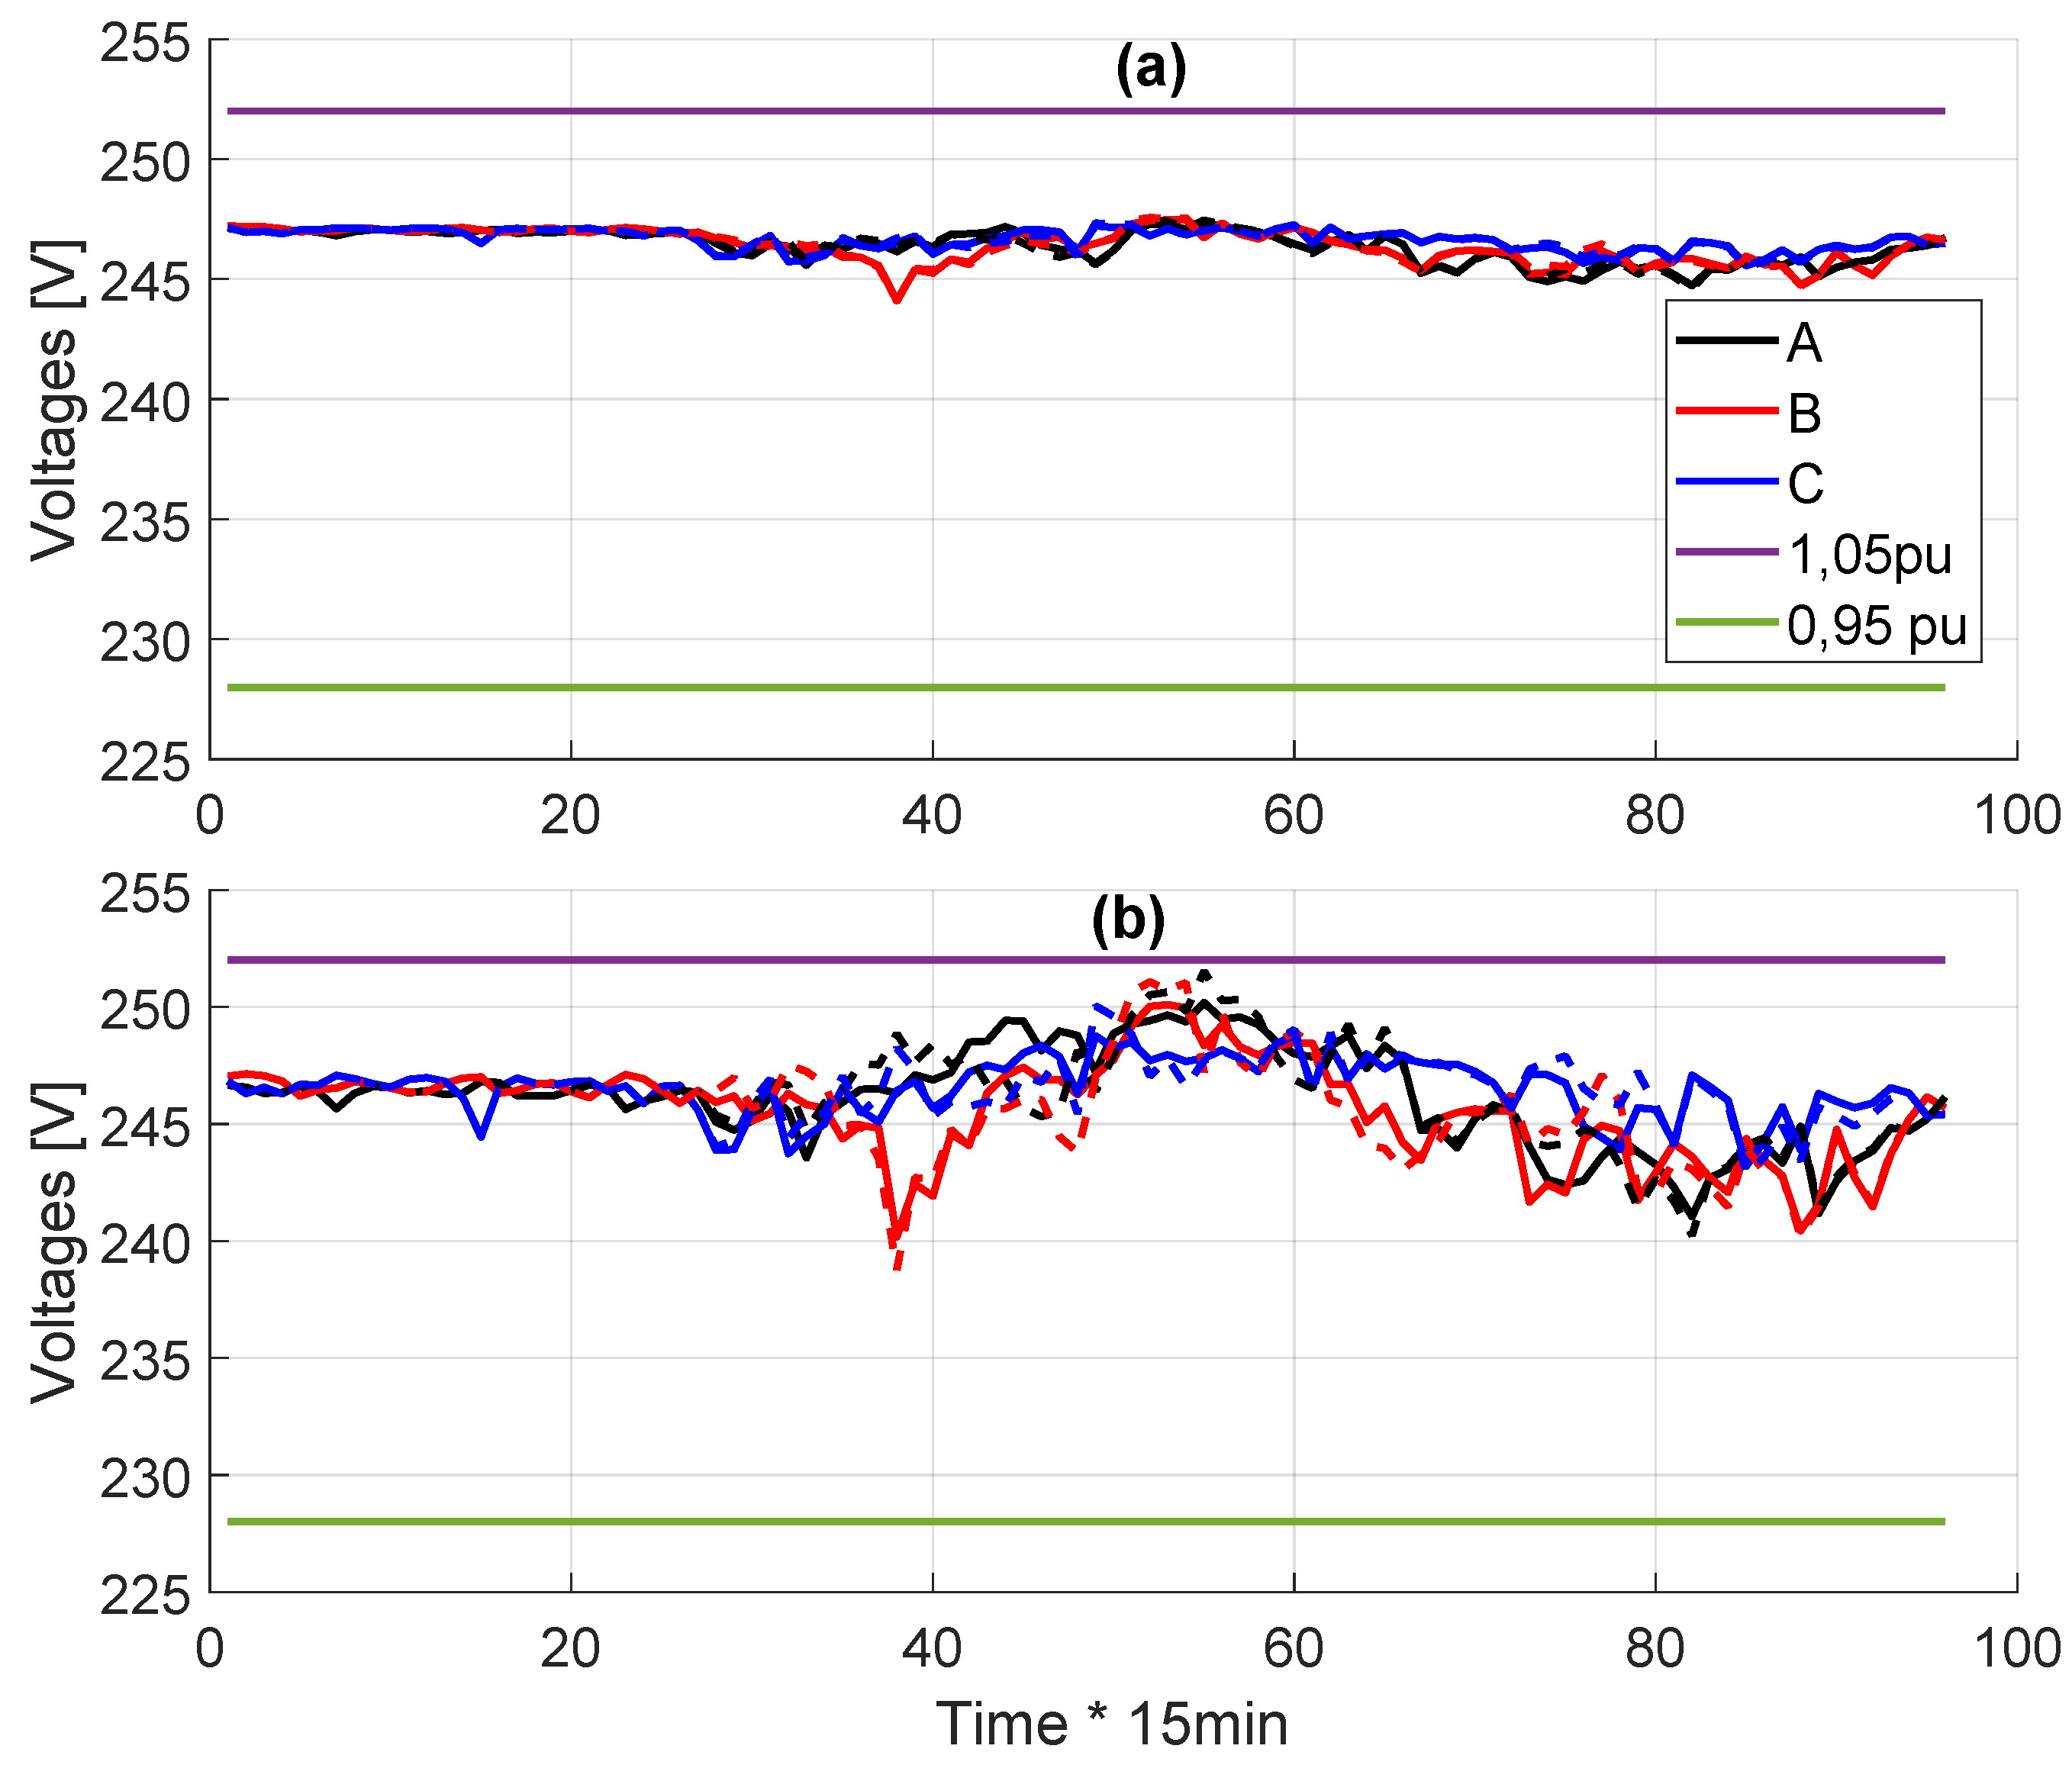
Figure 10 shows the 3-phase voltages on the feeder transformer’s low-voltage side and the voltage on the furthest point in electrical distance from the mentioned transformer. In the worst case, no voltage has broken the limits between
and
pu. However, in the market scenario, the voltages tend to be more volatile during sunny hours. At the traditional peak load time around 6 PM, the market operation benefits the grid by presenting less voltage drop.
The study [
23] compares the grid performance for P2P and no-P2P scenarios and finds that the voltages tend to fluctuate more in P2P trading.
3.3.2. Transformer Load and Load Factor
The transformer is less solicited in market operation than in net-metering operation at the beginning of the evening time, the highest peak during the night also occurs during market operation. This can be measured through the transformer load factor (expressed in Equation (
10)) (
Table 4), which deteriorates for the market-based scenario:
3.3.3. Circuit Losses
The sum of all circuit losses is shown in
Table 4. There are no significant changes in circuit losses from one scenario to another. This is an opposite finding than [
23], where the P2P trading scenario present significant more losses than the no-P2P scenario. In that study, the batteries are designed to engage in arbitrage, which provides a substantial difference in the operation.
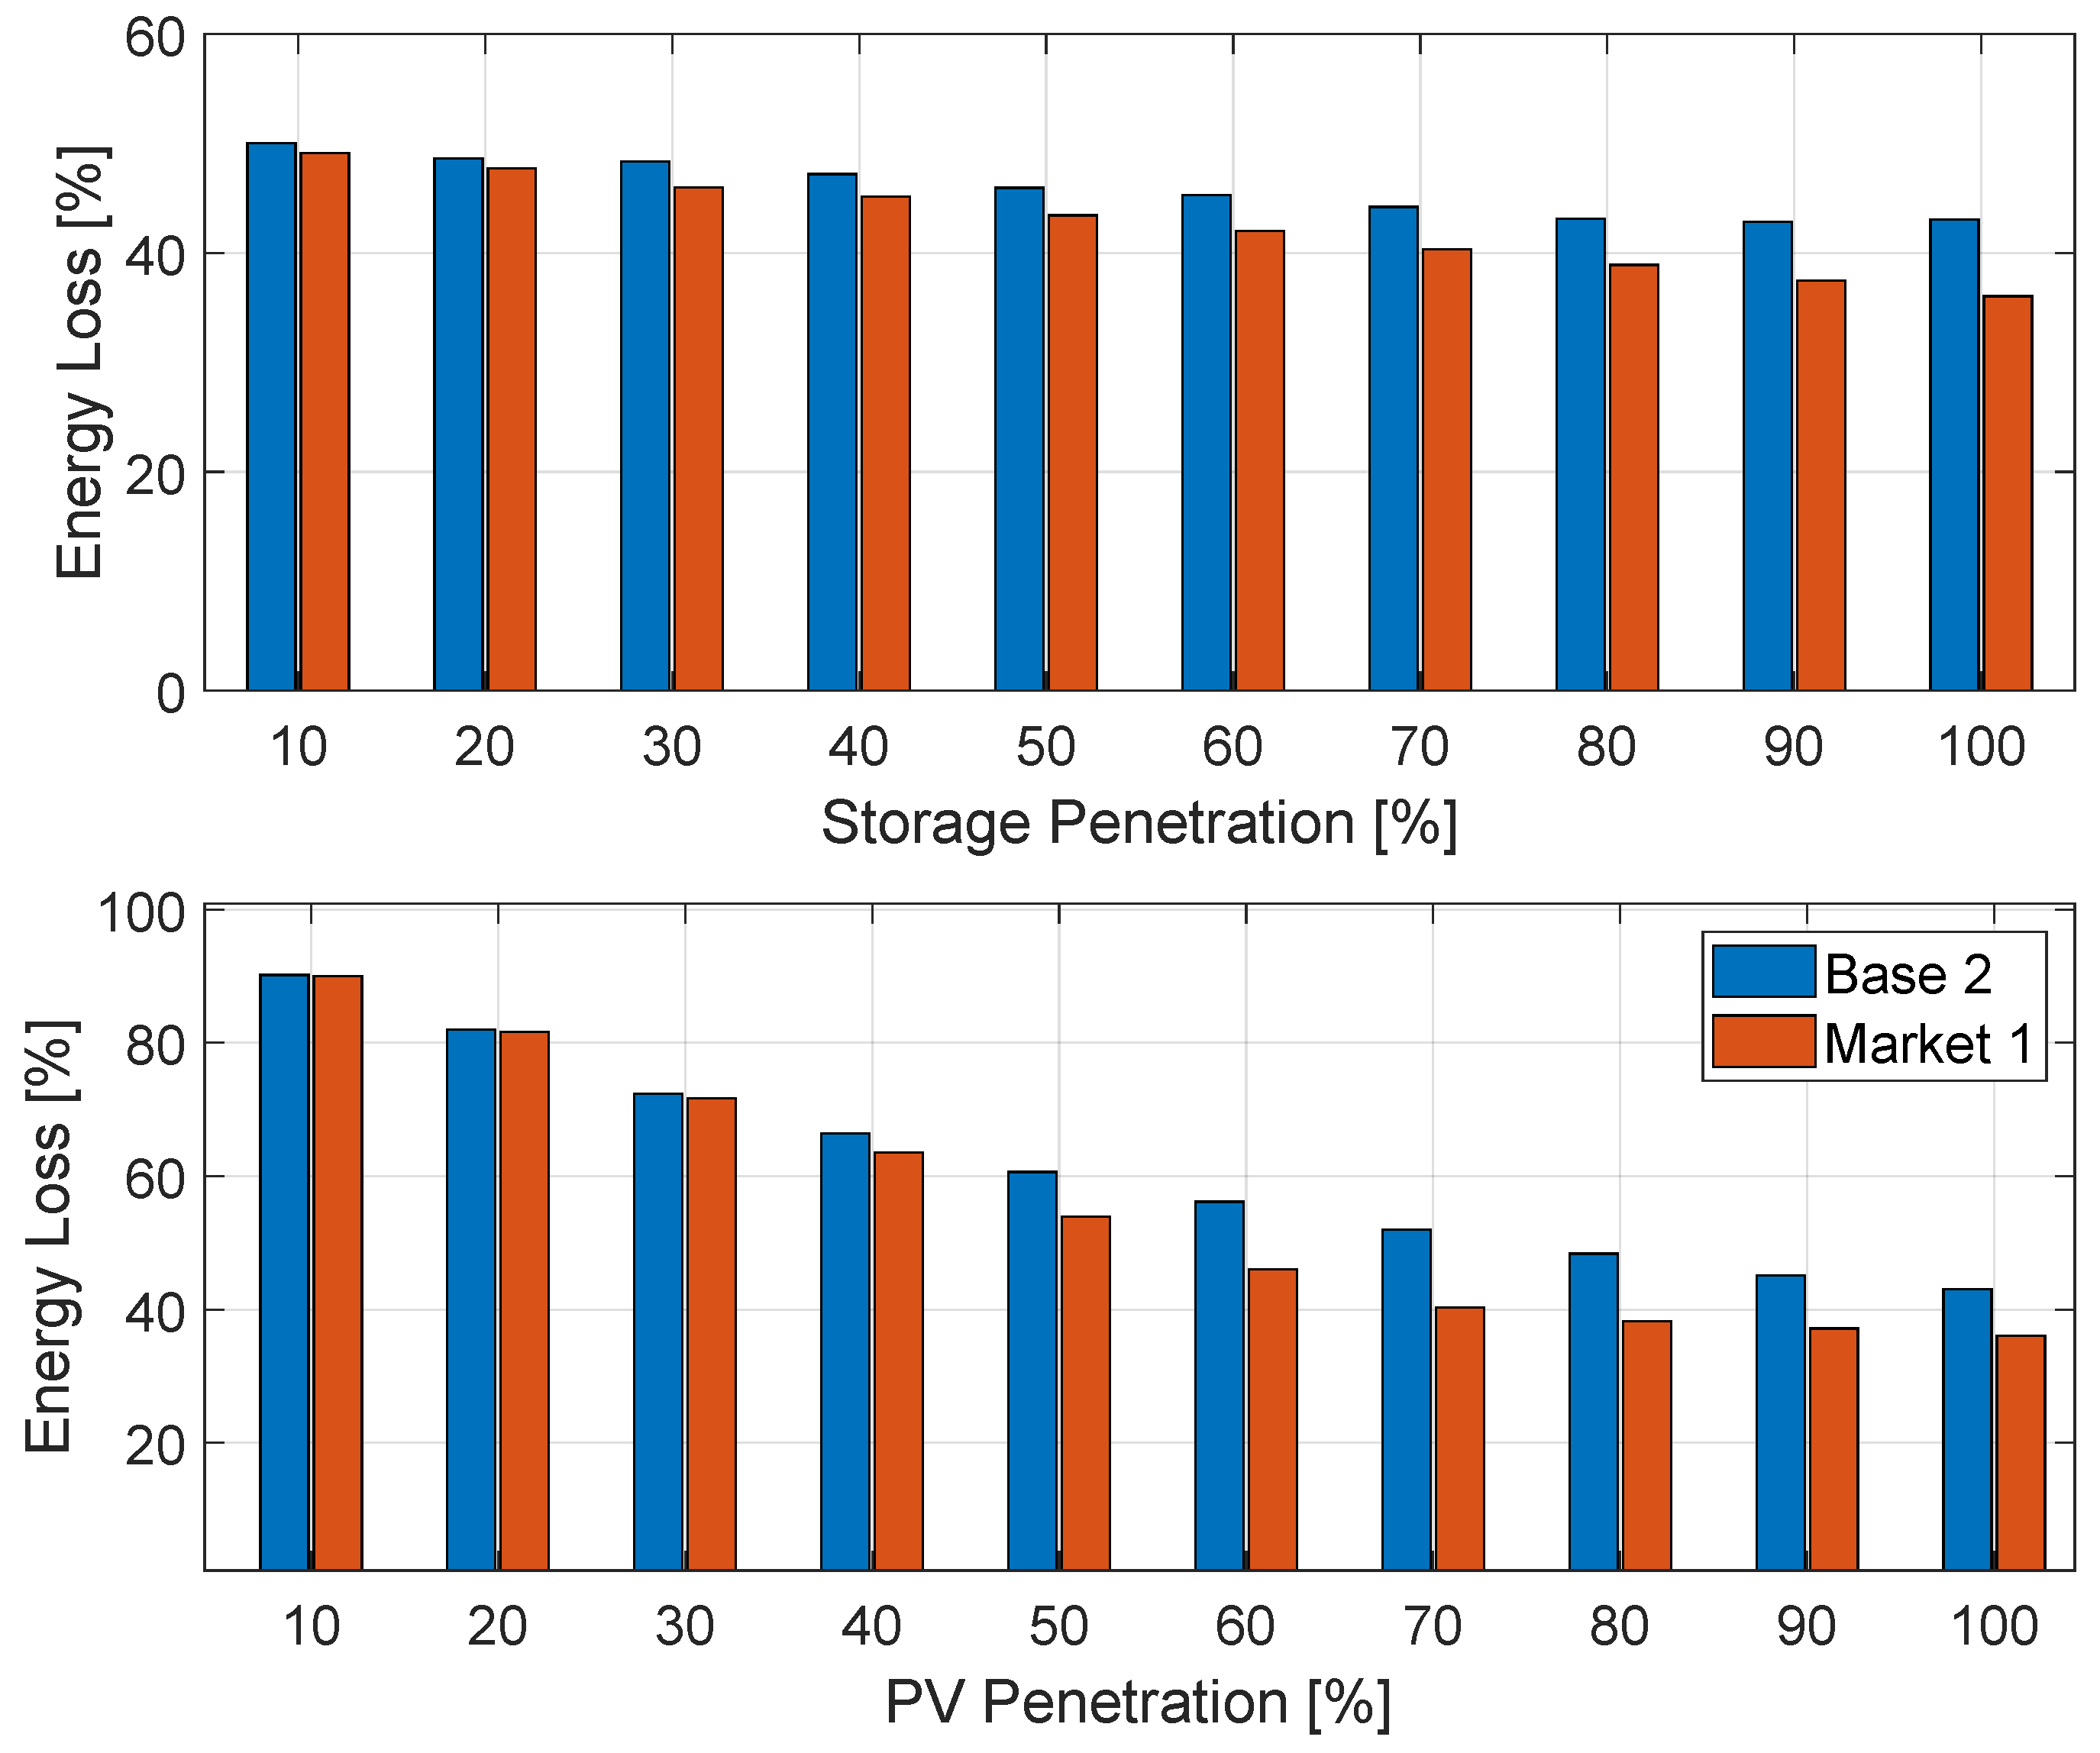
3.3.4. Sensitivity to PV and Storage Penetration
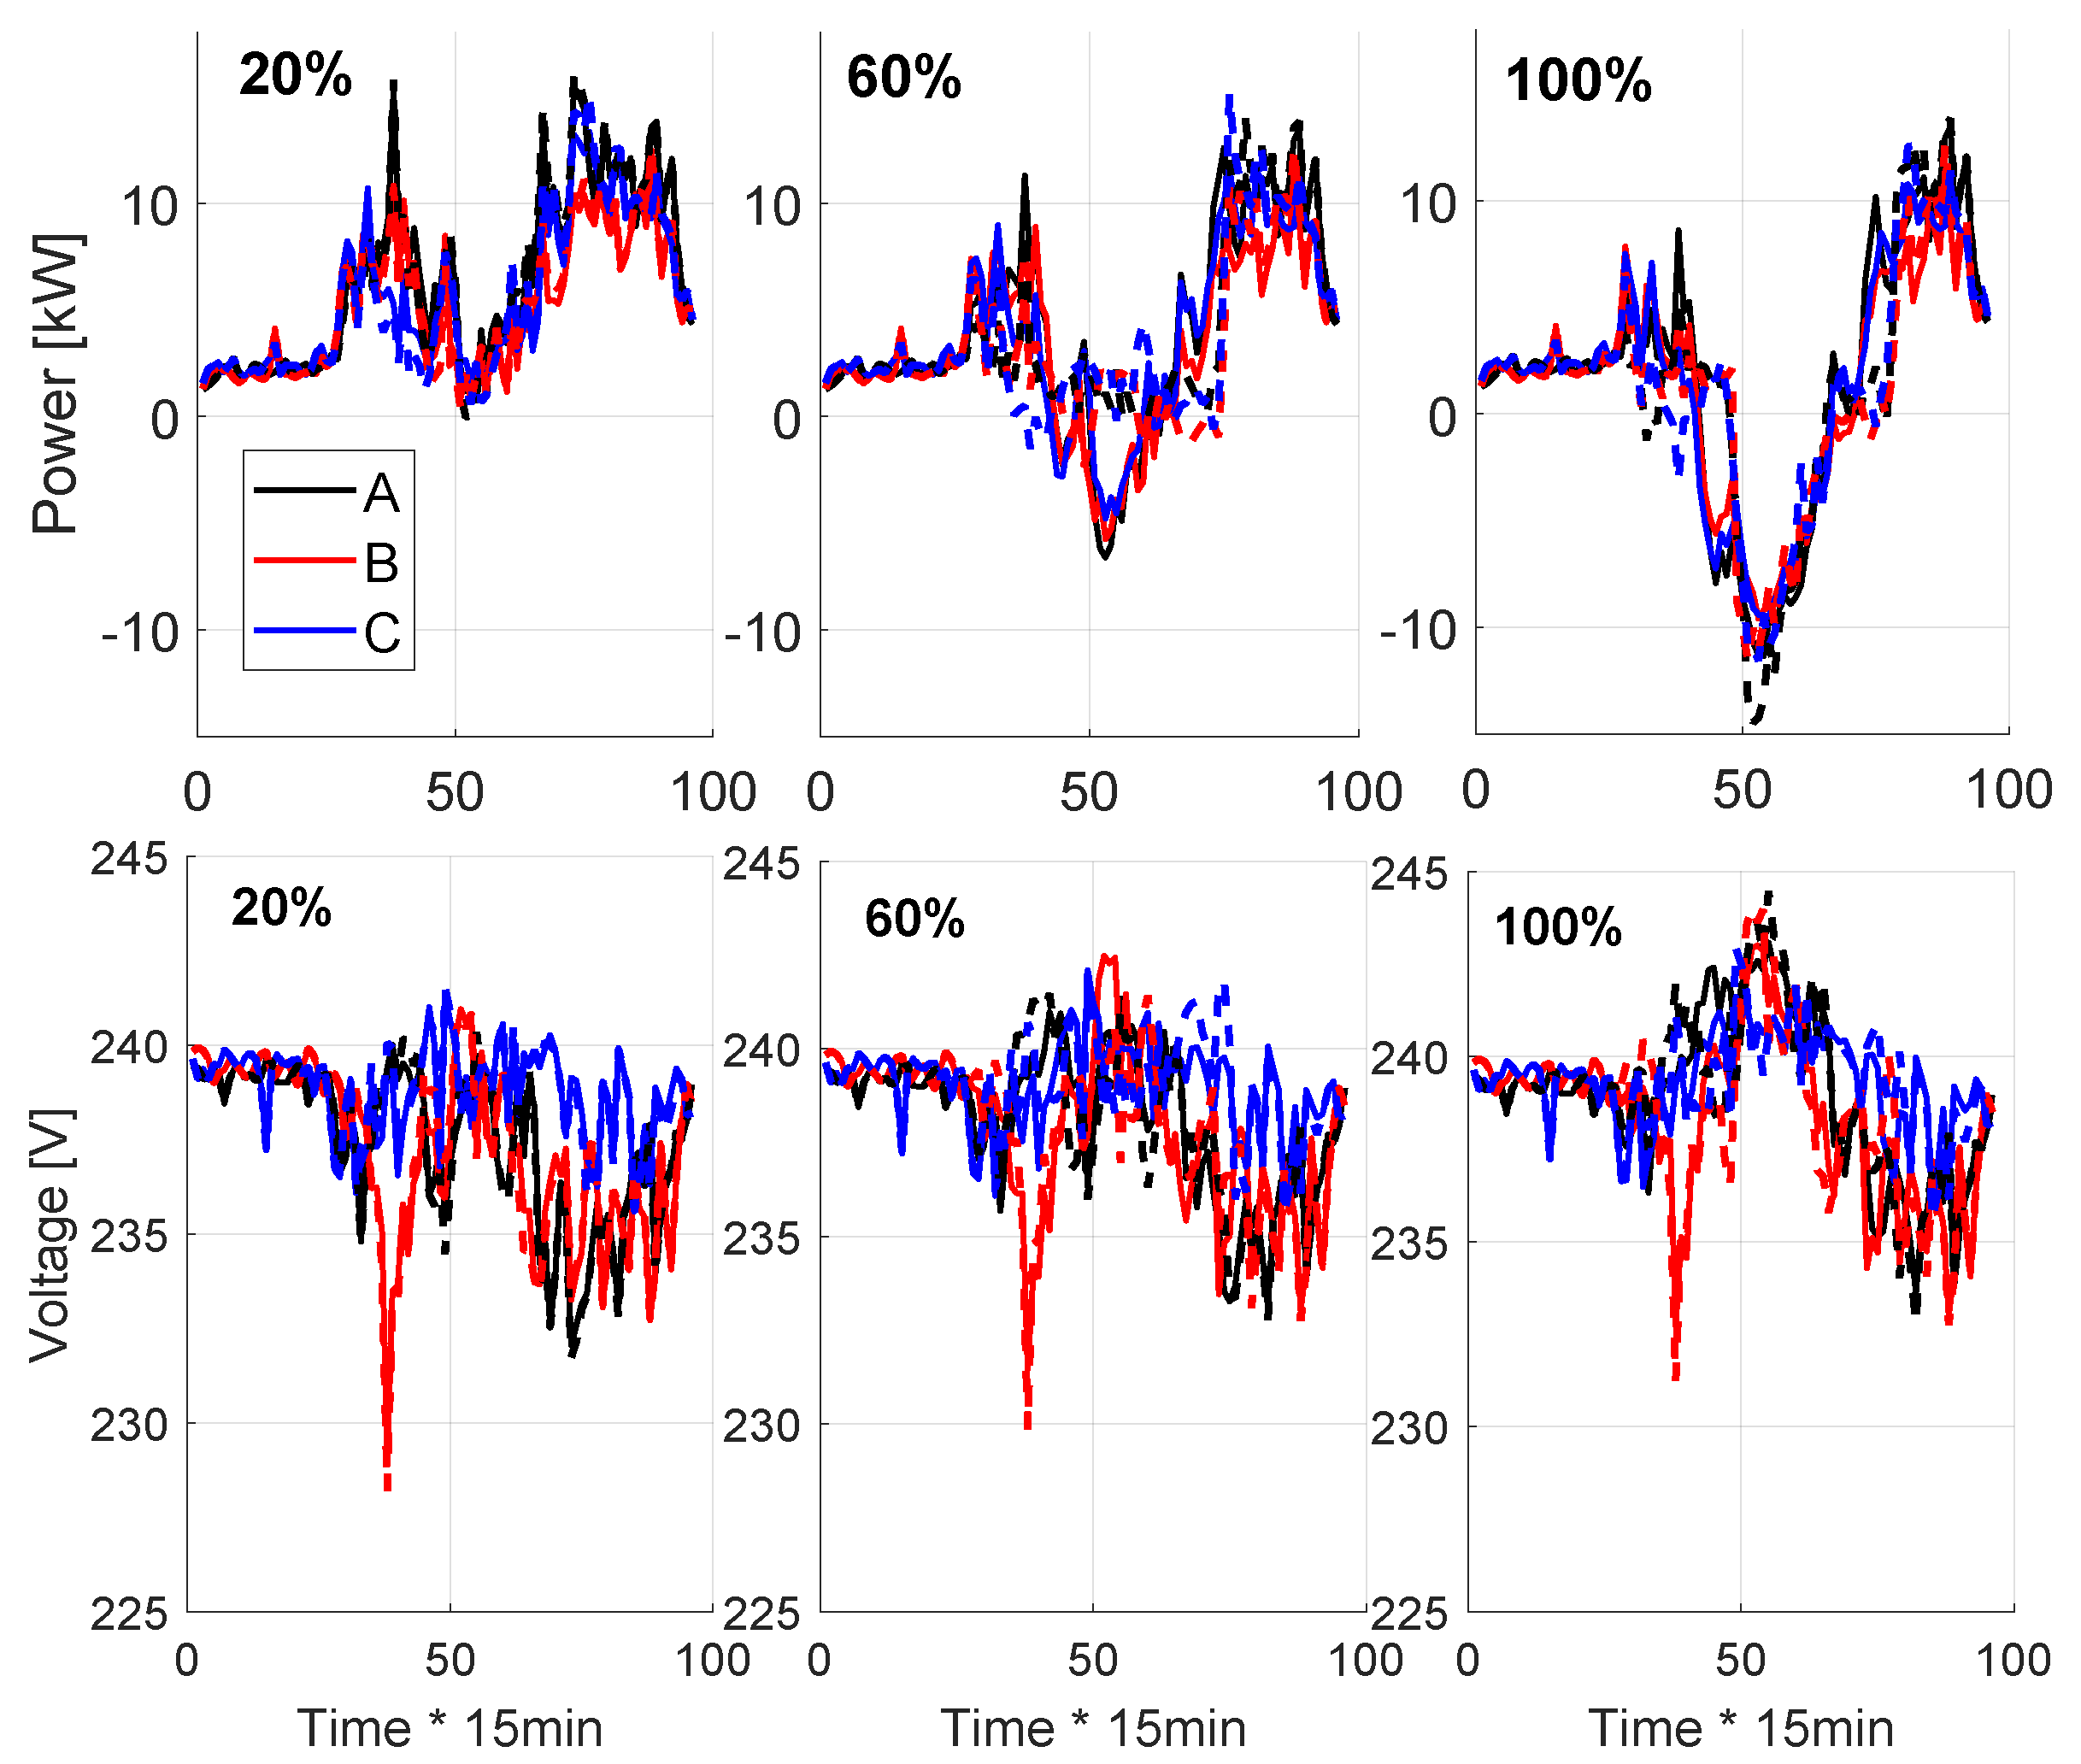
By around 60% PV penetration, the market-based operation can eliminate the reverse power feed into the main grid due to the effect of the market-ruled collective self-consumption. This is confirmed by evaluating the power at the transformer and voltages on the furthest node (
Figure 11). The overvoltage at peak PV surplus by 60% penetration is managed better in the market than in the net-metering. By 100%, the market scenarios have higher overvoltages at peak PV surplus than the net-metering scenario. This means that the P2P energy impacts on the grid depend on market designs and the proportion of DER deployment.
The observed impacts and effects on grid operation for the storage variation did not demonstrate significant divergence from the base case results. Ref. [
21] also varies storage penetration for P2P and non-P2P operation, but focused on energy losses, with the same conclusion.
3.4. Local Energy Markets as a Non-Wire Alternative to Infrastructure
Such as previously discussed in
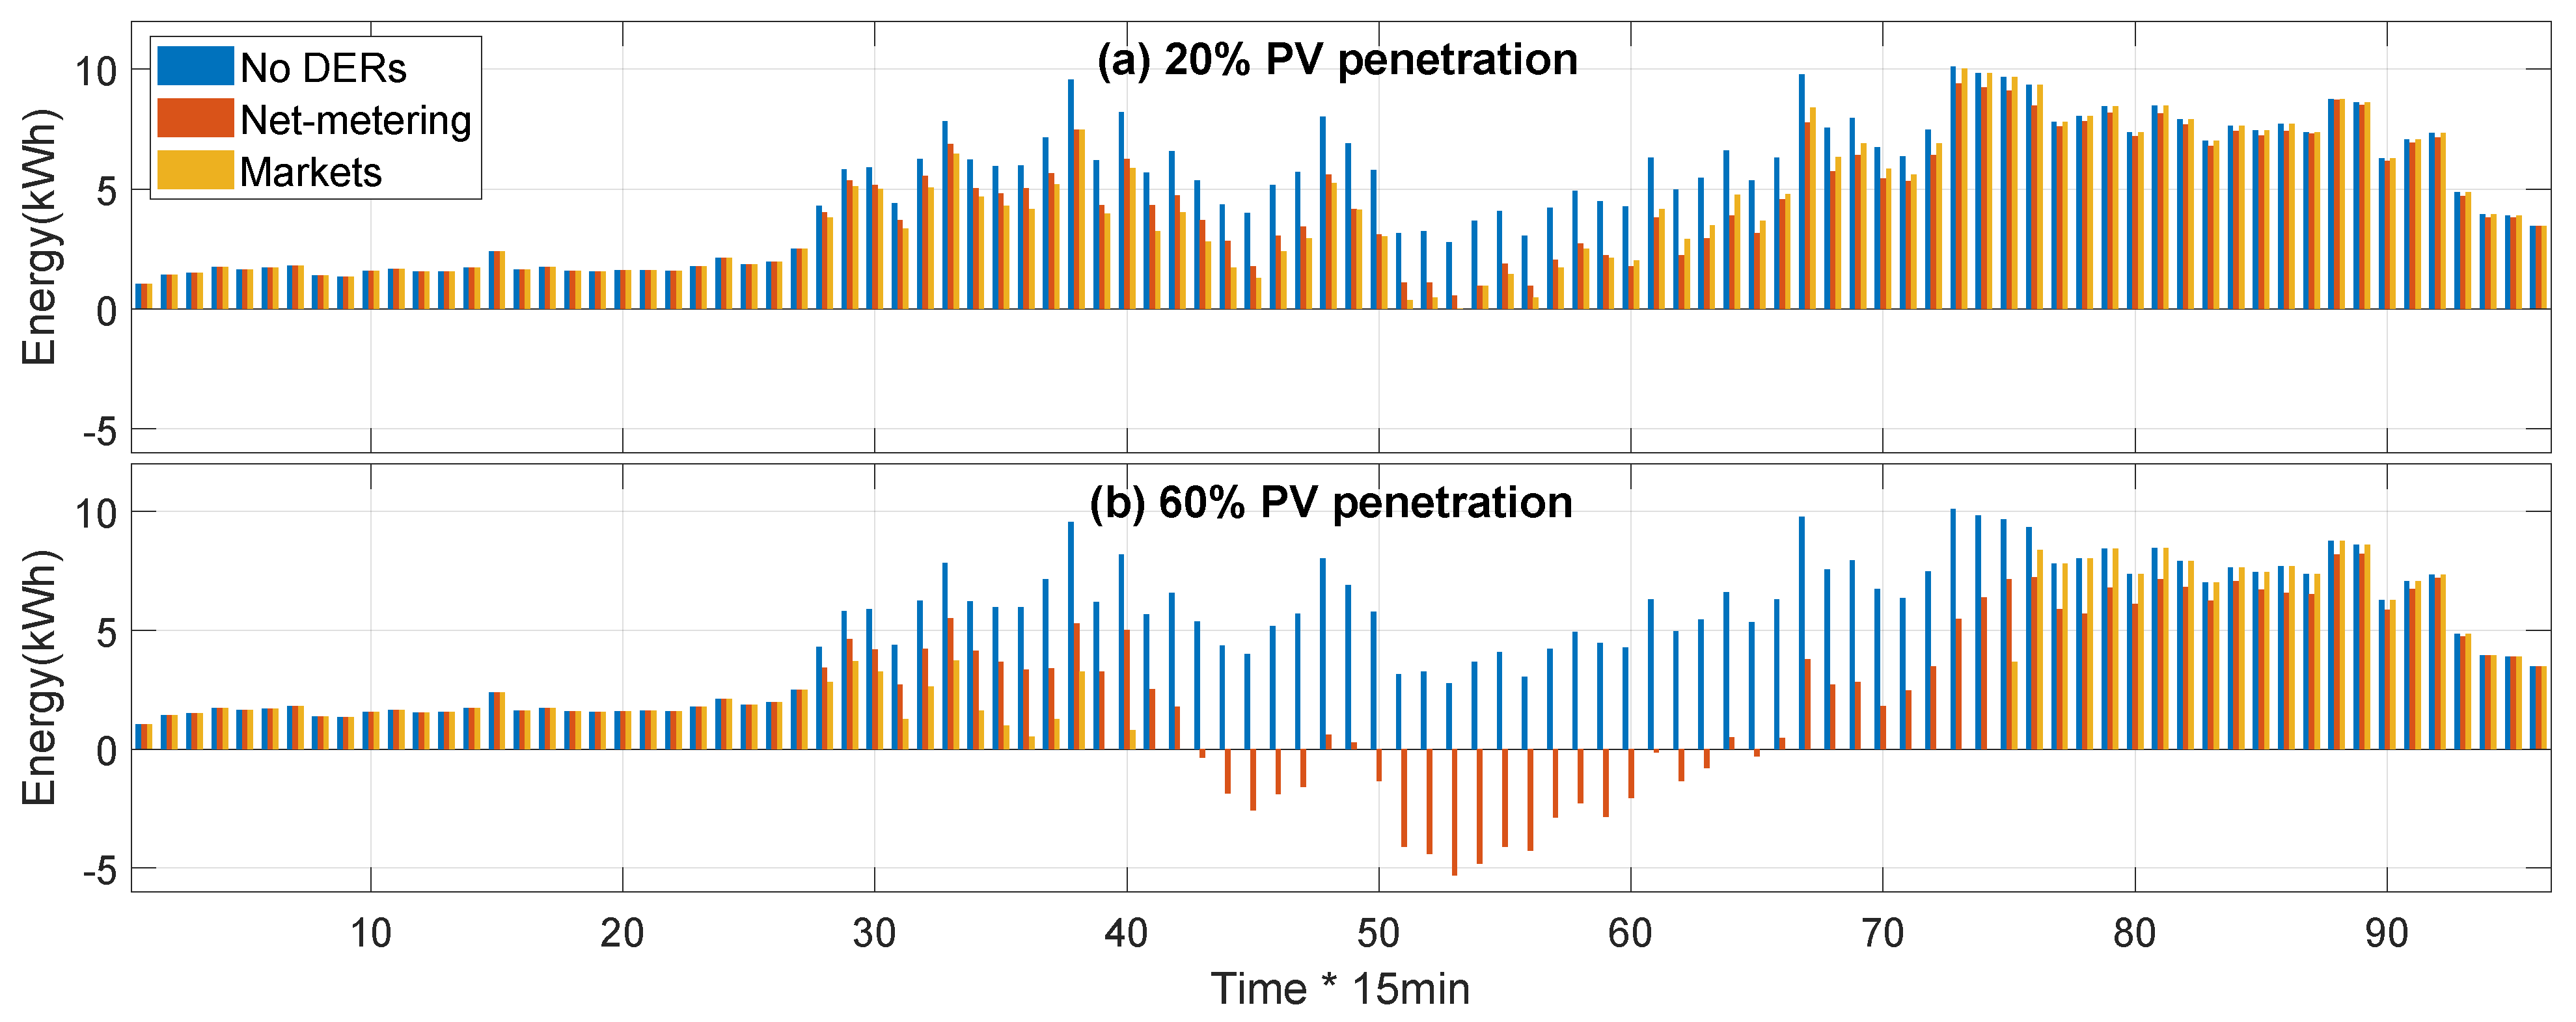
Section 3.2.3, there is an optimal amount of PV, which minimizes the main grid dependency (between 60% and 70% penetration). As observed in
Figure 12, a 20% penetration is not enough to differentiate market and net-metering operations. With 60% PV penetration, the market scenario operated for some period without exchange with the main grid and managed to avoid reverse power flows. The market framework taps better into the DERs’ flexibility, which can help with the grid investment deferral. However, the PV/storage ratio must be carefully considered for this effect.
3.5. Local Energy Markets as One of the Approaches to Locally Coordinating DERs
Net-metering and LEM approaches can be observed as forms of local coordination of DERs, or how do these approaches compare in terms of the independence of the main grid? To make such an evaluation, the net energy both frameworks require from the main grid for varying DER penetration is compared, as means of testing how impacted the loads would be in case of disconnection from the main grid. This has at least two related consequences: one is the acceptance by the prosumers considering their security of supply, and the other is the impact on utility interruption indexes.
Figure 13 shows the average load loss for net-metering and local market scenarios for different PV and storage penetration, respectively, as a percent of the load loss in the case of no DER scenario (
11).
It is observed that the load loss is reduced at a greater rate for the local market scenario in comparison with net-metering with the increase in DER deployment. The local market framework has an advantage over net-metering in this aspect, given that it can better address load loss issues by grid disconnection.
Regarding the overall operation performance comparison, both utility and prosumers can benefit more from the market operation due to its greater flexibility and opportunities to improve network usage as long as a careful planning horizon with the growing number of participants and varying DER penetrations is considered. A possibility would be the active allocation of DERs by the utility to help grid operation, as observed next, strategically.
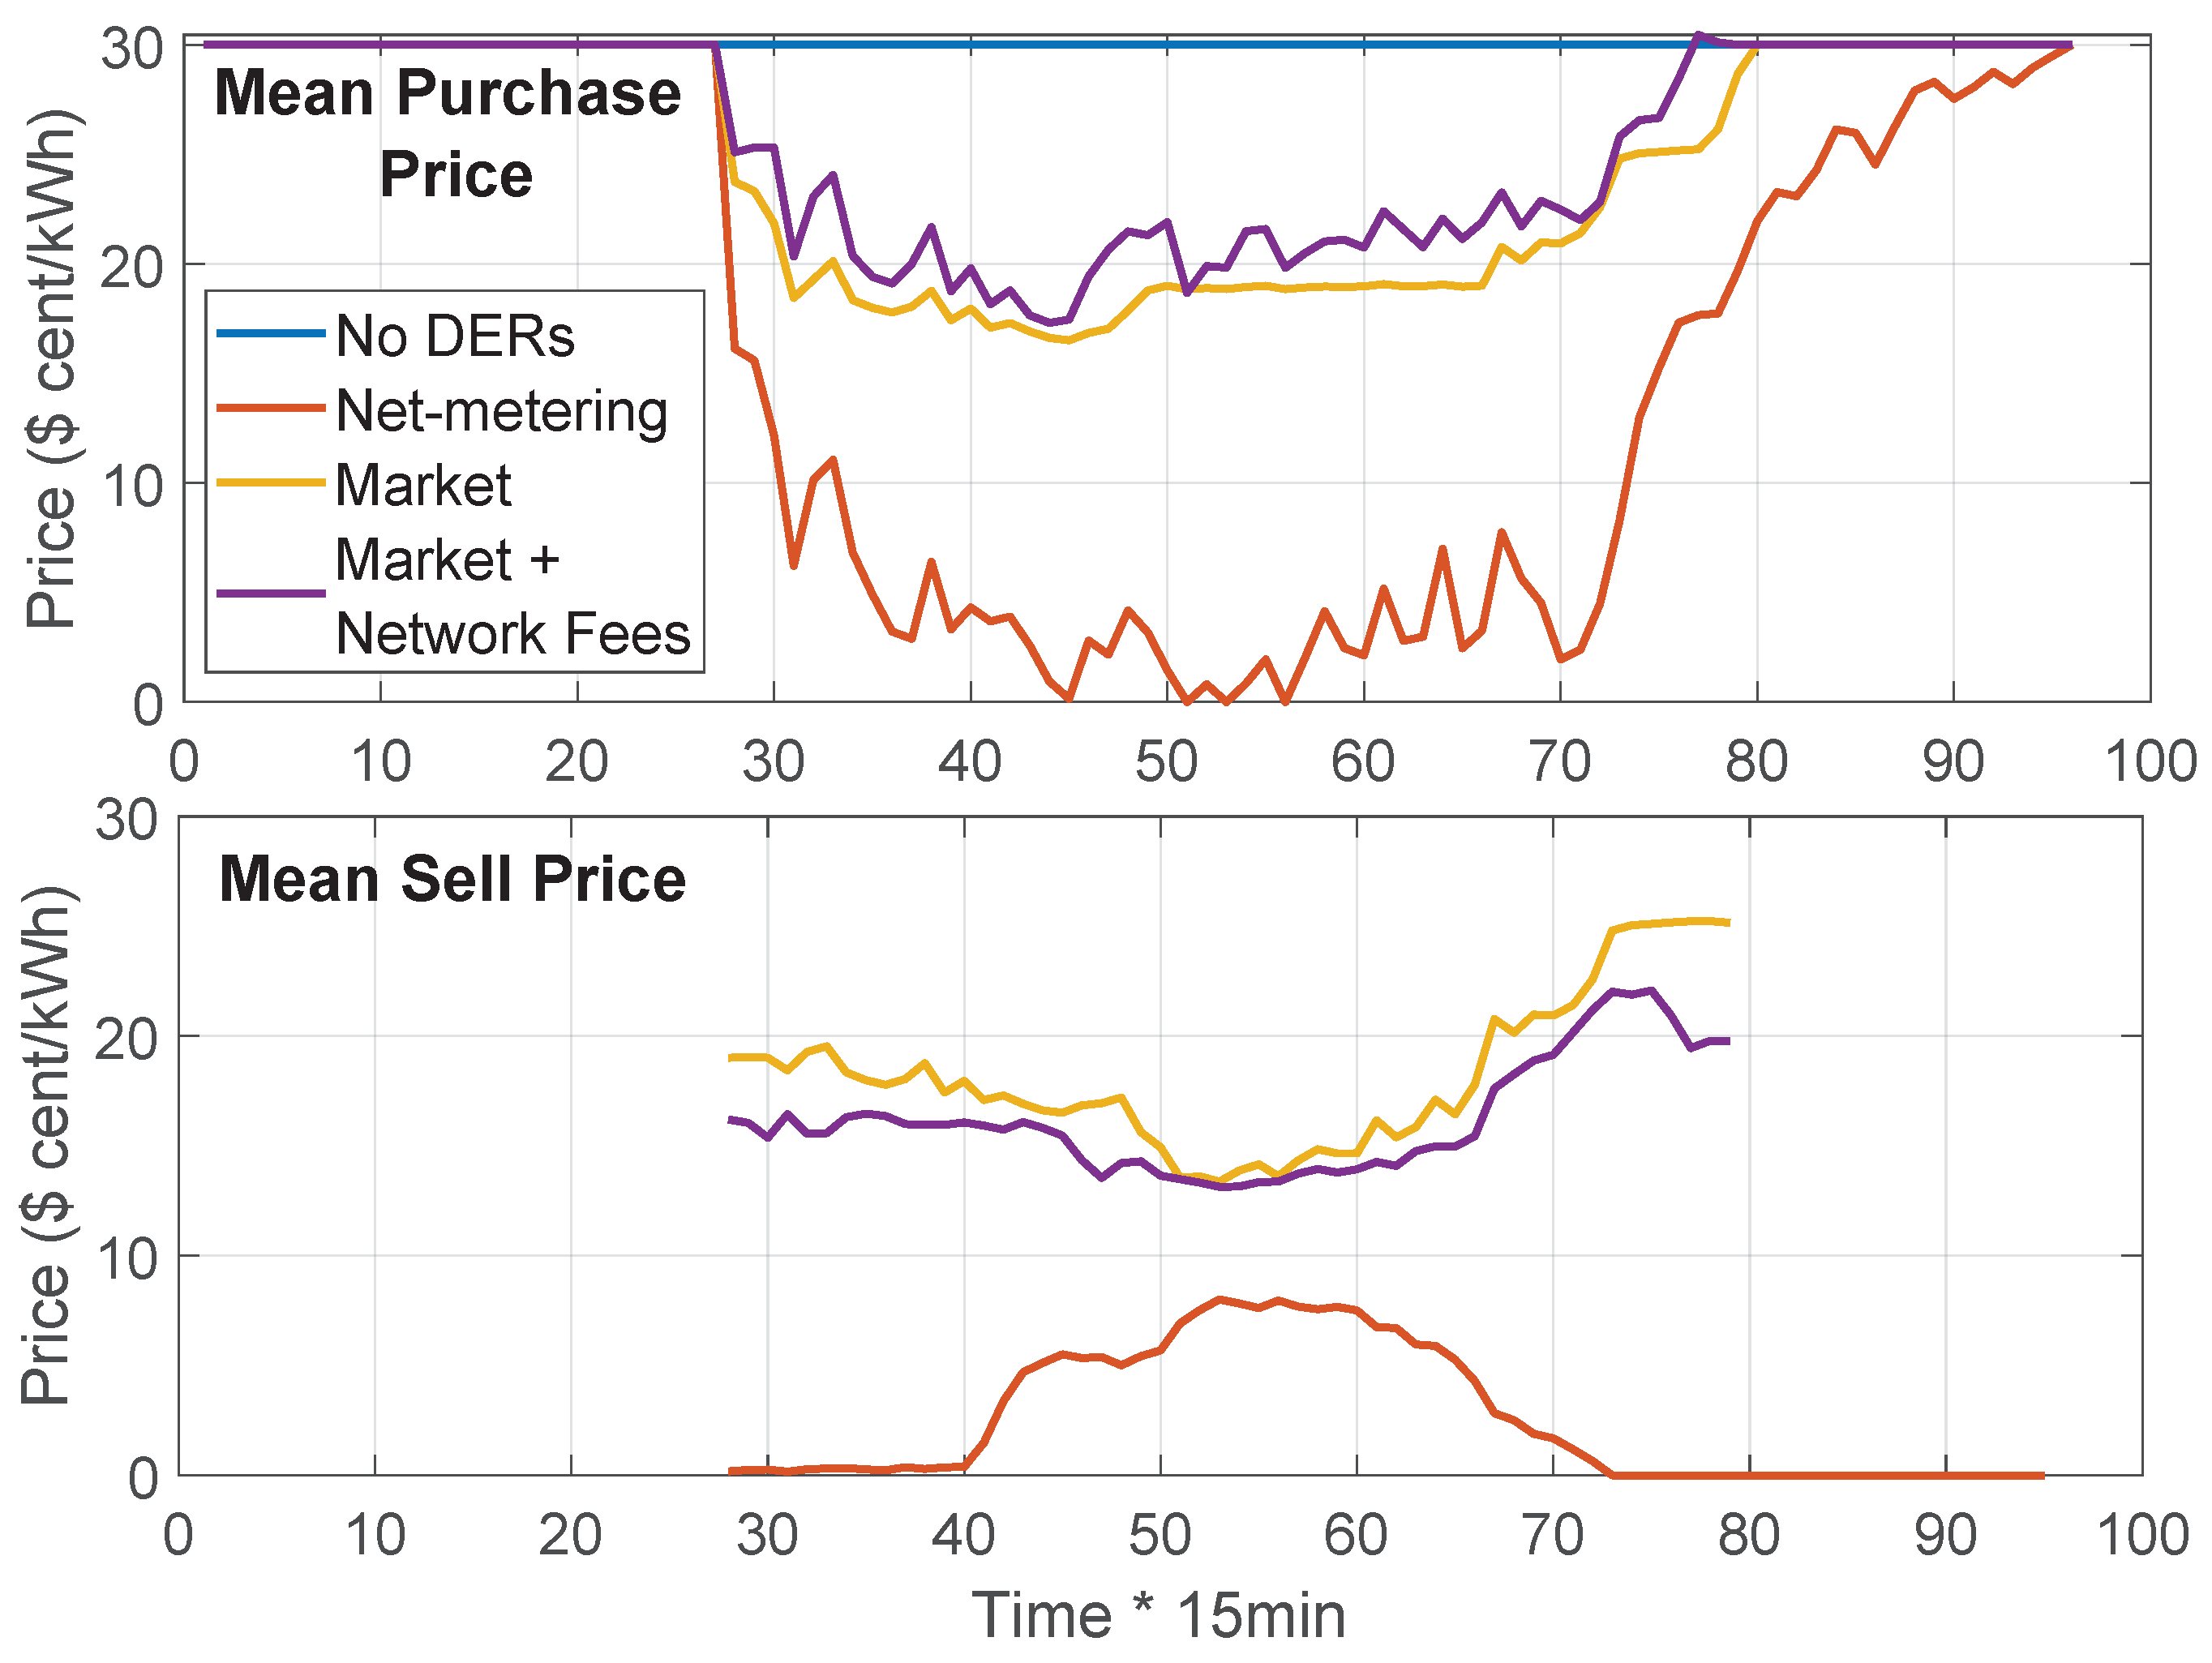
3.6. Reducing Costs for Prosumers
As already shown in
Section 3.2, the local market scenarios bring advantages for the prosumers as opposed to net-metering in terms of the reduction in energy bills, as long as the transaction fees are not too high.
When allowed to participate in the market, the prosumer will observe a change in perceived prices for buying and selling energy. The mean value of the purchase and sell prices can be observed in
Figure 14. The perceived prices for buying energy in the local market are greater than in net-metering (prosumers “buy” from their PV in the local market scenario). Prosumers with PV also perceive a better price for energy sales, which results in a lower total energy bill. For households without PV, the market scenario enables electricity purchase from the neighbors at a smaller price than the utility tariff.
4. Discussion
With the basis of the found results, the research questions posed in
Section 1.3 are discussed.
Regarding the revenue impact comparison, the analyses demonstrated that market-driven systems are still challenging to tackle to provide both prosumers and utilities with motivation enough to adopt and participate in the market. Recapping conclusions from other works, the studies presented in [
29] evaluated the retail market performance for DERs under different stakeholder perspectives, and reached that the utility is not profiting as much from a retail market scenario as from net energy metering or traditional scenarios. It proposed then, that the utility turns its objective from making a significant profit to an approach of social equity and profit socialization. Moreover, ref. [
30] saw how the economic benefits for prosumers affect the system operators negatively and speak for a “golden mean”, where the profits are divided. In [
25], the perspective of the energy retailer was the focus as opposed to the prosumer, and the advantages for this retailer in terms of revenue compensation, are also explored. This study also brought out the importance of economic balance for the utility. The current study confirms the previous findings and takes this conclusion a step further: when we look exclusively at revenue, there is no possibility for both prosumers and utility to benefit simultaneously compared to the net-metering scenario. Whenever a positive impact in revenue is proposed to the utility, the prosumers are negatively impacted and vice-versa. This already implies that there is no path for adoption without integrating other possible benefits to the utility into the analysis.
None of the aforementioned studies quantified other possible advantages for the utility as compensation for the revenue loss in a more comprehensive analysis. Our study demonstrates that non-financial aspects must be considered as possible motivations for both utility and prosumers, such as (a) gains in operation, (b) DER implementation as non-wire alternatives, or (c) suitable approaches for local grid coordination. These three aspects are discussed below.
Looking at (a) gains in operation, the study in [
23] compared the grid performance for P2P and no-P2P scenarios and finds that the voltages tend to fluctuate more and losses are higher in P2P trading, showing a clear disadvantage for the market scenario. In another study [
31], a low voltage network is also analyzed, finding advantages in operating the grid in a P2P market scenario, in comparison to a base case with no DERs in a traditional utility operation.
At the grid performance comparison, our findings, compared to the other studies, demonstrate that the operation impacts are highly circumstantial. In our study, the simulated base case did not positively impact the utility in regard to the net-metering scenario. However, when varying the PV and storage penetration, some setups can improve grid operation in the market-driven scenario. That explains why some P2P market studies demonstrate a positive and others a negative impact on grid operation: those impacts will depend highly on the grid configuration.
By comparing net-metering and decentralized markets as a (b) non-wire alternative to infrastructure investment, we found that the market operation has better potential for flexibility. Nonetheless, “proper” operation setups must be found to explore this flexibility regarding PV/storage penetration sensitivity analysis. In previous works, most P2P analyses assume a given penetration of DER, which provides a static framework. This does not allow utilities to establish plans assuming different levels of DER in their networks, where real-world LEM deployment is known to happen throughout a planning horizon with varying DER penetrations.
The next advantage for the utility would be the functioning of the market-based scenario compared to net-metering as a (c) better approach for the local coordination of DERs. This study shows a clear advantage of the market operation, since it taps onto the potential for collective consumption of the group. By analyzing a hypothetical islanding situation, the market operation could coordinate the resources better to tackle the load loss issue, which would directly impact the SAIDI and SAIFI indexes for the utility in a positive way. For future work, the translation of these technical impacts into financial metrics is suggested, as this is a research gap identified during this study.
Network fees in the form of grid and transaction fees can adjust revenue loss from market scenarios when compared to net-metering operations. One interesting finding is that the variation of the number of agents, fee values, and DER deployment have a proportional impact on fee income, with certain thresholds where the utility revenue loss in the net-metering scenario can be reversed. This suggests to the utilities and policymakers that when designing the markets, much care must be taken not to overdo fees to scare prosumers out of the market, considering that a functioning market can only work with enough participants to ensure liquidity. The fee design has been focus of previous studies ([
32,
33]), which have identified the need for a fee design with attention to revenue balance.
The current study identifies a further need, which is that fee prices must be designed to be sensitive to variations in market participation and DER penetration. This way the fees can be used to find a compromise in revenue balance for all stakeholders.
An envisioned possibility for future work would be to explore the impact of network fees on prosumer behavior. In the present study, the customer behavior was not modified by price, meaning they did not enter demand response mode by modifying their consumption patterns. In a more complex model, this could be taken into consideration. This way, the impacts on revenues and grid operation would take a more dynamic reaction when fees are modified.
The different impacts in DER deployment sensitivity analysis highlight the need to conduct an integrative analysis of the said impacts. For example, when varying PV and storage penetration, the results demonstrate that for a penetration value of around 60%, the utility’s revenue is minimized compared to net-metering. However, for this penetration, the market shows the best possible outcome in grid operation, avoiding reverse flows and minimizing grid utilization compared to other analyzed PV-to-storage ratios. In other words, the proportion of PV and storage that brings the least revenue also provides the least cost for the utility. So far, only [
20] explored the impact of variable DER penetration in P2P markets, but with a focus on distribution losses. This is a key finding from this work. To the author’s knowledge, the broader implications of variation of DER penetration on P2P markets have not been explored in other studies. Future research is needed due to its significance in adopting LEMs in distribution systems.
Further to this question, this study has identified the need for a deeper evaluation of PV and storage penetration when operating in market scenarios. PV and storage amounts could be optimized for the best economic and grid operation outcomes. Even though the expansion of distributed generation is prosumer-defined and not controlled by the utility, the utility could use this information for the installation of utility-owned distributed generation allocated strategically at different nodes in the distribution system.
Lastly, is it possible that, under the assumptions taken, there is a scenario where both stakeholders—utility and prosumers—benefit more from peer-to-peer market schemes rather than from net-metering, self-consumption regulatory framework?
This research has demonstrated that a careful design of local market structures is needed for a decentralized energy market to benefit all stakeholders, but such an equilibrium is achievable. A “win-win” scenario for both utility and prosumers is attainable if an integrated feasibility analysis is provided, taking into account and quantifying non-financial metrics such as gains in operation flexibility (the ability to shape energy flows through prosumer behavior), DER deployment as non-wire alternative and possibility of local grid coordination. The utility must be significantly involved in designing the market structure, possibly customizing solutions and making them sensitive to different grid configurations. These customized solutions should consider the grid particularities of each utility, but also under the premises of a regulatory framework that ensures economical equilibrium for all stakeholders.
Additional important aspects include, for instance, the number of market participants, deployed DER flexibility capabilities and load/generation profiles, generation-to-storage deployment ratios, and the value of network fees. The gains in operation flexibility on market-driven frameworks should be acknowledged as an asset and be quantified by itself, as it can bring operation cost reductions for the utility; or it can become a liability to operation if poorly coordinated. In summary, the market operation offers opportunities and challenges that must be thoroughly analyzed to ensure that it will bring economy, reliability, and sustainability to the power system when adopted as a solution.
5. Conclusions
This research has provided a better comprehension of the impacts of P2P markets on utilities. It has identified possible development paths and research gaps to use P2P markets to integrate DERs into the distribution system. It developed an approach for the impact analysis of P2P markets by integrating technical and economic criteria into one comprehensive analysis framework. By encompassing monetary and non-monetary benefits and drawbacks, this investigation concludes that the motivation for adopting decentralized energy markets must come from an integrated feasibility analysis. There needs to be more than a direct economic benefit through the revenue analysis to envision feasible market operation solutions; however, acknowledging other technical potential contributions from the market operation might be the path for adoption.
The revenue loss in the market-driven operation can be reversed by implementing grid and transaction fees. Network fees can serve as a tool to provide an economic balance between the stakeholders. However, this balance varies by the number of market participants and DER penetration. Considering the distribution network as an ever-evolving system, this suggests that the design of the market structure and implementation of fees should be sensitive to changes in the grid configuration to ensure this balance is permanently kept. On the technical side, the market operation effects on the grid operation performance are highly circumstantial, meaning the impacts can change considering the variation of DER penetration and implemented market rules. In general, beneficial market-driven operation points can be found, making a case for the utility to be highly involved in market design.
In a broader view, the collective self-consumption effect created from the market scenario is an excellent asset for grid operation. The market-driven operation could maximize the internal self-consumption inside the feeder and avoid reverse power flows upward the power network with a higher DER penetration than the net-metering operation. This feature shows the potential of markets to accelerate DER implementation and could contribute to minimizing interruption indexes and operational cost reduction.
The main continuation for future research is regarded to making the non-financial metrics tangible into economic quantification, or in other words, decoding the decentralized markets’ cost reduction potential for the utility in monetary terms. With that analysis, it would be then possible to deepen the financial and economic analysis of P2P markets implementation in terms of cost recovery and return on investment for the stakeholders. Finally, among other recommendations for future work, a study to deepen the analysis of how the variation in DER penetration can be used for maximizing the market outcomes and efficient grid operation is suggested. It became apparent during the current study that this is an essential gap in decentralized energy market design analysis, considering the significant variation the PV-to-storage deployment ratios have produced in market scenario outcomes.


 ,
, 


