Article

Influence of Cr Doping on Structural, Optical, and Photovoltaic Properties of BiFeO3 Synthesized by Sol-Gel Method

1
Departamento de Física Aplicada, Universidad Nacional Jorge Basadre Grohmann, Avenida Miraflores S/N, Ciudad Universitaria, Tacna 23003, Peru
2
Laboratorio de Nanotecnología, Facultad de Ingeniería, Universidad Nacional Jorge Basadre Grohmann, Avenida Miraflores S/N, Ciudad Universitaria, Tacna 23003, Peru
3
Departamento de Metalurgia y Materiales, Universidad Nacional Jorge Basadre Grohmann, Avenida Miraflores S/N, Ciudad Universitaria, Tacna 23003, Peru
*
Author to whom correspondence should be addressed.
Energies 2023, 16(2), 786; https://doi.org/10.3390/en16020786
Submission received: 8 December 2022 / Revised: 1 January 2023 / Accepted: 7 January 2023 / Published: 10 January 2023

Abstract

:
In this work, pure BiFeO3 and samples doped with different concentrations of chromium were synthesized to improve the optical properties and efficiency of solar cells based on BiFeO3. The sol-gel method was used for synthesis due to its ability to produce nanostructured materials with high purity and good homogeneity, as well as the possibility of controlling the size and shape of the resulting particles. The samples were characterized by different analytical techniques. Thermal analysis results indicate that the dopant increases the weight loss of the sample from 61 to 81%, with an increase in the exothermal in the nucleation and crystallization temperature range. The X-ray diffraction patterns and UV-visible spectra show a dependence of the crystallite size and bandgap with respect to the amount of Cr dopant, decreasing from 168 to 73 nm and from 2.14 to 1.92 eV, respectively. Scanning electron microscopy images display a decreasing grain size as a result of an increasing amount of dopant. The I-V analysis results show a 1% Cr-doped BiFeO3 photovoltaic device exhibits enhanced photovoltaic performance with higher photocurrent and 4.17 times greater energy conversion efficiency compared with a pure BiFeO3 photovoltaic device. For their behavior, Cr-doped BiFeO3-based photoelectrodes are very promising materials for photovoltaic devices.

1. Introduction

Solar power, as a renewable energy source, has gradually replaced some traditional fossil fuels or polluting energy sources due to its abundant resources, widespread availability, and environmentally friendly nature [1].
At present, researchers are conducting numerous studies to find materials that can efficiently convert solar radiation into electrical energy. This process involves the development of various types of solar cells, including those based on silicon, semiconductor compounds, and emerging technologies [2]. Within the emerging solar cell classification, perovskite-based solar cells have attracted significant attention due to their properties, including high energy conversion efficiency due to high light absorption, high carrier mobility, and low cost of production. However, these cells also present several issues, such as their instability and toxicity, which are still being investigated [3].
Currently, research efforts are focused on developing materials with low toxicity and high stability including photoferroelectric materials, such as bismuth ferrite (BiFeO3). BiFeO3 is a semiconductor that exhibits photosensitive and ferroelectric properties, as well as a unique mechanism known as the anomalous photovoltaic effect. In this mechanism, the photogenerated electrons and holes are directly separated by the intrinsic ferroelectric polarization of the material, resulting in a spontaneous electric field. This result allows BiFeO3 to reach high open-circuit voltages (VOC) but low short-circuit current (JSC) [4]. To improve the properties of BiFeO3, various techniques have been developed. These include modulating the bandgap by controlling particle size [5]; optimizing performance through annealing in different atmospheres to decrease leakage current density [6]; and doping [7] with elements such as Cr [8], Mn [9], Gd [10], Nd [11], rare earths [12], and others [13]. These techniques can also improve multiferroic conduction [14].
However, no single process can yet ensure the best output [15,16,17]. Furthermore, little work has been completed so far on the development of inexpensive low-temperature synthesis techniques for film preparation. The bibliography shows that doping with chromium could increase the efficiency of solar cells [8,11,18,19]; however, few publications investigate the influence of chromium on optical and structural properties, as well as its performance when used in solar cells. Therefore, it is necessary to look for a simple method to produce chromium-doped BiFeO3 photoelectrodes. One of the methods most commonly used for the synthesis of BiFeO3 is the sol-gel method [20,21,22], which allows for the obtaining of pure phases and control of the particle size, as well as lowering its cost. When comparing the sol-gel method with other techniques for synthesizing BiFeO3 (as shown in Table 1), we can see that the sol-gel method is often considered a superior choice due to the several advantages it offers. These include the ability to produce nanostructured materials with high purity and good homogeneity, as well as the ability to control the size and shape of the resulting particles. The sol-gel method also allows for the incorporation of dopants and other additives which can significantly alter its physical and chemical properties. Additionally, the sol-gel process is easy to scale up for large-scale production and can be carried out at relatively low temperatures, making it energy-efficient. Furthermore, the sol-gel method is relatively simple and cost-effective, which is why it is widely used in the synthesis of BiFeO3 and other materials.
In this work, we have synthesized pure BiFeO3 doped with different concentrations of Cr by the sol-gel method. The samples obtained were characterized by DSC/TGA, XRD, FTIR, and UV-visible. The obtained materials were applied as photoanode materials in dye-sensitized solar cells. We report the effect of Cr-doping on the optical, structural, morphological, and photovoltaic properties of BiFeO3.

2. Materials and Methods

2.1. Sample Preparation

BiFe1-xCrxO3 (x = 0, 0.01, 0.03, 0.05, 0.10) powders were synthesized by the sol-gel method. The chemical reagents used in this work were iron nitrate nonahydrate (Fe(NO3)3·9H2O), bismuth nitrate pentahydrate (Bi(NO3)3·5H2O), chromium nitrate hexahydrate (Cr(NO3)3·9H2O), nitric acid (HNO₃, 65%), and citric acid (HOC(COOH)(CH2COOH)2). All chemicals were of analytical grade purity from Merck (Merck Millipore, Darmstadt, Germany) and used without further purification.
To prepare BiFe1-xCrxO3 (x = 0, 0.01, 0.03, 0.05, 0.10), Stoichiometric amounts of Bi(NO3)3·5H2O, Fe(NO3)3·9H2O, and Cr(NO3)3·9H2O were dissolved in 25 mL of water for 20 min, then 20 mL of nitric acid was added and stirred for 30 min to dissolve completely. Subsequently, 10 g of citric acid was added, forming the sol. The resulting solution was heated at 80 °C to obtain gel. Then the gel was dried at 150 °C for 6 h. The obtained material was grounded in Agata mortar for 10 min and calcined at 600 °C in air atmosphere for 4 h with a heating rate of 5 °C/min. The samples were labeled as BiFeO3, BiFeO3-1% Cr, BiFeO3-3% Cr, BiFeO3-5% Cr, and BiFeO3-10% Cr according to Cr content.

2.2. Solar Cell Fabrication

To manufacture the active layer for the working electrode, an Indium-doped tin oxide glass slide (ITO-P001, <10 Ω/sq, Kaivo Optoelectronic, Zhuhai, China) was used as a substrate. The ITO cleaning process included ultrasonication in an ultrasonic bath of deionized water for 30 min, followed by washing in isopropanol and cleaning with acetone.
The working electrode-blocking layer was prepared using a solution of titanium (IV) tetra isopropoxide (98%, Merck Millipore, Darmstadt, Germany) in 2-Propanol (Merck Millipore, Darmstadt, Germany) (1:4 %V), which was deposited onto precleaned substrates by spin coating (Ni-Lo 5 XL, Ni-Lo Scientific, Ottawa, ON, Canada) at 4000 rpm for 10 s. The layer was dried at 90 °C for 1 h, heated to 300 °C for 1 h, and then cooled to room temperature.
The active layer was prepared by mixing, by ultrasound for 40 min, 0.05 g of pure and Cr-doped BiFeCrO3 samples, 2.6 mL of deionized water, 325 μL of acetylacetone (Merck Millipore, Darmstadt, Germany), and 320 μL of Triton X (Merck Millipore, Darmstadt, Germany). Then, 15 μL of the resulting solution was deposited three times onto the blocking layer by spin-coating at 5000 rpm for 10 s. Then it was dried at 90 degree for 1 h and calcined at 500 °C for 30 min. The thickness of the manufactured films was analyzed using scanning electron microscopy
The counter electrode was made from ITO, platinized by spin coating using Pt solution (Platisol T, Solaronix D, Aubonne, Switzerland) at 4000 rpm for 10 s, then calcined at 500 °C for 30 min.
The working electrodes and the counter electrode were combined into a sandwich-type solar cell. Then, 10 μl of high-performance electrolyte (Iodolyte HI-30, Solaronix D, Switzerland) was injected in between the electrodes and evaluated.

2.3. Characterization

The thermal behavior of the precursor powder was studied using a combination of differential scanning calorimetry (DSC) and thermogravimetric analysis (TGA) with the SDT 650 instrument (TA instruments, New Castle, DE, USA, EEUU). The weight loss and heat flow of the powder were measured from room temperature to 850 °C at a heating rate of 20 °C/min in a nitrogen atmosphere. The structural characterization of pure and doped BiFeO3 powders was carried out using a PANalitycal X-ray diffractometer model AERIS Research (Malvern Panalytical Ltd.a., Almedo, The Netherlands) with Ni-filtered CuKα radiation (1.5406 Å) operated at 40 kV and 15 mA. The diffraction patterns were recorded from 20° to 80° with a step size of 0.022° and a measurement time of 20 s per step. The crystallite size and structural parameters were determined using Rietveld refinement with the X’Pert HighScore Plus software v. 4.9. UV-visible diffuse reflectance spectra of the powder samples were measured using a Thermo Scientific spectrometer model Evolution 220, (Thermo Scientific Co., Ltd., Waltham, MA, USA). Attenuated total reflectance Fourier-transform infrared spectra were recorded with a Bruker Invenio R spectrometer (Bruker, Ettlingen, Germany). The sample morphology was observed with a field emission scanning electron microscope (Thermo Scientific Co., Eindhoven, The Netherlands) operated at 30 kV and high vacuum. The behavior of the solar cells was studied at room temperature using a photovoltaic testing system (Sciencetech INC, London, ON, Canada) equipped with a Keithley source meter (2400, Keithley, Cleveland, OH, USA), a AAA solar simulator with a power intensity of 100 mW/cm2. Before evaluating the current-voltage characteristics, the system was calibrated with a typical Si solar cell.

3. Results and Discussion

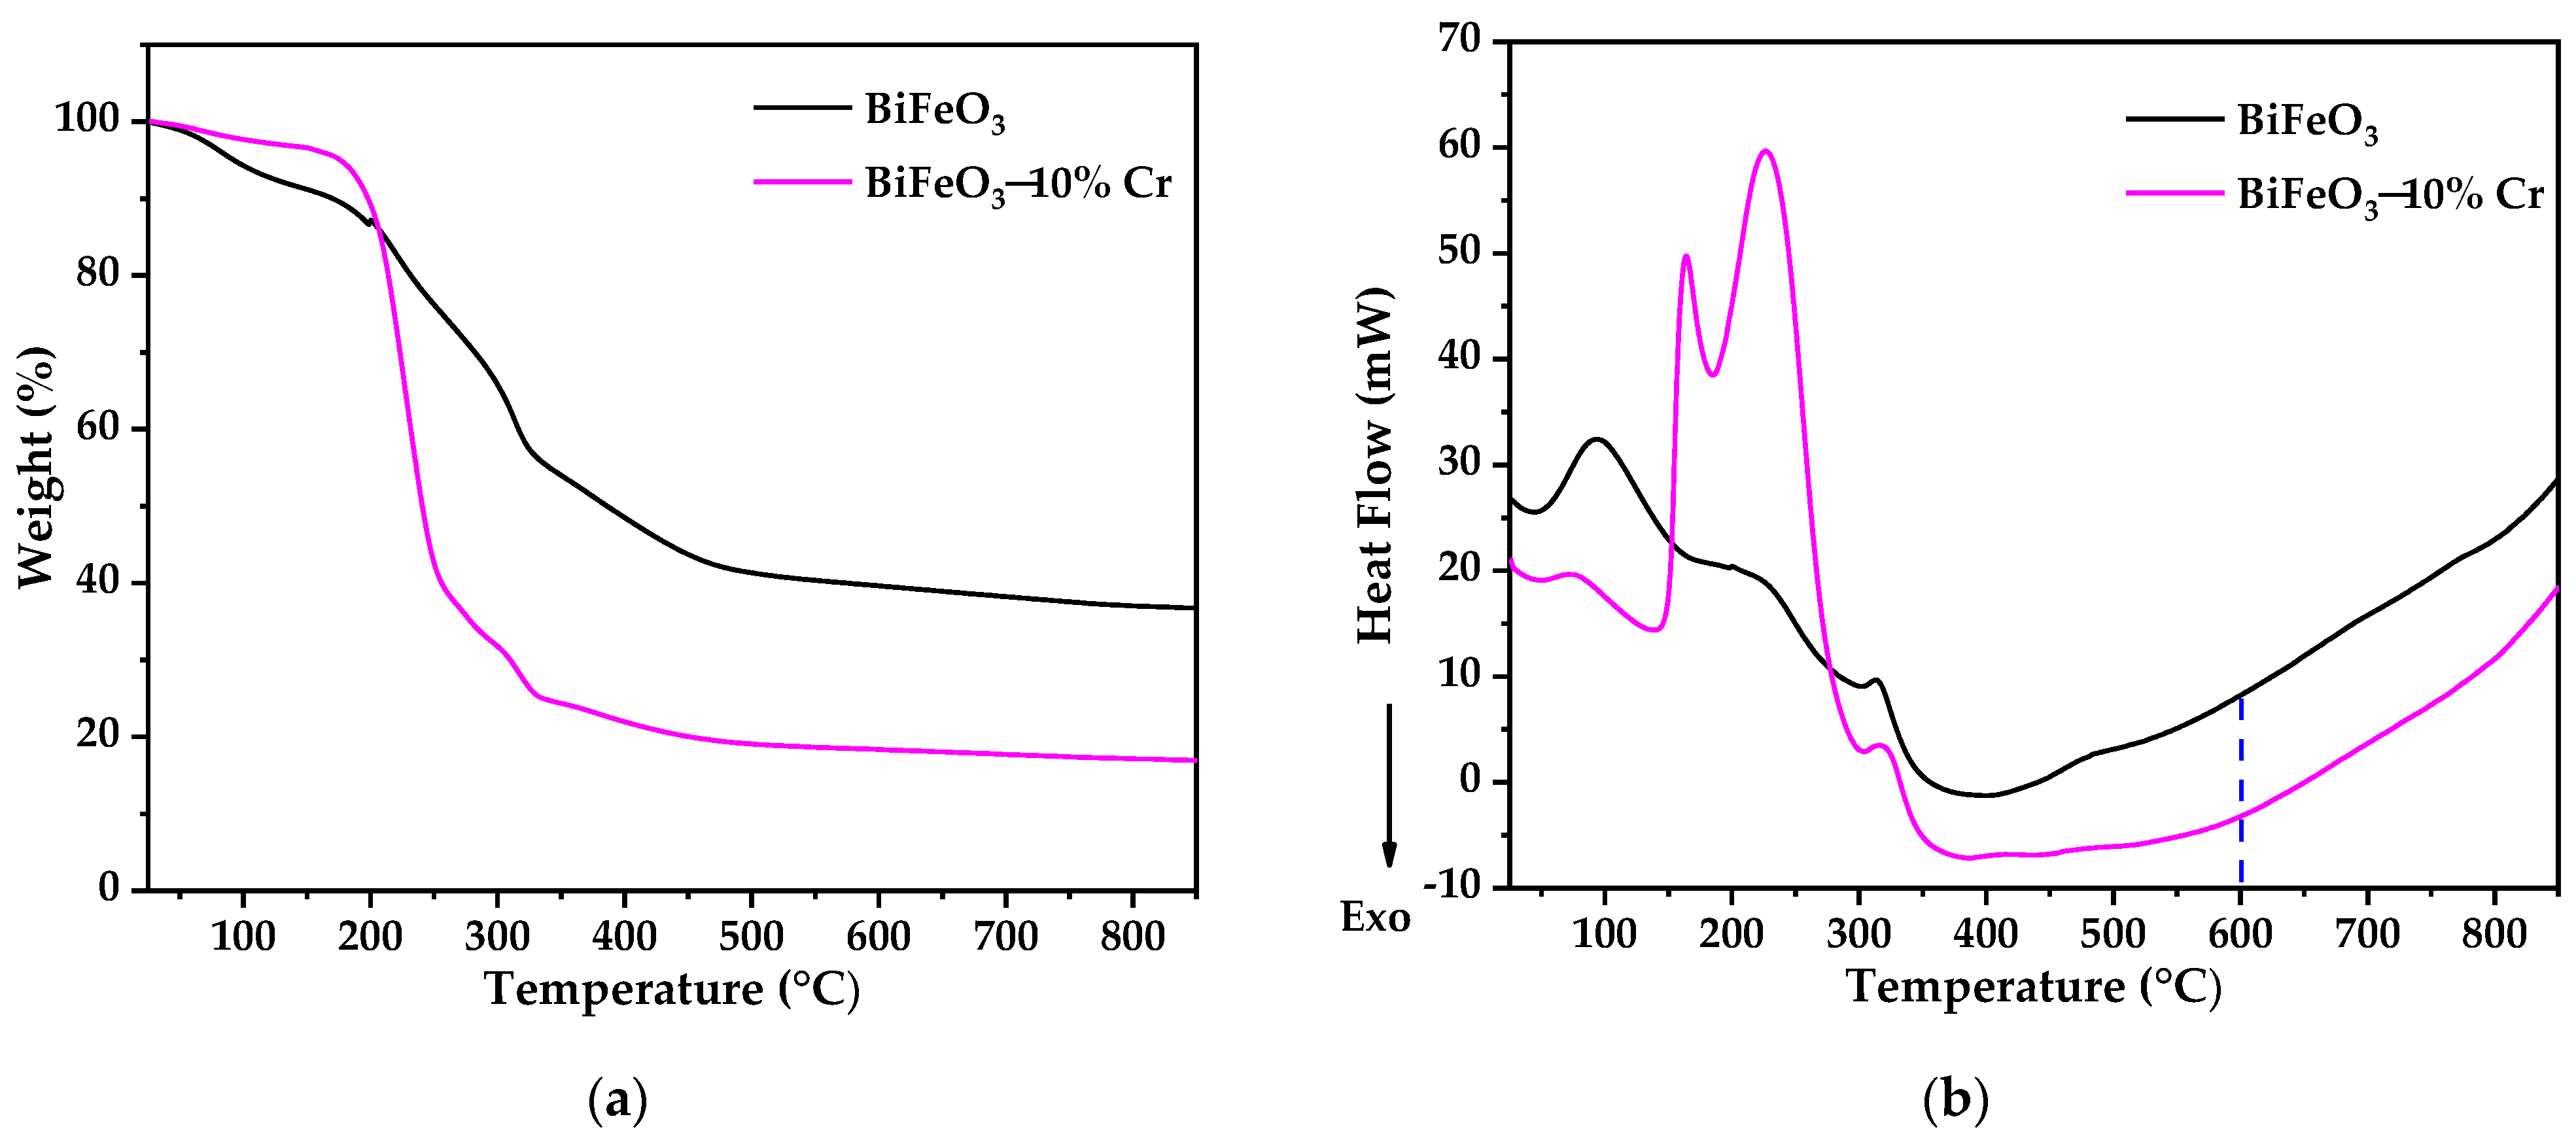
3.1. Thermal Analysis

Thermal investigations were conducted to identify the optimal annealing conditions and the crystallization temperature required to generate a single bismuth ferrite phase. Figure 1a,b show the TGA and DSC curves of BiFeO3 and BiFeO3-10% Cr, produced from room temperature up to 850 °C. The results show that the weight loss is presented in four stages, corresponding to the change in mass and energy. The first defined stage (25–200 °C) is associated with the evaporation of residual water and nitric acid. The second stage (200–260 °C) is related to citric acid decomposition [29]. The third stage (260–340 °C) involves the breakdown of polymeric metal-carboxylate complexes and the creation of a metal oxide phase. The fourth stage (340–550 °C) is related to BiFeO3 phase crystallization [30]. Additionally, it has been observed that in the case of BiFeO3–10% Cr (as shown in Figure 1b), the peak during the heating cycle occurred between 330 °C and 500 °C, with a peak temperature of 390 °C, which may be attributed to a solid-to-solid phase transition. The results also display that the chromium addition increased the weight loss from 61% to 81% at 850 °C and generated two endothermic peaks between 150 and 300 °C mainly due to the elimination of a greater amount of water trapped in the structure of the doped sample, as well as the decomposition of citric acid, respectively. It can also be seen that the doped sample presents a higher exothermic flux from 300 °C to 850 °C, showing that doping accelerates the formation. The results also show that there is an exothermic peak around 600 °C (see dotted line in Figure 1b) which ends at ~700 °C due to the formation of bismuth ferrite. This temperature was selected for the calcination of all the synthesized samples.

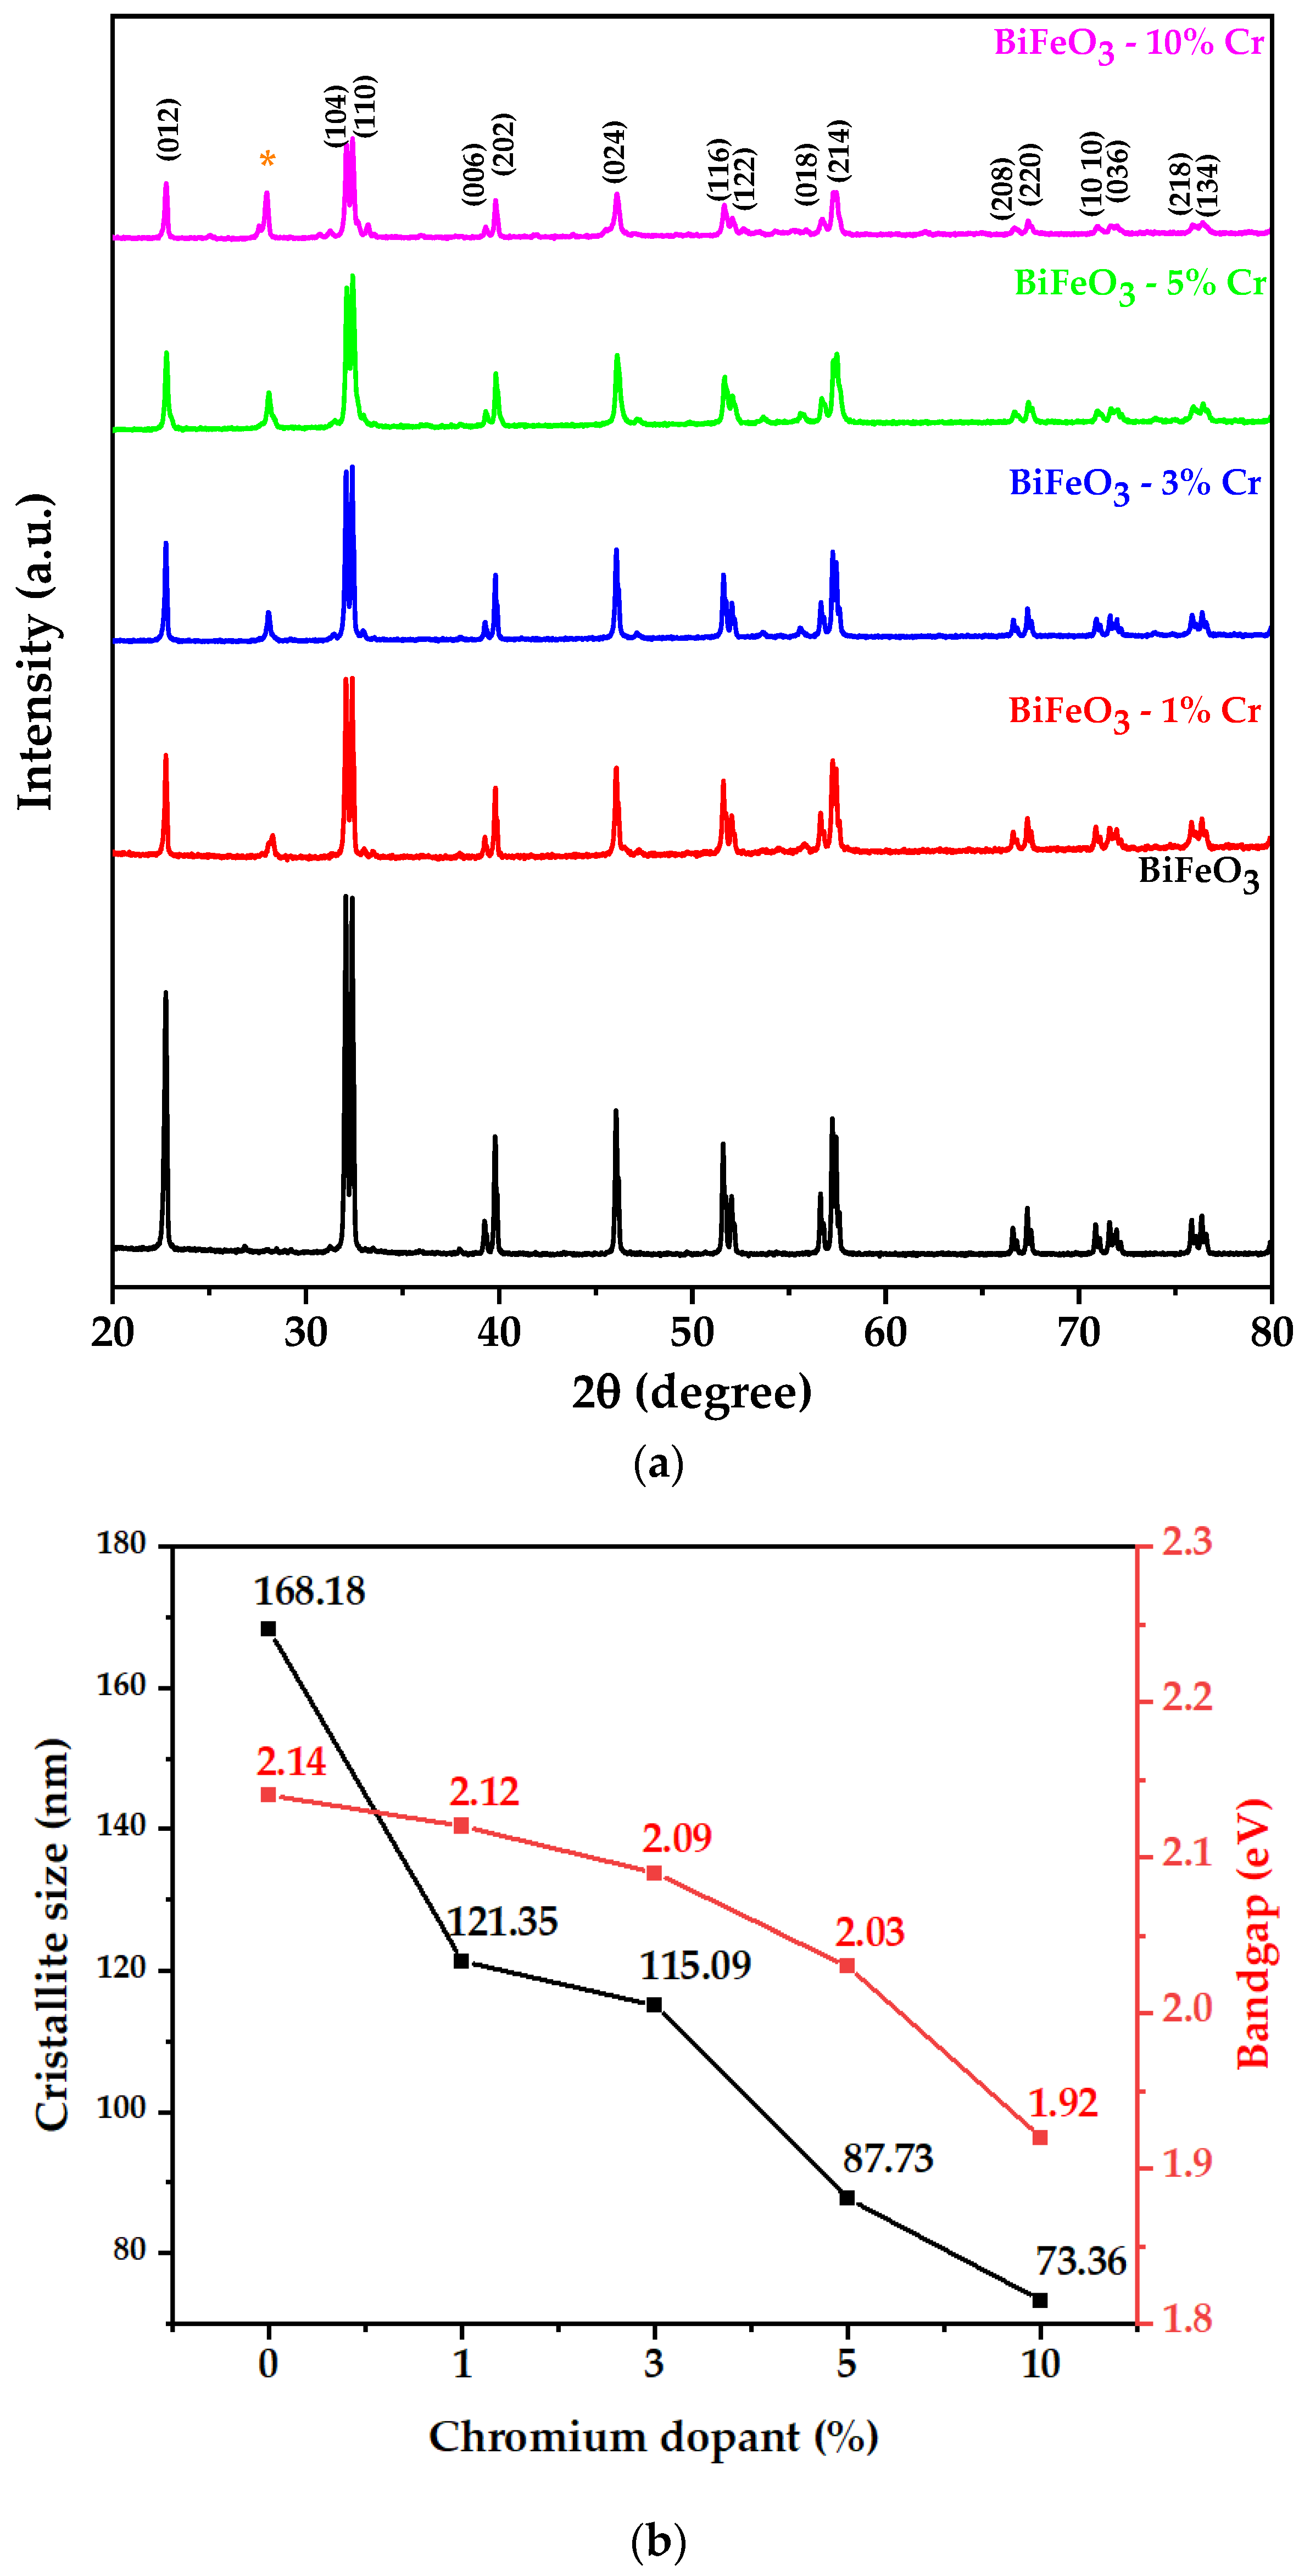
3.2. X-Ray Diffraction

Figure 2a illustrates a structural analysis of pure and Cr-doped BiFeO3 samples. Pure BFO are crystalline and polycrystalline and show the pure BFO phase which has been reported in literature [31]. The resulting diffraction pattern shown in Figure 2a illustrates a fundamental physical property of the material, as determined by the positions and intensities of the diffraction effects. These diffraction effects result from a scattering process in which the electrons of the atoms in the sample scatter X-rays without changing their wavelength. Since X-rays have wavelengths (between 0.2 and 10 nm) that are comparable to the interatomic space of a crystalline solid, the incident X-ray beam is diffracted in specific directions that are predicted by Bragg’s law. The phase analysis of all the samples shows good agreement with standard data for BiFeO3 (JCPDS card number 01-071-2494) which corresponds to the rhombohedral crystal system and R3c (number 161) space group. However, the X-ray diffraction pattern of the Cr-doped BiFeO3 samples reveals an additional peak at 2θ = 28.02°. This can be attributed to the (222) reflection of bismuth oxide (Bi2O3) (JCPDS card number 00-022-0515) and is indicated by an asterisk (*) in the graph. The intensity of the (222) peak for the Bi2O3 phase increases with increasing Cr dopant concentration formed during the synthesis process.
To determine the influence of a Cr dopant on the crystal structure of BiFeO3, Rietveld refinement of X-ray diffraction patterns were performed using scientific software Highscore Plus Software V 4.9 (Malvern Panalytical B.V., Almelo, The Netherlands). Table 2 lists the structural parameters of pure and Cr-doped BiFeO3 material, displaying that crystal parameters a and c decrease according to Cr-dopant content. Similarly, crystallite size decreases, as can be seen in Figure 2b, from 168.18 nm to 73.36 nm for pure BiFeO3 and BiFeO3-10% Cr, respectively. This result may be attributed to the decrease in intensity caused by the addition of the dopant since Cr3+ has an ionic radius of 0.615 Å, less than that of Fe3+ (0.645 Å) [32,33].

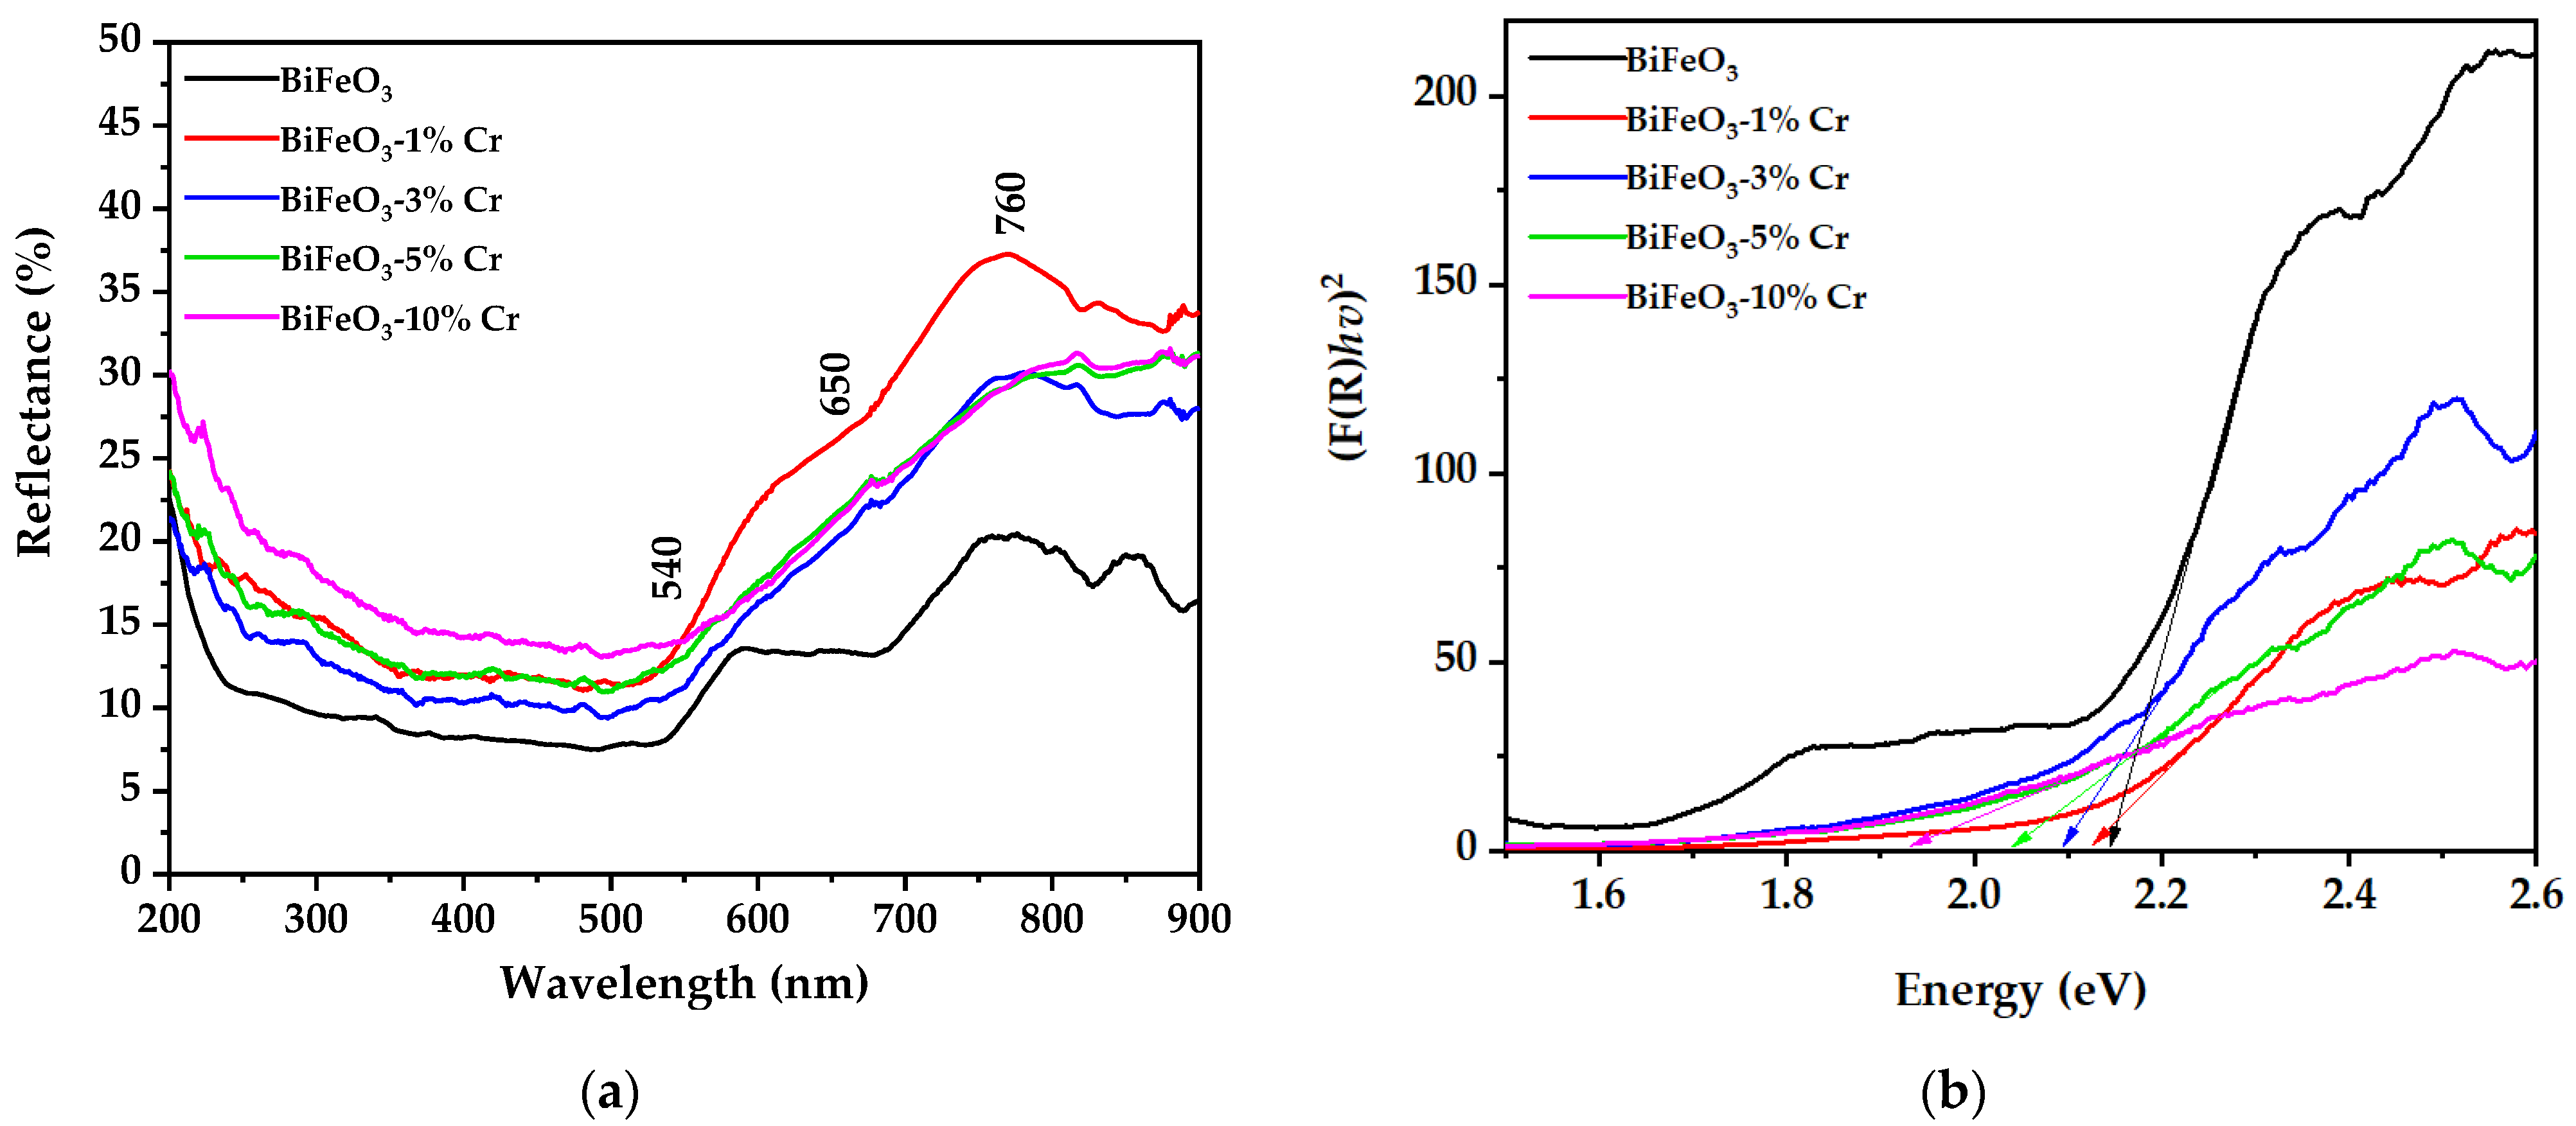
3.3. UV-Visible Spectroscopy

The influence of a Cr dopant on the optical properties of BiFeO3 was investigated at room temperature by recording their UV-vis reflectance spectra, as shown in Figure 3a. The figure shows two absorption edges of pure and Cr-doped BiFeO3 samples: the band at 650 nm is caused by a metal-to-metal transition, while the one around 760 nm is caused by a crystal field transition. [34]. In addition, the pure and Cr-doped BiFeO3 exhibit a significant absorption band at around 540 nm, which is attributable to the electronic transition from the O 2p state to the Fe 3d state [35]. These robust bands suggest that the sol-gel synthesized material may be suitable as photoactive material in solar cell applications. The diffused reflectance data of the samples were transformed to the Kubelka–Munk function F(R) = (where R is the diffused reflectance value) to generate [F(R)hv]2 vs. hv plots (Figure 3b). The intersection of the tangent line with [F(R)hv]2 = 0 reflects the energy difference between the top of the valence band (O 2p) and the bottom of the conduction band (Fe 3d) of BiFeO3 [36]. The bandgap value of the samples is listed in Table 2. The results display that the Cr-doping process of BiFeO3 decreases the band gap of the samples from 2.14 eV to 1.92 eV (Figure 2b).This red shift behavior was previously reported where BiFeO3 is doped with Gd and Mn [37], Sm and Mn [38], and others [39]. This shift may be attributed to the formation of distortions in the Fe-O octahedral rearrangement of molecular orbitals [40] resulting in an increase in density of states in the valence band and possibly also the density of states in the band gap that will cause the fundamental absorption edge to move toward longer wavelengths [41].

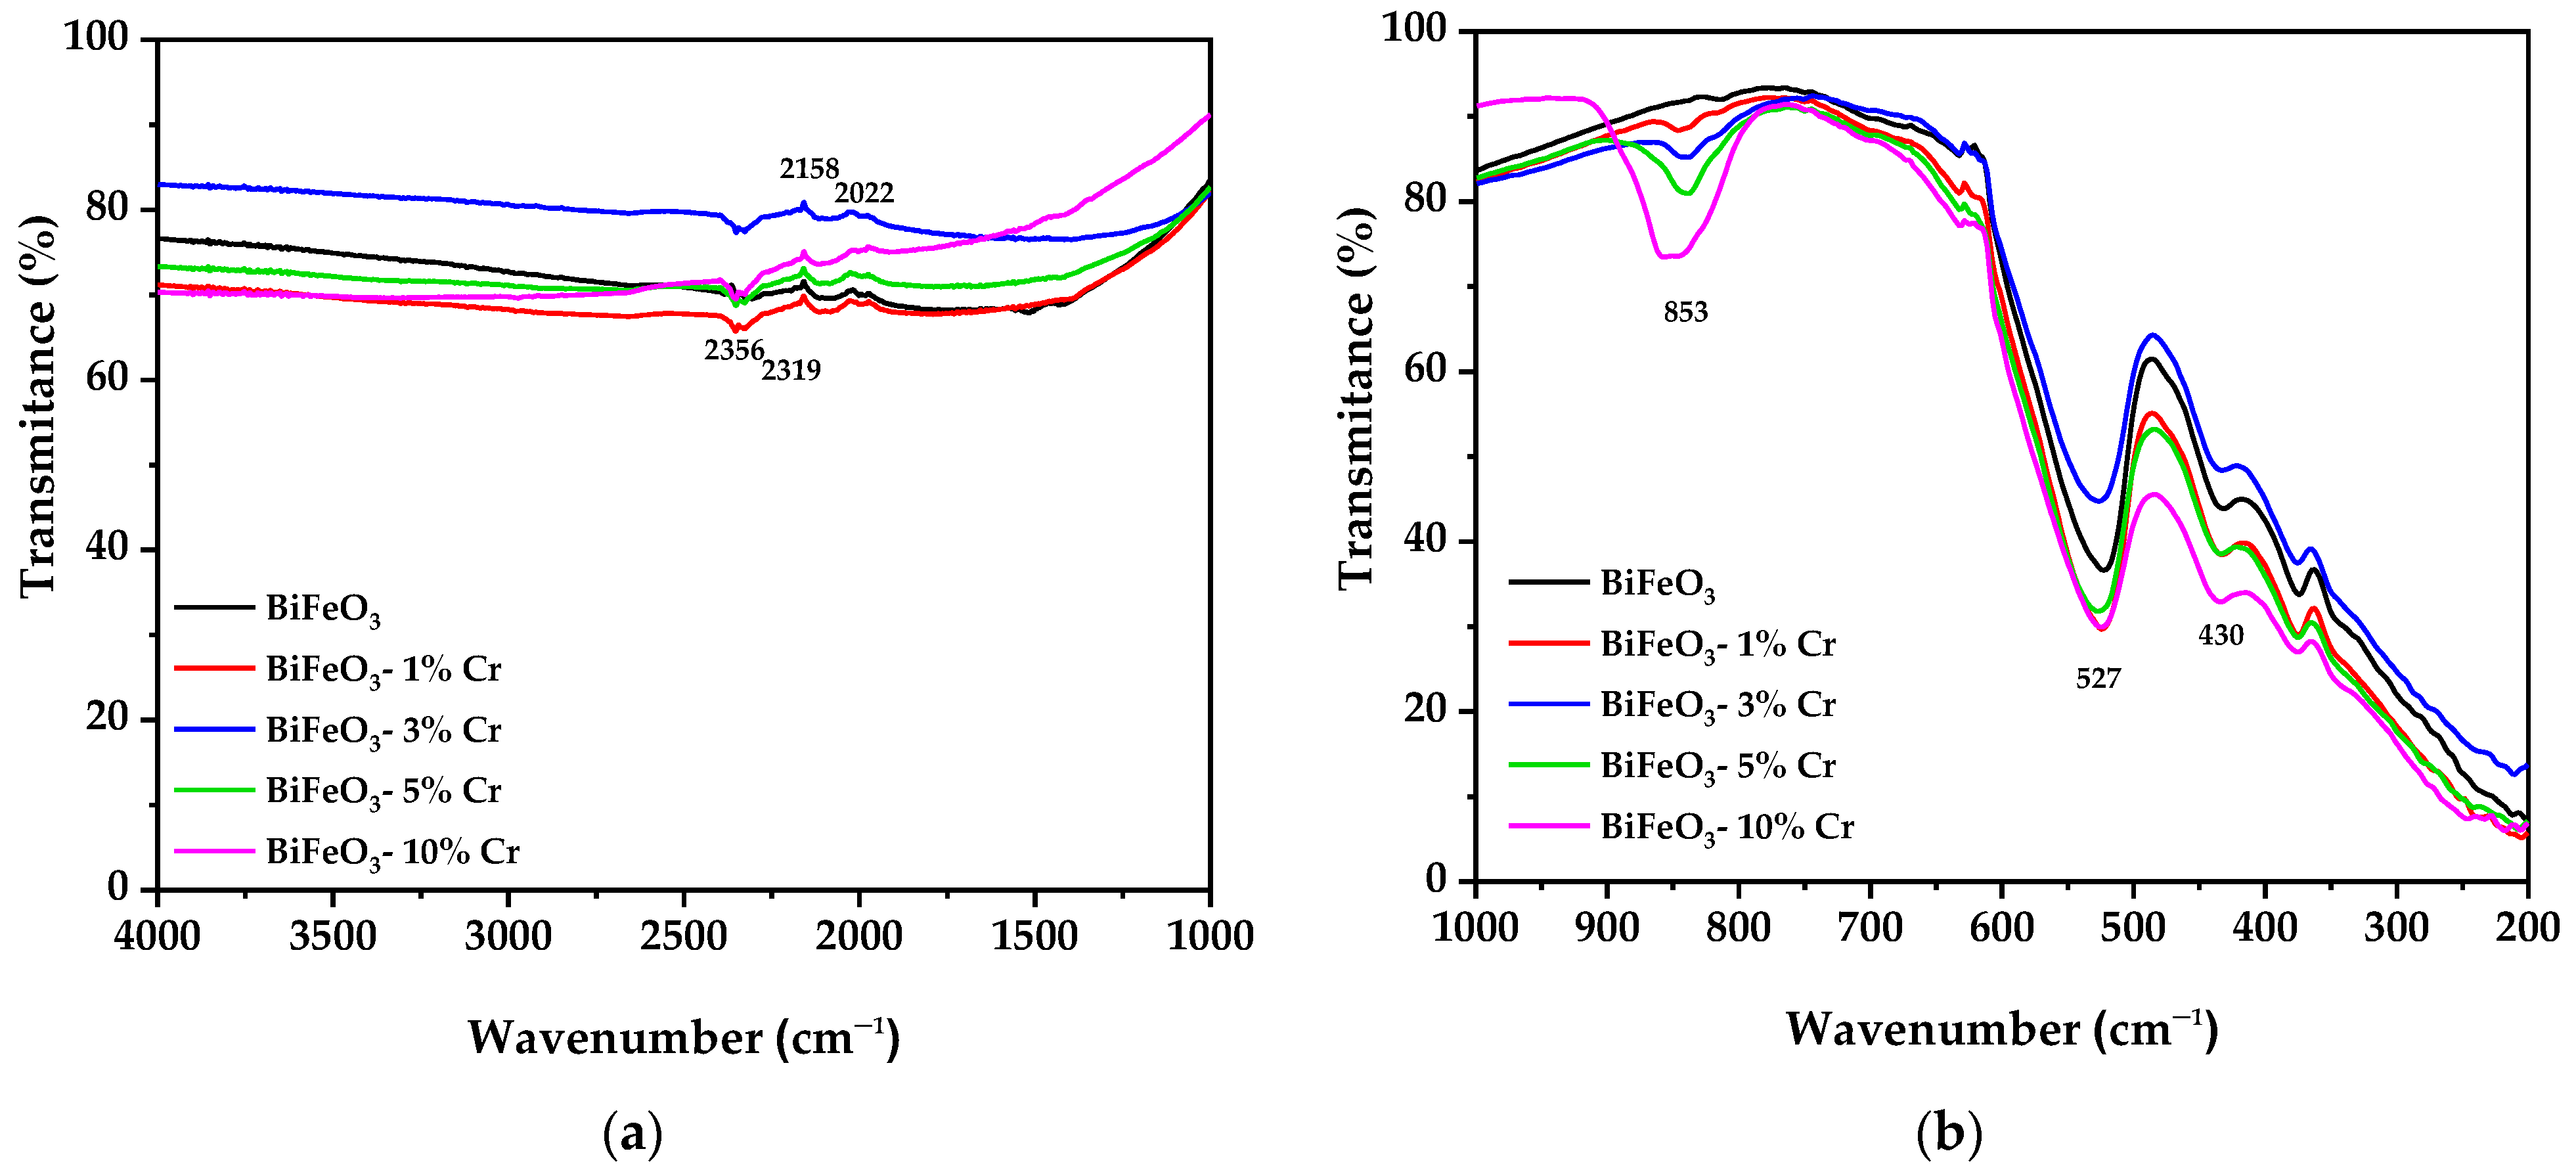
3.4. FTIR Spectroscopy

Figure 4a depicts the Fourier Transform Infrared (FTIR) absorption spectra of pure and Cr-doped BiFeO3 samples at ambient temperature. The FTIR spectrum provides information about the chemical and molecular structural changes in BiFeO3 caused by the introduction of a foreign atom, such as chromium (Cr). The significant absorptive peak between 400 and 600 cm−1 is attributed to the Fe-O stretching and O-Fe-O bending vibrations, respectively [42], indicating the production of octahedral FeO6 in the perovskite structure. The band around 853 cm−1 is a result of trapped NO3- ions in the samples, and the small peaks between 2000 and 2400 cm−1 may be attributed to the presence of a small amount of carbonaceous components that may have remained after citric acid combustion. [43].
FTIR analysis verifies the formation of the perovskite structure in pure and Cr-doped BiFeO3 samples. The influence of the Cr dopant can be seen in Figure 4b, where the increase in Cr dopant generates strong bands related to Fe-O vibrations between 400 and 600 cm−1 whose absorption increases according to the amount of added dopant. However, the Cr dopant also increases the amount of NO3− trapped in the structures, which is a result of the reagent residue [44].

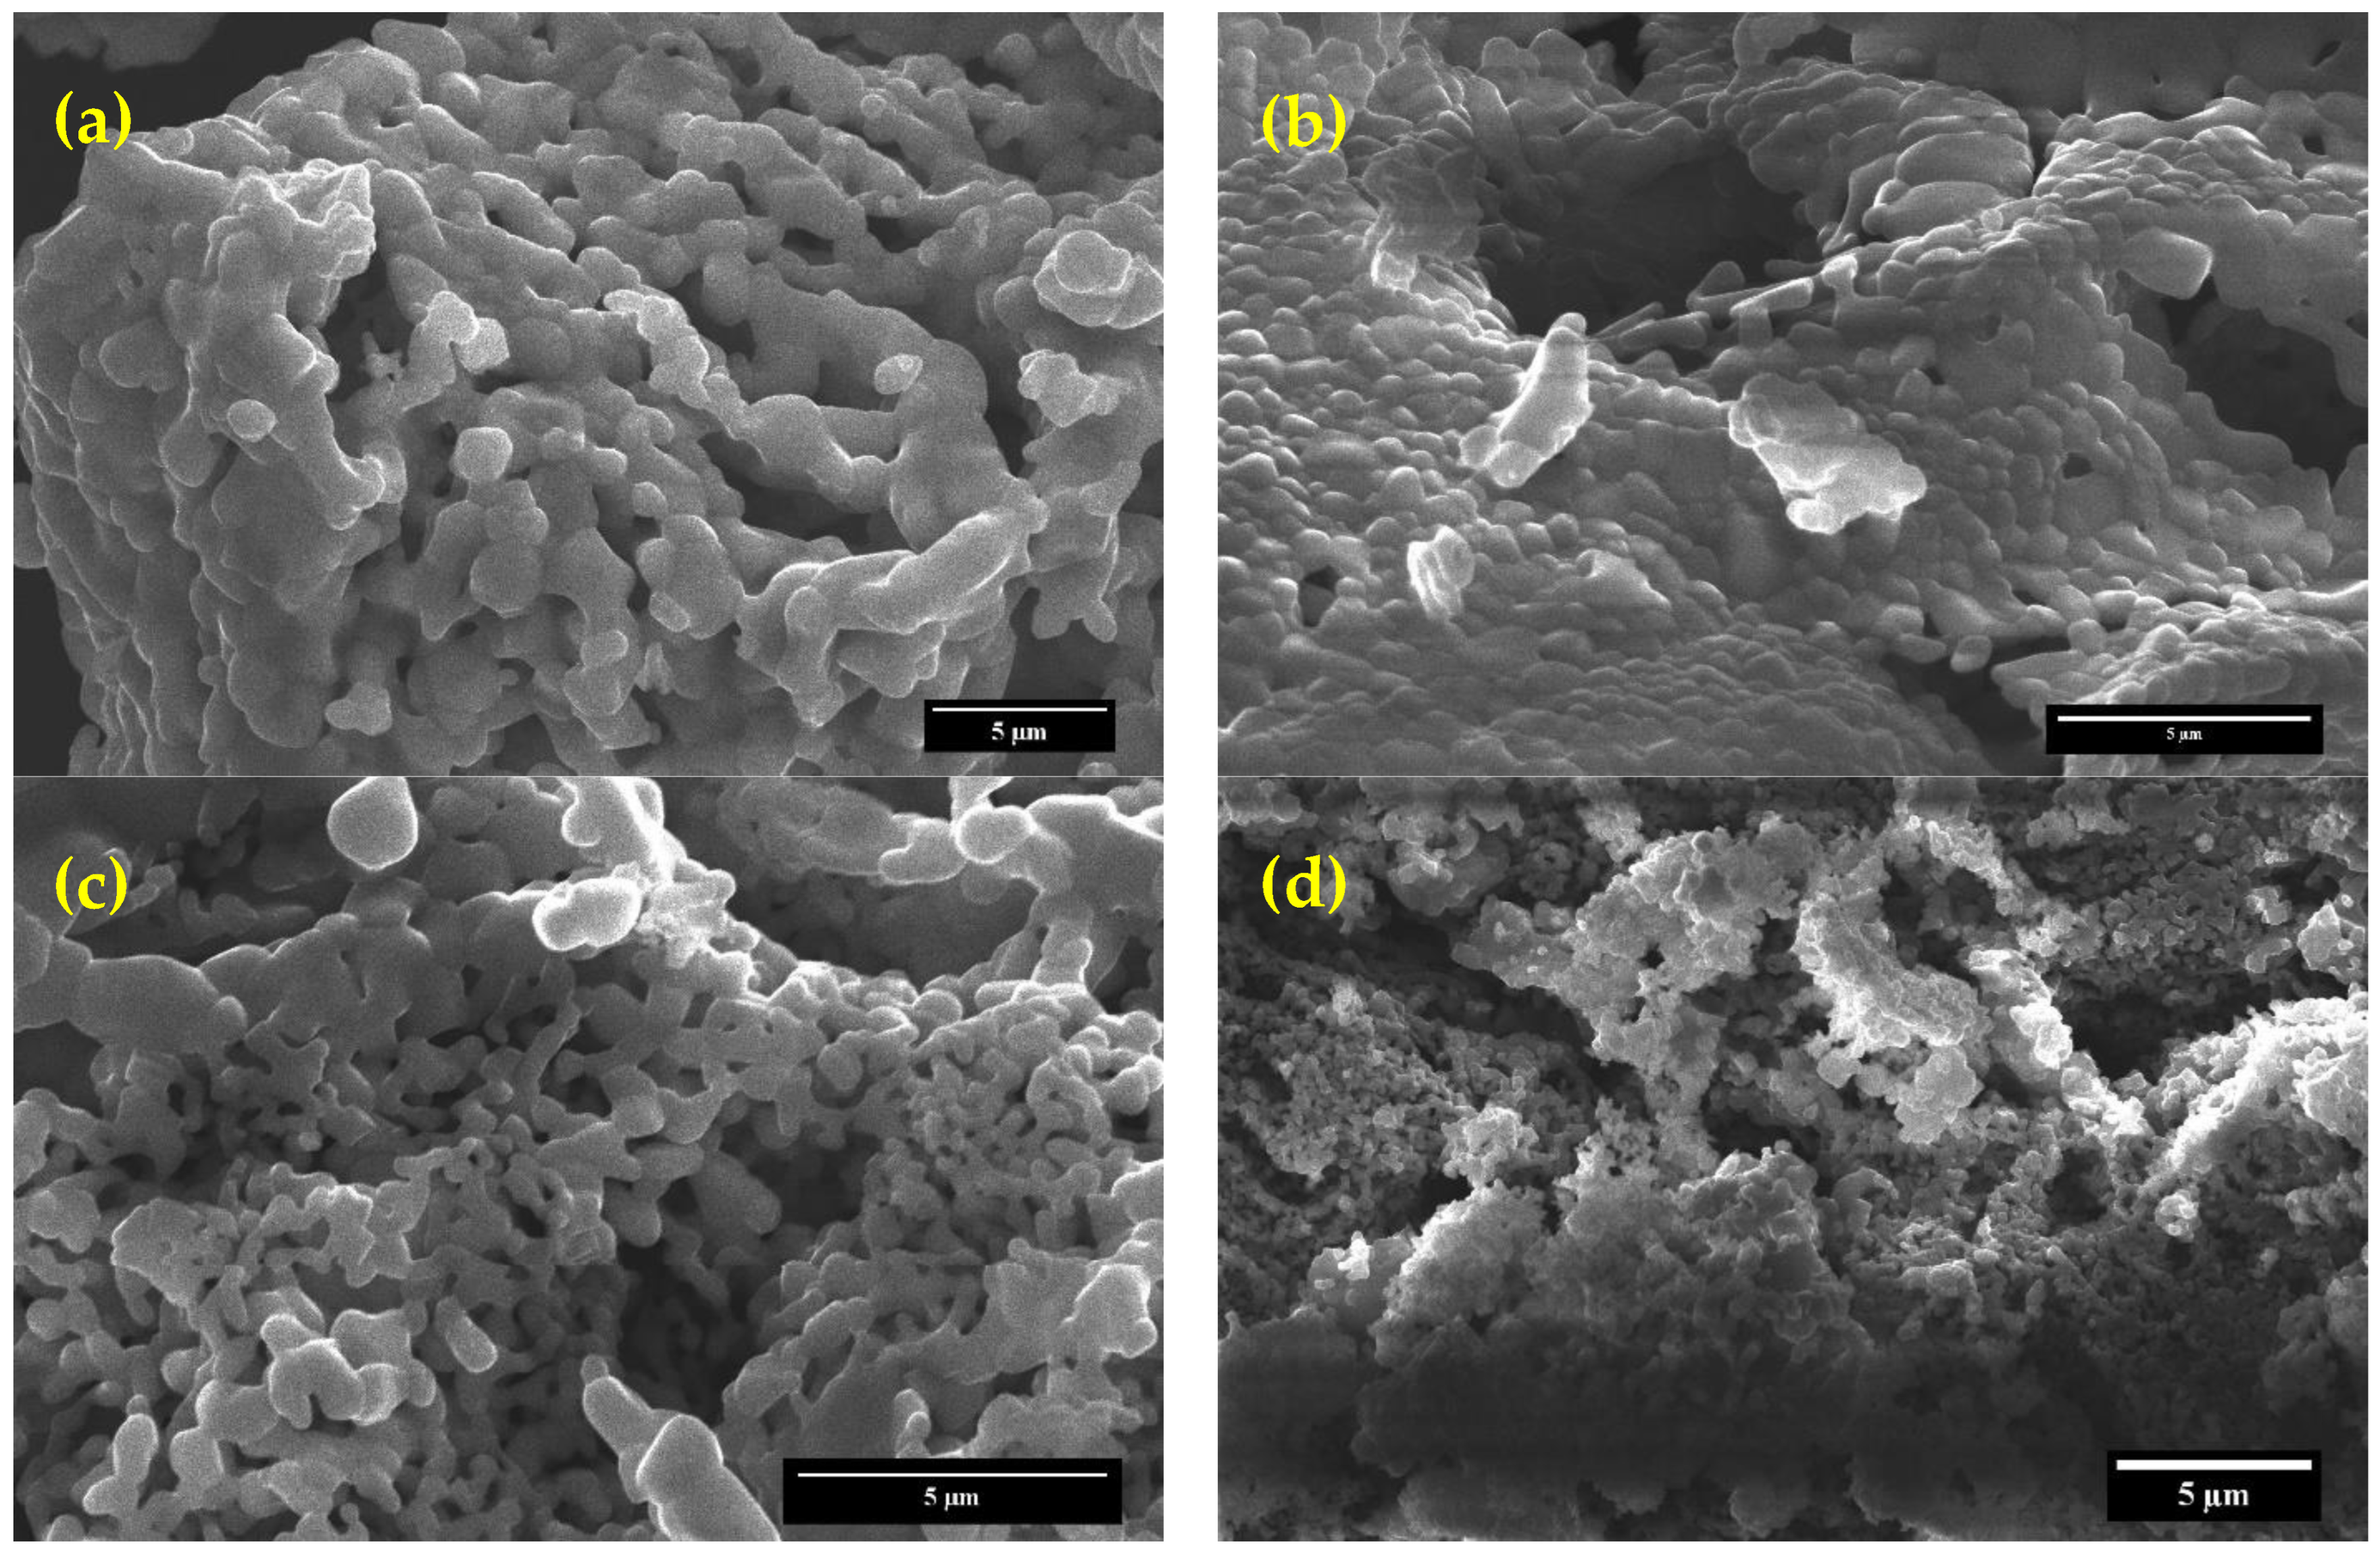
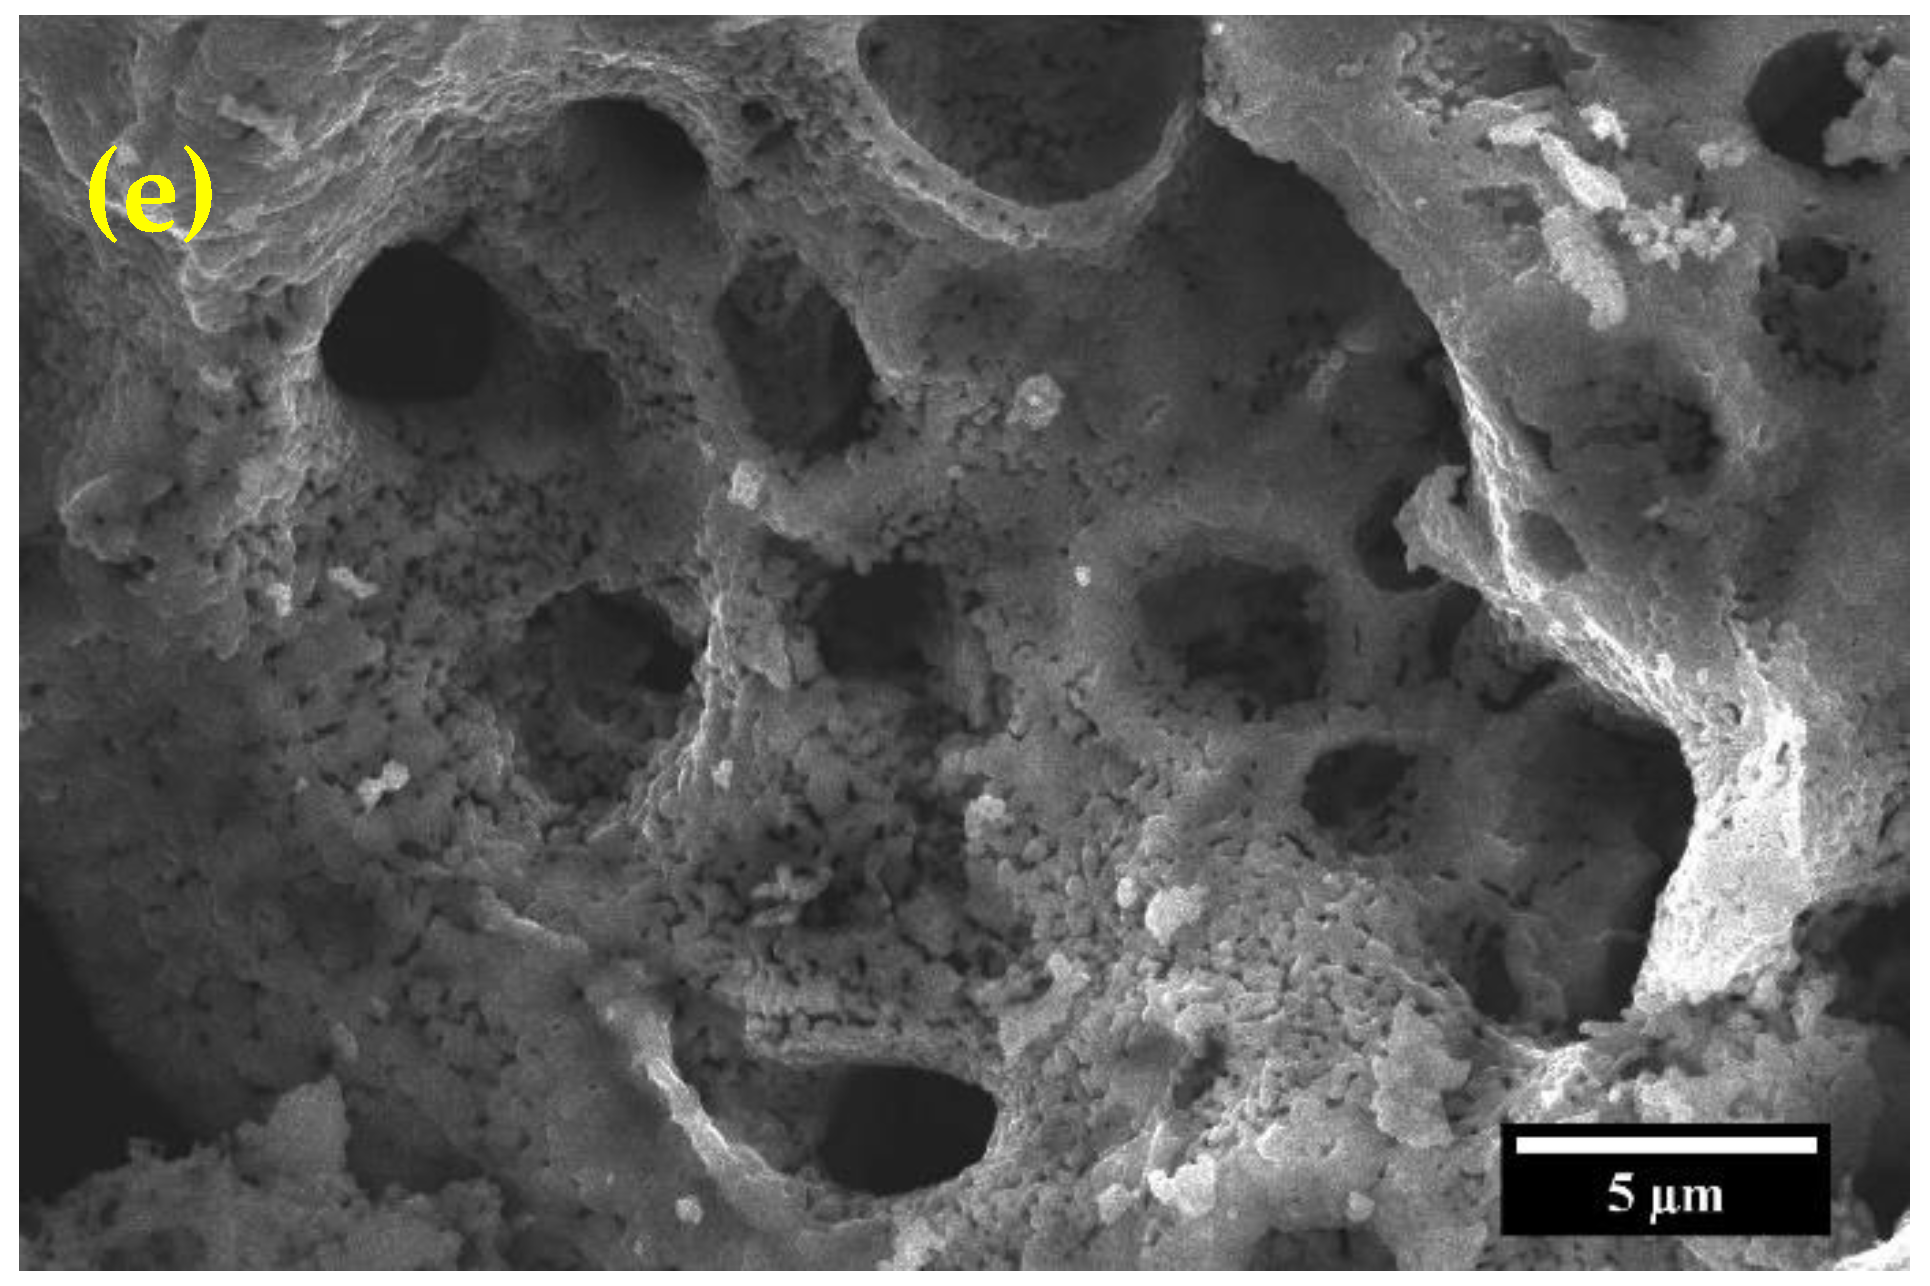
3.5. Scanning Electron Microscopy

Figure 5 shows the morphology of pure and Cr-doped BiFeO3 samples using Scanning Electron Microscopy (SEM) analysis. The micrographs reveal non-uniform grain shape and size, as well as intergranular porosity, which affects the sample density. However, intergranular porosity is present in all samples and can be attributed to the emission of a large quantity of gases due to the volatilization of citric acid [29]. It can be observed that the grain size is significantly reduced by increasing the Cr dopant concentration, as shown in Figure S1. The grain size average decreases with increasing Cr content, with averages of 1052.31 nm, 602.63 nm, 517.55 nm, 281.16 nm, and 243.89 nm, corresponding to BiFeO3, BiFeO3-1%Cr, BiFeO3-3%Cr, BiFeO3-5%Cr, and BiFeO3-10%Cr, respectively. The reduction in grain size of Cr-doped BFO ceramics can be explained by the suppression of oxygen vacancy concentration, which slows down the motion of oxygen ions and the grain growth rate [45].
The analysis of multiple scanning electron microscopy images showed that the average thickness of the fabricated electrodes was (7.05 ± 0.49), (6.59 ± 0.32), (6.22 ± 0.54), (5.01 ± 0.56), and (2.55 ± 0.27) μm corresponding to the BiFeO3, BiFeO3-1%Cr, BiFeO3-3%Cr, BiFeO3-5%Cr, and BiFeO3-10%Cr samples, respectively (Figure S2). It can be seen that the reduction in the electrode thickness is linked to the decrease in the particle size of the samples.

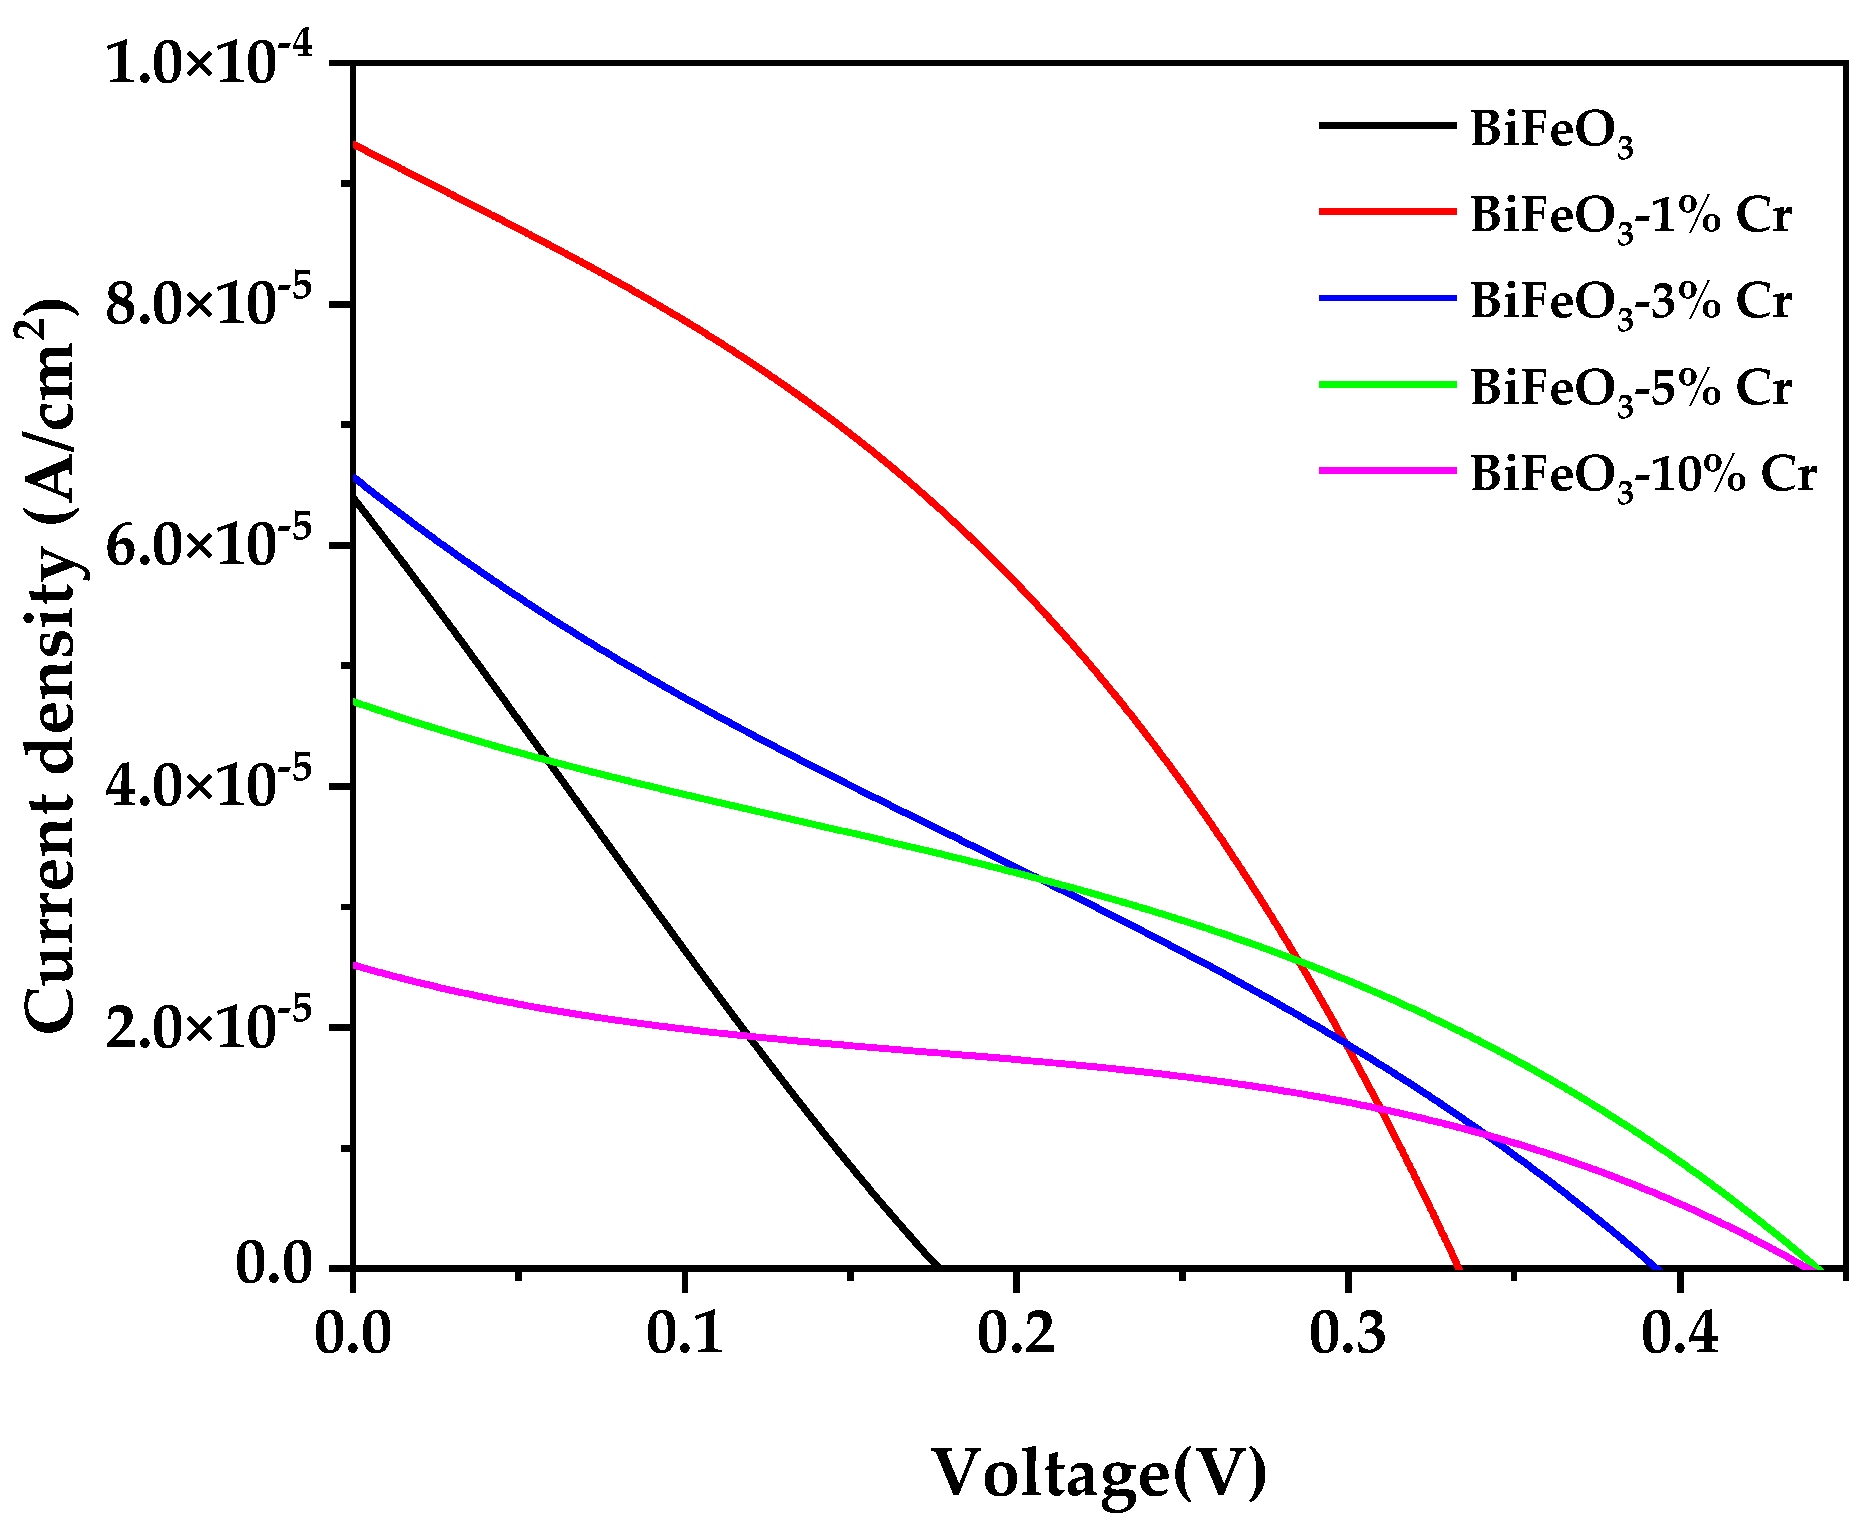
3.6. Solar Cell Evaluation

The results shown in Figure 6 illustrate the behavior of the BiFeO3-based solar cell and the influence of chromium-doping on the current and voltage generated. With 1% chromium, currents of up to 9.32 × 10⁻⁵ A/cm2 can be achieved. This result is 45% higher than the current generated by the pure BiFeO3-based solar cell, while the generated voltage increases to two times higher than that generated by the pure BiFeO3-based solar cell. The figure also shows that increasing the chromium concentration decreases the current generated but increases the voltage to 0.44 V for the samples with 5% and 10% chromium dopant. Table 3 shows the electrical parameters of the manufactured solar cells with pure and Cr-doped BiFeO3-based photoelectrodes. The values found show an improvement in the efficiency of the solar cells based on BiFeO3 photoelectrodes compared to literature values due to improvement in the absorption of solar radiation through chromium-doping [46]. This improved efficiency, in turn, could lead to the formation of defects, mainly vacancies, which can cause the recombination of electron-hole pairs, decreasing the current in a short circuit [5,33]. The experimental results show that at low-dopant concentrations, the defects generated are isolated interstitial defects which do not significantly affect the efficiency of the solar cell. The high number of charge carriers may be due to an improvement in the local photocurrent, as chromium-doping improves the conductivity of BiFeO3 [47]. However, high concentrations of dopant generate a larger number of defects that negatively impact the solar cell, recombining the electron-hole pairs.

4. Conclusions

The addition of Cr dopant to BiFeO3 improved several physical properties of the material, including its weight loss, phase transformation process, crystallite size, bandgap, and particle size. These improvements were observed through various techniques, such as thermogravimetric analysis, which showed a weight loss of approximately ~61% to ~81% for pure BiFeO3 and BiFeO3-10% Cr, respectively. Differential Scanning Calorimetry showed that increasing the chromium concentration produced a phase transformation process with greater energy release.
X-ray diffraction results showed that the undoped sample corresponded to bismuth ferrite, and that increasing the dopant concentration resulted in the formation of a residual phase corresponding to bismuth oxide (Bi2O3). Refinement of the diffraction patterns showed that the crystallite size decreased from 168 nm to 73 nm with increasing doping concentration.
Similarly, the bandgap of the synthesized samples decreased from 2.14 eV to 1.92 eV, depending on the amount of dopant used.
SEM microphotographs of the samples showed a decrease in particle size from 1052 nm to 243 nm, a change also related to the doping concentration, with higher doping resulting in smaller particle size.
Evaluation of the solar cells showed that the solar cell with the best performance was made with BiFeO3-1% Cr achieving the highest efficiency compared to the other cells manufactured. These findings suggest that Cr-doped BiFeO3 may have potential applications in a variety of fields, including energy conversion and storage. Further research could explore these potential uses and extensions of this material.

Supplementary Materials

The following supporting information can be downloaded at: https://www.mdpi.com/article/10.3390/en16020786/s1, Figure S1. Particle size distribution of (a) Pure BiFeO3, (b) BiFeO3 -1% Cr, (c) BiFeO3 -3% Cr, (d) BiFeO3 -5% Cr and (e) BiFeO3 -10% Cr and Figure S2. Electrode Thickness of (a) Pure BiFeO3, (b) BiFeO3 -1% Cr, (c) BiFeO3 -3% Cr, (d) BiFeO3 -5% Cr and (e) BiFeO3 -10% Cr Solar cell.

Author Contributions

J.T., E.M., and J.C. funding acquisition, experiment design, investigation; E.S., experiment design, investigation, characterization, data analysis and Writing—original draft, review and editing; F.G. and J.M., XRD and SEM analysis; C.P., Solar cell evaluation; A.Q., Writing—review and editing. All authors have read and agreed to the published version of the manuscript.

Funding

This research was funded by the Universidad Nacional Jorge Basadre Grohmann through “Fondos del canon sobrecanon y regalias mineras”, approved by rectoral resolution N° 4516-2018-UN/JBG, with the project “Study of ferroelectric materials (BiFeO3 and Bi2FeCrO6) and their application in solar cells”.

Data Availability Statement

The data presented in this study are available on request from the corresponding author.

Acknowledgments

We are grateful to the projects: “Study of the application of nanotechnology for the purification of water with arsenic in the Tacna region,” “Development of thin films of MWCNT/TiO2 to improve the efficiency of dye sensitized solar cells (DSSC),” and “Determination of the optical fingerprints of solid, liquid and organic materials using visible and infrared spectroscopy,” of the Universidad Nacional Jorge Basadre Grohmann, approved by rectoral resolutions Nº 3780-2014-UN/JBG, N° 4516-2018-UN/JBG and N° 5854-2019-UN/JBG, respectively, for their support.

Conflicts of Interest

The authors declare no conflict of interest.

References

  1. Kåberger, T. Progress of renewable electricity replacing fossil fuels. Glob. Energy Interconnect. 2018, 1, 48–52. [Google Scholar] [CrossRef]
  2. Ibn-Mohammed, T.; Koh, S.; Reaney, I.M.; Acquaye, A.; Schileo, G.; Mustapha, K.B.; Greenough, R. Perovskite solar cells: An integrated hybrid lifecycle assessment and review in comparison with other photovoltaic technologies. Renew. Sustain. Energy Rev. 2017, 80, 1321–1344. [Google Scholar] [CrossRef]
  3. Li, P.-F.; Tang, Y.-Y.; Liao, W.-Q.; Ye, H.-Y.; Zhang, Y.; Fu, D.-W.; You, Y.-M.; Xiong, R.-G. A semiconducting molecular ferroelectric with a bandgap much lower than that of BiFeO3. NPG Asia Mater. 2017, 9, e342. [Google Scholar] [CrossRef] [Green Version]
  4. Zheng, F.; Xin, Y.; Huang, W.; Zhang, J.; Wang, X.; Shen, M.; Dong, W.; Fang, L.; Bai, Y.; Shen, X.; et al. Above 1% efficiency of a ferroelectric solar cell based on the Pb(Zr,Ti)O3 film. J. Mater. Chem. A 2014, 2, 1363–1368. [Google Scholar] [CrossRef]
  5. Mocherla, P.S.V.; Karthik, C.; Ubic, R.; Ramachandra Rao, M.S.; Sudakar, C. Tunable bandgap in BiFeO3 nanoparticles: The role of microstrain and oxygen defects. Appl. Phys. Lett. 2013, 103, 22910. [Google Scholar] [CrossRef]
  6. Li, J.; Sha, N.; Zhao, Z. Effect of annealing atmosphere on the ferroelectric properties of inkjet printed BiFeO3 thin films. Appl. Surf. Sci. 2018, 454, 233–238. [Google Scholar] [CrossRef]
  7. Djatoubai, E.; Khan, M.S.; ul Haq, S.; Guo, P.; Shen, S. BiFeO3 bandgap engineering by dopants and defects control for efficient photocatalytic water oxidation. Appl. Catal. A Gen. 2022, 643, 118737. [Google Scholar] [CrossRef]
  8. Renuka, H.; Joshna, P.; Venkataraman, B.H.; Ramaswamy, K.; Kundu, S. Understanding the efficacy of electron and hole transport layers in realizing efficient chromium doped BiFeO3 ferroelectric photovoltaic devices. Sol. Energy 2020, 207, 767–776. [Google Scholar] [CrossRef]
  9. Yan, T.-L.; Chen, B.; Liu, G.; Niu, R.-P.; Shang, J.; Gao, S.; Xue, W.-H.; Jin, J.; Yang, J.-R.; Li, R.-W. Improved photovoltaic effects in Mn-doped BiFeO3 ferroelectric thin films through band gap engineering. Chin. Phys. B 2017, 26, 67702. [Google Scholar] [CrossRef]
  10. Vishwakarma, A.K.; Tripathi, P.; Srivastava, A.; Sinha, A.; Srivastava, O.N. Band gap engineering of Gd and Co doped BiFeO3 and their application in hydrogen production through photoelectrochemical route. Int. J. Hydrogen Energy 2017, 42, 22677–22686. [Google Scholar] [CrossRef]
  11. Zhang, J.; Ma, P.; Shi, T.; Shao, X. Nd-Cr co-doped BiFeO3 thin films for photovoltaic devices with enhanced photovoltaic performance. Thin Solid Film. 2020, 698, 137852. [Google Scholar] [CrossRef]
  12. Yao, Y.; Liu, W.; Chan, Y.; Leung, C.; Mak, C.; Ploss, B. Studies of Rare-Earth-Doped BiFeO3 Ceramics. Int. J. Appl. Ceram. Technol. 2011, 8, 1246–1253. [Google Scholar] [CrossRef]
  13. Silva, J.; Reyes, A.; Esparza, H.; Camacho, H.; Fuentes, L. BiFeO3: A Review on Synthesis, Doping and Crystal Structure. Integr. Ferroelectr. 2011, 126, 47–59. [Google Scholar] [CrossRef]
  14. Yang, C.-H.; Seidel, J.; Kim, S.Y.; Rossen, P.B.; Yu, P.; Gajek, M.; Chu, Y.H.; Martin, L.W.; Holcomb, M.B.; He, Q.; et al. Electric modulation of conduction in multiferroic Ca-doped BiFeO3 films. Nat. Mater. 2009, 8, 485–493. [Google Scholar] [CrossRef] [PubMed]
  15. Feng, D.; Huang, B.; Li, L.; Li, X.; Gu, Y.; Hu, W.; Zhang, Z. The effects of Eu3+ doping on the epitaxial growth and photovoltaic properties of BiFeO3 thin films. J. Mater. Sci. Technol. 2022, 106, 49–55. [Google Scholar] [CrossRef]
  16. Yang, T.; Wei, J.; Sun, Z.; Li, Y.; Liu, Z.; Xu, Y.; Chen, G.; Wang, T.; Sun, H.; Cheng, Z. Design of oxygen vacancy in BiFeO3-based films for higher photovoltaic performance. Appl. Surf. Sci. 2022, 575, 151713. [Google Scholar] [CrossRef]
  17. Tablero, C. An evaluation of BiFeO3 as a photovoltaic material. Sol. Energy Mater. Sol. Cells 2017, 171, 161–165. [Google Scholar] [CrossRef]
  18. Gopal Khan, G.; Das, R.; Mukherjee, N.; Mandal, K. Effect of metal doping on highly efficient photovoltaics and switchable photovoltage in bismuth ferrite nanotubes. Phys. Status Solidi RRL 2012, 6, 312–314. [Google Scholar] [CrossRef]
  19. Ahmad, T.; Jindal, K.; Tomar, M.; Jha, P.K.; Gupta, V. Role of charge states and dopant site in governing electronic properties of Cr doped BiFeO3. Mater. Chem. Phys. 2021, 263, 124438. [Google Scholar] [CrossRef]
  20. Kim, J.K.; Kim, S.S.; Kim, W.-J. Sol–gel synthesis and properties of multiferroic BiFeO3. Mater. Lett. 2005, 59, 4006–4009. [Google Scholar] [CrossRef]
  21. Khakhomov, S.A.; Gaishun, V.E.; Kovalenko, D.L.; Semchenko, A.V.; Sidsky, V.V.; Strek, W.; Hreniak, D.; Lukowiak, A.; Kovalchuk, N.S.; Pyatlitski, A.N.; et al. Synthesis of BiFeO3-Powders by Sol-Gel Process. In Recent Advances in Technology Research and Education; Laukaitis, G., Ed.; Springer International Publishing: Cham, Switzerland, 2019; pp. 43–48. ISBN 978-3-319-99833-6. [Google Scholar]
  22. Wang, Y.; Jiang, Q.; He, H.; Nan, C.-W. Multiferroic BiFeO3 thin films prepared via a simple sol-gel method. Appl. Phys. Lett. 2006, 88, 142503. [Google Scholar] [CrossRef]
  23. Majid, F.; Mirza, S.T.; Riaz, S.; Naseem, S. Sol-Gel Synthesis of BiFeO3 Nanoparticles. Mater. Today Proc. 2015, 2, 5293–5297. [Google Scholar] [CrossRef]
  24. Niu, F.; Gao, T.; Zhang, N.; Chen, Z.; Huang, Q.; Qin, L.; Sun, X.; Huang, Y. Hydrothermal Synthesis of BiFeO3 Nanoparticles for Visible Light Photocatalytic Applications. J. Nanosci. Nanotechnol. 2015, 15, 9693–9698. [Google Scholar] [CrossRef] [PubMed]
  25. Mazumder, R.; Chakravarty, D.; Bhattacharya, D.; Sen, A. Spark plasma sintering of BiFeO3. Mater. Res. Bull. 2009, 44, 555–559. [Google Scholar] [CrossRef]
  26. Han, H.; Lee, J.H.; Jang, H.M. Low-Temperature Solid-State Synthesis of High-Purity BiFeO3 Ceramic for Ferroic Thin-Film Deposition. Inorg. Chem. 2017, 56, 11911–11916. [Google Scholar] [CrossRef]
  27. Ferri, E.A.V.; Santos, I.A.; Radovanovic, E.; Bonzanini, R.; Girotto, E.M. Chemical characterization of BiFeO3 obtained by Pechini method. J. Braz. Chem. Soc. 2008, 19, 1153–1157. [Google Scholar] [CrossRef] [Green Version]
  28. Yotburut, B.; Yamwong, T.; Thongbai, P.; Maensiri, S. Synthesis and characterization of coprecipitation-prepared La-doped BiFeO3 nanopowders and their bulk dielectric properties. Jpn. J. Appl. Phys. 2014, 53, 06JG13. [Google Scholar] [CrossRef]
  29. Varma, A.; Mukasyan, A.S.; Rogachev, A.S.; Manukyan, K.V. Solution Combustion Synthesis of Nanoscale Materials. Chem. Rev. 2016, 116, 14493–14586. [Google Scholar] [CrossRef]
  30. Wang, J.; Wei, Y.; Zhang, J.; Ji, L.; Huang, Y.; Chen, Z. Synthesis of pure-phase BiFeO3 nanopowder by nitric acid-assisted gel. Mater. Lett. 2014, 124, 242–244. [Google Scholar] [CrossRef]
  31. Sharma, S.; Singh, V.; Kotnala, R.K.; Dwivedi, R.K. Comparative studies of pure BiFeO3 prepared by sol–gel versus conventional solid-state-reaction method. J. Mater. Sci. Mater. Electron. 2014, 25, 1915–1921. [Google Scholar] [CrossRef]
  32. Layek, S.; Saha, S.; Verma, H.C. Preparation, structural and magnetic studies on BiFe 1-x Cr x O 3 (x = 0.0, 0.05 and 0.1) multiferroic nanoparticles. AIP Adv. 2013, 3, 32140. [Google Scholar] [CrossRef] [Green Version]
  33. Sinha, A.K.; Bhushan, B.; Jagannath; Sharma, R.K.; Sen, S.; Mandal, B.P.; Meena, S.S.; Bhatt, P.; Prajapat, C.L.; Priyam, A.; et al. Enhanced dielectric, magnetic and optical properties of Cr-doped BiFeO3 multiferroic nanoparticles synthesized by sol-gel route. Results Phys. 2019, 13, 102299. [Google Scholar] [CrossRef]
  34. Guan, X.Y.; Qiao, Z.W.; Yan, D.Z.; Sun, Y.F.; Li, J. Investigation on structural and functional properties of Nd doped BiFeO3 particles prepared by hydrothermal method. J. Mater. Sci. Mater. Electron. 2015, 26, 6807–6813. [Google Scholar] [CrossRef]
  35. Chaturvedi, S.; Das, R.; Poddar, P.; Kulkarni, S. Tunable band gap and coercivity of bismuth ferrite–polyaniline core–shell nanoparticles: The role of shell thickness. RSC Adv. 2015, 5, 23563–23568. [Google Scholar] [CrossRef] [Green Version]
  36. Higuchi, T.; Liu, Y.-S.; Yao, P.; Glans, P.-A.; Guo, J.; Chang, C.; Wu, Z.; Sakamoto, W.; Itoh, N.; Shimura, T.; et al. Electronic structure of multiferroic BiFeO3 by resonant soft x-ray emission spectroscopy. Phys. Rev. B 2008, 78, 085106. [Google Scholar] [CrossRef] [Green Version]
  37. Hasan, M.; Basith, M.A.; Zubair, M.A.; Hossain, M.S.; Mahbub, R.; Hakim, M.A.; Islam, M.F. Saturation magnetization and band gap tuning in BiFeO3 nanoparticles via co-substitution of Gd and Mn. J. Alloys Compd. 2016, 687, 701–706. [Google Scholar] [CrossRef] [Green Version]
  38. Irfan, S.; Shen, Y.; Rizwan, S.; Wang, H.-C.; Khan, S.B.; Nan, C.-W. Band-Gap Engineering and Enhanced Photocatalytic Activity of Sm and Mn Doped BiFeO3 Nanoparticles. J. Am. Ceram. Soc. 2017, 100, 31–40. [Google Scholar] [CrossRef]
  39. Hussain, S.; Hasanain, S.K. Chemical pressure induced red shift in band gap and d-d transition energies in Sr doped BiFeO3. J. Alloys Compd. 2016, 688, 1151–1156. [Google Scholar] [CrossRef]
  40. Arora, M.; Sati, P.C.; Chauhan, S.; Chhoker, S.; Panwar, A.K.; Kumar, M. Structural, Optical and Multiferroic Properties of BiFeO3 Nanoparticles Synthesized by Soft Chemical Route. J. Supercond. Nov. Magn. 2013, 26, 443–448. [Google Scholar] [CrossRef]
  41. Peng, L.; Deng, H.; Tian, J.; Ren, Q.; Peng, C.; Huang, Z.; Yang, P.; Chu, J. Influence of Co doping on structural, optical and magnetic properties of BiFeO3 films deposited on quartz substrates by sol–gel method. Appl. Surf. Sci. 2013, 268, 146–150. [Google Scholar] [CrossRef]
  42. Yousaf, M.; Lu, Y.; Hu, E.; Wang, B.; Niaz Akhtar, M.; Noor, A.; Akbar, M.; Yousaf Shah, M.A.K.; Wang, F.; Zhu, B. Tunable magneto-optical and interfacial defects of Nd and Cr-doped bismuth ferrite nanoparticles for microwave absorber applications. J. Colloid Interface Sci. 2022, 608, 1868–1881. [Google Scholar] [CrossRef] [PubMed]
  43. Amin, M.; Rafique, H.M.; Yousaf, M.; Ramay, S.M.; Saleem, M.; Abbas, S.K.; Atiq, S. Multiferroicity in sol–gel synthesized Sr/Mn co-doped BiFeO3 nanoparticles. J. Mater. Sci. Mater. Electron. 2017, 28, 17234–17244. [Google Scholar] [CrossRef]
  44. Cao, W.; Chen, Z.; Gao, T.; Zhou, D.; Leng, X.; Niu, F.; Zhu, Y.; Qin, L.; Wang, J.; Huang, Y. Rapid synthesis of single-phase bismuth ferrite by microwave-assisted hydrothermal method. Mater. Chem. Phys. 2016, 175, 1–5. [Google Scholar] [CrossRef]
  45. Song, G.L.; Zhang, H.X.; Wang, T.X.; Yang, H.; Chang, F.G. Effect of Sm, Co codoping on the dielectric and magnetoelectric properties of BiFeO3 polycrystalline ceramics. J. Magn. Magn. Mater. 2012, 324, 2121–2126. [Google Scholar] [CrossRef]
  46. Renuka, H.; Venkataraman, B.H.; Ramaswamy, K.; Kundu, S.; Goel, S. A Study on the effect of Cr doping on the Structural, Optical and Photovoltaic Properties of BFO based Heterostructures. In Proceedings of the 2021 IEEE 48th Photovoltaic Specialists Conference (PVSC), Fort Lauderdale, FL, USA, 20–25 June 2021; Volume 6202021, pp. 1182–1186, ISBN 978-1-6654-1922-2. [Google Scholar]
  47. Renuka, H.; Sharma, S.; Venkataraman, B.H.; Ramaswamy, K.; Chappanda, K.N.; Kundu, S.; Goel, S. Extensive Enhancement in Charge Collection Efficiency of Ferroelectric Cr-Doped BFO-Based Solar Cells by Using TiO2 Nanotube Arrays. IEEE J. Photovolt. 2021, 11, 1278–1284. [Google Scholar] [CrossRef]
  48. Arti; Gupta, R.; Singh, S.P.; Walia, R.; Kumar, V.; Verma, V. Modification in photovoltaic and photocatalytic properties of bismuth ferrites by tailoring band-gap and ferroelectric properties. J. Alloys Compd. 2022, 908, 164602. [Google Scholar] [CrossRef]
  49. Katiyar, R.K.; Misra, P.; Morell, G.; Katiyar, R.S. Effect of Poling on Photovoltaic Properties in Highly Oriented BiFeO 3 Thin Films. Integr. Ferroelectr. 2014, 157, 168–173. [Google Scholar] [CrossRef]
  50. Mai, H.; Lu, T.; Li, Q.; Sun, Q.; Vu, K.; Chen, H.; Wang, G.; Humphrey, M.G.; Kremer, F.; Li, L.; et al. Photovoltaic Effect of a Ferroelectric-Luminescent Heterostructure under Infrared Light Illumination. ACS Appl. Mater. Interfaces 2018, 10, 29786–29794. [Google Scholar] [CrossRef]
  51. Ceballos-Sanchez, O.; Sanchez-Martinez, A.; Flores-Ruiz, F.J.; Huerta-Flores, A.M.; Torres-Martínez, L.M.; Ruelas, R.; García-Guaderrama, M. Study of BiFeO3 thin film obtained by a simple chemical method for the heterojunction-type solar cell design. J. Alloys Compd. 2020, 832, 154923. [Google Scholar] [CrossRef]
  52. Fang, L.; You, L.; Zhou, Y.; Ren, P.; Shiuh Lim, Z.; Wang, J. Switchable photovoltaic response from polarization modulated interfaces in BiFeO3 thin films. Appl. Phys. Lett. 2014, 104, 142903. [Google Scholar] [CrossRef]
  53. Keskin, V.; Gupta, A.; Szulczewski, G. Solution processed TiO2/BiFeO3/poly(3-hexylthiophene) solar cells. Mater. Lett. 2015, 159, 305–308. [Google Scholar] [CrossRef] [Green Version]
  54. Dong, W.; Guo, Y.; Guo, B.; Li, H.; Liu, H.; Joel, T.W. Enhanced photovoltaic effect in BiVO4 semiconductor by incorporation with an ultrathin BiFeO3 ferroelectric layer. ACS Appl. Mater. Interfaces 2013, 5, 6925–6929. [Google Scholar] [CrossRef]
  55. Mohamed, M.M.; Reda, S.M.; Amer, A.A. Enhanced performance of BiFeO3@nitrogen doped TiO2 core-shell structured nanocomposites: Synergistic effect towards solar cell amplification. Arab. J. Chem. 2020, 13, 2611–2619. [Google Scholar] [CrossRef]
  56. Pei, W.; Chen, J.; You, D.; Zhang, Q.; Li, M.; Lu, Y.; Fu, Z.; He, Y. Enhanced photovoltaic effect in Ca and Mn co-doped BiFeO3 epitaxial thin films. Appl. Surf. Sci. 2020, 530, 147194. [Google Scholar] [CrossRef]
  57. Lin, Z.; Cai, W.; Jiang, W.; Fu, C.; Li, C.; Song, Y. Effects of annealing temperature on the microstructure, optical, ferroelectric and photovoltaic properties of BiFeO3 thin films prepared by sol–gel method. Ceram. Int. 2013, 39, 8729–8736. [Google Scholar] [CrossRef]
  58. Wang, M.; Wei, H.; Wu, Y.; Jia, J.; Yang, C.; Chen, Y.; Chen, X.; Cao, B. Polarization-enhanced bulk photovoltaic effect of BiFeO3 epitaxial film under standard solar illumination. Phys. Lett. A 2020, 384, 126831. [Google Scholar] [CrossRef]
  59. Kumar, A.M.; Peter, I.J.; Ramachandran, K.; Mayandi, J.; Jayakumar, K. Influence of Al-Cu doping on the efficiency of BiFeO3 based perovskite solar cell (PSC). Mater. Today Proc. 2021, 35, 62–65. [Google Scholar] [CrossRef]
Figure 1. Thermal study of pure and doped BiFeO3 through (a) Thermogravimetric analysis and (b) Differential Scanning Calorimetry.
Energies 16 00786 g001
Figure 2. (a) X-ray diffraction pattern of pure and doped BiFeO3 powder, and (b) influence of dopant on crystallite size and band gap.
Energies 16 00786 g002
Figure 3. (a) UV-visible diffuse reflectance spectra of pure and Cr-doped BiFeO3 and (b) the Kulbeka–Munk plot to calculate the energy bandgap.
Energies 16 00786 g003
Figure 4. FTIR spectra of pure and Cr-doped BiFeO3 int the region (a)4000-1000 cm−1 and (b)100-200 cm−1.
Energies 16 00786 g004
Figure 5. Scanning electron microscopy images (bar 5 μm) of (a) Pure BiFeO3, (b) BiFeO3-1% Cr, (c) BiFeO3-3% Cr, (d) BiFeO3-5% Cr, and (e) BiFeO3-10% Cr.
Energies 16 00786 g005aEnergies 16 00786 g005b
Figure 6. Current density-voltage curves for pure and Cr-doped BiFeO3.
Energies 16 00786 g006
Table 1. Advantages and disadvantages of BiFeO3 synthesis technique.
Synthesis TechniqueAdvantagesDisadvantagesRef.
Sol-Gel Method
-
Can produce highly pure materials
-
Can produce materials with fine particle size
-
Can produce materials with good homogeneity
-
Can be time-consuming
-
Can be expensive due to the need for specialized equipment and chemicals
[23]
Hydrothermal Method
-
Can produce materials with fine particle size
-
Can produce materials with good homogeneity
-
Can be relatively simple to set up and operate
-
Can produce materials with lower purity compared to other techniques
-
Can be sensitive to variations in reaction conditions
[24]
Spark Plasma Sintering
-
Can produce materials with fine particle size
-
Can produce materials with high density and good mechanical properties
-
Can be relatively fast
-
Can be expensive due to the need for specialized equipment
[25]
Solid State Reaction
-
Can produce materials with good purity
-
Can be relatively simple and cheap
-
Can produce materials with larger particle size compared to other techniques
-
Can be sensitive to variations in reaction conditions
[26]
Pechini methodCan produce high-quality BiFeO3 films with good uniformity and smooth surfaceRequires a complex synthesis process with multiple steps and the use of expensive precursors[27]
Coprecipitation methodCan produce BiFeO3 powders with good purity and crystallinityMay produce coarse or irregularly shaped particles and may require high temperatures and long reaction times[28]
Table 2. Structural parameters of pure and Cr-doped BiFeO3.
Structural ParameterSample
BiFeO3BiFeO3-1%CrBiFeO3-3%CrBiFeO3-5%CrBiFeO3-10%Cr
Crystal structureR3cR3cR3cR3cR3c
a = b (nm)5.57815.578015.57785.57645.5761
c (nm)13.868313.867913.865313.859913.8574
A = β (°)9090909090
γ (°)120120120120120
ρ (g/cm3)8.348.348.348.358.35
D (nm)168.18121.35115.0987.7373.36
Rexp (%)3.53335.41154.44544.19704.7448
Rwp (%)5.490410.28918.51668.785811.0893
Rp (%)3.01256.16144.77975.09516.3865
GOF1.55391.90121.91582.09342.3371
Eg (eV)2.142.122.092.031.92
Table 3. Photovoltaic parameters of pure and Cr-doped BiFeO3 solar cells compared with works reported in the literature.
SampleVoc
(V)
Jsc (A/cm2)Efficiency (%)Incident LightReference
BiFeO30.16786.41 × 10−52.73 × 10−3100 mW/cm2 AM 1.5 GThis work
BiFeO3-1%Cr0.3349.32 × 10−51.14 × 10−2100 mW/cm2 AM 1.5 GThis work
BiFeO3-3%Cr0.39296.58 × 10−56.72 × 10−3100 mW/cm2 AM 1.5 GThis work
BiFeO3-5%Cr0.44154.70 × 10−57.30 × 10−3100 mW/cm2 AM 1.5 GThis work
BiFeO3-10%Cr0.43952.52 × 10−54.15 × 10−3100 mW/cm2 AM 1.5 GThis work
Bi0.9Gd0.1Fe0.95Cr0.5O30.2712.32 × 10−63.6 × 10⁻³ [48]
BiFeO33.9262 × 10−9 100 mW/cm2[49]
ITO/BFO/Pt 5 × 10⁻³
BiFeO3/ Y2O3:Yb,Tm0.4049 × 10−9 20 mW, 980 nm laser[50]
Glass/ITO/CdS/BFO-Thin/PbS/Ag0.13 239 × 10−6 AM 1.5 G[51]
LSMO/BFO/LSMO/STO0.053.7 × 10−12 Halogen lamp, 20 mW/cm2[52]
TiO2/BiFeO3/poly(3-hexylthiophene)−0.465 × 10−5 150 W Xe lamp[53]
Au/BVO/FTO0.26 × 10−53.7 × 10−3100 mW/cm2 AM 1.5 G[54]
BiFeO30.464.8 × 10−63.7 × 10⁻³ELH-lamp, 100 mW/cm2 [55]
BiFeO3−0.118 × 10−58 × 10−4Xenon Lamp 280 mW/cm2[56]
BiFeO30.114.3 × 10−5 [57]
BiFeO30.7523.35 × 10−65 × 10−3100 mW/cm2 AM 1.5 G[58]
BiFeO30.285.3 × 10−51 × 10−3 [59]
Disclaimer/Publisher’s Note: The statements, opinions and data contained in all publications are solely those of the individual author(s) and contributor(s) and not of MDPI and/or the editor(s). MDPI and/or the editor(s) disclaim responsibility for any injury to people or property resulting from any ideas, methods, instructions or products referred to in the content.

