

ANN-Based Reliability Enhancement of SMPS Aluminum Electrolytic Capacitors in Cold Environments


Abstract
:1. Introduction
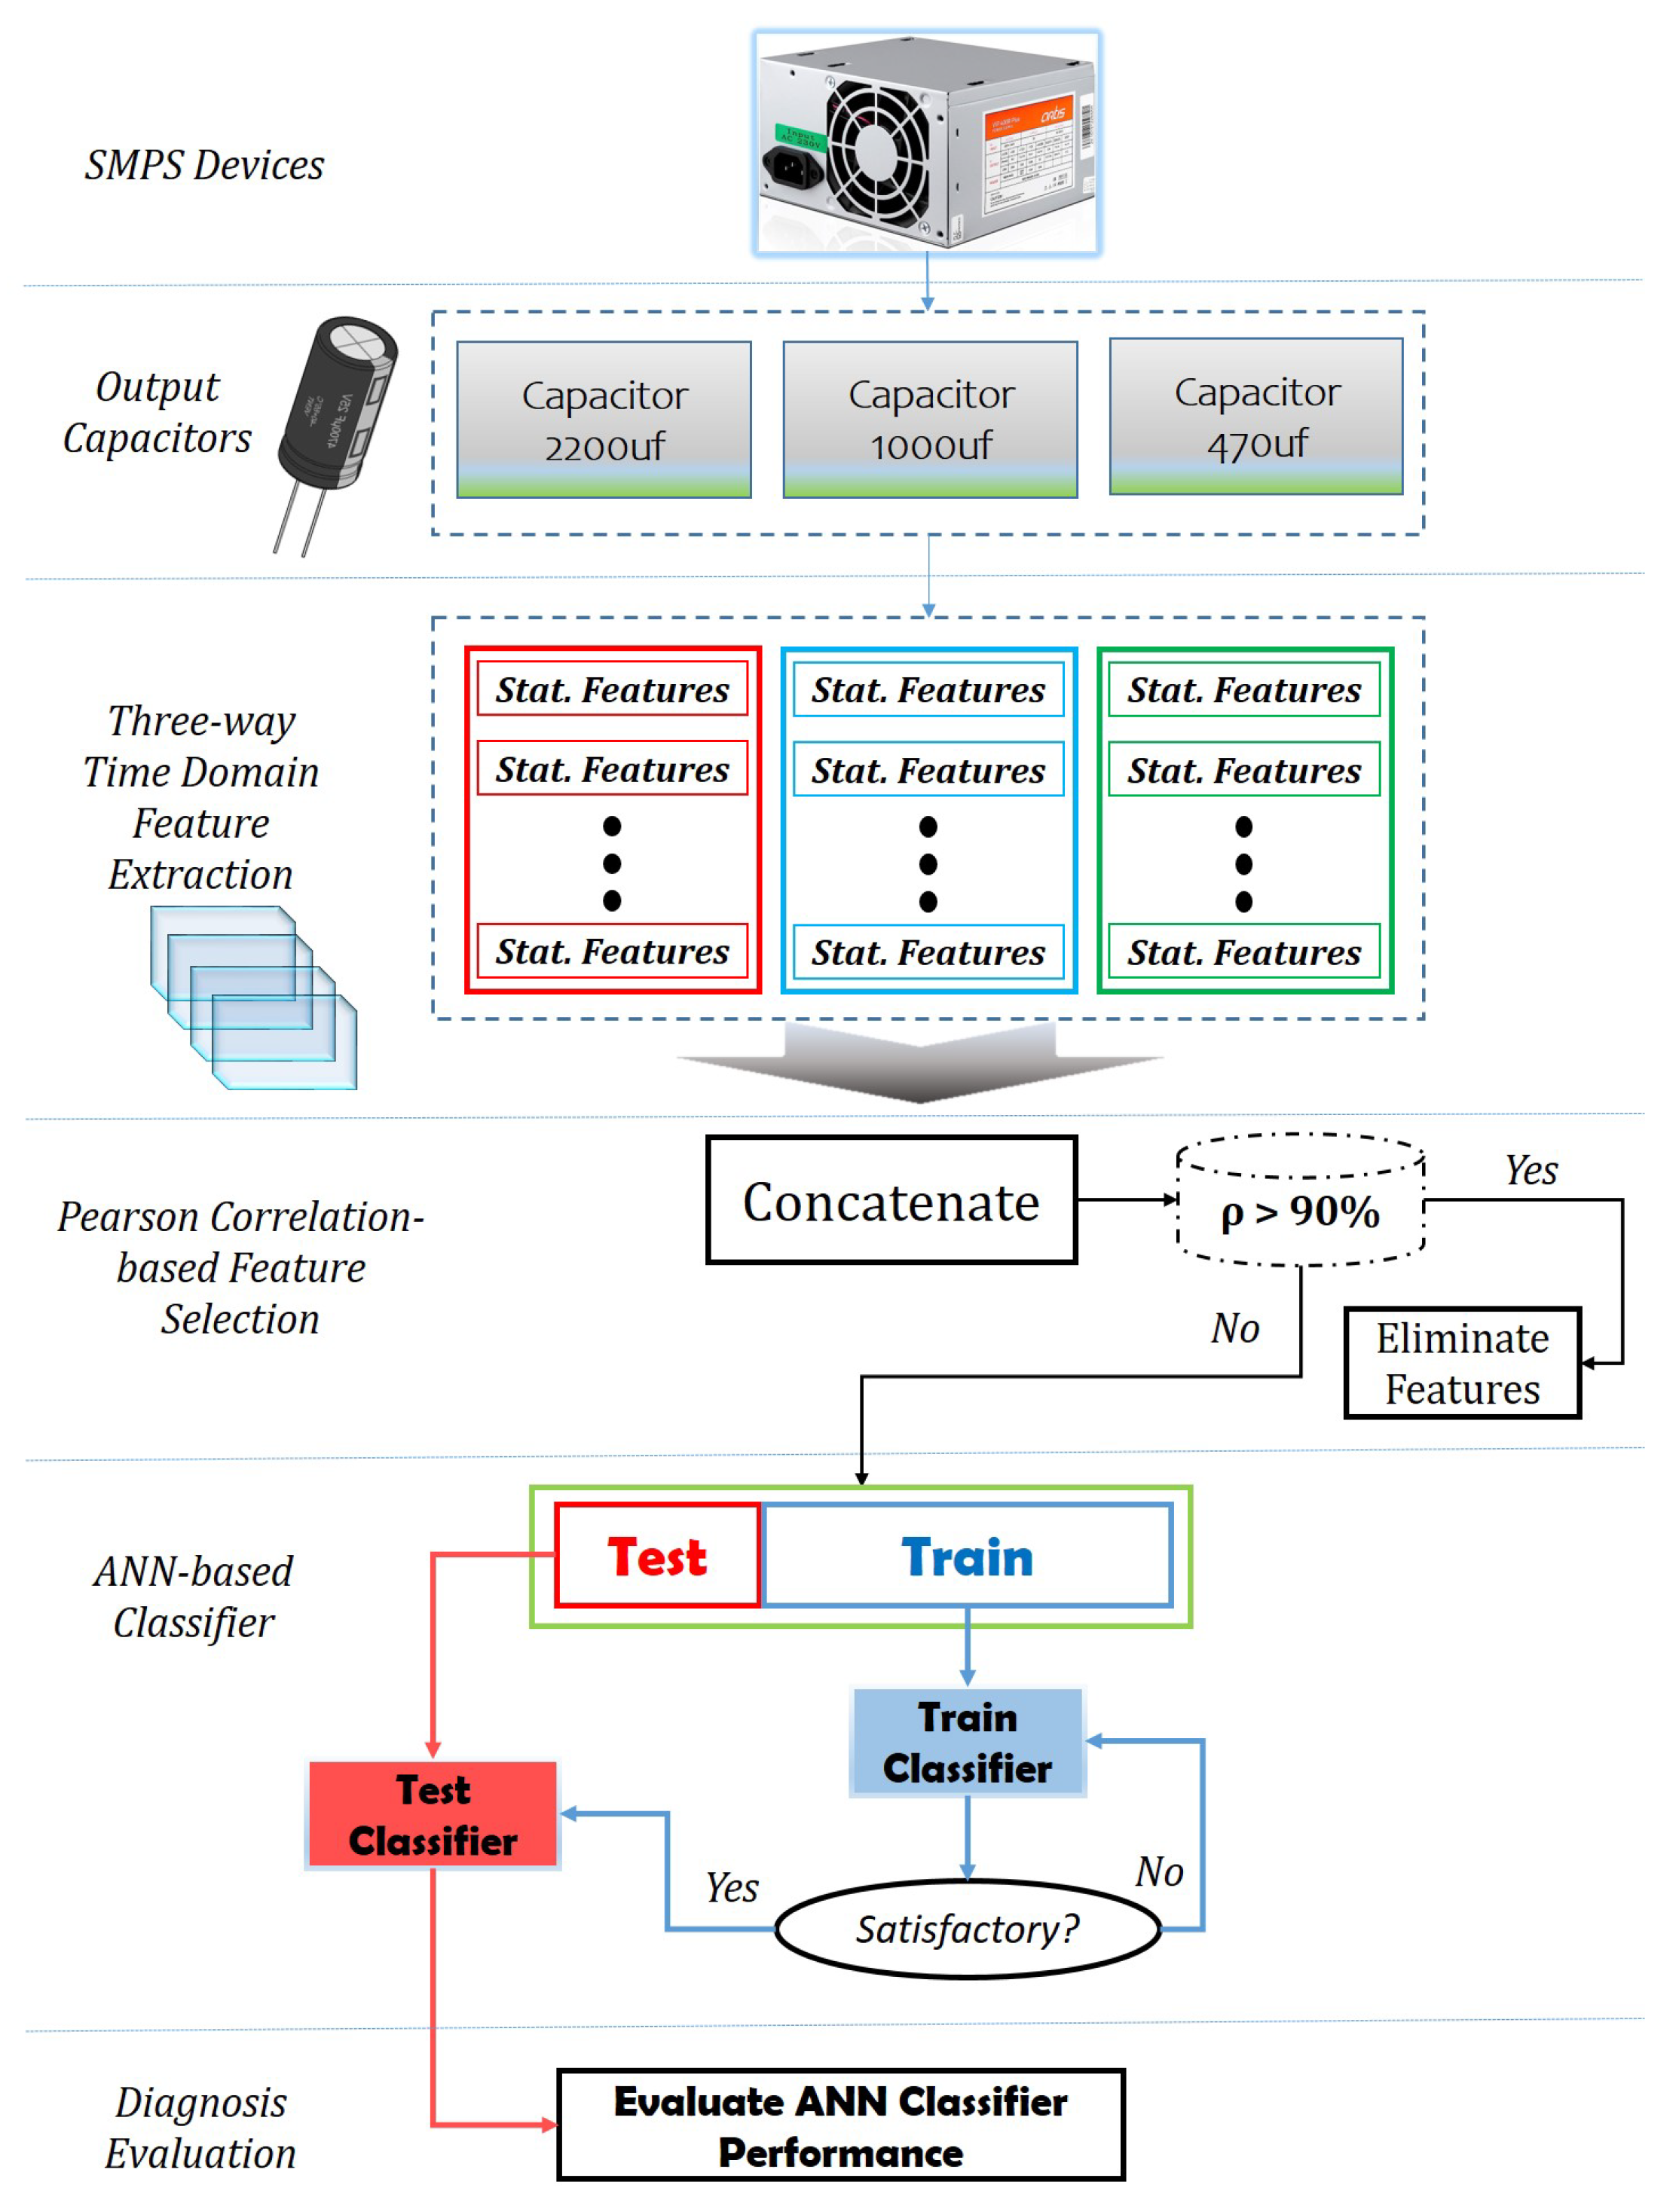
- This research paper introduces a statistical-based approach for extracting meaningful information from the dataset related to the aluminum electrolytic capacitor. This approach allows for the identification and analysis of key parameters that affect the capacitor’s reliability.
- This research paper proposes the utilization of an ANN-based machine learning algorithm. The extracted meaningful information from the dataset is fed into the ANN to develop a predictive model for assessing the reliability of the capacitor. This algorithm enhances the accuracy of reliability predictions and aids in identifying potential failure modes.
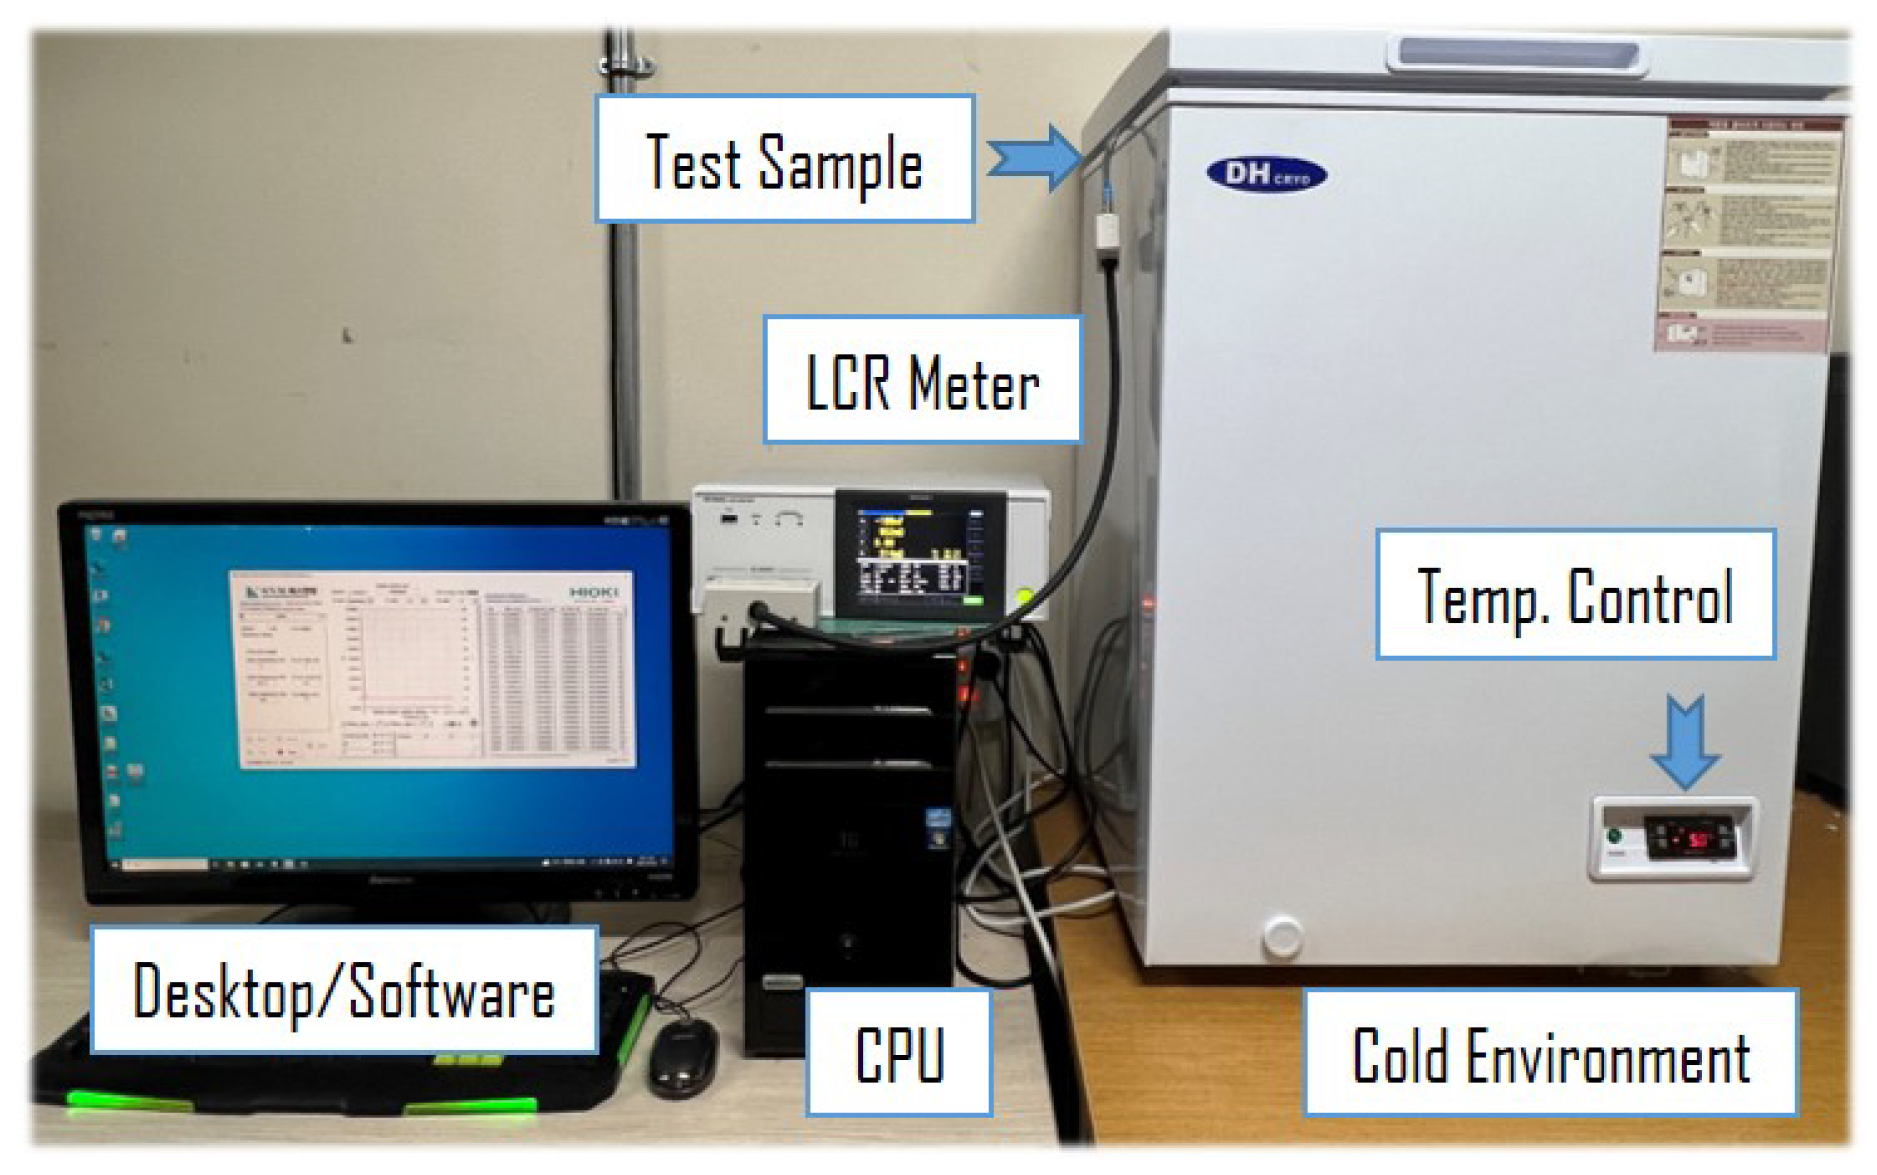
- This research paper describes an experimental process that employs a data-driven and multiple-choice approach for collecting various parameters related to the aluminum electrolytic capacitor. Parameters, such as equivalent series resistance (ESR), dissipation factor, capacitance, and impedance, are measured using the HIOKI LCR meter, providing a comprehensive dataset for analysis.
- The multiple-choice approach implemented during the experimental process ensures the collection of diverse data points for different capacitor parameters. This extensive dataset enhances the accuracy and robustness of the subsequent analysis and modeling.
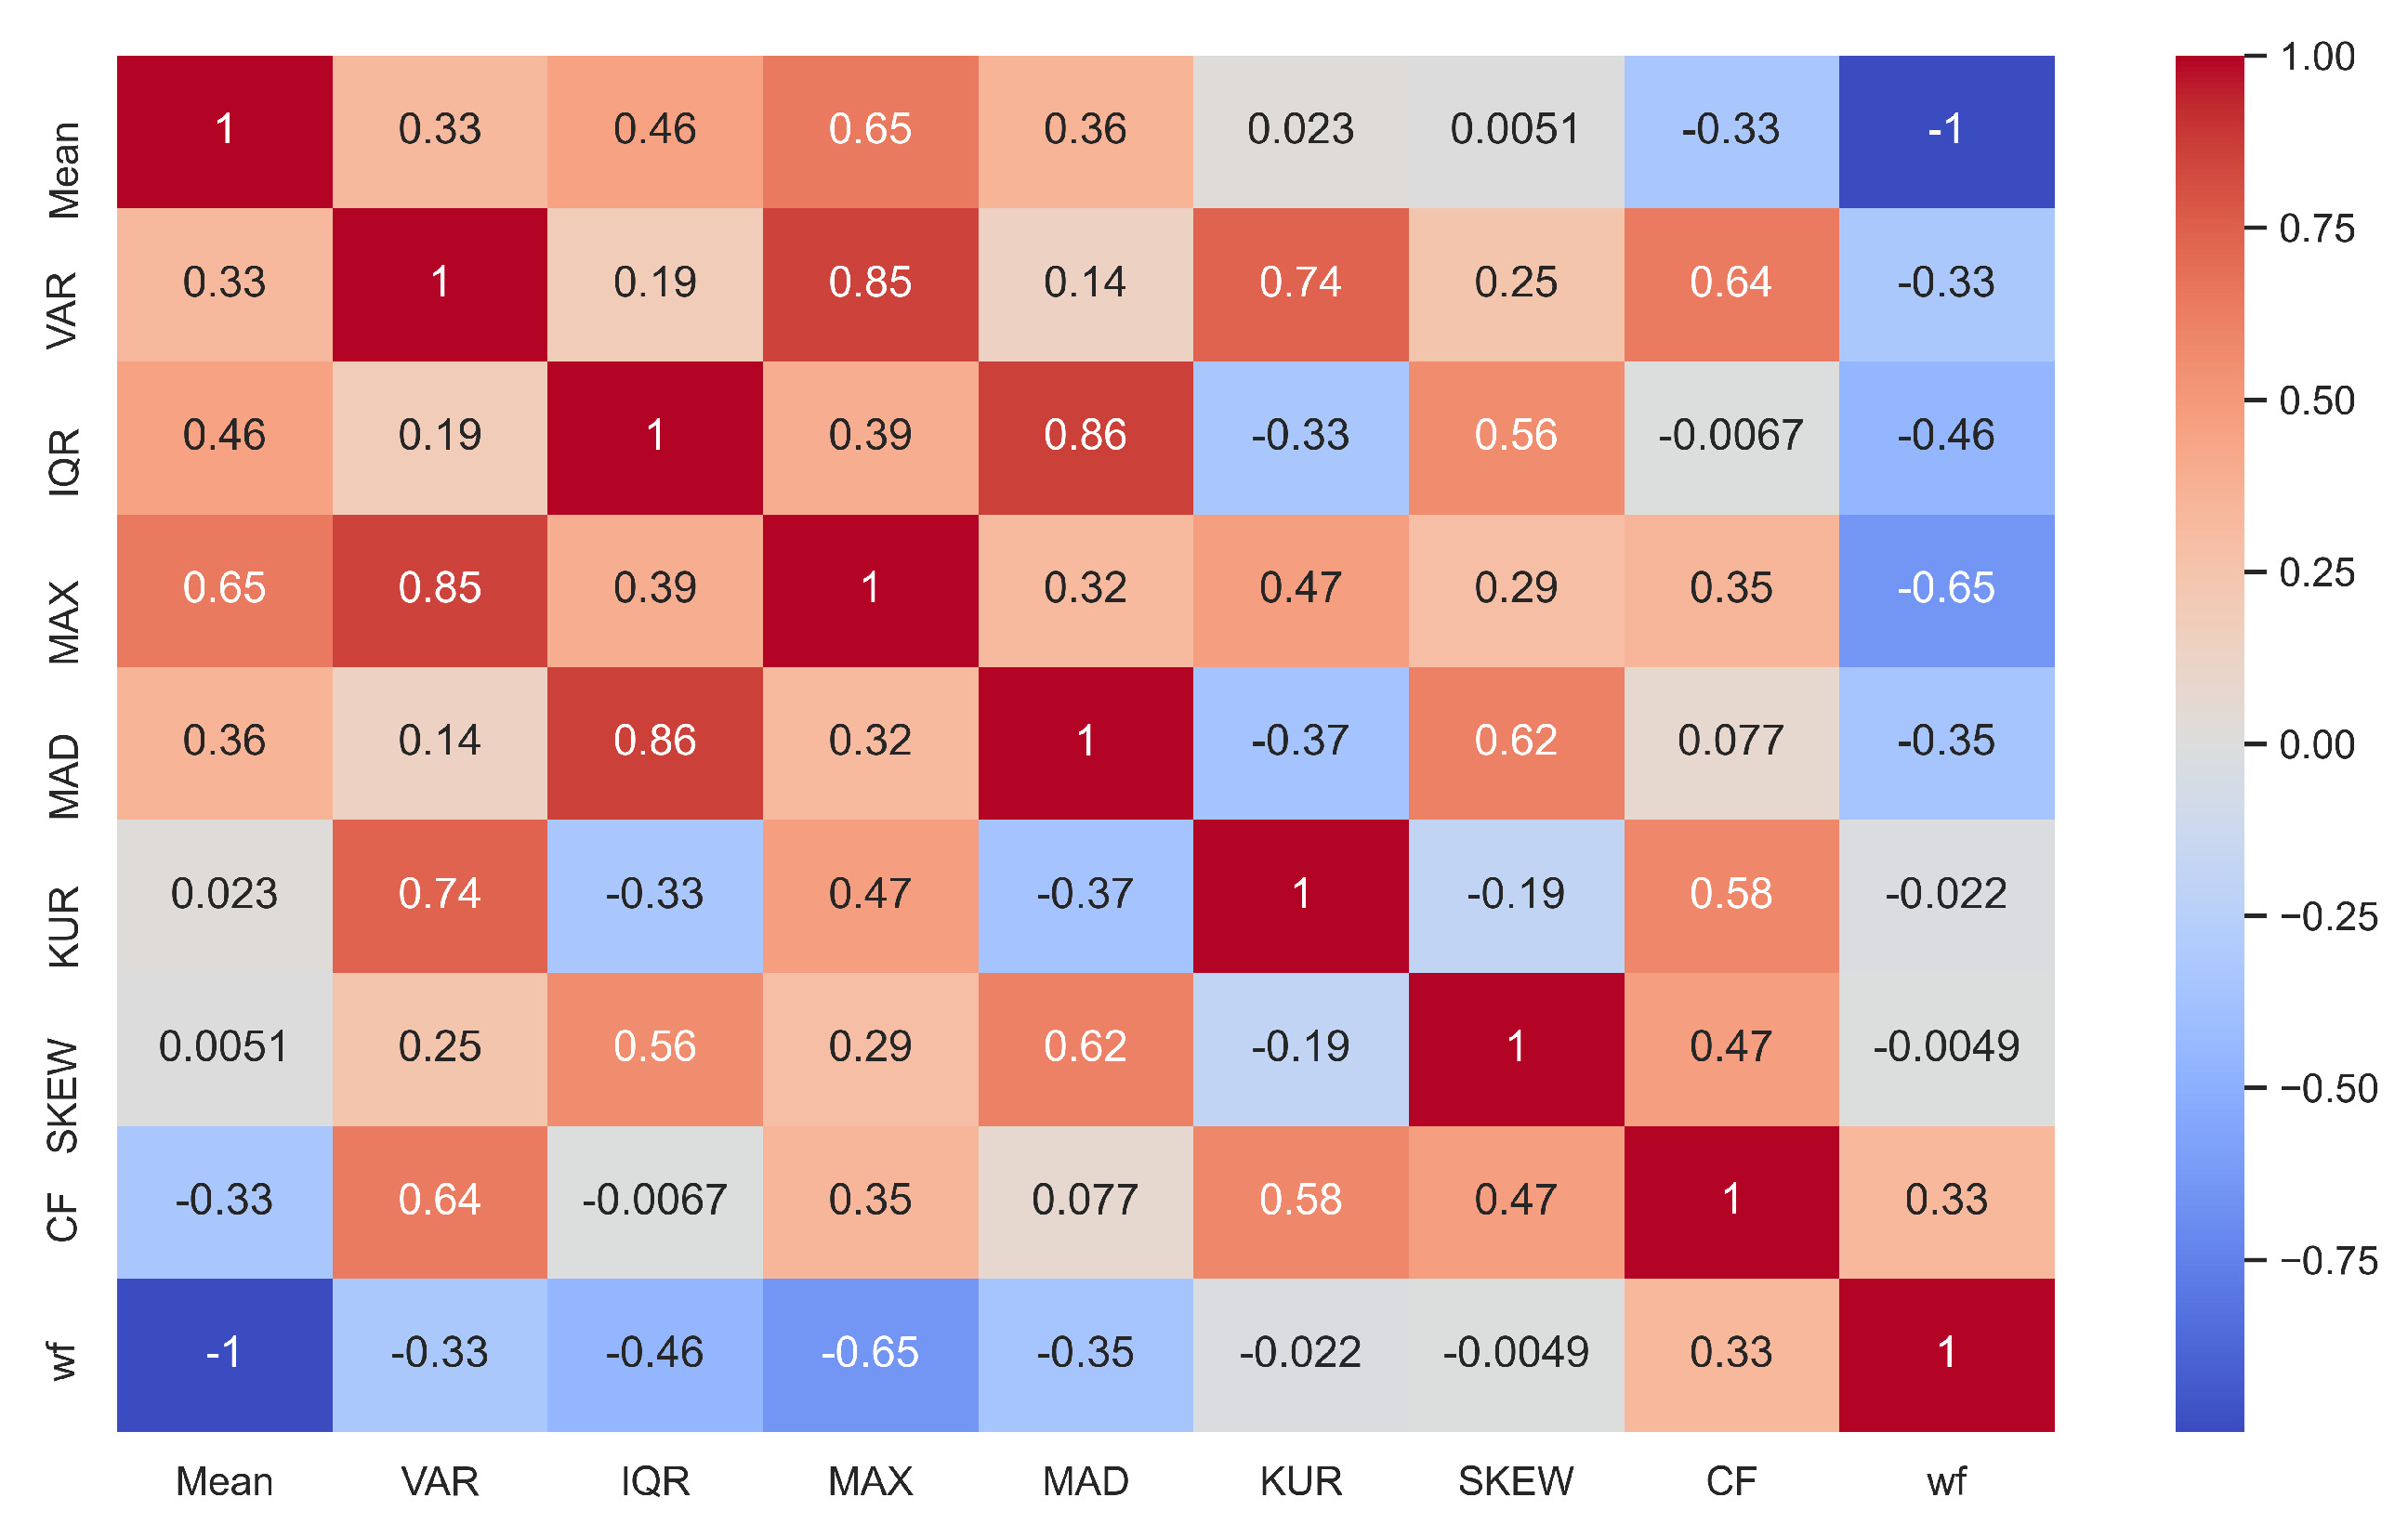
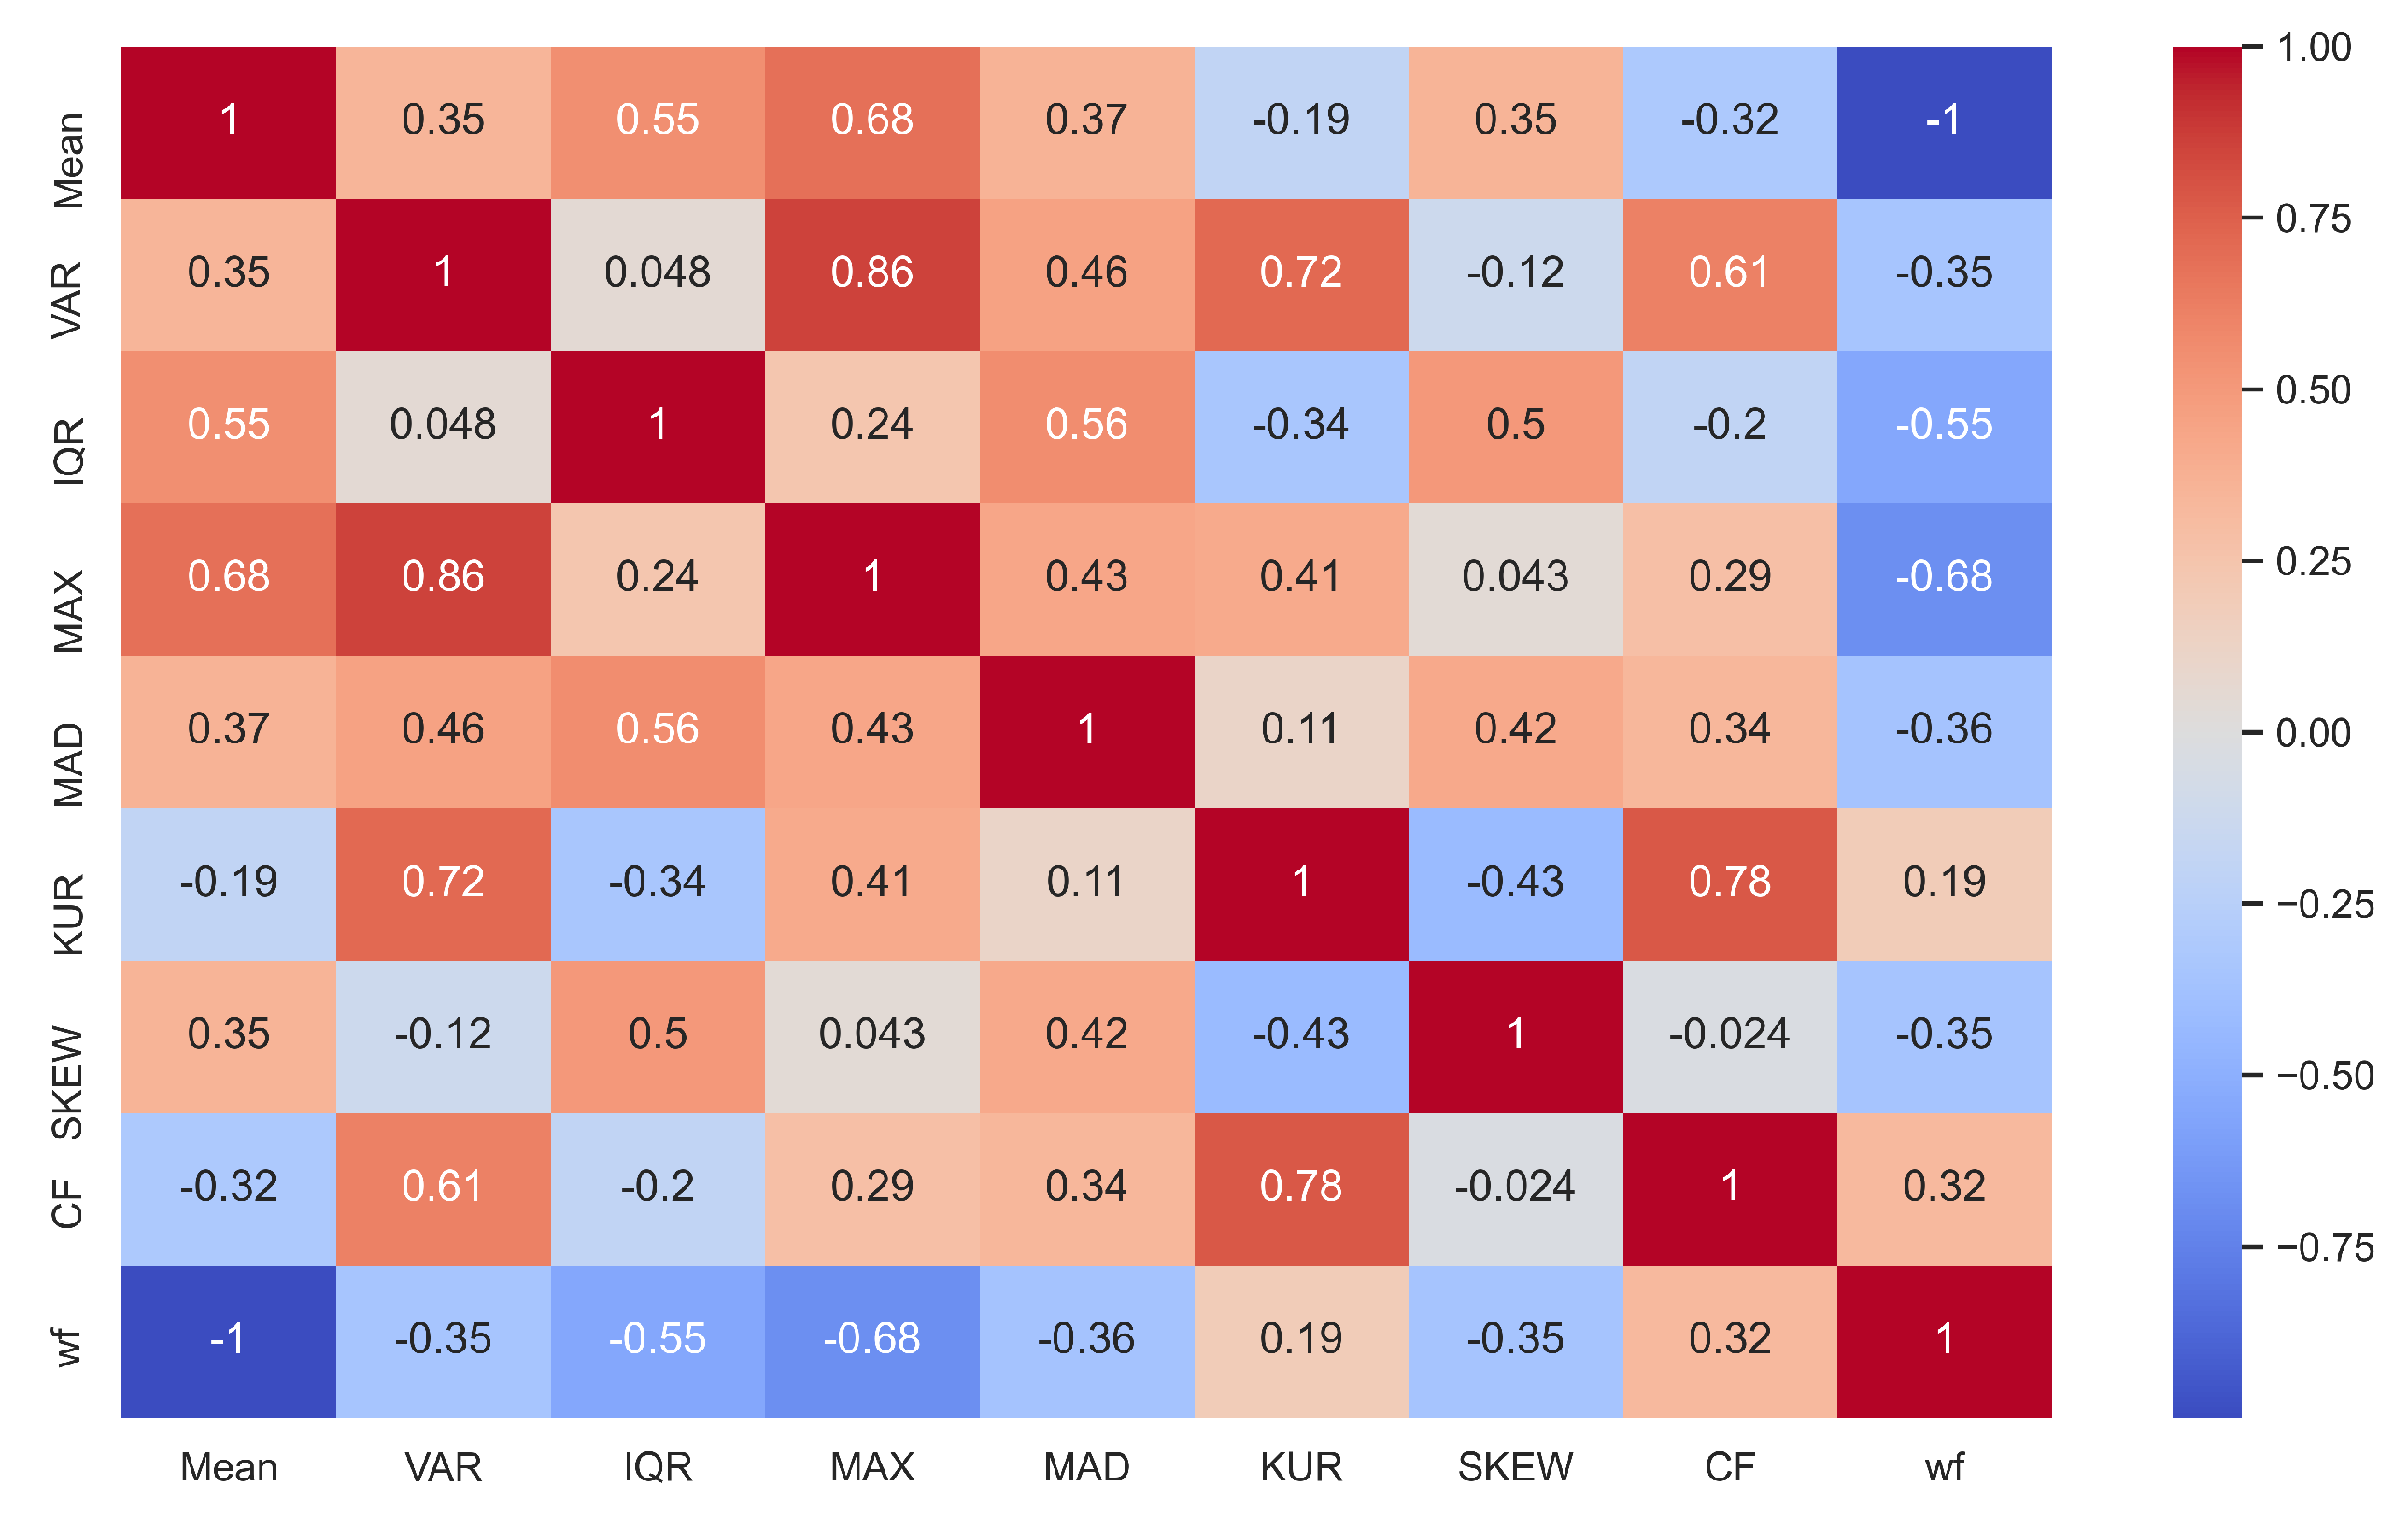
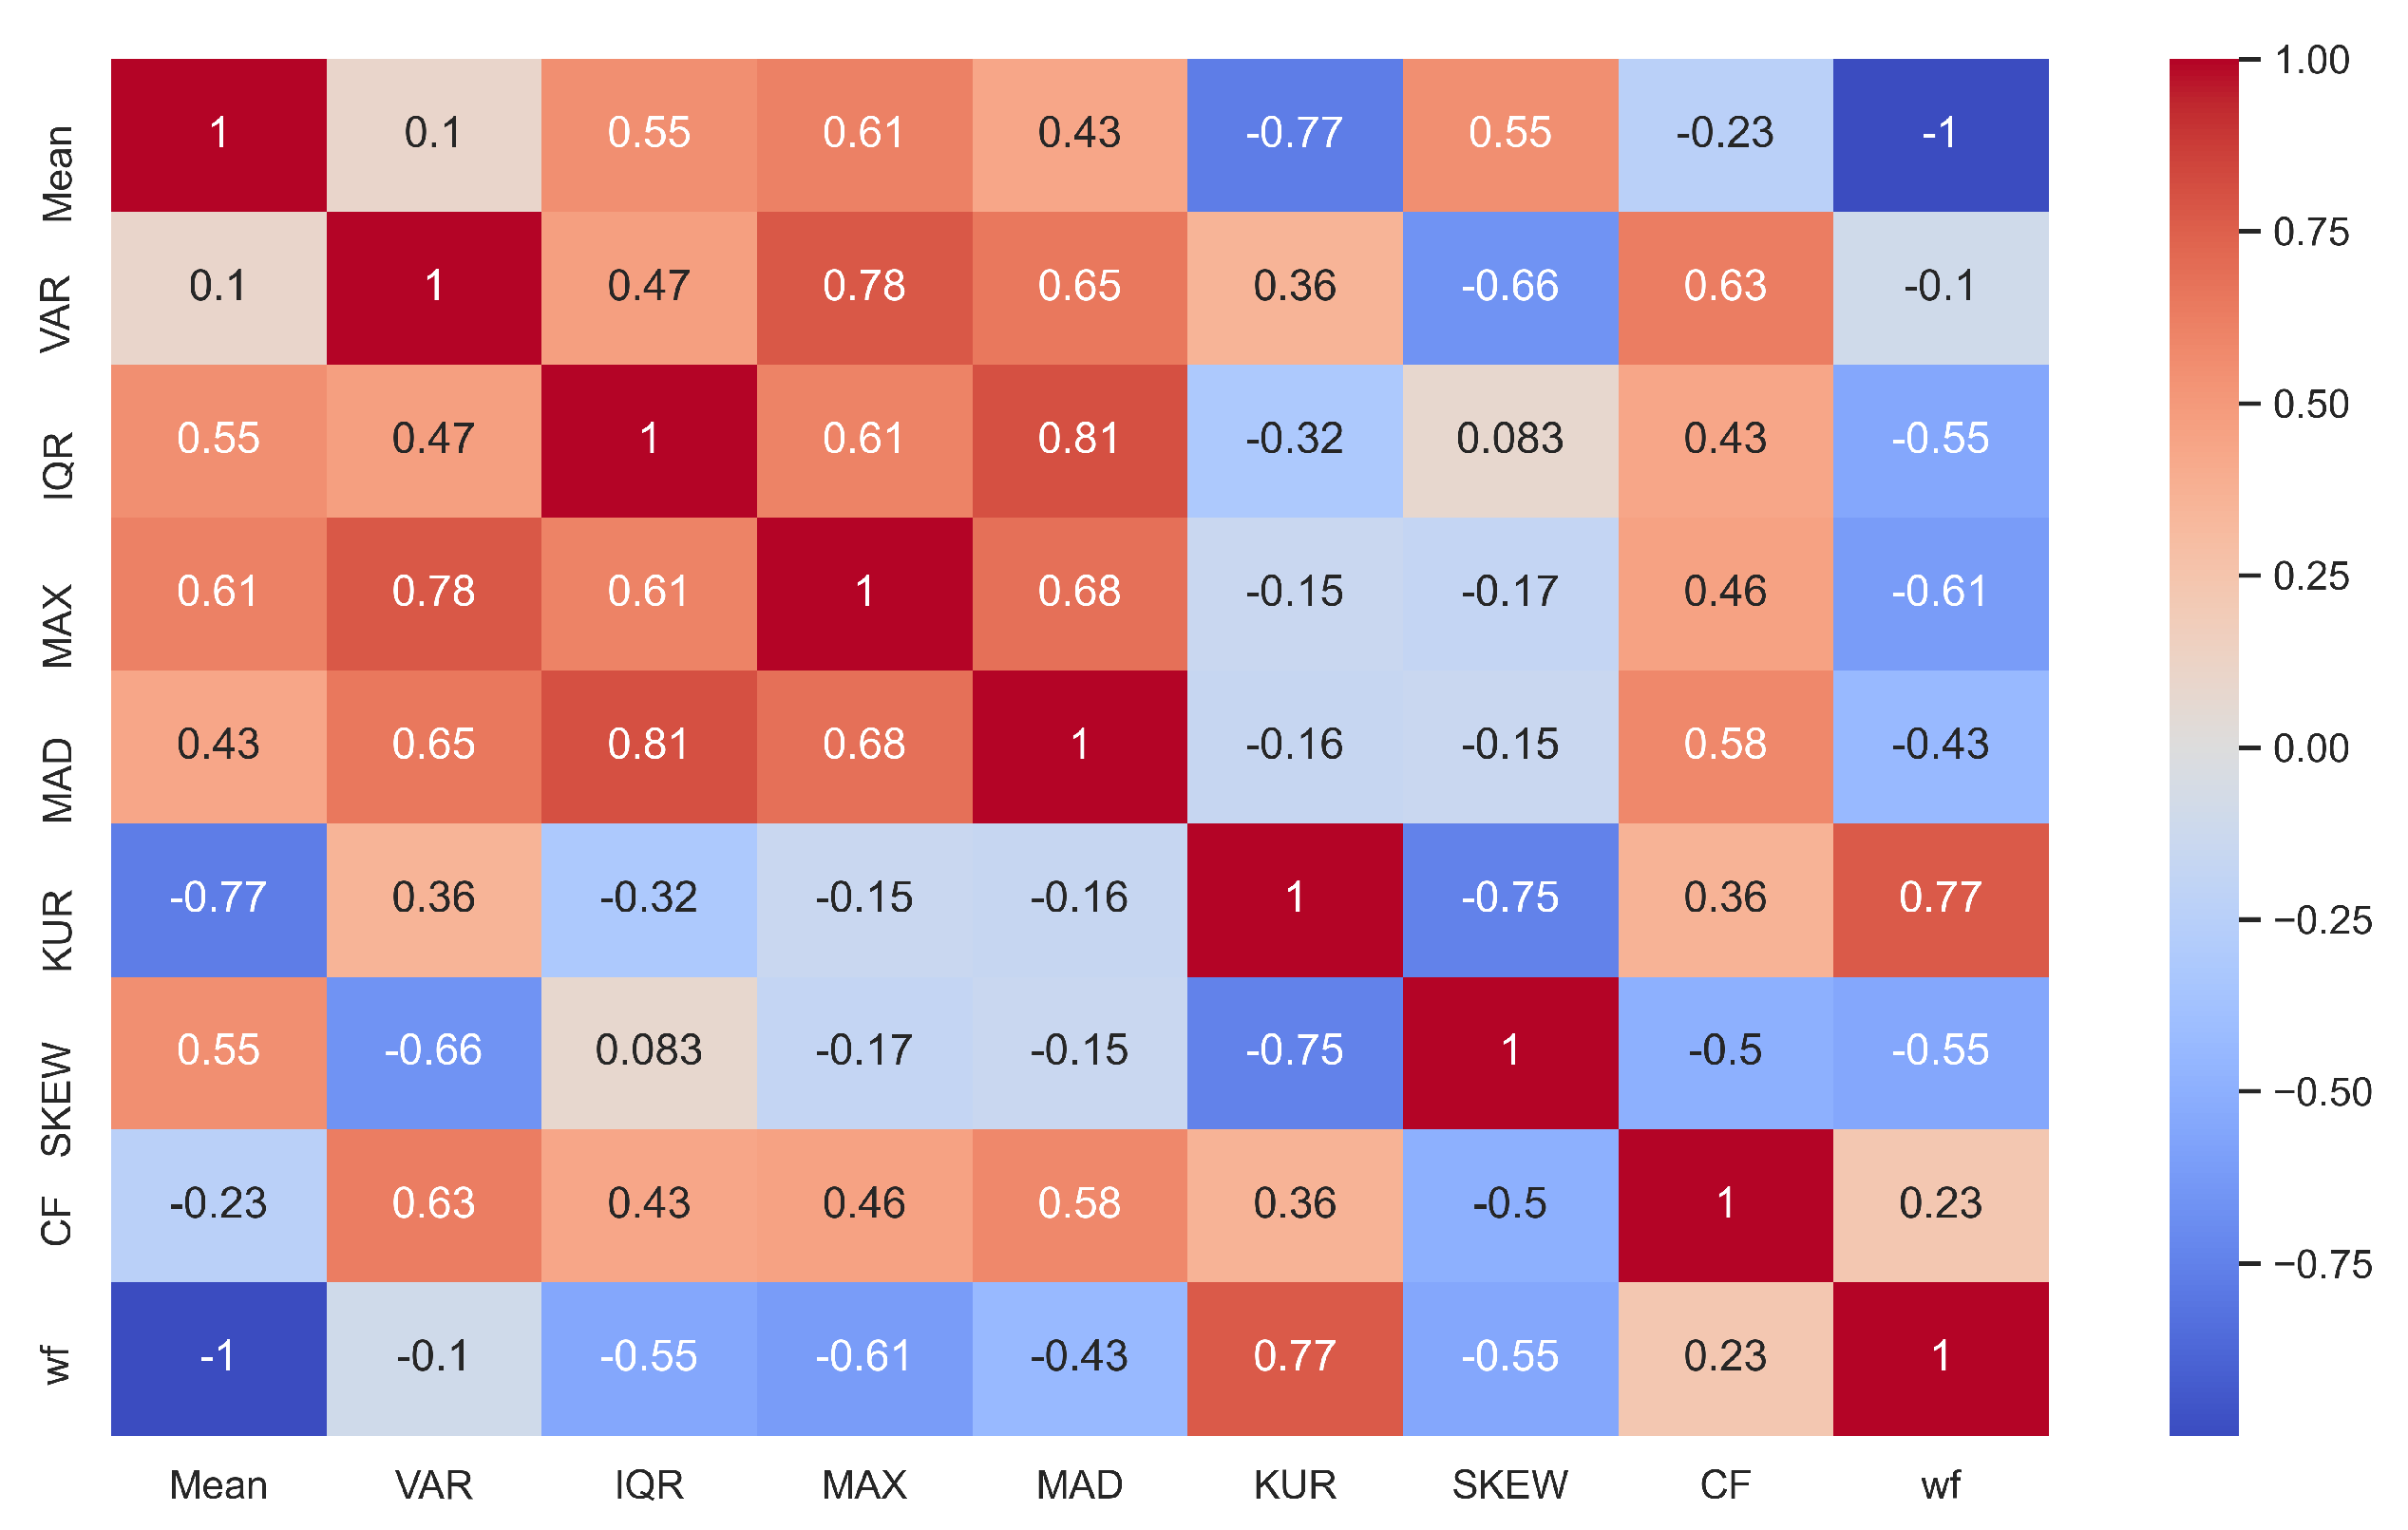
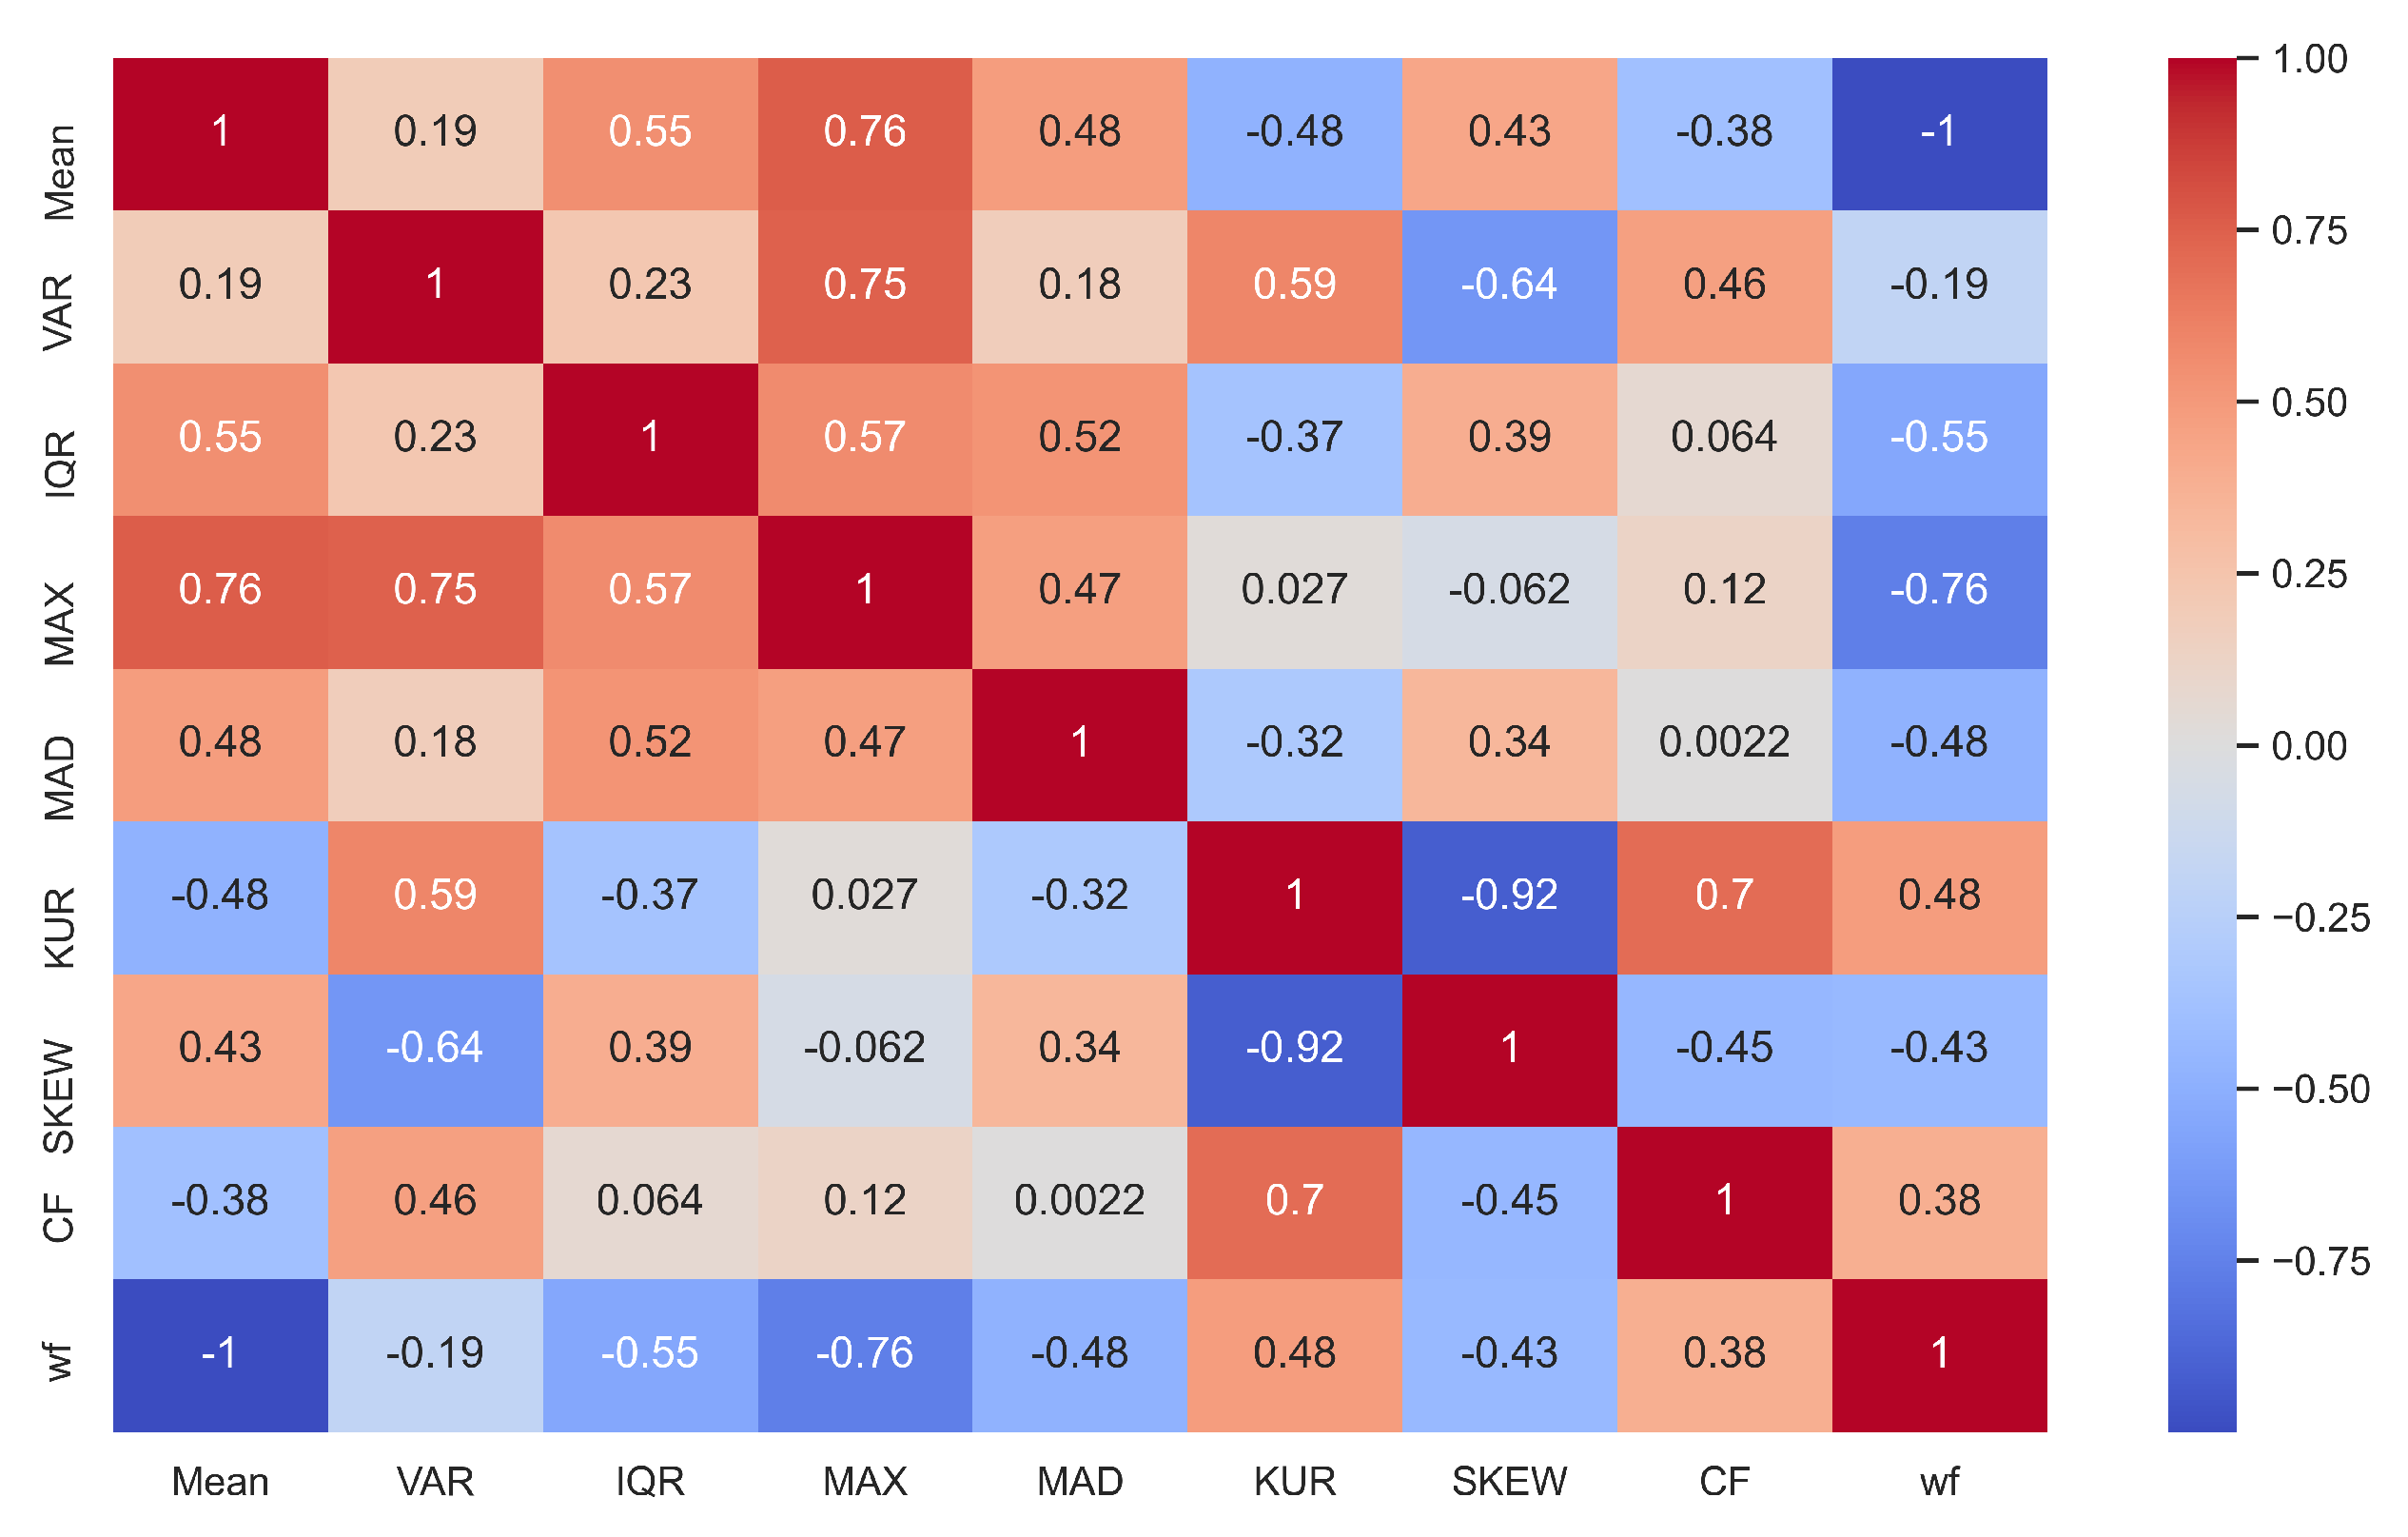
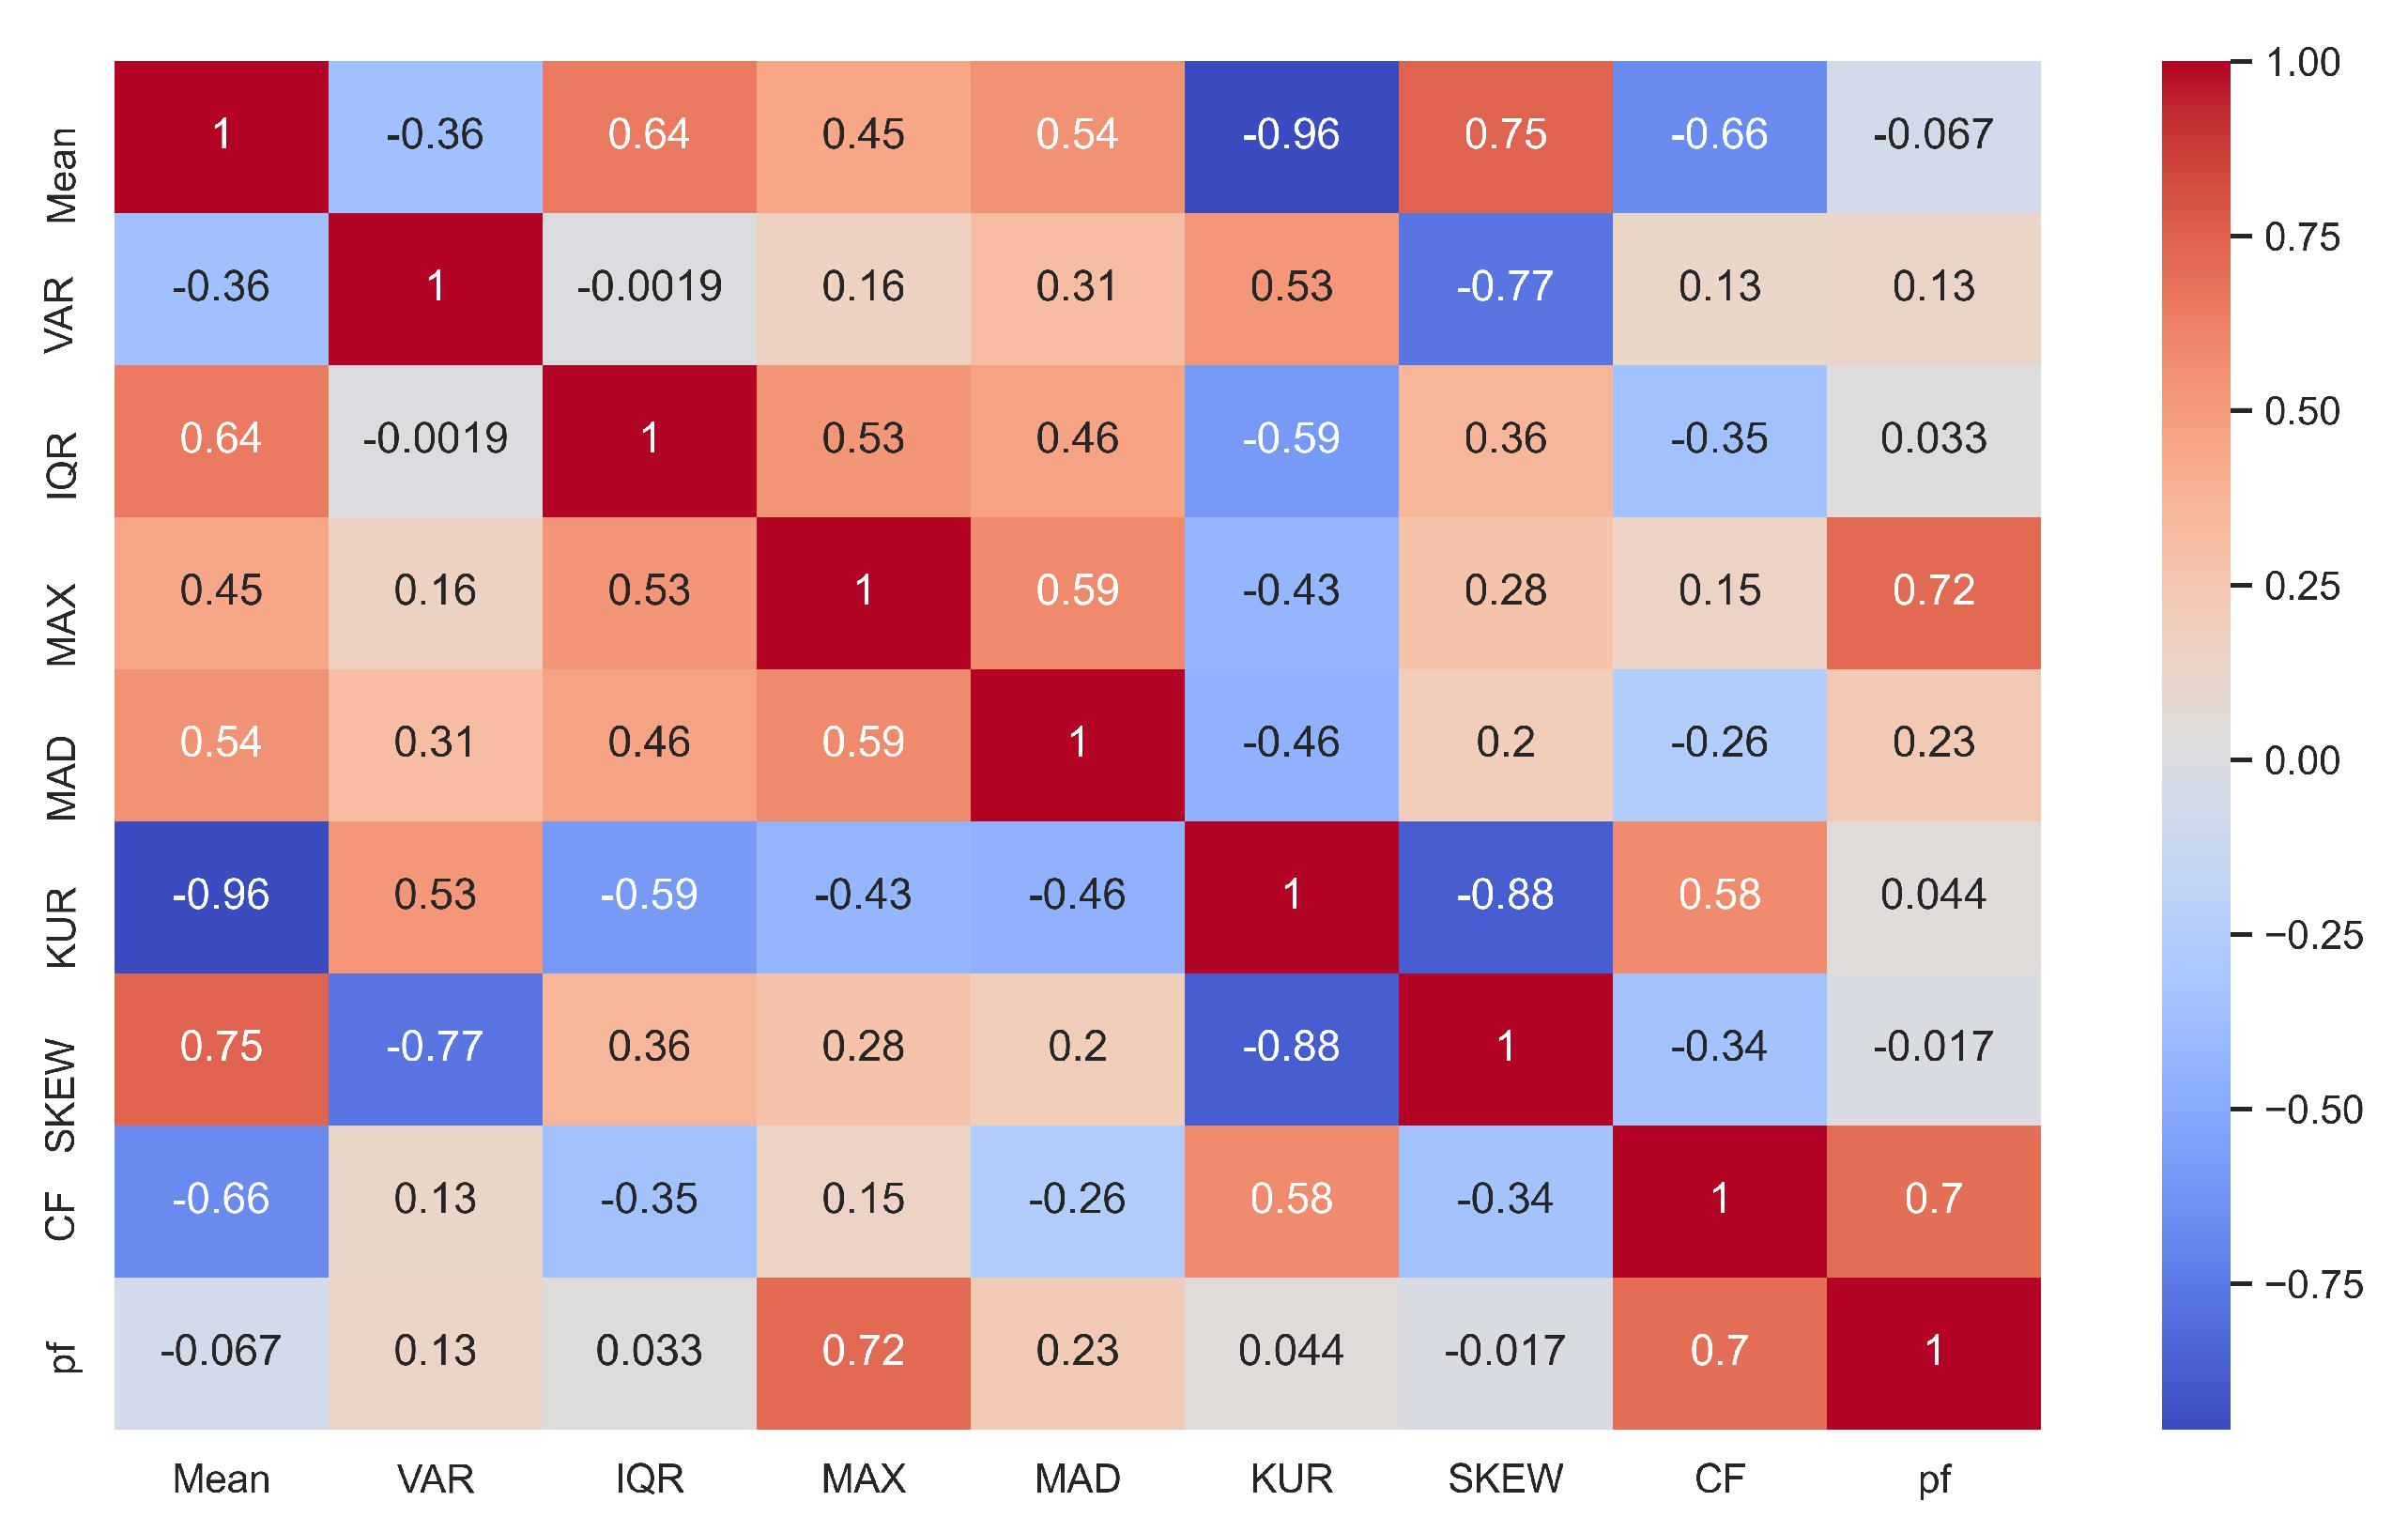
- The collected dataset is subjected to in-depth analysis to identify correlations, patterns, and trends among the various parameters. This analysis helps uncover the key factors influencing the reliability of the aluminum electrolytic capacitor.
- Leveraging the statistical-based approach and the ANN algorithm, a predictive model is developed to assess the reliability of the capacitor. The model takes into account the interrelationships among the collected parameters, enabling accurate reliability predictions.
- The research paper’s contributions lead to an enhanced method for assessing the reliability of aluminum electrolytic capacitors used in SMPSs. The combination of comprehensive dataset collection, statistical analysis, and machine learning algorithms results in more accurate and reliable predictions.
2. Literature and Related Works
3. Theoretical Backgrounds
3.1. Pearson Correlation Coefficient
- It is symmetric;
- It is bounded between −1 and +1: the correlation coefficient cannot exceed these bounds;
- It is sensitive to linear relationships: although it may not account for nonlinear correlations, it quantifies the magnitude of the linear association between the two variables.
3.2. Artificial Neural Networks
- y is the output of the neuron;
- is the activation function that introduces non-linearity;
- are the weights associated with the inputs;
- and b is the bias term.
- Input layer: The input data are acquired and transmitted to the subsequent layers. Each input node represents a characteristic or attribute of the input information.
- Hidden layers: These intermediate neurons lie between the input and output layers. They execute calculations and modify the input across the network. The quantity of concealed neurons in the capacitor classifier algorithm and the number of neurons in each covert layer represent design decisions subject to variation based on the specific problem at hand.
- Output layer: This layer generates the outcome of the network, which may encompass classification, regression, or any other preferred prognosis or result.
4. Data Acquisition Process
5. Proposed Artificial Neural Networks Model
Statistical Feature Engineering
6. Results Analysis and Discussion
7. Conclusions
Author Contributions
Funding
Data Availability Statement
Conflicts of Interest
References
- Kareem, A.B.; Hur, J.-W. A Feature Engineering-Assisted CM Technology for SMPS Output Aluminium Electrolytic Capacitors (AECs) Considering D-ESR-Q-Z Parameters. Processes 2022, 10, 1091. [Google Scholar] [CrossRef]
- Jami, T.; Charles, J.; Ali, S. Electrolytic capacitor: Properties and operation. J. Energy Storage 2023, 58, 106330. [Google Scholar] [CrossRef]
- Shahraki, A.F.; Al-Dahidi, S.; Taleqani, A.R.; Yadav, O.P. Using LSTM neural network to predict the remaining useful life of electrolytic capacitors in dynamic operating conditions. J. Risk Reliab. 2023, 237, 16–28. [Google Scholar] [CrossRef]
- Duan, C.; Chen, P. Adaptive Maintenance Scheme for Degrading Devices With Dynamic Conditions and Random Failures. IEEE Trans. Ind. Inform. 2023, 19, 2508–2519. [Google Scholar] [CrossRef]
- Wei, Y.; Hossain, M.; Mantooth, H.A. Evaluation and Modeling of SiC Based Power Converter for Low-Temperature Operation. IEEE Trans. Ind. Appl. 2023, 59, 3660–3673. [Google Scholar] [CrossRef]
- Zeng, X.; Bian, J.; Liang, L.; Cao, Q.; Liu, L.; Chen, X.; Wang, Y.; Xie, X.; Xie, G. Preparation and characterization of an anode foil for aluminium electrolytic capacitors by powder additive manufacturing. Powder Technol. 2023, 426, 118602. [Google Scholar] [CrossRef]
- Tan, S.; Yang, H.; Zhang, Z.; Xu, X.; Xu, Y.; Zhou, J.; Zhou, X.; Pan, Z.; Rao, X.; Gu, Y.; et al. The Progress of Hard Carbon as an Anode Material in Sodium-Ion Batteries. Molecules 2023, 28, 3134. [Google Scholar] [CrossRef]
- Wang, Y.; Wu, T.; Che, L.; Huang, G. Microstructure and Recrystallization Behavior of Heating Rate-Controlled Electrolytic Capacitor Aluminum Foil under Cold Forming and Annealing. Materials 2023, 16, 4128. [Google Scholar] [CrossRef]
- Banerjee, R.; John, D.; Zhang, C.; Agarwal, A.; Raj, P. Cold-sprayed aluminium capacitors on lead frames for 3D power packaging. In Proceedings of the 2023 Fourth International Symposium on 3D Power Electronics Integration and Manufacturing (3D-PEIM), Miami, FL, USA, 1–3 February 2023; pp. 1–4. [Google Scholar] [CrossRef]
- Both, J. The modern era of aluminium electrolytic capacitors. IEEE Electr. Insul. Mag. 2015, 31, 24–34. [Google Scholar] [CrossRef]
- Yao, B.; Zhao, S.; Zhang, Y.; Wang, H. A Health Indicator of Aluminum Electrolytic Capacitors Based on Strain Sensing. IEEE Trans. Power Electron. 2023, 38, 7982–7987. [Google Scholar] [CrossRef]
- Suskis, P.; Zakis, J.; Suzdalenko, A.; Van Khang, H.; Pomarnacki, R. A Study on Electrolytic Capacitor Aging in Power Converters and Parameter Change Over the Lifespan. In Proceedings of the 2023 IEEE 10th Jubilee Workshop on Advances in Information, Electronic and Electrical Engineering (AIEEE), Vilnius, Lithuania, 27–29 April 2023; pp. 1–5. [Google Scholar] [CrossRef]
- Cousseau, R.; Patin, N.; Monmasson, E.; Idkhajine, L. A methodology for studying aluminium electrolytic capacitors wear-out in automotive cases. In Proceedings of the 2013 15th European Conference on Power Electronics and Applications (EPE), Lille, France, 2–6 September 2013; pp. 1–10. [Google Scholar] [CrossRef]
- Bhargava, C.; Banga, V.K.; Singh, Y. Condition monitoring of aluminium electrolytic capacitors using accelerated life testing: A comparison. Int. J. Qual. Reliab. Manag. 2018, 35, 1671–1682. [Google Scholar] [CrossRef]
- Amaral, A.M.R.; Cardoso, A.J.M. Using Newton-Raphson Method to Estimate the Condition of Aluminum Electrolytic Capacitors. In Proceedings of the 2007 IEEE International Symposium on Industrial Electronics, Vigo, Spain, 4–7 June 2007; pp. 827–832. [Google Scholar] [CrossRef]
- Jedtberg, H.; Buticchi, G.; Liserre, M.; Wang, H. A method for hotspot temperature estimation of aluminium electrolytic capacitors. In Proceedings of the 2017 IEEE Energy Conversion Congress and Exposition (ECCE), Cincinnati, OH, USA, 1–5 October 2017; pp. 3235–3241. [Google Scholar] [CrossRef]
- Kareem, A.B.; Hur, J.-W. Towards Data-Driven Fault Diagnostics Framework for SMPS-AEC Using Supervised Learning Algorithms. Electronics 2022, 11, 2492. [Google Scholar] [CrossRef]
- Bărbulescu, C.; Căiman, D.-V.; Dragomir, T.-L. Parameter Observer Useable for the Condition Monitoring of a Capacitor. Appl. Sci. 2022, 12, 4891. [Google Scholar] [CrossRef]
- Zhou, Y.; Liao, R.; Chen, Y. Study on Optimization of Data-Driven Anomaly Detection. In Proceedings of the 2022 International Conference on Data Science and Its Applications (ICoDSA), Bandung, Indonesia, 6–7 July 2022; pp. 123–127. [Google Scholar] [CrossRef]
- Okwuosa, C.N.; Hur, J.-W. A Filter-Based Feature-Engineering-Assisted SVC Fault Classification for SCIM at Minor-Load Conditions. Energies 2022, 15, 7597. [Google Scholar] [CrossRef]
- Kareem, A.B.; Ejike Akpudo, U.; Hur, J.-W. An Integrated Cost-Aware Dual Monitoring Framework for SMPS Switching Device Diagnosis. Electronics 2021, 10, 2487. [Google Scholar] [CrossRef]
- Laadjal, K.; Bento, F.; Cardoso, A.J.M. On-Line Diagnostics of Electrolytic Capacitors in Fault-Tolerant LED Lighting Systems. Electronics 2022, 11, 1444. [Google Scholar] [CrossRef]
- Amaral, A.M.R.; Laadjal, K.; Cardoso, A.J.M. Advanced Fault-Detection Technique for DC-Link Aluminum Electrolytic Capacitors Based on a Random Forest Classifier. Electronics 2023, 12, 2572. [Google Scholar] [CrossRef]
- Zhou, X.; Han, X.; Wang, Y.; Lu, L.; Ouyang, M. A Data-Driven LiFePO4 Battery Capacity Estimation Method Based on Cloud Charging Data from Electric Vehicles. Batteries 2023, 9, 181. [Google Scholar] [CrossRef]
- Iqbal, T.; Elahi, A.; Wijns, W.; Amin, B.; Shahzad, A. Improved Stress Classification Using Automatic Feature Selection from Heart Rate and Respiratory Rate Time Signals. Appl. Sci. 2023, 13, 2950. [Google Scholar] [CrossRef]
- Cen, S.; Yoo, J.H.; Lim, C.G. Electricity Pattern Analysis by Clustering Domestic Load Profiles Using Discrete Wavelet Transform. Energies 2022, 15, 1350. [Google Scholar] [CrossRef]
- Viswa Teja, A.; Razia Sultana, W.; Salkuti, S.R. Performance Explorations of a PMS Motor Drive Using an ANN-Based MPPT Controller for Solar-Battery Powered Electric Vehicles. Designs 2023, 7, 79. [Google Scholar] [CrossRef]
- Oyedeji, M.O.; Alharbi, A.; Aldhaifallah, M.; Rezk, H. Optimal Data-Driven Modelling of a Microbial Fuel Cell. Energies 2023, 16, 4740. [Google Scholar] [CrossRef]
- Kim, T.-G.; Lee, H.; An, C.-G.; Yi, J.; Won, C.-Y. Hybrid AC/DC Microgrid Energy Management Strategy Based on Two-Step ANN. Energies 2023, 16, 1787. [Google Scholar] [CrossRef]
- Jlidi, M.; Hamidi, F.; Barambones, O.; Abbassi, R.; Jerbi, H.; Aoun, M.; Karami-Mollaee, A. An Artificial Neural Network for Solar Energy Prediction and Control Using Jaya-SMC. Electronics 2023, 12, 592. [Google Scholar] [CrossRef]
- Jasim, A.M.; Jasim, B.H.; Neagu, B.-C.; Alhasnawi, B.N. Coordination Control of a Hybrid AC/DC Smart Microgrid with Online Fault Detection, Diagnostics, and Localization Using Artificial Neural Networks. Electronics 2023, 12, 187. [Google Scholar] [CrossRef]
- Sankar, R.S.R.; Deepika, K.K.; Alsharef, M.; Alamri, B. A Smart ANN-Based Converter for Efficient Bidirectional Power Flow in Hybrid Electric Vehicles. Electronics 2022, 11, 3564. [Google Scholar] [CrossRef]
- Metsämuuronen, J. Artificial systematic attenuation in eta squared and some related consequences: Attenuation-corrected eta and eta squared, negative values of eta, and their relation to Pearson correlation. Behaviormetrika 2023, 50, 27–61. [Google Scholar] [CrossRef]
- Denuit, M.; Trufin, J. Model selection with Pearson’s correlation, concentration and Lorenz curves under autocalibration. Eur. Actuar. J. 2023, 13, 1–8. [Google Scholar] [CrossRef]
- Yücelbaş, C.; Yücelbaş, Ş. Examining the Success of Information Gain, Pearson Correlation, and Symmetric Uncertainty Ranking Methods on 3D Hand Posture Data for Metaverse Systems. Sak. Univ. J. Sci. 2023, 27, 271–284. [Google Scholar] [CrossRef]
- Wan, Z. Analysis and Prediction of Wordle Dataset Based on ARIMA and Pearson’s Correlation Coefficient. Front. Comput. Intell. Syst. 2023, 3, 39–43. [Google Scholar] [CrossRef]
- Cunha, F.; Ribeiro, T.; Lopes, G.; Ribeiro, A.F. Large-Scale Tactile Detection System Based on Supervised Learning for Service Robots Human Interaction. Sensors 2023, 23, 825. [Google Scholar] [CrossRef] [PubMed]
- Fuadah, Y.N.; Pramudito, M.A.; Lim, K.M. An Optimal Approach for Heart Sound Classification Using Grid Search in Hyperparameter Optimization of Machine Learning. Bioengineering 2023, 10, 45. [Google Scholar] [CrossRef] [PubMed]
- Soomro, A.A.; Mokhtar, A.A.; Salilew, W.M.; Abdul Karim, Z.A.; Abbasi, A.; Lashari, N.; Jameel, S.M. Machine Learning Approach to Predict the Performance of a Stratified Thermal Energy Storage Tank at a District Cooling Plant Using Sensor Data. Sensors 2022, 22, 7687. [Google Scholar] [CrossRef] [PubMed]
- Amin, M.N.; Ahmad, A.; Khan, K.; Ahmad, W.; Nazar, S.; Faraz, M.I.; Alabdullah, A.A. Split Tensile Strength Prediction of Recycled Aggregate-Based Sustainable Concrete Using Artificial Intelligence Methods. Materials 2022, 15, 4296. [Google Scholar] [CrossRef] [PubMed]


| Functions | Description |
|---|---|
| Electrical Parameters | Cp–Z–D–Rs |
| Signal Level | 0.5 Vrms |
| Total Frequency/Step | 8 MHz/100 Hz |
| DC Bias | ON 1.0 volts |
| LowZ mode | ON |
| Measurement Range | Auto |
| Speed | SLOW2 |
| Parameters | Definition | Functions |
|---|---|---|
| Capacitance | ||
| Z | Impedance | |
| D | Loss coefficient/Dissipation Factor | |
| Equivalent Series Resistance |
| Parameters | Values |
|---|---|
| Hidden Layer Size | 25 |
| Max-iter | 50 |
| Activation | ReLU |
| Solver | Adam |
| Random state | 1 |
| Early stopping | True |
| Validation fraction | 0.2 |
| Learning rate | 0.001 |
| Feature Description | Definitions |
|---|---|
| Root Mean Square | |
| Mean | |
| Kurtosis | |
| Interquartile range | |
| Median abs deviation | |
| Skewness | |
| Max | |
| Min | |
| Crest Factor | |
| Peak factor | |
| Wave Factor | |
| Standard error mean | |
| Standard deviation | |
| Variance |
| Fault Classification | Electrical Parameters | Accuracy (%) | Precision (%) | Recall (%) | F1-Score (%) | Cost (s) |
|---|---|---|---|---|---|---|
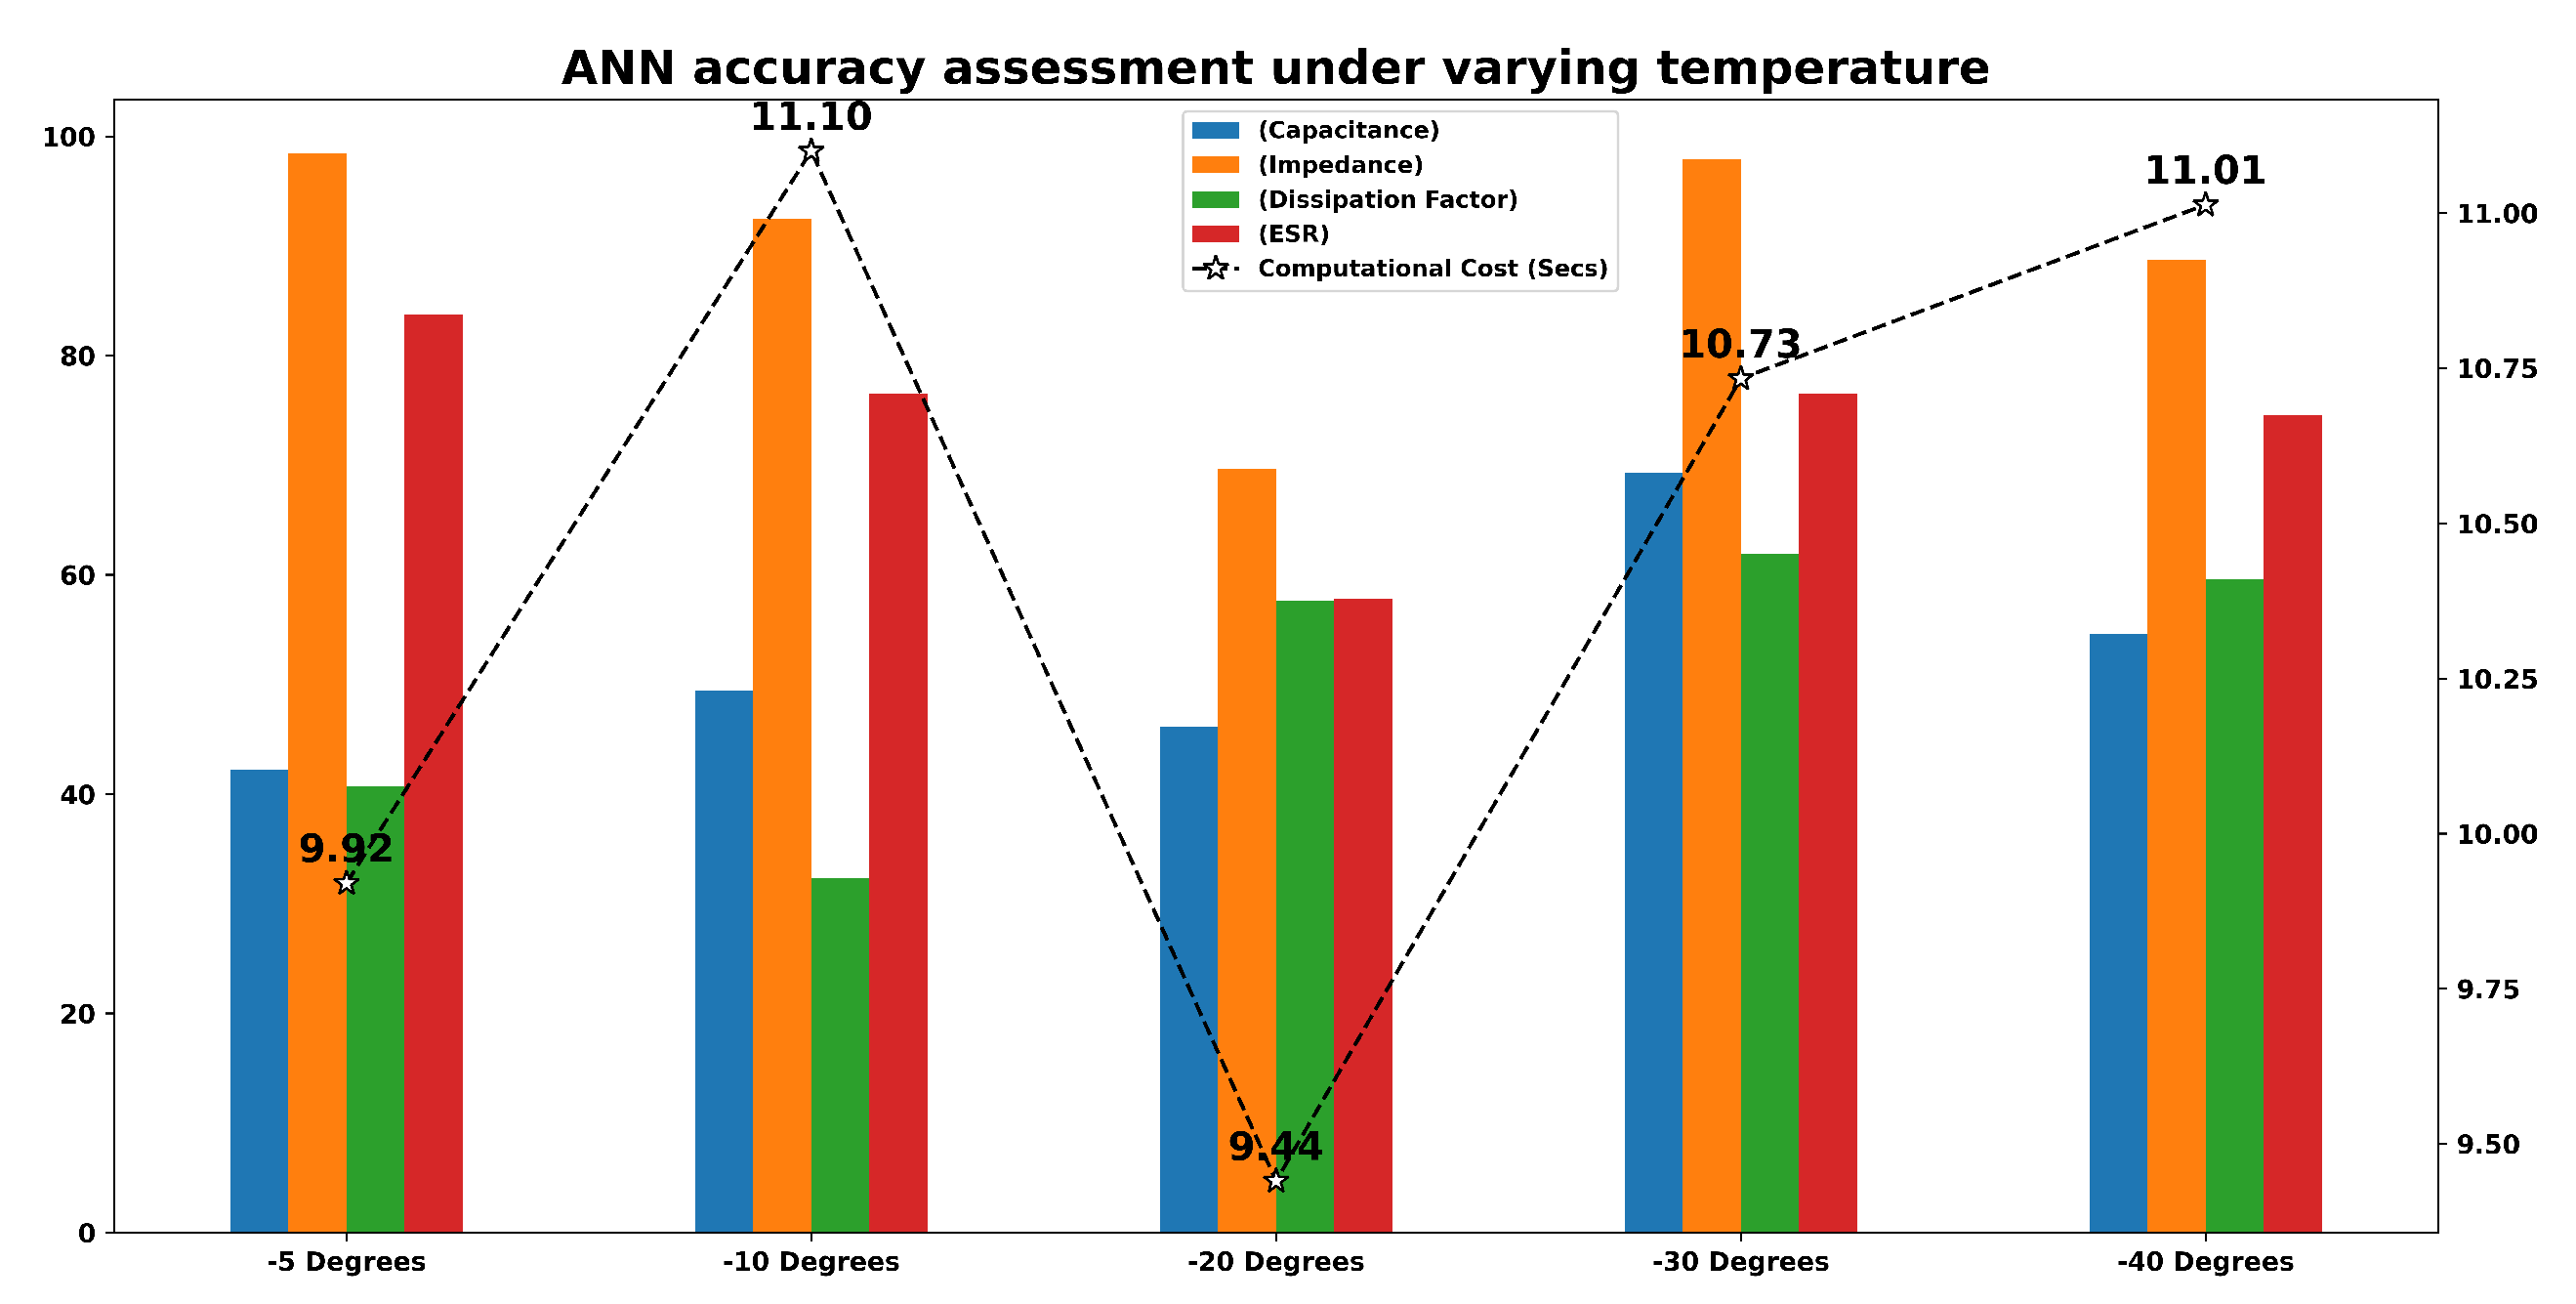
| Capacitance | 42.22 | 49.93 | 42.22 | 38.55 | 6.0333 | |
| −5 °C | Impedance | 98.44 | 100.00 | 100.00 | 100.00 | 9.9200 |
| DF | 40.69 | 40.00 | 40.69 | 38.18 | 5.3000 | |
| ESR | 83.74 | 84.74 | 83.75 | 83.42 | 9.4333 | |
| Capacitance | 49.44 | 56.03 | 49.44 | 49.28 | 8.3800 | |
| −10 °C | Impedance | 92.50 | 93.52 | 92.50 | 92.40 | 11.1000 |
| DF | 32.36 | 10.47 | 32.36 | 15.83 | 2.4733 | |
| ESR | 76.52 | 78.65 | 76.53 | 76.51 | 5.4400 | |
| Capacitance | 46.11 | 43.39 | 46.11 | 43.70 | 8.0933 | |
| −20 °C | Impedance | 69.72 | 73.65 | 69.72 | 67.94 | 9.4400 |
| DF | 57.64 | 64.35 | 57.64 | 58.16 | 9.3867 | |
| ESR | 57.78 | 58.09 | 57.78 | 56.94 | 7.3867 | |
| Capacitance | 69.30 | 69.48 | 69.31 | 68.57 | 7.5267 | |
| −30 °C | Impedance | 97.91 | 98.07 | 97.92 | 97.91 | 10.7333 |
| DF | 61.94 | 63.50 | 61.94 | 61.83 | 9.6067 | |
| ESR | 76.52 | 77.34 | 76.53 | 76.17 | 8.4800 | |
| Capacitance | 54.58 | 58.07 | 54.58 | 48.06 | 7.0200 | |
| −40 °C | Impedance | 88.75 | 90.96 | 88.75 | 88.84 | 11.0133 |
| DF | 59.58 | 62.04 | 59.58 | 59.73 | 6.4000 | |
| ESR | 74.58 | 75.49 | 74.58 | 73.89 | 9.6000 |
Disclaimer/Publisher’s Note: The statements, opinions and data contained in all publications are solely those of the individual author(s) and contributor(s) and not of MDPI and/or the editor(s). MDPI and/or the editor(s) disclaim responsibility for any injury to people or property resulting from any ideas, methods, instructions or products referred to in the content. |
© 2023 by the authors. Licensee MDPI, Basel, Switzerland. This article is an open access article distributed under the terms and conditions of the Creative Commons Attribution (CC BY) license (https://creativecommons.org/licenses/by/4.0/).
Share and Cite
Jeong, S.; Kareem, A.B.; Song, S.; Hur, J.-W. ANN-Based Reliability Enhancement of SMPS Aluminum Electrolytic Capacitors in Cold Environments. Energies 2023, 16, 6096. https://doi.org/10.3390/en16166096
Jeong S, Kareem AB, Song S, Hur J-W. ANN-Based Reliability Enhancement of SMPS Aluminum Electrolytic Capacitors in Cold Environments. Energies. 2023; 16(16):6096. https://doi.org/10.3390/en16166096
Chicago/Turabian StyleJeong, Sunwoo, Akeem Bayo Kareem, Sungwook Song, and Jang-Wook Hur. 2023. "ANN-Based Reliability Enhancement of SMPS Aluminum Electrolytic Capacitors in Cold Environments" Energies 16, no. 16: 6096. https://doi.org/10.3390/en16166096