Review

A Comprehensive Review on Condition Monitoring and Fault Diagnosis in Fuel Cell Systems: Challenges and Issues

by
Pedro Andrade
1,*,
Khaled Laadjal
1,*,
Adérito Neto Alcaso
1,2 and
Antonio J. Marques Cardoso
1
1
CISE-Electromechatronic Systems Research Centre, University of Beira Interior, Calçada Fonte do Lameiro, P-6201-001 Covilhã, Portugal
2
Polytechnic of Guarda, School of Technology and Management, P-6300-559 Guarda, Portugal
*
Authors to whom correspondence should be addressed.
Energies 2024, 17(3), 657; https://doi.org/10.3390/en17030657
Submission received: 19 December 2023 / Revised: 19 January 2024 / Accepted: 23 January 2024 / Published: 30 January 2024

Abstract

:
The complexity of Fuel Cell (FC) systems demands a profound and sustained understanding of the various phenomena occurring inside of it. Thus far, FCs, especially Proton Exchange Membrane Fuel Cells (PEMFCs), have been recognized as being among the most promising technologies for reducing Green House Gas (GHG) emissions because they can convert the chemical energy bonded to hydrogen and oxygen into electricity and heat. However, their efficiency remains limited. To enhance their efficiency, two distinct factors are suggested. First, the quality of materials plays a significant role in the development of more robust and efficient FCs. Second, the ability to identify, mitigate, and reduce the occurrence of faults through the use of robust control algorithms is crucial. Therefore, more focused on the second point, this paper compiles, distinguishes, and analyzes several publications from the past 25 years related to faults and their diagnostic techniques in FCs. Furthermore, the paper presents various schemes outlining different symptoms, their causes, and corresponding fault algorithms.

1. Introduction

Climate change has been raising different questions and concerns with scientists and researchers around the world. It is caused by the increase in Green House Gas (GHG) emissions, such as carbon dioxide, which are released during the process of burning fossil fuel to produce electric energy. Nonetheless, most European countries are starting to have a significant quota of Renewable Energies [1]. Even though the percentage of renewable energy is increasing, another problem related to energy storage arises. This problem is related to the intermittent nature of renewable sources, which are dependent on external, uncontrollable factors, such as the sun and the wind, generating a gap between the available energy and its final use. Therefore, storing the excess produced energy is paramount to eliminating the intermittent nature of renewable energies [2]. Among other solutions, hydrogen storage is being intensively researched to work as an energy vector, as illustrated in Figure 1, for future direct conversion to electricity when demanded [1,3].
Converting the energy stored in hydrogen back to electricity requires an electrochemical device, such as an FC, which chemically converts the energy present into two reactants, in this case, hydrogen and oxygen, into electricity and heat [4]. Despite the simple theoretical process, the overall composition of the system is still dependent on expensive and rare materials, such as gold and platinum [4]. So, to ensure that the lifetime expectancy increases and the FC system is reliable, a deep understanding of how it operates under different conditions is required; this includes identifying ways to prevent and address any potential issues, like faults [5]. Thereafter, the analysis of fault diagnosis plays a crucial role in ensuring the stable operation and efficient output of FC systems. In recent years, numerous scholars have delved into this area to enhance accuracy and reliability. There are primarily two types of approaches: model-based methods (both qualitative and quantitative) and data-driven methods. In the model-based approach, an accurate mathematical model is developed based on the internal mechanisms of FC system operation [6]. Subsequently, residual vectors are utilized as features for statistical analysis to extract fault information embedded in the residual sequence. This process enables the detection of abnormal situations within the system, but existing fault diagnosis technology falls short in predicting the future degradation trend of FC systems. If the degradation of FCs could be estimated before a complete failure, maintenance personnel would have ample time to devise maintenance plans and replace components proactively. This proactive approach could significantly reduce repair and maintenance costs and prevent the unscheduled downtime of FC systems [7,8]. Faults, or failure modes, have been well established in the literature [9], and some reviews on fault diagnosis have been summarised in [10,11]. For example, in both [12,13], several tests for single and multi-cells under the influence of constant and dynamic loads have been reviewed and analyzed. It has been concluded that ensuring a specific relationship between failure modes and a particular signal, referenced as an indicator, requires an extensive amount of data under various operation conditions. However, there is an evident relationship between the cathode pressure drop and cathode flooding. Moreover, ref. [14] presented different model and non-model diagnosis methods for FC, while ref. [15] focused more on non-model-based diagnostics approaches. The conclusion drawn was that, when compared to model-based techniques, non-model-based approaches require a larger dataset of both normal and faulty conditions. Nevertheless, they are considered a prominent method for FC fault diagnosis due to their simplicity, flexibility, and ability to handle system uncertainties.
Regardless, most of the published work has only focused on closed-cathode single-cell systems and on specific diagnostic techniques; therefore, it is necessary to compel, update, and analyze the different fault diagnosis techniques and fault-tolerant modes presented in the literature.
This paper aims to present the main different types of FC technology and analyze the different fault diagnostic approaches applied to FC systems over the past years, providing special concern in PEMFCs with the open cathode. To achieve that, more than one hundred papers were reviewed and compared. The paper is organized as follows: firstly, a brief introduction on the topic is provided; secondly, the working principle and types of fuel cells are presented; thirdly, a brief section on how to model both FC systems and faults is introduced; fourthly, the definition of faults and the different faults that may occur, as well as their organization in terms of reversibility, are provided; fifthly, the different faults are discussed; sixthly, an extensive discussion is presented; and finally, the main conclusions are drawn.

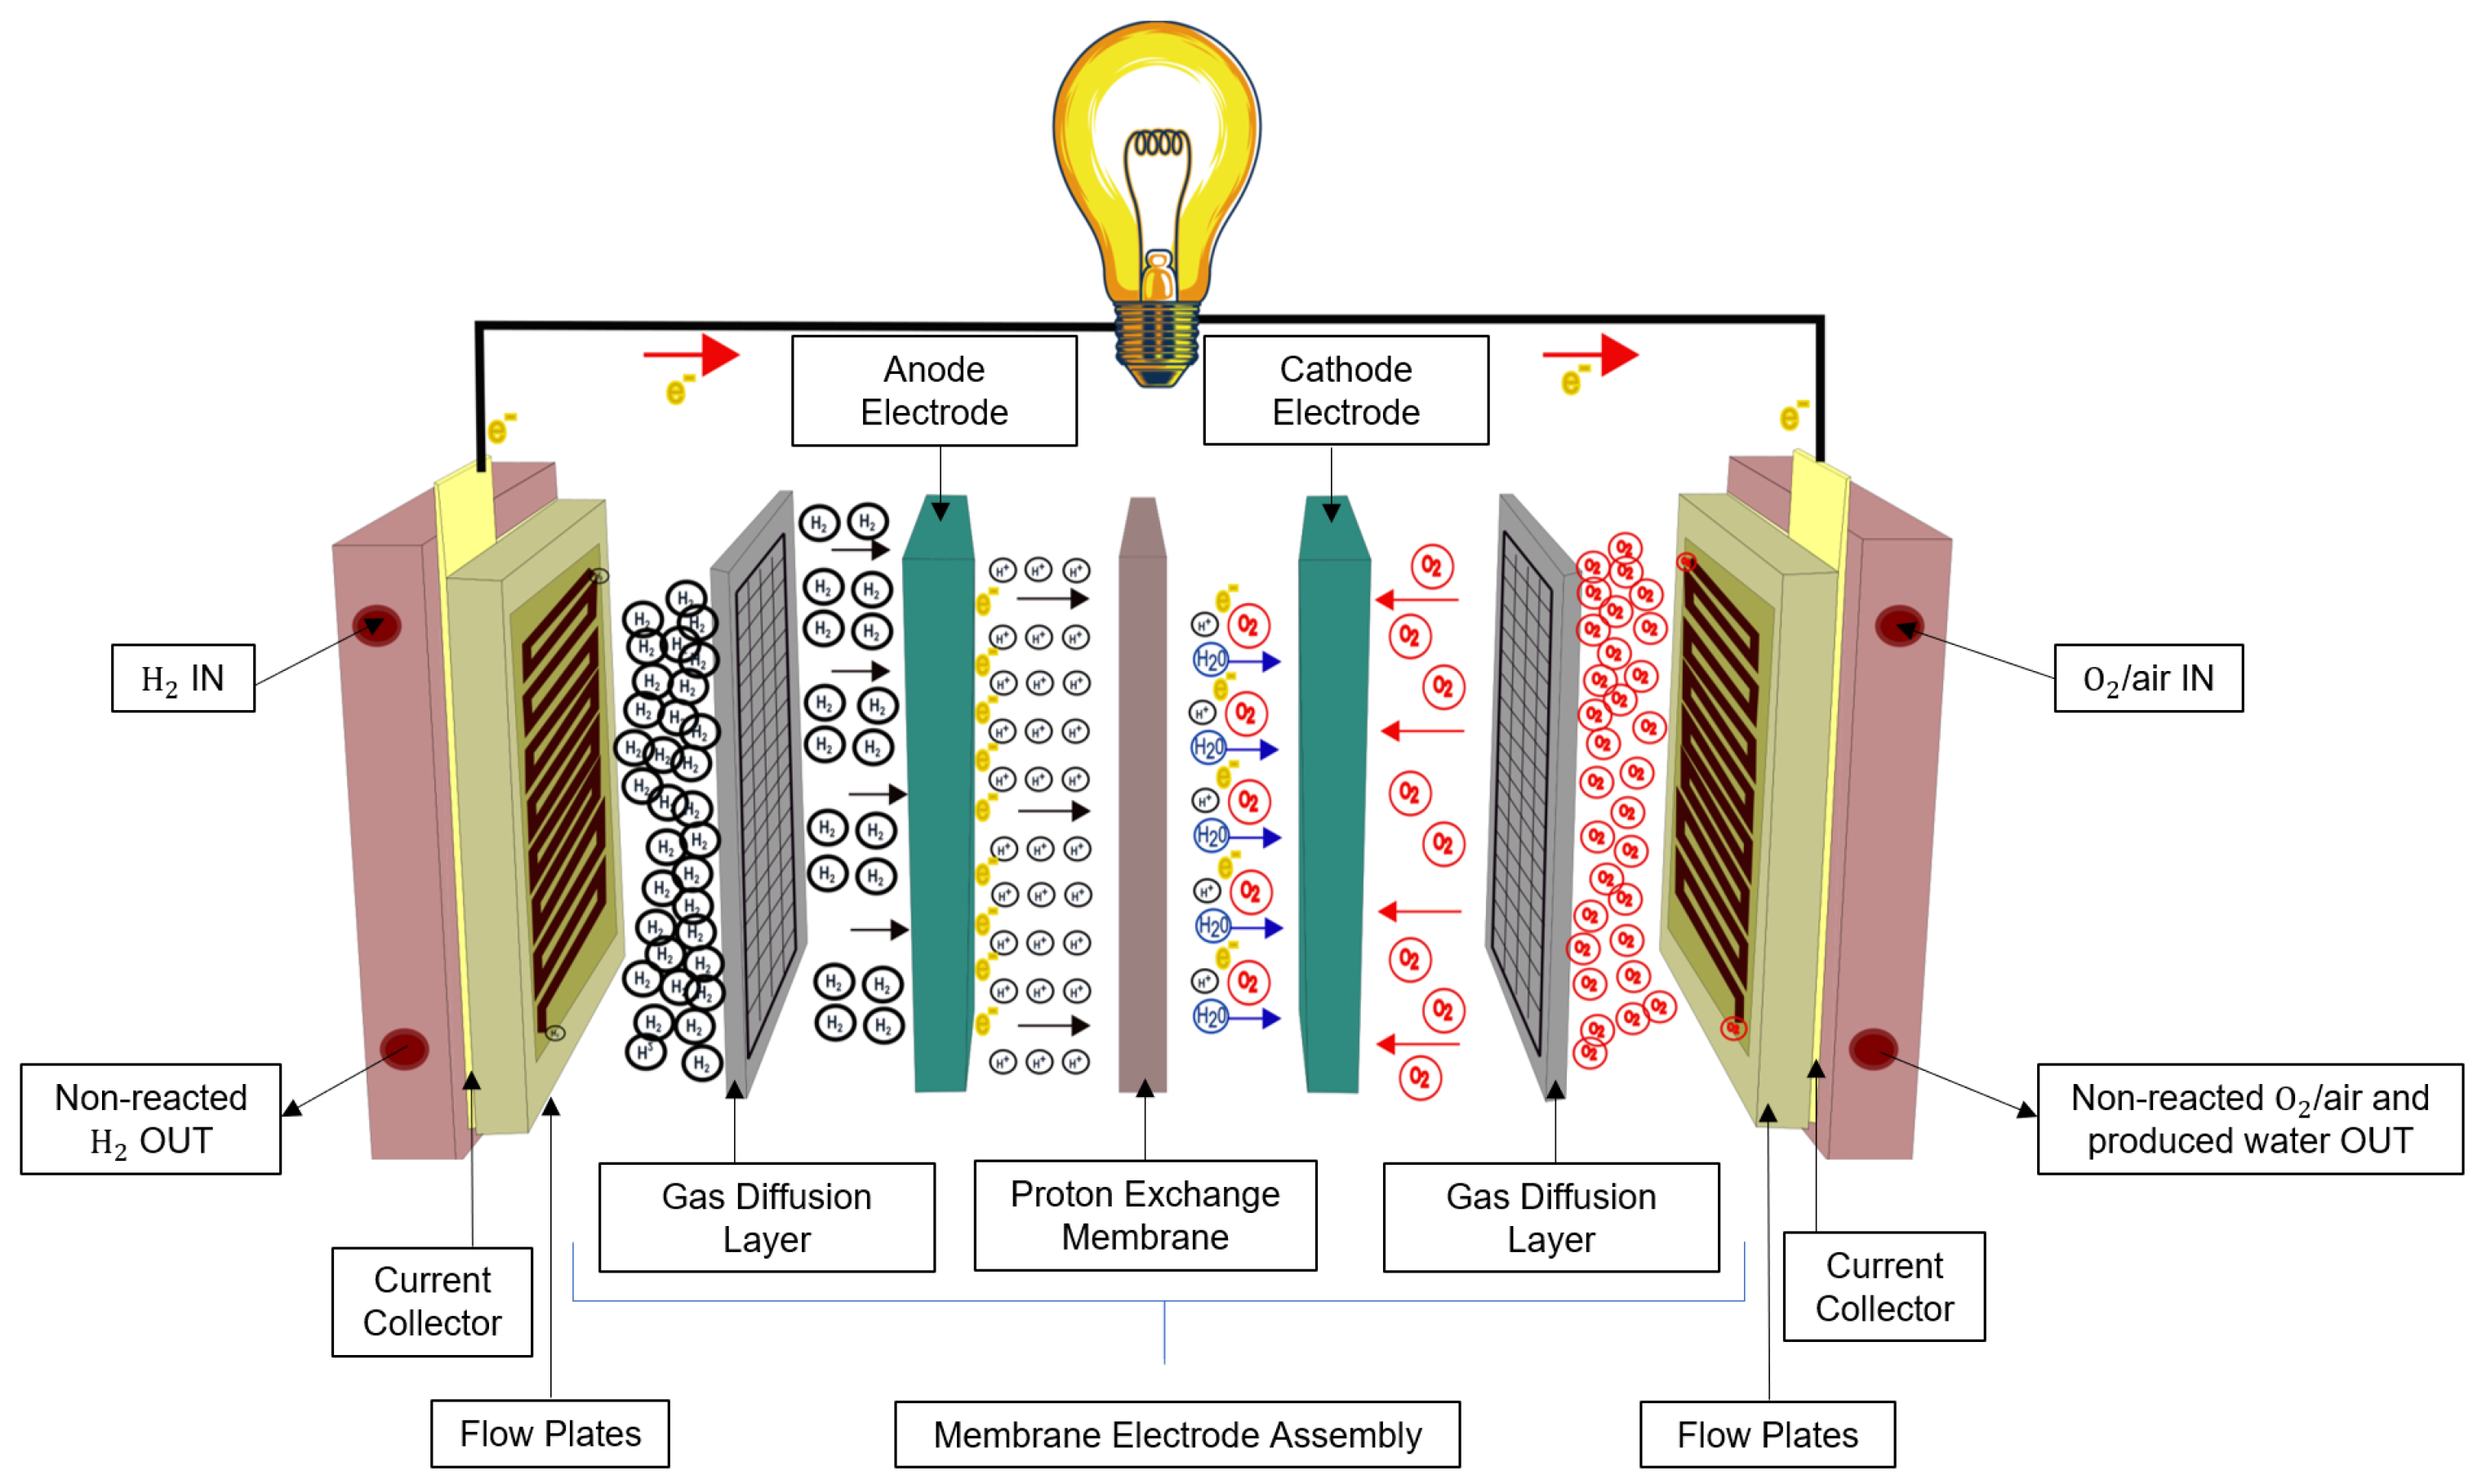
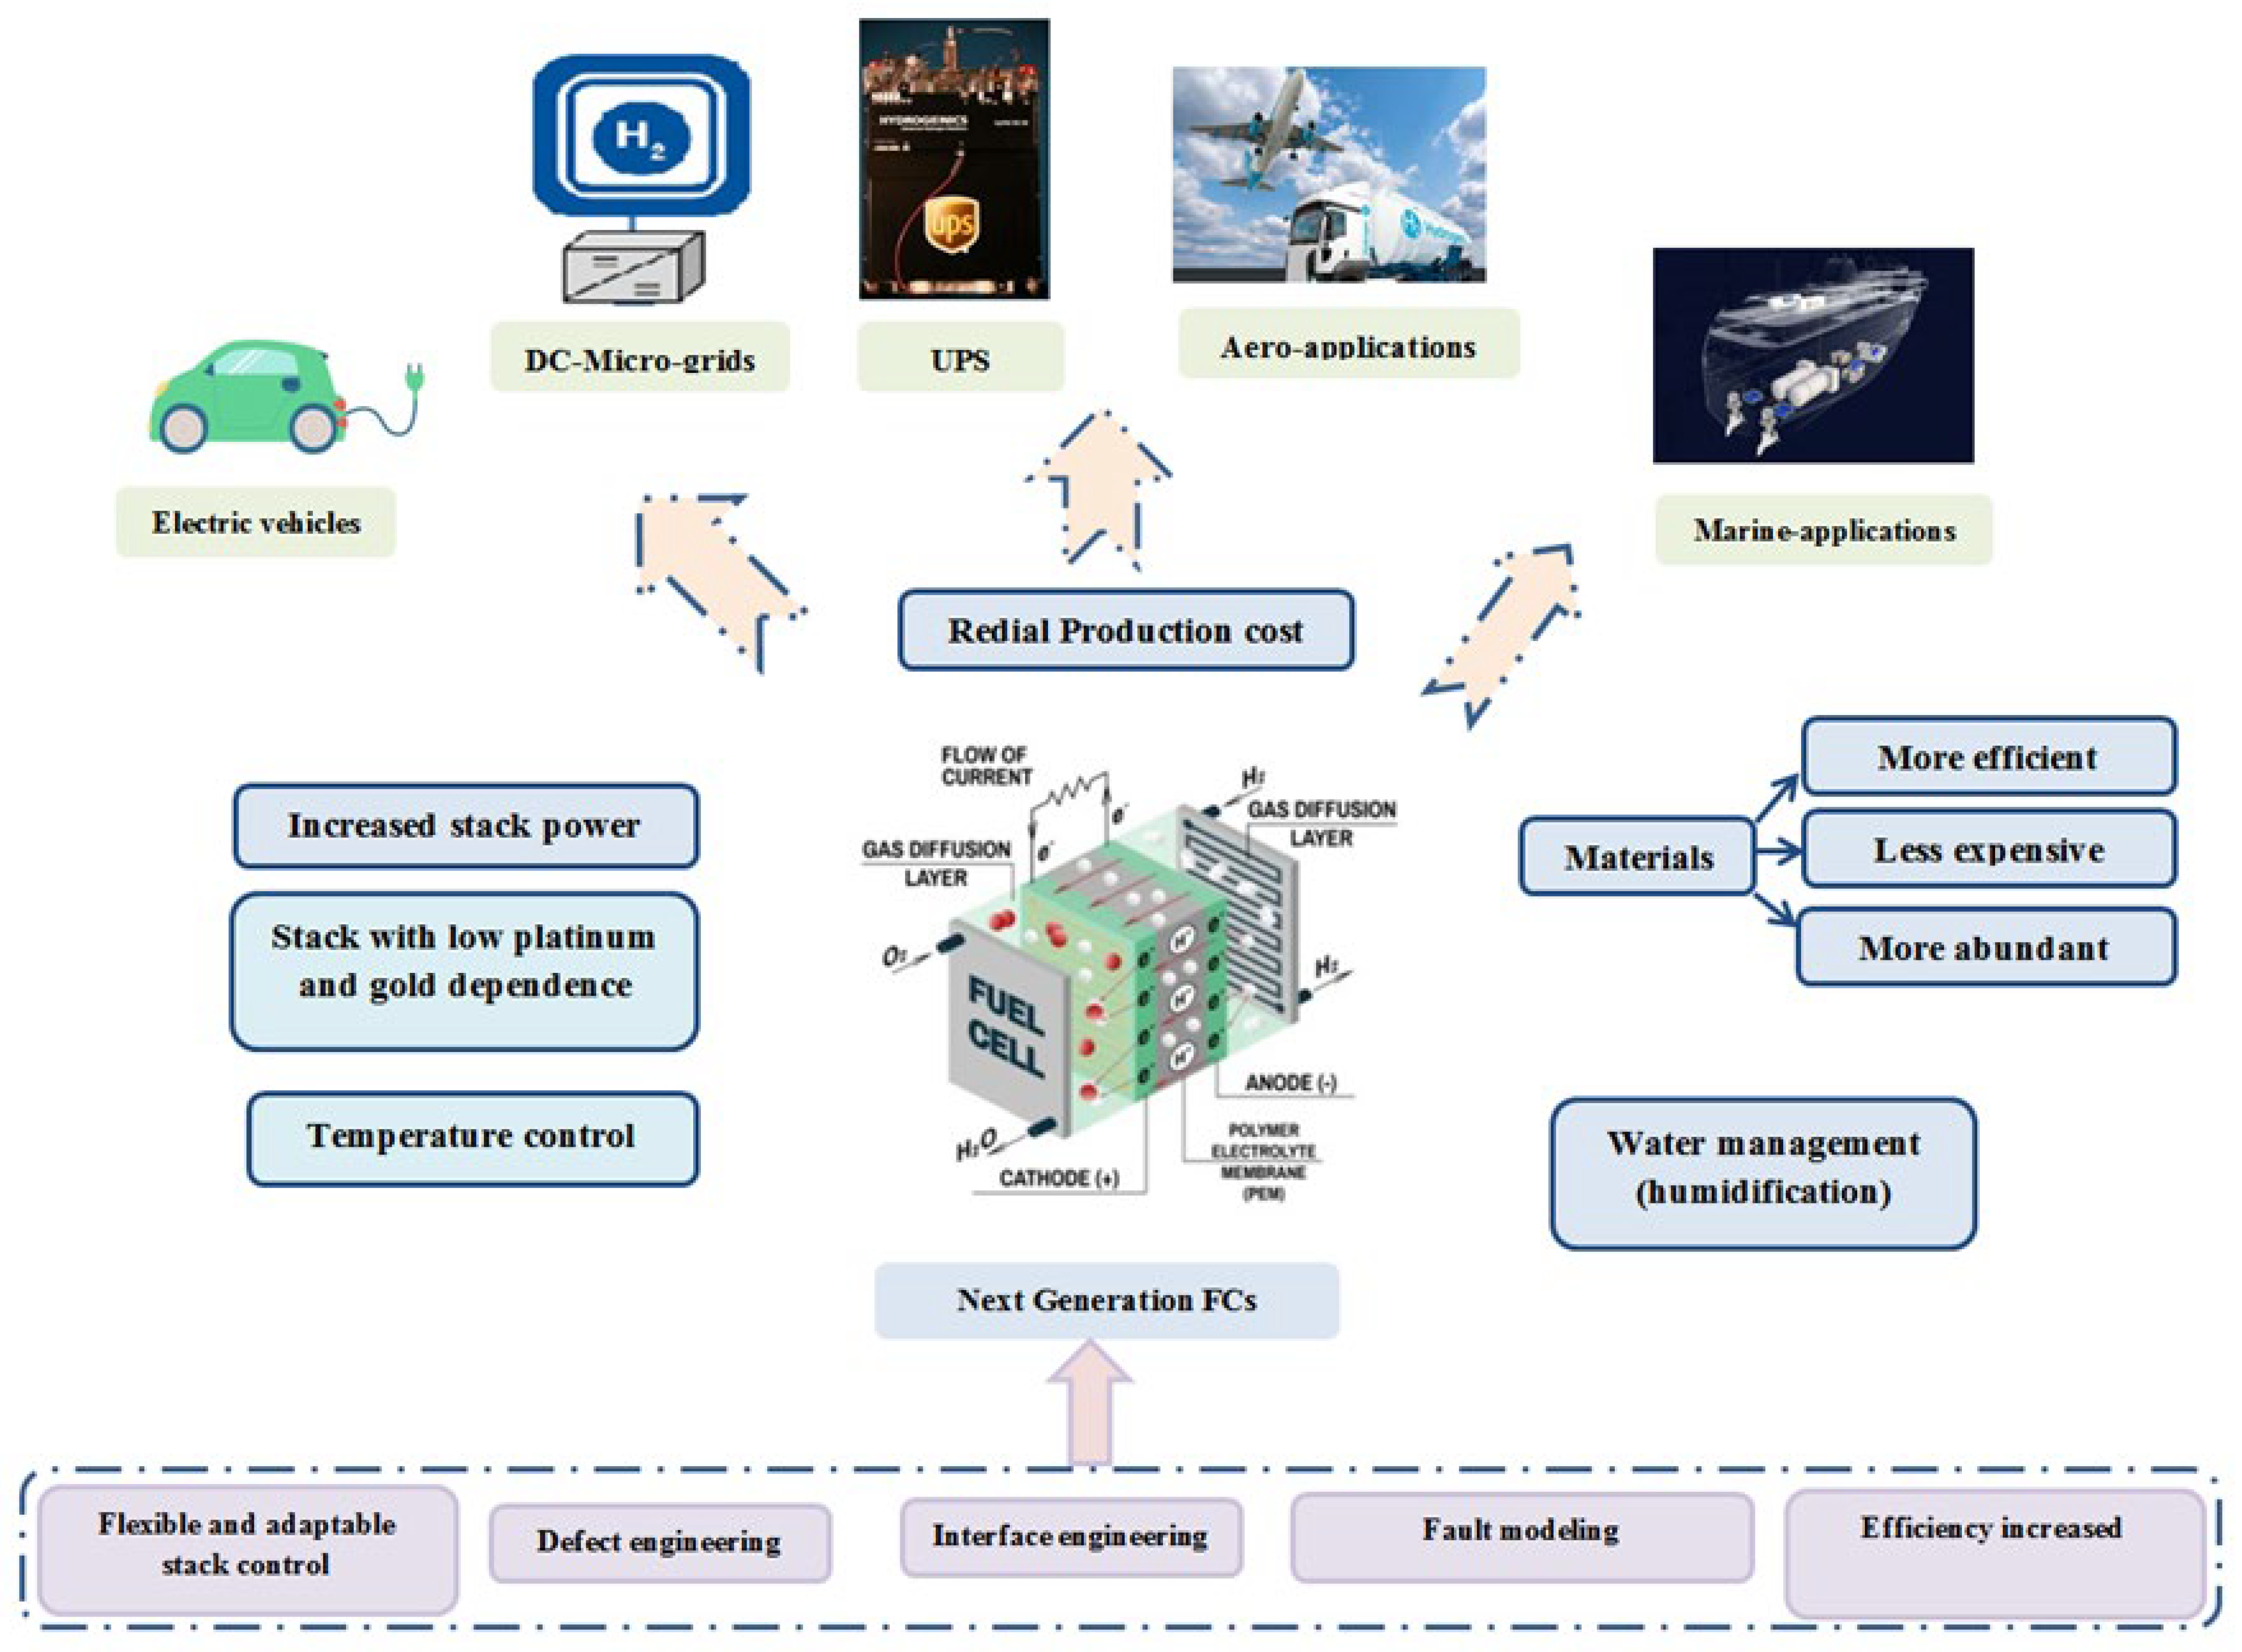
2. Fuel Cells Technologies

Fuel cells can be classified based on several factors. First, they can be categorized depending on the type of electrolyte separating the electrodes they use, which can be either alkaline or acidic. Second, a more common classification is through the operating temperature; therefore, they are referred to as a High-Temperature Fuel Cell (HT-FC) or a Low-Temperature Fuel Cell (LT-FC).
Table 1 outlines the typical characteristics of the different types of FCs, organized by their operating temperatures. The efficiency of FCs is influenced by the choice of electrolytes, catalysts, and operating temperature. Different FCs and their applications are illustrated in Table 1.
MCFCs find applications in energy storage [22,23,24,25,26,27]. Operating efficiently at 560 °C, MCFCs generate excess heat, which can be utilized in cogeneration processes. AFCs were the first FC model to be used by NASA in the first space exploration missions because of their vast temperature range and high efficiency, which were critical aspects at the time. PAFCs represent one of the first widely commercialized fuel cell technologies in the mid-1970s and offered a reliable solution for stationary applications at the time [18,22,28,29]. Due to their moderate operating temperature, PAFCs boast high efficiency and offer a wide range of reactant possibilities. However, they suffer from drawbacks such as poor power density, limited lifespan, and high production costs, which hinder their progress.
DMFCs undergo methanol oxidation to convert chemical energy into electrical energy [30]. Regarded as one of the most advanced fuel cells in terms of performance and user convenience, the DMFC is being explored as a potential alternative to traditional batteries in portable systems. These fuel cells fall into the category of low-temperature fuel cells based on polymer membranes; however, they have a high environmental impact since carbon dioxide is one of the byproducts. Moreover, another drawback of DMFC is the possibility of methanol crossover through the membrane, causing the efficiency to decrease [31]. SOFCs are the most suitable for high-power applications and large-scale centralized electric energy production. Unlike other FCs, they do not require expensive and rare materials for the electrodes and are less prone to Carbon Monoxide (CO) poisoning; however, a higher start-up time to reach the temperature range is required [4].
The PEMFC was initially developed for the Gemini spacecraft. In this design, a proton-conducting polymer membrane serves as the electrolyte, with electrodes constructed on thin layers on either surface. In certain aspects, the electrolyte resembles the plasticized electrolyte found in lithium-ion cells, comprising a liquid electrolyte trapped within a polymer matrix component [32]. Due to their diverse applications and the emission of residual GHG, PEMFCs have become a focal point for researchers seeking enhancements. Despite sharing a similar working principle with different types, PEMFCs consist of distinct components, as depicted in Figure 2. The negatively charged electrode, known as the anode, and its counterpart, the cathode, are separated by layers including a Gas Diffusion Layer (GDL). The GDL efficiently disperses reactants from the inlet to the catalyst layer, where crucial chemical reactions take place. On the anode side, hydrogen undergoes oxidation, and the resulting hydrogen protons move across the protonic membrane to the cathode, while electrons flow through the external circuit. At the cathode, oxygen is reduced by reacting with protons and electrons, resulting in the production of water and heat [4].
Another crucial characteristic of fuel cells is the polarization curve, depicting the relationship between fuel cell voltage and current under various loads. Figure 3 provides a general representation where three distinct zones are identified. The first zone, occurring at low power densities, is commonly referred to as activation polarization. This zone illustrates the energy barrier that must be overcome to initiate the electrochemical reaction at the electrode. Next, the ohmic zone exhibits a linear relationship between voltage and current. The slope in this zone is determined by the inherent resistance that conductors pose to the passage of electrical charges. Finally, the concentration zone or mass transport zone is characterized by a sudden voltage drop. This drop is attributed to the fuel cell’s inability to expel reaction products, indicating that the concentration of reaction products surpasses that of the reactants [4]. The zones mentioned in the text signify the losses that cannot be reversed. The relationship between voltage and current is determined chemically by comparing the open-circuit voltage (a reversible loss), also known as the Nernst voltage, with the irreversible losses mentioned earlier.
A further consideration for PEMFCs is the reactant feeding configuration. In educational stack models, a common setup is the cathode-close configuration, where both pure hydrogen and oxygen supplies are required. Much of the presented research focuses on this model due to its cost-effectiveness, ability to function as an electrolyzer producing necessary gases, and its suitability for experimenting with various Membrane Electrode Assembly (MEA) materials. For higher stack power, PEMFCs adopt an open cathode configuration, using atmospheric air as the oxygen source. This configuration simplifies the system by eliminating the need for an external oxygen storage and injection system, thus reducing overall costs and minimizing parasitic losses. However, relying on ambient air introduces dependencies on temperature and humidity levels, constituting a significant drawback [33]. Managing humidity control within the stack poses a challenge. The correct humidity level inside the cell is crucial for optimal proton conductivity, facilitating ion transport. Additionally, this humidity level significantly impacts the promotion of efficient reactions at the electrodes. Furthermore, maintaining the correct humidity levels helps to regulate the temperature inside the stack [4,34].
Regarding hydrogen admission, three distinct modes are defined [35]. The first, the dead-end mode, is characterized by working at low pressure and with maximum hydrogen flow for all operating points while expelling the non-reacted hydrogen periodically through an outlet valve. The second, flow-through mode, employs a back-pressure regulator valve and a flow controller to regulate the pressure of the inlet. The third mode is similar to the first but recirculates the non-reacted hydrogen. These three modes are illustrated in Figure 4.
The next section is oriented to the modelling of FC systems, with a specific focus on PEMFCs. This attention to PEMFCs is due to their alignment with various parameters and reasons to address diverse challenges, including high energy efficiency, low operational temperatures, rapid start-up capabilities, and adaptability for a wide array of applications.

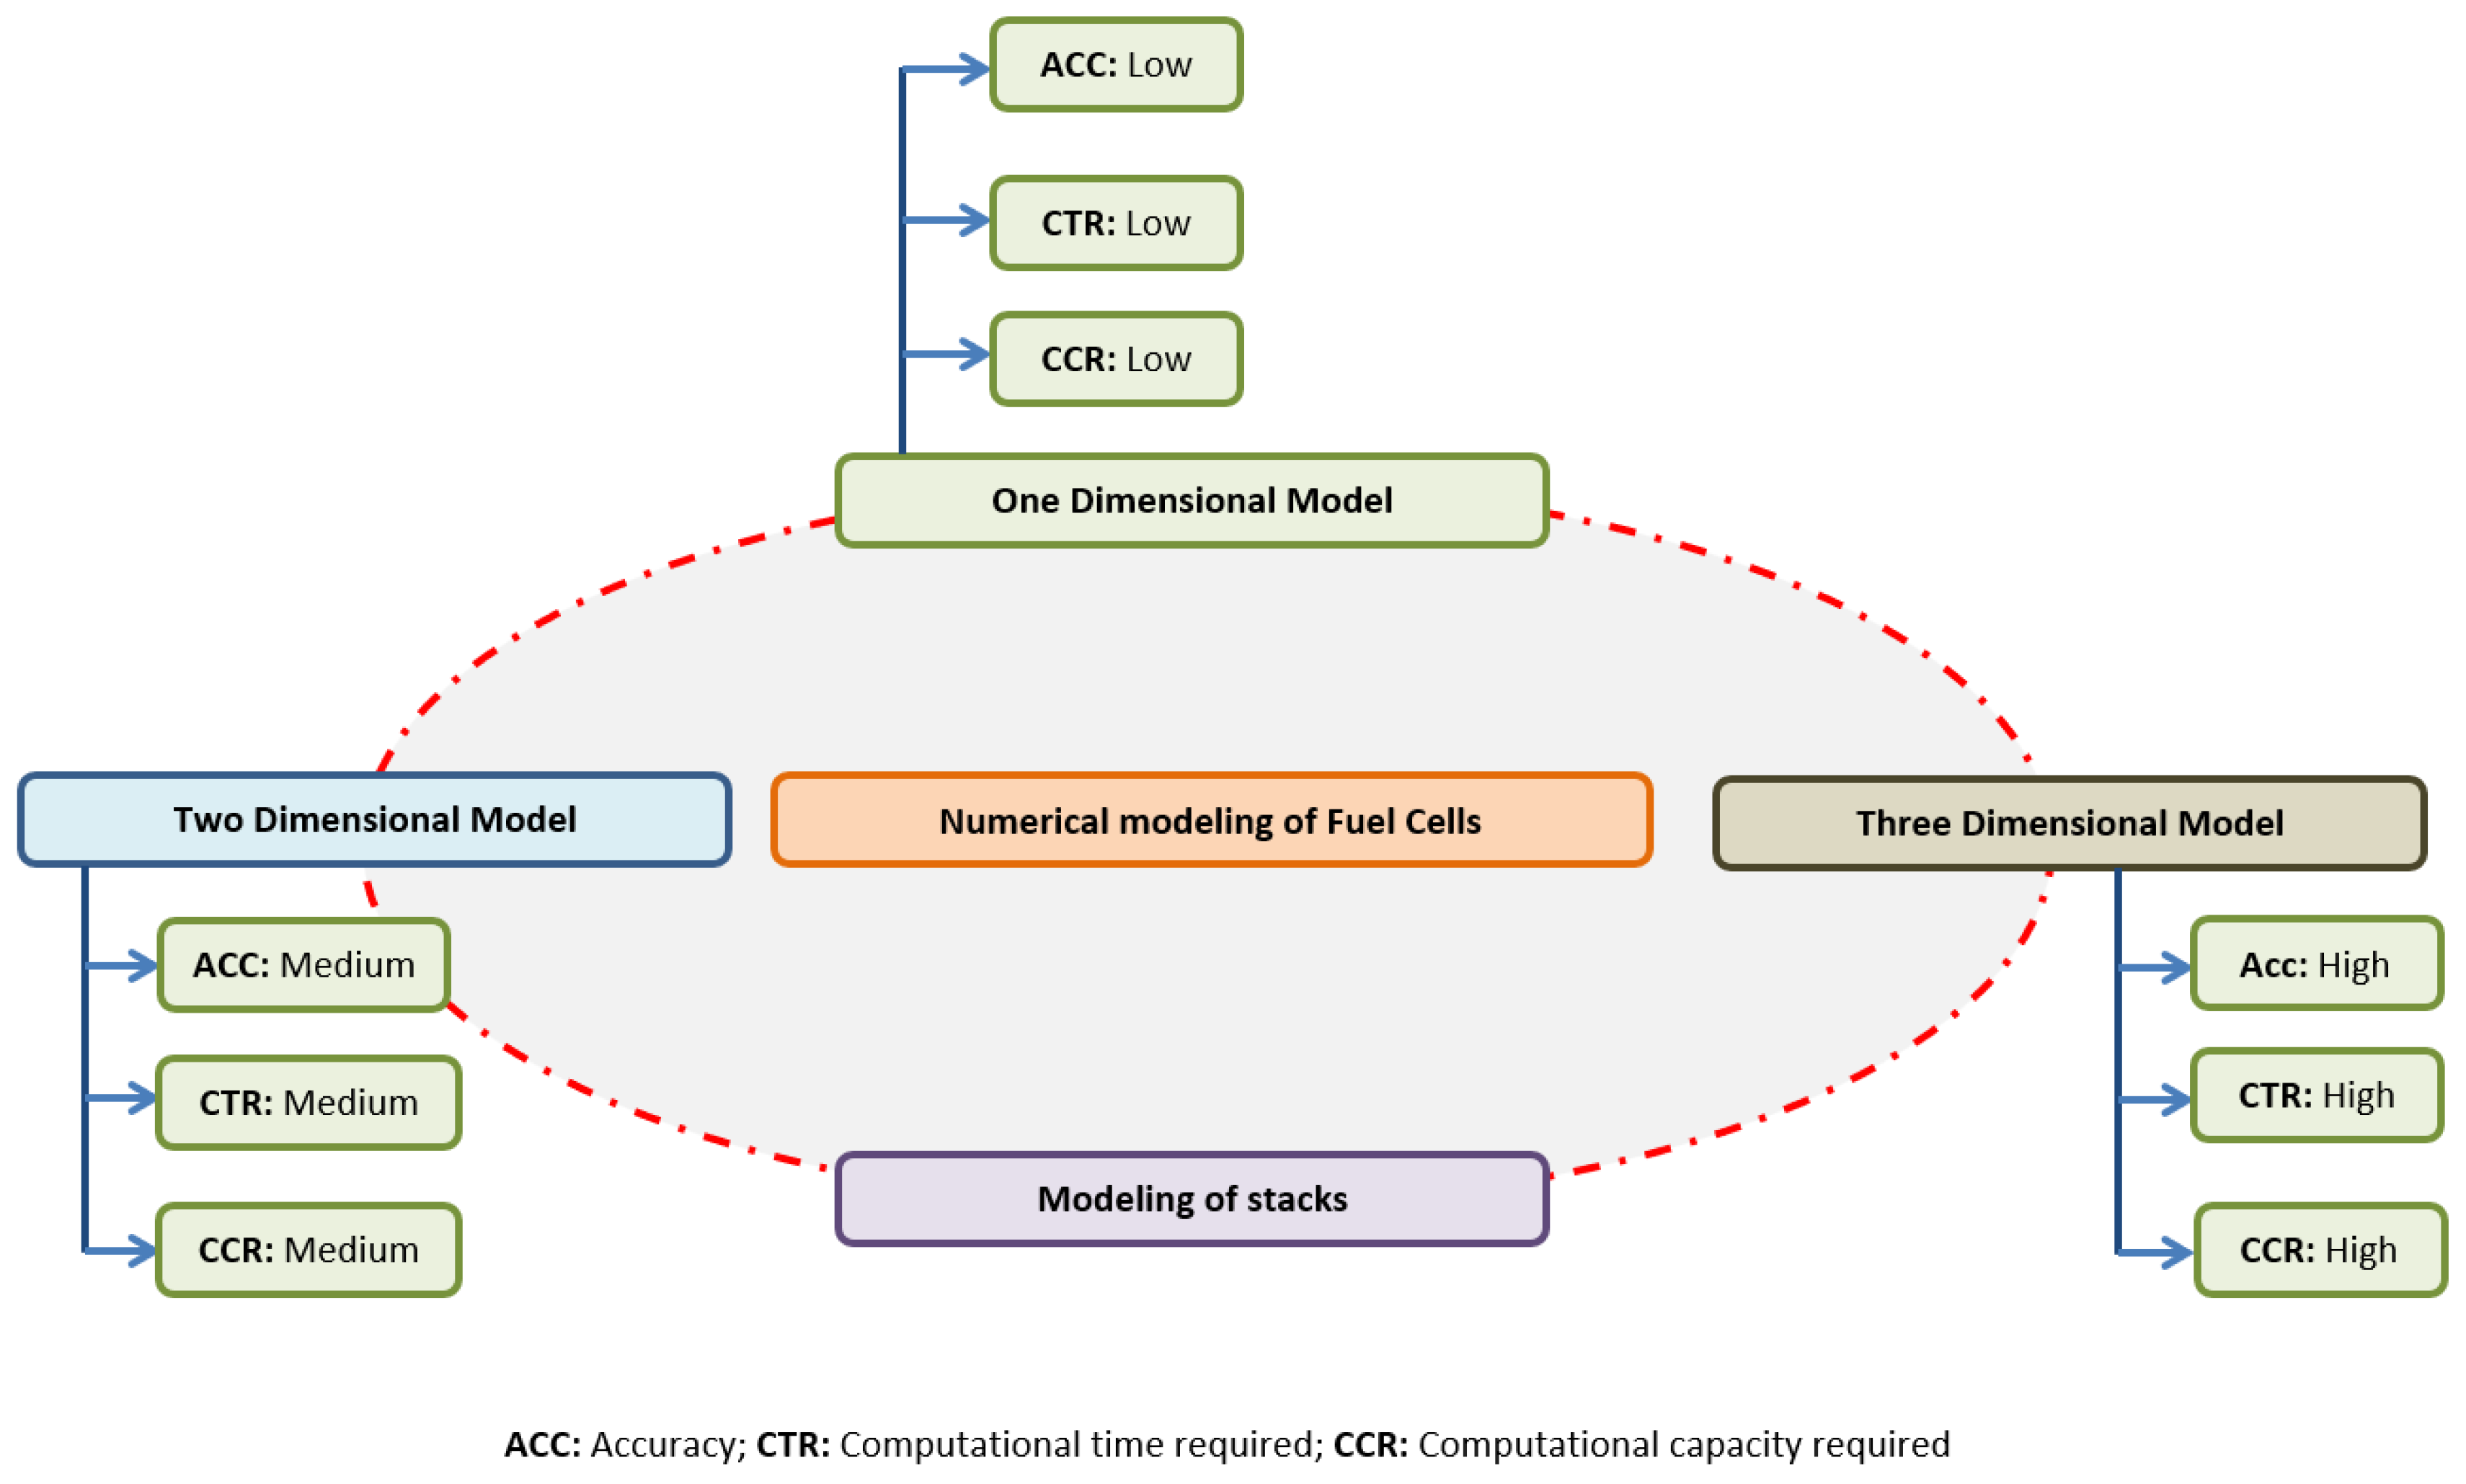
3. Fuel Cell Modelling

Emulating the behavior of the FC using computational tools allows for a better comprehension of the system without having to physically intervein with it, eliminating the risk of damaging any component. Therefore, correct modeling is of major importance when sensible components are being studied, such as in the case of faults. A plethora of model possibilities have been presented in the literature and based on that, classification was performed, which is visually represented in Figure 5.
The first works date back to the beginning of the century and were based on a premise still true in today’s works. Those works [36,37] are based on the simulation of the difference between the reversible losses and the irreversible losses that compose the polarization curve. Equation (1) refers to how the polarization curve is defined:
V F C = N c e l l × [ E F C R T F C n F ln a H 2 O a H 2 a O 2 1 2 R T F C α F ln i F C + i n i o i F C × R i R T F C n F ln i l i l i F C ]
Parameters designation: V F C : Fuel Cell Voltage; i F C : Fuel Cell Current; N c e l l : Number of Cells in Series; E F C : Nerst Potential; R : Universal Gas Constant; a x x : Partial Pressure of the Reactants; α : Charge Transfer Coefficient; F : Farad Constant; i o : Exchange Current Density; i n : Internal Current Density; R i : Fuel Cell Internal Resistance; n : Number of Exchange Electrons; i l : Maximum Current; T F C : Fuel Cell Temperature.
Following the above equation, identifying and physically quantifying the value of the parameters is a difficult task to undertake. Based on that, authors in [38] analyzed how certain parameters in Equation (1) can be simulated and how the FC temperature affects their values. Experiments were conducted on an FC with an active area of 25 c m 2 and temperature variation from 50 °C to 80 °C. The reactants (hydrogen and air) were pre-humidified according to the temperature. Results showed that only i o , R i , and i n can be estimated without interfering with other parameters. Curiously, all the estimated parameters varied linearly with the temperature, and R i inclusively decreased with temperature, suggesting that for high values of temperatures, the ohmic losses are significantly more affected.
Because of the different interactions between parameters of Equation (1), authors started to replace them with empirical mathematical equations that describe the same graphic trajectory of the polarization curve presented in Figure 3. For example, in [39], a logarithm term was used to simulate the activation losses, without having to directly compute the terms identified in that part of Equation (1). Another empirical model is presented in [40]. The authors proposed three exponential expressions to simulate the three zones presented in Figure 3 and validate the model both in steady and dynamic states. The expressions were then fitted with data obtained from a 5 kW FC, and the results showed good accuracy between experimental and simulated values.
Another approach to Fuel Cell modeling is to use an electric equivalent model such as the one presented in Figure 6.
The model in Figure 6 was first introduced in [41]. In Figure 6, the resistor R e i represents the equivalent Fuel Cell resistance and a sudden change in the current is rapidly reflected in the voltage drop across the load. The activation zone is characterized by the capacitor Ca in parallel with the resistor Ra, while the voltage source represents the open-circuit voltage. To estimate the parameters in Figure 6, two distinct approaches were performed: the first one is called the interrupt test, and its operating principle is based on cutting off the current drawn from the Fuel Cell suddenly and analyzing the voltage evaluation until it reaches the open-circuit voltage. This test allows one to collect data related to the activation zone. The second approach is a known parameter estimation technique denoted as Electrical Impedance Spectroscopy (EIS), and it consists of performing a frequency sweep and plotting the graph of impedance versus frequency, also known as a Nyquist plot. An example of how the different elements of the equivalent circuit mode are related to the frequency is presented in Figure 7.
With the collected data, several parameter identification techniques can be adopted. For example, in [42], a machine learning regression model is deduced to fit the data and obtain the equivalent values of the equivalent resistance and capacitor values. Others have used curve-fitting tools [41,43,44,45].
Specifically for open-cathode FCs, the model is not only focused on the voltage output but also on the influence of reactants’ stoichiometry. Since the cathode is fed air, the oxygen percentage is low, and it is necessary to keep the ratio between the oxygen supplied and consumed (stoichiometry) higher than one. On that basis, several authors tried to model that behavior. In [46], a Volterra series was used to model the air-feeding system, so the oxygen stoichiometry could be optimized for every operation point. A similar idea was presented in [47], where a nonlinear model predictive control was employed to control the power while keeping the FC operating at the ohmic region with a minimum consumption of hydrogen and oxygen. To ensure that different experiments were conducted under different loads and different hydrogen and oxygen stoichiometries, a fourth-order polynomial is used to approximate the data. Therefore, the authors have the possibility of controlling the air intake according to the setpoint given by the approximation. A different polynomial approach to calculate the oxygen stoichiometry is presented in [48]. The authors increased the voltage applied to the air blower and measured the air mass flow that was moved through it. Finally, a third-order polynomial was then fitted to the data, and the results showed good agreement between the simulation and the experimental results. Since third-order polynomial approximation has little computational burden, it can be easily implemented in a low-cost processor and improve the control of air fed to an open-cathode FC.
So far, most of the presented work has been focused on estimating or simulating the voltage and current of the FC as a function of the load and power; however, trying to model the chemical, electrochemical, and thermal reactions inside the cell is a major challenge. Regarding the modeling of water movement inside the cell, previous authors [49] tried to include the non-isothermal and non-isobaric effects in a single model. The model parameters included diffusion of the hydrogen, oxygen, and water through the porous electrodes; the electro-osmotic transport of liquid water in the electrodes and the membrane; and the heat generated in the FC. The results showed that the non-uniform temperature and pressure distributions have a large impact on the predicted water produced. Furthermore, in [49], a more robust three-dimensional model was presented, which involved all layers of the MEA at a constant temperature. In [50], the authors also tried to model water diffusion in a polymer-type membrane (known as Nafion) by assuming that the relationship between the membrane water content and the channel water concentration is linear. The authors were then able to change the parameters of relative humidity to understand its effects on the model. Even though the authors claim to have an error of less than 20% between the model and the experimental results, this error still presents a major effect; nonetheless, considering technology’s limitations and this being one of the first papers published on modeling such phenomena, dating to the beginning of the century, that error is more than acceptable.
Another work incorporating the flow distribution within the gas chamber in a unit cell was introduced in [51]. As a mathematical basis, the laws of mass and momentum conservation are applied. The model was validated on a 190-cell stack in a built-in customized Pitot tube to measure the gas flow in an inlet and the different outlets. In theory, it is safe to assume that the air flow distribution is the same for all single cells; however, as the results show, different cells are submitted to different air stoichiometry, and this can be attributed to the losses that occur in the gas pipes.
Water is a fundamental byproduct found in all key components of a fuel cell system, making its control vital for the efficient and reliable operation of FCs. Several mechanisms contribute to water transport within an FC, including hydraulic permeation, electro-osmotic drag, thermal-osmotic drag, and back diffusion. These phenomena will be thoroughly explained in section IV. Monitoring and predicting water movements during operation pose challenges due to the complex two-phase flow nature. Techniques such as nuclear magnetic resonance imaging and beam interrogation methods like X-ray neutron imaging and high-speed photography have been employed for in situ observation of liquid water [52,53].

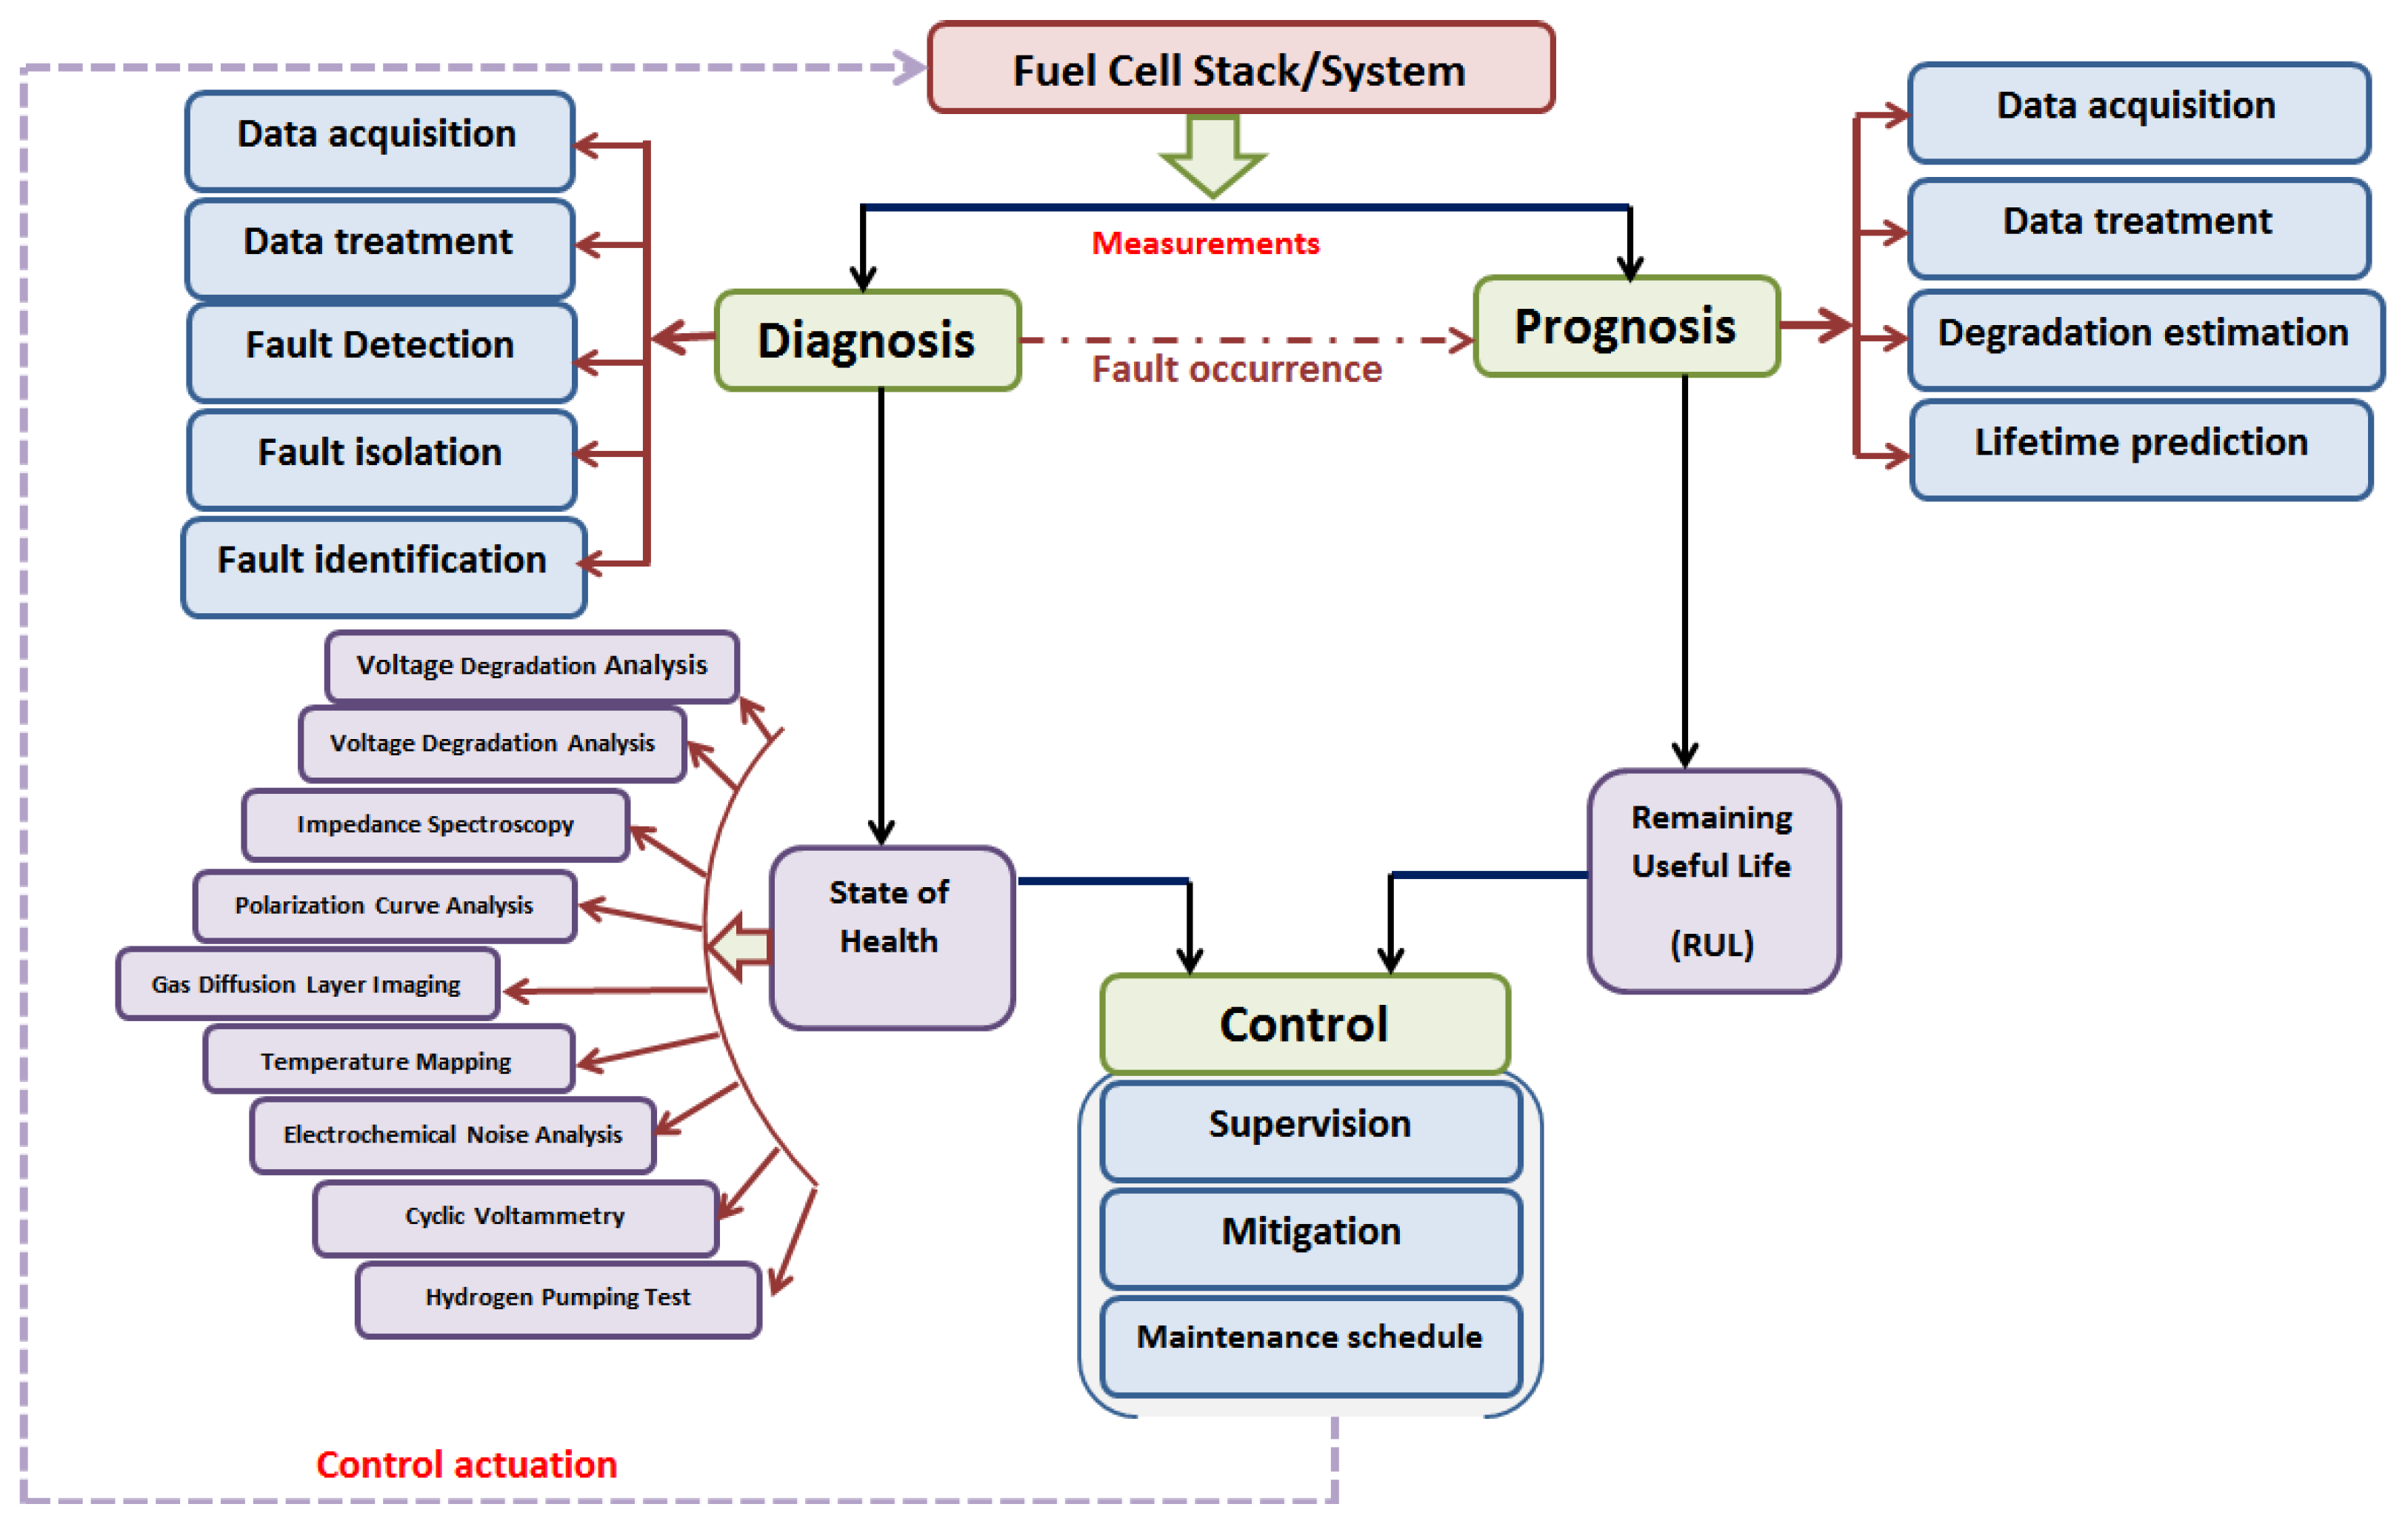
4. State of Health (SOH)

For many years, health monitoring has played a crucial role in engineering systems, ensuring performance, safety, availability, and reliability. Typically, sensors are employed to monitor operating conditions, performance, and loading cycles, allowing for the timely detection of anomalies and faults. This proactive approach helps prevent unforeseen incidents, downtime, and fault propagation. Minor faults within a system component can escalate into major issues, leading to system failure. The early detection or prediction of faults enables timely maintenance scheduling, preventing the development of more serious problems. The application of health-monitoring techniques provides a clear advantage, not only for safety reasons but also by significantly reducing unscheduled maintenance costs. Prognostics, offering information on the State of Health (SOH) and Remaining Useful Lifetime (RUL) of FCs, allows for optimized FC operation through appropriate control strategies. This, in turn, facilitates scheduled maintenance, effectively minimizing downtime [54,55,56].
In the domain of FCs, SOH entails a thorough assessment of a system’s condition and performance capabilities over time. While there is no standardized definition of SOH, it serves as a metric reflecting the degradation or aging of crucial components, including the membrane, catalysts, electrodes, and other vital elements. Monitoring SOH is crucial for evaluating the long-term reliability, efficiency, and remaining useful life of an FC [57].
An increasing number of researchers in FC studies are employing the AC impedance approach, or EIS, making it a prominent research tool in the field. EIS serves as a reliable characterization tool, crucial for detecting various failure mechanisms within the FC. Its integration with the control approach of the necessary power converter offers the potential for real-time diagnosis of the FC stack without the need for additional sensor devices. Consequently, impedance spectra serve as effective input parameters for predicting the state of health of FC. However, so far, authors have not defined or mathematically expressed the definition of SOH in FC, but rather presented several parameters, as will be explained further on, to benchmark the actual state with past states [58,59]. Additionally, non-invasive methods have been explored, involving the measurement of the magnetic field generated by induced current changes within a stack to detect faults in a PEMFC stack. This technique utilizes magnetic sensors placed around the stack to measure the magnetic field produced. The general aspect of FC State of Health is presented in Figure 8.
In [60], a seven-layer process is proposed. The first two layers pertain to data acquisition and processing using sensors and transducers. The third and fourth layers focus on condition assessment and diagnostics, aiming to assess the system’s state of health by detecting internal or external faults and proceeding to isolate them. The fifth layer, labeled prognostic, involves predicting the future condition based on past actions in a cause-and-effect reaction. The last two layers center on the decision-making process, drawing insights from the preceding layers. Furthermore, the authors identified the primary degradation mechanism in FC. They advocate for the use of behavioral models, such as static/dynamic, mathematical, and hybrid approaches (combining physical models with empirical support from Artificial Intelligence) as the most effective method for analyzing the state of health. In [61], an accurate physics-based aging model is proposed to foresee the degradation evaluation of the electrode active surface layer as a function of the operation conditions. The model is based on an unscented Kalman Filter (UKF)-based framework, and it showed a precision and accuracy of 95%.
A more extended review of the FC’s state of health has been presented in [57]. The authors identified various monitoring parameters and techniques applicable to assessing the SOH in FC applications. The first parameter under consideration is the cell voltage. The analysis indicates that all fault modes, which will be further explained, result in a voltage drop. This is evident in instances such as flooding and drying. Another key parameter is impedance. Utilizing EIS allows for the monitoring of the parameter’s evolution, aiding in the detection of any signs of accelerated degradation. Thermal stability is also a significant parameter for estimating the SOH of the stack. Research has demonstrated a correlation between local temperature and local current density. Moreover, these parameters exhibit a simultaneous increase when there is a decrease in the operating voltage. Additionally, the authors highlight the importance of considering other factors such as gas diffusion, membrane degradation, and catalyst poisoning in comprehensive SOH assessments. These aspects contribute valuable insights into the overall health and performance of the FC system.

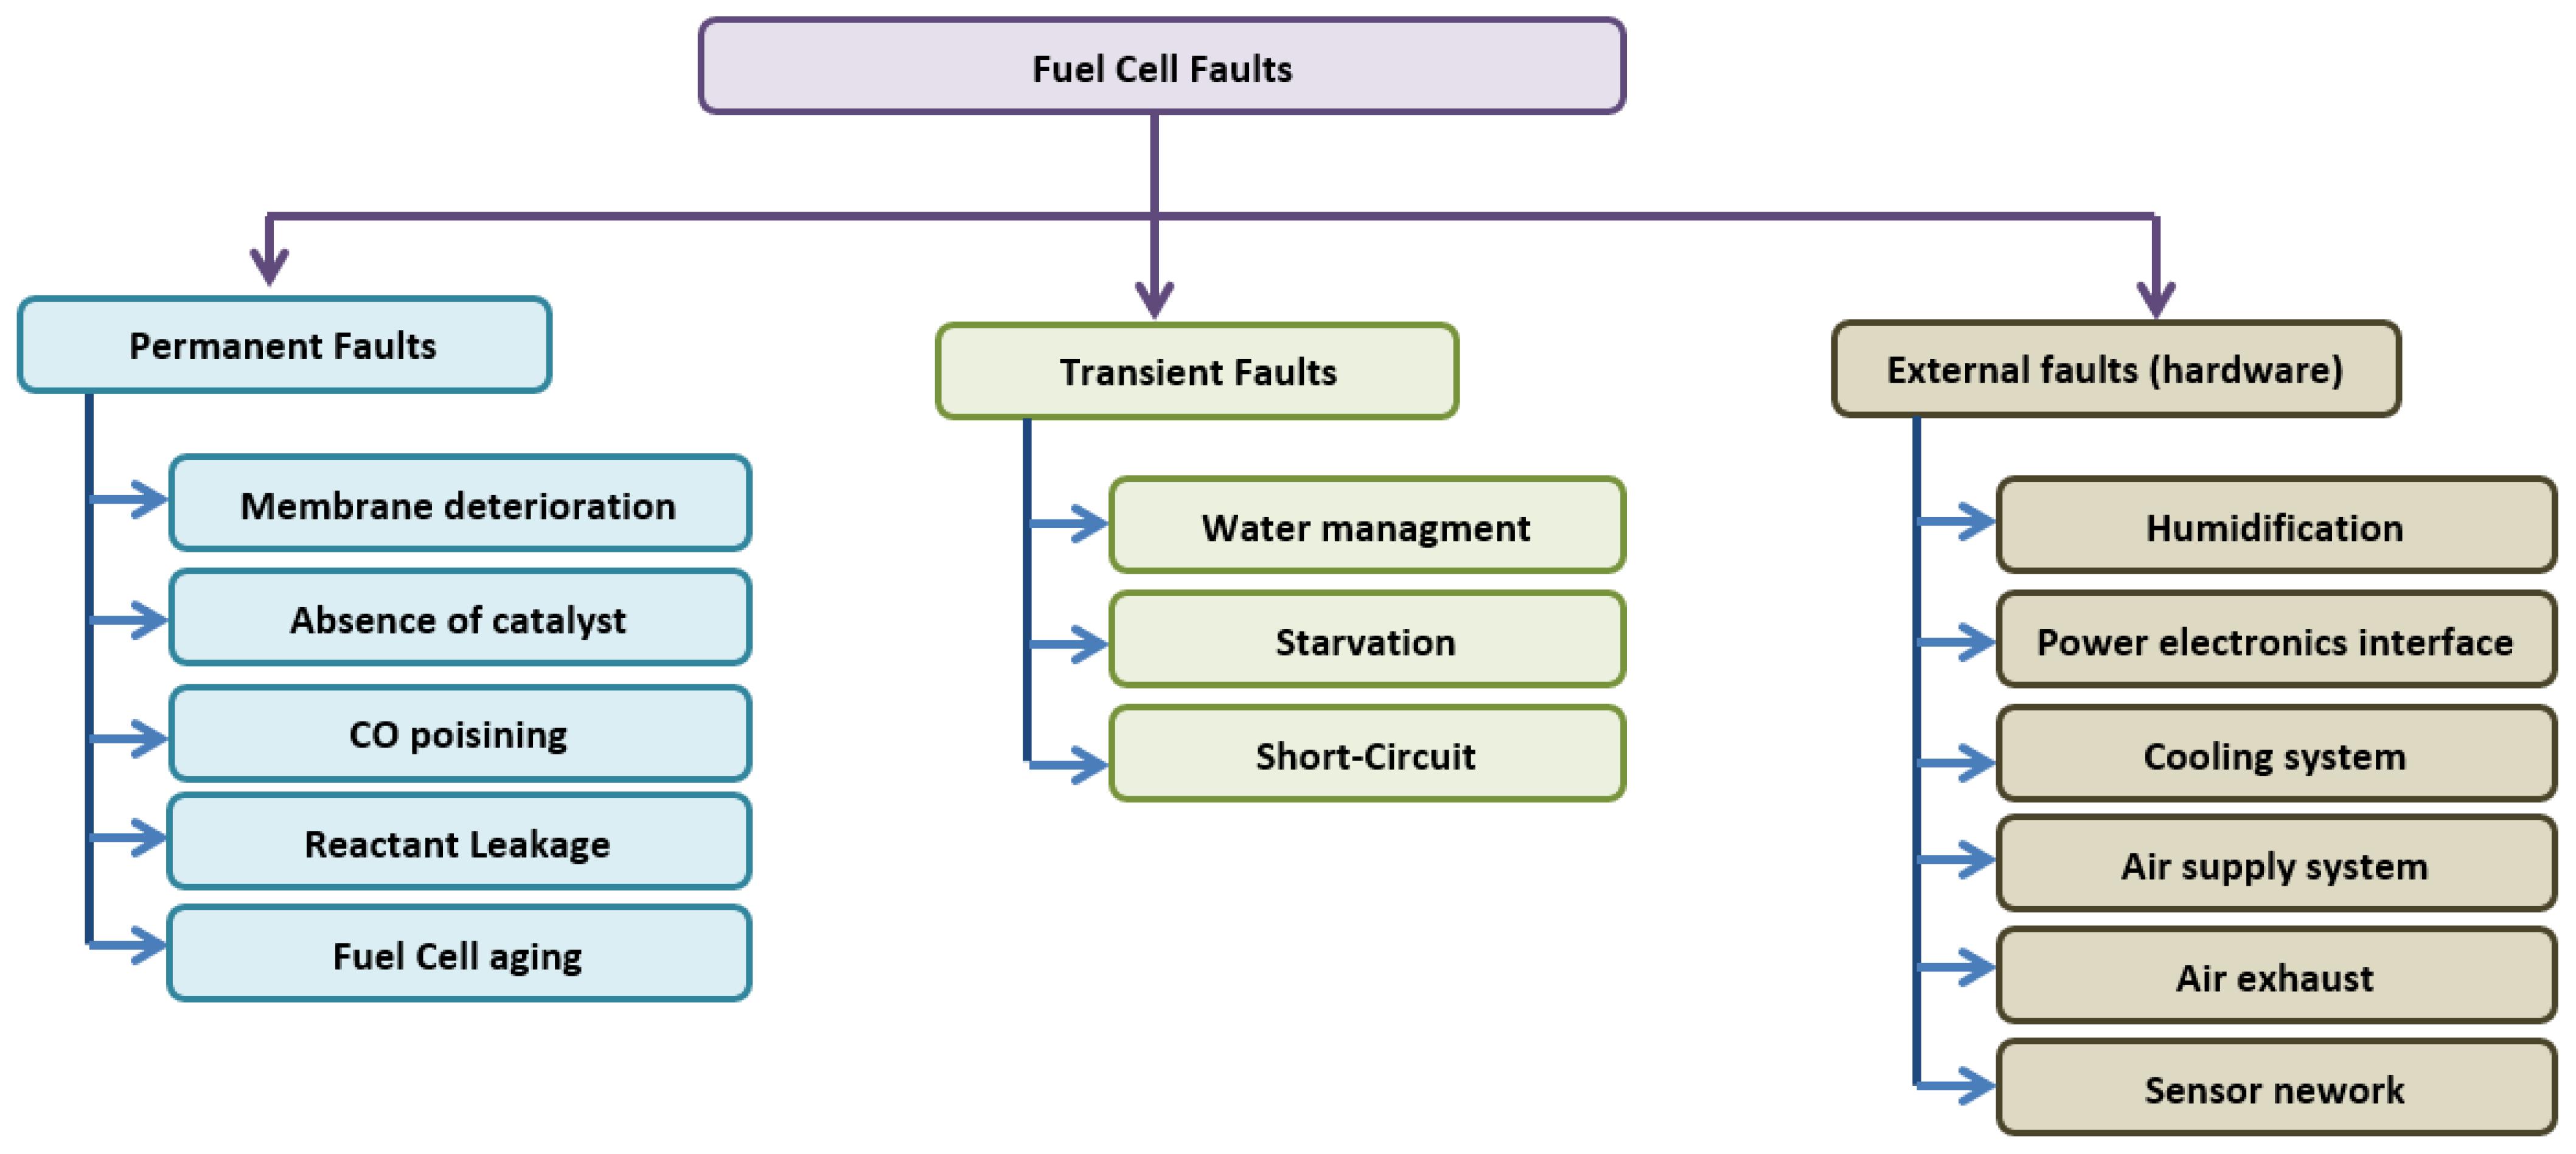
5. Fault Diagnostics

A fault may be defined as the condition of an equipment, material, or system, characterized by the termination of the ability to fully perform the required functions [62]. It can be categorized into three main classes: catastrophic—characterized by a sudden occurrence and involving the total and immediate stoppage of the functions performed until then; evolutionary—associated with a gradual development and affecting, at first only partially, the performance of the functions; and finally, intentional—deliberately caused and involving the interruption of the performance of the functions, regardless of the registered condition [62].
The identification of this abnormal condition is a critical and necessary task to endeavor to: first, restore the natural order of the system, and second, improve the reliability, as well as the feasibility. In that regard, it is desired to apply diagnosis tools to identify the fault when it is at the beginning of the evolutionary state [62].
Being a multi-physics system with complex hardware, FCs are susceptible to the occurrence of faults. Ref. [63] classified FCs’ faults in terms of their severity, identifying three types: the first, denominated as fatal (or permanent), which occurs mostly on the physical structure of the FCs and are irreversible, causing permanent damage to the FCs; the second, referred to as transient, is normally associated with FCs’ operating conditions or control strategy. They are characterized as being reversible if detected in a timely manner. Finally, the third classification is termed external faults. This classification occurs mostly in any system that is adjacent to the FCs, such as the humidification or cooling system, air supply system, or even sensor network. To classify the faults’ reversibility, the determining factor is not only reliant on fast identification of it but also on the level of redundancy within the system.
The next subsections will meticulously examine the different faults, via a careful examination of different symptoms, behaviors, and consequences for the different severity classifications. Moreover, different diagnostic techniques will also be introduced and evaluated for each fault.
Following the classification of FC faults introduced in [63], Figure 9 introduces the different faults and their severity classification.

5.1. Permanent Faults

Membrane deterioration is typically the catastrophic result of a transient fault that involves drying the membrane with consequences such as small cracks that appear in the membrane [64,65]. Normally, this fault is a result of the longer exposure duration to the transient fault and involves significant alteration in the pressure gradients between the cathode and anode channels [63].
Several diagnosis methods have been introduced in the literature, particularly in [66], where two different strategies are described. The first is not directly related to membrane deterioration but rather to the evaluation of the equivalent model parameters under faulty conditions, which inevitably will result in membrane failure if no action is taken previously. The second approach involves a static approach through the available information on each membrane of the stack to detect and adequately identify patterns of the fault such as membrane deterioration, flooding, and drying [66]. It was concluded that the pressure drop between the cathode and anode is suitable for identifying membrane deterioration since for this particular fault mode, it is the only parameter model that suffers significant changes [66].
Another method employed was reported in [67]. It was concluded that it is possible to access the working condition and identify fault occurrence by placing three high-load resistances in parallel with the stack and its individual cells. On one hand, the power–load resistance curve can be compared with the one provided by the manufacturers, working in the same operating conditions, and identify the fault. On the other hand, by repeating the same process for the individual cells, it is possible to pinpoint which ones are in faulty operation and discriminate which fault is occurring. It was also added that, if the output voltage of a single cell is really close to zero for the three different high-load resistances, the membrane is completely deteriorated, while if the output power of a single cell decreases with the decrease in the load resistance, then the porous layer of the single cell is gas-blocked or is clogged up by excessive water. Finally, if the opposite occurs, the active surface of the catalyst is either corrupted or physically damaged. Even though the experimental results on a 12-cell stack validated the proposed hypothesis, some concerns are to be pointed out. One of them is the impracticability of the proposed method for a numerous-cell stack since it requires a considerable amount of time to individually test all cells. To avoid this problem, the authors in [68] identified three control groups in a 20-cell stack and measured the voltage for each group to identify and categorize the fault. This method is focused on flooding or drying of the membrane, which is the prolonged pre-fault state of membrane deterioration. This method will be better explained in the water management section.
Another important technique to identify faults in FCs is the EIS; nevertheless, it faces several limitations for numerous cell stacks because of the technological limitation of the electrochemical spectrometer [63]. To cope with this limitation, the authors in [69] developed a new spectrometer that allows large FCs to be tested under different conditions, especially in extreme conditions of the membrane, such as high membrane permeability or a reduced active surface layer [63]. Experimental results were able to accurately highlight several behaviors of single cells inside the stack and were capable of identifying and quantifying hydrogen crossover in different cells, concluding that there is a minor variance between the FCs’ membrane permeability and the sum of the crossover rates measured for each individual cell. Even though this is not an online diagnostic method, its main disadvantage is the high production cost of the improved spectrometer.

5.1.1. Absence of Catalyst

This fault is characterized by a reduction in the catalyst’s active layer, which can be caused by excessive water content or physical damage to the catalyst layer itself [63]. Moreover, the degradation of fuel cell catalysts not only encompasses physical damage but also involves chemical aspects, including the dissolution and precipitation of active sites on the catalyst surface, as well as the oxidation and reconstruction of the catalytic surface [70]. Often the same diagnostic techniques used for membrane deterioration can be applied to this fault; for example, in [67], it is noted that if the output power of a single cell increases with the decrease in the load resistance, then it is safe to assume that the active surface of the catalyst is damaged, but its origin is not identified [63,67].
Another degrading agent of the active catalyst layer is the different strict conditions in which the catalyst surface must operate, especially for a high level of humidity and a high operating temperature [71]. The active catalyst layer is also affected by the long operation hours, which causes a continuous decrease in the electrochemically active catalyst surface area. Experimental results were presented in [72], where a reduction of 20% of the catalyst active surface layer for the same open-circuit voltage was observed after the FC was continuously operated for 2000 h.
Carbon corrosion is a phenomenon known for decreasing 60% of the cathode layer’s thickness, and in consequence, reducing the overall active layer, meaning that there is a high exchange current density and, as a result, a high activation overpotential [71]. Usually, carbon corrosion occurs when the cell cannot produce either enough electrons or protons to complete the electrochemical reaction, and therefore portions of the catalyst support layer (mostly PT particles) are forced to react to balance the equation, resulting in severe and irreversible cell damage [73,74]. The causes are usually related to local fuel starvation, uneven current and fuel distribution, increased humidity, or excessive temperature [74,75]. More specifically, ref. [76] identified that carbon corrosion is the main consequence of anode flooding, while ref. [75] emphasized the poor distribution of fuel and exaggerated fuel starvation.

5.1.2. CO Poisoning

Carbon Monoxide (CO) poisoning is related to the purity of hydrogen being supplied to the anode side of the FC [75]. When FCs are supplied with impure hydrogen, the hydrocarbons will react with the platinum anode catalyst surface, which will reduce the active surface; therefore, a performance loss will occur [77,78]. This phenomenon is dependent on the gas content, flow rate, humidity, temperature, and time of exposure [75].
The reversibility of this type of fault is very dependent on the time of exposure. In fact, [75] identified that hydrocarbon poisoning is one of the faults with a longer response time, between 1 s and a day depending on the level of impurity content present in the fuel.
As a recovering mechanism, in [79], air bleeding was used. Initially, a 25 c m 2 single cell was supplied with hydrogen pre-mixed with 53 parts per million (ppm) of CO. After less than 20 min of testing, the current witnessed an 80% loss of its nominal value. The authors were then able to recover, in less than 1 min, 90% of the nominal value by air bleeding the anode with 5% of air mixed with the contaminated hydrogen. This procedure shows great success because the content of oxygen in the fuel mixture will oxidize with the CO and deposited onto the catalyst surface, generating C O 2 , which is then expelled, reactivating the active surface layer [79]. This study also presents a transient model to estimate the current reduction due to CO poisoning and estimate the correct amount of air required for a successful recovery.
For open-cathode FC, the presence of pollutants, such as sulfur dioxide, in the atmospheric air can cause similar problems as the one previously explained. To combat and reduce the effect of such pollutants, two distinct methods can be applied: either filter the sucked air or perform cyclic voltammetry [80].
EIS can be employed to diagnose CO poisoning as shown in [81]. A mixture of hydrogen with 100 ppm CO was injected into a 23 c m 2 single cell and carried a frequency sweep from 10 kHz to 0.050 Hz. Experimental results showed an inductive behavior for frequencies below 3 Hz caused by CO poisoning. This is due to the reduction in the active surface layer, leading to a competitive process between the oxidation of hydrogen and carbon monoxide at the anode [75,81]. This inductive behavior is more and more noticeable for long-duration exposure to CO poisoning [75,81].
The authors in [82] also used EIS to detect CO poisoning. They compared two identical FCs with different CO compositions (50 and 100 ppm), and at the beginning of the experimental tests, both cells presented the same voltage of 0.72 V. After the initial minutes, the one fed a higher ppm of CO showed the firsts signs of poisoning by having its voltage dropped to 0.34 V, while the second cell took almost 60 min to have its voltage reduced to 0.41 V. Nevertheless, after the immediate drop in cell voltage, the results showed that the cell reached a stable value [82]. Regarding the EIS test results, the impedance increased for frequencies lower than 100 Hz, showing an impedance magnitude value 6 times higher than the normal one for the lowest frequency [82]. The same inductive process reported in [81] was also seen in [82]. Other solutions to mitigate the effects of CO poisoning can be found in [83,84], where the authors increased the operating temperature of the FCs to mitigate this effect. Although the method proved to be efficient, it can cause other problems arising from the excessive operating temperature. A more advanced solution is described in [85], where a high-power converter was used to send a pulsing current of a specific amplitude and low frequency, which creates an overpotential at the anode to force the CO to electro-oxidize into CO2, thus liberating the active surface layer from the irrigated CO. Experimentally, a 50% power gain was obtained when a cell was fed hydrogen and CO at 500 ppm [75,85]. Typically, this fault is more common when the hydrogen production process involves the use of fossil fuels as a main source. Even though the risk still exists, in today’s context, the use of green hydrogen virtually eliminates the threat of contamination from hydrocarbons. The focus regarding catalyst poisoning shifts to the cathode side, particularly in open-cathode fuel cells where the cathode side is susceptible to contamination from gases like sulfur dioxide present in the atmosphere, especially in more polluted areas.

5.1.3. Reactant Leakage

As the least dense element in the universe, hydrogen systems are prone to leakage. Normally, in relatively small quantities, it is harmless; nevertheless, hydrogen is flammable, with a colorless flame, and can be very volatile if confined to a non-ventilated space. In FCs, hydrogen leakage can occur in the supply system, cracked graphite plates, seal valves, or membrane cross-leaks [63,86].
Due to the aforementioned concerns, the authors in [87] began to study hydrogen leakages in a 1.25 kW FC, arriving at the conclusion that one parameter to take into consideration is the water vapor content in the anode, so FC manufacturers should not only implement mass flow sensors but also pressure and humidity sensors as well. The last one serves only the purpose of eliminating false alarms. The detection technique is based on a comparison between the model and the experimental values.
The authors in [88,89] used physical sensors to measure the open-circuit voltage of the stack’s cell and analyze them in different conditions. With these data, they were able to detect, in aged cells, hydrogen crossover between the anode and the cathode and between the anode and the cooling compartment. Although capable of locating damaged cells, this method will necessitate a substantial number of physical sensors for implementation in a stack with numerous cells. To detect hydrogen leakage between the anode and the cathode, the authors resorted to a signal-based technique where the amount of time for each cell to reach a predefined voltage level of 0.5 V after the hydrogen supply was cut off was measured [88,89]. After collecting the required data, they concluded that some cells reached the predefined value faster than others. Those that require more time to reach the predefined voltage present less probability of presenting hydrogen leakage between the two electrodes. To ensure the correct detection of the fault, a probability curve is calculated. In the second approach to anode/cooling hydrogen leakage, the relationship between the reactant gas flow and the water level in the expansion vessel was calculated [88,89]. Unfortunately, this technique is more complicated to implement on an open-cathode FC because, usually, a cooling compartment is not necessary.
Another work, involving reactant leakage, used a well-established computational model and included different faults, such as air leakage. To diagnose the fault, relative fault sensitivity of the different faults has been used [90,91,92].
Using model-based methods, in [93], six different faults were diagnosed, including air leakage, by calculating residual sensitivity parameters to distinguish the faults. After that, a theoretical matrix was developed, with the sensitivity parameters in the rows and the faults in the columns [93].
An online fault monitoring was developed in [94]. The hydrogen leakage is identified through an abrupt variation of the hydrogen pressure controller and the hydrogen mass flow meter. They used this approach because hydrogen leakage is normally associated with cracks or fractures in the membrane caused by temperature hot spots and mechanical stress when the FC is operated under dynamic load operation.
Other works that also involve hydrogen mass flow and pressure sensors are summarized in [10]. They analyzed the flow rate at different points in the pipeline and combined that information with the output power of the stack. Cooling pipe leakage has also been reported in water-cooled stacks, which is noted by an abrupt increase in the internal humidity of the FC.
Reactant leakage, especially hydrogen leakage, may have originated from a fault in the injection system or from a consequence of membrane deterioration. The latter is a tragic consequence of poor water management of the cell. Therefore, to identify and then isolate hydrogen reactant leakage faults, the techniques should focus on mass flow rate and pressure variation between the injection system and anode intake. Some authors might consider hydrogen leakage a transient fault; however, in the present work, hydrogen leakage is considered a reactant problem, which can be the result of a cracked membrane and is considered the most extreme permanent fault in FC.

5.1.4. Fuel Cell Aging

The aging of the materials in the FC is inevitable; every material is limited to several working cycles and operating conditions. Considering this, several works are presented in this subsection.
In [95], EIS was employed to provide information on the dynamic behavior of the FC operating time and its remaining lifetime, and then combine it with a pattern recognition tool. This tool used an empirical model to extract and track the evolution of the polarization curve, and, at the same time, a latent regression model was used to split the imaginary part and approximate it by polynomials. Experimental results were able to predict accurately the ageing trajectory, obtaining an error of 21.4% on 1000 h operated FC, and after perfecting the proposed tool, the error decreased to 9.5%.
Both the pattern recognition and EIS tools continued to be improved in [96]. With the new models and improved EIS techniques, the reported error was reduced to only 2 h out of the 1000 h.
The ripple content caused by the power converter can have a negative impact on FC aging; nonetheless, the real impact on the FC is not well understood at this moment. For example, the authors in [97] studied the effect of high-frequency ripple currents on a five-cell stack. The simulation results showed that the current ripple does not have a significant impact on local conditions; however, the model used was very rudimental, and other different parameters must be considered to understand the effect of ripple on an FC. In opposition, ref. [98] stated that the current ripple in the FC causes an unbalanced heat distribution in the FC, which leads to the occurrence of hot spots, causing faster degradation.
The current ripple has also been used to assess the state of health of the FC: in [54], the ripple was used to calculate the internal resistance of the FC. The authors were able to use the simple Ohm’s law recurring for the voltage and current ripple because the equivalent electric model of the FC for high frequency is reduced to the internal resistance of the FC. Another study [55], which used the current ripple, showed that it is possible to resort to the oscillations introduced by the power electronics converter, in particular the buck and buck-boost, to estimate the parameters involved in the activation zone of the polarization curve.
Analyzing the evolution of FC aging also implies that one must submit the FC to extreme conditions. One of the first studies considering FC aging is presented in [56], where two types of aging constraints were exploited. On the one hand, the stack was studied for steady-state operation for a 1000 h duration time, while on the other hand, the stack was operated for a cyclic load for the same duration. EIS and Nyquist plots were used to study the effects.
In [99], two different aging tests were conducted: the first submitted the FC to an extreme temperature of 300 °C and analyzed its polarization curve after 24 h. The experimental results showed increased degradation from the nominal polarization curve. The activation losses and the ohmic losses seem to be the ones that suffered from the severe influence since the mass concentration losses are not visible in the results. In the second test, the FC was submitted to 24 h operation at over the limit current, meaning that there is an excessive water content being produced at the cathode. Overall, these two tests suggest that excessive temperature and current can cause severe aging in the FC.
FC aging depends not only on the conditions in which the FC operates but also on the dynamic cyclic load operation. Accelerated aging can only be prevented if control of all the systems is optimized or if the lifetime expectancy of the different materials is also improved. Regarding the former, optimizing the hydrogen intake system, cooling system, water management system, and power converter efficiency must be the engineers’ main focus.

5.2. Transient Fault

Transient faults are related to the currently operating state of the FC and the control system. Their feature is their reversibility; nonetheless, as stated in the previous subsection, most of the identified permanent faults have their origin in a transient fault, especially those related to water management.

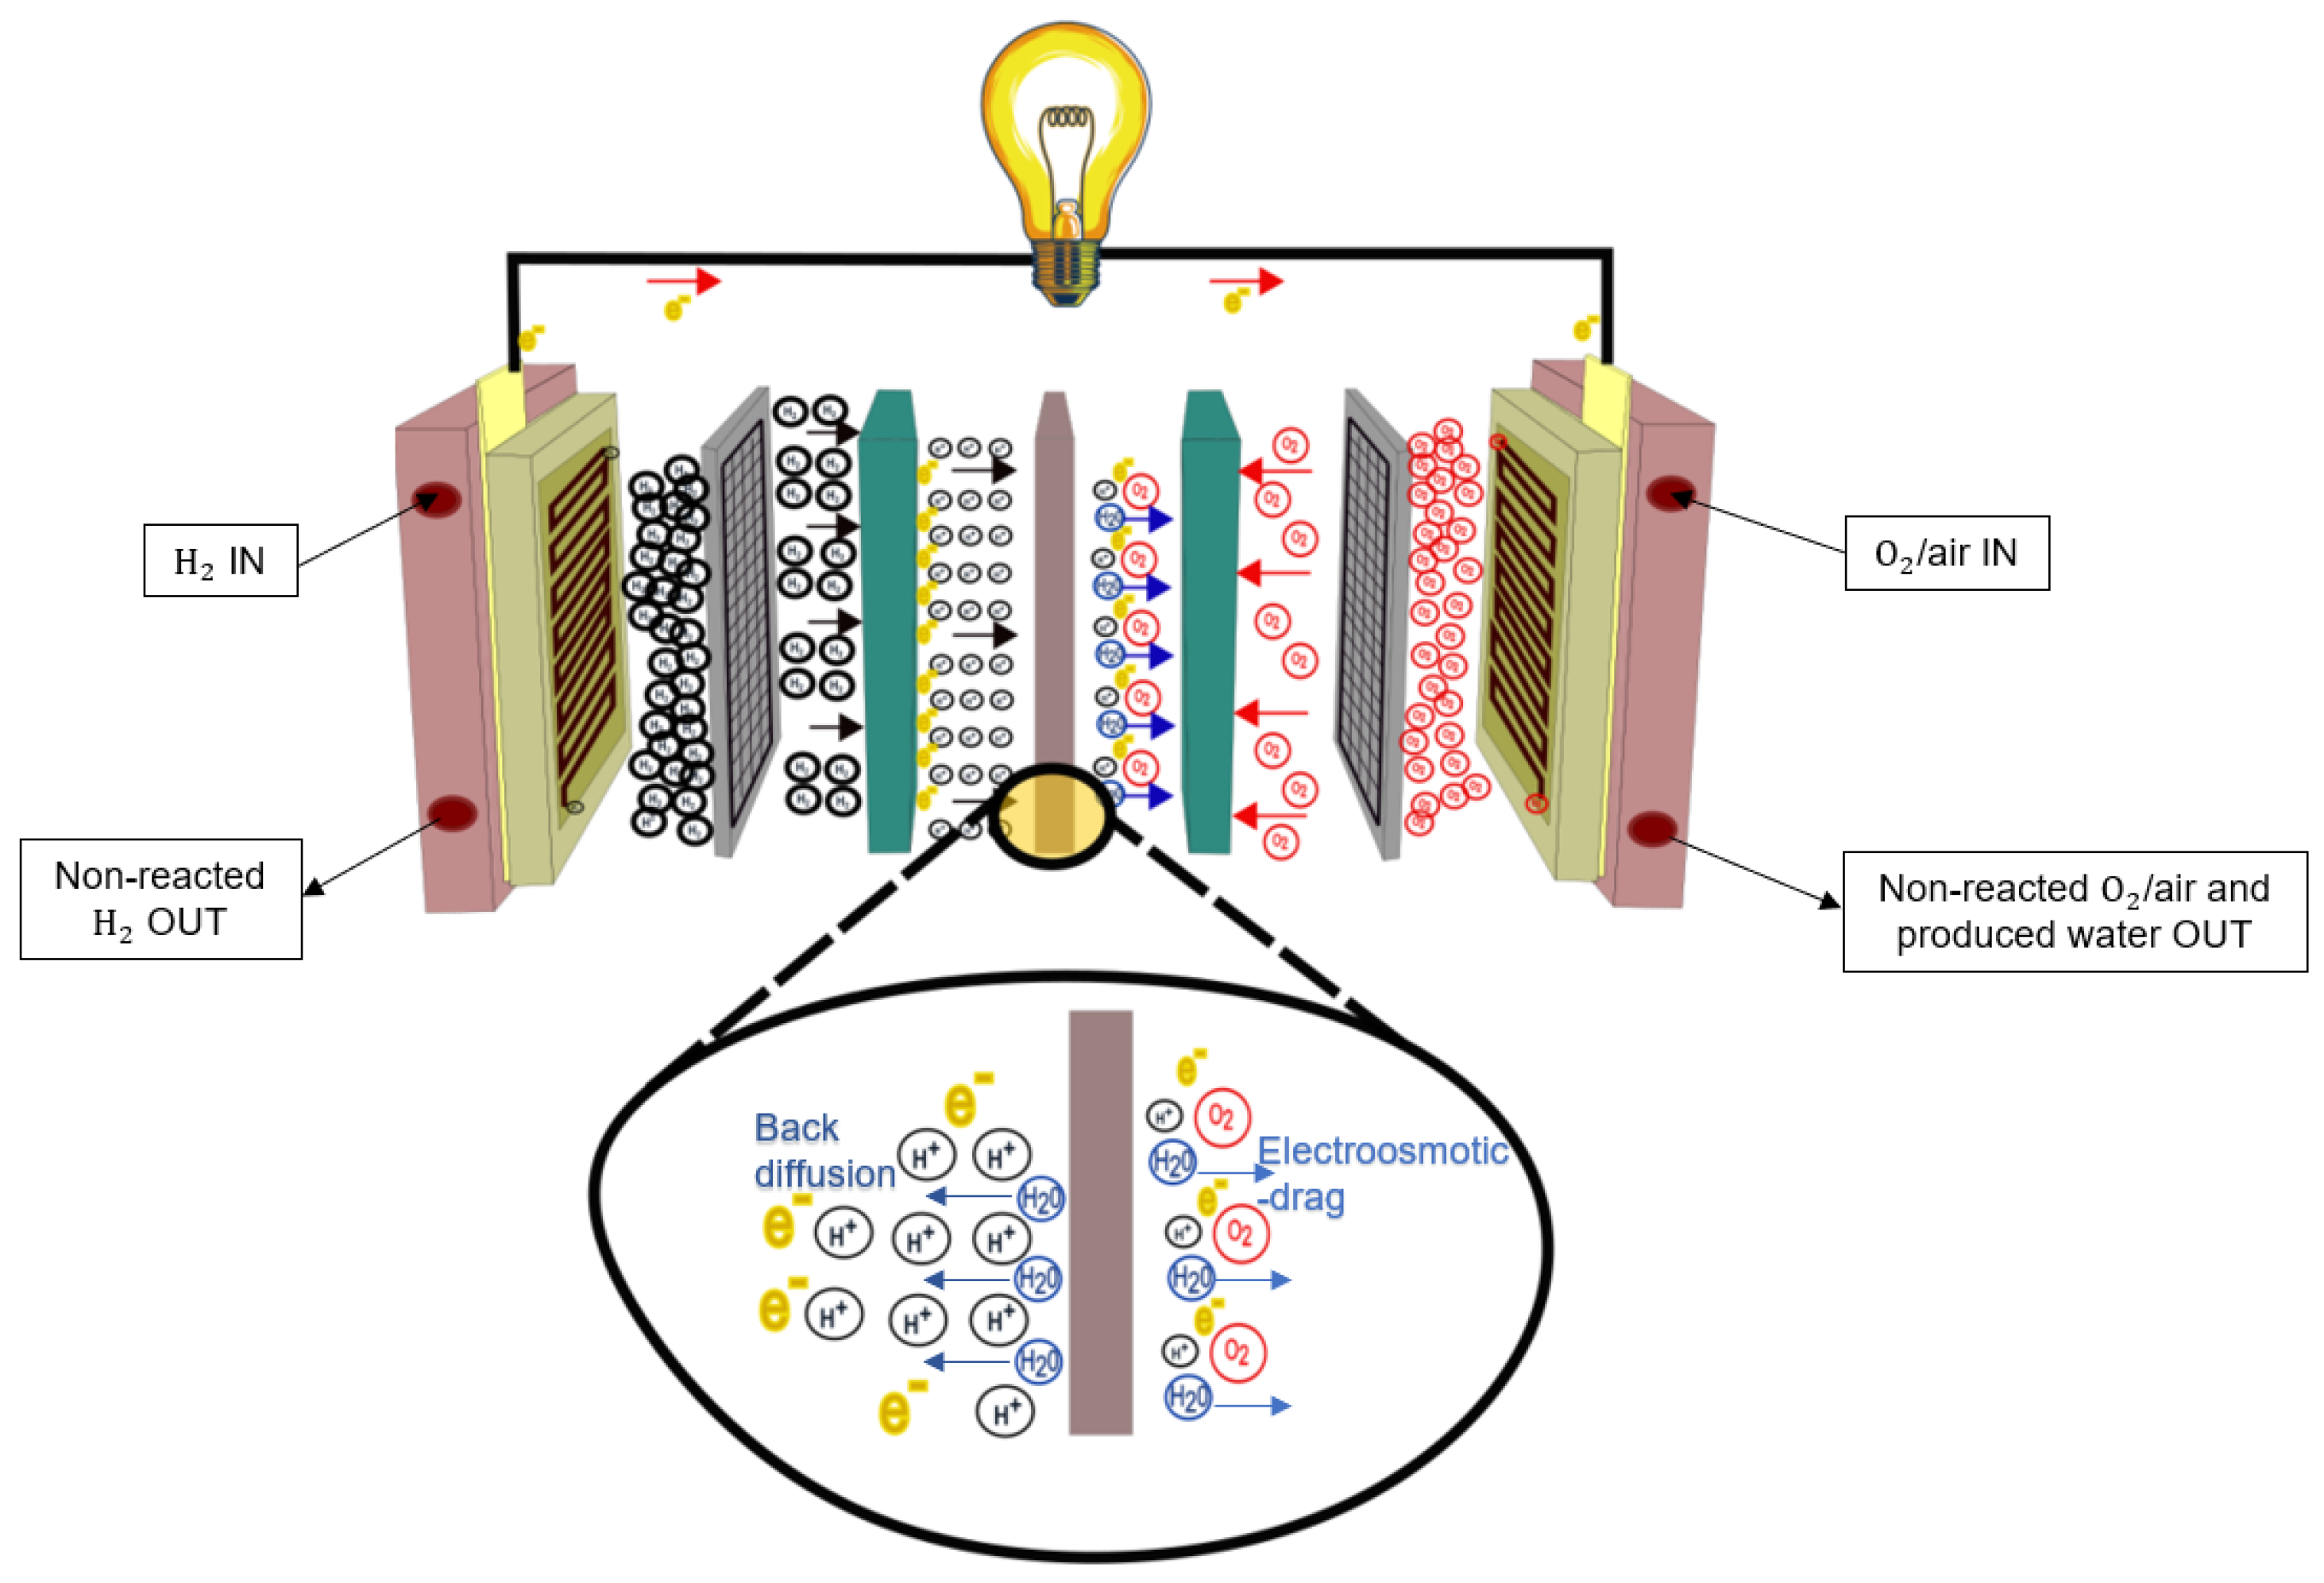
5.2.1. Water Management

Concerning water management, two major concepts must be mentioned, and they are drying and flooding. The former is characterized by the lack of water content in the membrane, while the latter is the opposite, namely, the excess water content inside the membrane [100]. If the water content inside the cell is not optimized, the protons, which are moving through the hydrated parts of the membrane, cannot successfully cross the protonic membrane. Furthermore, the clear sign of this fault is a decrease in the electric power, but other symptoms are not shared, such as the case of a pressure drop at the cathode, which is only noticeable for flooding [101].
  • Cell design (GDL effect)
It is undeniable that the water content inside the PEMFC has been the major focus of FC engineers and researchers over the past 20 years, with early work dating back to the 1900s; for example, in [102], the water movement inside the stack was analyzed for the first time. As is represented in Figure 10, it is named electro-osmotic drag when the water moves across the electrolyte membrane from the anode to the cathode and back-diffusion transport for the opposite water movement [103]. The goal was to determine the water content and how it correlates with proton conductivity in Nafion membranes for open-cathode FCs and closed-cathode FCs.
Following the previous work, ref. [104] started to look for water management techniques that could improve the efficiency of the stack. For that, experiments were conducted on an SOFC, and several water management solutions were identified such as system design (especially MEA design), stack operating conditions, and external hardware accessories. It was identified that the operation of the cell at high current density is related to the optimal operating point. This point is also correlated with the maximum generation of water. To show this effect, the authors experimentally obtained the polarization curve with and without the water management control technique. The results showed that the greater benefit of applying such control is obtained at high current densities. Even though the MEA design reconfiguration technique showed promising results, the authors also stated that this alone will not be sufficient to guarantee the proper optimal operation in different conditions. Therefore, new methods are to be explored to improve the efficiency of MEA design reconfiguration.
Following the MEA design and the determination of how materials can improve the performance of the FC, poly tetrafluoroethylene (PTFE) coating was first mentioned in [105]. This method has been used since then and it consists of implanting microspheres of this hydrophobic material on the surface of the electrode; in this way, any excess water content is repelled, therefore mitigating the effect of excess water. Moreover, the authors in [106] compiled several studies that show the benefit of coating not only the electrodes but also the treatment of the GDL and the catalyst layer. The identified advantages showed a better distribution of the reactants in the membrane, an enhanced mechanical compatibility between layers, an improved local current distribution, and an efficient wicking of the liquid water [107,108].
The authors in [109] also followed this line of thought and studied the influence of anode GDL wettability on water balance on the anode side. Typically, the anode side does not generate water; nonetheless, due to the back-diffusion phenomena, water can be present on the anode side causing catastrophic consequences, such as carbon corrosion. To access the anode side, a transparent polycarbonate plate was placed outside of the anode current collector, so it was possible to take optical pictures. Two treated GDL membranes, one with hydrophobic PTFE and the other without any treatment (causing it to be hydrophilic), were used at different current densities, such as 0.2, 0.5, and 0.8 A / C m 2 ), at different hydrogen flow rates and temperatures. The first experimental results were taken after 60 min of exposure to the different conditions. Related to the hydrophobic GDL, water droplets were observed for low current densities (0.2 A / C m 2 ), but clogging was not observed because the exposure time was too short. When repeated for higher current densities, no water droplets were observed on the anode, meaning that anode flooding is more prone to occur at low current densities. Furthermore, to access the effect of doping the GDL, a lighting technique was used, and the results showed that, despite having water droplets on the anode side, the GDL did not present any sign of it, meaning that the water content was a result of water condensation on the channel surfaces. That could be mitigated if the hydrogen intake is increased slightly or if the temperature is also increased. The clogging phenomenon was registered after repeating the experience with a longer exposure time (2 h) for the lowest current density value. This is due to the fact that the hydrogen flow rate is too low to be able to remove the water droplets. All in all, the paper presents a relationship between the water content on the anode side and the current density, concluding that anode flooding can be prevented if the FC is operated at higher current densities levels or if the plate’s temperature is discreetly increased. Another work focusing on the GDL influence on anode flooding is presented in [110]. The authors varied both reactant humidity and gas composition on four different commercially available GDLs. To compare the different GDLs, different humidity levels were introduced to the reactants at a constant current. The findings demonstrate that a decrease in the humidity levels results in a decrease in the overall efficiency, which is explained by the increase in the membrane resistance. Overall, the paper concludes that for low levels of inlet humidity, membrane humidification is affected, while cathode flooding is also dependent on the inlet humidity level.
The accumulation of water droplets in the flow channels of the flow field can cause blockage of the reactants on the electrodes, causing an increase in the concentration loss, and therefore reducing the overall efficiency of the FC. To avoid that, a new diagnostic method was proposed in [111]. The idea is to analyze the frequencies present in the pressure drop across the flow channels resorting to frequency analysis through Fast Fourier Transform (FFT). Although the pressure drop signal itself can be used for the identification of flooding in the cell, it is severely affected by high air flow rates. The findings reported that peaks higher than 1 Hz in the dominant frequency are an indication of water removal in droplets, meaning that most of the water is still inside the cell, while lower peaks, ranging from 0.3 to 0.8 Hz are more characteristic of water removal in the form of a stream, therefore representing better removability of water. Furthermore, the magnitude of the dominant frequency peak was also reported to be an indication of the water droplet size. Despite showing promising results, the technique requires at least one sensor (per individual cell) inside the cell, which adds complexity to the design of the cell. Also, the technique has only been tested on a single cell with low current densities, so it needs further development.
To properly manage water movement in the PEMFC, an optimal point between adequate membrane hydration and avoidance of water at either the catalyst layers or GDL must be obtained. This point is typically obtained by externally humidifying the reactant before entering the stack; however, for certain operating conditions, such as low temperatures, high humidification levels, or high current densities, it can cause the inside of the cell to become oversaturated with water vapor and condensation is likely to happen, blocking the active layer of the catalyst. GDL itself represents a critical component, which requires proper design. Ref. [106] presents a summary of the effects of flooding in GDL and their main functions, like access to reactant gases, water removal, electronic and heat conductivity, and mechanical strength [106].
  • Flooding/drying
The first experimental test concerning the evaluation of water distribution in the anode as a function of temperature and current density was presented in [112]. The authors changed the back plate of the cathode to be able to perform infrared spectroscopy. Experimental results were performed on an open-cathode FC with an active cell area of 2025 m m 2 at three different levels of air flow rates. At the lower level of air flow rate, the current produced was 3.8 A with a mean temperature of 36.2 °C, and the results showed that the regions with a higher water content presented a higher temperature than the non-flooded area. For the inter-medium level of the air flow rate, the current drawn was 4.7 A, and flooding was only observed in the middle cells. Once again, the same results regarding temperature distribution can also be observed, and regions with higher flooded areas present a higher temperature. Finally, for the extreme level of air flow, the current drawn is 5.5 A. Surprisingly, the results showed no presence of water or at least no signs of flooded channels. The authors tried to find an explanation for this phenomenon by guessing that it could be a measurement error or a consequence of high-temperature gradients resulting from the high current densities, which hinder water’s condensation. This last argument is supported by the registered temperature of 37.5 °C. Referring to the use of neutron imaging to understand the phenomenon of cathode flooding, the authors in [52] concluded that this process is initially caused by water droplets retained at GDL, which evolve to a critical point and then water flooding occurs. A similar work can also be found in [53].
A more easy-to-implement technique was proposed in [113]. The authors identified and monitored the relationship between cathode pressure and internal cell resistance with the occurrence of flooding and drying. They concluded that an increase in the pressure drop, particularly in an open-cathode FC, is related to cell flooding, while an increase in cell resistance is an indicator of FC drying. Moreover, the correlation between these two parameters can be used in deciding on corrective actions. Experiments were conducted on a three-cell stack, and both a milliohm-meter and pressure sensors were employed to measure the internal resistance and the cathode pressure drop, respectively. To first verify the relationship between the cathode pressure drop and the mass flow rate with different humidification levels, tests were conducted with no current. The results show a linear relationship between these two parameters. Additionally, the pressure drop is higher for high levels of the cold air mass flow rate and even higher for air with 100% air humidity, with the current being drawn from the FC. Regarding drying, this phenomenon occurs when the humidification temperature decreases well below the stack operating temperature [113]. This can be observed by an increase in the pressure drop and the continuous increase in cell resistance.
Continuing with the cathode pressure drop for water management, other similar work was introduced in [114]. For that, a transparent PEMFC was used. The technique employed a pressure drop between the anode and the cathode to monitor the water accumulation. The increase in the pressure drop is a sign of excessive water content, while a sharp decrease corresponds to the expulsion of water content. With the theory verified through experimental results, it is possible to optimize the fan velocity for optimal water removal. The main conclusion defined that the velocity of air should never be lower than 2.3 and 5 m / s for 600, 1000, and 1200 m A / c m 2 , respectively. Although both works in [113,114] show concurring results and an easy-to-implement diagnostic tool, the pressure drop alone shows some drawbacks when confronted with load changes. When that happens, the hydrogen flow changes accordingly; thereafter, so does the pressure.
The conventional EIS has also been applied in several studies for the identification of drying and flooding faults [115,116,117]. A particular study using EIS, where a specified frequency occurred for identification of the flooding or drying, was presented in [118]. The experiments were conducted on a single cell with a 10 c m 2 active area with the admission of both pure hydrogen and oxygen. For the flooding state, the Nyquist plot showed an increase in both imaginary and real axes, as the water accumulated on the cathode side. At the same time, the real part of the graph started to increase, and the graph started to move slightly to the right while keeping the same format because of the increase in the membrane resistance [118]. Furthermore, as the level of water content in the cathode increased, the diameter of the semicircle changed due to the decrease in temperature. Regarding the drying state, similar experiments were conducted and the Nyquist plot results showed the appearance of another semicircle in the low-frequency region, which is followed by an increase in the magnitude of both imaginary and real axes [118]. Additionally, a negative slope in the magnitude response was reported, opposite to what was registered for the normal and flooding state; henceforth, authors concluded that it would be possible to establish a difference between the operation modes: the drying and flooding. Finally, an empirical model based on the electrical equivalent circuit was proposed, and a mitigation algorithm was defined. Although this was one of the first papers to identify and propose a mitigation algorithm, it did not identify only the fault, so no restoring mechanism of the state was implemented. Nonetheless, by independently controlling the power switches of the cascade connection between boost and buck converters, the authors prevented the occurrence of the fault and improved cell efficiency. The input current was controlled by the boost side of the converter, while the buck was responsible for keeping the output voltage constant. To improve the efficiency of the cell, a step change in the input current of 2 A, regardless of the actual current value, was performed every two minutes.

5.2.2. Fuel Starvation

The starvation phenomena may be a consequence of flooding but also may be caused by a defect in the reactant supply system. Nonetheless, starvation can occur on a local or global level if there is any kind of reactant undersupply [71]. Local starvation is typically associated with self-humidification techniques employed by FC manufacturers, which resort to an instantaneous short-circuit to humidify the membrane. In this case, there is an irregular supply of reactants, which causes starvation, but it does not affect the overall current to the load. Imposingly, global starvation is caused by a defect in the supply of one of the reactants, and therefore the power demand is not fulfilled [71,75].
Typically, starvation is more related to the cathode side, because normally, it is a result of a malfunction in the air-feeding system; regardless, the anode side can also be susceptible to fuel starvation. In fact, as concluded in [119,120], extreme hydrogen starvation has more catastrophic consequences than extreme oxygen starvation. In [119,120] a compilation of different works related to fuel starvation is presented. The authors identified that starvation is not only related to an external fault but can also be caused by the dynamics of the stack. For example, during sudden load changes or improper start-up conditions, hydrogen or oxygen starvation can occur. The slow dynamics of the stack, where the mass transfer cannot accompany the load change, is the cause behind the starvation. Regarding hydrogen starvation, it was noted that complete hydrogen starvation induces high potential, which leads to carbon corrosion, and mathematically, this is translated to the inequality between the hydrogen molar flow and the ratio between the current and the double of the Faraday’s constant. Moreover, when there is only partial hydrogen starvation, or local starvation, the current requirements are satisfied but the fuel distribution is not homogenous in the GDL. For this case, the mathematical expression is the same as the previous one, as long as the current per area of the stack is higher than the maximum current density.
The authors in [121,122] worked on global starvation caused by a malfunction in the air supply fan on an open-cathode FC. The consequences of such a breakdown will typically result in water accumulation on the cathode, which itself causes local starvation and reduces the air supplied, causing global starvation. The first case is simulated by an empirical formula that considers several parameters in the healthy state: the volume of water accumulated and an empirical constant that represents the electrode’s flooding. The second case is also simulated using an empirical formula, which represents the air stoichiometry for the healthy and faulty states. The employed algorithm is based on a Bayesian Network (BN) that considers several inputs, such as stack voltage and current, temperature, air flow, and accumulated water. Simulation results showed that when the air stoichiometry is reduced to values close to 1, the voltage and current undergo an immediate decrease until they reach a plateau. However, once the accumulated water parameter reaches a certain value (in this case, 0.05 L) or higher, both the current and voltage start to decrease exponentially. This is because the accumulated water starts to cause local starvation in the different cells of the stacks, meaning that the supplied reactants cannot react.
A different approach to this problem is reported in [123]. More focused on the output power of a single stack, several coupling strategies between small power stacks were conducted, creating a multi-system that the authors referred to as a multi-stack. The authors concluded that a series connection between stacks is advantageous, especially when paired with antiparallel by-pass diodes, which allow for fault tolerance if needed. The results showed good coupling between the two stacks, and when the fault was registered, the anti-parallel bypass diode strategy was able to bypass the faulty stack while ensuring that the load current remained constant. It is important to note that the starvation phenomenon is noted by a sudden voltage decrease. After some experiments to ensure the correct coupling between the stacks, an EIS test was performed. The results showed no significant difference between the healthy and faulty modes. No particular attention was given to this situation; however, it is safe to say that due to the time associated with starvation (as introduced in [75]), no immediate effect is measured. As previously mentioned, if starvation is not detected rapidly, it will lead to permanent damage, such as carbon corrosion. The continuation of the previous work is represented in [124], where the same principle is applied to a 500 W FC system, equipped with two 20-cell FC stacks. The experimental results proved to be congruent with what was initially foreseen, and a strategy to operate an FC system under degraded mode is validated.
In order to gain a deeper understanding of the impact of fuel starvation and develop accurate diagnostic tools, a comprehensive study was conducted utilizing EIS techniques [125]. These experiments were performed on an open-cathode FC composed of 47 cells with a nominal power and voltage of 1200 W and 26 V, respectively. For this FC model, hydrogen is supplied at a constant pressure of 9.5 bars, while oxygen is fed at atmospheric pressure. Concerning air stoichiometry, its reliance is on the ongoing current production. Subsequently, an excessively high value has the potential to dry the membrane or flood the cathode. Conversely, maintaining a low air stoichiometry can lead to air starvation. Hence, the authors considered two operating conditions: the first, where the stack current is operated at a constant value of 10 A, and a second scenario for a higher value of current equal to 30 A. After calculating the correct value of the oxygen stoichiometry for the first case, the authors proceed to the EIS under different values. When the stoichiometry falls below the recommended threshold, the data points exhibit increased fluctuations, causing expansion in the low-frequency loop. This expansion results in elevated mass transportation losses, potentially leading to cathode flooding or instances of local starvation. The interesting result appeared when the air-stoichiometry rate was increased to values double and triple that of the normal one. In these instances, the low-frequency mass transportation semi-loop diminishes, giving way to the anticipated semi-loop at high frequencies. This high-frequency semi-loop signifies the charge transfer process, and it is indicative of the drying phenomenon. However, no significant difference between the healthy and the faulty state was reported, meaning that this membrane is not affected by high air stoichiometry [123,125]. The second case represents similar results, and thus the same conclusions. The proposed diagnosis technique is similar to the one already explained for water management [126], based on fuzzy c-means clustering. The simulation results showed correct feature selection and extraction, but further implementation on a real FC is required to validate the proposed diagnosis tool.
Regarding the operating conditions at a high air stoichiometry ratio, the conclusions in [123,125] were not observed in [127]. In this last paper, the effect of high air stoichiometry on an open-cathode FC is accessed. Initially, a certain agreement between the mentioned works is obtained, with authors in [127] stating that for relatively higher air flow (almost double the proper value), the performance of the FC increased because the distribution of air is more homogeneous through the stack and, thus, more oxygen is available to react. Also, the excess air helps to exhaust any water droplet formation. However, when air stoichiometry increased to higher values, a significant decrease in the stack voltage was reported, and an increase in temperature of almost 2 °C was reported. The cause of such voltage degradation is explained by the drying conditions of the membranes caused by the excess of air; thereafter, normal conditions can be restored if the membrane is properly humidified. All in all, operating the stack at high air stoichiometry ratios can cause irreversible voltage damage. It was also observed that at high air stoichiometry, the pressure between the inlet and outlet differed because the outlet pressure decreased. Moreover, these degrading conditions can cause notable oscillations in the temperature and humidity. With that consideration in mind, the paper proposes a diagnosis method based on the Discrete Wavelet Transform. This signal processing tool is applied to the voltage and pressure signals acquired for the healthy and faulty state. After that, the high frequencies of the signal are analyzed through their energy and entropy content, which are generated to access the SOH of the FC system. To pinpoint exactly which cells are being most affected by the fault, three distinct input signals are considered: the air drop pressure between the inlet and outlet, the stack voltage, and the individual cell voltages. Experimental results showed the evolution of the energy and entropy of the high frequencies for different operating conditions.
The difficulties involved in measuring the amount of oxygen being consumed at the cathode side for an open-cathode Fuel Cell present one of the problems with actual air-feeding systems. To solve this, the authors in [128] inferred this variable using another variable, such as the case of the compressor’s air mass flow. This variable is more accessible and measurable. Furthermore, the theoretical value of the oxygen flow consumed can be calculated by using the stack’s current, the molar mass of the oxygen, the number of cells, and Faraday’s constant. Moreover, presenting an alternative way to refer to oxygen stoichiometry, the paper also presents a fault-tolerant technique to avoid starvation phenomena. The authors used a set number of controllers, also called Un-falsified Control (UC), where the control law is set depending on a set of input/output data. With this approach, they were able to control the oxygen stoichiometry rate while avoiding any faulty states. To achieve that, the control input is the theoretical value of the oxygen flow consumed and the compressor’s air mass flow, while the output is the compressor’s voltage. Several experimental scenarios were reported, for the faulty scenario several faults are considered, such as the case of flow blockage and flow leak. To identify the fault, a cathode pressure sensor is inserted, and its evolution is tracked for the different conditions. For the case of flow blockage, the cathode pressure increases, and the control increases the compressor’s voltage to restore to the normal value, while for the case of the flow leak, the cathode pressure was not affected, but rather the compressor voltage changed. Regardless of the case, the proposed switched control was able to regulate the oxygen flow to restore normal conditions. It is important to note that despite the cathode pressure being a valid parameter for the identification of oxygen starvation, it alone may infer misleading conclusions. As analyzed for cathode flooding, its pressure was also used and concluded that an increase in its measured pressure means that the cathode is flooded. So, for this case, the control might need to be readjusted to avoid flooding and not starvation. Another fault-tolerant control based on a modified super-twisting sliding mode is presented in [129]. Here, the control is dimensioned taking into consideration the dynamic behavior of the cathode partial pressure, the air supply manifold dynamics, and the compressor dynamics. The residual signals are generated by comparing the model’s output to the observers. After that, the observer is responsible for identifying the fault and the presence of external disturbances, and finally, reconstructing the system. Another similar work can be found in [130].
As stated in the present work, FCs can be fed pure oxygen or air, with the principal difference being the percentage of oxygen in each of those forms. Obviously, both require different cathode feeding systems and rely mostly on user choice. A comparison between the influence of cathode stoichiometry for the two cases has been assessed in [131]. The work intends to identify how the cathode stoichiometry level affects the stack’s performance. It is concluded that, for air-fed FCs, the assumed minimum stoichiometry level is 2. Even though this value is dependent on the temperature and current, according to the authors, it corresponds to a balance between correctness, efficiency, and economy of the FC when it is operated at the rated power [131]. For air-fed FC, the injected air also has the function of expelling water from the cathode. Conversely, it was concluded that on pure oxygen stacks, lowering the stoichiometry value as low as 1.25 would not cause any voltage degradation. Only when subsiding below 1.1 did some degradation appear in some cells. Despite the presented findings, there are several drawbacks: firstly, the duration of the experiment is not sufficient for water accumulation on the cathode side; secondly, there was no mention of load change, which is directly affected by air stoichiometry, and thirdly, lowering the stoichiometry ratio as the authors did will cause the stack to work as a “hydrogen pump”, which is because the protons that are migrating through the membrane are going to react with their electron pairs that had just flowed through the external circuit.

5.2.3. Short Circuit

Short-circuit conditions, also referred to as operation under high-current conditions, occur specifically on self-humidify open-cathode fuel cells. This system involves a frequent auto short-circuit with a duration of milliseconds that stimulates water production inside the stack. However, if not currently controlled, those conditions can cause irreversible conditions, such as melting of the electrodes and accelerated aging. Moreover, high current peaks, even during short periods of time, generate hot stops in the membrane and can cause water accumulation in the cathode [74]. Beneficial effects of short-term duration short circuits have been noted in [75]. The authors claim that the production of momentary large quantities of water reduces ohmic losses and cleanses the electrons’ active surface layer of any oxygen deposits, resulting in an overall increase in the system’s performance.
To assess the operation of the stack under both short-circuit conditions and high current densities, the authors in [74,132] analyzed the coupling behavior between a Fuel Cell and an Ultra-Capacitor (UC). The first experiment was conducted on a 3-cell stack FC with an open-circuit voltage of 2.64 V, while the UC voltage was very similar, with a value of 2.7 V. Initially, the UC was completely discharged, and the fuel cell current was measured. The charging current was approximately 80 A, and the FC was forced to operate in the concentration loss zone of the polarization curve. A similar experiment was conducted, but this time on a stack with 16 cells. The results showed that the FC voltage drop was not so abrupt, but the UC charging time was higher because of the UC’s higher voltage. A second experiment focused on the auto-humidified system was conducted. Despite showing an increase in the stack voltage, the EIS showed no significant difference between the cases with and without the auto-humidify system. Nonetheless, a more thorough analysis of the individual cell voltage showed that the cells further from the hydrogen inlet presented a high voltage drop during short-circuit conditions. This is caused by the slow dynamics of the FC and the challenge of hydrogen reaching cells farthest from the hydrogen inlet. Further studies on this effect are required since there was no mention of operating the stack with the auto humidification system and the UC, particularly during operation with subcritical loads.
In extreme conditions, short circuits can also occur within the cell’s electrodes. A phenomenon referred to as fuel crossover happens when either hydrogen or oxygen can penetrate the membrane, creating an internal leakage. Radicals of oxygen and hydrogen can be formed and corrupt the membrane’s structures, thus creating a short circuit. The authors in [120] were able to detect internal short circuits and hydrogen crossover by resorting to a well-suited Fuel Cell diagnostic tool, referred to as Linear Sweep Voltammetry (LSV). LSV is an electro-analytical method that measures the current at the electrode while its potential is swept linearly in time. When analyzing the results in the presence of an internal short-circuit, a positive slope above the swept value of 0.25 V was registered.

5.3. Hardware/External Faults
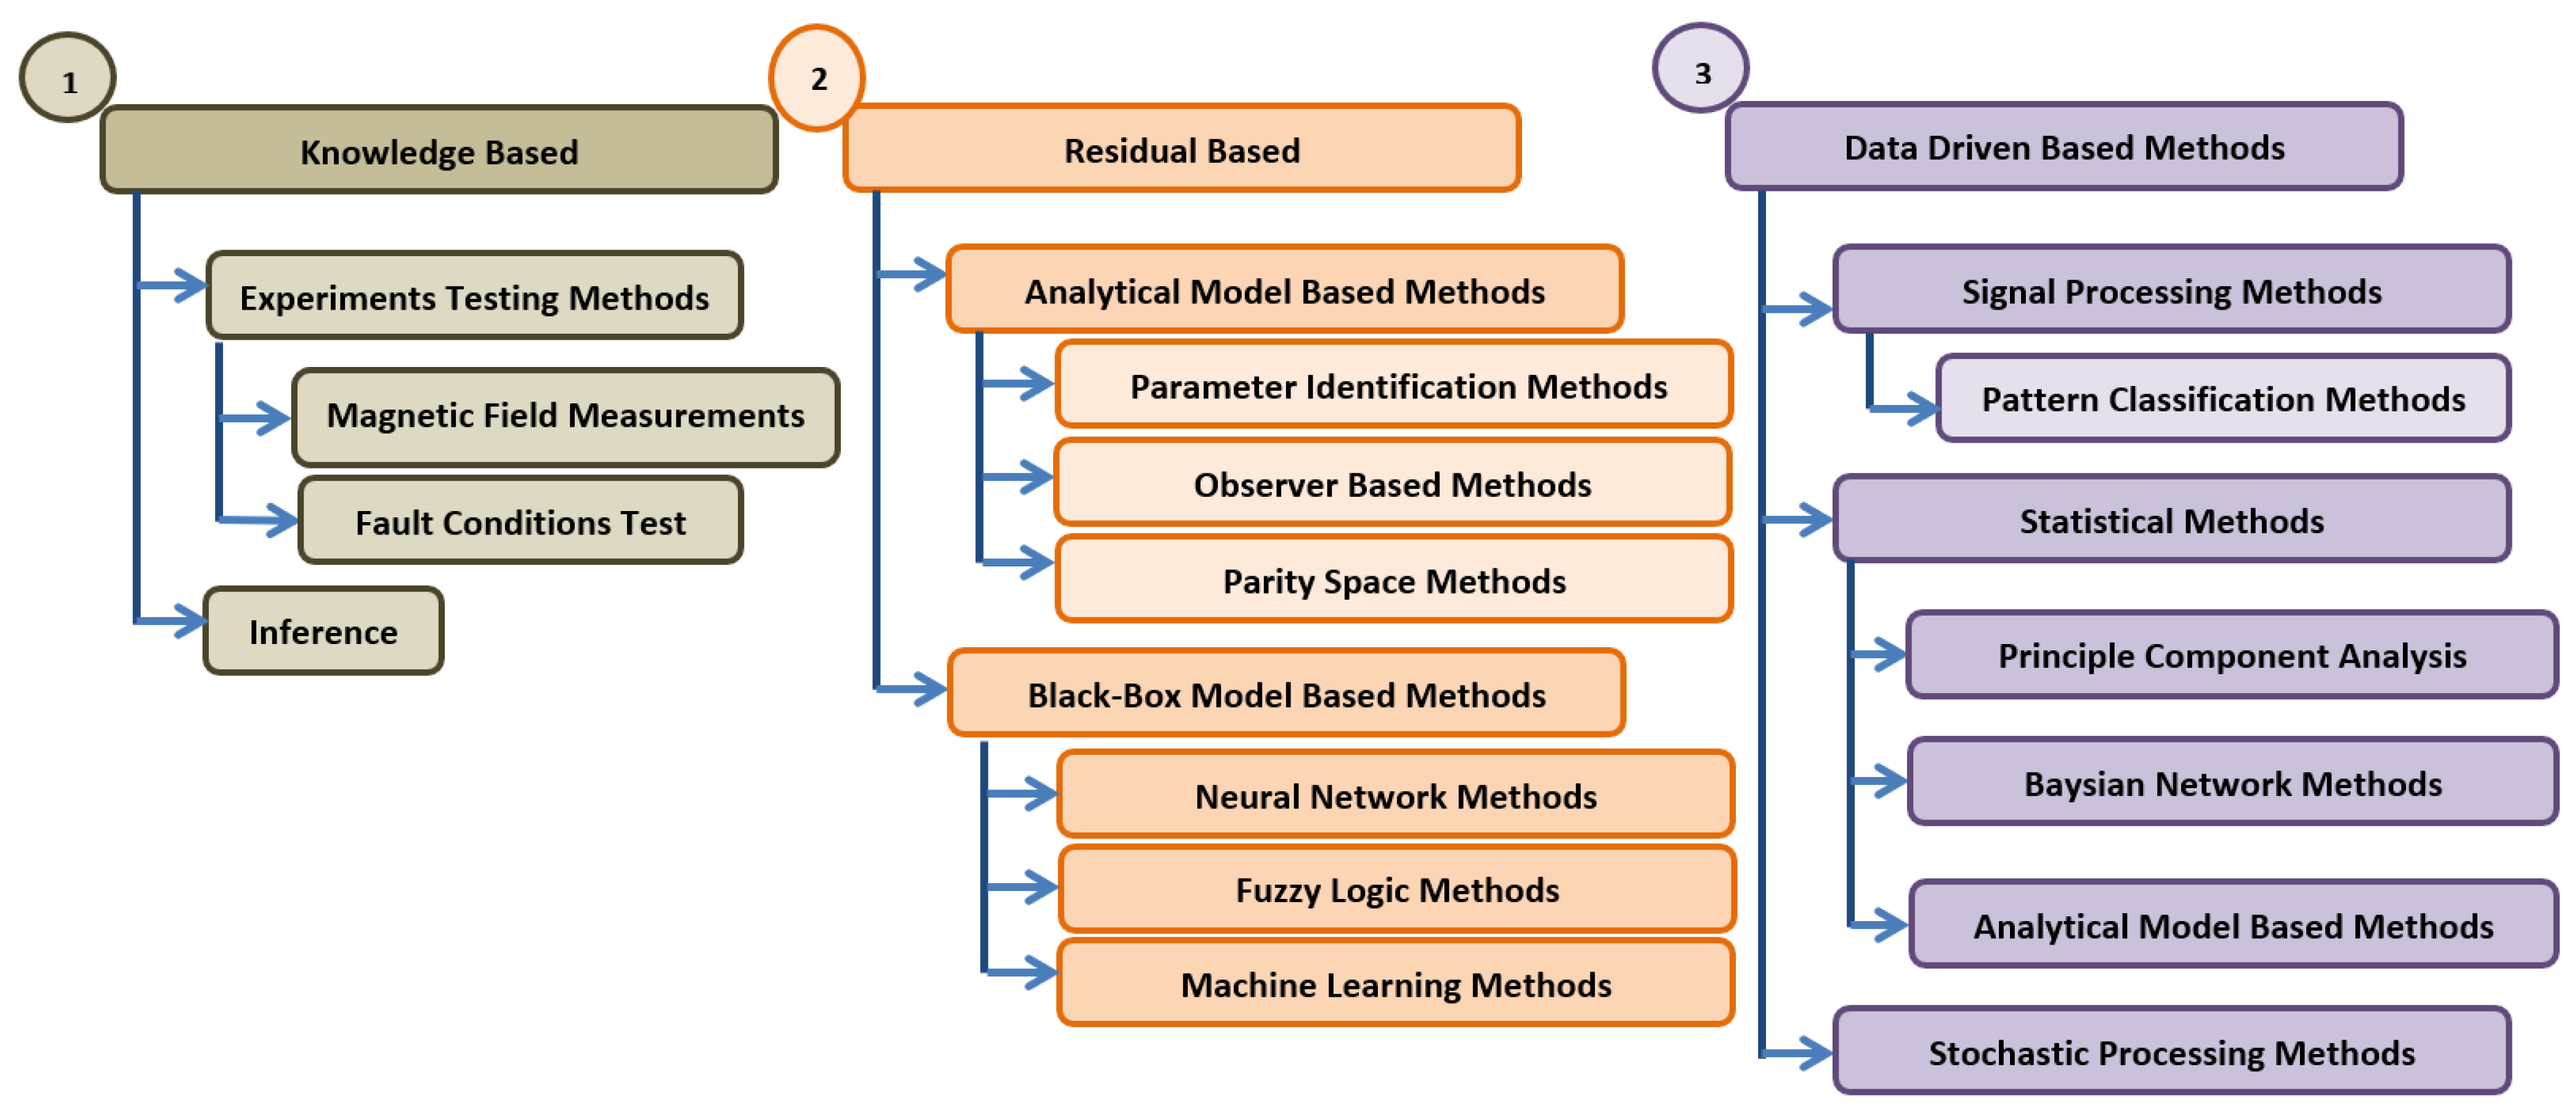
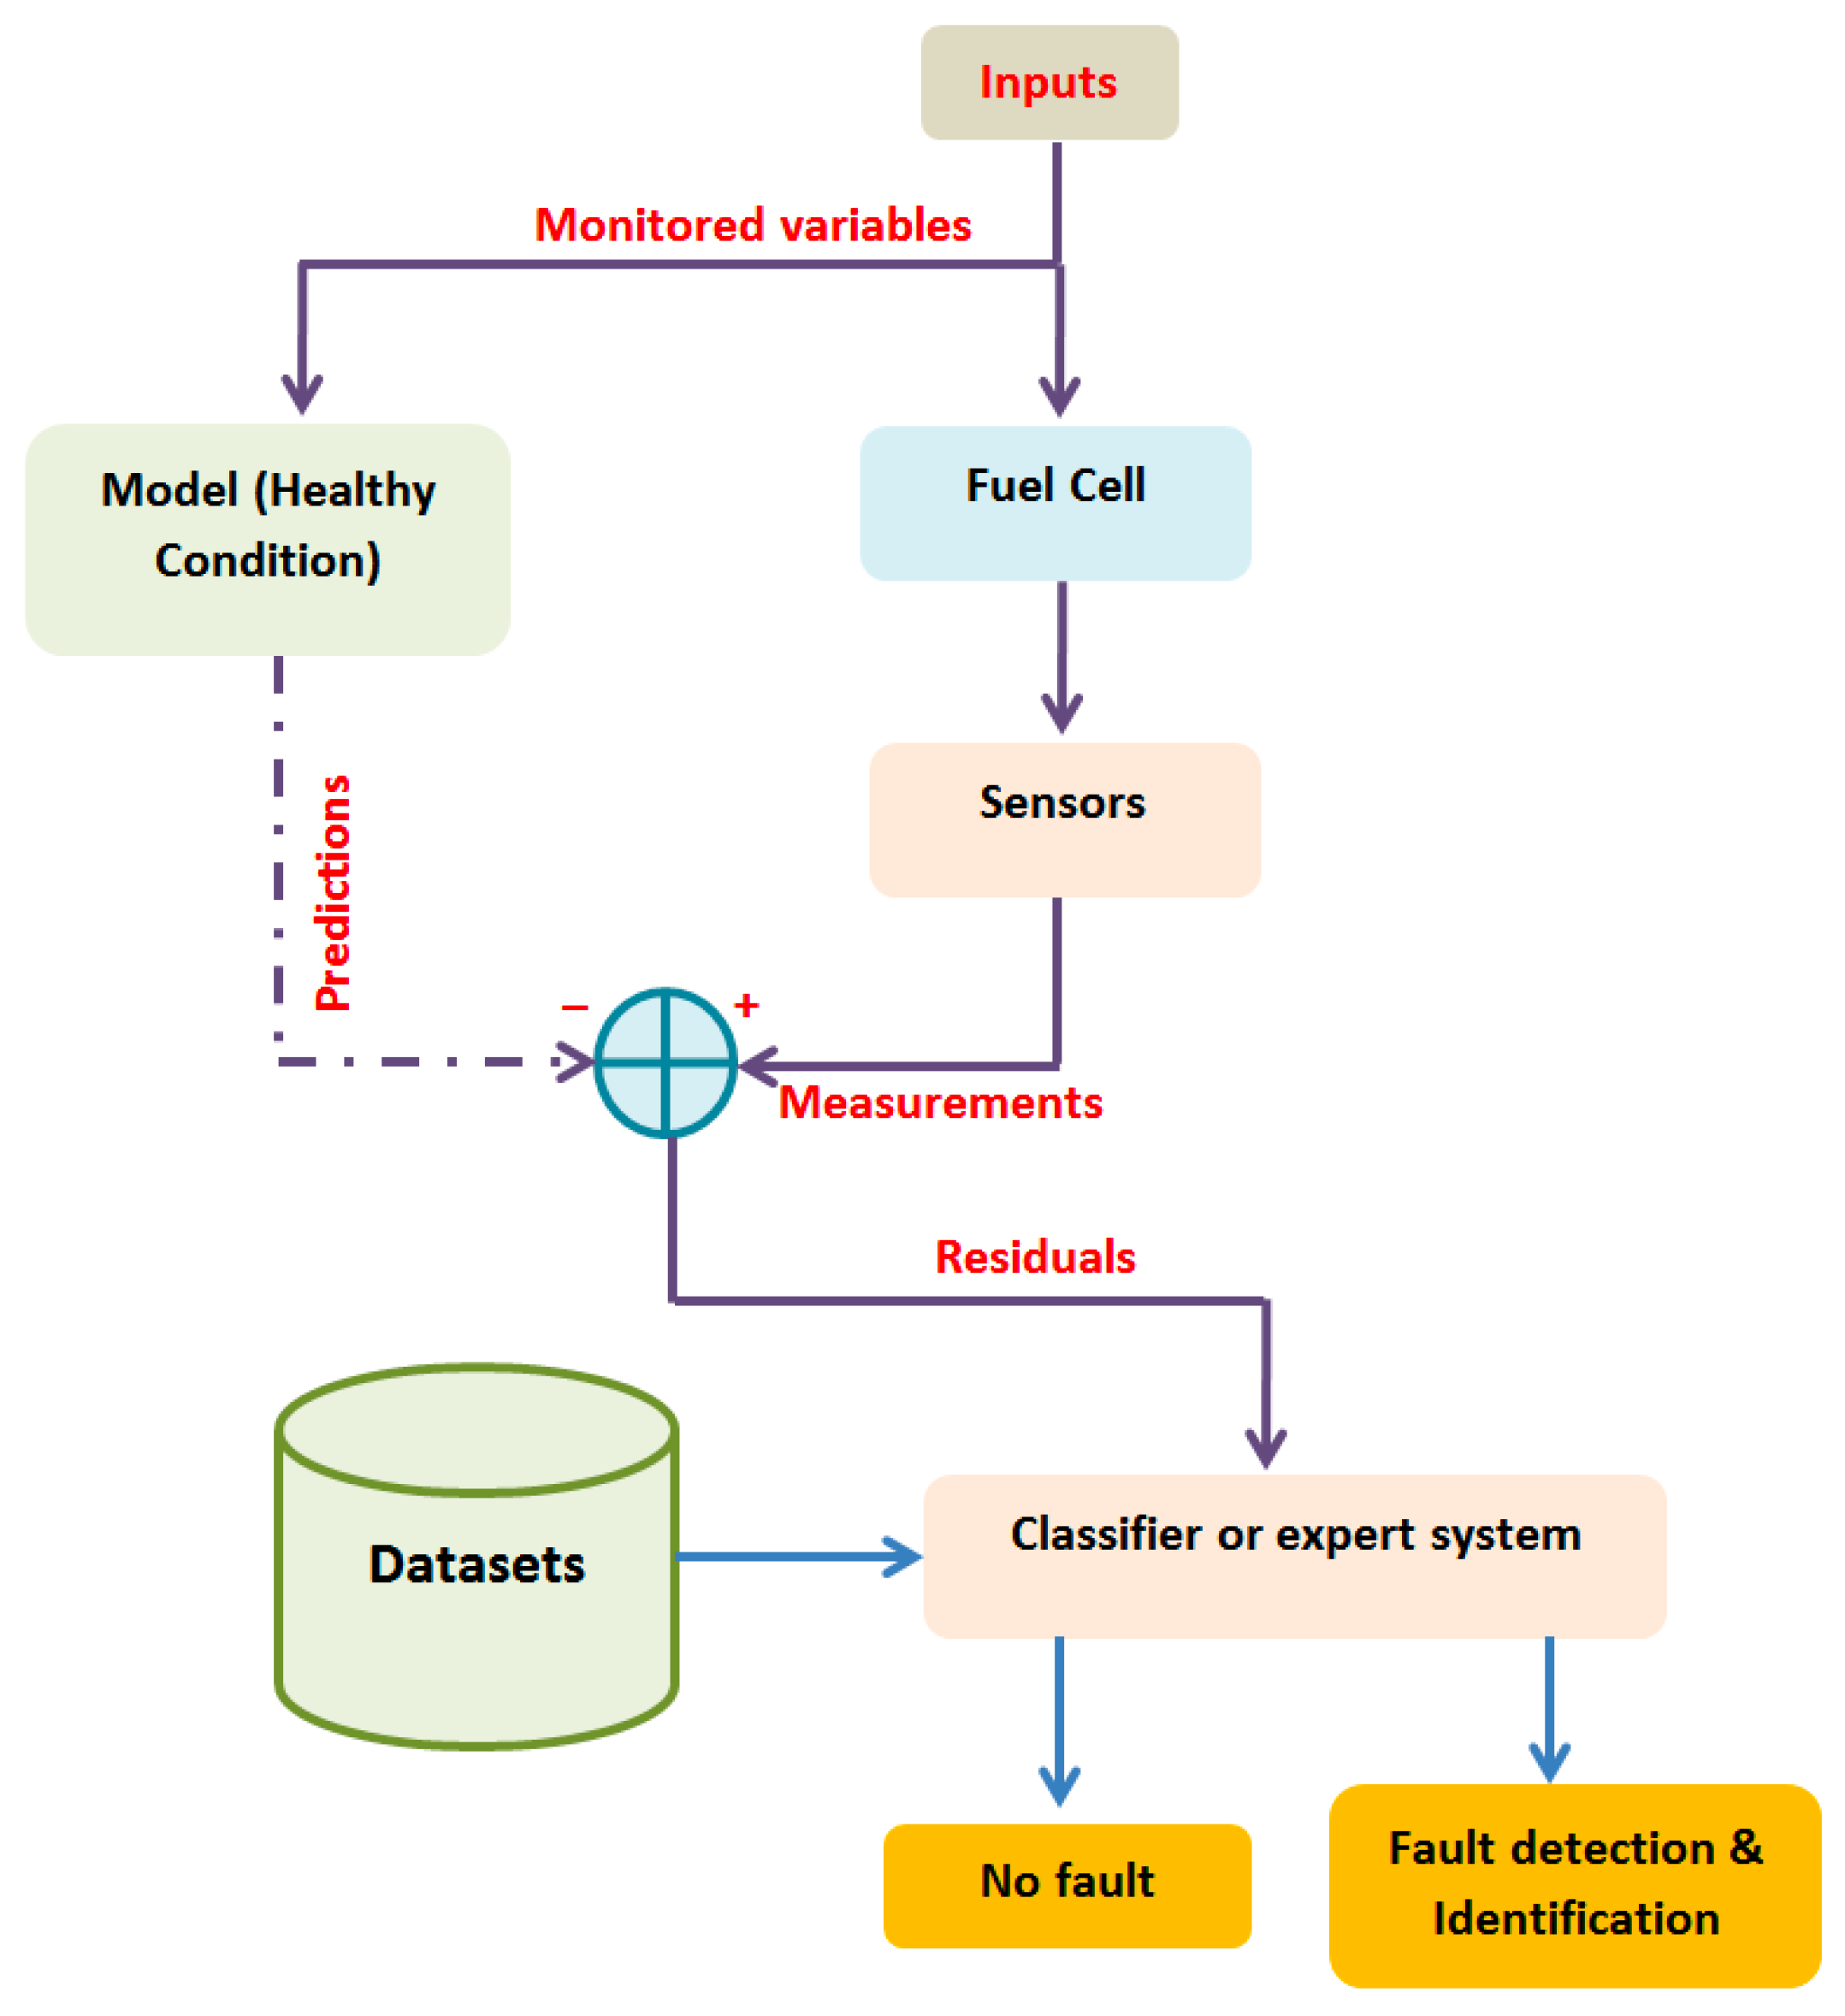
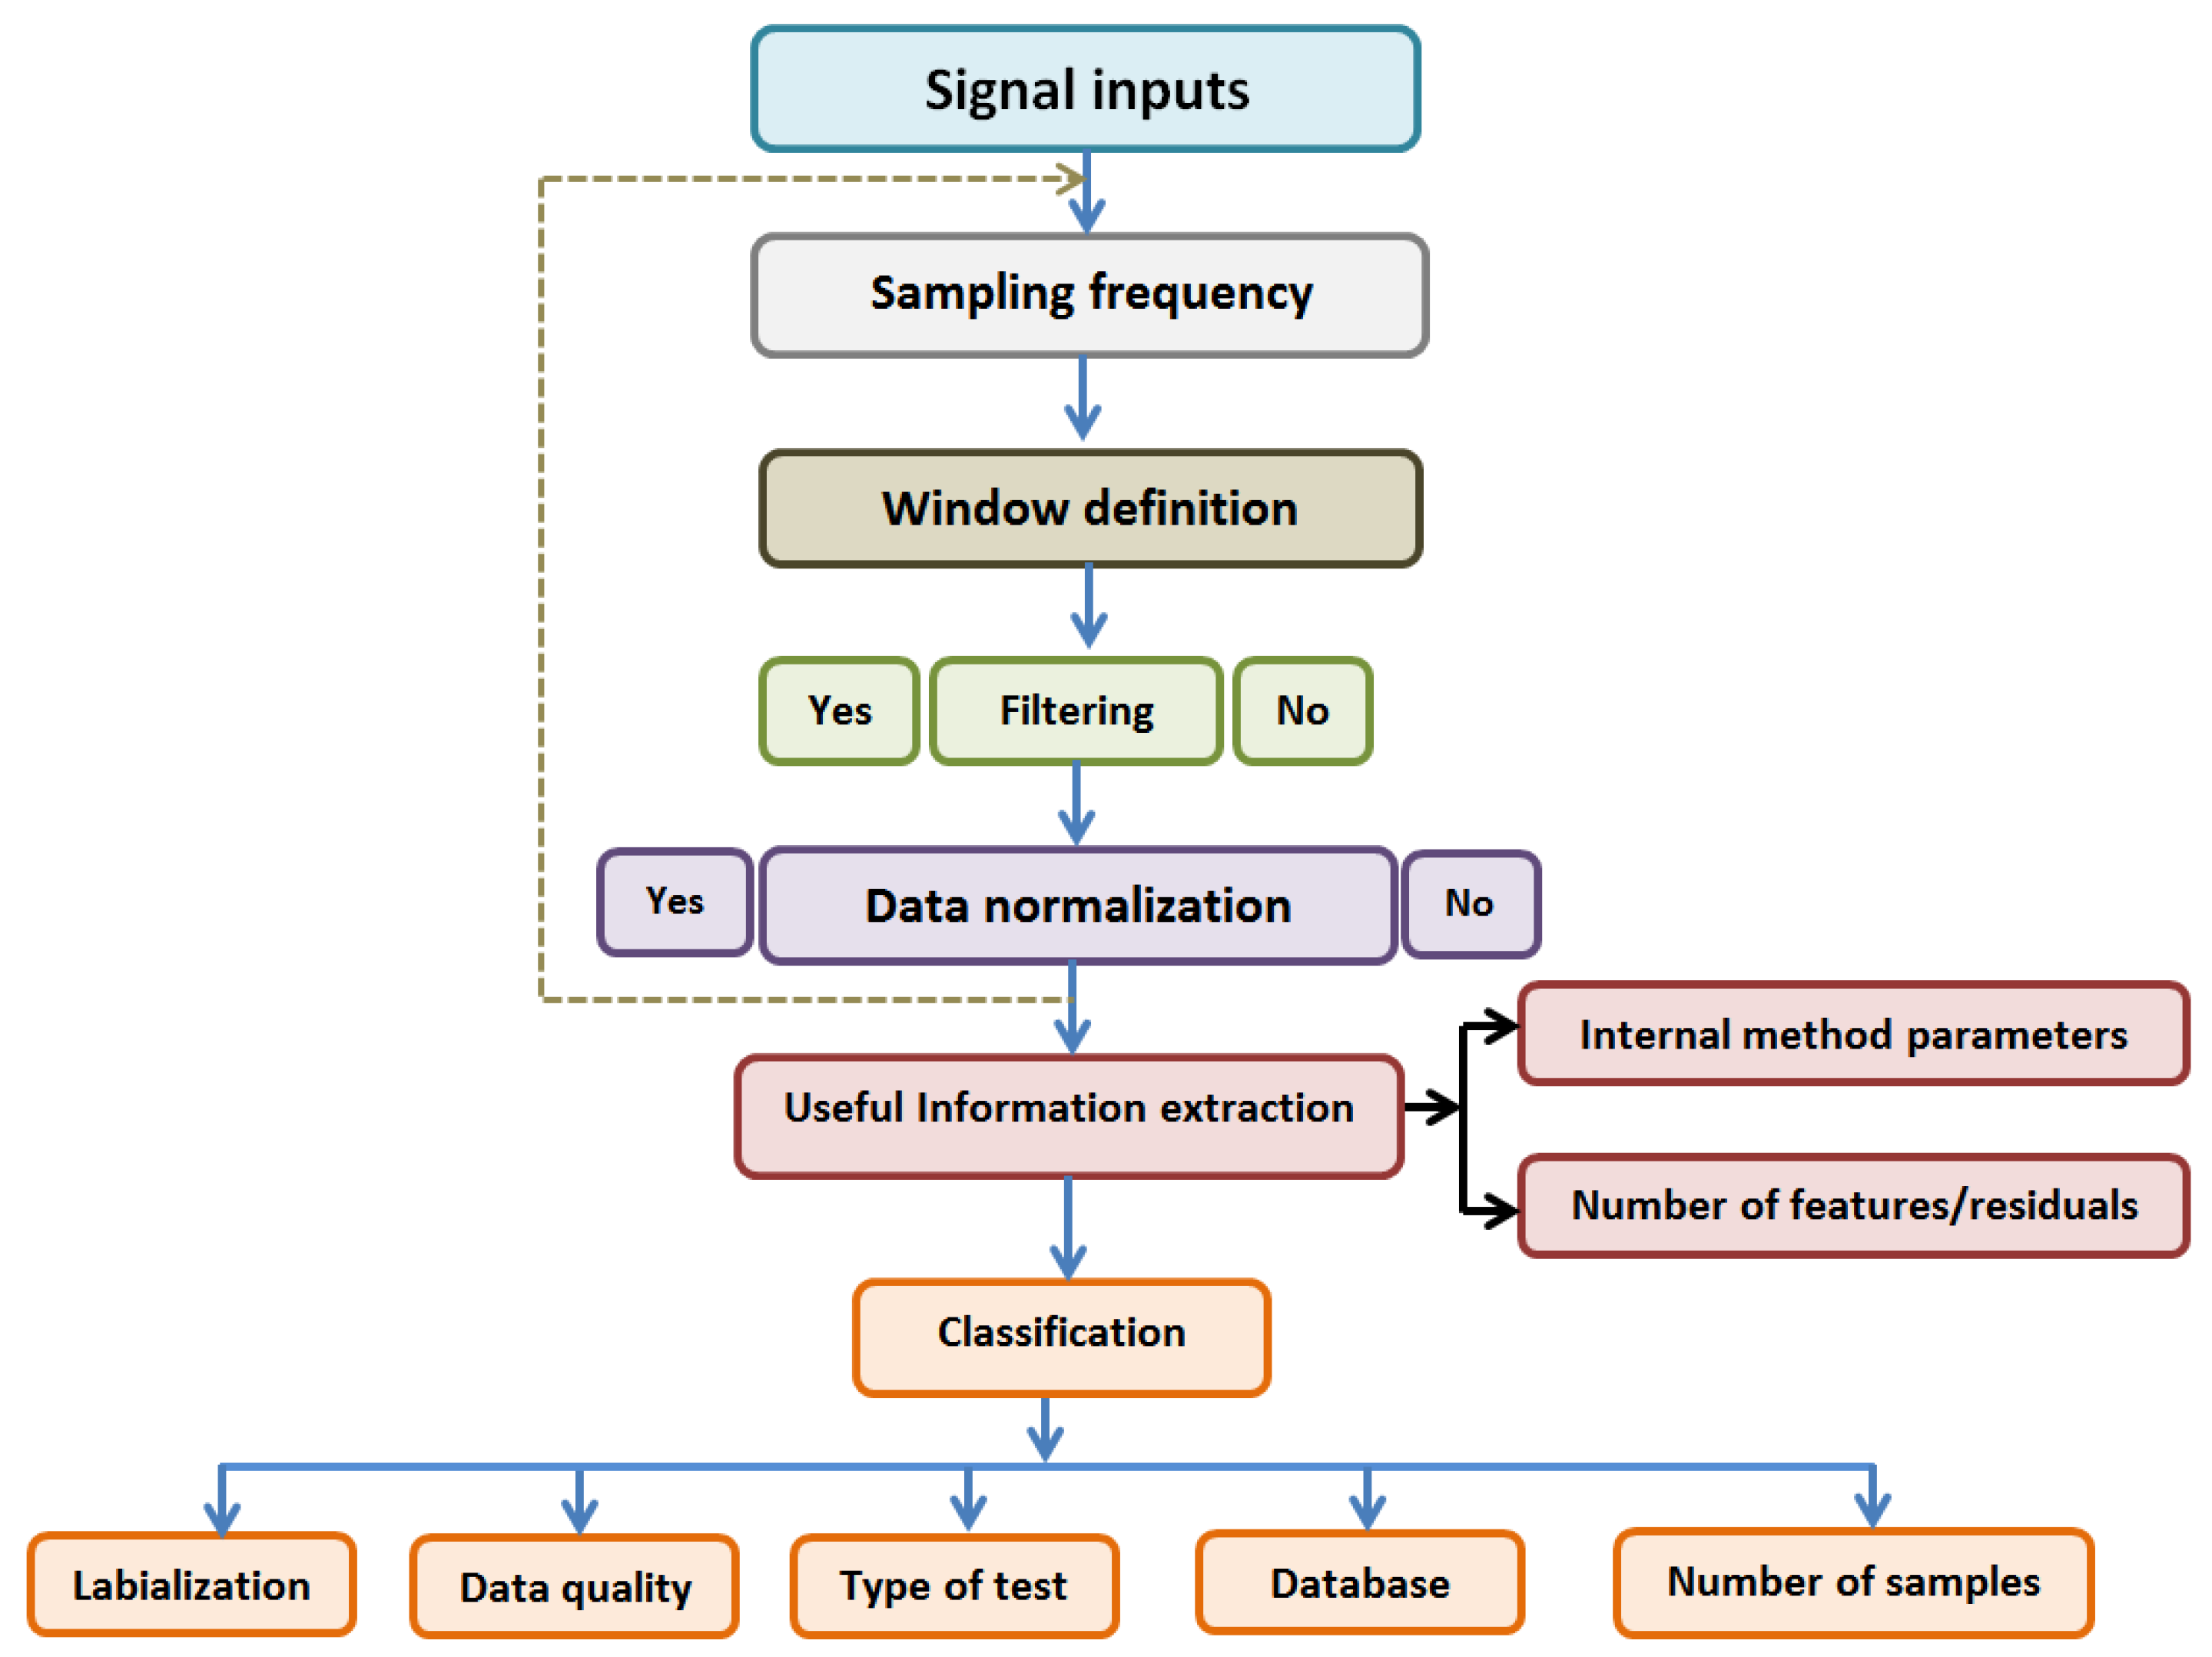
These types of faults are the ones with less work reported in the literature. This is because almost all external components are very conventional and not specifically designed for Fuel Cell applications [63,133,134]. Furthermore, this category is very dependent on the type of FC being used, and which external components are required. Nonetheless, in [135] a diagnostic system technique was proposed for detecting faults in the FC system sensor’s network. This diagnostic technique was implemented on a bus fleet at the Shanghai Expo in 2010 and is based on Principal Component Analysis (PCA). This model-based tool takes into consideration the sensors’ information under normal working conditions by using the relevance of process variables and tests the divergence of samples and the model online [135]. A total of 17 sensors were modeled and the result showed the good capability of the system to identify the fault and isolate it. Further research on sensor rehabilitation is available in [136], where the authors concentrated on identifying faulty humidity sensors that hinder the accurate detection of water flooding. The data tool uses several data-based approaches, such as Kernel Principal Component Analysis (KPCA), Wavelet Packet Transform (WPT), and Singular Value Decomposition (SVD). The tool was implemented in an 80 W open-cathode FC, and the experimental procedure involved cooling down the stack to cause cathode flooding and immediately increasing the temperature to mitigate the effect. With such a procedure, four different datasets were created: from normal to flooding conditions, from flooding conditions to normal conditions, normal conditions, and finally flooding to normal conditions. The proposed approach is then to monitor the sensor’s measurements every 5 s and check for reliability regarding the features extracted from each sensor. The experimental results showed that without considering the humidity sensor fault, the diagnosis data tool could not detect cathode flooding, while when faulty humidity was removed from the data, the tool easily identified cathode flooding.
Finally, when referring to external faults, serious attention must be paid to power electronics components. Despite falling out of the scope of this paper, some work has already covered a significant part of this field [137,138,139,140].

6. Diagnostic Tools

As previously stated, the transient fault classification class is the most suitable and desired for the application of diagnostic tools. Given this, the authors in [75] identified several diagnostic approaches and compiled them in a tree-like graph. Figure 11 illustrates the organization of the diagnostic tools.
Originally, Figure 11 only accounted for data- and residual-based classification, but adding knowledge-based classification is important because, to evolve into a more adaptative and robust method, it is necessary to truly understand the system by intensively experimenting with it.
Despite being a very limited diagnostic tool, the knowledge-based approach is founded on logic and reason, where a conclusion is reached through several observations. An example of this approach is Fault Tree Analysis (FTA) [141]. This technique is basically action–consequence knowledge that uses deduction, which allows the relationship between an undesired state to cross reference low-level events via a top-down approach. Residual-based approaches compare the healthy state of the FCs, through their model, to the real system measurement. The difference, also called residuals, is analyzed to detect the fault occurrence and, at the same time, specify the fault [75]. Finally, data-based approaches use data processing techniques and rely only on the input and output of the system to identify fault occurrence [75]. Data are then collected and analyzed by verifying the distance between faulty operating conditions and the nominal operating point to take the necessary diagnostic actions [75].
Another important distinction made in [62] is related to the way in which fault diagnostic tools are applied. The authors categorized them off-line and on-line. The former requires the FC to be out of service, and in most cases, to be dismantled to access specific components, while the latter can perform diagnosis without the need to interrupt the operation of the FC. Therefore, the development of online diagnosis methods has attracted more interest. Regarding on-line methods, they can also be classified as invasive and non-invasive [62].
One of the most studied diagnostic techniques involves measuring the individual stack voltage and accompanying the voltage difference between them and the time evolution [142,143]. Other techniques involve more invading methods such as Electrochemical Impedance Spectroscopy (EIS) [144,145], while others opt for more model-based techniques through the use of residuals and hysteresis windows [91,145,146] or even data-driven [147,148] and signal processing tools [149,150,151,152,153,154].

6.1. Residual-Based Approaches

Figure 12 illustrates the concept of residuals. The approach involves generating an error by comparing data measured through hardware-installed sensors with a computational model that simulates or estimates normal behavior. Subsequently, the residuals are compared with a predefined threshold window, acting as a barometer. Values falling beyond this window are considered indicative of faulty conditions.
Residual-based diagnostic tools can be applied on-line or off-line, depending on the definition of the tool. Some of the off-line methods have already been presented in Section 4 (for example, [91,129,130,145,146]); however, in recent works, several online techniques have been receiving a lot of attention due to the ability of real-time implementation, early-stage fault detection, and preventive maintenance of the system. Consequently, these approaches aim to prevent system malfunctions or total failures, ultimately enhancing system reliability. Some of the recent works have been summarized in [155]. In [156], an on-line method was employed to ensure proper humidification of the stack. The authors used a DC/DC power converter to interface with the FC, and with the proper sensors and control of the converter, they were able to measure the harmonic impedance for different conditions, such as faults related to membrane humidification and low mass flow of reactants for constant load. The DC/DC converter used was an isolated full-bridge converter with a capacitor placed in parallel with the FC to minimize the current harmonics. Resorting to the control of the converter, the on-line method proposed is based on the EIS methodology. The EIS principle, as already explained, requires a small perturbation in the input of the FC, and the authors have achieved this by causing small sinusoidal modulation at different frequencies around the nominal value of the duty cycle. To ensure that this perturbation does not affect the output voltage, the method can only be employed when the dynamical conditions of the load are sufficiently low to disable the output voltage control. Furthermore, to inject the signal into the FC, a current ripple injection controller had to be dimensioned by simply measuring the current of the stack, extracting the alternating part of the signal, and adding it to the reference current ripple. The generated response is then added to the constant duty cycle. Having ensured proper operation of the methods, the authors measured both FC voltage and current, performed a frequency-adjusted division to eliminate the PWM ripple component, and proceeded to apply a Discrete Fourier Transform (DFT). All in all, the proposed online tool can detect a fault; however, an increase in high impedance is also a sign of membrane flooding or drying, and therefore this tool needs to be enhanced.
A similar work is presented in [54]. The idea is based on calculating the impedance using only the ripple produced by the converter, in this case, a boost converter. Knowing that the internal resistance is a good indicator of the humidification level of the membrane, and that, for high frequencies, the electric equivalent circuit can be reduced to only the resistance part, the authors extracted the DC component of the voltage and the current signals and divided them. The proposed method was experimentally tested on a closed cathode FC, with external air being fed to simulate bad humidification and therefore causing drying to the membrane. The results showed that the internal resistance increased when the external air was supplied, thus diminishing the level of humidification of the membrane. Once again, a diagnostic tool using just the power converter is proposed; nonetheless, as was shown in [156], gas mass flow can also affect the internal resistance, so this parameter alone is not enough to isolate the fault. Also, for the proposed method, the dimension of the power converter components plays a major influence since larger values of inductors cause small ripple content in the current; hence, according to what the authors proposed, there was higher internal resistance. This aspect was mentioned in the work, but no solution was provided since the authors chose a small inductor and stated that the work is rather more focused on the evaluation of the membrane resistance than on calculating its accurate value. Other works that use the variance of the internal resistance to detect faults can be found in [157,158].
A different online approach was studied in [159]. The authors aimed to develop an easy-to-implement technique for an FC applied to transportation applications. The proposed technique is based on a threshold that is defined according to the polarization curve for both faulty modes: flooding and drying. To define the threshold values, an expression based on the polarization curve equation is deduced, and whenever the FC-measured voltage is below the threshold value, the fault is detected. To distinguish between flooding and drying, the authors needed to apply the current interrupt method, which measures the FC response after a sudden high step occurs in the current. Typically, the flooding phenomena affect the double layer effect, while drying is more noted in the internal resistance. By combining these two approaches the authors were able to identify and isolate the fault; however, some remarks must be pointed out. First, the cyclic loads can cause variations in the cell voltage that are not related to the faulty state; second, the definition of the threshold window is dependent on the estimation of how much area is affected by the flooding, and different levels of flooding or drying can occur in separate cells inside the stack. The first drawback has already been addressed through simulation work. Experimental results were performed on a 500 W stack composed of 20 cells with 100 c m 2 each and reported in [68].
An online signal-based fault diagnosis for both flooding and drying was presented in [160]. To achieve that, the technique is based on a signal processing method, which is characterized as being empirical, intuitive, direct, and adaptive, without the need to pre-determine the basis function, denominated as Empirical Model Decomposition (EMD). Moreover, this tool requires low computational power and fewer measurements. The application of such a tool to an FC only requires the output voltage and can be adapted to every FC since it does not require a predetermined set of functions because it calculates those from the original signal. From the original signal, a set of Intrinsic Mode Functions (IMFs) are calculated. These functions represent the contribution of high and low frequencies in which the signal is composed. After that, the algorithm extracts the possible number of IMFs and proceeds to calculate the contribution of each IMF to the signal. The function obtained is denominated as the feature vector. The authors identified that only the first and ninth IMF values are necessary to properly distinguish between drying and flooding states. The experimental results showed a global diagnosis accuracy of 98.6%.
One of the first works to introduce machine learning in the fault diagnosis of FCs was presented in [161]. By using a Bayesian Network (BN), the authors were able to identify different faults, including water management faults. The authors proclaim that using this type of strategy is advantageous when there are variables difficult to estimate or measure.
The use of Artificial Neural Networks (ANNs) to detect flooding has been presented in [101]. This diagnostic method is based on comparing the experimental value for cathode pressure drop with model ones, creating what is denominated as residuals. For this case, an Elman Neural Network (ENN) was used to create the model, and a threshold was defined. The experimental tests were performed on a 20-cell stack PEMFC with 500 W nominal output power, and the result showed that for flooding operating conditions, the overall temperature of the stack decreased significantly, while the dew point temperature presented some oscillation. Prior to that, the voltage decreased almost 2 V during the 35 min experiment, and the cathode pressure also increased. To train the ENN, normal operation data were fed to the algorithm, and after some trial and error, the threshold residual was chosen. The authors then applied the algorithm to the flooded cell. To simulate the flooded mechanism, the hydrogen gas dew point was set to a lower value than the cells, forcing condensation to occur uncontrollably. The proposed algorithm was able to detect and order an increase in the hydrogen dew point temperature to mitigate the fault. The time that it took to detect the fault was not reported, but the experimental results showed that during the duration of the experiment (almost 45 min), 15 min were reported in flooded mode, and the residuals were very different from the threshold limit, therefore showing the good applicability of the method. Another NN has been used in [162] to identify flooding and drying. This method used a black-box model based on an ENN, which simulates and calculates the evolution of both pressure drop and voltage and compares it to the real measured value. From that comparison, two residuals are generated and evaluated with a threshold, which indicates the occurrence of the fault. The main limitation of using the residuals generated by the model is the calculation of the threshold value, which typically is empirically based. Nevertheless, both simulation and experimental results showed the good accuracy of the proposed technique. Similar works can be found in [163,164,165].
Another work using voltage and cathode pressure drop residuals is presented in [166]. The authors based their model on an ANN that models the evolution of the cathode pressure and the voltage and uses their residuals to identify the fault. This technique was only focused on flooding conditions and experimented on a single cell with 50 c m 2 of active area. Moreover, this work is also relevant for being one of the first to present a recovering technique to recuperate from the flooding state. The reconfiguration mechanism is based on a self-tuning PID controller that has the function of supplying oxygen to the cell. Therefore, whenever a fault is detected, the oxygen intake is increased automatically by the PID controller, hence recuperating from the flooding state. Even though the method showed good results, applying it to a more elaborated FC may have its difficulties since it relies on physical sensors that are typically not inserted in a stack, and excess oxygen intake can lead to further complications such as an increase in oxidation at the cathode.
Flooding is not only associated with the cathode but can also occur in the anode, especially if it is caused by an excess of back-diffusion phenomena. Most FC manufacturers, for economic and practical reasons, choose an exhaustion system based on a regular purge of a solenoid valve, which is also referred to as dead-end mode (DEA). This method increases the humidity level inside the stack but also causes voltage degradation because the water purge is not optimized for each operation point [76]. To improve this major drawback, the authors in [76] proposed a purge system that takes into consideration the water expelled from the purge system and the time of the purge. Initially, an anode water model was deduced; during this stage, the pre-built purge system was accessed and noted that it occurred every 10 s for a duration of 10 milliseconds. After that, the authors weighted the water being expelled for different current values for a time duration of 10 min. With that, and considering the anode as a lumped volume, a 0-D model is developed. The results showed good agreement between the model and the pre-built purge system, validating the proposed model. Furthermore, to improve the purge system a strategy is proposed, where the difference between the weight of water expelled and the real one is proposed. No experimental results were published, but some concerns must be addressed, such as the behavior under dynamic load and the effect on the hydrogen consumption rate. Furthermore, although the strategy seems promising, the practical implementation is of concern. Such a measure of the weight of the water requires precise sensors, and for every purge, the sensor would need to be reset.
Another work using an on-line technique through data processing is presented in [167]. The authors were able to identify three health states: normal state, flooding state, and drying state, using a Support Vector Machine (SVM) approach paired with an FC fluidic model. The diagnosis principle was based on the data-labeling process and model training off-line, and then it was applied on-line. An important aspect of this approach is the training of the data, which should be as precise as possible. To ensure that, the authors compared the theoretical air mass flow with the real air mass flow and defined a ratio that serves as an indicator of the stack’s water management. If the measured ratio exceeds the threshold, the cell is in a drying state due to low water content. Conversely, if the ratio is lower, it indicates an excess of water molecules blocking the airflow passage, resulting in a flooding state. Experimental results performed on a 1 kW 20-cell Stack PEMFC were first conducted in the normal state to train the algorithm and define the admissible thresholds and showed an overall 90% accuracy. Similar work can also be found in [168].
The assumptions typically taken into consideration for the model-based approach are very limited for the data available. Taking this into account, a different approach is presented in [169]. By developing a 3D semi-empirical FC model, the authors were able to consider several electrochemical and thermal parameters, as well as the impedance. This 3D model can simulate both flooding and drying modes for various operating conditions, such as temperature, pressure, and humidity. To identify the fault, an SVM learning algorithm is applied. The authors began to identify critical points for a single cell, which are referred to as nodes, at the cell center, inlet gas and outlet gas, and boundary zones. In total, nine nodes were identified, and their positions on the 3D model represent physical phenomena. To model the faults, some resistors were placed within the vicinity of the nodes that connect the anode of the previous cell to the cathode of the adjacent cell. To understand the difference between drying and flooding, the authors identified that the internal relative humidity levels should be between 60 and 100%; anything higher than the latter values induces flooding conditions, while values lower than the former values cause drying conditions. The temperature is an important parameter that affects different operating conditions; therefore, for example, both activation and concentration losses are reduced when temperature is increased. Nonetheless, if the temperature increases higher than a certain point, it will negatively affect the performance of the cell, causing cell degradation. Another important parameter is the pressure. Regarding the activation losses, higher pressures of hydrogen and oxygen are preferred to reduce their effect; however, too-high reactant pressure values can cause cell failure, such as flooding. For the flooding state, the authors increased the inlet pressure, and to monitor the drying state, the relativity humidity levels were kept below the minimum value. Furthermore, the results showed that the trainer classifier presented a training efficiency of 95.5% and an increase of 3% when applied to unknown data.
Fuzzy logic has also been applied to faults in FC diagnosis, including water faults, [56,170]. In [126], an EIS technique is used as a basic tool, followed by fuzzy clustering and fuzzy logic, to develop and mine diagnostic rules from the experimental data on-line. The authors proceeded to identify the effect of different operating parameters on the expected EIS results, and after the Nyquist plot was obtained, the fuzzy clustering algorithm organized the data into different groups with similar characteristics. Another fuzzy application in FC diagnosis is presented in [125], where it is applied to a commercially available FC. The authors studied the effect of air stoichiometry on both oxygen starvation and flooding. Initially, EIS is used to measure the response to a voltage stimulus, and after that, a non-model based on fuzzy clustering is used for fault diagnosis. When it comes to using the EIS technique, there is a crucial factor that must be considered—the impact of the purging system. This effect cannot be ignored and must be carefully considered to ensure the best possible outcomes. This FC system recurs with a purging mechanism, which can induce local fuel starvation for every purging moment [76]. However, this effect ended up being neglected, because, for a stack with a high number of cells, such as this case, this effect is only noticed in a reduced number of cells, particularly those close to the outlet [76,125]. Moreover, once the Nyquist plot is obtained for the EIS measurements, a fuzzy-c clustering algorithm clusters groups of similar data and compares them to a specific threshold. These data are obtained according to certain criteria: the first represents the high-frequency intercept of the impedance arc, which represents the internal resistances; the second is the polarization resistance, which corresponds to the solely real part of the Nyquist plot; the third criterion is the difference between the two previously mentioned, and it is represented by the width of the semi-circle measured in the real axis; and finally, the fourth criterion is based on the absolute phase value of the impedance. The experimental results proved that the first cluster criteria were demonstrated to be successfully able to assess the state of health and diagnose flooding and drying conditions.

6.2. Data-Based Approaches

6.2.1. Signal-Based Techniques

A frequently used signal processing tool called Wavelet Packet Transform (WPT) has also been used for the diagnosis of flooding and drying in FCs, refs. [171,172]. This was first studied in [172], where the voltage signal was analyzed by extracting and decomposing it in order to obtain fault identification and fault classification. In this case, only the flooding state is tested. This tool allows for distinguishing between the flooding state and the normal state for the whole state or only for a determined number of cells within the stack. The latter case faces greater challenges since the flooding in a defined number of cells does not necessarily affect the overall voltage. After applying some mathematical functions and properties, a convolution signal is obtained, and for this case, the signal can be interpreted continuously, filtering the signal by using low- and high-pass filters [172]. From this wavelet packet, two coefficients are derived that represent the threshold, which identifies the fault. Experimental tests were conducted on a stack composed of 20 cells and with a closed cathode, and the results showed a significant difference between the determined coefficients for the normal state and flooding state; therefore, the authors concluded that the proposed tool can be implemented in different applications. To expand the applicability of the tool, a Kalman filter, which uses a set of mathematical equations to estimate the state of discrete data, was used to detect flooding [173]. The general signal approach for the condition monitoring of fuel cells is illustrated in Figure 13.

6.2.2. Statistical Methods

Statistical methods are considered one of the data-based approaches, as represented in Figure 12. Although not fully explored regarding FC applications, this method is very prompt in on-line applications and can easily reduce the cost of decision making, improve the prediction of future actions, and most importantly, identify problems and faults and make the correct readjustment action [174].
One of the first works published on this topic is presented in [174], where the authors proposed a statistical approach to estimate the flooding conditions inside the stack by elaborating on a reverse fluidic model. The model took into consideration several parameters, including the inlet and outlet air mass flow rate, temperature, relative humidity, and dimensions of the flow channels and their respective hydraulic coefficients. The output of the model is the number of non-flooded parallel channels, assuming that in the healthy state, there is no presence of any water droplets, and for the flooded state, the fluid flow in the channel is zero. Furthermore, the in-between state is represented in the model by the healthy state multiplied by a scalar, which represents the non-flooding degree. To validate the feasibility of the model, three different experiments under healthy conditions were conducted, and the polarization curve was obtained. For the simulation of flooded conditions, the hygrometry (moisture content of the intake gases, RH) was increased. Initially, the hygrometry was adjusted within the range of 0.7 to nearly 1.1. Values close to 0.7 exhibited a minimal degree of flooding, while for values close to 1.1, this parameter increased to almost 0.1. Due to the dynamics of the flooding process and the responsiveness of the model, the sudden change in RH is not directly registered in the flooding degree parameter. Other tests were performed under constant currents of 40 and 30 A. From the analysis of the experimental results, the authors concluded that higher degrees of flooding represent higher voltage variances, while the other parameters remain unchanged; thus, concluding that only cell variances are sensitive to flooding occurrence.
Figure 13. General scheme of advanced signal-based techniques for monitoring Fuel Cell conditions.
Energies 17 00657 g013
Another statistical work involving statistical analysis has been presented in [175]. The authors analyzed the Electrochemical Noise (EN) present in the cell voltage signal in the form of voltage fluctuations. After that, several statistical descriptors in the time domain were calculated over a small time window, presenting as an on-line technique. The experimental results showed that these descriptors (in this case, standard deviation, skewness, and flatness) are very sensitive to both drying and flooding conditions. Furthermore, this technique was tested for different humidity and current levels.

7. Discussion

Taking into consideration the number of papers reviewed in the previous section, it is more than clear that the focus for PEMFC has been water management issues. In fact, according to the data presented in [176], water management faults represent 52% of the reported cases. Within that percentage, flooding is responsible for 33%, while drying is responsible for only 19%. Typically, flooding occurs at high current densities where the production of water is higher. In this case, the stack is operating in the concentration zone of the polarization curve, meaning that the number of reaction products is superior to that of the reactants, and there is an abrupt decay in both voltage and current. Common symptoms involve significant pressure differences between the anode and the cathode, low air mass flow at the outlet, sudden voltage decreases, and overall drops in the stack’s performance. When operating in dry conditions, the initial voltage drop (activation zone) is higher, leading to a more tilted ohmic zone. This occurs because the equivalent cell resistance has increased, and the protons have more difficulties crossing the protonic membrane. Diagnosing the drying state may include the stack’s temperature, increase in internal resistance, membrane’s humidity, and outlet air temperature. Surely, mitigating such an occurrence is only possible after a deep, sustained knowledge of the system. That is why most diagnostic methods are based on models, which rely on the residuals between a physical parameter and a model-estimated one, with a focus on an acceptable empirical window where such residuals can oscillate. The main limitation lies in the defined threshold, as achieving a fully accurate model devoid of any assumptions is quite challenging. Therefore, adopting a 10% threshold variation is deemed acceptable. When considering the data-based approach, two variables must be taken into consideration. On one hand, there is the computational power required, and on the other hand, the targeted time window for the study. For this case, wavelet decomposition and FFT have been the main choice preferred by the authors in the literature.
Furthermore, an important aspect, often overlooked in the literature, pertains to the transition from the normal state to the faulty state. If external faults are excluded, and the natural aging of the electrodes (which heavily depends on the materials used) is neglected, the remaining faults can be mitigated through the implementation of appropriate and optimized control. As previously mentioned, ensuring proper membrane humidification is paramount, alongside the accurate provision of reactants, to extend the stack’s lifespan. Fuel cell manufacturers attempt to address this concern by either humidifying the reactants prior to their entry into the cell or by inducing instantaneous excess water production. However, the latter approach might restrict the stack’s application and potentially lead to the formation of hot spots within the membrane.
In order to enhance the efficiency and reliability of FC systems, three distinct strategies can be implemented. The first strategy centers on augmenting material durability and reducing costs. This approach seeks to extend the stack’s lifespan by alleviating, or at the very least diminishing, the occurrence of permanent faults, such as membrane deterioration or FC aging. The second strategy hinges on optimizing the control of reactants, fuel, humidity, and average stack temperature. This is a pivotal strategy, as it offers the potential to avert transient faults, notably flooding and starvation. Moreover, this approach is applicable to existing FC systems and can enhance their efficiency. The third approach amalgamates optimized control with real-time fault diagnostic algorithms. Its objective is to detect faults on-line and subsequently mitigate them by adjusting the control parameters. This ultimate stage represents a comprehensive solution for enhancing FC system reliability. By operating the stack under optimal conditions and addressing faults as they arise, this approach ensures robust performance. Despite progress, challenges persist, and the prospect of integrating fault diagnosis and optimized control into FC systems promises to bolster their durability, resilience, and overall reliability.
For a better visualization of the different reviewed works, Table 2 compiles, in a simple form, the five most important characteristics for correctly identifying and avoiding the occurrence of faults in FC systems.
The next generation of fuel cells shows immense potential across various applications, including clean energy production and transportation (Figure 14). These advancements include increased efficiency, enabling better fuel utilization and reduced waste, thereby enhancing sustainability. Researchers are also focusing on lowering production costs by employing innovative materials and manufacturing techniques, making FCs more economically competitive. The exploration of advanced catalysts and proton-conducting membranes enhances FC performance and durability. Hydrogen fuel cells are gaining attention for applications like vehicles and stationary power generation, with on-going efforts to improve hydrogen production, storage, and transportation. FCs are being integrated with renewable energy sources, complementing the energy supply, and thereby enhancing the reliability of renewable energy systems. Progress in portable and micro-FC technology is extending battery life for devices like smartphones and laptops, reducing the need for frequent recharging. Additionally, fuel cell vehicles emit only water vapor, making them a clean alternative to traditional internal combustion engine vehicles, with continuous research improving their efficiency and infrastructure. Large-scale FC systems are explored for grid-scale energy storage, aiding grid stability and facilitating the integration of renewable energy. FCs produce electricity with significantly lower emissions, contributing to environmental sustainability, and promoting the transition to a low-carbon economy. International collaboration and partnerships are crucial, fostering shared knowledge and resources, driving innovation, and overcoming technical and economic challenges associated with FC adoption.
Developing advanced condition monitoring and fault diagnosis intelligent techniques for the next generation of FCs is of paramount importance. These techniques play a crucial role in ensuring the reliability, efficiency, and longevity of FC systems. By implementing intelligent monitoring systems, researchers and engineers can continuously assess the health and performance of FCs in real time, allowing for the early detection of potential issues or faults. This proactive approach enables timely maintenance and prevents costly breakdowns, ultimately improving the overall operational efficiency of fuel cell technologies. Moreover, intelligent fault diagnostic techniques facilitate a deeper understanding of the intricate processes within fuel cells, leading to continuous improvements in design and performance. These innovations not only enhance the safety and reliability of fuel cell applications but also accelerate the widespread adoption of this clean and sustainable energy solution, contributing significantly to the transition to a more environmentally friendly energy landscape.

8. Conclusions

This paper aims to analyze the occurrence of faults in Fuel Cell systems and how they can be detected. Initially, a generalized definition of a fault and its characterization was provided, and a fault-tree analogy regarding the different types of fault diagnostic techniques was shown. Throughout the paper, meticulous characterization of the faults and their symptoms, as well as the different diagnostic approaches, was presented.
It can be concluded that flooding and drying represent the majority of fault occurrences in a Fuel Cell, and their symptoms include significant pressure differences between the anode and the cathode, outlet temperature and humidity variation, and an increase in membrane resistance. Several diagnostic techniques have been proposed, and among them, invasive and off-line techniques such as EIS or current interruption are the ones that offer a better understanding of the fault and allow a visual interpretation of it. Furthermore, the future trends of fault diagnosis in Fuel Cells were also discussed.

Author Contributions

Conceptualization, P.A., K.L., A.N.A. and A.J.M.C.; methodology, P.A., K.L., A.N.A. and A.J.M.C.; software, P.A.; validation, P.A., K.L., A.N.A. and A.J.M.C.; formal analysis, P.A. and K.L.; investigation, P.A. and K.L.; resources, A.J.M.C.; data curation, P.A. and K.L.; writing—original draft preparation, P.A.; writing—review and editing, K.L., A.N.A. and A.J.M.C.; visualization, P.A.; supervision, A.N.A. and A.J.M.C.; project administration, A.J.M.C.; funding acquisition, A.J.M.C. All authors have read and agreed to the published version of the manuscript.

Funding

This work was supported by the Portuguese Foundation for Science and Technology (FCT) under Projects UIDB/04131/2020, UIDP/04131/2020, and 2022.12782.BD.

Data Availability Statement

Not applicable.

Conflicts of Interest

The authors declare no conflicts of interest.

Abbreviations

The following list of abbreviations and symbols have been used in the paper:
FCFuel Cell
MCFCMolten Carbonate Fuel Cell
AFCAlkaline Fuel Cell
PAFCPhosphoric Acid Fuel Cell
DMFCDirect Methanol Fuel Cell
SOFCSolid Oxide Fuel Cell
PEMFCProton Exchange Membrane Fuel Cell
GDLGas Diffusion Layer
ACCAccuracy
CTRComputational time required
CCRComputational Capacity Required
EISElectrical Impedance Spectroscopy
SOHState Of Health
RULRemaining Useful Lifetime
PTFEPoly tetrafluoroethylene
FFTFast Fourier Transform
BNBayesian Network
DWTDiscrete Wavelet Transform
UCUltracapacitor
LSVLinear Sweep Voltammetry
PCAPrincipal Component Analysis
KPCAKernel Principal Component Analysis
WPTWavelet Packet Transform
SVDSingular Value Decomposition
FTAFault Tree Analysis
DFTDiscrete Fourier Transform
IMFsIntrinsic Mode Functions
ANNArtificial Neural Networks
ENNElman Neural Network
DEADead-End Mode
SVMSupport Vector Machine
ENElectrochemical Noise
Symbols
°CTemperature
NiNickel
NiONickel Oxide
Li2CO3Lithium carbonate
KOHPotassium hydroxide
CCarbon
PtPlatinum
YSZYttria-Stabilized Zirconia
LSMLanthanum Strontium Manganite
SiCSilicon carbide
COCarbon Monoxide
V F C Fuel Cell Voltage
i F C Fuel Cell Current
N c e l l Number of Cells
E F C Nerst Potential
R Universal Gas Constant
a x x Partial Pressure of the Reactants
α Charge Transfer Coefficient
F Farad Constant
i o Exchange Current Density
i n Internal Current density
R i Fuel Cell Internal Resistance
n Number of Exchange Electrons
i l Maximum current
T F C Fuel Cell Temperature
Wwatt
OCVOpen-Circuit Voltage

References

  1. Lagioia, G.; Spinelli, M.P.; Amicarelli, V. Blue and green hydrogen energy to meet European Union decarbonisation objectives. An overview of perspectives and the current state of affairs. Int. J. Hydrogen Energy 2023, 48, 1304–1322. [Google Scholar] [CrossRef]
  2. Sun, C.; Negro, E.; Vezzù, K.; Pagot, G.; Cavinato, G.; Nale, A.; Herve Bang, Y.; Di Noto, V. Hybrid inorganic-organic proton-conducting membranes based on SPEEK doped with WO3 nanoparticles for application in vanadium redox flow batteries. Electrochim. Acta 2019, 309, 311–325. [Google Scholar] [CrossRef]
  3. Dutta, S. A review on production, storage of hydrogen and its utilization as an energy resource. J. Ind. Eng. Chem. 2014, 20, 1148–1156. [Google Scholar] [CrossRef]
  4. Spiegel, C.; York, N.; San, C.; Lisbon, F.; Madrid, L.; City, M.; New, M.; San, D.; Singapore, J.S.; Toronto, S. Designing and Building Fuel Cells; McGraw-Hill: New York, NY, USA, 2007; ISBN 0-07-148977-0. [Google Scholar]
  5. Al-Baghdadi, M.A.R.S. Proton exchange membrane fuel cells modeling: A review of the last ten years results of the Fuel Cell Research Center-IEEF. Int. J. Energy Environ. 2017, 8, 1–28. [Google Scholar]
  6. Lin, R.H.; Xi, X.N.; Wang, P.N.; Wu, B.D.; Tian, S.M. Review on hydrogen fuel cell condition monitoring and prediction methods. Int. J. Hydrogen Energy 2019, 44, 5488–5498. [Google Scholar] [CrossRef]
  7. Onanena, R.; Oukhellou, L.; Candusso, D.; Same, A.; Hissel, D.; Aknin, P. Estimation of fuel cell operating time for predictive maintenance strategies. Int. J. Hydrogen Energy 2010, 35, 8022–8029. [Google Scholar] [CrossRef]
  8. Knowles, M.; Ren, Q.; Baglee, D. The state of the art in Fuel Cell condition monitoring and maintenance. World Electr. Veh. J. 2010, 4, 487–494. [Google Scholar] [CrossRef]
  9. Borup, R.; Meyers, J.; Pivovar, B.; Kim, Y.S.; Mukundan, R.; Garland, N.; Myers, D.; Wilson, M.; Garzon, F.; Wood, D.; et al. Scientific aspects of polymer electrolyte fuel cell durability and degradation. Chem. Rev. 2007, 107, 3904–3951. [Google Scholar] [CrossRef] [PubMed]
  10. Pan, T.; Zhang, P.; Du, C.; Wu, D. A review of fault diagnosis and fault-tolerant control of vehicular polymer electrolyte membrane fuel cell power system. J. Phys. Conf. Ser. 2022, 2206, 012015. [Google Scholar] [CrossRef]
  11. Brik, K.; Ben Ammar, F.; Djerdir, A.; Miraoui, A. Causal and fault trees analysis of proton exchange membrane fuel cell degradation. J. Fuel Cell Sci. Technol. 2015, 12, 051002. [Google Scholar] [CrossRef]
  12. Chen, J.; Zhou, B. Diagnosis of PEM fuel cell stack dynamic behaviors. J. Power Sources 2008, 177, 83–95. [Google Scholar] [CrossRef]
  13. Miller, M.; Bazylak, A. A review of polymer electrolyte membrane fuel cell stack testing. J. Power Sources 2011, 196, 601–613. [Google Scholar] [CrossRef]
  14. Aitouche, A.; Olteanu, S.C.; Ould Bouamama, B. A Survey of Diagnostic of Fuel Cell Stack Systems; IFAC: Prague, Czech Republic, 2012; Volume 45, ISBN 9783902823090. [Google Scholar]
  15. Zheng, Z.; Petrone, R.; Péra, M.C.; Hissel, D.; Becherif, M.; Pianese, C.; Yousfi Steiner, N.; Sorrentino, M. A review on non-model based diagnosis methodologies for PEM fuel cell stacks and systems. Int. J. Hydrogen Energy 2013, 38, 8914–8926. [Google Scholar] [CrossRef]
  16. Silveira, J.L.; Martins Leal, E.; Ragonha, L.F. Analysis of a molten carbonate fuel cell: Cogeneration to produce electricity and cold water. Energy 2001, 26, 891–904. [Google Scholar] [CrossRef]
  17. Pu, Z.; Zhang, G.; Hassanpour, A.; Zheng, D.; Wang, S.; Liao, S.; Chen, Z.; Sun, S. Regenerative fuel cells: Recent progress, challenges, perspectives and their applications for space energy system. Appl. Energy 2021, 283, 116376. [Google Scholar] [CrossRef]
  18. Sammes, N.; Bove, R.; Stahl, K. Phosphoric acid fuel cells: Fundamentals and applications. Curr. Opin. Solid State Mater. Sci. 2004, 8, 372–378. [Google Scholar] [CrossRef]
  19. Kamarudin, S.K.; Achmad, F.; Daud, W.R.W. Overview on the application of direct methanol fuel cell (DMFC) for portable electronic devices. Int. J. Hydrogen Energy 2009, 34, 6902–6916. [Google Scholar] [CrossRef]
  20. Das, S.; Das, D.; Patra, A. Operation of Solid Oxide Fuel Cell based Distributed Generation. Energy Procedia 2014, 54, 439–447. [Google Scholar] [CrossRef]
  21. Andrade, P.; Bento, F.; Alcaso, A.N.; Marques Cardoso, A.J. Output Current Control for Two-Switch Boost Buck Converters in Fuel Cell Applications for DC Microgrids. In Proceedings of the 2023 International Conference on Clean Electrical Power (ICCEP), Terrasini, Italy, 27–29 June 2023; pp. 136–140. [Google Scholar] [CrossRef]
  22. Jiang, S.P.; Li, Q. Phosphoric Acid Fuel Cells. In Introduction to Fuel Cells; Springer: Singapore, 2021; pp. 649–671. ISBN 0387355375. [Google Scholar]
  23. Sun, Q.; Lin, D.; Khayatnezhad, M.; Taghavi, M. Investigation of phosphoric acid fuel cell, linear Fresnel solar reflector and Organic Rankine Cycle polygeneration energy system in different climatic conditions. Process Saf. Environ. Prot. 2021, 147, 993–1008. [Google Scholar] [CrossRef]
  24. Szablowski, L.; Dybinski, O.; Szczesniak, A.; Milewski, J. Mathematical Model of Steam Reforming in the Anode Channel of a Molten Carbonate Fuel Cell. Energies 2022, 15, 608. [Google Scholar] [CrossRef]
  25. Contreras, R.R.; Almarza, J.; Rincón, L. Molten carbonate fuel cells: A technological perspective and review. Energy Sources Part A Recover. Util. Environ. Eff. 2021, 7, 1273–1283. [Google Scholar] [CrossRef]
  26. Izurieta, E.M.; Cañete, B.; Pedernera, M.N.; López, E. Biofuels-based hybrid MCFC/gas turbine plant design and simulation for power and heat generation. Braz. J. Chem. Eng. 2022, 39, 759–771. [Google Scholar] [CrossRef]
  27. Archit Rai, S.P. Prabhansu Renewable energy for sustainable growth assessment. In Renewable Energy for Sustainable Growth Assessment; Nayan Kumar, P., Ed.; John Wiley & Sons: New York, NY, USA, 2022; pp. 1–656. ISBN 9781119785460. [Google Scholar]
  28. Jang, I.; Ahn, M.; Lee, S.; Yoo, S.J. Surfactant assisted geometric barriers on PtNi@C electrocatalyst for phosphoric acid fuel cells. J. Ind. Eng. Chem. 2022, 110, 198–205. [Google Scholar] [CrossRef]
  29. Nohara, T.; Arita, T.; Tabata, K.; Saito, T.; Shimada, R.; Nakazaki, H.; Suzuki, Y.; Sato, R.; Masuhara, A. Novel Filler-Filled-Type Polymer Electrolyte Membrane for PEFC Employing Poly(vinylphosphonic acid)-b-polystyrene-Coated Cellulose Nanocrystals as a Filler. ACS Appl. Mater. Interfaces 2022, 14, 8353–8360. [Google Scholar] [CrossRef] [PubMed]
  30. Hamnett, A. Mechanism and electrocatalysis in the direct methanol fuel cell. Catal. Today 1997, 38, 445–457. [Google Scholar] [CrossRef]
  31. Rao, A.S.; Rashmi, K.R.; Manjunatha, D.V.; Jayarama, A.; Veena Devi Shastrimath, V.; Pinto, R. Methanol crossover reduction and power enhancement of methanol fuel cells with polyvinyl alcohol coated Nafion membranes. Mater. Today Proc. 2019, 35, 344–351. [Google Scholar] [CrossRef]
  32. Winter, M.; Brodd, R.J. What are batteries, fuel cells, and supercapacitors? Chem. Rev. 2004, 104, 4245–4269. [Google Scholar] [CrossRef]
  33. Kurnia, J.C.; Chaedir, B.A.; Sasmito, A.P.; Shamim, T. Progress on open cathode proton exchange membrane fuel cell: Performance, designs, challenges and future directions. Appl. Energy 2021, 283, 116359. [Google Scholar] [CrossRef]
  34. Yan, S.; Yang, M.; Sun, C.; Xu, S. Liquid Water Characteristics in the Compressed Gradient Porosity Gas Diffusion Layer of Proton Exchange Membrane Fuel Cells Using the Lattice Boltzmann Method. Energies 2023, 16, 6010. [Google Scholar] [CrossRef]
  35. Barbir, F. PEM Fuel Cells: Theory and Practice, 1st ed.; Dorf, R.C., Ed.; Elsevier Academic Press: San Diego, CA, USA, 2005. [Google Scholar]
  36. Kazim, A. Determination of an Optimum Performance of a PEM Fuel Cell Based on Its Limiting Current Density; Springer: Dordrecht, The Netherlands, 2004; pp. 159–166. [Google Scholar] [CrossRef]
  37. Corrêa, J.M.; Farret, F.A.; Popov, V.A.; Simões, M.G. Sensitivity Analysis of the Modeling Parameters Used in Simulation of Proton Exchange Membrane Fuel Cells. IEEE Trans. Energy Convers. 2005, 20, 211–218. [Google Scholar] [CrossRef]
  38. Santarelli, M.G.; Torchio, M.F.; Cochis, P. Parameters estimation of a PEM fuel cell polarization curve and analysis of their behavior with temperature. J. Power Sources 2006, 159, 824–835. [Google Scholar] [CrossRef]
  39. Fraser, S.D.; Hacker, V. An empirical fuel cell polarization curve fitting equation for small current densities and no-load operation. J. Appl. Electrochem. 2007, 38, 451–456. [Google Scholar] [CrossRef]
  40. Boscaino, V.; Miceli, R.; Capponi, G.; Casadei, D. Fuel cell modelling and test: Experimental validation of model accuracy. In Proceedings of the 4th International Conference on Power Engineering, Energy and Electrical Drives, Istanbul, Turkey, 13–17 May 2013; pp. 1795–1800. [Google Scholar] [CrossRef]
  41. Forrai, A.; Funato, H.; Yanagita, Y.; Kato, Y. Fuel-cell parameter estimation and diagnostics. IEEE Trans. Energy Convers. 2005, 20, 668–675. [Google Scholar] [CrossRef]
  42. Guarino, A.; Trinchero, R.; Canavero, F.; Spagnuolo, G. A fast fuel cell parametric identification approach based on machine learning inverse models. Energy 2022, 239, 122140. [Google Scholar] [CrossRef]
  43. Nabag, M.; Fardoun, A.; Hejase, H.; Al-Marzouqi, A. Review of Dynamic Electric Circuit Models for PEM Fuel Cells. In Proceedings of the ICREGA’14: The Third International Conference on Renewable Energy: Generation and Applications, Al-Ain, United Arab Emirates, 4–6 February 2014; Springer: Cham, Switzerland, 2014; pp. 59–71. [Google Scholar] [CrossRef]
  44. Restrepo, C.; Garcia, G.; Calvente, J.; Giral, R.; Martinez-Salamero, L. Model identification of a Proton-Exchange Membrane Fuel-Cell from an input-output experiment: The diffusive representation approach. In Proceedings of the 2013 European Control Conference (ECC), Zurich, Switzerland, 17–19 July 2013; pp. 3578–3583. [Google Scholar] [CrossRef]
  45. Restrepo, C.; Torres, C.; Calvente, J.; Giral, R.; Leyva, R. Simulator of a PEM fuel-cell stack based on a dynamic model. In Proceedings of the 2009 35th Annual Conference of IEEE Industrial Electronics, Porto, Portugal, 3–5 November 2009; pp. 2796–2801. [Google Scholar] [CrossRef]
  46. Gruber, J.K.; Bordons, C.; Oliva, A. Nonlinear MPC for the airflow in a PEM fuel cell using a Volterra series model. Control. Eng. Pract. 2012, 20, 205–217. [Google Scholar] [CrossRef]
  47. Ziogou, C.; Papadopoulou, S.; Georgiadis, M.C.; Voutetakis, S. On-line nonlinear model predictive control of a PEM fuel cell system. J. Process Control 2013, 23, 483–492. [Google Scholar] [CrossRef]
  48. Restrepo, C.; Konjedic, T.; Guarnizo, C.; Avino-Salvado, O.; Calvente, J.; Romero, A.; Giral, R. Simplified mathematical model for calculating the oxygen excess ratio of a PEM fuel cell system in real-time applications. IEEE Trans. Ind. Electron. 2014, 61, 2816–2825. [Google Scholar] [CrossRef]
  49. Djilali, N.; Lu, D. Influence of heat transfer on gas and water transport in fuel cells. Int. J. Therm. Sci. 2002, 41, 29–40. [Google Scholar] [CrossRef]
  50. St-Pierre, J. Simple mathematical model for water diffusion in Nafion® membranes. Proc.-Electrochem. Soc. 2005, 2002-31, 373–387. [Google Scholar] [CrossRef]
  51. Chang, P.A.C.; St-Pierre, J.; Stumper, J.; Wetton, B. Flow distribution in proton exchange membrane fuel cell stacks. J. Power Sources 2006, 162, 340–355. [Google Scholar] [CrossRef]
  52. Owejan, J.P.; Trabold, T.A.; Gagliardo, J.J.; Jacobson, D.L.; Carter, R.N.; Hussey, D.S.; Arif, M. Voltage instability in a simulated fuel cell stack correlated to cathode water accumulation. J. Power Sources 2007, 171, 626–633. [Google Scholar] [CrossRef]
  53. Du, F.; Dao, T.A.; Peitl, P.V.J.; Bauer, A.; Preuss, K.; Bonastre, A.M.; Sharman, J.; Spikes, G.; Perchthaler, M.; Schmidt, T.J.; et al. Effects of PEMFC Operational History under Dry/Wet Conditions on Additional Voltage Losses due to Ionomer Migration. J. Electrochem. Soc. 2020, 167, 144513. [Google Scholar] [CrossRef]
  54. Hinaje, M.; Sadli, I.; Martin, J.P.; Thounthong, P.; Raël, S.; Davat, B. Online humidification diagnosis of a PEMFC using a static DC-DC converter. Int. J. Hydrogen Energy 2009, 34, 2718–2723. [Google Scholar] [CrossRef]
  55. Grötsch, M.; Mangold, M.; Kienle, A. Analysis of the coupling behavior of PEM fuel cells and DC-DC converters. Energies 2009, 2, 71–96. [Google Scholar] [CrossRef]
  56. Hissel, D.; Candusso, D.; Harel, F. Fuzzy-clustering durability diagnosis of polymer electrolyte fuel cells dedicated to transportation applications. IEEE Trans. Veh. Technol. 2007, 56, 2414–2420. [Google Scholar] [CrossRef]
  57. Sutharssan, T.; Montalvao, D.; Chen, Y.K.; Wang, W.C.; Pisac, C.; Elemara, H. A review on prognostics and health monitoring of proton exchange membrane fuel cell. Renew. Sustain. Energy Rev. 2017, 75, 440–450. [Google Scholar] [CrossRef]
  58. Becherif, M.; Péra, M.C.; Hissel, D.; Zheng, Z. Determination of the health state of fuel cell vehicle for a clean transportation. J. Clean. Prod. 2018, 171, 1510–1519. [Google Scholar] [CrossRef]
  59. Pang, R.; Zhang, C.; Dai, H.; Bai, Y.; Hao, D.; Chen, J.; Zhang, B. Intelligent health states recognition of fuel cell by cell voltage consistency under typical operating parameters. Appl. Energy 2022, 305, 117735. [Google Scholar] [CrossRef]
  60. Jouin, M.; Gouriveau, R.; Hissel, D.; Péra, M.C.; Zerhouni, N. Prognostics and Health Management of PEMFC—State of the art and remaining challenges. Int. J. Hydrogen Energy 2013, 38, 15307–15317. [Google Scholar] [CrossRef]
  61. Zhang, X.; Pisu, P. Prognostic-oriented fuel cell catalyst aging modeling and its application to health-monitoring and prognostics of a PEM fuel cell. Int. J. Progn. Heal. Manag. 2014, 5, 1–16. [Google Scholar] [CrossRef]
  62. Cardoso, A.J.M. Introduction. In Diagnosis and Fault Tolerance of Electrical Machines, Power Electronics and Drives; The Institution of Engineering and Technology: Stevenage, UK, 2018; pp. 1–6. [Google Scholar] [CrossRef]
  63. Salim, R.I.; Noura, H.; Fardoun, A. A review on fault diagnosis tools of the proton exchange Membrane Fuel Cell. In Proceedings of the 2013 Conference on Control and Fault-Tolerant Systems (SysTol), Nice, France, 9–11 October 2013; pp. 686–693. [Google Scholar] [CrossRef]
  64. Khan, S.S.; Shareef, H.; Ibrahim, A.A. Improved Semi-empirical Model of Proton Exchange Membrane Fuel Cell Incorporating Fault Diagnostic Feature. J. Mod. Power Syst. Clean Energy 2021, 9, 1566–1573. [Google Scholar] [CrossRef]
  65. Singh, Y.; White, R.T.; Najm, M.; Boswell, A.; Orfino, F.P.; Dutta, M.; Kjeang, E. Mitigation of Mechanical Membrane Degradation in Fuel Cells by Controlling Electrode Morphology: A 4D In Situ Structural Characterization. J. Electrochem. Soc. 2021, 168, 034521. [Google Scholar] [CrossRef]
  66. Hernandez, A.; Hissel, D.; Outbib, R. Modeling and fault diagnosis of a polymer electrolyte fuel cell using electrical equivalent analysis. IEEE Trans. Energy Convers. 2010, 25, 148–160. [Google Scholar] [CrossRef]
  67. Lin, Z.; Wang, C.H.; Liu, Y. The fault analysis and diagnosis of proton exchange membrane fuel cell stack. Adv. Mater. Res. 2011, 197–198, 705–710. [Google Scholar] [CrossRef]
  68. Frappé, E.; De Bernardinis, A.; Bethoux, O.; Candusso, D.; Harel, F.; Marchand, C.; Coquery, G. PEM fuel cell fault detection and identification using differential method: Simulation and experimental validation. EPJ Appl. Phys. 2011, 54, 1–11. [Google Scholar] [CrossRef]
  69. Wasterlain, S.; Candusso, D.; Harel, F.; Hissel, D.; Franois, X. Development of new test instruments and protocols for the diagnostic of fuel cell stacks. J. Power Sources 2011, 196, 5325–5333. [Google Scholar] [CrossRef]
  70. Xu, K.; Zhao, X.; Hu, X.; Guo, Z.; Ye, Q.; Li, L.; Song, J.; Song, P. The review of the degradation mechanism of the catalyst layer of membrane electrode assembly in the proton exchange membrane fuel cell. IOP Conf. Ser. Earth Environ. Sci. 2020, 558, 052041. [Google Scholar] [CrossRef]
  71. Yousfi-Steiner, N.; Moçotéguy, P.; Candusso, D.; Hissel, D. A review on polymer electrolyte membrane fuel cell catalyst degradation and starvation issues: Causes, consequences and diagnostic for mitigation. J. Power Sources 2009, 194, 130–145. [Google Scholar] [CrossRef]
  72. Gottesfeld, W.G.S. Degradation of Catalyst for PEMFCs. J. Electrochem. Soc. 1993, 1, 2872–2877. [Google Scholar]
  73. Yu, X.; Ye, S. Recent advances in activity and durability enhancement of Pt/C catalytic cathode in PEMFC. Part II: Degradation mechanism and durability enhancement of carbon supported platinum catalyst. J. Power Sources 2007, 172, 145–154. [Google Scholar] [CrossRef]
  74. Silva, R.E.; Harel, F.; Jemeï, S.; Gouriveau, R.; Hissel, D.; Boulon, L.; Agbossou, K. Proton exchange membrane fuel cell operation and degradation in short-circuit. Fuel Cells 2014, 14, 894–905. [Google Scholar] [CrossRef]
  75. Dijoux, E.; Steiner, N.Y.; Benne, M.; Péra, M.C.; Pérez, B.G. A review of fault tolerant control strategies applied to proton exchange membrane fuel cell systems. J. Power Sources 2017, 359, 119–133. [Google Scholar] [CrossRef]
  76. Fukuhara, S.; Marx, N.; Ettihir, K.; Boulon, L.; Ait-Amirat, Y.; Becherif, M. A lumped fluidic model of an anode chamber for fault tolerant strategy design. Int. J. Hydrogen Energy 2016, 41, 5037–5047. [Google Scholar] [CrossRef]
  77. Wu, J.; Yuan, X.Z.; Wang, H.; Blanco, M.; Martin, J.J.; Zhang, J. Diagnostic tools in PEM fuel cell research: Part I Electrochemical techniques. Int. J. Hydrogen Energy 2008, 33, 1735–1746. [Google Scholar] [CrossRef]
  78. Wu, J.; Zi Yuan, X.; Wang, H.; Blanco, M.; Martin, J.J.; Zhang, J. Diagnostic tools in PEM fuel cell research: Part II. Physical/chemical methods. Int. J. Hydrogen Energy 2008, 33, 1747–1757. [Google Scholar] [CrossRef]
  79. Sung, L.Y.; Hwang, B.J.; Hsueh, K.L.; Tsau, F.H. Effects of anode air bleeding on the performance of CO-poisoned proton-exchange membrane fuel cells. J. Power Sources 2010, 195, 1630–1639. [Google Scholar] [CrossRef]
  80. Schonvogel, D.; Büsselmann, J.; Wagner, P.; Kraus, H.; Misz, U.; Langnickel, H.; Dyck, A. Effect of air contamination by sulfur dioxide on the high temperature PEM fuel cell. Int. J. Hydrogen Energy 2021, 46, 6751–6761. [Google Scholar] [CrossRef]
  81. Wagner, N.; Schulze, M. Change of electrochemical impedance spectra during CO poisoning of the Pt and Pt-Ru anodes in a membrane fuel cell (PEFC). Electrochim. Acta 2003, 48, 3899–3907. [Google Scholar] [CrossRef]
  82. Le Canut, J.-M.; Abouatallah, R.M.; Harrington, D.A. Detection of Membrane Drying, Fuel Cell Flooding, and Anode Catalyst Poisoning on PEMFC Stacks by Electrochemical Impedance Spectroscopy. J. Electrochem. Soc. 2006, 153, A857. [Google Scholar] [CrossRef]
  83. Baschuk, J.J.; Li, X. Carbon monoxide poisoning of proton exchange membrane fuel cells. Int. J. Energy Res. 2001, 713, 695–713. [Google Scholar] [CrossRef]
  84. Murthy, M.; Esayian, M.; Lee, W.; Zee, J.W. Van The Effect of Temperature and Pressure on the Performance of a PEMFC Exposed to Transient CO Concentrations The Effect of Temperature and Pressure on the Performance of a PEMFC Exposed to Transient CO Concentrations. J. Electrochem. Soc. 2003, 150, A29. [Google Scholar] [CrossRef]
  85. Choi, W.; Enjeti, P.N.; Appleby, A.J. An Advanced Power Converter Topology to Significantly Improve the CO Tolerance of the PEM Fuel Cell Power Systems. In Proceedings of the Conference Record of the 2004 IEEE Industry Applications Conference, 2004, 39th IAS Annual Meeting, Seattle, WA, USA, 3–7 October 2004; Volume 2, pp. 1185–1191. [Google Scholar] [CrossRef]
  86. Collong, S.; Kouta, R. Fault tree analysis of proton exchange membrane fuel cell system safety. Int. J. Hydrogen Energy 2015, 40, 8248–8260. [Google Scholar] [CrossRef]
  87. Ingimundarson, A.; Stefanopoulou, A.G.; McKay, D.A. Model-based detection of hydrogen leaks in a fuel cell stack. IEEE Trans. Control. Syst. Technol. 2008, 16, 1004–1012. [Google Scholar] [CrossRef]
  88. Tian, G.; Wasterlain, S.; Endichi, I.; Candusso, D.; Harel, F.; François, X.; Péra, M.C.; Hissel, D.; Kauffmann, J.M. Diagnosis methods dedicated to the localisation of failed cells within PEMFC stacks. J. Power Sources 2008, 182, 449–461. [Google Scholar] [CrossRef]
  89. Tian, G.; Wasterlain, S.; Candusso, D.; Harel, F.; Hissel, D.; François, X. Identification of failed cells inside PEMFC stacks in two cases: Anode/cathode crossover and anode/cooling compartment leak. Int. J. Hydrogen Energy 2010, 35, 2772–2776. [Google Scholar] [CrossRef]
  90. Zhou, S.; Jervis, R. A Review of Polymer Electrolyte Fuel Cells Fault Diagnosis: Progress and Perspectives. Chemistry-Methods 2024, 4, e202300030. [Google Scholar] [CrossRef]
  91. Escobet, T.; Feroldi, D.; de Lira, S.; Puig, V.; Quevedo, J.; Riera, J.; Serra, M. Model-based fault diagnosis in PEM fuel cell systems. J. Power Sources 2009, 192, 216–223. [Google Scholar] [CrossRef]
  92. Rosich, A.; Nejjari, F.; Sarrate, R. Fuel Cell System Diagnosis Based on a Causal Structural Model; IFAC: Prague, Czech Republic, 2009; Volume 42, ISBN 9783902661463. [Google Scholar]
  93. Cadet, C.; Jemeï, S.; Druart, F.; Hissel, D. Diagnostic tools for PEMFCs: From conception to implementation. Int. J. Hydrogen Energy 2014, 39, 10613–10626. [Google Scholar] [CrossRef]
  94. Zhan, Y.; Wang, H.; Zhu, J.; Guo, Y. Fault monitoring and control of PEM fuel cell as backup power for UPS applications. In Proceedings of the 2009 IEEE Energy Conversion Congress and Exposition, San Jose, CA, USA, 20–24 September 2009; pp. 631–638. [Google Scholar] [CrossRef]
  95. Onanena, R.; Oukhellou, L.; Candusso, D.; Harel, F.; Hissel, D.; Aknin, P. Fuel cells static and dynamic characterizations as tools for the estimation of their ageing time. Int. J. Hydrogen Energy 2011, 36, 1730–1739. [Google Scholar] [CrossRef]
  96. Wasterlain, S.; Candusso, D.; Harel, F.; François, X.; Péra, M.C.; Hissel, D. Durability test results of a polymer electrolyte membrane fuel cell operated at overnominal temperature with low humidified reactants. J. Fuel Cell Sci. Technol. 2010, 7, 0245021–0245024. [Google Scholar] [CrossRef]
  97. Gerard, M.; Poirot-Crouvezier, J.P.; Hissel, D.; Ṕra, M.C. Ripple current effects on PEMFC aging test by experimental and modeling. J. Fuel Cell Sci. Technol. 2011, 8, 021004. [Google Scholar] [CrossRef]
  98. Yildiz, E.; Vural, B.; Akar, F. Current ripple minimization of a PEM fuel cell via an interleaved converter to prolong the stack life. In Proceedings of the 2016 19th International Symposium on Electrical Apparatus and Technologies (SIELA), Bourgas, Bulgaria, 29 May–1 June 2016; pp. 1–4. [Google Scholar] [CrossRef]
  99. Zhang, J.; Song, C.; Zhang, J. Accelerated Lifetime Testing for Proton Exchange Membrane Fuel Cells Using Extremely High Temperature and Unusually High Load. J. Fuel Cell Sci. Technol. 2011, 8, 051006. [Google Scholar] [CrossRef]
  100. Yousfi-Steiner, N.; Moçotéguy, P.; Candusso, D.; Hissel, D.; Hernandez, A.; Aslanides, A. A review on PEM voltage degradation associated with water management: Impacts, influent factors and characterization. J. Power Sources 2008, 183, 260–274. [Google Scholar] [CrossRef]
  101. Steiner, N.Y.; Candusso, D.; Hissel, D.; Mooteguy, P. Model-based diagnosis for proton exchange membrane fuel cells. Math. Comput. Simul. 2010, 81, 158–170. [Google Scholar] [CrossRef]
  102. Zawodzinski, T.A.; Derouin, C.; Radzinski, S.; Sherman, R.J.; Smith, V.T.; Springer, T.E.; Gottesfeld, S. Water Uptake by and Transport Through Nafion® 117 Membranes. J. Electrochem. Soc. 1993, 140, 1041–1047. [Google Scholar] [CrossRef]
  103. Eckl, R.; Zehtner, W.; Leu, C.; Wagner, U. Experimental analysis of water management in a self-humidifying polymer electrolyte fuel cell stack. J. Power Sources 2004, 138, 137–144. [Google Scholar] [CrossRef]
  104. Wilkinson, D.P.; Voss, H.H.; Prater, K. Water management and stack design for solid polymer fuel cells. J. Power Sources 1994, 49, 117–127. [Google Scholar] [CrossRef]
  105. Bevers, D.; Rogers, R.; Von Bradke, M. Examination of the influence of PTFE coating on the properties of carbon paper in polymer electrolyte fuel cells. J. Power Sources 1996, 63, 193–201. [Google Scholar] [CrossRef]
  106. Li, H.; Tang, Y.; Wang, Z.; Shi, Z.; Wu, S.; Song, D.; Zhang, J.; Fatih, K.; Zhang, J.; Wang, H.; et al. A review of water flooding issues in the proton exchange membrane fuel cell. J. Power Sources 2008, 178, 103–117. [Google Scholar] [CrossRef]
  107. Jordan, L.R.; Shukla, A.K.; Behrsing, T.; Avery, N.R.; Muddle, B.C.; Forsyth, M. Effect of diffusion-layer morphology on the performance of polymer electrolyte fuel cells operating at atmospheric pressure. J. Appl. Electrochem. 2000, 30, 641–646. [Google Scholar] [CrossRef]
  108. Passalacqua, E.; Squadrito, G.; Lufrano, F.; Patti, A.; Giorgi, L.; Conversion, E.E. Effects of the diffusion layer characteristics on the performance of polymer electrolyte fuel cell electrodes. J. Appl. Electrochem. 2001, 31, 449–454. [Google Scholar] [CrossRef]
  109. Ge, S.; Wang, C.-Y. Liquid Water Formation and Transport in the PEFC Anode. J. Electrochem. Soc. 2007, 154, B998. [Google Scholar] [CrossRef]
  110. Holmström, N.; Ihonen, J.; Lundblad, A.; Lindbergh, G. The influence of the gas diffusion layer on water management in polymer electrolyte fuel cells. Fuel Cells 2007, 7, 306–313. [Google Scholar] [CrossRef]
  111. Chen, J. Dominant frequency of pressure drop signal as a novel diagnostic tool for the water removal in proton exchange membrane fuel cell flow channel. J. Power Sources 2010, 195, 1177–1181. [Google Scholar] [CrossRef]
  112. Hakenjos, A.; Muenter, H.; Wittstadt, U.; Hebling, C. A PEM fuel cell for combined measurement of current and temperature distribution, and flow field flooding. J. Power Sources 2004, 131, 213–216. [Google Scholar] [CrossRef]
  113. Barbir, F.; Gorgun, H.; Wang, X. Relationship between pressure drop and cell resistance as a diagnostic tool for PEM fuel cells. J. Power Sources 2005, 141, 96–101. [Google Scholar] [CrossRef]
  114. Ma, H.P.; Zhang, H.M.; Hu, J.; Cai, Y.H.; Yi, B.L. Diagnostic tool to detect liquid water removal in the cathode channels of proton exchange membrane fuel cells. J. Power Sources 2006, 162, 469–473. [Google Scholar] [CrossRef]
  115. White, R.J.; Ghez, A.M. Current Interruption—Instrumentation and Applications. J. Electrochem. Soc. 1987, 134, 539–546. [Google Scholar]
  116. Wang, S.; Zhang, J.; Gharbi, O.; Vivier, V.; Gao, M.; Orazem, M.E. Electrochemical impedance spectroscopy. Nat. Rev. Methods Prim. 2021, 1, 41. [Google Scholar] [CrossRef]
  117. Legros, B.; Thivel, P.X.; Bultel, Y.; Nogueira, R.P. First results on PEMFC diagnosis by electrochemical noise. Electrochem. Commun. 2011, 13, 1514–1516. [Google Scholar] [CrossRef]
  118. Gebregergis, A.; Pillay, P.; Rengaswamy, R. PEMFC fault diagnosis, modeling, and mitigation. IEEE Trans. Ind. Appl. 2010, 46, 295–303. [Google Scholar] [CrossRef]
  119. Qin, C.; Wang, J.; Yang, D.; Li, B.; Zhang, C. Proton exchange membrane fuel cell reversal: A review. Catalysts 2016, 6, 197. [Google Scholar] [CrossRef]
  120. Wasterlain, S.; Candusso, D.; Hissel, D.; Harel, F.; Bergman, P.; Menard, P.; Anwar, M. Study of temperature, air dew point temperature and reactant flow effects on proton exchange membrane fuel cell performances using electrochemical spectroscopy and voltammetry techniques. J. Power Sources 2010, 195, 984–993. [Google Scholar] [CrossRef]
  121. Riascos, L.A.M.; Cozman, F.G.; Miyagi, P.E.; Simões, M.G. Bayesian network supervision on fault tolerant fuel cells. In Proceedings of the Conference Record of the 2006 IEEE Industry Applications Conference Forty-First IAS Annual Meeting, Tampa, FL, USA, 8–12 October 2006; Volume 2, pp. 1059–1066. [Google Scholar] [CrossRef]
  122. Riascos, L.A.M.; Simoes, M.G.; Miyagi, P.E. A Bayesian network fault diagnostic system for proton exchange membrane fuel cells. J. Power Sources 2007, 165, 267–278. [Google Scholar] [CrossRef]
  123. Candusso, D.; De Bernardinis, A.; Péra, M.C.; Harel, F.; François, X.; Hissel, D.; Coquery, G.; Kauffmann, J.M. Fuel cell operation under degraded working modes and study of diode by-pass circuit dedicated to multi-stack association. Energy Convers. Manag. 2008, 49, 880–895. [Google Scholar] [CrossRef]
  124. De Bernardinis, A.; Candusso, D.; Harel, F.; François, X.; Coquery, G. Experiments of a 20 cell PEFC operating under fault conditions with diode by-pass circuit for uninterrupted power delivery. Energy Convers. Manag. 2010, 51, 1044–1054. [Google Scholar] [CrossRef]
  125. Zheng, Z.; Petrone, R.; Pera, M.C.; Hissel, D.; Becherif, M.; Pianese, C. Diagnosis of a commercial PEM fuel cell stack via incomplete spectra and fuzzy clustering. In Proceedings of the IECON 2013—39th Annual Conference of the IEEE Industrial Electronics Society, Vienna, Austria, 10–13 November 2013; pp. 1595–1600. [Google Scholar] [CrossRef]
  126. Zheng, Z.; Péra, M.C.; Hissel, D.; Becherif, M.; Agbli, K.S.; Li, Y. A double-fuzzy diagnostic methodology dedicated to online fault diagnosis of proton exchange membrane fuel cell stacks. J. Power Sources 2014, 271, 570–581. [Google Scholar] [CrossRef]
  127. Pahon, E.; Yousfi Steiner, N.; Jemei, S.; Hissel, D.; Moçoteguy, P. A signal-based method for fast PEMFC diagnosis. Appl. Energy 2016, 165, 748–758. [Google Scholar] [CrossRef]
  128. Bianchi, F.D.; Ocampo-Martinez, C.; Kunusch, C.; Sánchez-Peña, R.S. Fault-tolerant unfalsified control for PEM fuel cell systems. IEEE Trans. Energy Convers. 2015, 30, 307–315. [Google Scholar] [CrossRef]
  129. Liu, J.; Luo, W.; Yang, X.; Wu, L. Robust Model-Based Fault Diagnosis for PEM Fuel Cell Air-Feed System. IEEE Trans. Ind. Electron. 2016, 63, 3261–3270. [Google Scholar] [CrossRef]
  130. Niroumand, A.M.; Mérida, W.; Saif, M. PEM fuel cell low flow FDI. J. Process Control 2011, 21, 602–612. [Google Scholar] [CrossRef]
  131. Polak, A.; Grzeczka, G.; Piłat, T. Influence of cathode stoichiometry on operation of PEM fuel cells’ stack supplied with pure oxygen. J. Mar. Eng. Technol. 2018, 16, 283–290. [Google Scholar] [CrossRef]
  132. Hinaje, M.; Raël, S.; Caron, J.P.; Davat, B. An innovating application of PEM fuel cell: Current source controlled by hydrogen supply. Int. J. Hydrogen Energy 2012, 37, 12481–12488. [Google Scholar] [CrossRef]
  133. De Bernardinis, A.; Candusso, D.; Harel, F.; Coquery, G. Power electronics interface for an hybrid PEMFC generating system with fault management strategies for transportation. In Proceedings of the 2009 13th European Conference on Power Electronics and Applications, Barcelona, Spain, 8–10 September 2009. [Google Scholar]
  134. Rao, S.S.L.; Shaija, A.; Jayaraj, S. Performance analysis of a transparent PEM fuel cell at theoptimized clamping pressure applied on its bolts. Mater. Today Proc. 2018, 5, 58–65. [Google Scholar] [CrossRef]
  135. Hua, J.; Li, J.; Ouyang, M.; Lu, L.; Xu, L. Proton exchange membrane fuel cell system diagnosis based on the multivariate statistical method. Int. J. Hydrogen Energy 2011, 36, 9896–9905. [Google Scholar] [CrossRef]
  136. Mao, L.; Jackson, L.; Davies, B. Investigation of PEMFC fault diagnosis with consideration of sensor reliability. Int. J. Hydrogen Energy 2018, 43, 16941–16948. [Google Scholar] [CrossRef]
  137. Bento, F.; Cardoso, A.J.M. Novel Fault Tolerant DC-DC Converter Architecture for LED Lighting Systems Operating in DC Microgrids. In Proceedings of the 2019 IEEE Third International Conference on DC Microgrids (ICDCM), Matsue, Japan, 20–23 May 2019; pp. 16–21. [Google Scholar] [CrossRef]
  138. Bento, F.; Cardoso, A.J.M. Open-Circuit Fault Diagnosis and Fault Tolerant Operation of Interleaved DC-DC Boost Converters for Homes and Offices. IEEE Trans. Ind. Appl. 2019, 55, 4855–4864. [Google Scholar] [CrossRef]
  139. Cardoso, A.J.M.; Bento, F. Diagnostics and Fault Tolerance in DC–DC Converters and Related Industrial Electronics Technologies. Electronics 2023, 12, 2341. [Google Scholar] [CrossRef]
  140. Bento, F. Fault Tolerant DC-DC Converters at Homes and Offices. Ph.D. Dissertation, University of Beira Interior, Covilhã, Portugal, 2022. [Google Scholar]
  141. Yousfi Steiner, N.; Hissel, D.; Moçotéguy, P.; Candusso, D.; Marra, D.; Pianese, C.; Sorrentino, M. Application of fault tree analysis to fuel cell diagnosis. Fuel Cells 2012, 12, 302–309. [Google Scholar] [CrossRef]
  142. Webb, D.; Møller-Holst, S. Measuring individual cell voltages in fuel cell stacks. J. Power Sources 2001, 103, 54–60. [Google Scholar] [CrossRef]
  143. Mulder, G.; De Ridder, F.; Coenen, P.; Weyen, D.; Martens, A. Evaluation of an on-site cell voltage monitor for fuel cell systems. Int. J. Hydrogen Energy 2008, 33, 5728–5737. [Google Scholar] [CrossRef]
  144. Sorrentino, A.; Sundmacher, K.; Vidakovic-Koch, T. Polymer electrolyte fuel cell degradation mechanisms and their diagnosis by frequency response analysis methods: A review. Energies 2020, 13, 5825. [Google Scholar] [CrossRef]
  145. Wasterlain, S.; Candusso, D.; Harel, F.; François, X.; Hissel, D.; Member, S. Diagnosis of a Fuel Cell Stack Using Electrochemical Impedance Spectroscopy and Bayesian Networks. In Proceedings of the 2010 IEEE Vehicle Power and Propulsion Conference, Lille, France, 1–3 September 2010; pp. 1–6. [Google Scholar]
  146. Yang, Q.; Aitouche, A.; Ould Bouamama, B. Model based Fault detection and isolation of PEM fuel cell. In Proceedings of the 2010 Conference on Control and Fault-Tolerant Systems (SysTol), Nice, France, 6–8 October 2010; pp. 825–830. [Google Scholar] [CrossRef]
  147. Shao, M.; Zhu, X.J.; Cao, H.F.; Shen, H.F. An artificial neural network ensemble method for fault diagnosis ofproton exchange membrane fuel cell system. Energy 2014, 67, 268–275. [Google Scholar] [CrossRef]
  148. Li, Z.; Outbib, R.; Hissel, D.; Giurgea, S. Data-driven diagnosis of PEM fuel cell: A comparative study. Control Eng. Pract. 2014, 28, 1–12. [Google Scholar] [CrossRef]
  149. Benouioua, D.; Candusso, D.; Harel, F.; Oukhellou, L. Fuel cell diagnosis method based on multifractal analysis of stack voltage signal. Int. J. Hydrogen Energy 2014, 39, 2236–2245. [Google Scholar] [CrossRef]
  150. Benouioua, D.; Candusso, D.; Harel, F.; Oukhellou, L. PEMFC stack voltage singularity measurement and fault classification. Int. J. Hydrogen Energy 2014, 39, 21631–21637. [Google Scholar] [CrossRef]
  151. Sethi, A.; Verstraete, D. A Comparative Study of Wavelet-based Descriptors for Fault Diagnosis of Self-Humidified Proton Exchange Membrane Fuel Cells. Fuel Cells 2020, 20, 131–142. [Google Scholar] [CrossRef]
  152. Benouioua, D.; Candusso, D.; Harel, F.; François, X.; Picard, P. Characterization of low and high frequency phenomena in a PEM fuel cell using singularity analysis of stack voltage. J. Energy Storage 2020, 28, 101298. [Google Scholar] [CrossRef]
  153. Benouioua, D.; Candusso, D.; Harel, F.; Picard, P. Diagnosis of fuel cells using instantaneous frequencies and envelopes extracted from stack voltage signal. Int. J. Hydrogen Energy 2022, 47, 9706–9718. [Google Scholar] [CrossRef]
  154. Ao, Y.; Laghrouche, S.; Depernet, D.; Candusso, D. Diagnosis of PEMFC based on autoregressive model and voltage fluctuation. In Proceedings of the 2022 10th International Conference on Systems and Control (ICSC), Marseille, France, 23–25 November 2022; pp. 346–351. [Google Scholar] [CrossRef]
  155. Zhang, X.; Zhang, T.; Chen, H.; Cao, Y. A review of online electrochemical diagnostic methods of on-board proton exchange membrane fuel cells. Appl. Energy 2021, 286, 116481. [Google Scholar] [CrossRef]
  156. Narjiss, A.; Depernet, D.; Candusso, D.; Gustin, F.; Hissel, D. Online diagnosis of PEM fuel cell. In Proceedings of the 2008 13th International Power Electronics and Motion Control Conference, Poznan, Poland, 1–3 September 2008; pp. 734–739. [Google Scholar] [CrossRef]
  157. Dotelli, G.; Ferrero, R.; Stampino, P.G.; Latorrata, S.; Toscani, S. Low-cost PEM fuel cell diagnosis based on power converter ripple with hysteresis control. IEEE Trans. Instrum. Meas. 2015, 64, 2900–2907. [Google Scholar] [CrossRef]
  158. Katayama, N.; Kogoshi, S. Real-Time Electrochemical Impedance Diagnosis for Fuel Cells Using a DC-DC Converter. IEEE Trans. Energy Convers. 2015, 30, 707–713. [Google Scholar] [CrossRef]
  159. Frappé, E.; De Bernardinis, A.; Bethoux, O.; Marchand, C.; Coquery, G. Fault detection and identification using simple and non-intrusive on-line monitoring techniques for pem fuel cell. In Proceedings of the 2010 IEEE International Symposium on Industrial Electronics, Bari, Italy, 4–7 July 2010; pp. 2029–2034. [Google Scholar] [CrossRef]
  160. Damour, C.; Benne, M.; Grondin-Perez, B.; Bessafi, M.; Hissel, D.; Chabriat, J.P. Polymer electrolyte membrane fuel cell fault diagnosis based on empirical mode decomposition. J. Power Sources 2015, 299, 596–603. [Google Scholar] [CrossRef]
  161. Riascos, L.A.M.; Simoes, M.G.; Miyagi, P.E. On-line fault diagnostic system for proton exchange membrane fuel cells. J. Power Sources 2008, 175, 419–429. [Google Scholar] [CrossRef]
  162. Yousfi Steiner, N.; Hissel, D.; Moçtéguy, P.; Candusso, D. Diagnosis of polymer electrolyte fuel cells failure modes (flooding & drying out) by neural networks modeling. Int. J. Hydrogen Energy 2011, 36, 3067–3075. [Google Scholar] [CrossRef]
  163. Jiang, S.; Li, Q.; Gan, R.; Chen, W. Fault diagnosis for pemfc water management subsystem based on learning vector quantization neural network and kernel principal component analysis. World Electr. Veh. J. 2021, 12, 255. [Google Scholar] [CrossRef]
  164. Zuo, B.; Zhang, Z.; Cheng, J.; Huo, W.; Zhong, Z.; Wang, M. Data-driven flooding fault diagnosis method for proton-exchange membrane fuel cells using deep learning technologies. Energy Convers. Manag. 2022, 251, 115004. [Google Scholar] [CrossRef]
  165. Kim, K.; Kim, J.; Choi, H.; Kwon, O.; Jang, Y.; Ryu, S.; Lee, H.; Shim, K.; Park, T.; Cha, S.W. Pre-diagnosis of flooding and drying in proton exchange membrane fuel cells by bagging ensemble deep learning models using long short-term memory and convolutional neural networks. Energy 2023, 266, 126441. [Google Scholar] [CrossRef]
  166. Lebreton, C.; Benne, M.; Damour, C.; Yousfi-Steiner, N.; Grondin-Perez, B.; Hissel, D.; Chabriat, J.P. Fault Tolerant Control Strategy applied to PEMFC water management. Int. J. Hydrogen Energy 2015, 40, 10636–10646. [Google Scholar] [CrossRef]
  167. Li, Z.; Giurgea, S.; Outbib, R.; Hissel, D. Online diagnosis of PEMFC by combining support vector machine and fluidic model. Fuel Cells 2014, 14, 448–456. [Google Scholar] [CrossRef]
  168. Li, Z.; Outbib, R.; Giurgea, S.; Hissel, D.; Jemei, S.; Giraud, A.; Rosini, S. Online implementation of SVM based fault diagnosis strategy for PEMFC systems. Appl. Energy 2016, 164, 284–293. [Google Scholar] [CrossRef]
  169. Bharath, K.V.S.; Blaabjerg, F.; Haque, A.; Khan, M.A. Model-based data driven approach for fault identification in proton exchange membrane fuel cell. Energies 2020, 13, 3144. [Google Scholar] [CrossRef]
  170. Khanafari, A.; Alasty, A.; Kermani, M.J.; Asghari, S. Flooding and dehydration diagnosis in a polymer electrolyte membrane fuel cell stack using an experimental adaptive neuro-fuzzy inference system. Int. J. Hydrogen Energy 2022, 47, 34628–34639. [Google Scholar] [CrossRef]
  171. Ibrahim, M.; Antoni, U.; Steiner, N.Y.; Jemei, S.; Kokonendji, C.; Ludwig, B.; Moçotéguy, P.; Hissel, D. Signal-Based Diagnostics by Wavelet Transform for Proton Exchange Membrane Fuel Cell. Energy Procedia 2015, 74, 1508–1516. [Google Scholar] [CrossRef]
  172. Steiner, N.Y.; Hissel, D.; Moçotéguy, P.; Candusso, D. Non intrusive diagnosis of polymer electrolyte fuel cells by wavelet packet transform. Int. J. Hydrogen Energy 2011, 36, 740–746. [Google Scholar] [CrossRef]
  173. Ramamoorthy, D.; Che Mid, E. Fault detection for PEM fuel cell using kalman filter. J. Phys. Conf. Ser. 2020, 1432, 012070. [Google Scholar] [CrossRef]
  174. Giurgea, S.; Tirnovan, R.; Hissel, D.; Outbib, R. An analysis of fluidic voltage statistical correlation for a diagnosis of PEM fuel cell flooding. Int. J. Hydrogen Energy 2013, 38, 4689–4696. [Google Scholar] [CrossRef]
  175. Maizia, R.; Dib, A.; Thomas, A.; Martemianov, S. Statistical short-time analysis of electrochemical noise generated within a proton exchange membrane fuel cell. J. Solid State Electrochem. 2017, 22, 1649–1660. [Google Scholar] [CrossRef]
  176. Benmouna, A.; Becherif, M.; Depernet, D.; Gustin, F.; Ramadan, H.S.; Fukuhara, S. Fault diagnosis methods for Proton Exchange Membrane Fuel Cell system. Int. J. Hydrogen Energy 2017, 42, 1534–1543. [Google Scholar] [CrossRef]
  177. Rubio, M.A.; Bethune, K.; Urquia, A.; St-Pierre, J. Proton exchange membrane fuel cell failure mode early diagnosis with wavelet analysis of electrochemical noise. Int. J. Hydrogen Energy 2016, 41, 14991–15001. [Google Scholar] [CrossRef]
Figure 1. General classification of electrical energy storage technologies.
Energies 17 00657 g001
Figure 2. Fuel Cell composition.
Energies 17 00657 g002
Figure 3. Typical Fuel Cell polarization curve.
Energies 17 00657 g003
Figure 4. Hydrogen feeding modes. (a) Dead-end mode; (b) flow-through mode; (c) recirculation mode.
Energies 17 00657 g004
Figure 5. General scheme of different FC models.
Energies 17 00657 g005
Figure 6. Generic Fuel Cell Equivalent Circuit Model. Legend: O C V : Open-Circuit Voltage; C A : Equivalent Capacity Between Anode and Membrane; R A : Anode Transfer Resistance; R e i : Internal Equivalent Resistance; C C : Equivalent Capacity Between Cathode and Membrane; R C : Cathode Transfer Resistance.
Energies 17 00657 g006
Figure 7. Generic Nyquist plot example with the incorporation of the electric equivalent circuit.
Energies 17 00657 g007
Figure 8. FC state of health (SOH).
Energies 17 00657 g008
Figure 9. Fuel Cell faults chart.
Energies 17 00657 g009
Figure 10. Water movement inside the Fuel Cell membrane.
Energies 17 00657 g010
Figure 11. Diagnostic tool fault-tree-like graph.
Energies 17 00657 g011
Figure 12. Residual formation and classification.
Energies 17 00657 g012
Figure 14. Diagram of FCs highlighting the main challenges in generating reliable FCs and their many applications.
Energies 17 00657 g014
Table 1. An overview of the different materials for different types of FCs.
TypeAnodeCathodeElectrolyteTemperature (°C)Application
Molten Carbonate Fuel Cells (MCFC)NiNiOMolten Li2CO3 in LiAlO−2550–700
(HT-FC)
Energy Storage/Cogeneration [16]
Alkaline Fuel Cell
(AFC)
Carbon (C)/Platinum (Pt) catalystCarbon (C)/Platinum (Pt) catalystAqueous KOHAmbient–250
(LT-FC)
Space Exploration [17]
Phosphoric Acid Fuel Cell
(PAFC)
C/Pt catalystC/Pt catalystPhosphoric acid in SiC matrix150–220
(LT-FC)
Stationary Power [18]
Direct Methanol Fuel Cell
(DMFC)
C/Pt catalystC/Pt catalystAcidic Polymer60–90
(LT-FC)
Portable Applications [19]
Solid Oxide Fuel Cell
(SOFC)
Ni-YSZLSM* PerovskiteYSZ*600–1000
(HT-FC)
Stationary and Distributed Power [20]
Polymer Electrolyte Membrane Fuel Cell
(PEMFC)
C/Pt catalystC/Pt catalystAcidic PolymerAmbient–90
(LT-FC)
Stationary, Portable and Vehicle Applications [21]
Note: YSZ* = Yttria-stabilized zirconia. LSM* = Stronia-dopped lanthanum manganite.
Table 2. A compilation of the most crucial and essential information on fault occurrence, diagnostic methods, and mitigation techniques as applied to Fuel Cell systems.
Membrane Deterioration
CausesSymptomsConsequencesDiagnosticsRecovering mechanism
[60] long hours of operation[63] significant alteration in the pressure gradient between cathode and node channels[64,65] small cracks
in the membrane
[63,69] EIS semi-circle increase, high impedance and high CDL
[66] equivalent model parameter evolution
[66] statical approach
[67] manufacture’s power data information comparison OR parallel high load resistance placement with individual voltage monitoring
[63,69] EIS
Not reported
Absence of catalyst
CausesSymptomsConsequencesDiagnosticsRecovering mechanism
[63,67] excessive water content and temperature
[75] poor fuel distribution or fuel starvation
[76] anode flooding
[63,67] output power of a single cell increases with the decrease in load resistance
[71] higher exchange current density, therefore, higher activation overpotential
[72] reduction in the OCV efficiency and rated powerNot a specific technique is reported; however, this fault typically occurs after more than thousands of operating hoursNot reported
CO Poisoning
CausesSymptomsConsequencesDiagnosticsRecovering mechanism
[75] hydrogen purity
[75] sulfur dioxide in the air
[79] sudden reduction in current when operated at nominal conditions
[82] reduction in OCV
[81,82] inductive behavior for F < 3 Hz on EIS Nyquist plot
[82] impedance 6 × higher for F < 100 Hz
[75] time of exposure
[75] cyclic voltammetry
[81] EIS
[75] filtering intake air
[79] air bleeding
[83,84] increase temperature
[75,85] high power converter pulsating current
Reactant Leakage
CausesSymptomsConsequencesDiagnosticsRecovering mechanism
[63,86] supply system, cracked graphite plates, seal-valves, and membrane cross-leaks.
[10] cracks in the cooling leakage
[87] water vapor content in the anode electrode
[94] abnormal variation in H2 pressure and mass flow
[88,89] reduction in OCV[87] pressure and humidity monitorization
[88,89] OCV using a signal-based technique
[90,91,92] fault sensitivity model-based approach
[93] model-based on-air mass flow residuals
[94] control switch between the FC and UPS system
Fuel Cell Aging
CausesSymptomsConsequencesDiagnosticsRecovering mechanism
[95] long hours of operation
[97,98] current ripple
[56,99] excessive temperature
[54] increase in internal equivalent resistanceOverall voltage reduction; Low power output
[56,99] higher activation and ohmic losses
[95,96] EIS and pattern recognition tool
[54] monitoring of internal equivalent resistance
[55] current ripple to estimate activation zone parameters, using buck and conventional buck-boost converters
Not reported
Water management
  • Cell design (GDL effect)
CausesSymptomsConsequencesDiagnosticsRecovering mechanism
[104] operation at nominal power
[107,108] electrode poor current distribution.
[106,107,108] poor mechanical compatibility between layers
[109] anode flooding (carbon corrosion-mostly for low current densities)
[110] low levels of reactant humidity
[109] excessive back-diffusion phenomena
[109] water condensation on the channel surfaces
[110] decrease in the overall efficiency
[110] increase in membrane resistance
[111] increase in the concentration losses
[111] elevated frequency peaks on the denominal frequency in the pressure drop signal
[109] infrared lighting technique
[111] pressure drop signal FFT analyzed
[104] improved MEA design
[105] electrode and GDL PTFE coating
[109] slowly increase the hydrogen and temperature
  • Flooding
CausesSymptomsConsequencesDiagnosticsRecovering mechanism
[104] operation at nominal power
[112] low temperature, and poor air distribution
[52] water droplets retained at the GDL
[76] anode flooding (unoptimized exhaustion system)
[112] excess of water at the anode
[113] increased pressure drops
[54,118] increased membrane resistance
[156] high level of overall impedance
[159] double layer effect affected
[101] temperature decreasing rapidly (oscillating dewpoint) + increased cathode pressure
[76] voltage degradation
[169] internal humidity levels higher than 100%
[169] high reactants pressure
[174] reactants hygrometry higher than 1.1
[125] low air stoichiometry
[100] decrease in electric power
[118] increased imaginary and real part in EIS results–Nyquist plot-(cathode flooded)
[118] decrease temperature (bigger EIS semi-circle diameter)
[52,53] neutron imaging
[101] online machine learning: ENN (cathode pressure residuals)
[112] infrared spectroscopy
[113] pressure, mass flow rate and humidity monitorization
[114] anode to cathode pressure drop
[115,116,117] EIS
[118] empirical equivalent model parameter estimation
[156] harmonic impedance measurement
[159] online threshold around the nominal polarization curve (current interrupt method)
[160] online signal based (EMD)
[161] online machine learning: BN
[163,164,165] online machine learning algorithm
[166] online Artificial Neural Network (ANN): cathode pressure and voltage residuals
[167,168] online SVM with FC fluidic model (air mass flow residuals)
[169] 3D electrochemical, and thermal semi-empirical FC model
[125,126,170] EIS-fuzzy clustering algorithm
[151,171,172,177] WVT signal processing
[173] Kalman filter
[174] statistical fluidic model approach
[175] EN analysis
[114] optimized fan velocity
[118] power convert optimized power-switch control
[156] online DC/DC converter control, which causes little perturbation to excess of the remaining water
[166] self-tuning PID controller for supplying oxygen
  • Drying
CausesSymptomsConsequencesDiagnosticsRecovering mechanism
[104] operation at nominal power
[54] excess air intake
[113] increase equivalent cell resistance
[156] high level of overall impedance
[54,118] increased membrane resistance
[169] internal humidity levels below 60%
[125] high air stoichiometry
[125] EIS results: high-frequency semi-loop because of the charge transfer phenomena
[100] decrease in electric power
[118] increase imaginary and real parts in EIS results–Nyquist plot- plus appearance of another semicircle in the low-frequency region. Negative slop in the magnitude response
[112] infrared spectroscopy
[115,116,117] EIS
[118] empirical equivalent model parameter estimation
[54] Randles’ electric equivalent circuit
[156,157,158] Online equivalent resistance estimation using voltage and current ripple content
[159] online threshold around the nominal polarization curve (current interrupt method)
[160] online signal based (EMD)
[161] Machine learning: BN
[101] Machine learning: ENN (cathode pressure residuals)
[163,164,165] online Machine Learning algorithm (online)
[167] SVM with FC fluidic model
[169] 3D electrochemical, and thermal semi-empirical FC model [125,126,170] EIS-fuzzy clustering algorithm
[171,172,177] WVT signal processing
[175] EN analysis
Cell operation
[118] power convert optimized power-switch control
[156] online DC/DC converter control, which causes little perturbation to excess of the remaining water
Fuel Starvation
CausesSymptomsConsequencesDiagnosticsRecovering mechanism
[71] undersupply of reactants (local or global)
[75] inefficient self-humidification technique (local starvation)
[71] reactant supply defective (global starvation)
[119] sudden load changes, or improper start-up conditions
[119,120] * hydrogen molar flow higher than the ratio between the current and the double of the Faraday’s constant (mathematically)
[122,131] oxygen stoichiometry close to 1 **
[131] air stoichiometry close to 2 **
[123] sudden voltage decrease (output power reduction)
[125] low air stoichiometry
[127] temperature increase
[127] irregular pressure gradient between inlet and outlet
[119] carbon corrosion for extreme H2 depletions
[121,122] water accumulation on the cathode
[122] voltage and current decrease until plateau, followed by an exponentially decreased (if air stoichiometry is continuously reduced)
[125] elevated mass transportations
[125] cathode flooding
[121] empirical model
[122] air stoichiometry BN model
[123] output power tracking
[125] EIS
[123] fuzzy c-means clustering
[127] pressure, stack voltage and individual cell voltage DWT signal processing
[128] oxygen stoichiometry rate UC adaptable control, using cathode pressure signal
[129] dynamic behavior of the cathode partial pressure, the air supply manifold, and the compressor dynamics
[123] multi-stack FC paired with antiparallel by-pass diodes
[128] oxygen stoichiometry rate UC adaptable control
[129,130] modified super-twisting sliding mode residuals
Short-circuit
CausesSymptomsConsequencesDiagnosticsRecovering mechanism
[74] self-humidification techniques, and high current peaks
[120] cell’s electrodes short-circuit (fuel crossover)
[74] suddenly water accumulation at the cathode
[74,132] poor H2 distribution, for high cell number stack, (especially in cells further from the H2 inlet)
[74] temperature hot spots in the membrane[120] Linear Sweep VoltammetryNot reported
Hardware/external faults
CausesSymptomsConsequencesDiagnosticsRecovering mechanism
[135] sensor’s network failure
[137,138,139,140] power electronics
[135] discrepancy in different sensors in the network[136] hinder the correct use of diagnosis tools[135] PCA in a bus fleet–Shanghai Expo
[136] faulty humidity sensor KPCA, WPT, and SVD
[137,138,139,140] Fault-tolerance in power electronics (interleaved converters, adaptative controllers)
Note: * starvation is more studied on the cathode side, but extreme H2 starvation has more catastrophic consequences than extreme starvation. ** For normal conditions, these values must be higher, and any value below the reference will cause fuel starvation. Furthermore, this value is very dependent on temperature and current.
Disclaimer/Publisher’s Note: The statements, opinions and data contained in all publications are solely those of the individual author(s) and contributor(s) and not of MDPI and/or the editor(s). MDPI and/or the editor(s) disclaim responsibility for any injury to people or property resulting from any ideas, methods, instructions or products referred to in the content.

