

Effect of Monodisperse Coal Particles on the Maximum Drop Spreading after Impact on a Solid Wall

Abstract
:1. Introduction
2. Materials
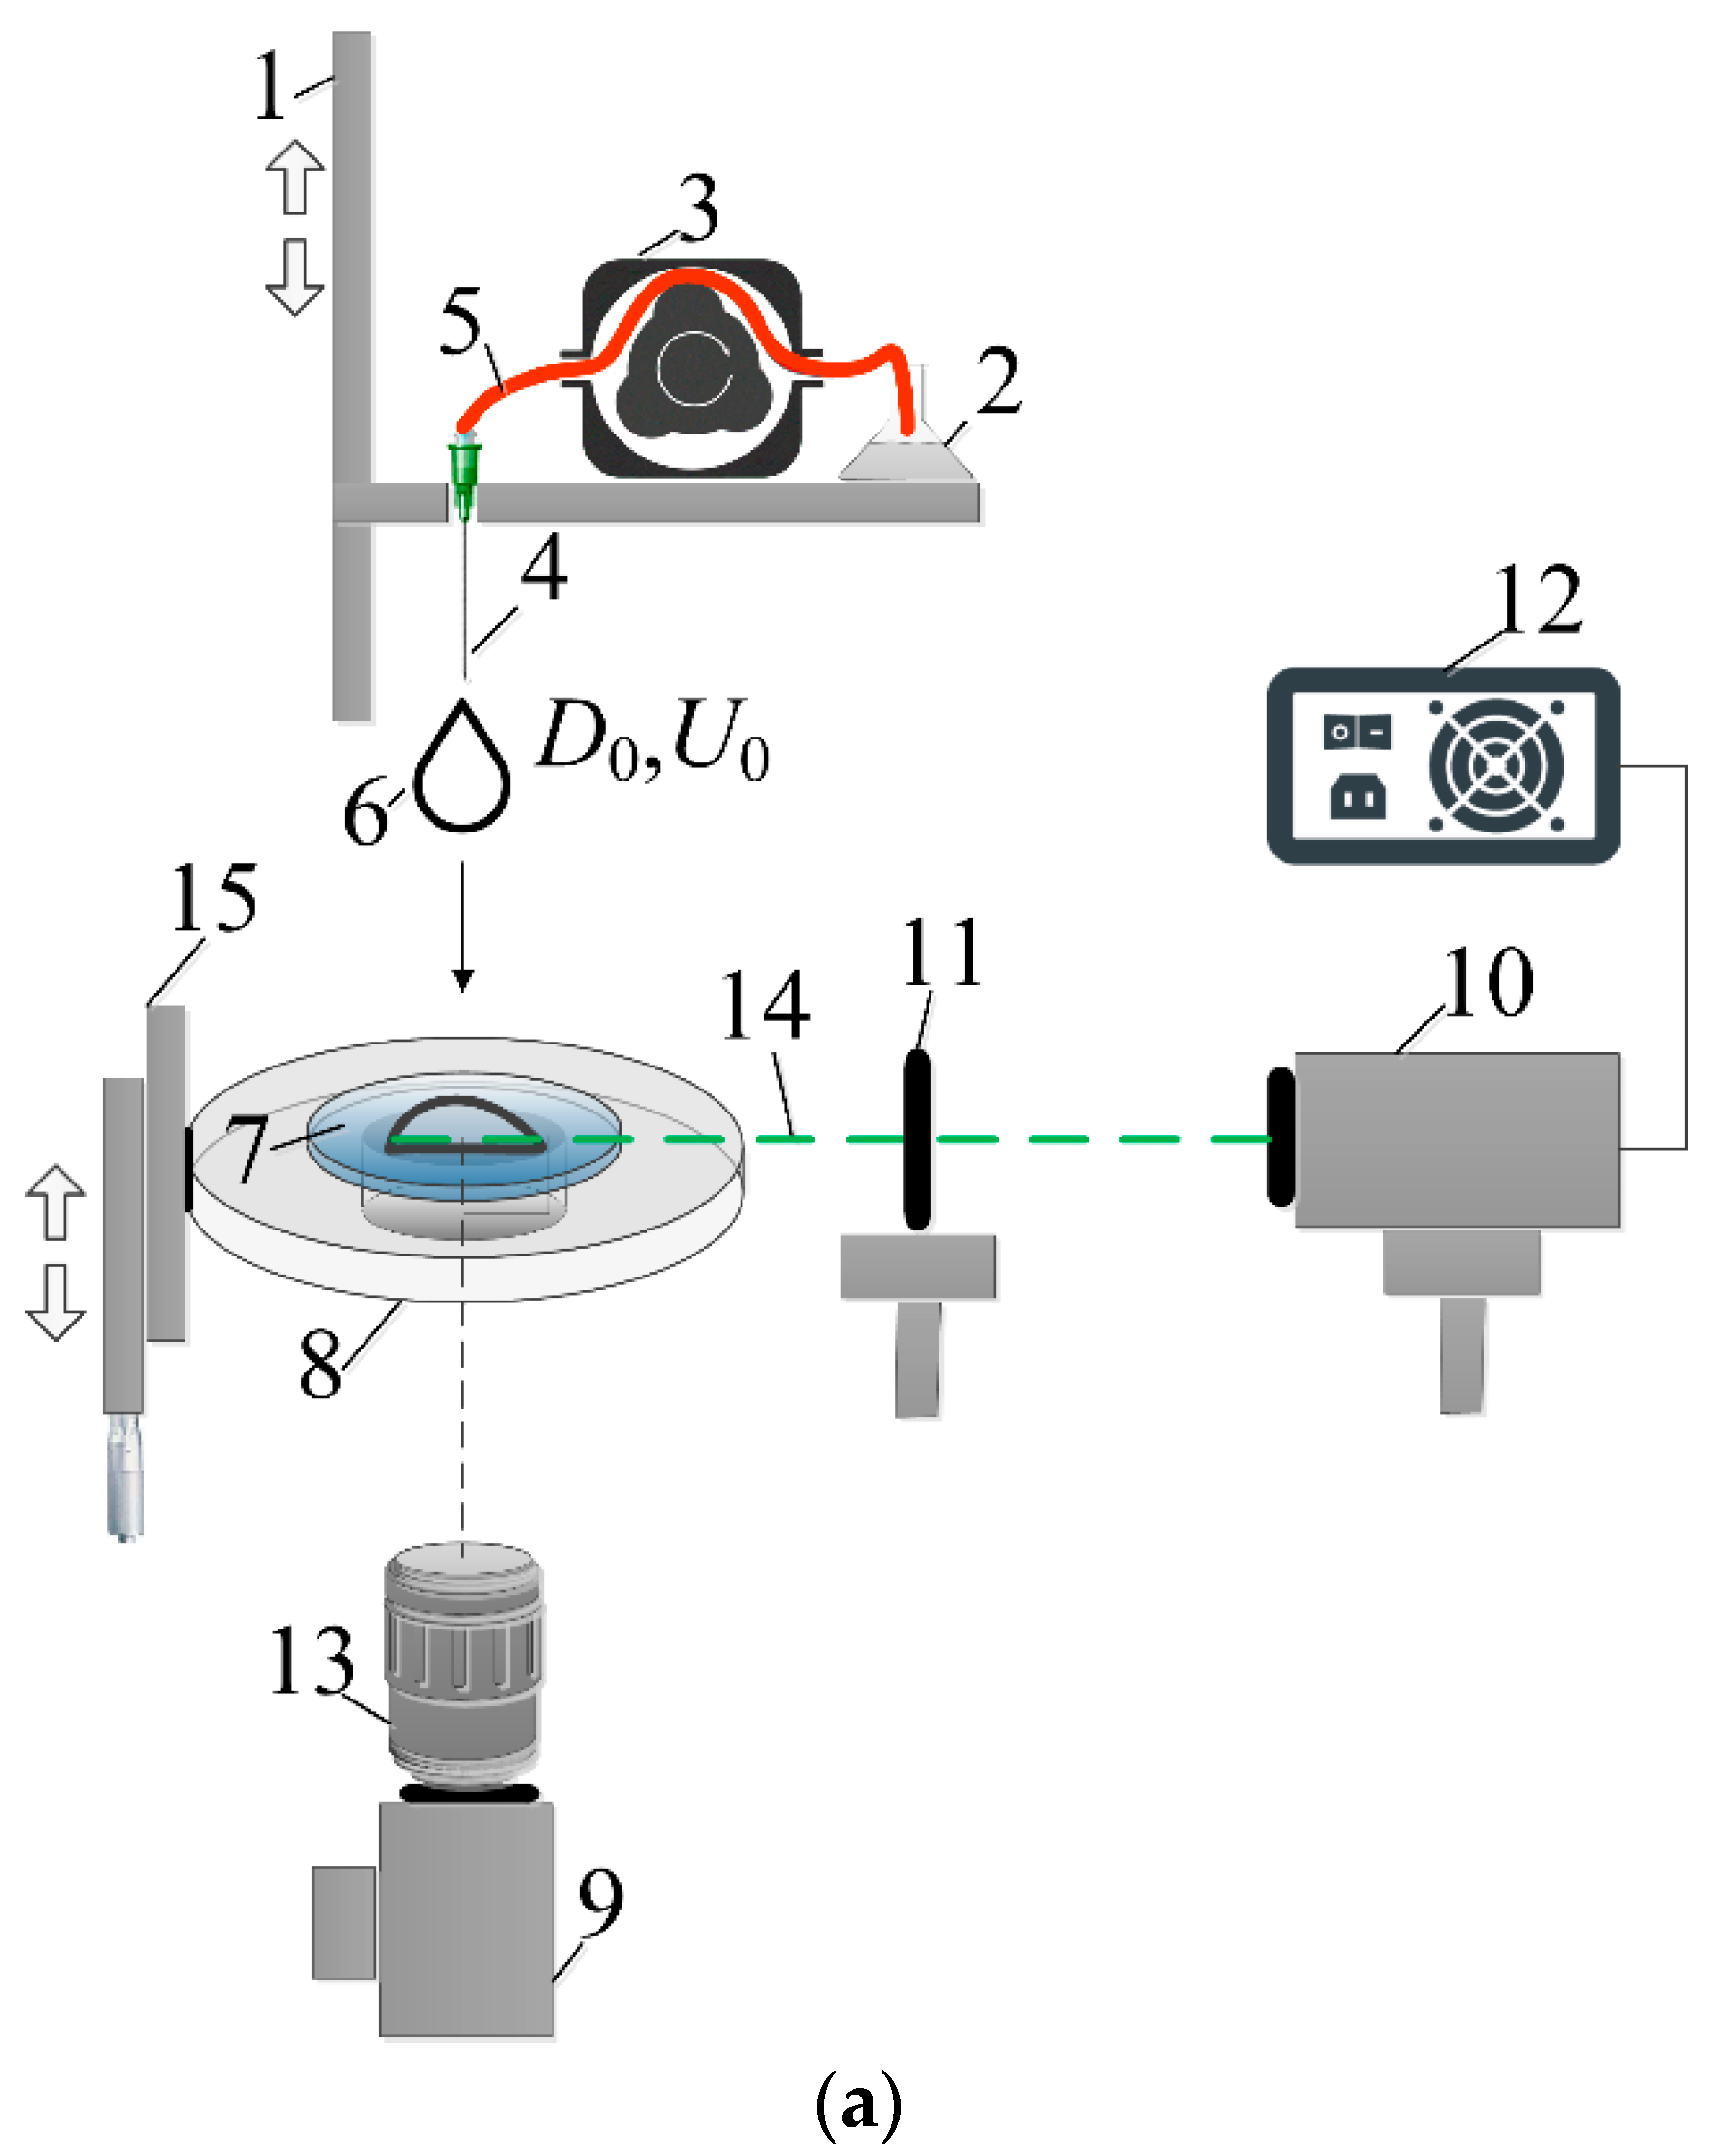
3. Experimental Set-Up
4. Method of Drop Spreading Research
- -
- the frames recorded by the high-speed video camera were imported into Actual Flow;
- -
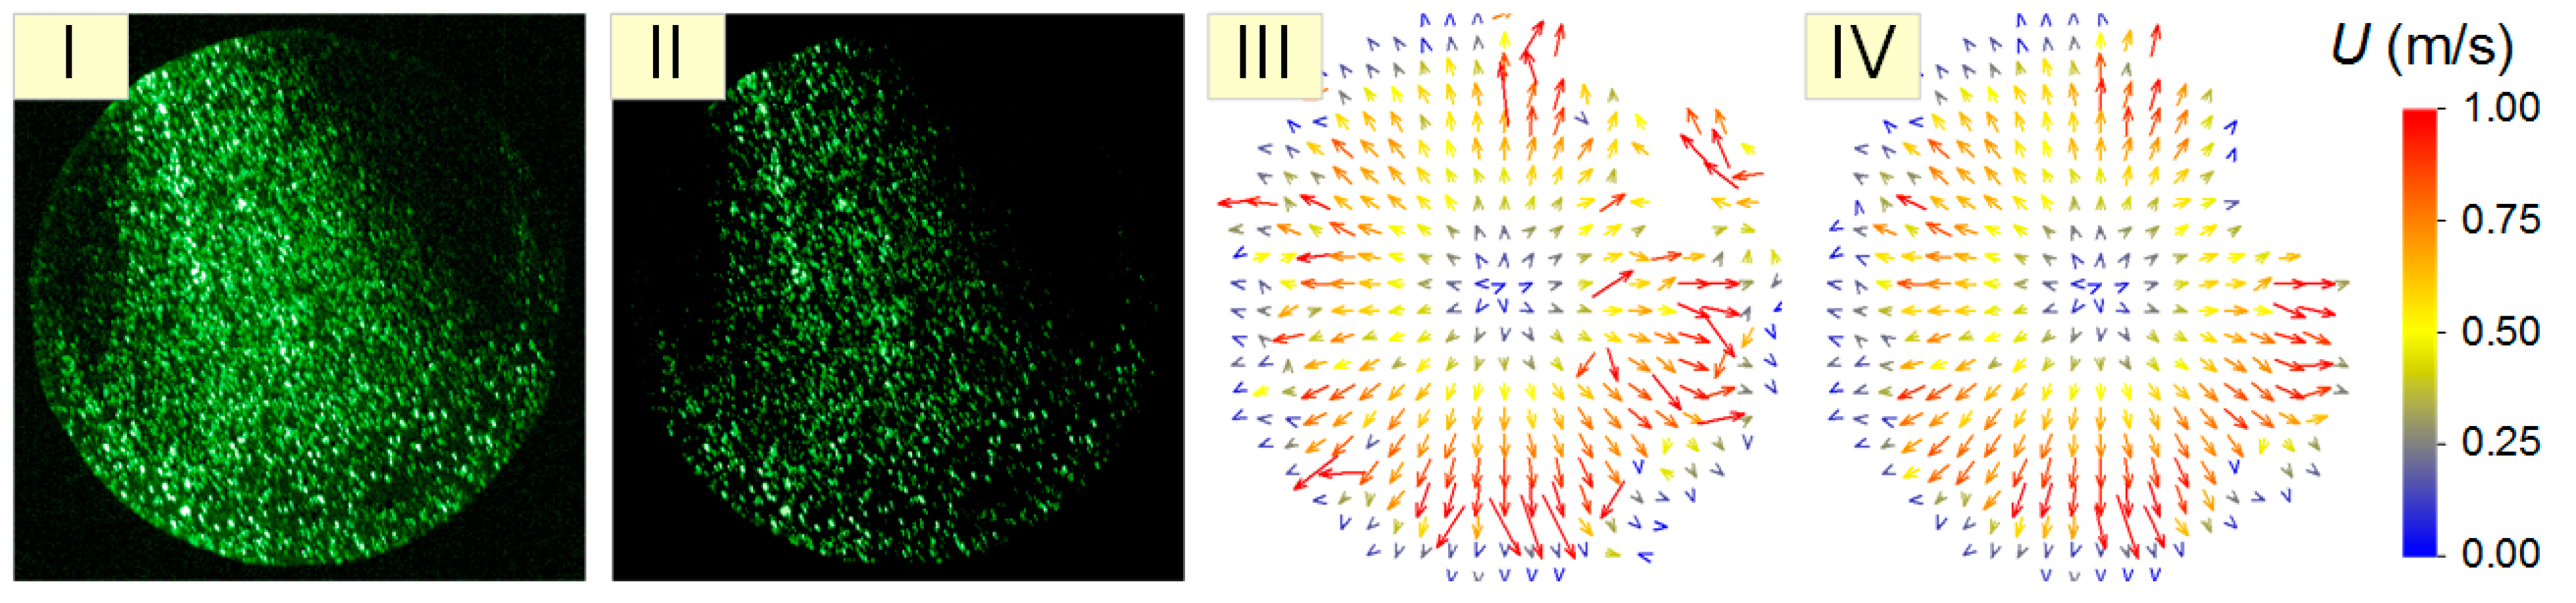
- the average background intensity of the image was determined for the area without a drop; the obtained intensity was subtracted from each frame, i.e., the intensity of each pixel of the image was reduced by this value of the intensity;
- -
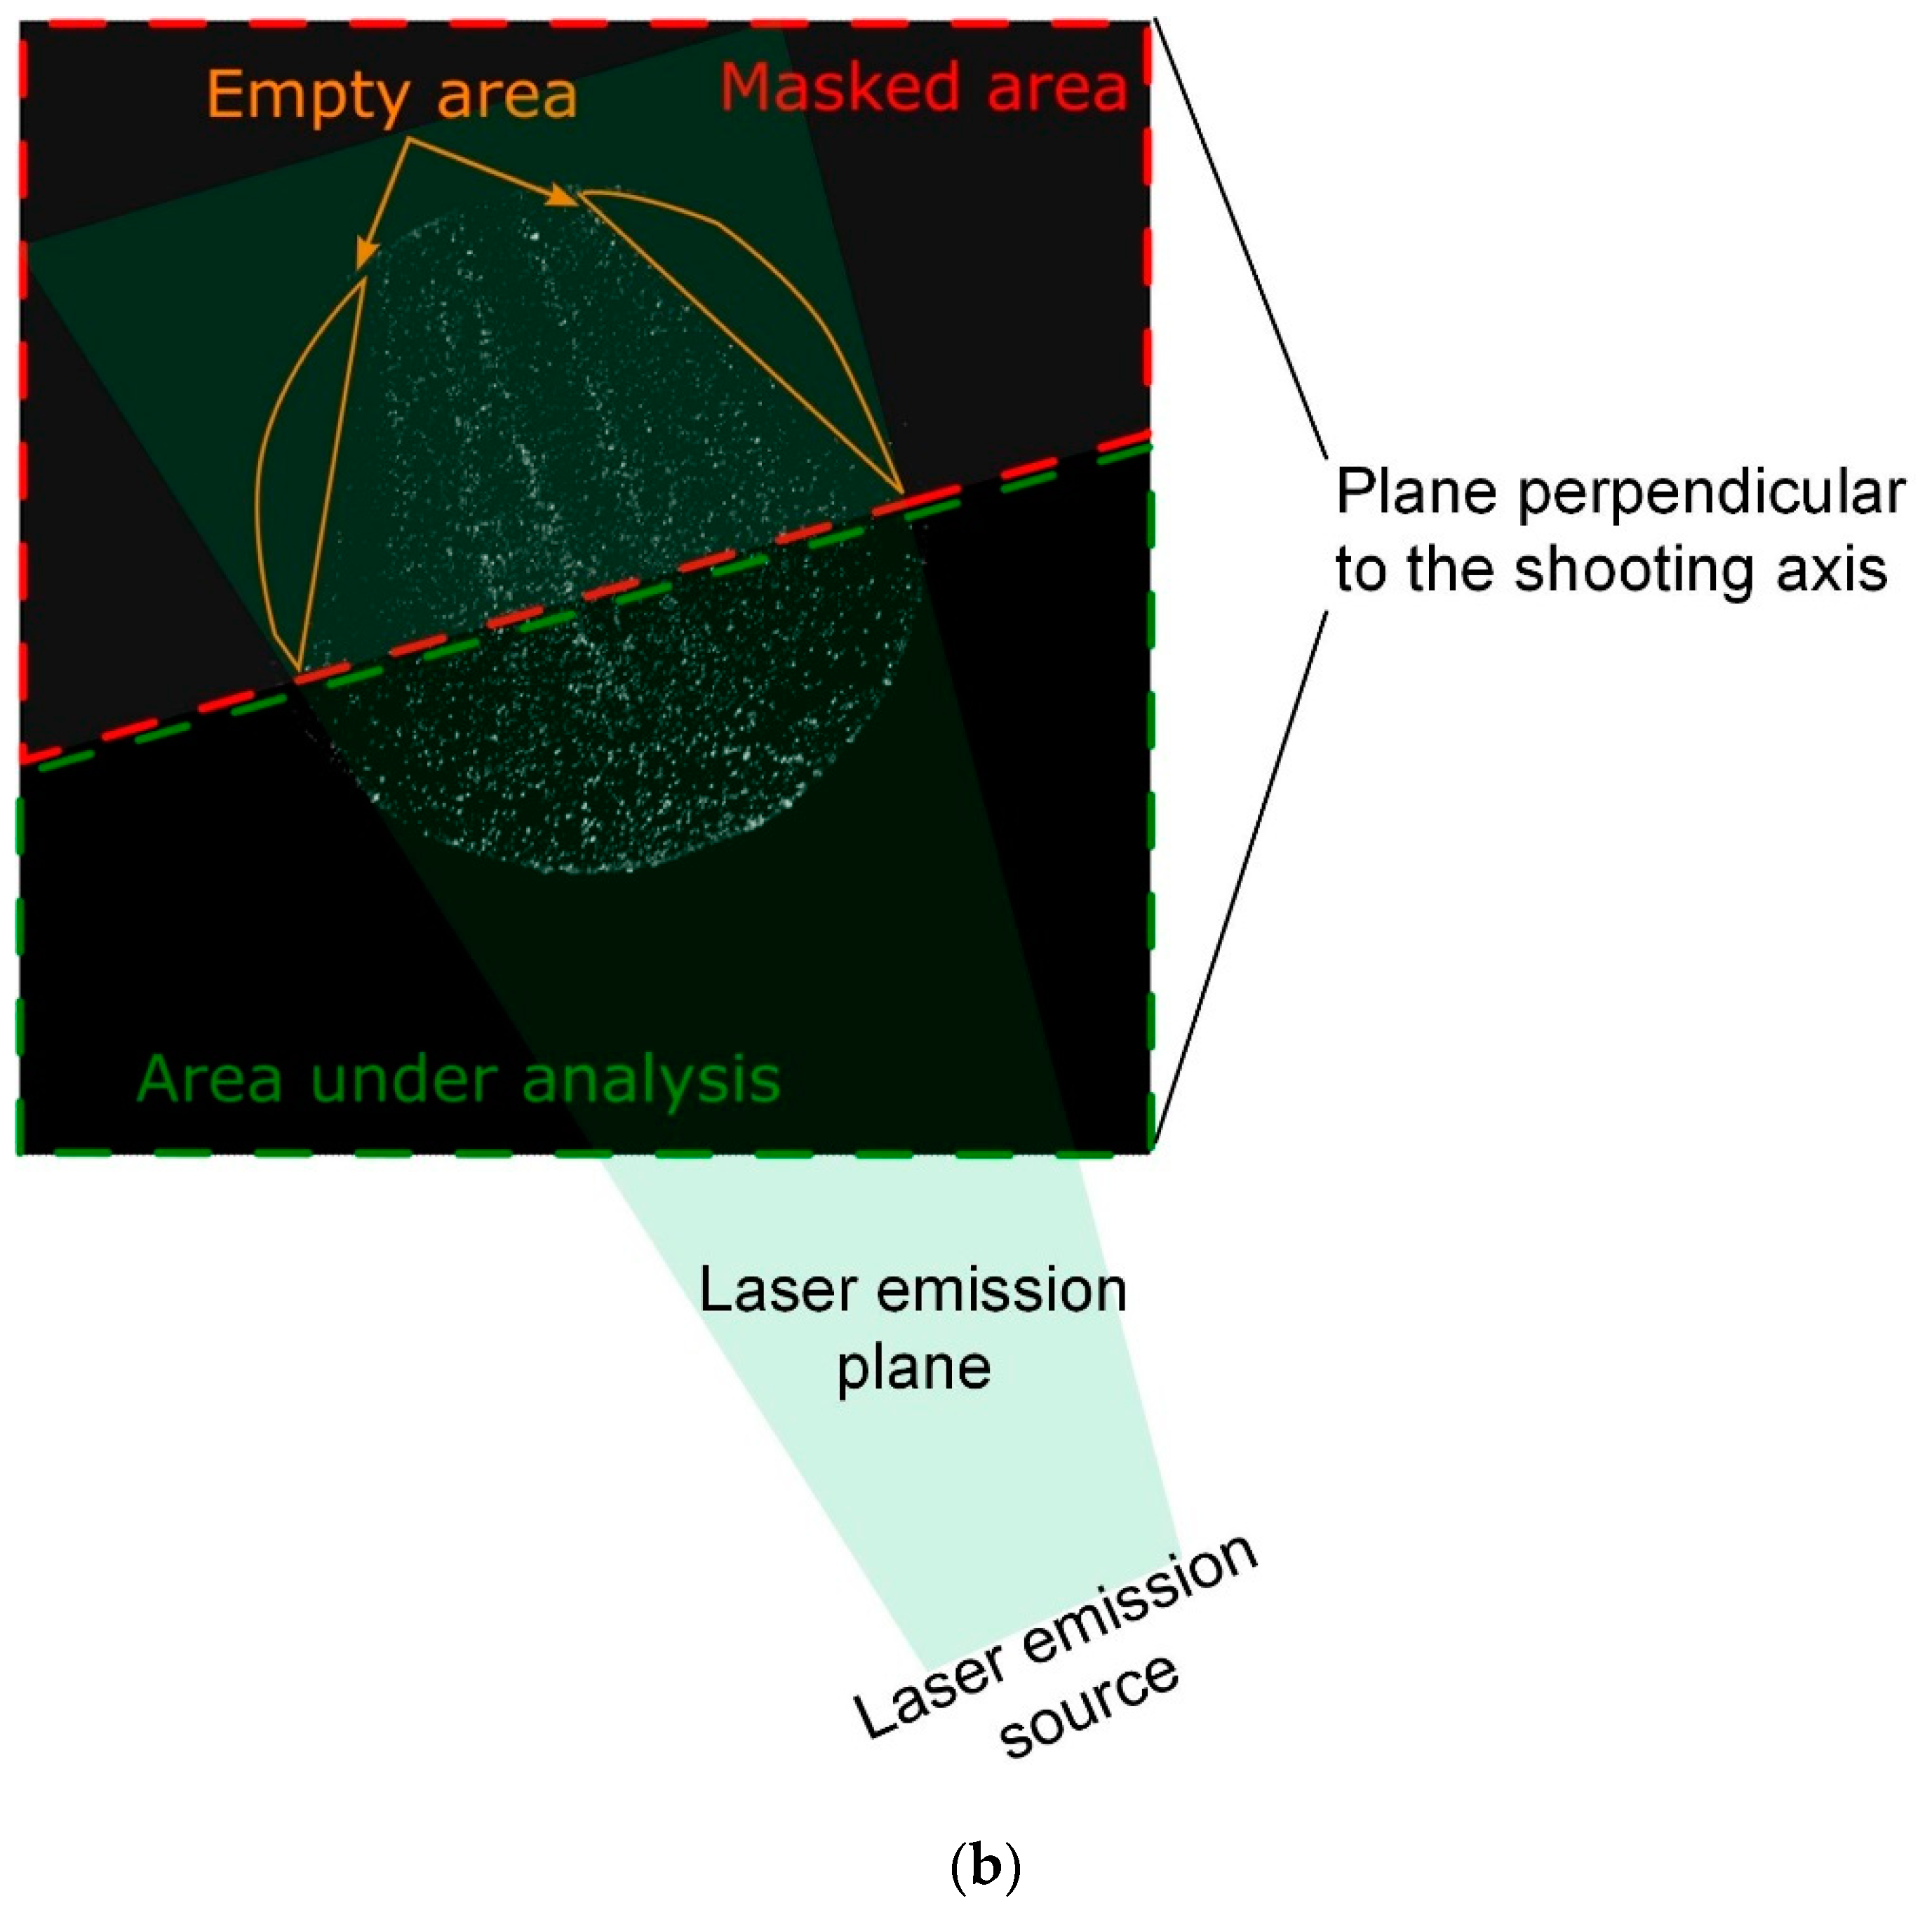
- when the laser light beam is strongly distorted by a drop or when laser light is strongly absorbed in a slurry drop, a geometric mask was applied to the original frame to avoid absorption and refraction of the laser light so that only the half of the drop that the light beam enters is analyzed (Figure 1);
- -
- each frame was divided into elementary regions of 32 × 32 pixels in size.
- -
- for each elementary region, the correlation function was calculated, after which the coordinates of its maximum were estimated;
- -
- the shift of the coordinates of the maximum of the correlation function in each elementary region for the time between each of two consecutive frames was determined with an accuracy of 0.2 pixels; the displacement of the coordinates of the maximum corresponds to the most probable movement of particles within the elementary region;
- -
- using the scale factor and the time delay between two consecutive frames, the velocity of fluorescent microparticles was calculated, and plotting the corresponding velocity vector for each elementary region took place;
- -
- using a set of velocity vectors, an instantaneous two-dimensional two-component field of the velocity of fluorescent microparticles was reconstructed at each frame;
- -
- an interpolation procedure was performed for the obtained velocity fields, during which the modulus and direction of each velocity vector were compared with the corresponding modulus and direction of neighboring vectors, as well as vectors located in the same elementary region in the previous and subsequent velocity fields; If the differences in the modulus and direction of the velocity vector were more than 20%, the correction of these parameters for this vector occurred.
- The curvature of the drop surface causes the angle between the plane of the laser knife incident on it and the drop surface to be different from 90° [27]. At the same time, this angle also changes up during the drop spreading. This leads to the refraction of the laser knife inside the drop and, as a result, its deviation from the direction parallel to the substrate surface. In other words, the knife begins to hit the surface of the substrate and reflect off it. This fact may introduce an additional error in the measurement results;
- When a drop spreads radially after it collides with a solid wall, waves (“horns”) are often formed along its surface, the crests of which also focus the laser beam as local collecting lenses. This results in the appearance of alternating laser-illuminated and non-illuminated regions and makes the registration of convection velocities inside the drop also impossible;
- If the content of coal particles is higher than 1–2 wt.%, the laser knife does not penetrate into the drop to a depth of more than 0.2–0.5 mm due to the absorption and reflection of light by these particles. This makes it impossible to record the convection velocities inside the drop.
5. Results and Discussion
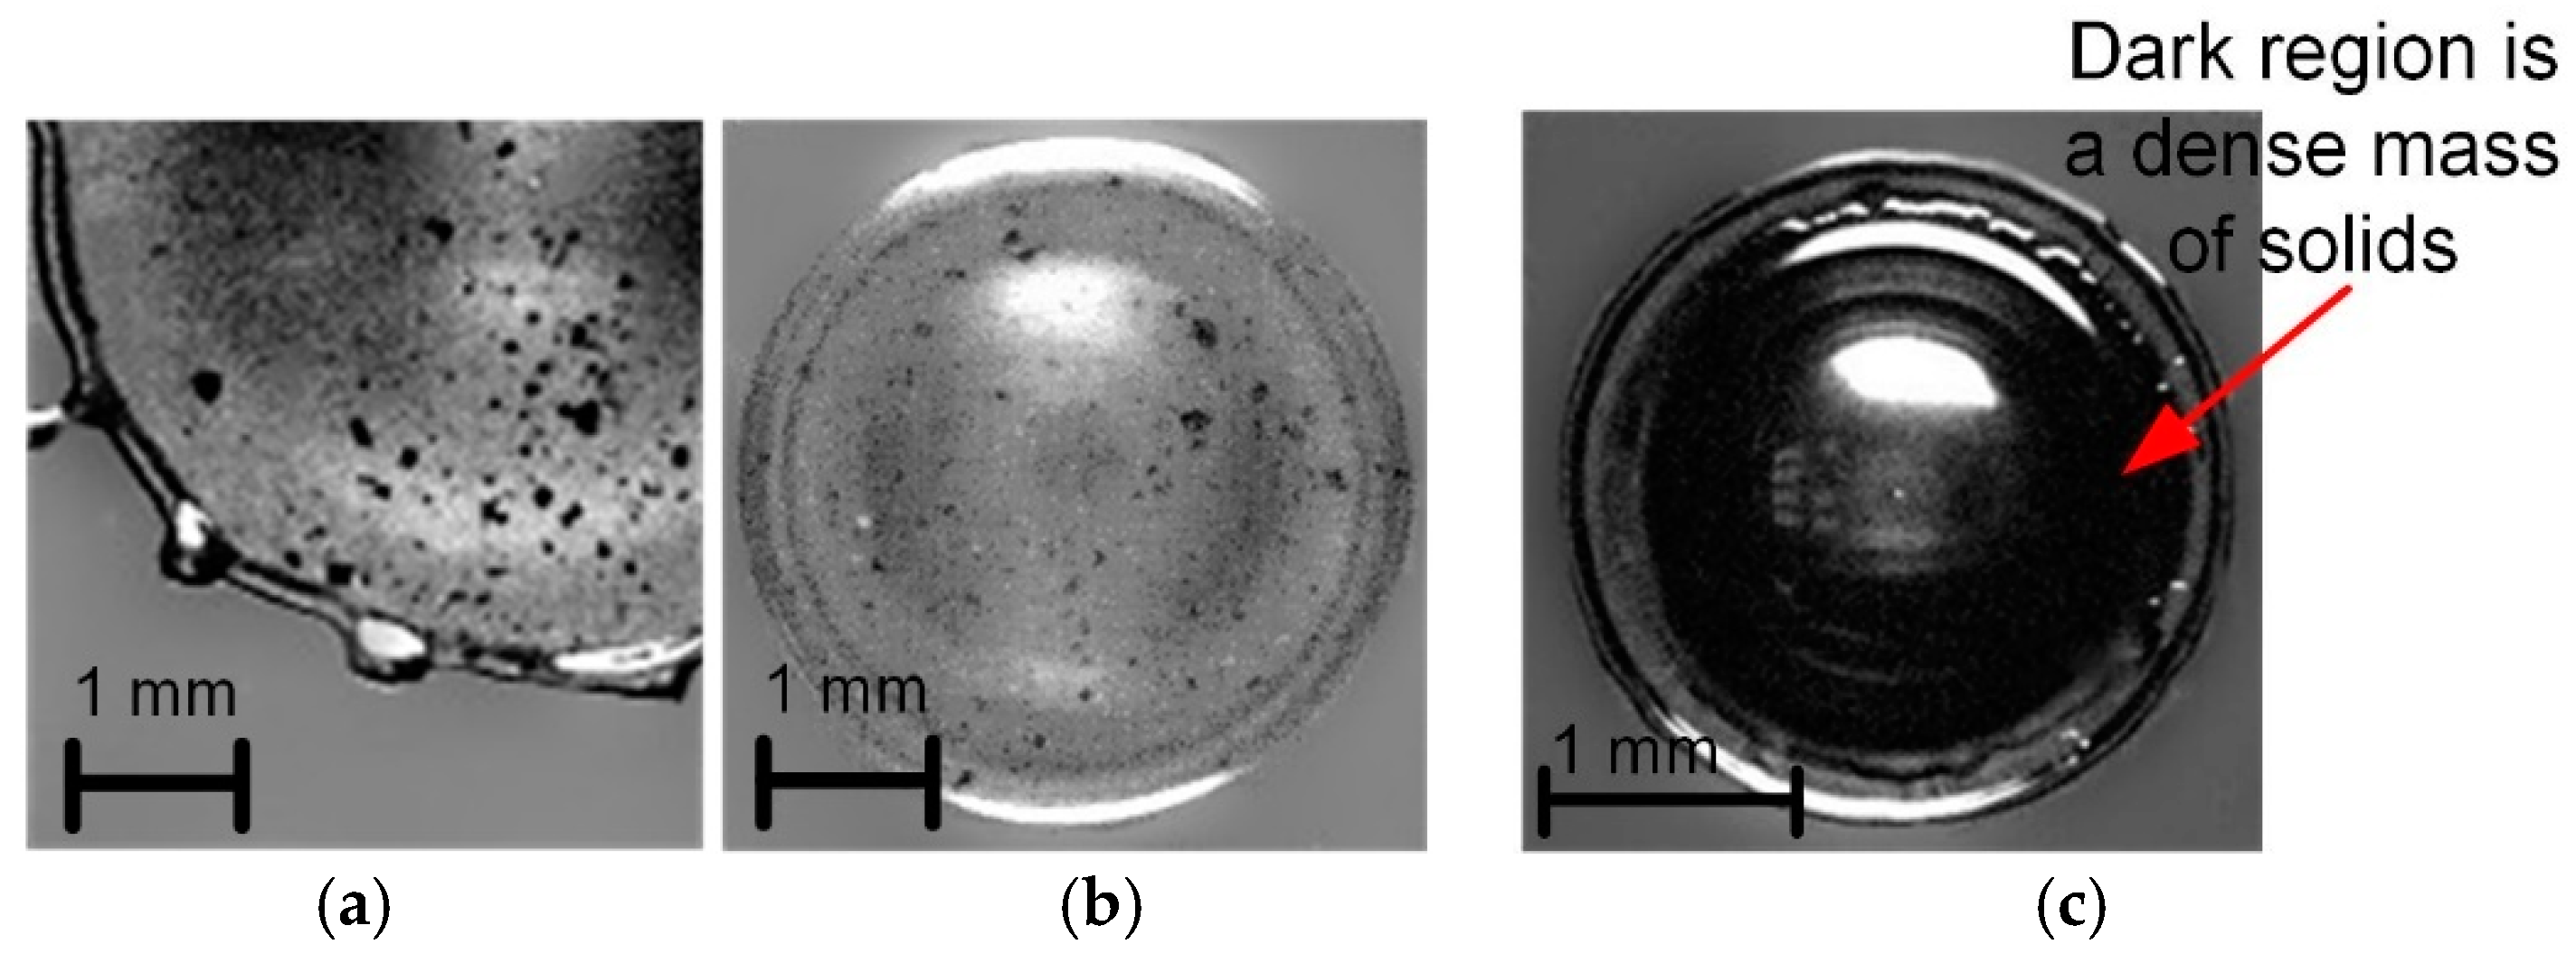
5.1. Morphological Observations
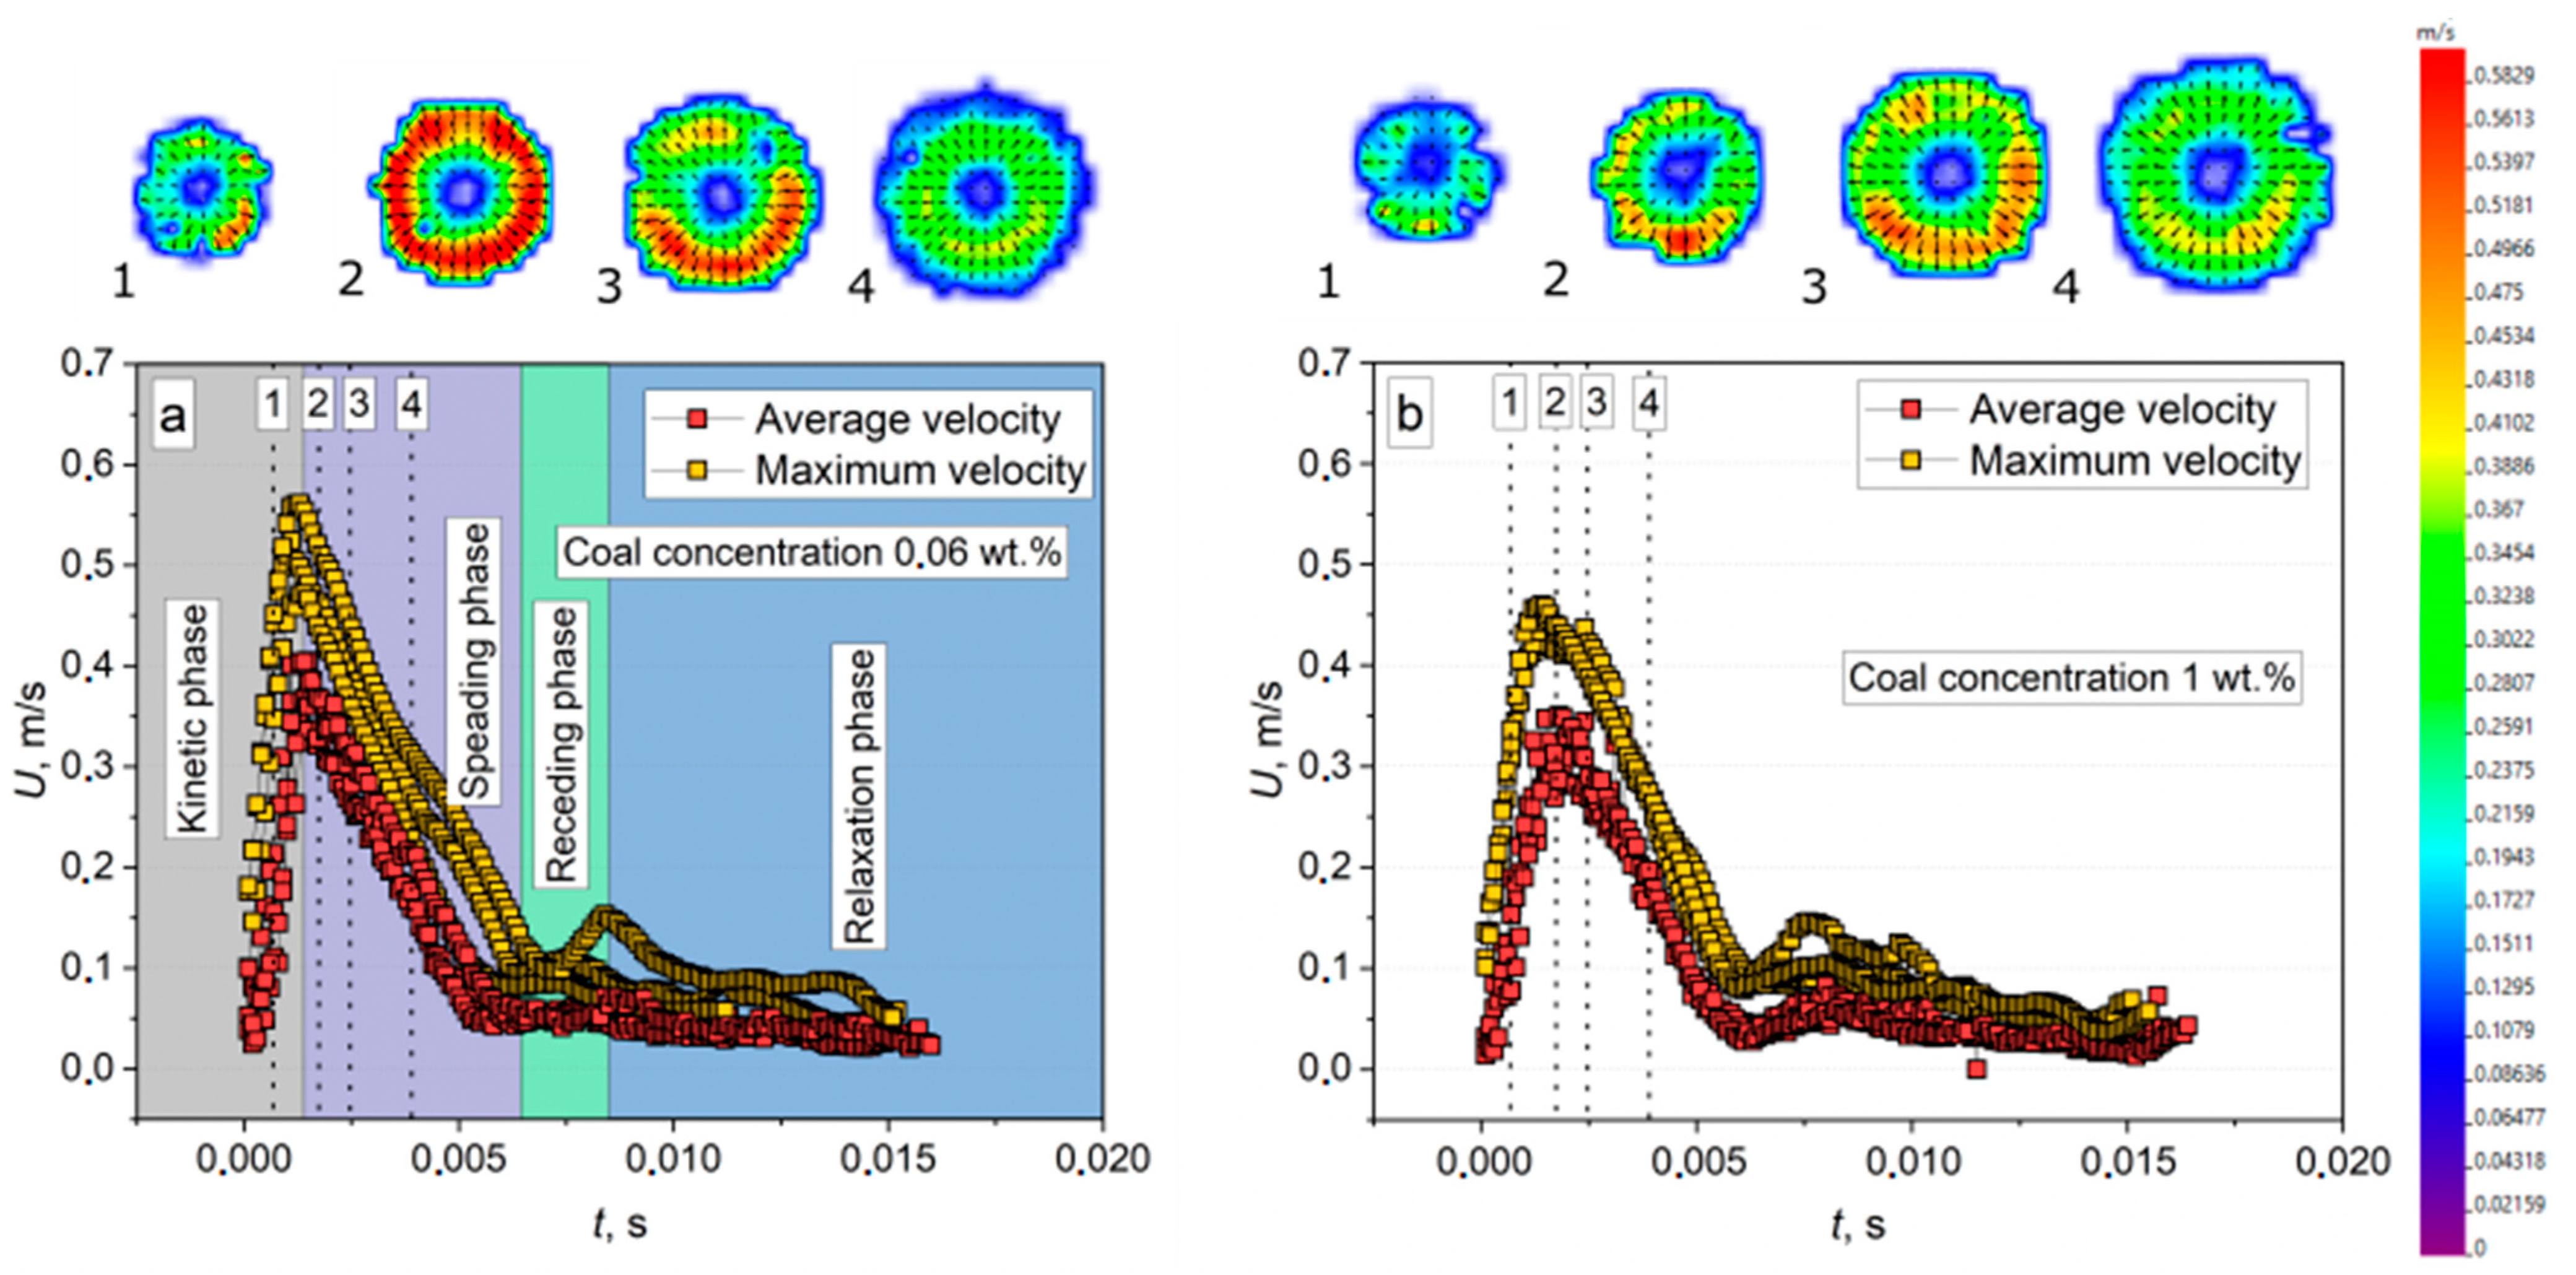
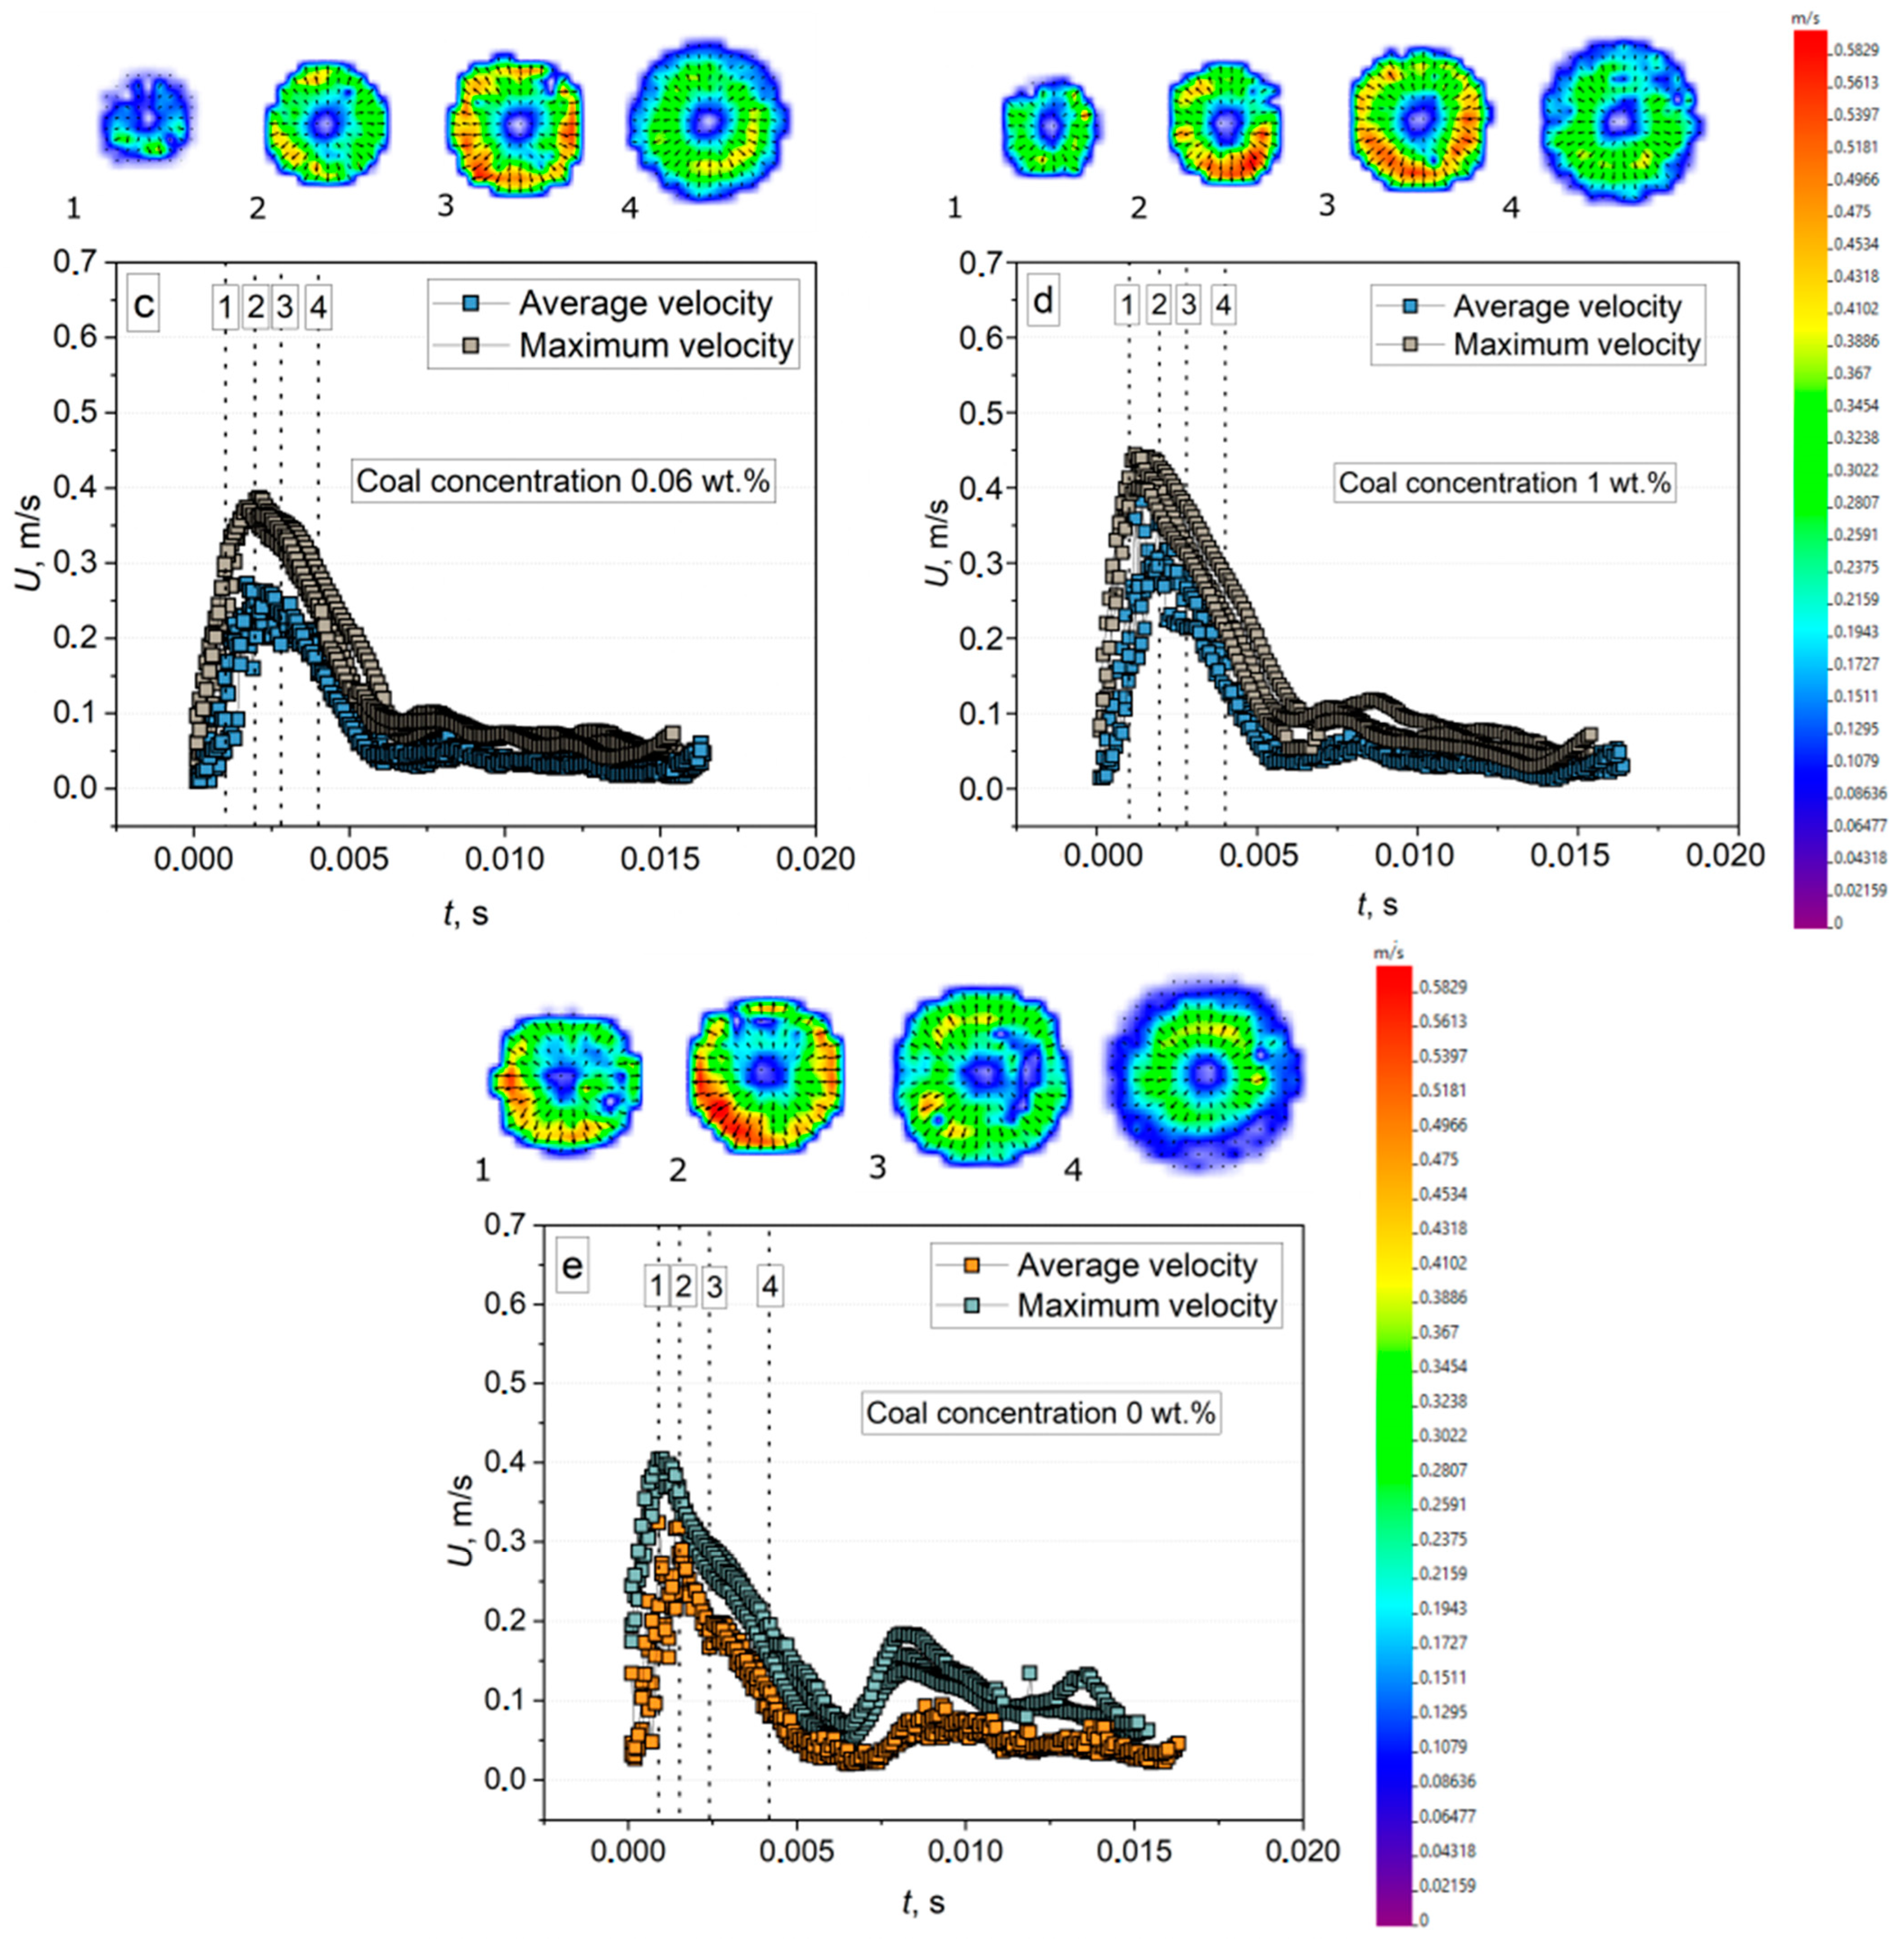
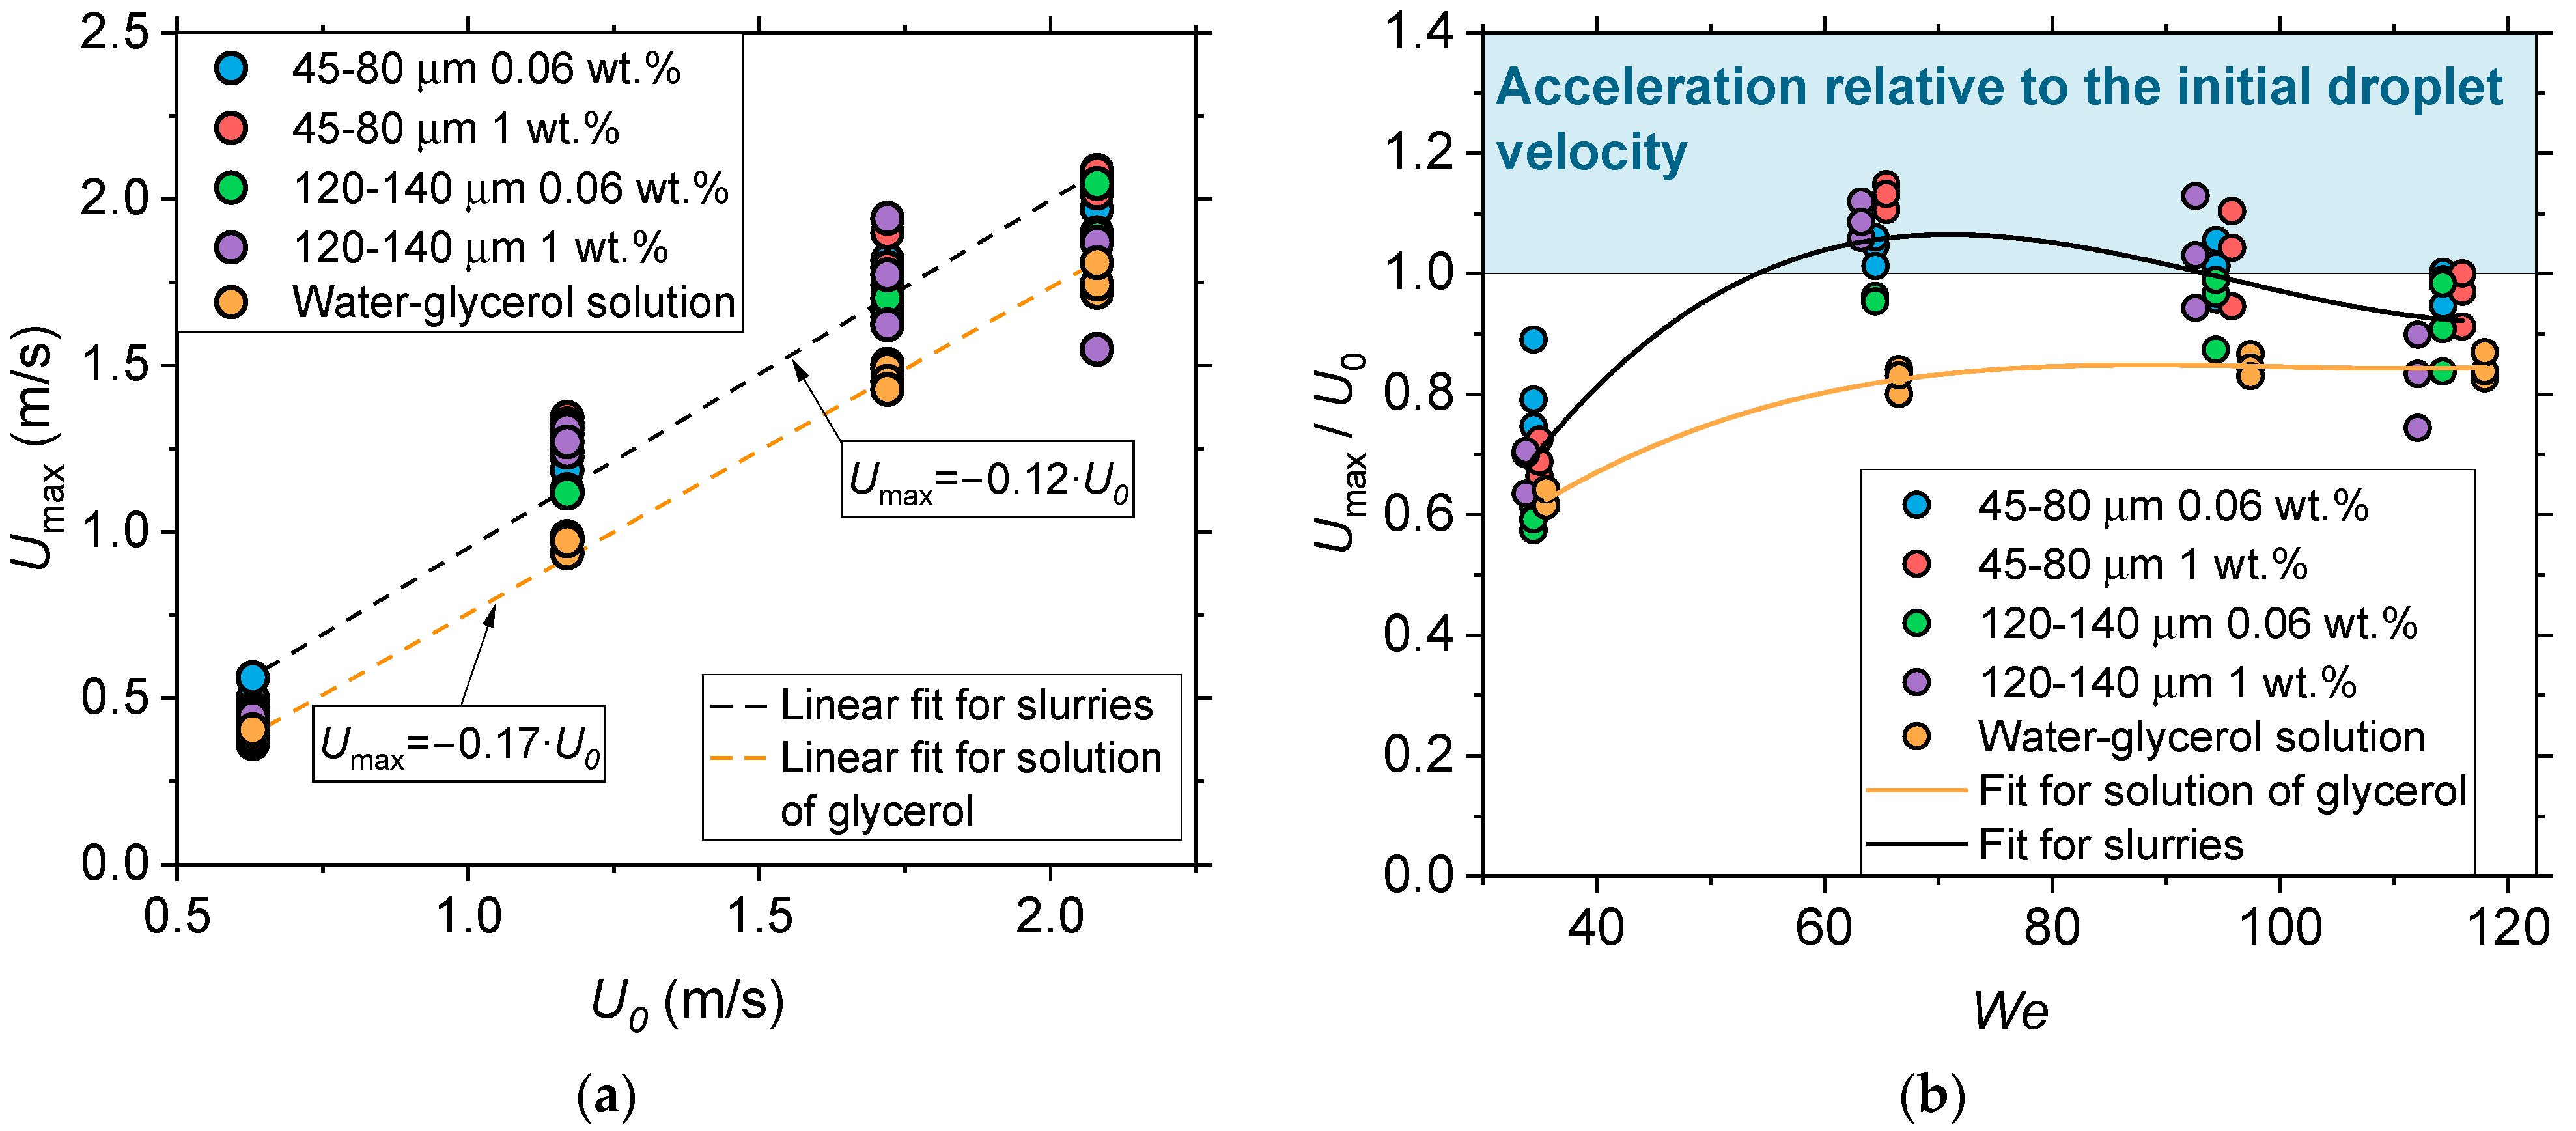
5.2. Effect of We and the Concentration of Coal Particles on the Velocity of Internal Flows in a Spreading Drop
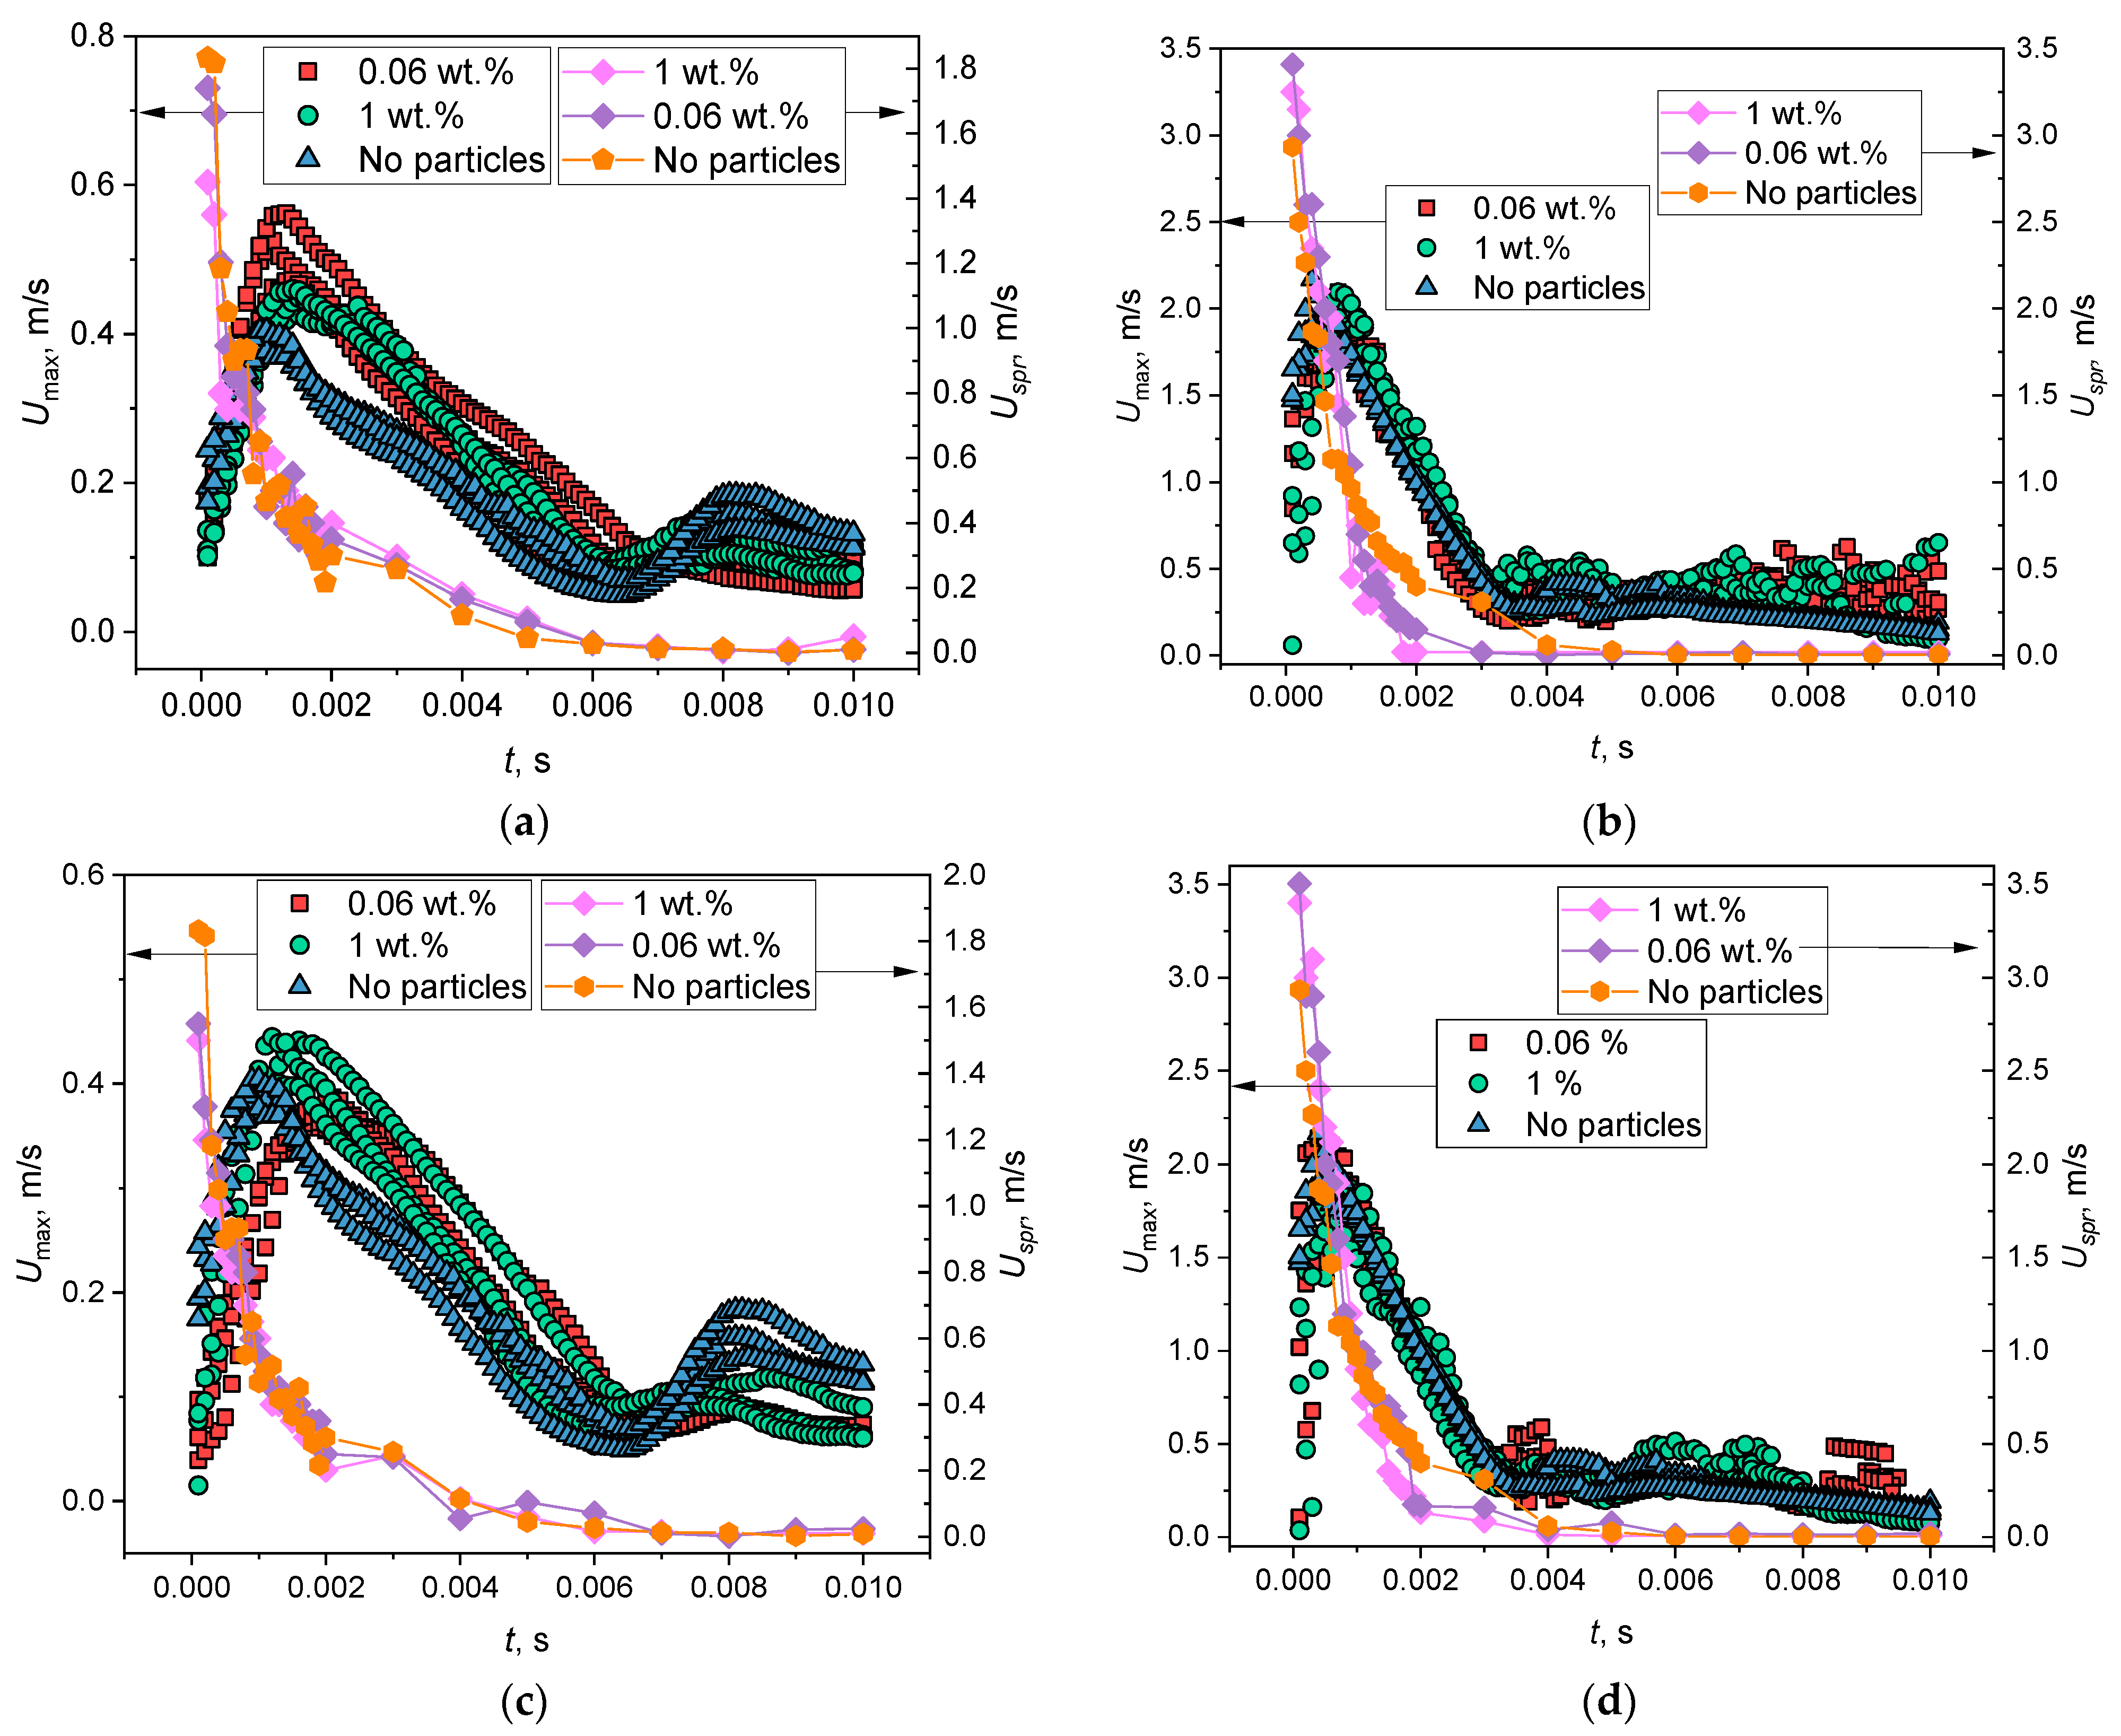
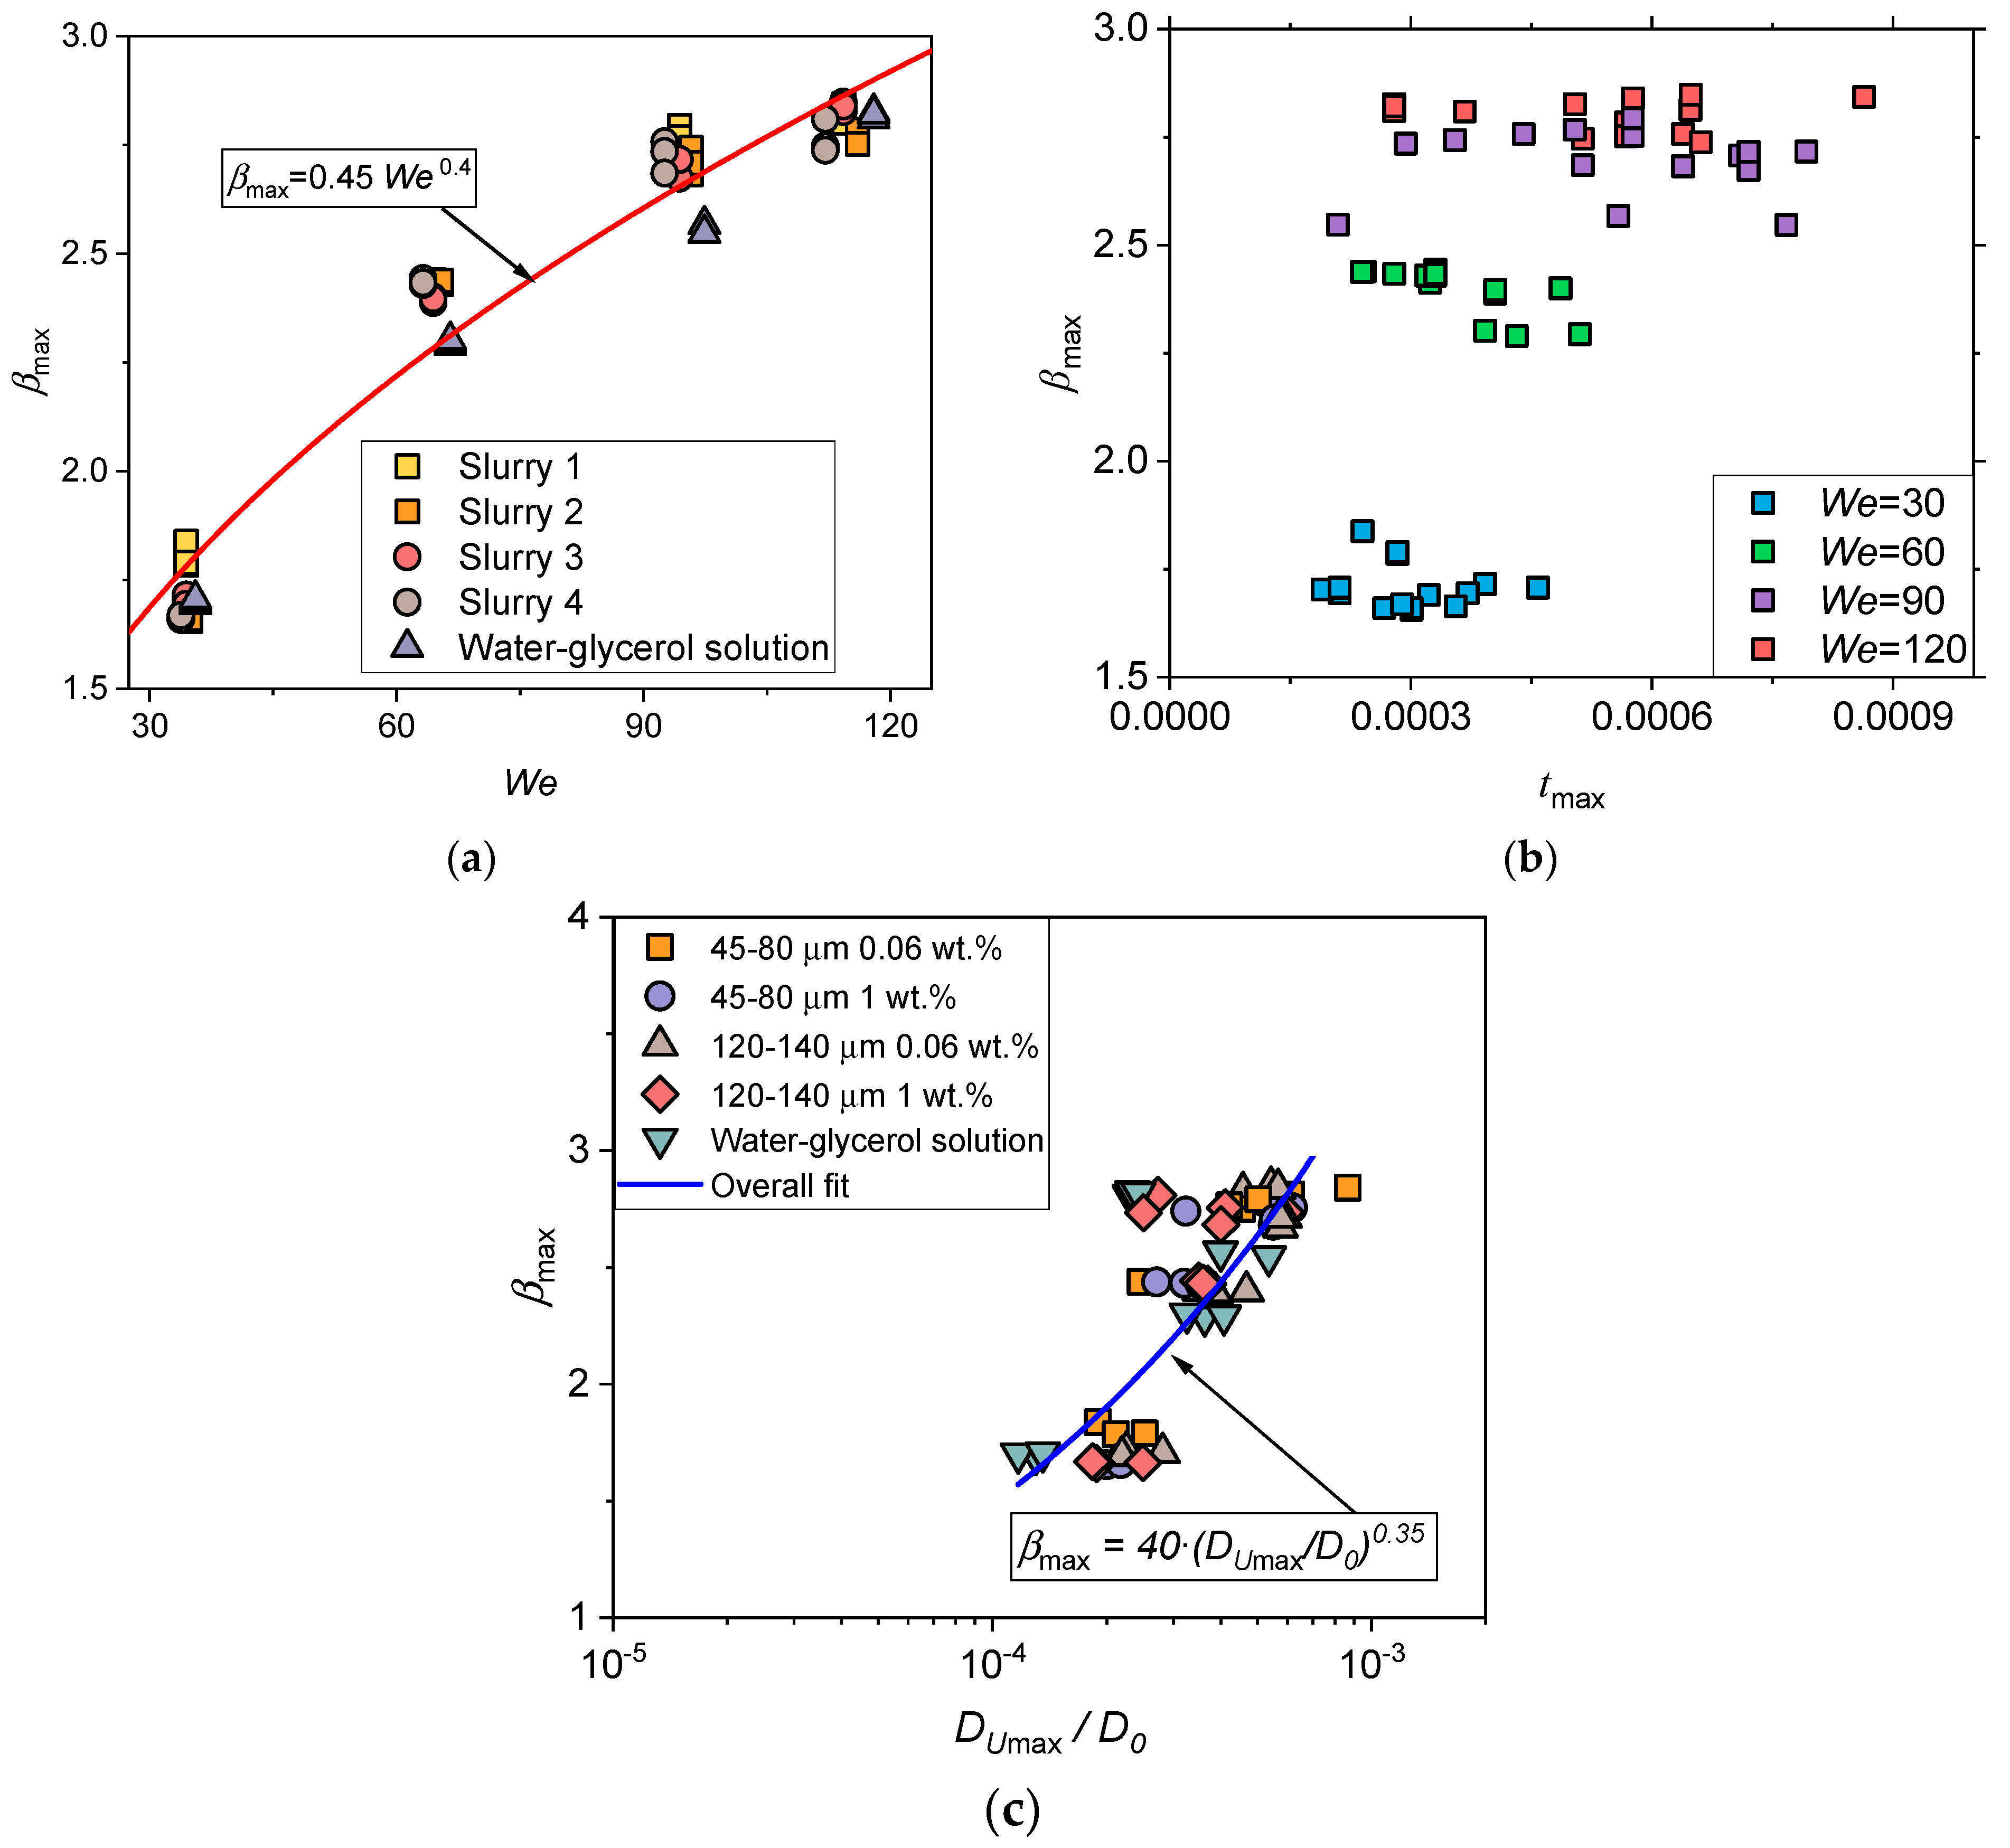
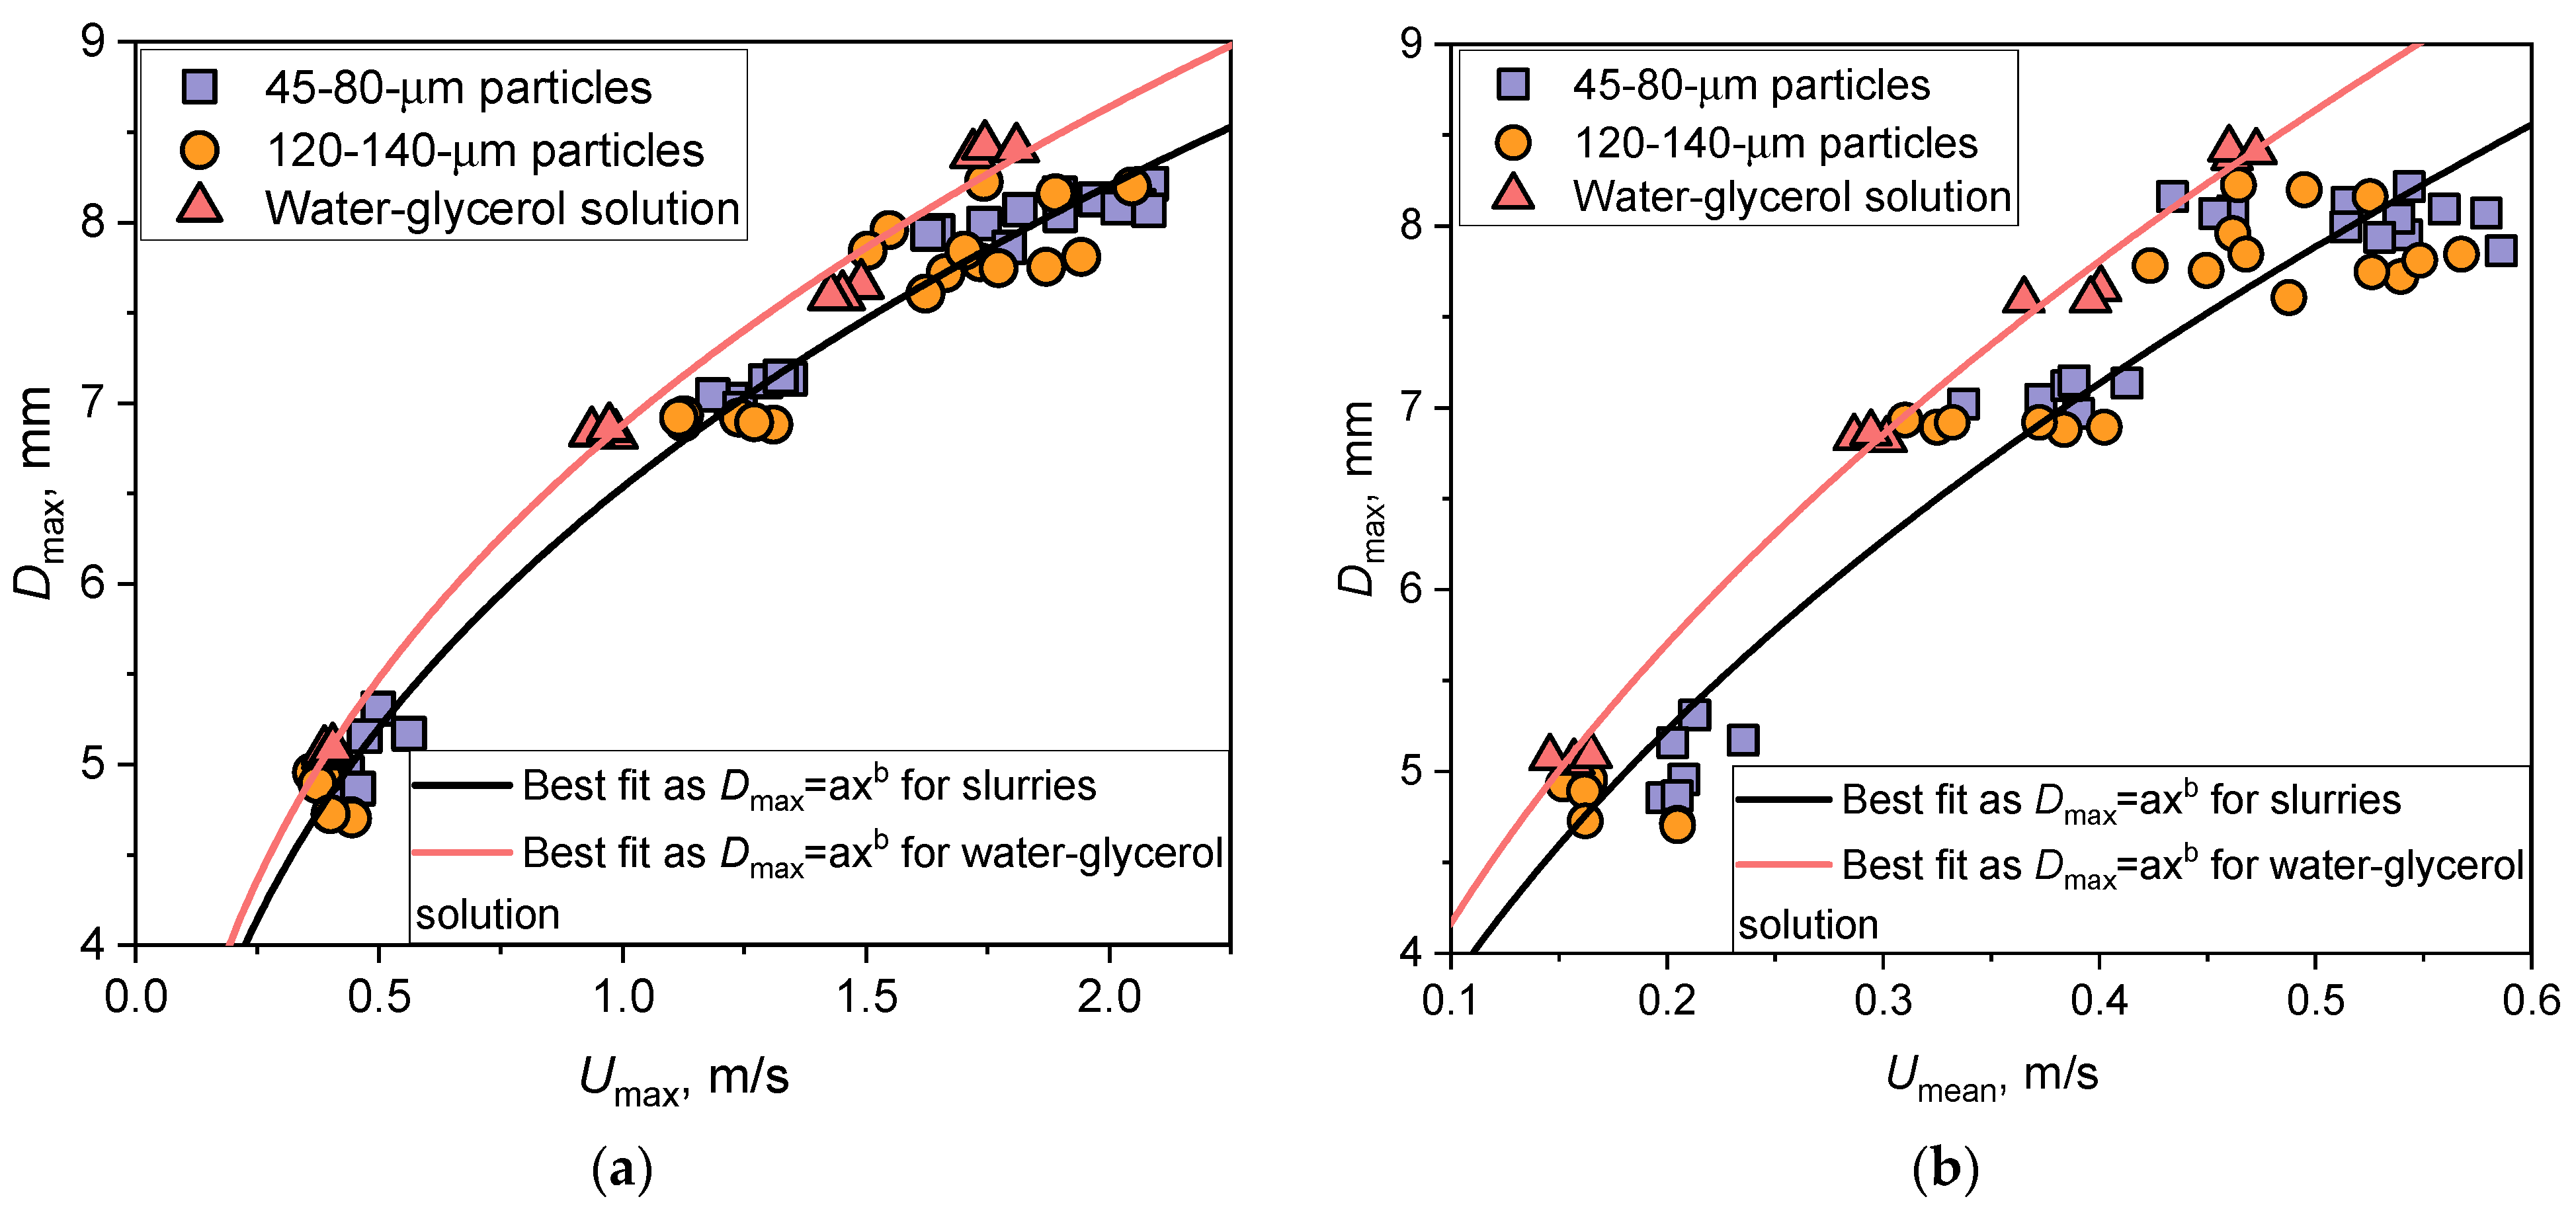
5.3. Effect of the Internal Flow Velocity on the Maximum Drop Spreading Diameter
5.3.1. Weber Number Factor
5.3.2. Factor of Coal Particles in a Drop
6. Conclusions
- The PIV-derived results of measuring the velocities of internal convective flows in the longitudinal section of a water-glycerol solution drop laden with hydrophilic coal particles and spreading over a hydrophobic surface allowed the exploration of the conditions for reducing the maximum spreading diameter.
- At We = 30, the particle grinding fineness and their concentration strongly affect the internal flow velocities, contributing both to their increase and decrease, depending on the combination of the initial parameters of a slurry. At We = 120, the spreading velocity of the particle-laden drops is approximately twice as high as at We = 30. Given this fact, the inertia-driven spreading of the particle-laden drop is mainly determined by the dynamics of the deformable Taylor rim, and the contribution of solids is insignificant, causing the closeness of the values of the maximum absolute velocity of internal flows for various combinations of the initial parameters of a slurry. Relying on the experimental data obtained by the shadow photography and PIV, the behavior of internal convective flows in the longitudinal section of a particle-laden drop is characterized. It is revealed that the kinetic energy of the translational motion of coal particles in a drop compensates for the energy expended by the drop on sliding friction along the wall.
- The behavior of the maximum spreading factor βmax for particle-laden and water-glycerol drops is mainly defined by the initial drop velocity with the constancy of other terms within the Weber number and is governed by the power function of βmax = 0.45We0.4 with a coefficient of determination R2 = 0.95. Further, it is revealed the peculiarity of a noticeable increase in the differences in the velocities of internal flows in spreading drops with an increase in Weber number. Finally, as the Weber number grows, an increase in the spreading drop diameter at the maximum absolute velocity of internal flows causes the elevated values of the maximum spreading diameter and is described by an expression of . In addition, the presence of coal particles causes a general tendency to reduce the liquid drop spreading.
Author Contributions
Funding
Data Availability Statement
Conflicts of Interest
Nomenclature
| Ad | ash content of the fuel on a dry basis (%); |
| Cdaf | carbon content calculated on a dry ash-free (daf) mass, (%); |
| D0 | initial droplet diameter before impact (m); |
| Dmax | maximum spreading diameter (m); |
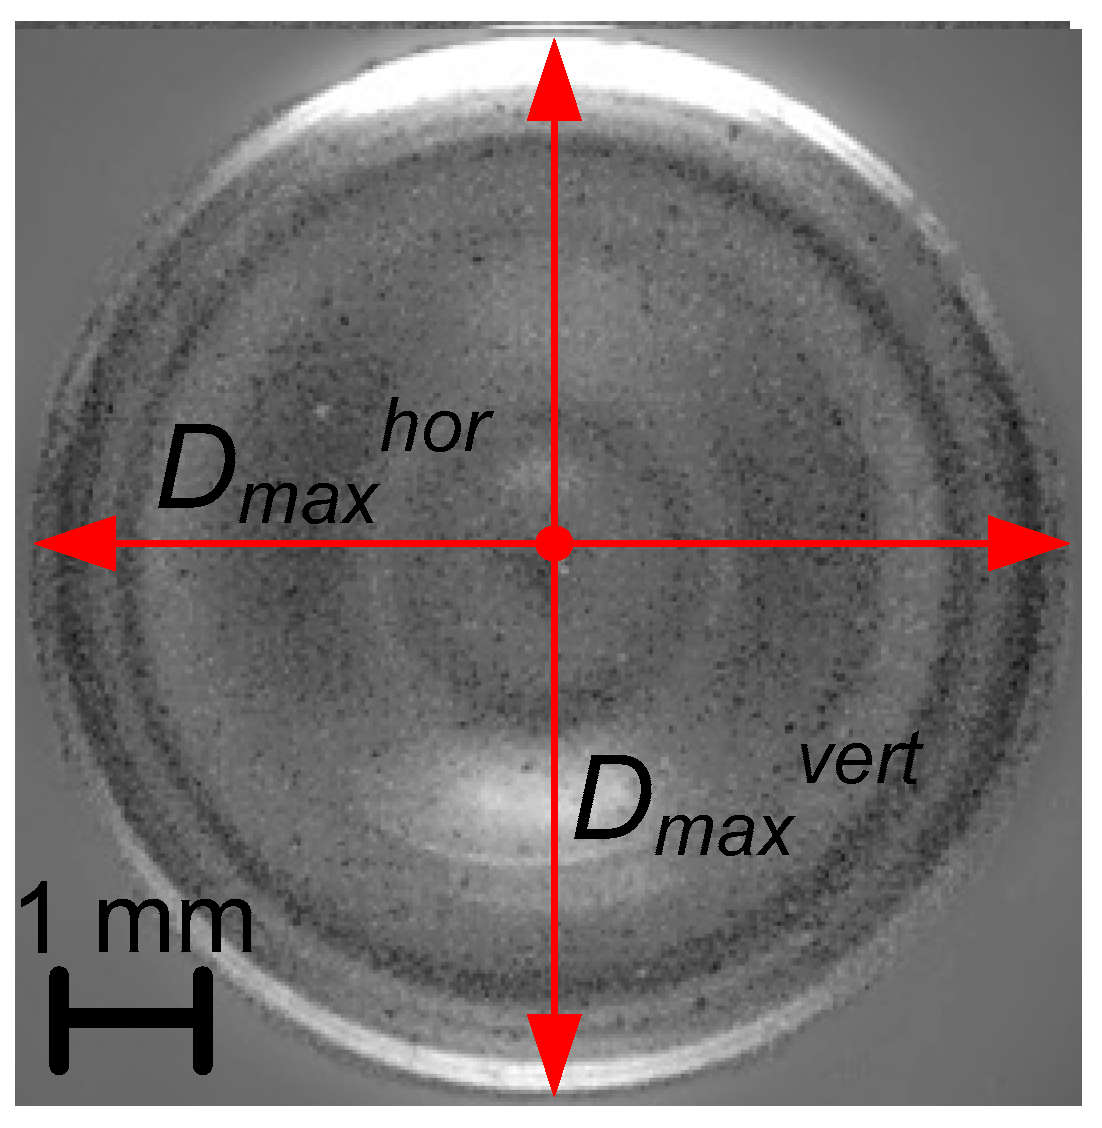
| Dmaxhor | maximum diameter of the drop spreading measured horizontally in a frame (m); |
| Dmaxvert | maximum diameter of the drop spreading measured vertically in a frame (m); |
| DUmax | drop diameter corresponding to the maximum absolute velocity of internal flows (m); |
| Hdaf | hydrogen content calculated on a dry ash-free (daf) mass, (%); |
| Ndaf | nitrogen content calculated on a dry ash-free (daf) mass, (%); |
| Odaf | oxygen content calculated on a dry ash-free (daf) mass, (%); |
| Qas,V | specific heat of combustion (MJ/kg); |
| Re | Reynolds number (–); |
| Std | sulfur content in dry matter, (%); |
| t | impact time (s); |
| tmax | time at the maximum spreading diameter (s); |
| U | instantaneous maximum and average velocities of fluorescent particles in a drop impacting the wall (m/s); |
| U0 | initial drop velocity (m/s); |
| Umax | maximum absolute velocity of internal flows in the drop during spreading (m/s); |
| Umean | average speed of internal flows for the period from the contact of the surface with a drop and up to the maximum spreading (m/s); |
| Uspr | drop spreading velocity (m/s); |
| Vdaf | amount of volatiles (%); |
| Wa | fuel moisture (%); |
| We | Weber number (–). |
| Greek symbols | |
| βmax | maximum spreading factor (–); |
| ρ | density (kg/m3); |
| σ | coefficient of surface tension (N/m); |
| μ | dynamic viscosity (Pa⸱s). |
References
- Wu, X.; Guo, Q.; Gong, Y.; Cheng, C.; Ding, L.; Wang, F.; Yu, G. Visualization Study on Particle Flow Behaviors during Atomization in an Impinging Entrained-Flow Gasifier. Chem. Eng. Sci. 2020, 225, 115834. [Google Scholar] [CrossRef]
- Wu, X.; Gong, Y.; Guo, Q.; Xue, Z.; Yu, G. Experimental Study on the Atomization and Particle Evolution Characteristics in an Impinging Entrained-Flow Gasifier. Chem. Eng. Sci. 2019, 207, 542–555. [Google Scholar] [CrossRef]
- Kuznetsov, G.V.; Strizhak, P.A.; Valiullin, T.R.; Volkov, R.S. Atomization Behavior of Composite Liquid Fuels Based on Typical Coal Processing Wastes. Fuel Process. Technol. 2022, 225, 107037. [Google Scholar] [CrossRef]
- Zhang, Y.; Kumar, P.; Lv, S.; Xiong, D.; Zhao, H.; Cai, Z.; Zhao, X. Recent Advances in 3D Bioprinting of Vascularized Tissues. Mater. Des. 2021, 199, 109398. [Google Scholar] [CrossRef]
- Shen, E.M.; McCloskey, K.E. Affordable, High-Resolution Bioprinting with Embedded Concentration Gradients. Bioprinting 2021, 21, e00113. [Google Scholar] [CrossRef]
- Brian, D.; Ahmadian-Yazdi, M.-R.; Barratt, C.; Eslamian, M. Impact Dynamics and Deposition of Perovskite Droplets on PEDOT:PSS and TiO2 Coated Glass Substrates. Exp. Therm. Fluid Sci. 2019, 105, 181–190. [Google Scholar] [CrossRef]
- Suda, Y.; Iwasa, T.; Komine, H.; Tomeoka, M.; Nakazawa, H.; Matsumoto, K.; Nakai, T.; Tanimoto, M.; Kishimoto, Y. Development of Onboard Friction Control. Wear 2005, 258, 1109–1114. [Google Scholar] [CrossRef]
- Thoraval, M.J.; Schubert, J.; Karpitschka, S.; Chanana, M.; Boyer, F.; Sandoval-Naval, E.; Dijksman, J.F.; Snoeijer, J.H.; Lohse, D. Nanoscopic Interactions of Colloidal Particles Can Suppress Millimetre Drop Splashing. Soft Matter 2021, 17, 5116–5121. [Google Scholar] [CrossRef]
- Visser, C.W.; Kamperman, T.; Karbaat, L.P.; Lohse, D.; Karperien, M. In-Air Microfluidics Enables Rapid Fabrication of Emulsions, Suspensions, and 3D Modular (Bio)Materials. Sci. Adv. 2018, 4, eaao1175. [Google Scholar] [CrossRef] [PubMed] [Green Version]
- Laborie, B.; Lachaussée, F.; Lorenceau, E.; Rouyer, F. How Coatings with Hydrophobic Particles May Change the Drying of Water Droplets: Incompressible Surface versus Porous Media Effects. Soft Matter 2013, 9, 4822–4830. [Google Scholar] [CrossRef] [Green Version]
- Grishaev, V.; Iorio, C.S.; Dubois, F.; Amirfazli, A. Impact of Particle-Laden Drops: Particle Distribution on the Substrate. J. Colloid Interface Sci. 2017, 490, 108–118. [Google Scholar] [CrossRef] [PubMed]
- Nguyen, T.V.; Ichiki, M. Bubble Entrapment during the Recoil of an Impacting Droplet. Microsyst. Nanoeng. 2020, 6, 36. [Google Scholar] [CrossRef] [PubMed]
- Almohammadi, H.; Amirfazli, A. Droplet Impact: Viscosity and Wettability Effects on Splashing. J. Colloid Interface Sci. 2019, 553, 22–30. [Google Scholar] [CrossRef] [PubMed]
- Grishaev, V.; Iorio, C.S.; Dubois, F.; Amirfazli, A. Complex Drop Impact Morphology. Langmuir 2015, 31, 9833–9844. [Google Scholar] [CrossRef] [PubMed]
- Ok, H.; Park, H.; Carr, W.W.; Morris, J.F.; Zhu, J. Particle-Laden Drop Impacting on Solid Surfaces. J. Dispers. Sci. Technol. 2005, 25, 449–456. [Google Scholar] [CrossRef]
- Ashikhmin, A.E.; Khomutov, N.A.; Piskunov, M.V.; Yanovsky, V.A. Secondary Atomization of a Biodiesel Micro-Emulsion Fuel Droplet Colliding with a Heated Wall. Appl. Sci. 2020, 10, 685. [Google Scholar] [CrossRef] [Green Version]
- Ueda, Y.; Yokoyama, S.; Nomura, M.; Tsujino, R.; Iguchi, M. Bouncing Behaviors of Suspension Liquid Drops on a Superhydrophobic Surface. J. Vis. 2010, 13, 281–283. [Google Scholar] [CrossRef]
- Piskunov, M.; Semyonova, A.; Khomutov, N.; Ashikhmin, A.; Yanovsky, V. Effect of Rheology and Interfacial Tension on Spreading of Emulsion Drops Impacting a Solid Surface. Phys. Fluids 2021, 33, 83309. [Google Scholar] [CrossRef]
- Bertola, V. An Impact Regime Map for Water Drops Impacting on Heated Surfaces. Int. J. Heat Mass Transf. 2015, 85, 430–437. [Google Scholar] [CrossRef]
- Piskunov, M.; Khomutov, N.; Semyonova, A.; Ashikhmin, A.; Misyura, S. Unsteady Convective Flow of a Preheated Water-in-Oil Emulsion Droplet Impinging on a Heated Wall. Phys. Fluids 2022, 34, 93311. [Google Scholar] [CrossRef]
- Semyonova, A.; Khomutov, N.; Misyura, S.; Piskunov, M. Dynamic and Kinematic Characteristics of Unsteady Motion of a Water-in-Oil Emulsion Droplet in Collision with a Solid Heated Wall under Conditions of Convective Heat Transfer. Int. Commun. Heat Mass Transf. 2022, 137, 106277. [Google Scholar] [CrossRef]
- Bolleddula, D.A.; Berchielli, A.; Aliseda, A. Impact of a Heterogeneous Liquid Droplet on a Dry Surface: Application to the Pharmaceutical Industry. Adv. Colloid Interface Sci. 2010, 159, 144–159. [Google Scholar] [CrossRef] [PubMed]
- Nicolas, M. Spreading of a Drop of Neutrally Buoyant Suspension. J. Fluid Mech. 2005, 545, 271–280. [Google Scholar] [CrossRef]
- Zhao, Z.; Wang, R.; Ge, L.; Wu, J.; Yin, Q.; Wang, C. Energy Utilization of Coal-Coking Wastes via Coal Slurry Preparation: The Characteristics of Slurrying, Combustion, and Pollutant Emission. Energy 2019, 168, 609–618. [Google Scholar] [CrossRef]
- Kuznetsov, G.V.; Romanov, D.S.; Vershinina, K.Y.; Strizhak, P.A. Rheological Characteristics and Stability of Fuel Slurries Based on Coal Processing Waste, Biomass and Used Oil. Fuel 2021, 302, 121203. [Google Scholar] [CrossRef]
- Volkov, R.S.; Strizhak, P.A. Using Planar Laser Induced Fluorescence and Micro Particle Image Velocimetry to Study the Heating of a Droplet with Different Tracers and Schemes of Attaching It on a Holder. Int. J. Therm. Sci. 2021, 159, 106603. [Google Scholar] [CrossRef]
- Volkov, R.S.; Strizhak, P.A.; Misyura, S.Y.; Lezhnin, S.I.; Morozov, V.S. The Influence of Key Factors on the Heat and Mass Transfer of a Sessile Droplet. Exp. Therm. Fluid Sci. 2018, 99, 59–70. [Google Scholar] [CrossRef]
- Breitenbach, J.; Roisman, I.V.; Tropea, C. From Drop Impact Physics to Spray Cooling Models: A Critical Review. Exp. Fluids 2018, 59, 55. [Google Scholar] [CrossRef]
- Liang, G.; Mudawar, I. Review of Drop Impact on Heated Walls. Int. J. Heat Mass Transf. 2017, 106, 103–126. [Google Scholar] [CrossRef]
- Piskunov, M.; Ashikhmin, A.; Khomutov, N.; Semyonova, A. Effects of Wall Temperature and Temperature-Dependent Viscosity on Maximum Spreading of Water-in-Oil Emulsion Droplet. Int. J. Heat Mass Transf. 2022, 185, 122442. [Google Scholar] [CrossRef]
- Rioboo, R.; Marengo, M.; Tropea, C. Time Evolution of Liquid Drop Impact onto Solid, Dry Surfaces. Exp. Fluids 2002, 33, 112–124. [Google Scholar] [CrossRef]
- Piskunov, M.; Breitenbach, J.; Schmidt, J.B.; Strizhak, P.; Tropea, C.; Roisman, I.V. Secondary Atomization of Water-in-Oil Emulsion Drops Impinging on a Heated Surface in the Film Boiling Regime. Int. J. Heat Mass Transf. 2021, 165, 120672. [Google Scholar] [CrossRef]
- Burzynski, D.A.; Roisman, I.V.; Bansmer, S.E. On the Splashing of High-Speed Drops Impacting a Dry Surface. J. Fluid Mech. 2020, 892, A2. [Google Scholar] [CrossRef] [Green Version]
- Sharp, D.H. An Overview of Rayleigh-Taylor Instability. Phys. D Nonlinear Phenom. 1984, 12, 3–18. [Google Scholar] [CrossRef] [Green Version]


| Main Characteristics | Elemental Composition | ||||||||
|---|---|---|---|---|---|---|---|---|---|
| Substance | Fuel moisture Wa, % | Ash content of the fuel on a dry basis Ad, % | Content of volatiles Vdaf, % | Specific heat of combustion Qas,V, MJ/kg | Carbon content calculated on a dry ash-free (daf) mass Cdaf, % | Hydrogen content calculated on a dry ash-free (daf) mass Hdaf, % | Nitrogen content calculated on a dry ash-free (daf) mass Ndaf, % | Sulfur content in dry matter Std, % | Oxygen content calculated on a dry ash-free (daf) mass Odaf, % |
| Coking coal | 2.05 | 14.65 | 27.03 | 29.76 | 79.79 | 4.486 | 1.84 | 0.868 | 13.016 |
| Temperature | Density, ρ | Dynamic Viscosity, µ | Surface Tension, σ |
|---|---|---|---|
| K | kg/m3 | Pa·s | N/m |
| 293.15 | 1154 | 10.8 × 10⁻³ | 0.06058 |
| Discharge height—2 cm, We ≈ 30 | Coal grinding fineness | Sample name | Coal grinding fineness | Sample name | Number of experiments |
| 45–80 μm | - | 120–140 μm | - | pcs. | |
| Particle concentration, wt.% | 0.06 | Slurry 1 | 0.06 | Slurry 3 | 6 |
| 1 | Slurry 2 | 1 | Slurry 4 | 6 | |
| Discharge height—7 cm, We ≈ 60 | Coal grinding fineness | Sample name | Coal grinding fineness | Sample name | Number of experiments |
| 45–80 μm | - | 120–140 μm | - | pcs. | |
| Particle concentration, wt.% | 0.06 | Slurry 1 | 0.06 | Slurry 3 | 6 |
| 1 | Slurry 2 | 1 | Slurry 4 | 6 | |
| Discharge height—15 cm, We ≈ 90 | Coal grinding fineness | Sample name | Coal grinding fineness | Sample name | Number of experiments |
| 45–80 μm | - | 120–140 μm | - | pcs. | |
| Particle concentration, wt.% | 0.06 | Slurry 1 | 0.06 | Slurry 3 | 6 |
| 1 | Slurry 2 | 1 | Slurry 4 | 6 | |
| Discharge height—22 cm, We ≈ 120 | Coal grinding fineness | Sample name | Coal grinding fineness | Sample name | Number of experiments |
| 45–80 μm | - | 120–140 μm | - | pcs. | |
| Particle concentration, wt.% | 0.06 | Slurry 1 | 0.06 | Slurry 3 | 6 |
| 1 | Slurry 2 | 1 | Slurry 4 | 6 | |
| Total | 48 | ||||
Disclaimer/Publisher’s Note: The statements, opinions and data contained in all publications are solely those of the individual author(s) and contributor(s) and not of MDPI and/or the editor(s). MDPI and/or the editor(s) disclaim responsibility for any injury to people or property resulting from any ideas, methods, instructions or products referred to in the content. |
© 2023 by the authors. Licensee MDPI, Basel, Switzerland. This article is an open access article distributed under the terms and conditions of the Creative Commons Attribution (CC BY) license (https://creativecommons.org/licenses/by/4.0/).
Share and Cite
Ashikhmin, A.; Khomutov, N.; Volkov, R.; Piskunov, M.; Strizhak, P. Effect of Monodisperse Coal Particles on the Maximum Drop Spreading after Impact on a Solid Wall. Energies 2023, 16, 5291. https://doi.org/10.3390/en16145291
Ashikhmin A, Khomutov N, Volkov R, Piskunov M, Strizhak P. Effect of Monodisperse Coal Particles on the Maximum Drop Spreading after Impact on a Solid Wall. Energies. 2023; 16(14):5291. https://doi.org/10.3390/en16145291
Chicago/Turabian StyleAshikhmin, Alexander, Nikita Khomutov, Roman Volkov, Maxim Piskunov, and Pavel Strizhak. 2023. "Effect of Monodisperse Coal Particles on the Maximum Drop Spreading after Impact on a Solid Wall" Energies 16, no. 14: 5291. https://doi.org/10.3390/en16145291