1. Introduction
The superheating of a liquid precedes and accompanies the liquid–vapor phase transition used in various technological applications [
1,
2,
3,
4,
5,
6]. Interest in the issue of boiling liquids has received an additional impetus due to the development of mini- and micro-sized devices [
6,
7]. An important component of this problem is the stage of the vapor phase nucleation onset [
8,
9]. It is registered by some macroscopic response of the system, which is monitored until the superheating is removed.
The practically significant case of nucleate boiling-up on a heated surface begins with bubble nucleation in the near-wall layer of the superheated liquid. Boiling-up modes are determined by the superheat value of the liquid with respect to the liquid–vapor equilibrium line. Essentially, the initial stage of boiling represents an isothermal process of a vapor-bubble expansion, which is limited by the rate at which a mechanical impulse is transmitted to the surrounding liquid (inertial bubble growth). Since turbulence of the liquid occurs near the heating surface, the growth rate of the vapor bubble determines the hydrodynamic regime in the wall layer and the intensity of heat exchange [
10,
11]. In connection with the development of microelectronics, it is timely to study heat transfer from locally heated “hot spots” at the boundary with the coolant [
12].
From the first experiments on the superheating of liquids, the attention of researchers was attracted to the initial stage of the boiling-up relative to the liquid–vapor equilibrium line [
13]. By reducing the product
Vliq·texp (where
Vliq—volume of the superheated liquid;
texp—observation time of the superheated state), it was possible to break through the background of the ready vaporization centers to achieve significant superheating. Due to the characteristic random nature of spontaneous boiling-up [
14], it is difficult to study the processes in detail. The use of recording equipment is complicated by a combination of uncertainty in the waiting time for boiling-up and the relatively rapid transition to the saturation line. This is due to the difficulty of identifying the site and moment of the spontaneous boiling-up onset in a liquid at the necessary microsecond resolution for the recording of rapid processes. A significant advance in this regard was achieved with the use of low-inertia metal heaters comprised of thin wires [
14,
15] and films [
16,
17]. Due to the relatively rapid heating of wires and films, it became possible to reduce the uncertainty at the time of boiling-up. The superheating of liquid was achieved in a thin layer adjacent to the surface of the heater during non-stationary heating. Consequently, the boiling site turned out to be localized on the heating surface. Numerous experiments have been carried out with oscillography and high-speed recording of the surface boiling processes [
14,
15,
16,
17,
18,
19,
20,
21,
22,
23,
24]; extensive data have been obtained on the attainable superheating of liquids during their pulsed heating [
4,
5,
6]. However, there was uncertainty associated with the randomness of the boiling site on the surface and the influence of the thickness of the heated layer (the temperature gradient normal to the heating surface) on the dynamics of the observed processes. In addition, the method was mainly applied at high superheating rates to reduce the waiting time for boiling-up onset in light of the influence of surface treatment quality over longer time intervals [
17,
18,
25].
In pursuit of further localization in terms of the location and time of observation of the initial stage of boiling-up, a technique was developed for the pulsed laser activation of the liquid–vapor transition in a miniature bubble chamber [
26]. The bubble chamber [
4,
14] is characterized by the uniform superheating of the liquid in the capillary. Since, as a result, there is no restriction on the thickness of the heated layer, the value of the superheating temperature can be set more precisely. The development of the boiling-up process can be traced by the reflection of a probing beam following the activation pulse. This approach, when the first powerful pulse transfers the system under study to a nonequilibrium state, and the subsequent probing serves to track the relaxation process of the system, is known as the “pump-probe” method [
27]. The advantage of this method lies in the strict synchronization of the processes of normalized exposure and observation, which allows for the rate of occurrence and repeatability of the observed phenomena to be assessed even at short time intervals. The purpose of the present work is to demonstrate the capabilities of the “pump-probe” laser method by identifying the features of the initial stage of activated liquid boiling-up (on the example of
n-pentane) under the conditions of uniform superheating in a miniature bubble chamber.
2. Background
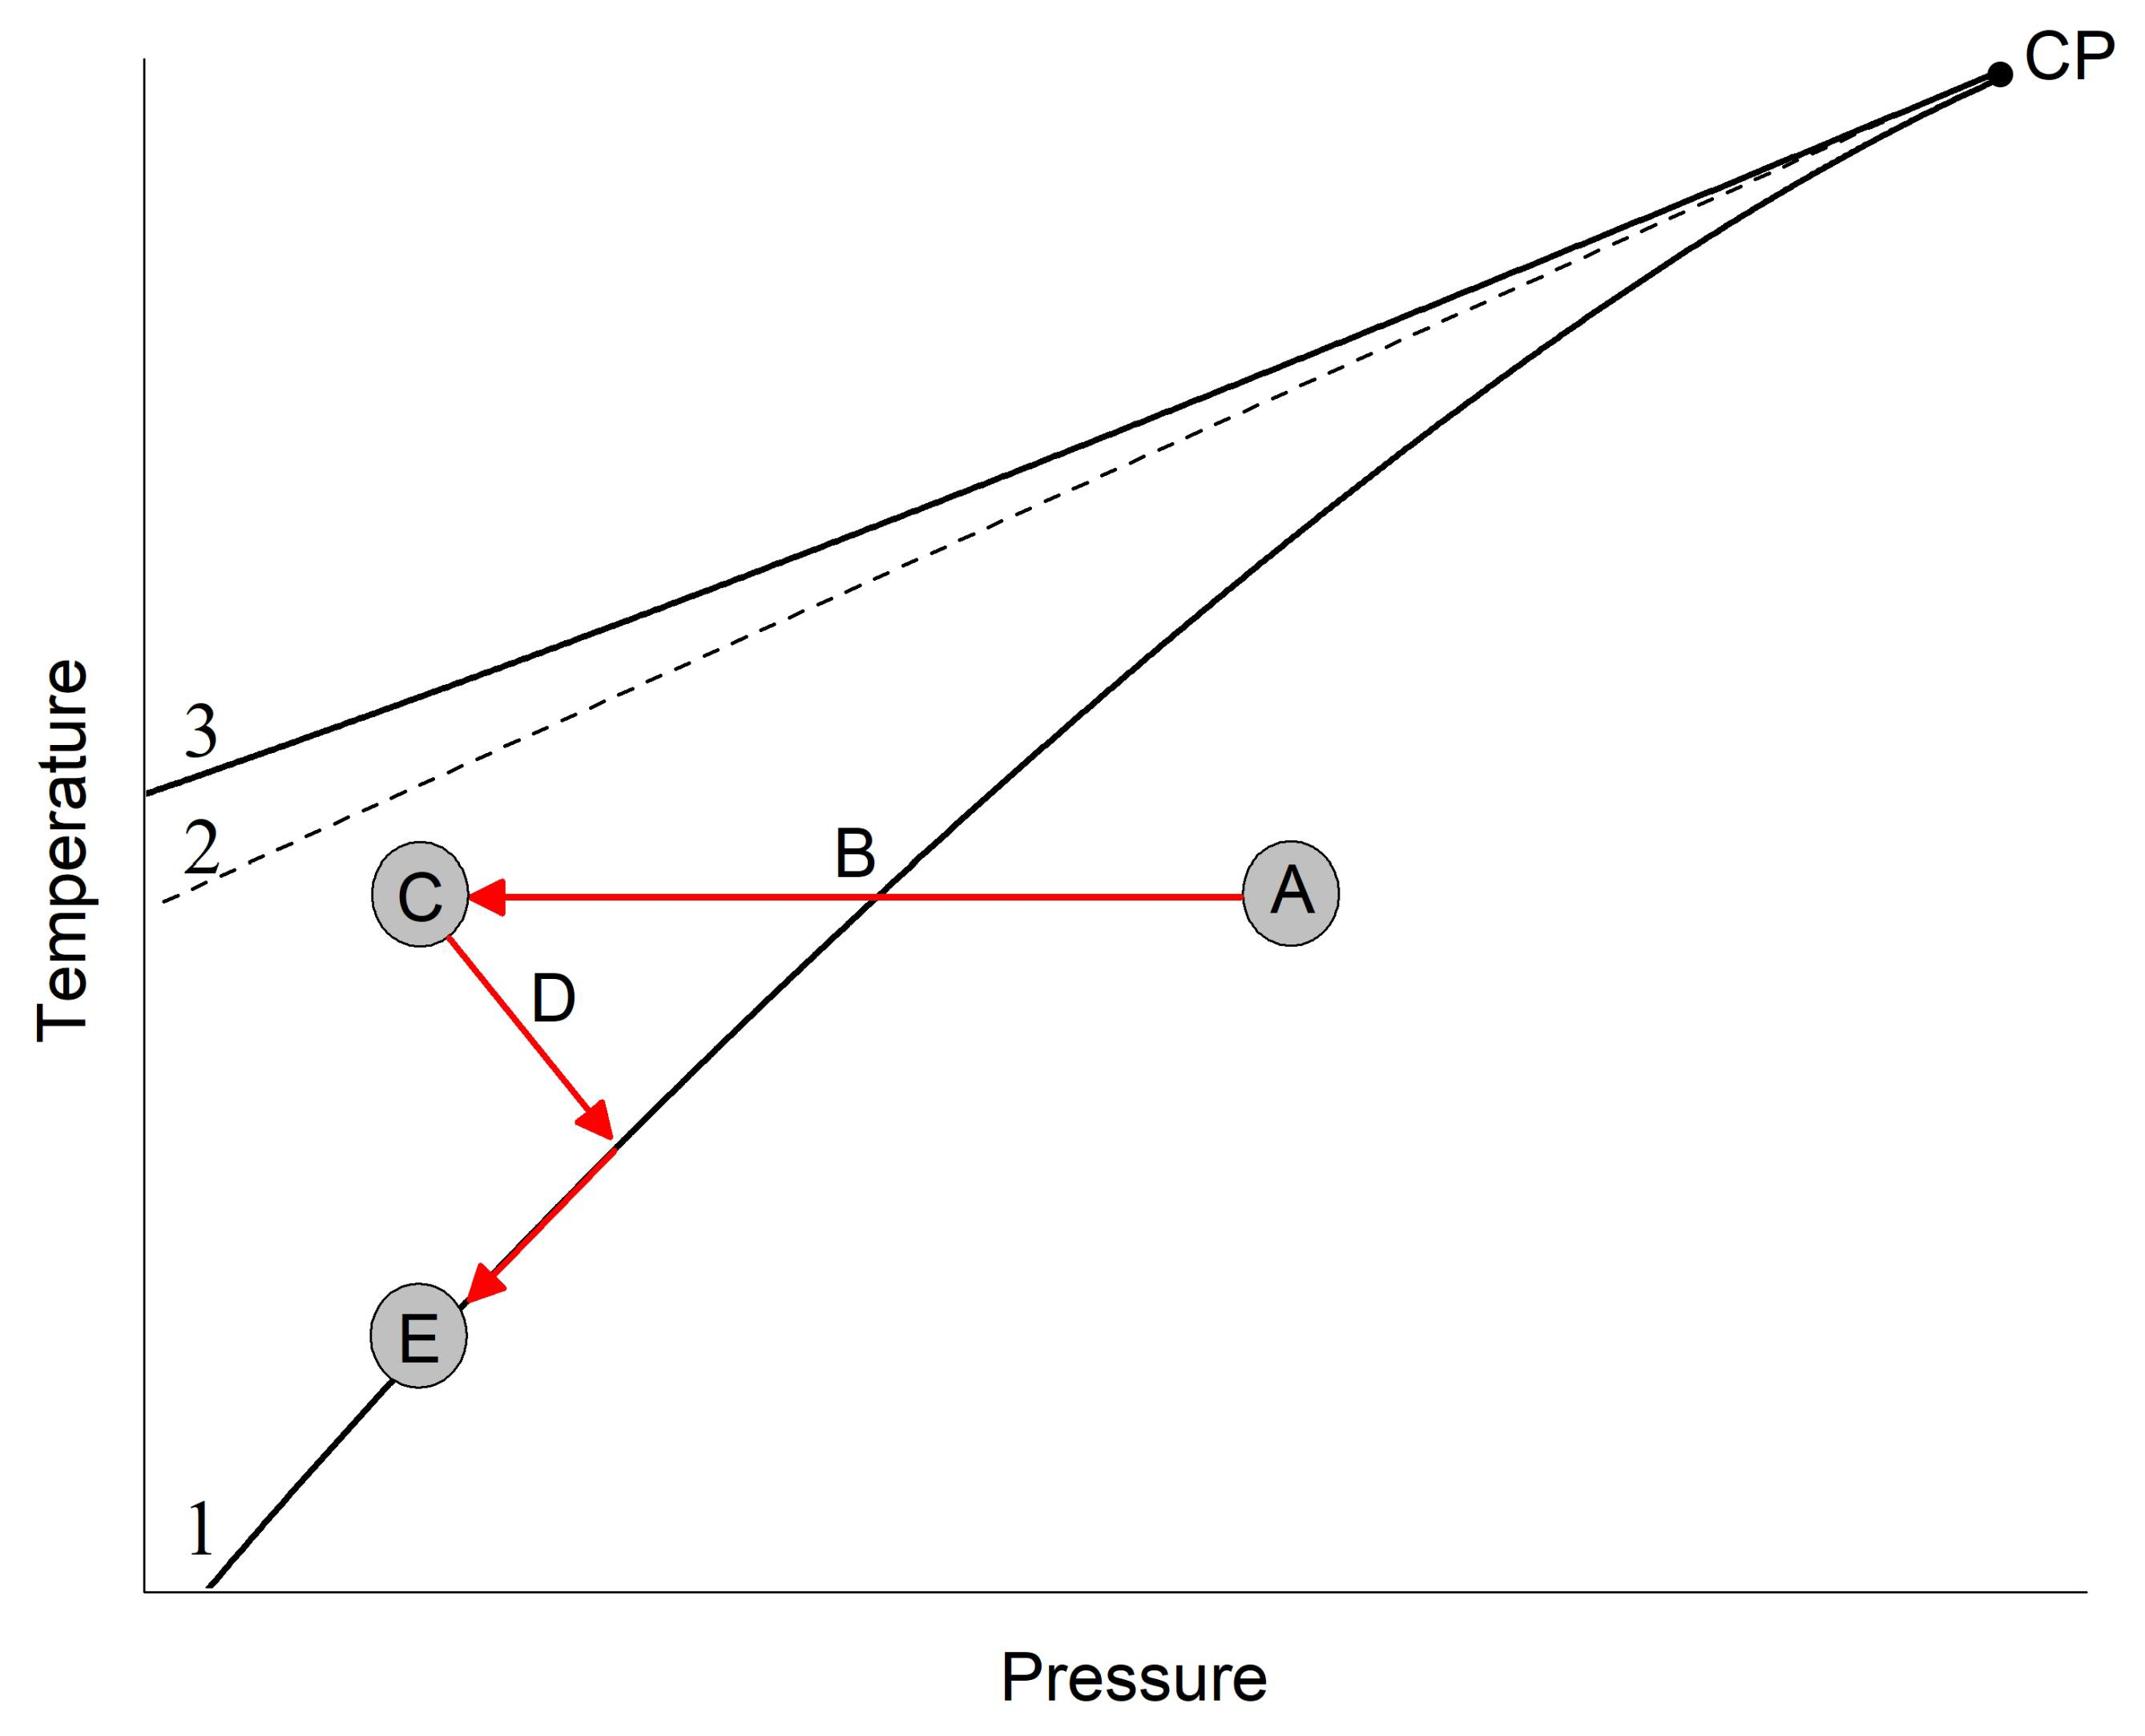
The action of the bubble chamber consists of transferring the liquid to the area of superheated states by resetting the initial pressure in the liquid
p0 below the equilibrium pressure liquid/vapor
ps (see
Figure 1, A–C transition).
Thus, the degree of superheating was given by the final pressure value
pexp <
ps; the parameter monitored in the experiment was the lifetime of the superheated state prior to its decay by spontaneous boiling-up at given thermodynamic parameters. A practical basis for the detailed verification of the theory of homogeneous nucleation [
8], and the measurement of different properties of substances in superheated states [
4,
28,
29,
30] including fuel-in-water emulsions and fuel blends [
31], consisted of the determination of the temperature, pressure, and volume of the superheated liquid. To track the rapid boiling processes, a fiber optic sensor is placed in the capillary of the bubble chamber [
9,
29,
32,
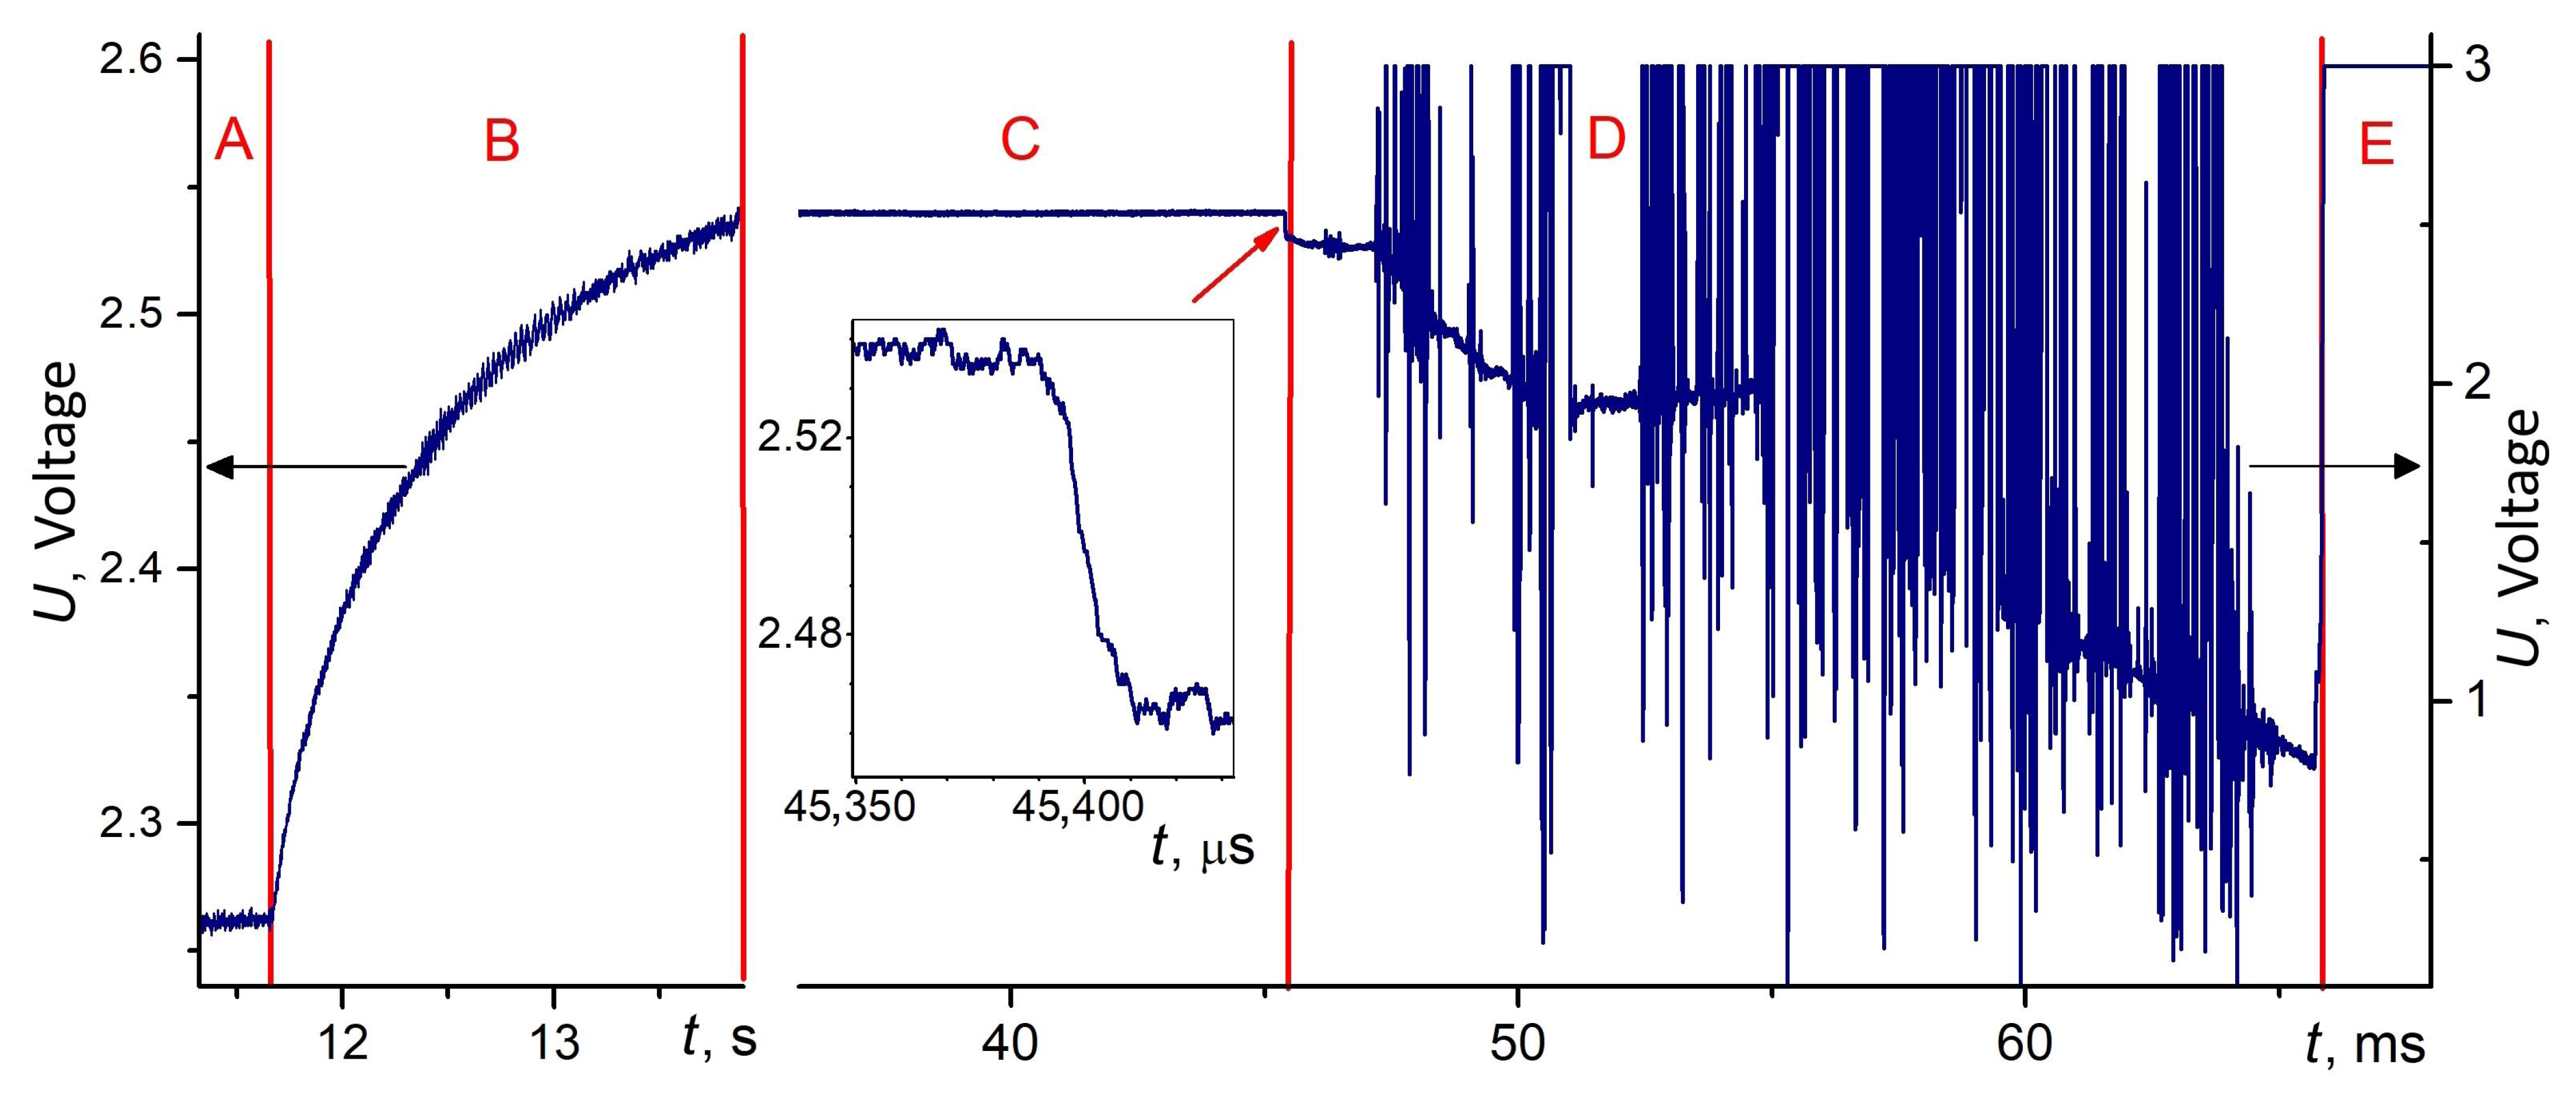
33]. As an example,
Figure 2 shows records of the spontaneous boiling-up signals of hexane carried out using the fiber optic sensor in previous works [
9,
32,
33]. The change in signal voltage at the output of the photodetector is associated with a change in the density of the medium surrounding the fiber optic sensor. The letters indicating the stages of the process correspond to the states and transitions noted in
Figure 1.
The initial equilibrium state is indicated by A (at initial pressure
p0 >
ps and temperature
T0 =
Texp). Transition B denotes the pressure release to
pexp < ps. In state C, the liquid is superheated (metastable) until boiling-up occurs, followed by a two-phase transition, D. The process terminates in equilibrium state E on the saturation line. The described cycle can be repeated many times for a dataset to permit its statistical processing. In state C, spontaneous boiling can be expected or activated by some external action. The region of vapor phase nucleation of interest to us is located at the transition from state C to state D (marked with an arrow in
Figure 2). Our approach to the boiling-up activation of
n-pentane in a bubble chamber is described in [
26]. The activation by a short laser pulse at the end of the light guide in the transparent liquid was found to have a threshold character in terms of the intensity of the excitation pulse. Increasing the energy of the pulse by changing its duration within wide limits (up to two orders of magnitude) with insufficient intensity did not lead to boiling-up. The results of a study into the effects accompanying the nanosecond excitation pulse suggest that the activation mechanism may be of a non-thermal nature. It is likely that an electrostriction mechanism of the liquid is activated at a certain intensity of the electromagnetic field of the laser pulse. Accordingly, the boiling-up activation is generated by a mechanical impulse from electrostriction. On the basis of the detected phenomenon, a method was developed for activating and studying transient the boiling-up processes across a wide area of superheated states with a precisely defined superheating temperature in the bubble chamber. The method of observing transient processes is described in [
29,
32]. A light guide in the bubble chamber was used to observe the liquid–vapor transition by changing the reflection signal from the end of the light guide with changes in the density of the medium [
9,
29,
32]. Since the speed of the available photodetectors is measured in hundreds of megahertz, it is possible to record processes at nanosecond resolution.
3. Method
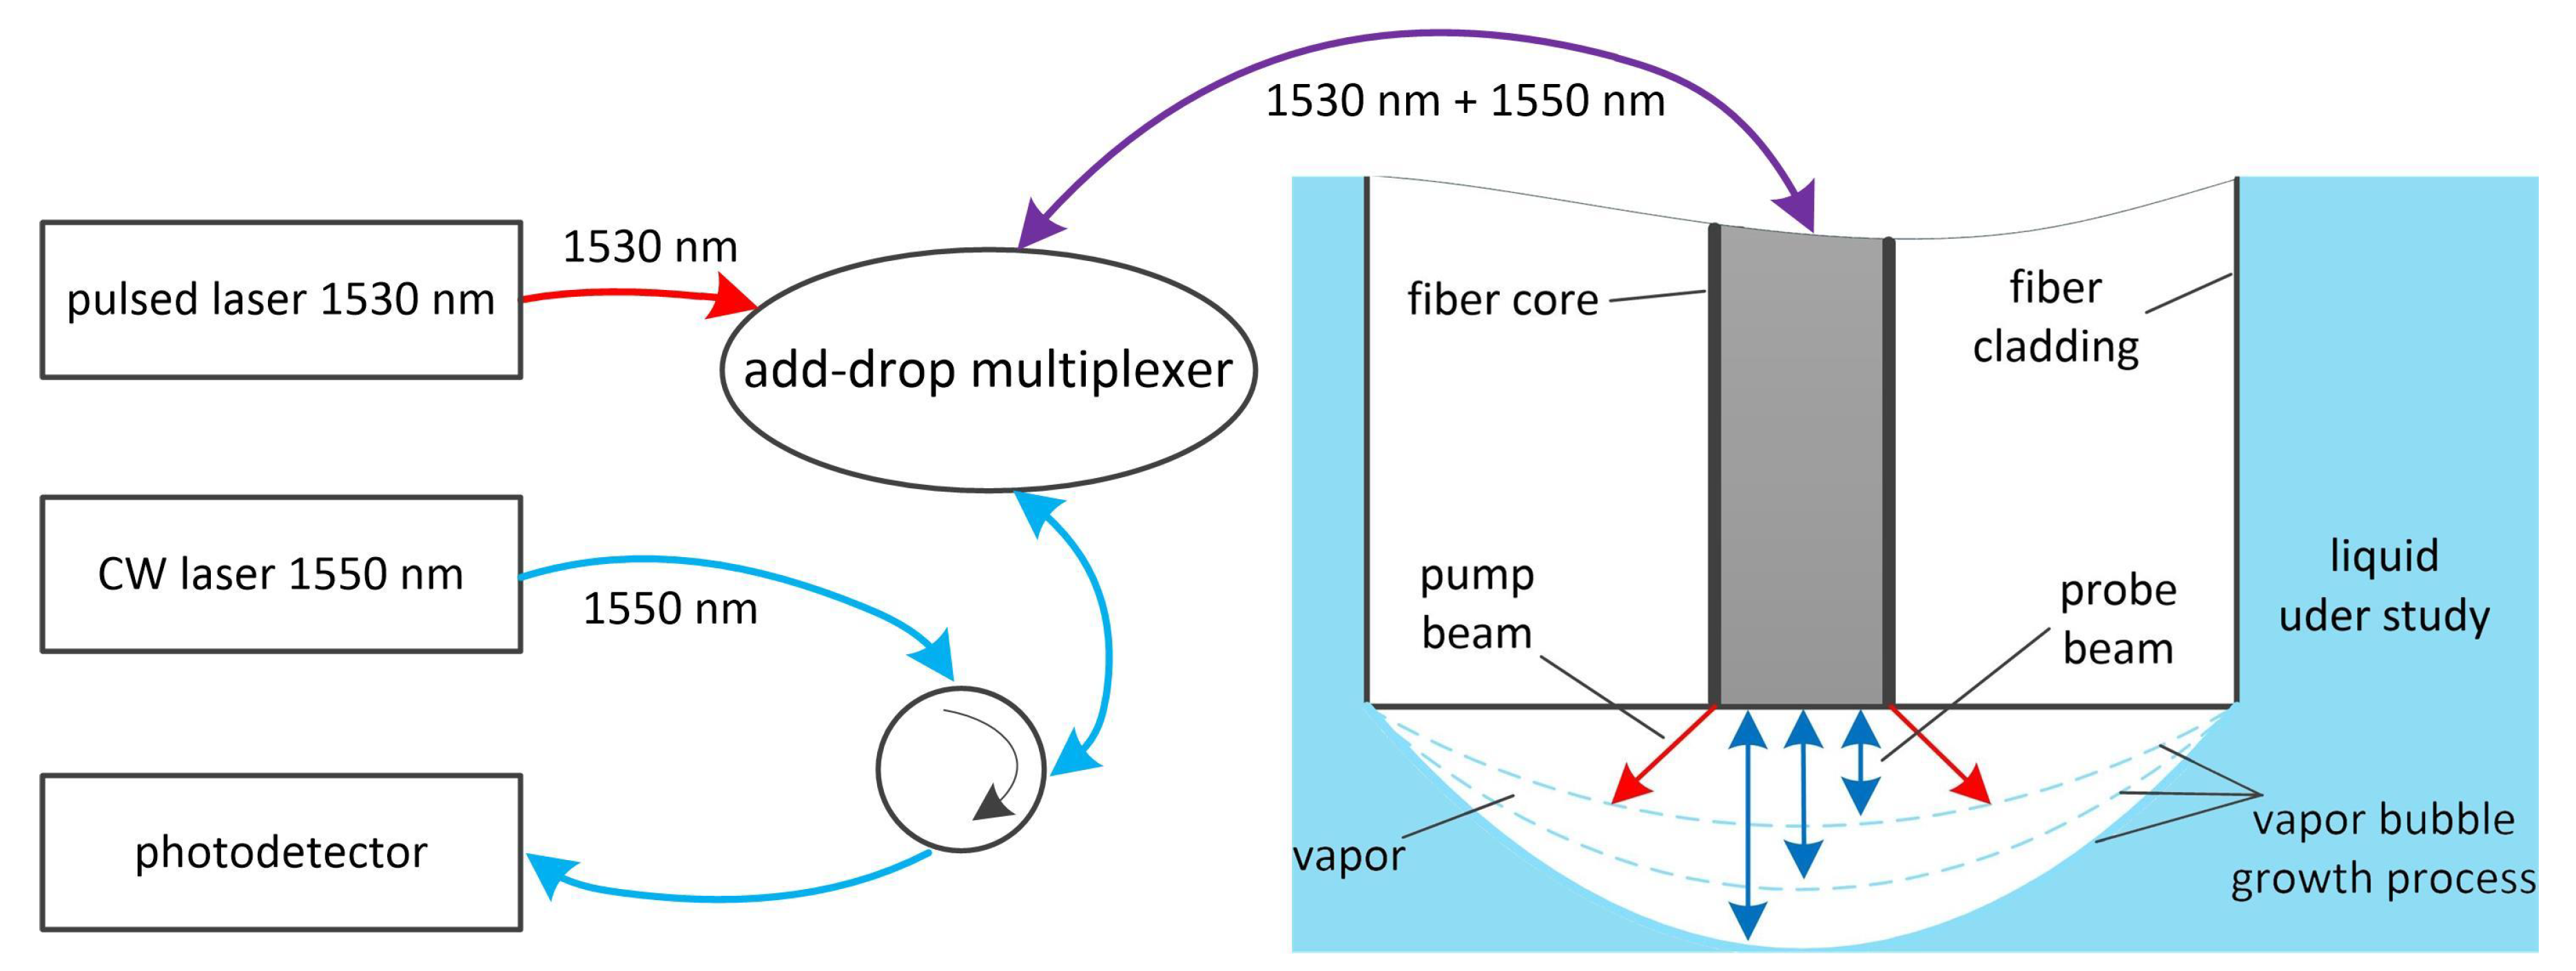
The application of the pump-probe method is illustrated in
Figure 3. A pump pulse beam with a duration of 1–10 ns was generated by pulsed laser 1530 nm. A probe beam was continuously generated by CW laser 1550 nm. Combining the emissions for the transmission over a single fiber was achieved using the add-drop multiplexer. The pump pulse beam acted on the end of the “optofiber” on the liquid superheated in the capillary and, at a sufficient intensity, activated its boiling. The probe beam reflected from the end was returned back through the add-drop multiplexer and optical circulator to the photodetector. The intensity of the reflected signal depends on the density of the medium at the end of the optofiber and increased as the density decreased. Therefore, the boiling of the liquid was accompanied by a sharp increase in the reflected signal. In the course of boiling, a two-phase system was formed near the end of the optofiber, as shown in
Figure 3. Then, the probe beam had a double reflection from the end and from the vapor–liquid interface, followed by interference. Since this interface moved as the bubble grows, the photodetector signal exhibited oscillations. The oscillation frequency is related to the speed of the interface movement according to the Doppler effect.
To activate the boiling of
n-pentane through the light guide at different temperatures and pressures, pulses of laser radiation (pump beam pulses) were applied. The required intensity and energy of the activating pulses increased with a decrease in the superheating temperature and an increase in the residual pressure
pexp [
26]. An increase in the work of the bubble formation with a decrease in the superheating temperature and with an increase in external pressure [
4,
5,
14] predetermined an increase in the intensity of the activating pulses. The development of the phase transition was monitored by changing the intensity of the probe beam reflected from the end of the light guide. Here, the measured intensity of the reflected radiation increased with a decrease in the refractive index of the medium according to the Fresnel formula. In turn, the refractive index decreased with a reduction in the density of the medium. The dynamics of the changes in the density of the medium were assessed by tracking the changes in the average intensity of the reflected radiation according to the photodetector signal following the activating pulse [
26,
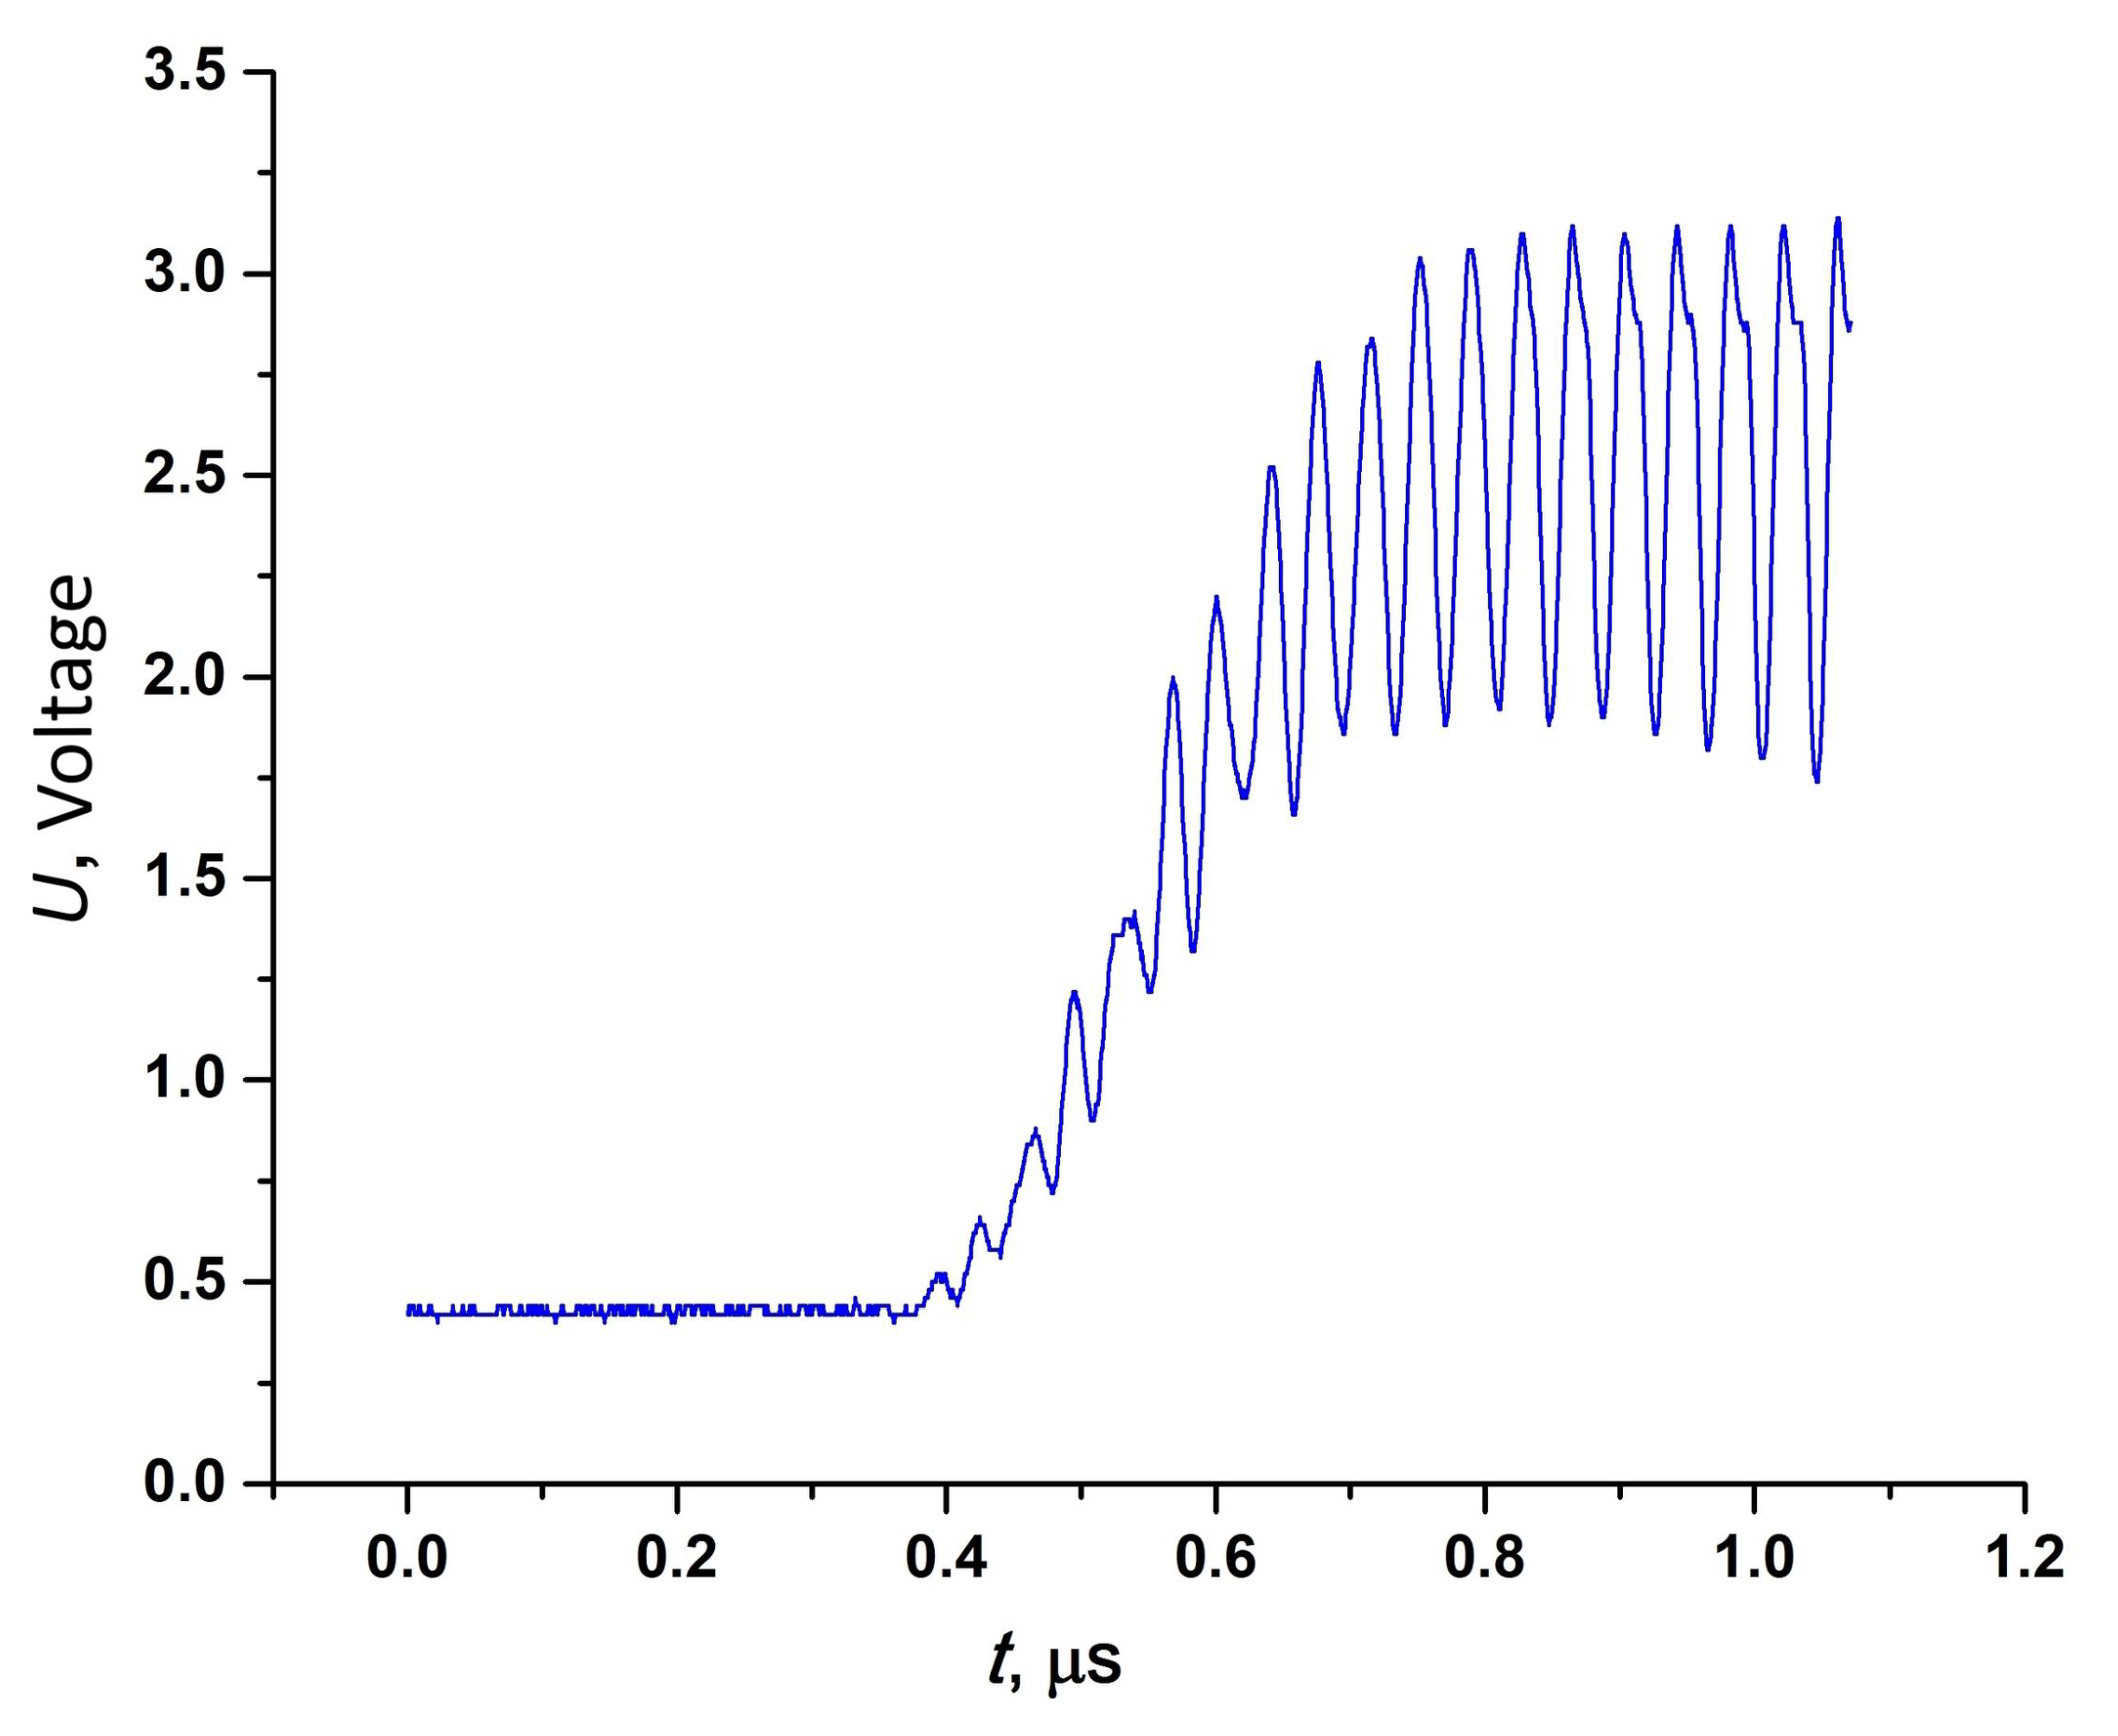
34]. During the fiber-optic densitometry experiments with superheated liquid following activation of boiling-up, high-frequency oscillations were observed at the output of the high-speed photodetector of reflected radiation. However, the observed oscillations are not associated with changes in the density of the medium, appearing rather as a result of interference of the reflected rays. The traveling interference pattern shown in
Figure 4, which is characteristic of the interferometers with a moving reflector, is due to the formation of an additional reflected signal as a result of the superposition of the origin and propagation of the phase interface with the reflected light waves from the stationary end of the fiber [
34]. Each oscillation period in the recorded signal (
Figure 4) corresponds to a shift of the vapor front by half the wavelength of the probing radiation.
In this case, the frequency of the observed oscillations depended on the speed of the movement of the reflector according to the Doppler effect. Thus, the speed of movement of the reflecting phase interface can be determined by measuring the frequency of the recorded oscillations. This laser measurement method is called laser Doppler velocimetry [
35]. In our experiments, the Doppler frequency shift increased in accordance with an intensification of in the bubble growth rate due to the higher superheating temperature of
n-pentane at atmospheric pressure.
The values of the velocity of movement of the phase interface were determined by the Doppler velocimetry ratio:
where
FD—current Doppler frequency shift (MHz); λ—wavelength of the laser diode radiation (1.55 microns); and
n(
t)—current refractive index of the medium:
where
nliq,
nvap—refractive indices of the liquid and vapor phases on the saturation line at the experimental temperature, respectively;
Umin;
Umax—minimum and maximum average values of the photodetector output signal corresponding to the values of
nliq,
nvap; and
U(
t)—current average value of the output signal of the photodetector.
Since the oscillations developed during decompression to the vapor phase, in most cases, n(t) => 1.
4. Installation
According to the phase diagram (
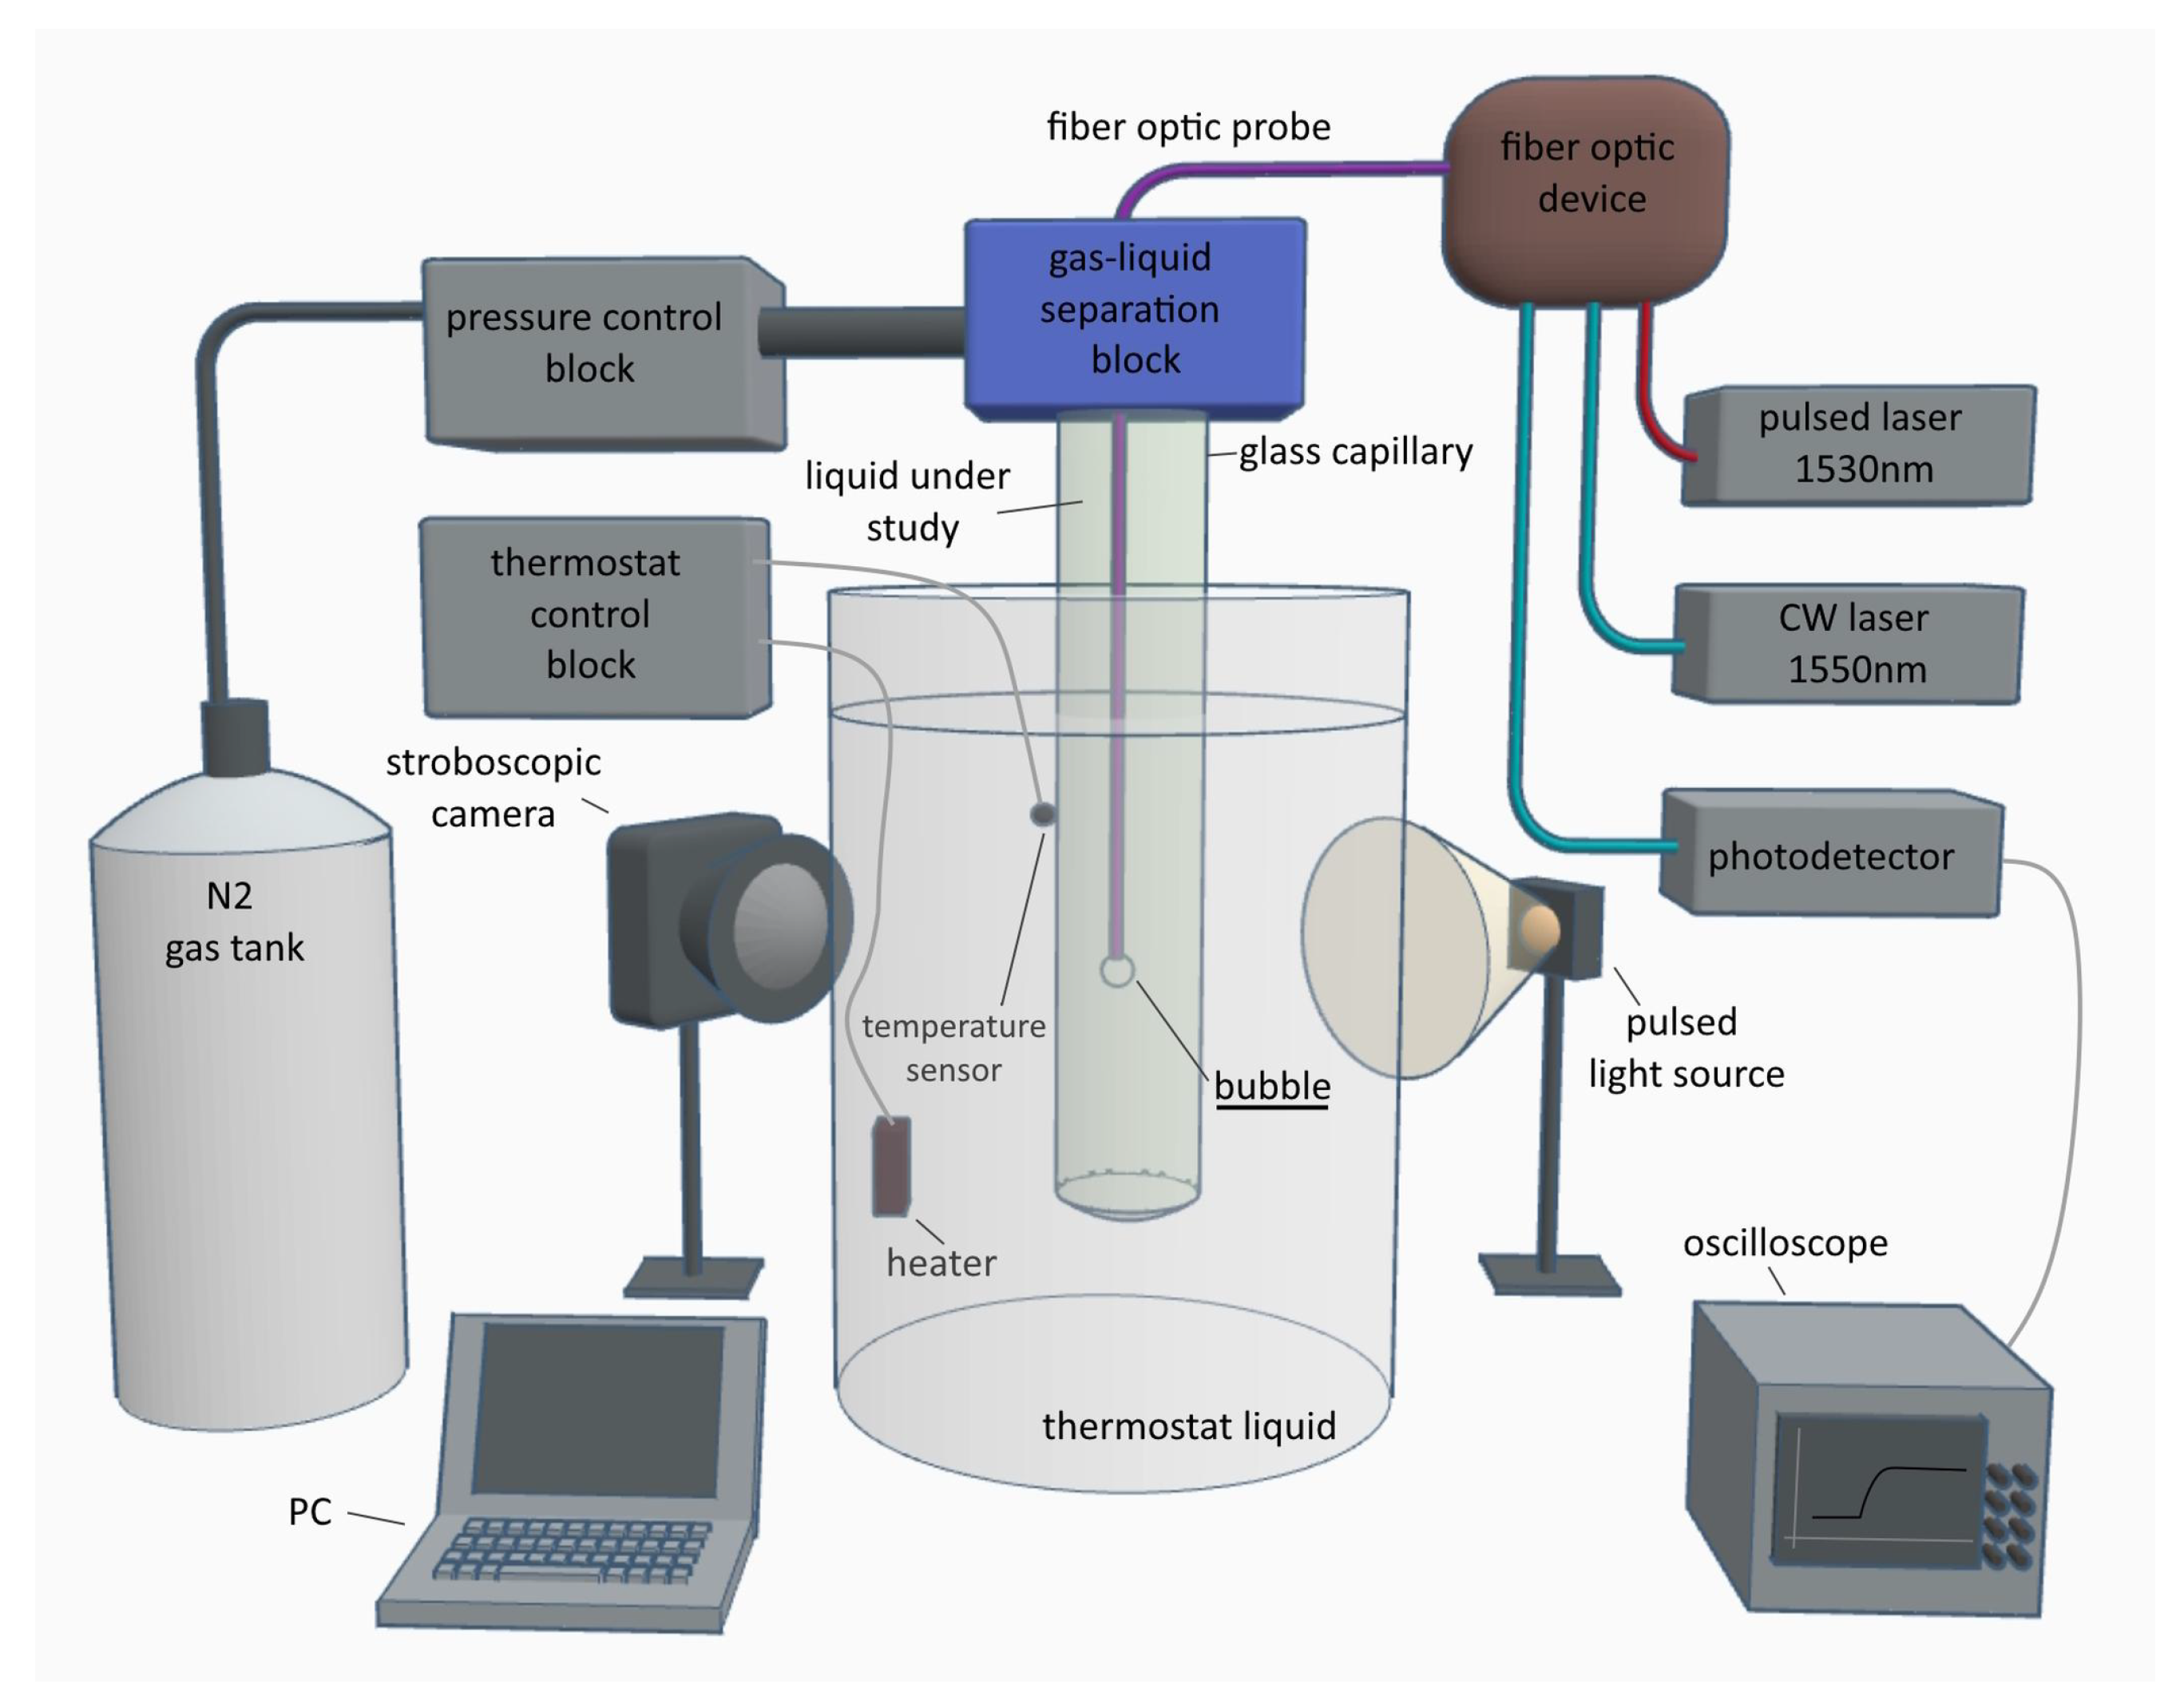
Figure 1), two stages are necessary to obtain a superheated state in the bubble chamber. At the first stage, the sample is heated and held in a stable liquid state (point A) at elevated pressure. At the second stage, there was a rapid decrease in the pressure (to atmospheric pressure) and the transfer of the liquid to a superheated state (point C). An experimental setup implementing such a mode is shown in
Figure 5. The test liquid was used to fill a glass capillary with an internal diameter of 1 mm and a heated section of 30 mm. Inside the capillary, the liquid pressure could be set by the external pressure of nitrogen vapor on the separation membrane. To achieve this, gas was supplied from the N
2 gas tank to the gas–liquid separation block via the pressure control block. The movable membrane, which separated the nitrogen and the liquid under study while maintaining their hydraulic connection, was installed inside the gas–liquid separation block. The mobility of the membrane and the low compressibility of the liquid were necessary to ensure the equality of the pressures in the capillary and in the gas cavity of the gas–liquid separation block. Such a system allowed for two possible pressure values to be selected for the liquid in the capillary: atmospheric and that provided from the N
2 gas tank via the pressure control block. The pressure control block is controlled from a PC.
In order to heat the sample, the glass capillary was immersed in a transparent thermostat (heat carrier) with a coolant fluid (thermostat liquid). The coolant fluid was heated using an electric heater.
A precision temperature sensor was installed to monitor the temperature near the capillary. The sensor was a type K thermocouple with measurement error of 0.1 °C. To increase the accuracy of measurements, the calibration curve of thermocouples was obtained on a special bench by comparing it with the indications of a platinum thermometer. The thermostat control block maintained the set temperature of the coolant by reading the sensor indications and adjusting the electric power level of the heater. This temperature was regulated directly on the unit or via software (PC).
A fiber optic probe was installed inside the capillary to supply the activation effect to the superheated liquid. The probe was a standard single-mode quartz fiber light guide, which was previously cleaned from the outer shell, and whose free end was located in the capillary. The outer diameter of the light guide was 125 microns; the diameter of the fiber core was 10 microns. The probe was connected to the electronic radiation supply and reception units via a fiber optic device. This scheme implemented the “pump-probe” principle. For the pump, a pulsed laser of 1530 nm, having an adjustable power of up to 30 W and a variable pulse duration on a scale from 1 ns to 100 ns, was used. The probing beam was generated by a permanent laser (CW laser 1550 nm) having a wavelength of 1550 nm and a power of 2.5 mW. Both kinds of radiation—pumping and probing—were combined and fed into the fiber probe using fiber elements comprising an adder and an optical circulator, which make up the fiber optic device. The probing radiation reflected from the free end of the light guide was separated, filtered, and then fed to the photodetector. The output of the photodetector generated an electrical signal, which was recorded using a high-speed oscilloscope. The recorded waveform files were transferred to the PC for processing. The photodetector received signals in the frequency range 0–100 MHz with a sensitivity to optical power of 0.1 V/μW. The Doppler frequency measurements using a photodetector and a Rigol 5354 oscilloscope have an uncertainty of 5% over the frequency range 10–40 MHz.
Due to the synchronous activation of the boiling-up with the pumping pulse and the subsequent growth of the vapor bubble, it was possible to capture the stages of bubble growth on a microsecond time scale using the stroboscopic video method. For this purpose, a video camera with a frame rate of 60 Hz in stroboscopic mode was used. The mode was provided by the operation of a pulsed light source, with the generation of a short (from 0.1 µs to 0.5 µs) light pulse (strobe) delayed relative to the pump pulse for a specified time. By changing the pause time between the strobe and the pump pulse, various stages of bubble growth could be recorded in a series of experiments (
Figure 6).
5. Results
The experiments in the bubble chamber were carried out in a wide area of superheated states created by the pressure drop in a heated liquid. The mean “lifetime” of
n-pentane before spontaneous boiling-up under the given conditions (
pexp <
ps,
Texp >
Ts) ranged from units of seconds to tens of minutes. This time was sufficient to establish thermodynamic equilibrium following the pressure drop [
14]. The activation of boiling was carried out by a single nanosecond pulse pump pulse (1–10 ns) with an intensity exceeding the activation threshold by ~10%. The values of the intensity and the duration of the pulse were selected experimentally from the condition of the absence of their influence on the recorded data.
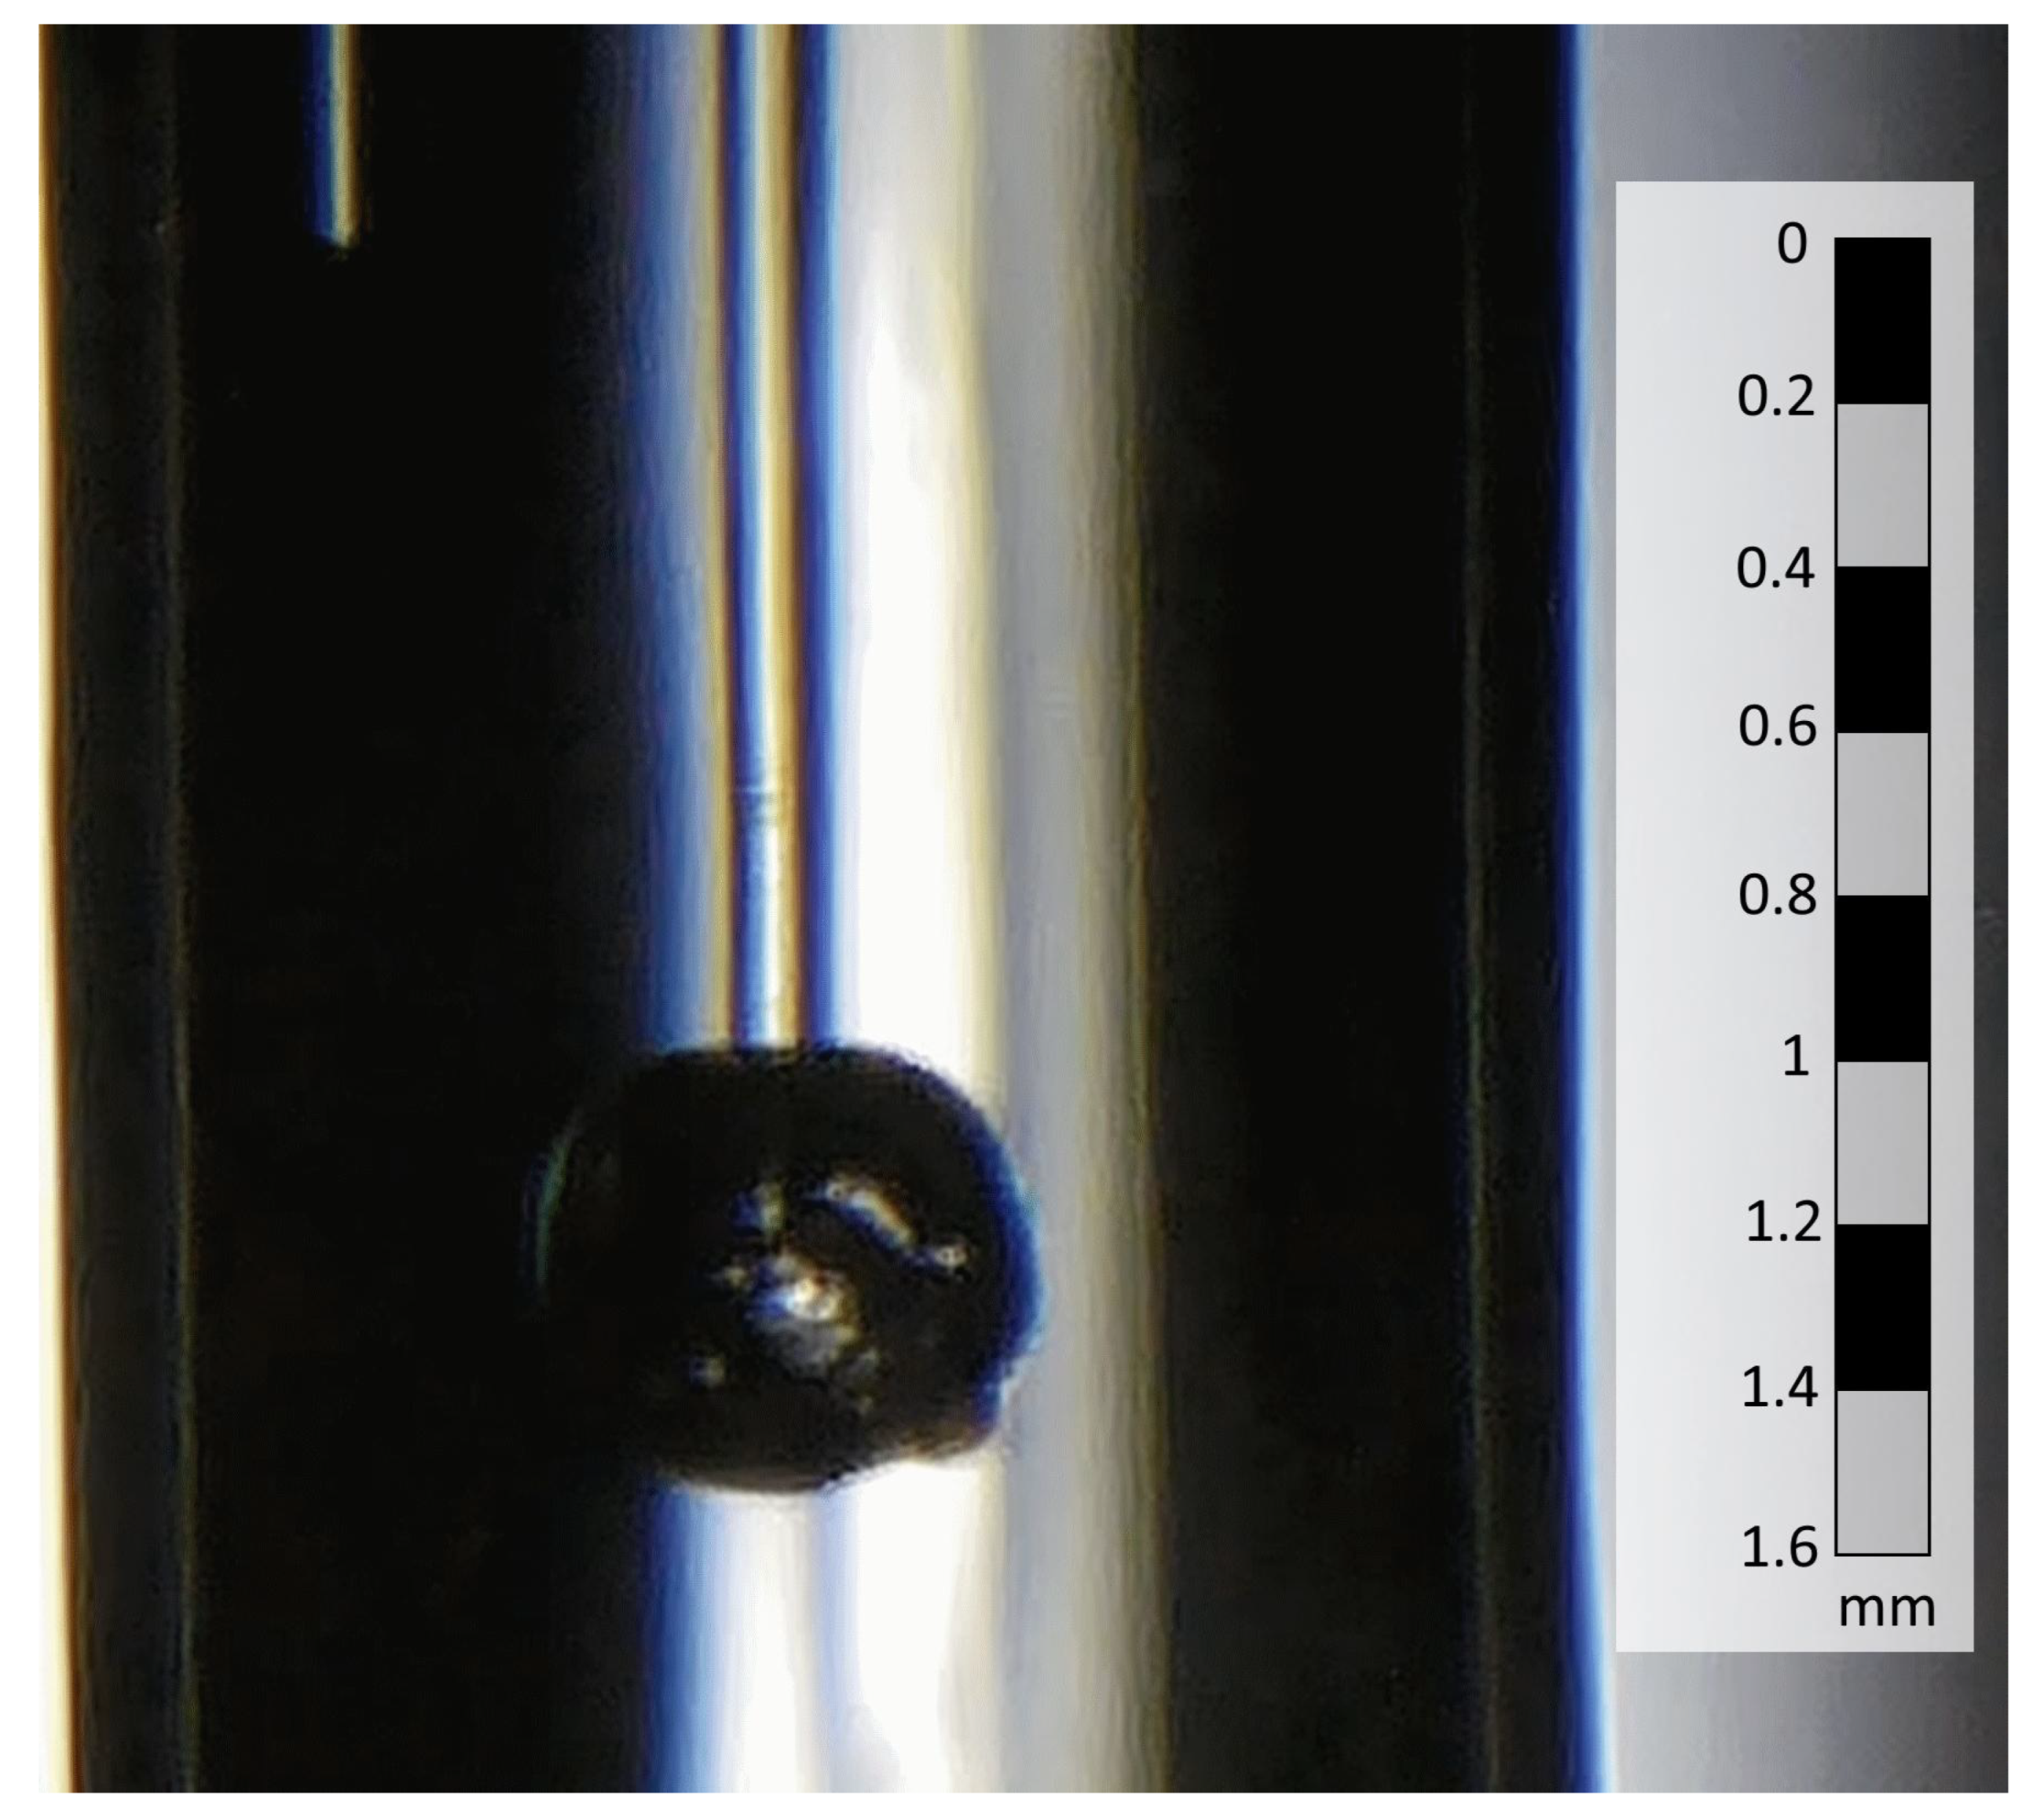
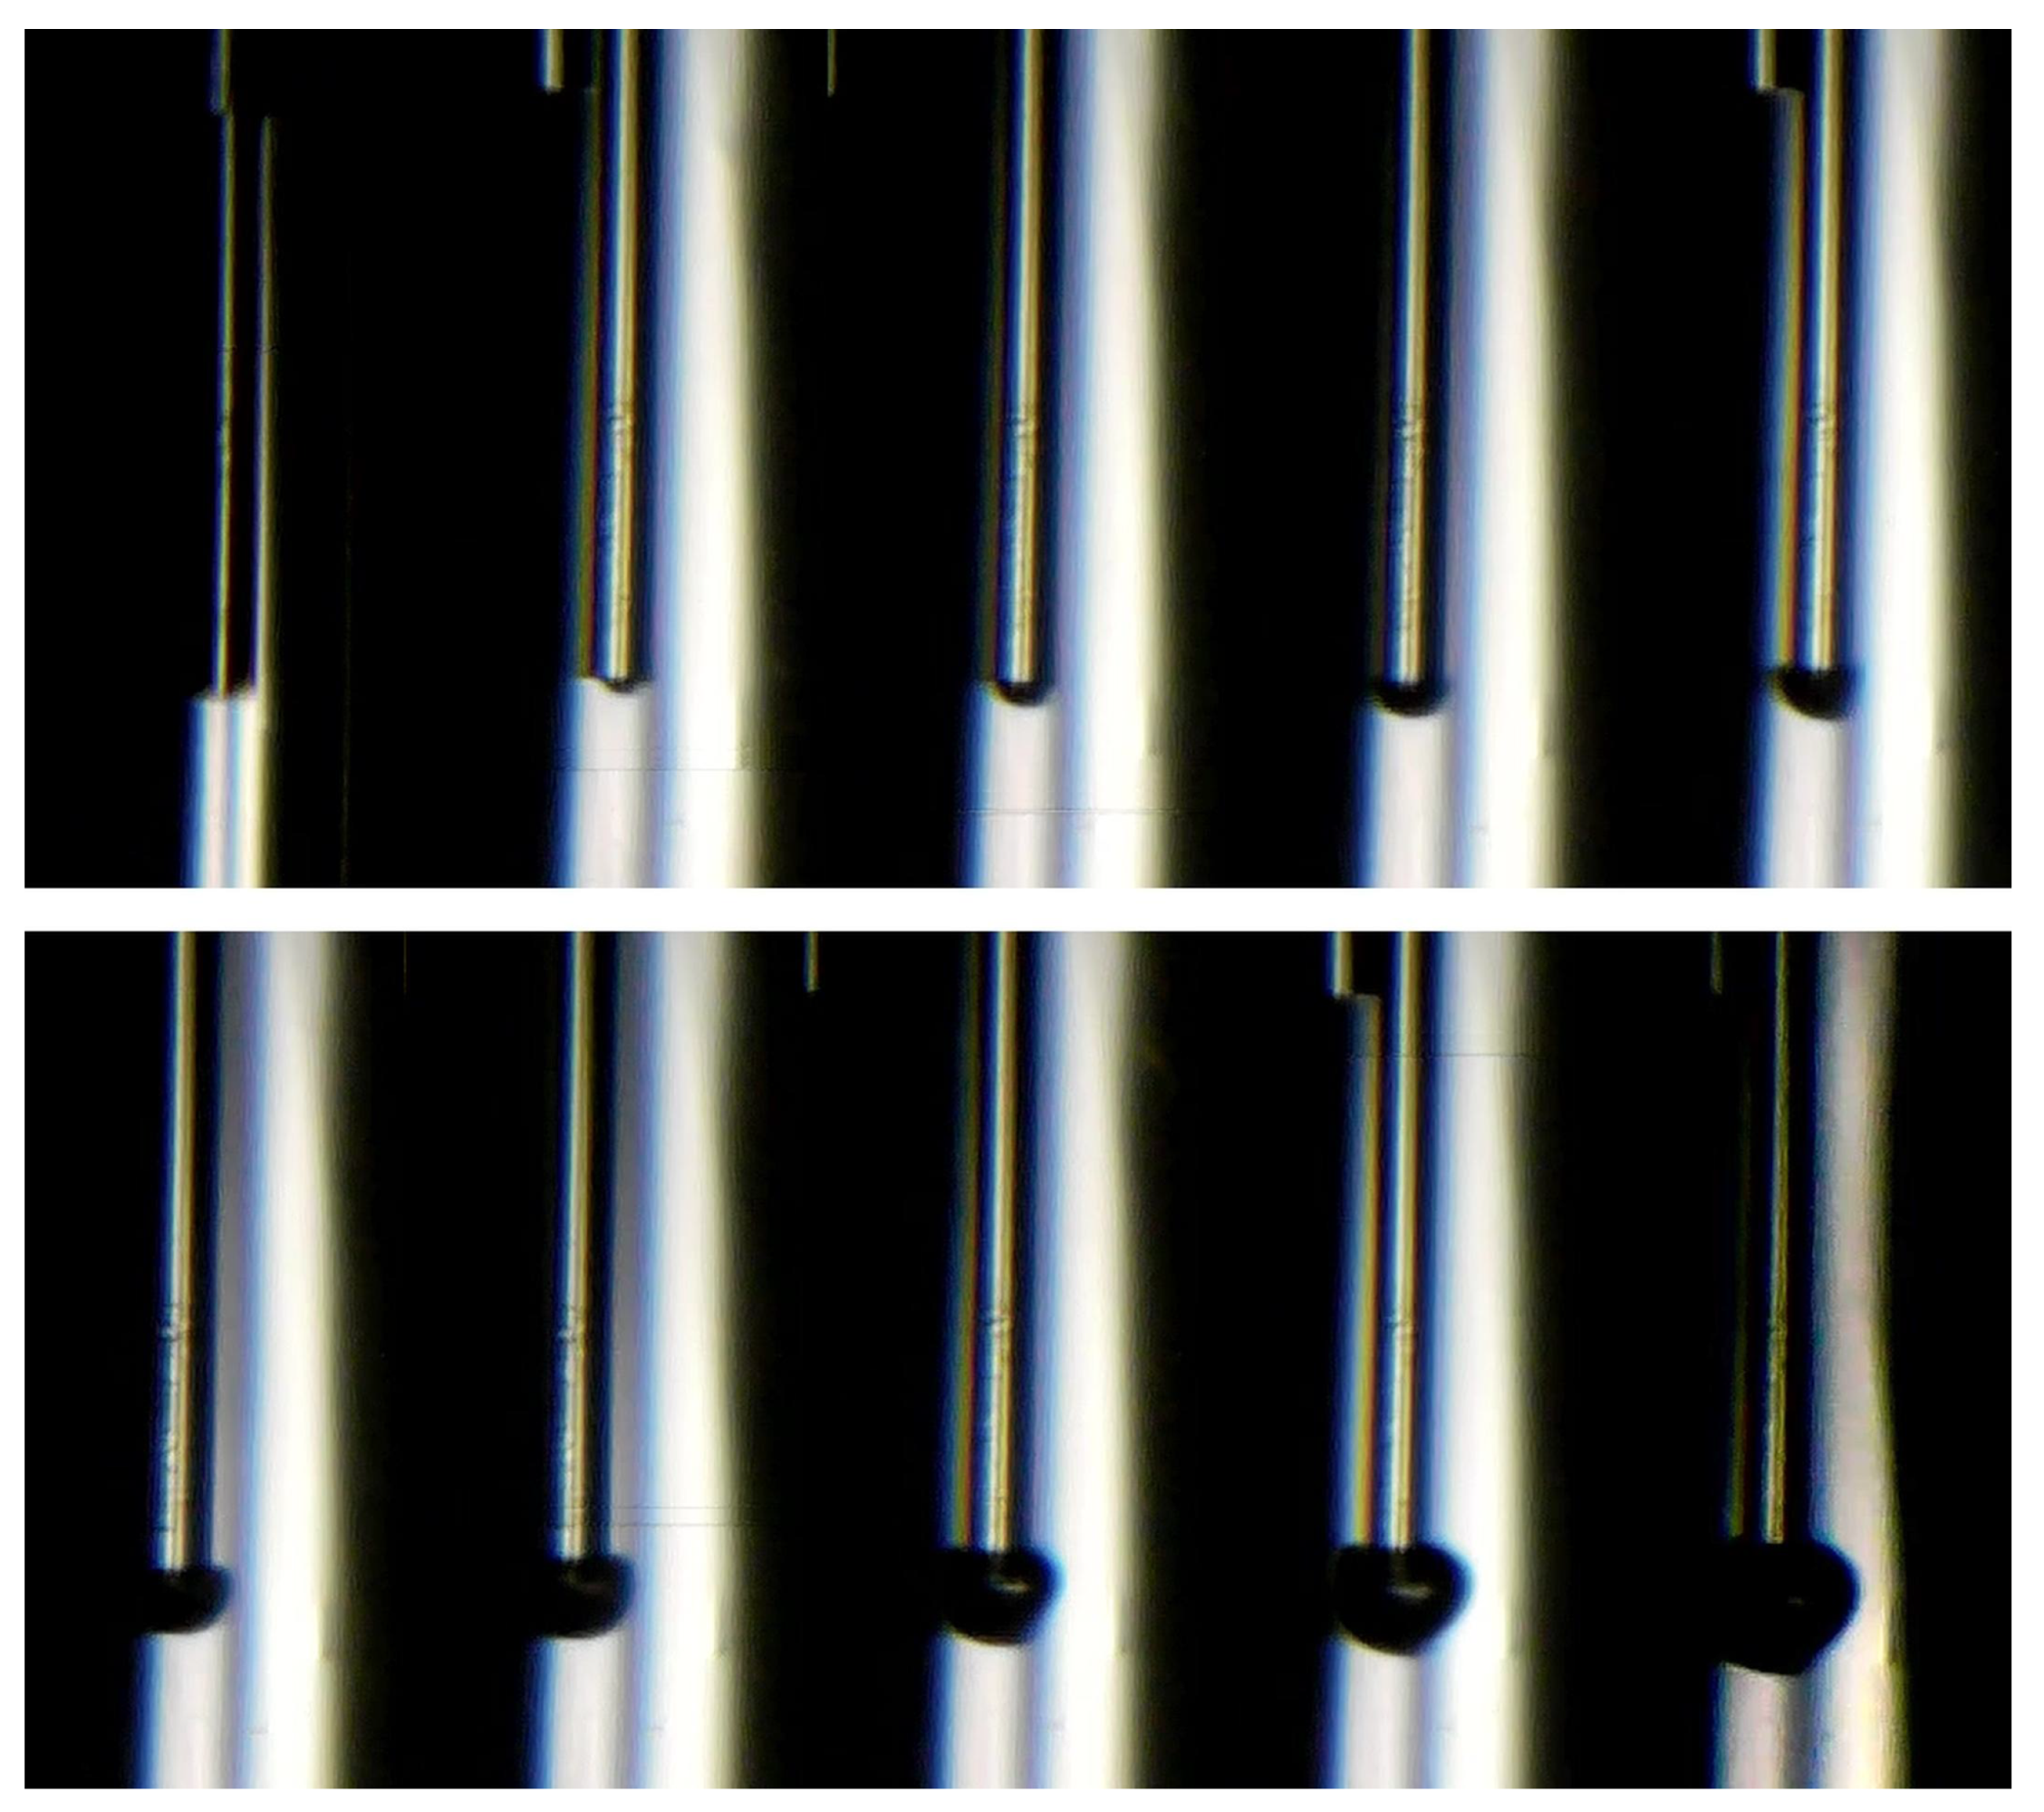
Figure 7 shows frames from the video footage obtained using the stroboscopic method. The duration of synchronous illumination with the pump pulse was 0.5 μs. The delay from the pump pulse increased by 1 microsecond for each subsequent frame. The video sequence shows the regular growth of the vapor film at the end of the light guide over time and the formation of a bubble after 3 μs at a temperature of 130 °C and at atmospheric pressure. Despite the image distortion due to light refraction, it is possible to estimate the size of the vapor cavity relative to the size of the light guide (125 µm) after 3 µs at a value of about 60 µm (average growth rate is 20 m/s). It is noteworthy that, for a short period of time, the surface tension forces hold the bubble at the end of the fiber. The subsequent development of the process was less predictable with the increasing influence of hydrodynamic disturbances.
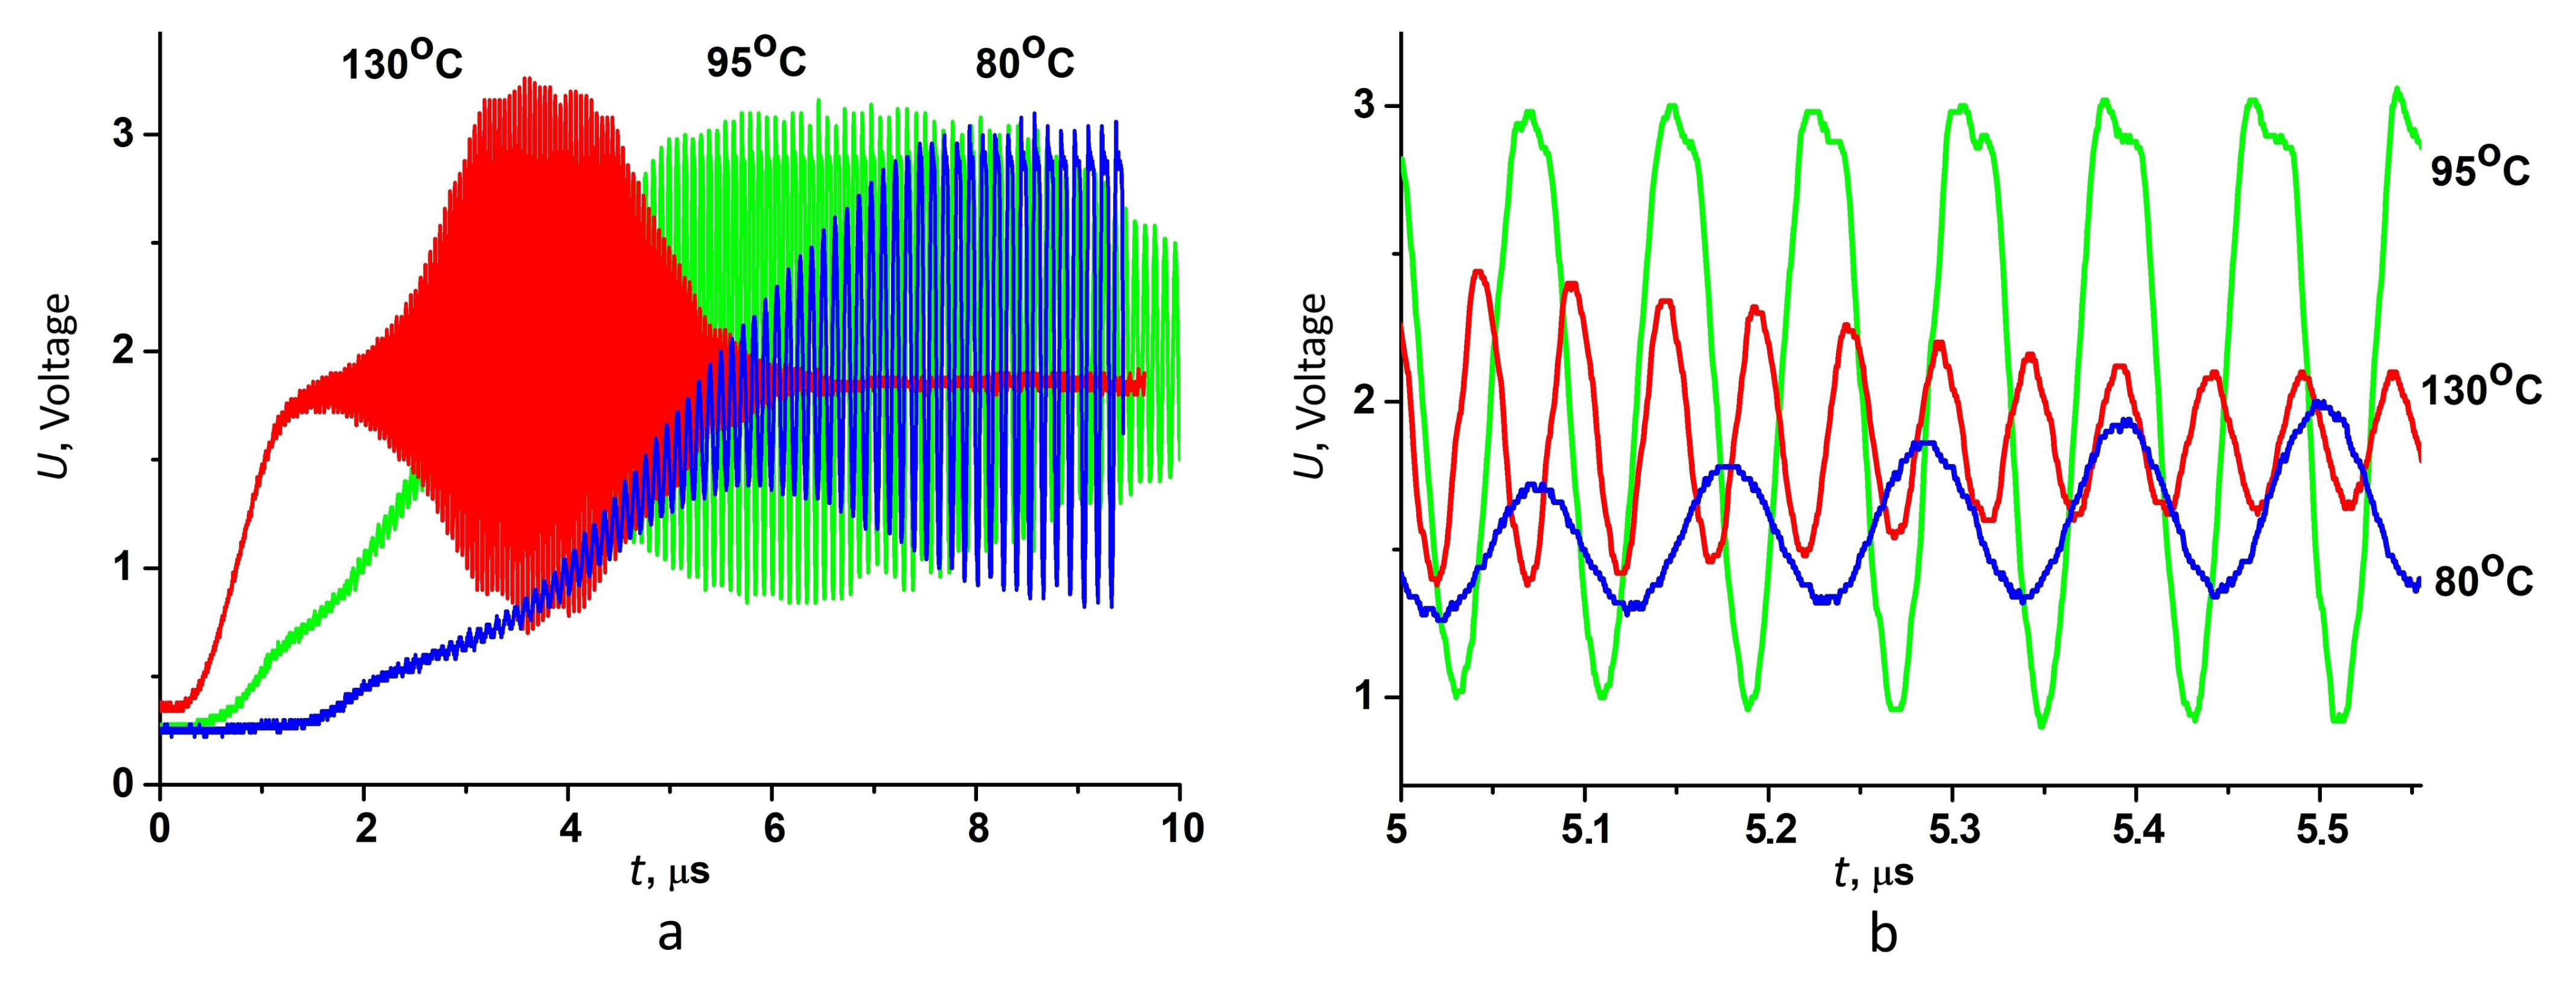
An example of the recorded dependences of the voltage in the photodetector on time is shown in
Figure 8. The waveforms of signals for
n-pentane temperature values of 80 °C, 95 °C, and 130 °C are shown (superheating
Texp −
Ts is 43, 58, and 93 degrees, respectively).
A change in the dynamics of signal growth following the activation of the boiling-up is shown in
Figure 8a, while
Figure 8b depicts the change in the frequency of the Doppler shift depending on temperature. The transition process to the steady-state average value occurred over a time from 1 μs for 130 °C to 6 μs for 80 °C. The frequency of Doppler oscillations varied accordingly from 12 to 25 MHz. The change in the oscillation frequency of up to 10% observed at intervals of estimating the rate of processes was associated with a known decrease in the bubble growth rate over time [
11]. For the subsequent calculations, averaged values were used.
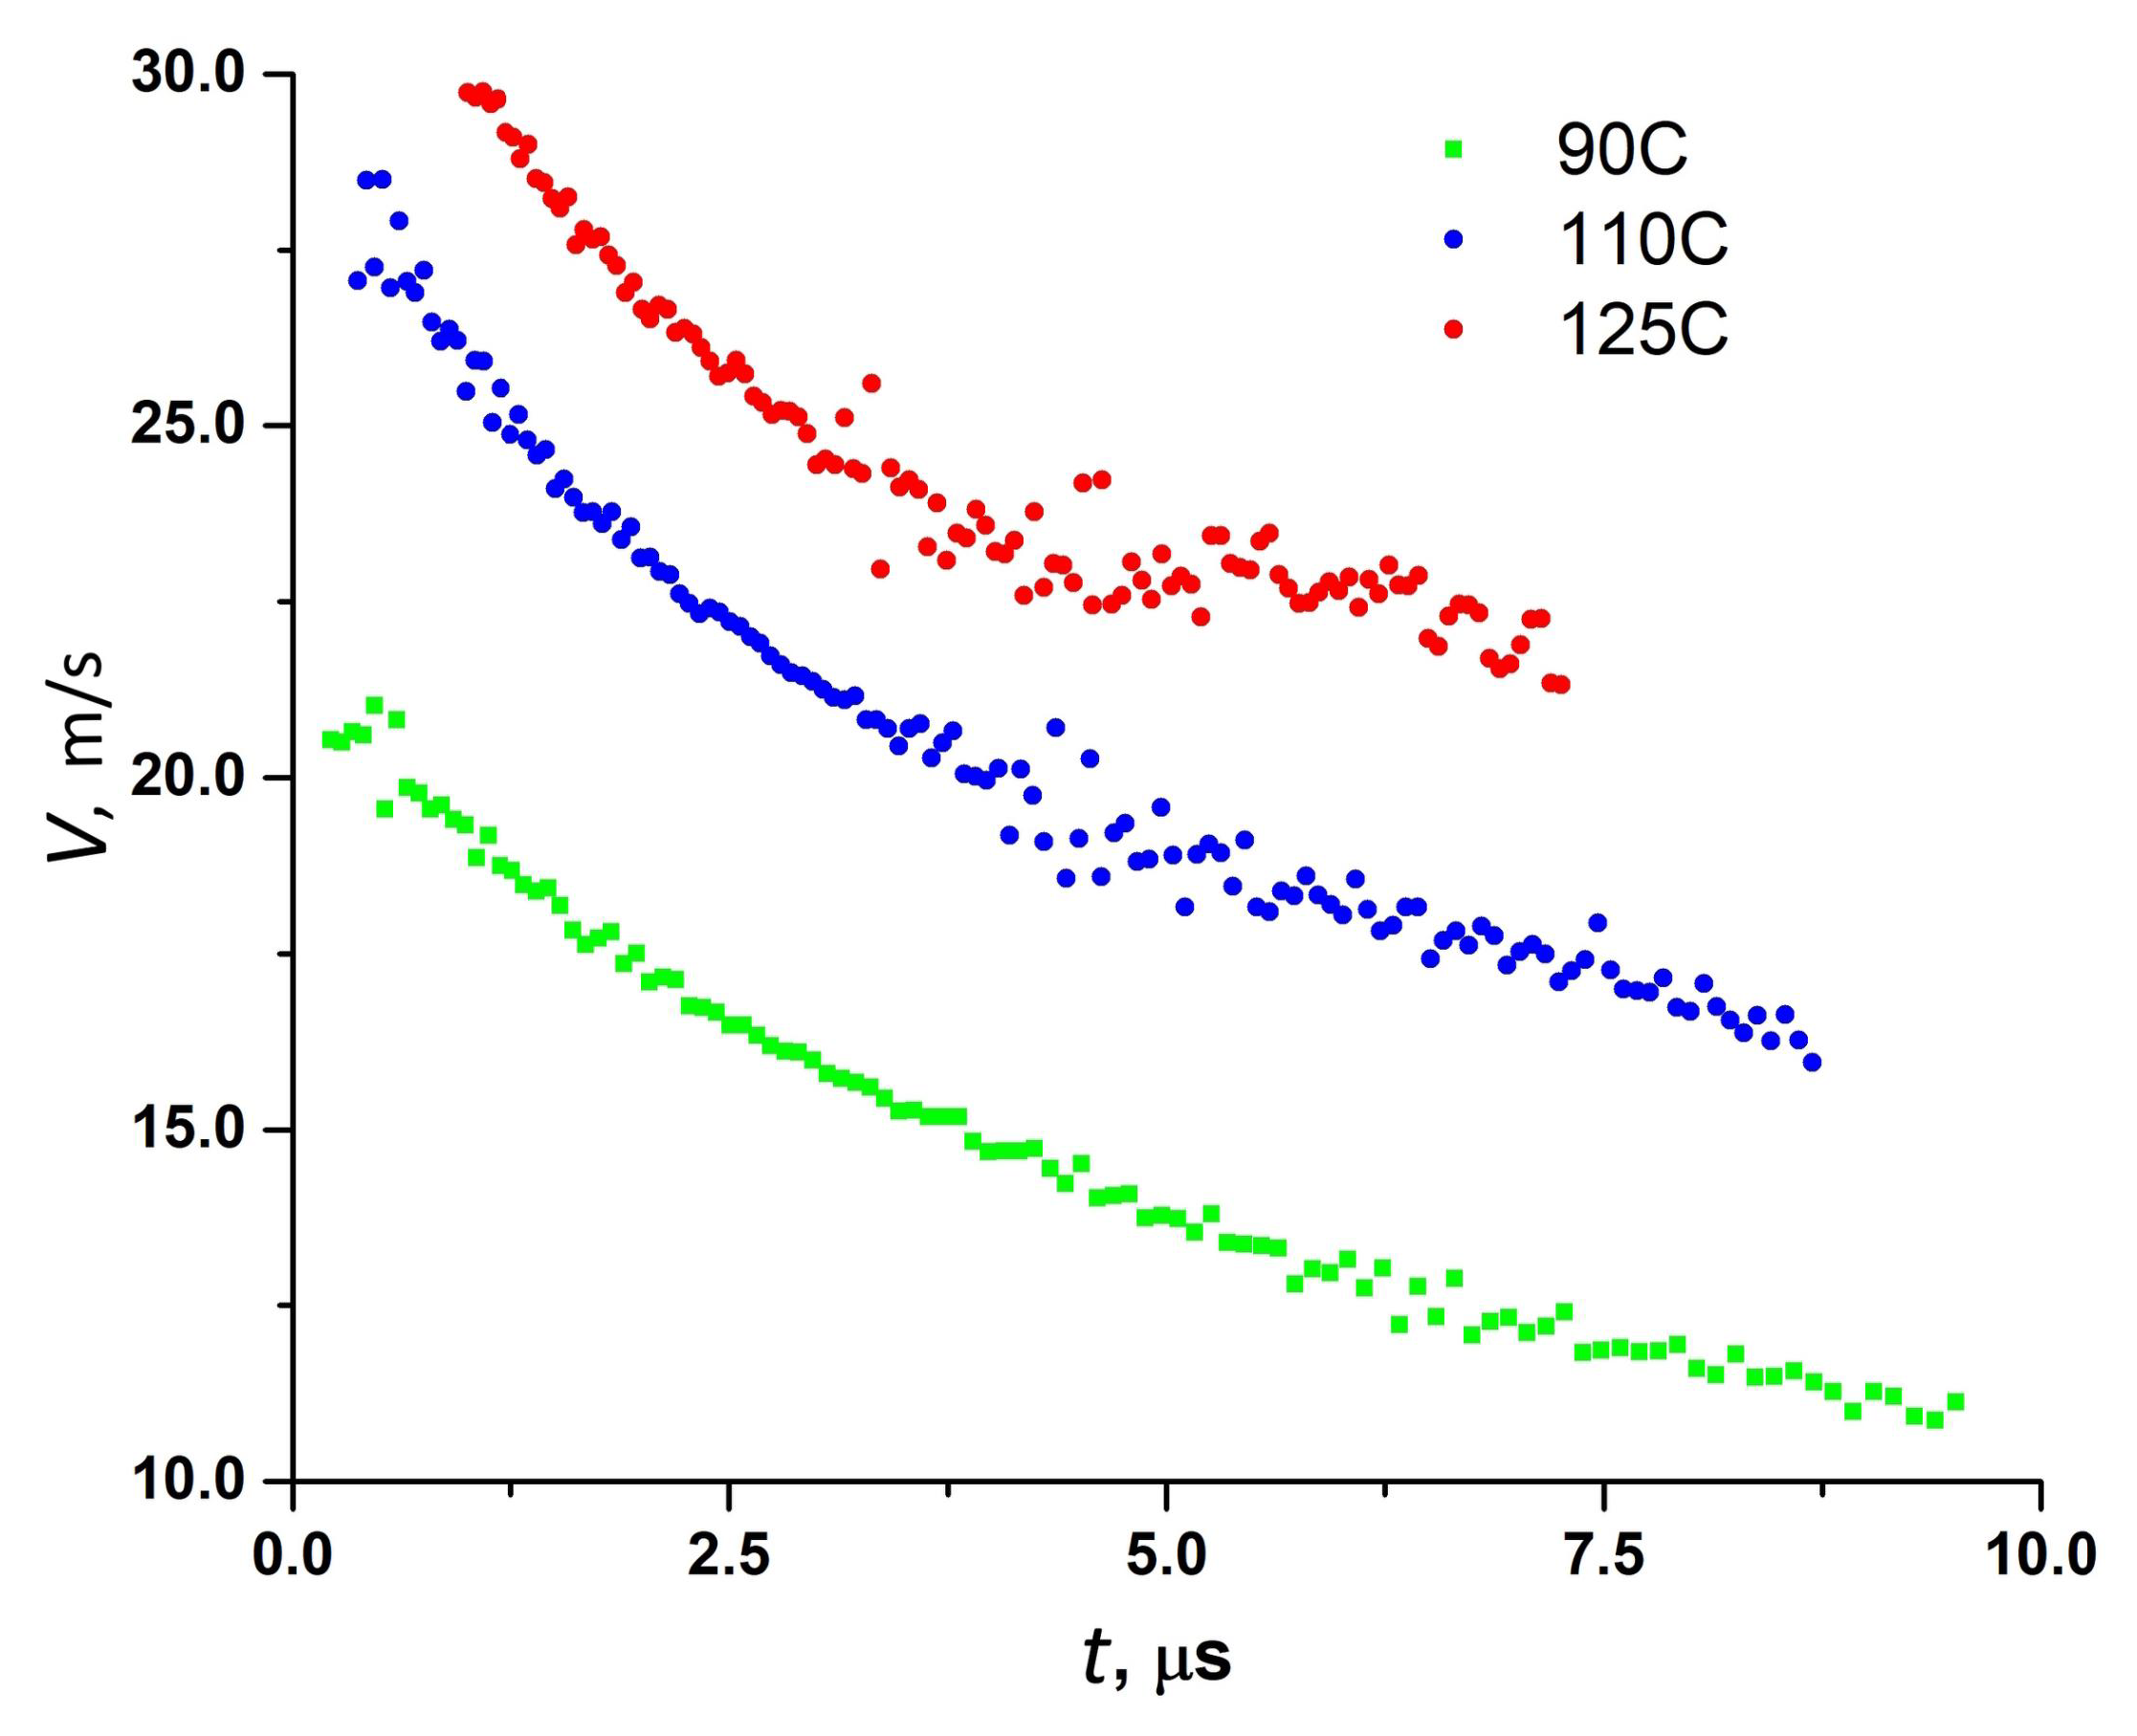
Figure 9 shows the dependences calculated from the frequency of oscillations of the vapor front velocity on time at different temperatures
Texp. Since a determination of the frequency of oscillations and velocity was possible only when a sufficient amplitude of the signal was reached, there is a delay in the beginning of measurements in
Figure 9.
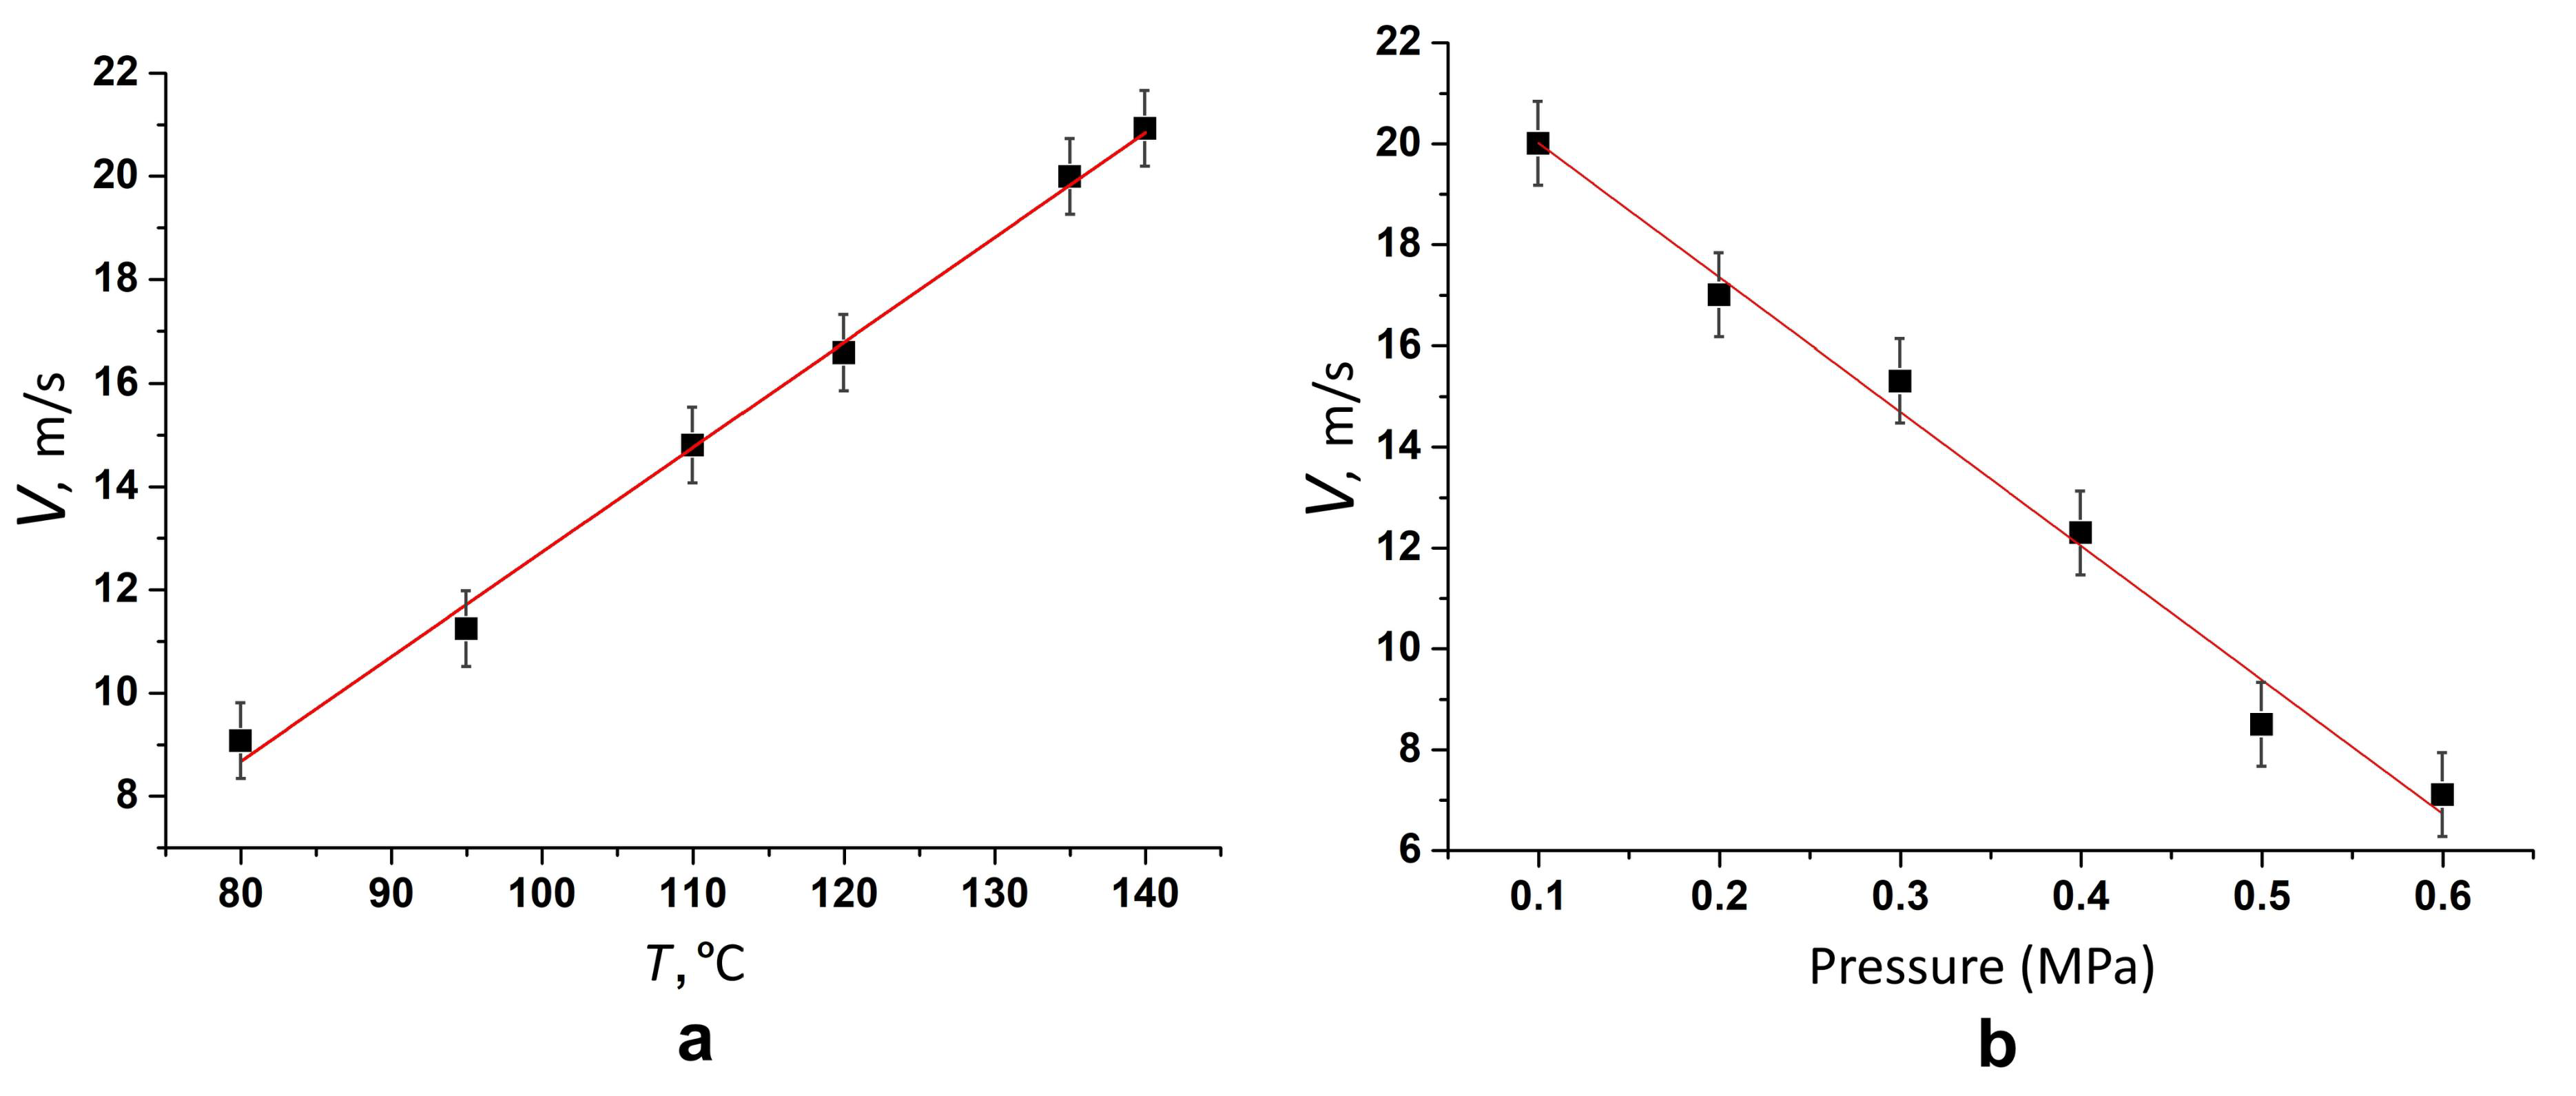
The developed Doppler velocimetry technique was validated for measuring the velocity of the evaporation front on samples of pure
n-pentane at various degrees of superheating relative to the liquid–vapor equilibrium temperature when the pressure drops to atmospheric values was carried out (
Figure 10a). In particular, for a temperature of 130 °C, the average growth rate of 19.2 m/s agrees quite well with the photographic estimate of 20 m/s (see
Figure 7).
Figure 10b shows the effect of the final pressure
pexp in the course of its release at a given temperature
Texp.
6. Discussion
Boiling-up is commonly defined as the process of separation of the liquid and vapor phases inside a superheated liquid. For our case of relatively high superheating (40–100 °C for pentane), the formation of a vapor film on the surface of the fiber end face was observed (see
Figure 7). The dynamics of the appearance and growth of a vapor film at the boundary of a solid surface and a highly superheated liquid significantly determine the intensity of heat transfer at the liquid boiling-up onset [
36]. The approach combining pump-probe and laser Doppler velocimetry made it possible to track the vapor front velocity at the initial stage of
n-pentane boiling in a miniature bubble chamber with a successive change in the degree of superheat.
The first obtained result consists of the possibility of such a local impact occurring in which the subsequent boiling process proceeds independently of the pump pulse parameters. In this case, a fairly accurate replication of the video frames and waveforms is capable of being repeatedly reproduced. The values of the initial growth rate of the vapor phase at the end of the fiber calculated from the measured Doppler frequencies differ significantly (by about 2 times) from those calculated using the Rayleigh formula for the inertial stage. Rayleigh’s formula for inertial bubble growth [
11] assumes the constancy of the growth rate
for bubbles with a radius
R of more than 1 μm in a superheated under the conditions of our experiments liquid:
where Δ
p is the difference between the pressure in the bubble and the pressure in the liquid, and
ρ is the density of the liquid.
Despite the advance of measurements of the vapor front velocity to sub-microsecond intervals from the beginning of boiling-up, we were not able to identify a region of expansion with a constant velocity as predicted by Rayleigh’s formula.
Figure 8a shows a gradual increase in the signal with time at the output of the fiber-optic densitometer, which corresponds to the gradual density decrease in the medium near the end of the fiber. The dependences of the vapor cavity growth rate on time and temperature turned out to be more consistent with thermally controlled bubble growth (see
Figure 9 and
Figure 10). Despite the process occurring near the hot surface of the end of the fiber, the obtained results confirm the assumptions made earlier [
37] about a lower vapor pressure and the probable cooling of the vapor film already at the initial stage of growth. The obtained dependencies of the initial velocity of the phase boundary displacement on temperature and pressure are close to linear (see
Figure 10). The opposite effects of the experimental temperature and pressure are consistent with the change in the degree of superheating of the liquid (see
Figure 1). An increase in temperature increased the speed of the boundary displacement by a factor of about 0.2 m/s per degree, while an increase in pressure reduced this speed by a factor of ~25.8 m/s per megapascal.
7. Conclusions
A method for measuring the velocity of the vapor front in the course of the activation of liquid boiling-up at the end of a light guide due to a short laser pulse has been developed and tested. The experiments were carried out in a miniature bubble chamber of the type traditionally used to determine the dependencies of the mean “lifetime” of a liquid and rate of nucleation on the temperature of superheating under strictly controlled conditions. The main novelty of our approach consists of the achievement of spatial localization in the units of micrometers with localization in time at the level of units of nanoseconds. The combination of a fiber-optic sensor with a bubble chamber according to the pump-probe method has opened up new opportunities for studying the fast-flowing processes during initial stages of liquid–vapor phase transitions using densitometric and velocimetric techniques. The obtained results, which do not fit into the Rayleigh scheme, can be interpreted as confirming the assumption of a lower vapor pressure and cooling of the vapor film already at the early stage of vapor phase growth. By applying this approach to the study of the initial velocity of the vapor front, it becomes possible to test theoretical ideas about the development of a phase transition at the interface between a liquid and a solid surface depending on the degree of superheating of the liquid.
Activation by nanosecond pulses was used to involve a wide area of moderately superheated states in the study, which were previously considered difficult to access due to the long waiting times for spontaneous boiling-up. Further research will be carried out in the field of relatively low superheating, which has significance for various practical applications, such as alternative fuel technologies based on rapid secondary atomization of composite droplets and modern minimally invasive medical tools, see references [
31,
34] and bibliography therein.


