Article

Voltage Stability Assessment of AC/DC Hybrid Microgrid

1
Department of Electrical and Computer Engineering, University of Michigan-Dearborn, Dearborn, MI 48128, USA
2
DTE Electric, Detroit, MI 48226, USA
*
Author to whom correspondence should be addressed.
Energies 2023, 16(1), 399; https://doi.org/10.3390/en16010399
Submission received: 25 November 2022 / Revised: 19 December 2022 / Accepted: 23 December 2022 / Published: 29 December 2022
(This article belongs to the Special Issue Future Smart Grids with High Integrations of New Technologies)

Abstract

:
AC/DC hybrid microgrids are becoming potentially more attractive due to the proliferation of renewable energy sources, such as photovoltaic generation, battery energy storage systems, and wind turbines. The collaboration of AC sub-microgrids and DC sub-microgrids improves operational efficiency when multiple types of power generators and loads coexist at the power distribution level. However, the voltage stability analysis and software validation of AC/DC hybrid microgrids is a critical concern, especially with the increasing adoption of power electronic devices and various types of power generation. In this manuscript, we investigate the modeling of AC/DC hybrid microgrids with grid-forming and grid-following power converters. We propose a rapid simulation technique to reduce the simulation runtime with acceptable errors. Moreover, we discuss the stability of hybrid microgrids with different types of faults and power mismatches. In particular, we examine the voltage nadir to evaluate the transient stability of the hybrid microgrid. We also design a droop controller to regulate the power flow and alleviate voltage instability. During our study, we establish a Simulink-based simulation platform for operational analysis of the microgrid.

1. Introduction

The AC/DC hybrid microgrid is a promising technology for building smart grids with enhanced operational efficiency and flexibility. It is formed by an AC sub-microgrid and a DC sub-microgrid interconnected by one or more interfacing power inverters [1]. It shows a few unique advantages compared with the traditional power grid, such as increased efficiency of power conversion, less copper, and higher power density [2,3]. It shows a few unique advantages compared with the traditional power grid, such as increased efficiency of power conversion, less copper, and higher power density. The AC load and AC generation can be connected to AC buses, while the DC load and DC generation can be connected to DC buses, which can greatly reduce power loss. Integrated with one or more interfacing power converters and various types of power generation, a hybrid microgrid can deal with power generation and conversion with higher flexibility. A few of researchers are exploring hybrid microgrid with more efficient and durable solutions, such as new control techniques and energy management [4,5].
To take full use of this emerging architecture of microgrids, it is critical and urgent to investigate the characteristics of AC/DC hybrid power grids. For example, we need to figure out not only the control strategy of the AC and DC sub-microgrid but also the overall control strategy; and how the control technique regulates the generic power flow and impacts the stability of the microgrid. Paper [6] presents power flow modeling for AC/DC hybrid islanded microgrids including droop-controlled distributed generation, which provides an efficient tool for future power flow planning and operation studies. Paper [7] introduces a power flow control and management framework enabling decentralized power sharing with less communication in a hybrid microgrid. However, the operation control and stability of hybrid microgrids is still a challenging topic, especially when it involves high penetration of power electronic devices and various types of power generation. The intricate characteristics of modern power electronic devices and renewable energy sources lead to new stability problems in hybrid microgrids since they can reshape the general dynamic characteristics of the microgrid. The dynamic responses of renewable energy resources and power electronic devices are quite different from the power generators and other power devices in traditional power grids [8]. Several existing studies have worked on the stability issues. Paper [9] proposes a novel coordination among distributed energy resources, where the frequency regulation is considered in a multi-objective optimization problem. However, the proposed approach focuses more on traditional synchronous generators, and it is limited to frequency stability analysis. In paper [10], a novel structure of a hybrid microgrid is proposed, where energy storage systems are coupled with the non-sensitive loads to achieve the supply/demand balance. However, the proposed design mainly aims at the construction of system reliability but does not consider transient stability. Additionally, paper [11,12] investigates the voltage stability in microgrids with distributed controlled converters and nonlinear loads, but the discussion is limited to DC microgrids only. The small-signal stability analysis of AC/DC hybrid microgrids is presented in [13], but it does not work well when large oscillation occurs. Paper [14] proposes a comprehensive inertial control strategy for stability improvement in an AC/DC hybrid microgrid. The coupling relationship between AC and DC sub-microgrids is discussed based on the power balance, and the characteristics of distributed generation are analyzed. Nevertheless, the control of power electronic components is not involved. In paper [15], a hybrid solar thermal system based power grid is presented to investigate the control of static synchronous compensator (STATCOM) and automatic voltage regulator (AVR). However, it does not consider the effects of control technique of the solar system. In fact, different control techniques of solar system may cause different transient behaviors of the power grid in a faster time scale, such as P-Q control or V-F control. In paper [16], a fuzzy logic based control technique is proposed to maintain the frequency and voltage stability for sudden changes in a hybrid microgrid. Nowadays, the modeling of a complicated AC/DC hybrid microgrid system is in discussion, and how to determine the effects of each component on the system stability is still an open question. The various operation modes of hybrid microgrid also bring challenges to addressing the issues. Moreover, the important objectives of control design for both grid architecture and power devices also include stability enhancement while realizing power management at the same time. These issues become more intractable when a fault or disturbance is imposed on the microgrid.
This manuscript develops an operational model of AC/DC hybrid microgrids and studies the stability issues based on the modeling. The contributions are as follows:
(1)
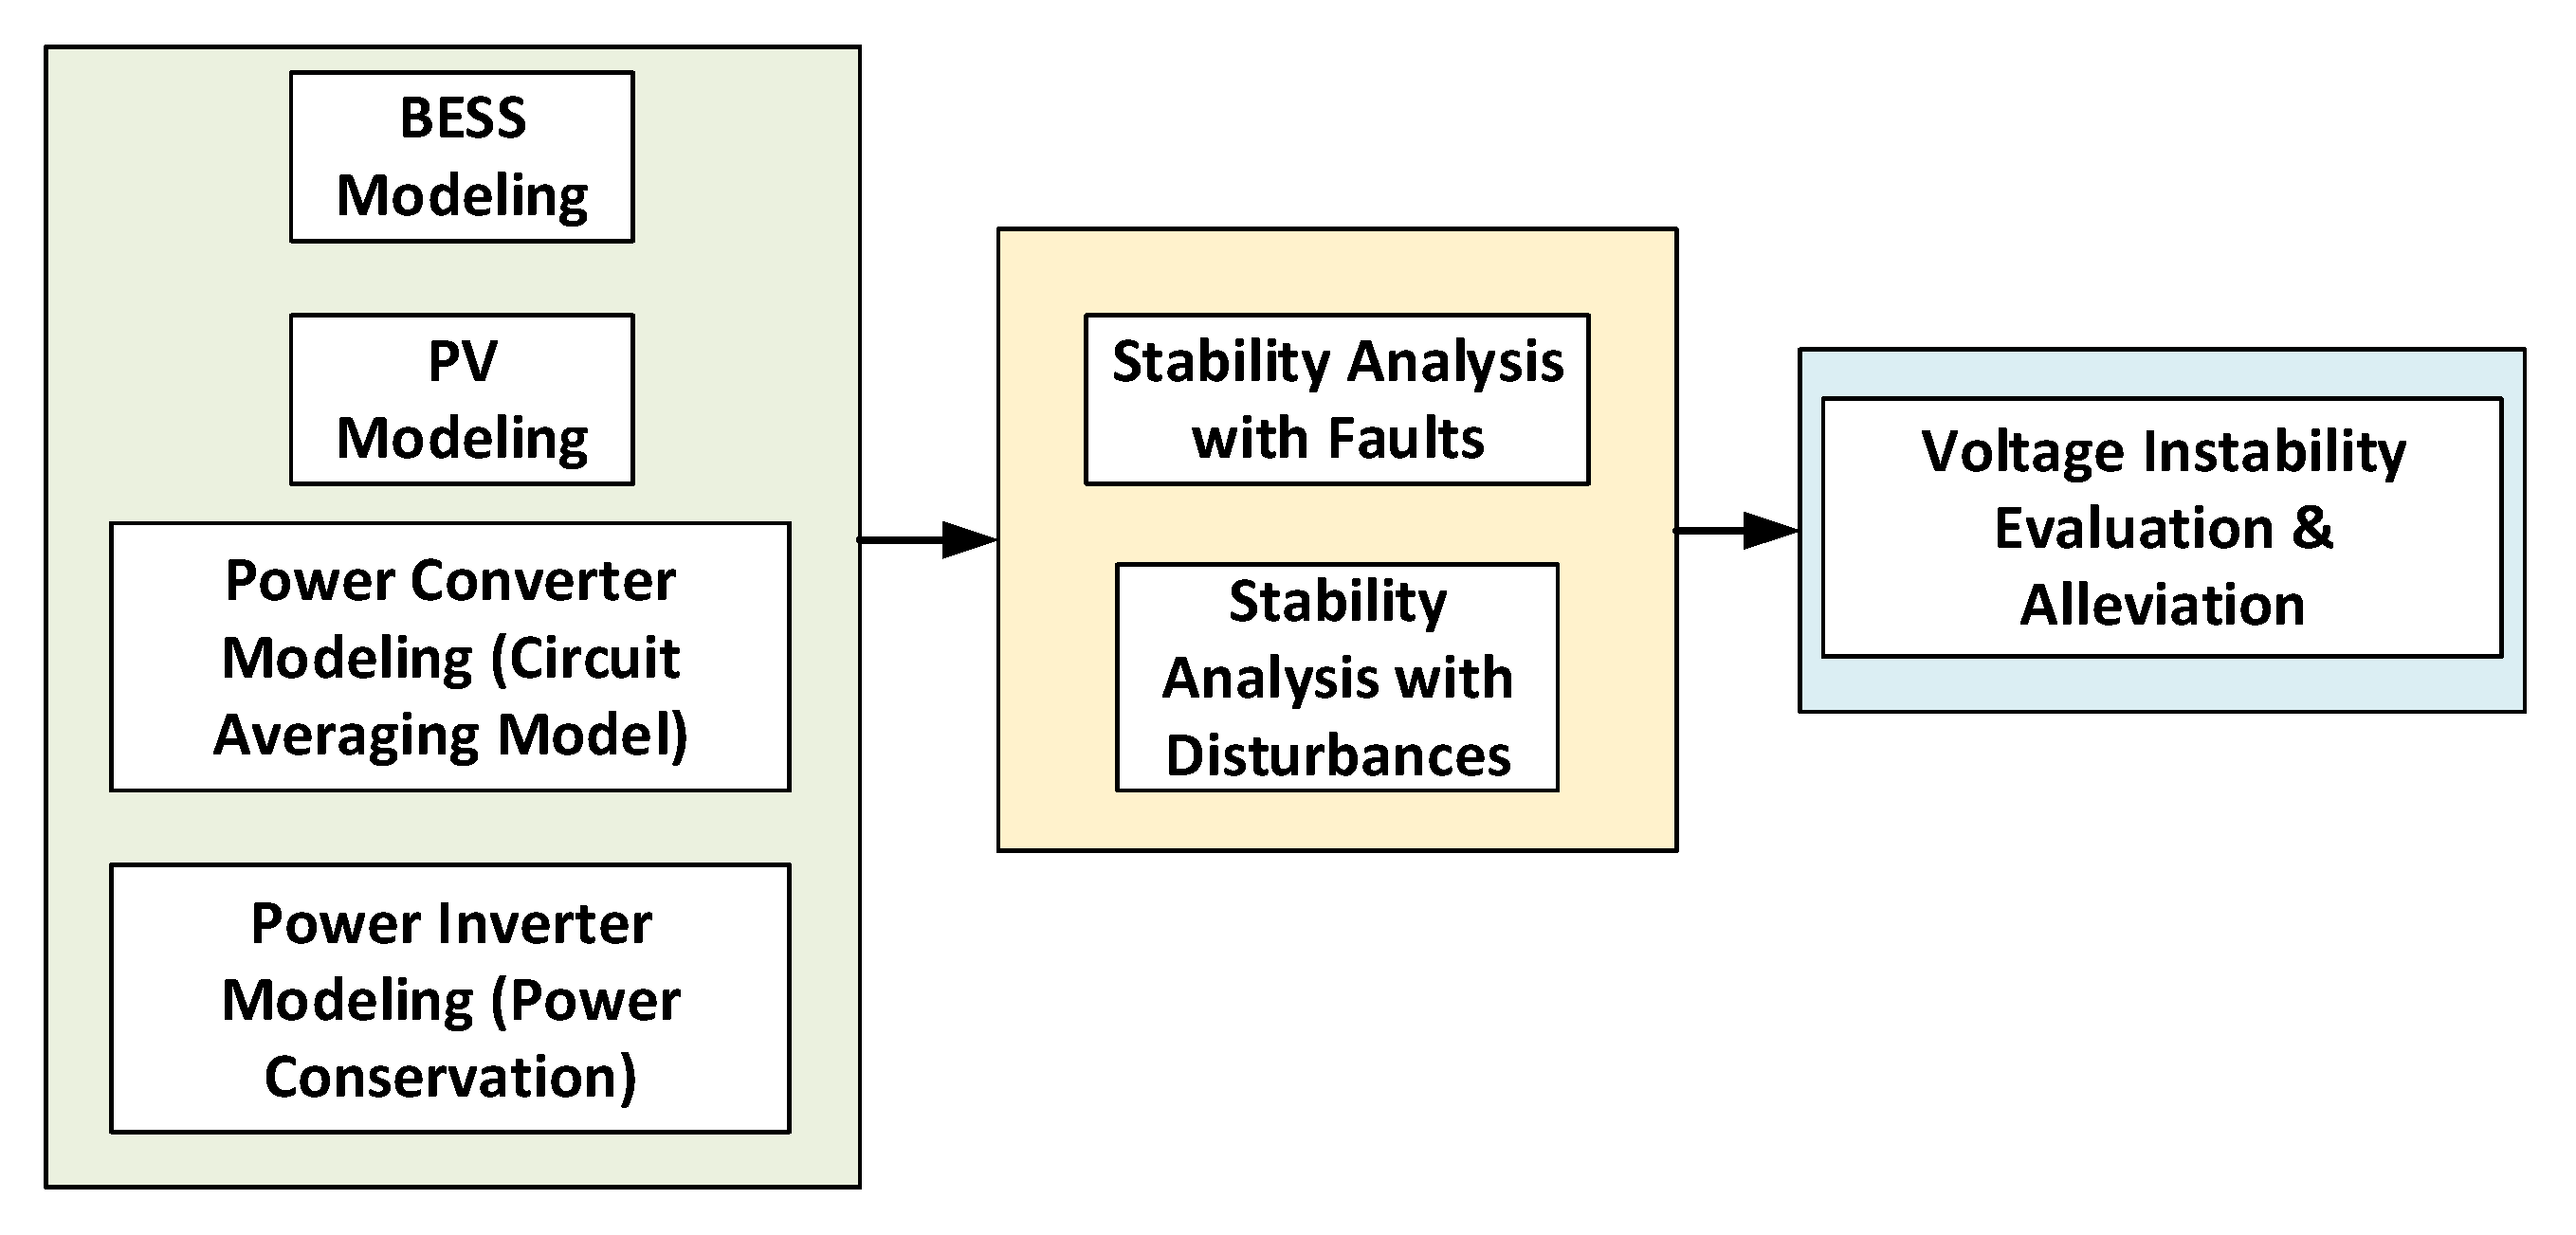
This manuscript investigates the modeling of AC/DC hybrid microgrids with different types of power electronic devices and power generation, including a traditional power generator, a battery energy storage system (BESS), and PV generation.
(2)
The power converters are modeled using the circuit averaging method, which greatly reduces the runtime of software simulation.
(3)
We discuss the stability of AC/DC hybrid microgrids when a fault or disturbance happens. The voltage nadir is examined to evaluate the transient stability of the microgrid.
(4)
Droop control is adopted to regulate the power flow and alleviate voltage instability. We formulate an equivalent control diagram to develop sensitivity analysis instead of using the original microgrid simulation.
The structure of this manuscript is organized as follows: In Section 2, a typical architecture of AC/DC hybrid microgrids is proposed. The modeling of main power devices is introduced, and the Simulink-based simulation platform is presented. Section 3 discusses the stability of hybrid microgrids when a fault or a disturbance happens. Besides, we present a voltage instability alleviation technique based on droop control. Section 4 concludes our work and indicates our future work. The work flow of the proposed methodology is described as below (Figure 1).

2. Materials and Methods

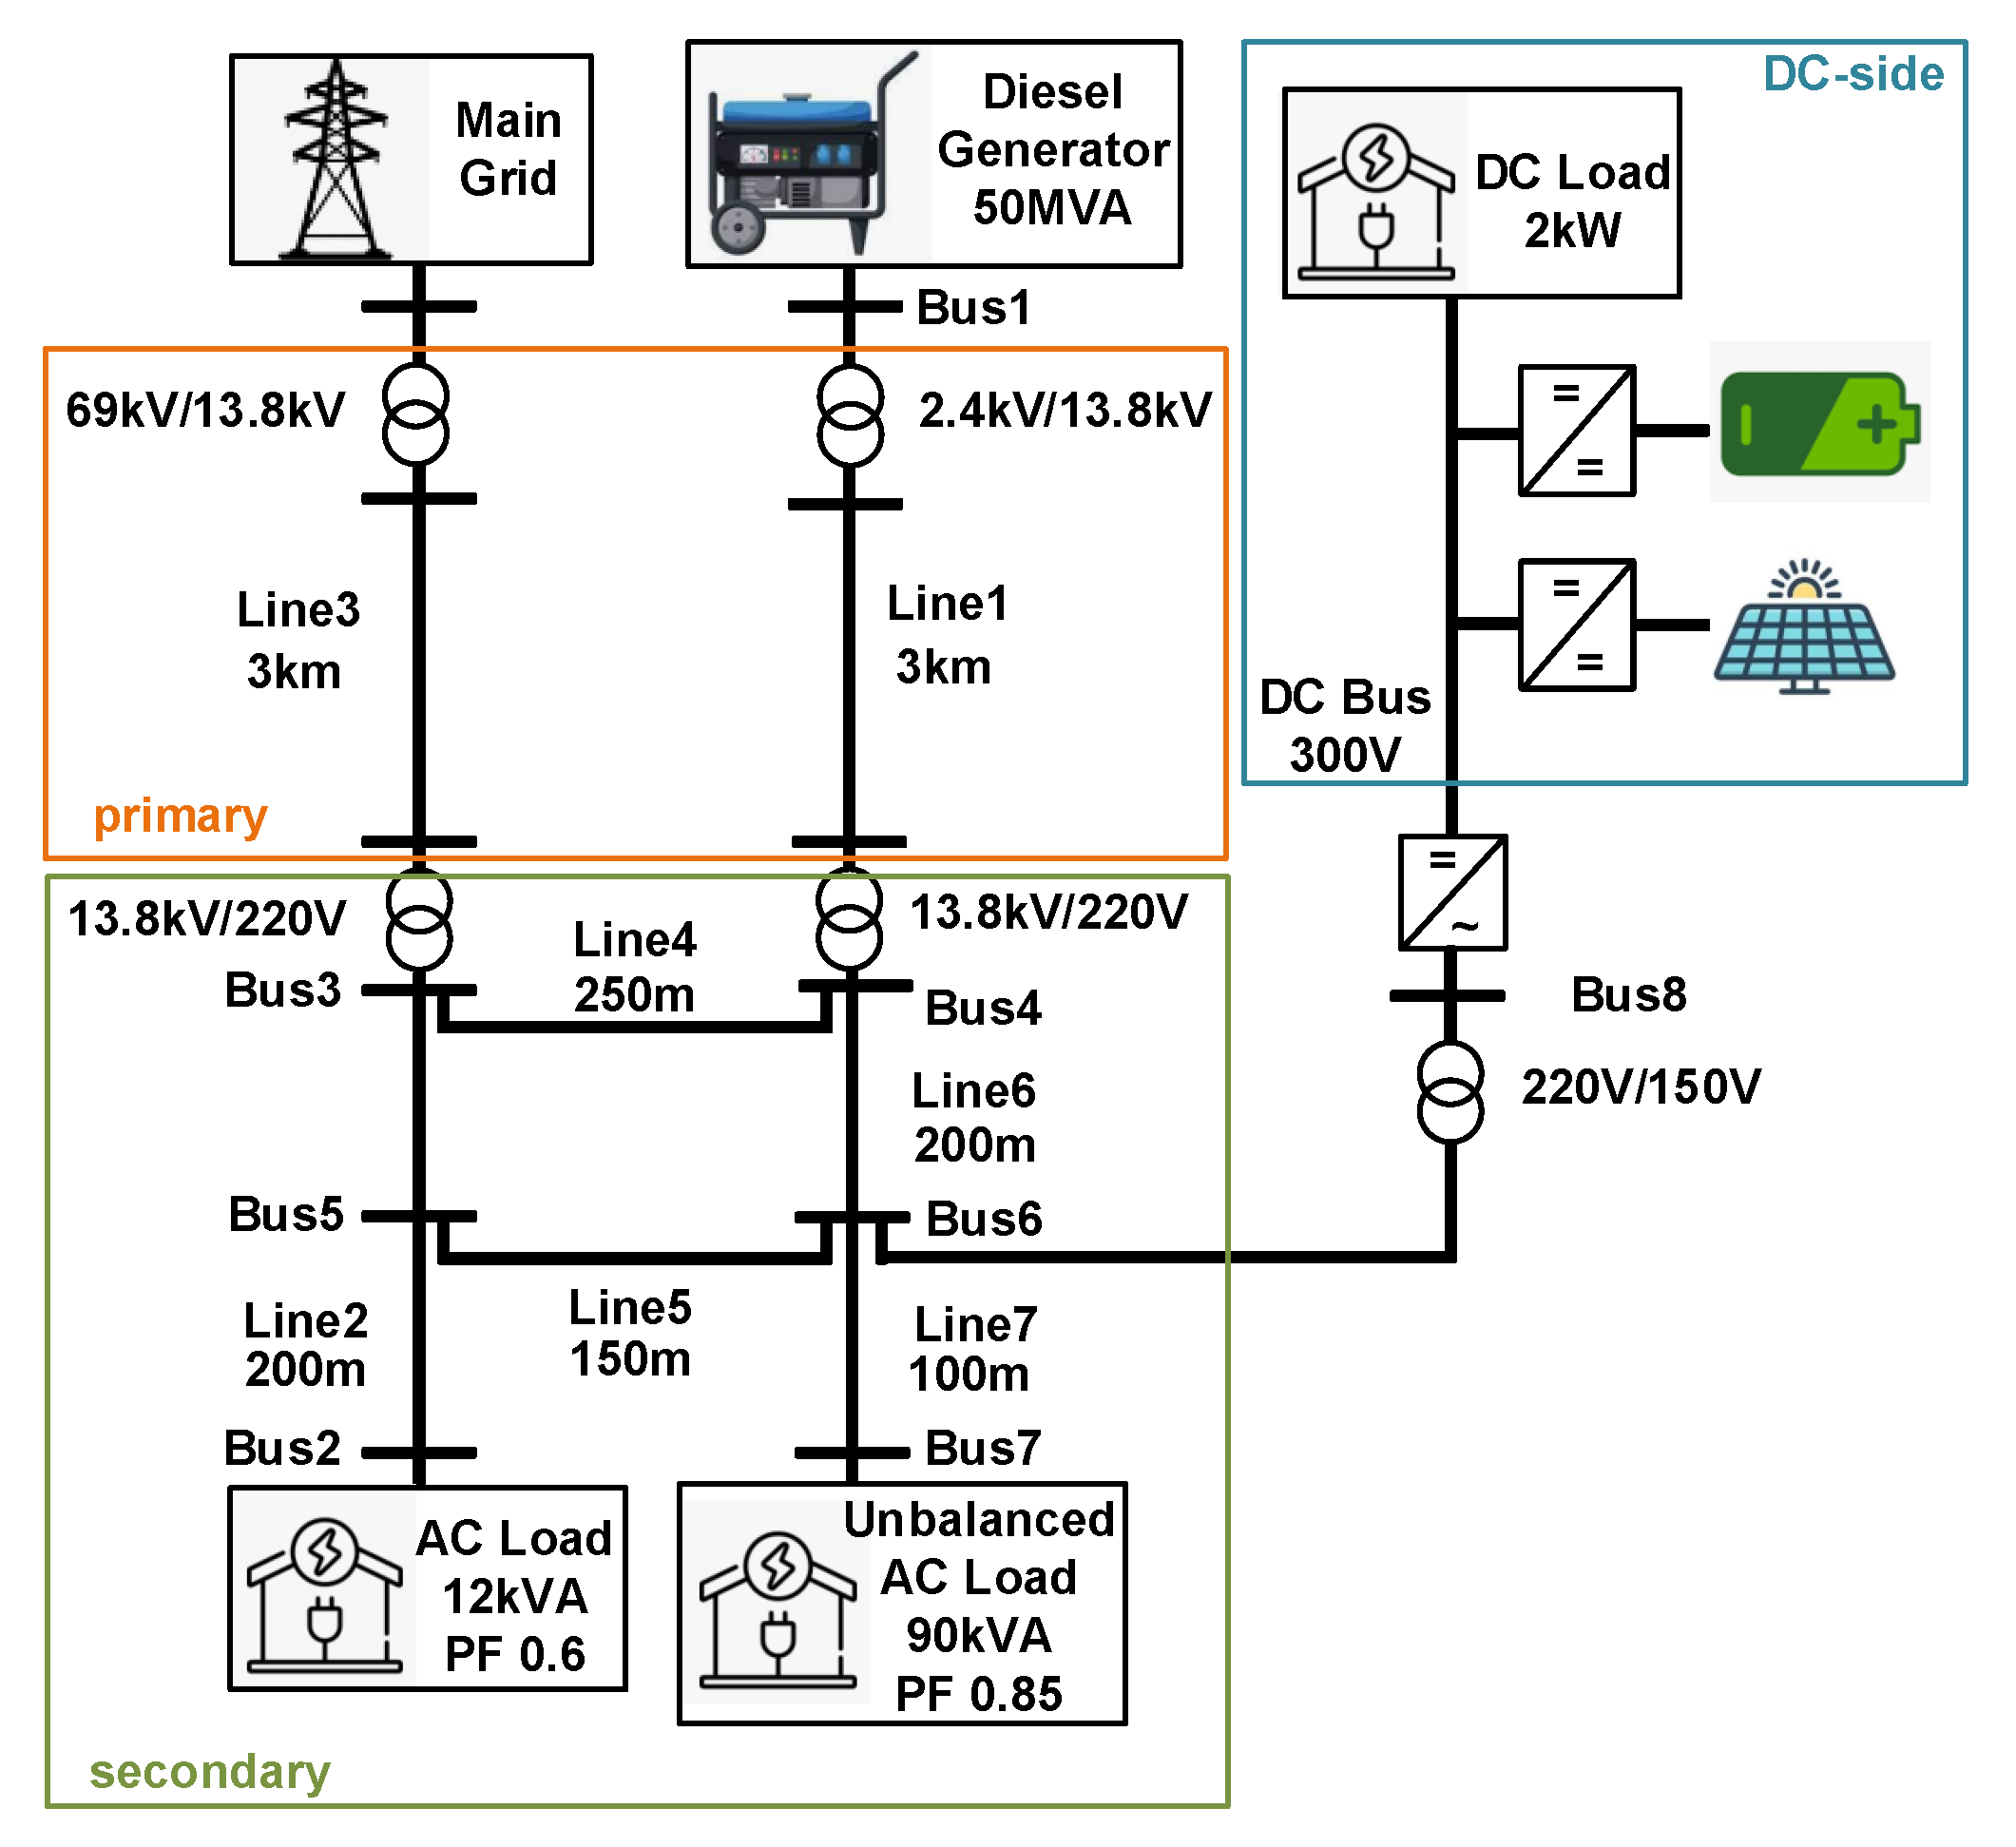
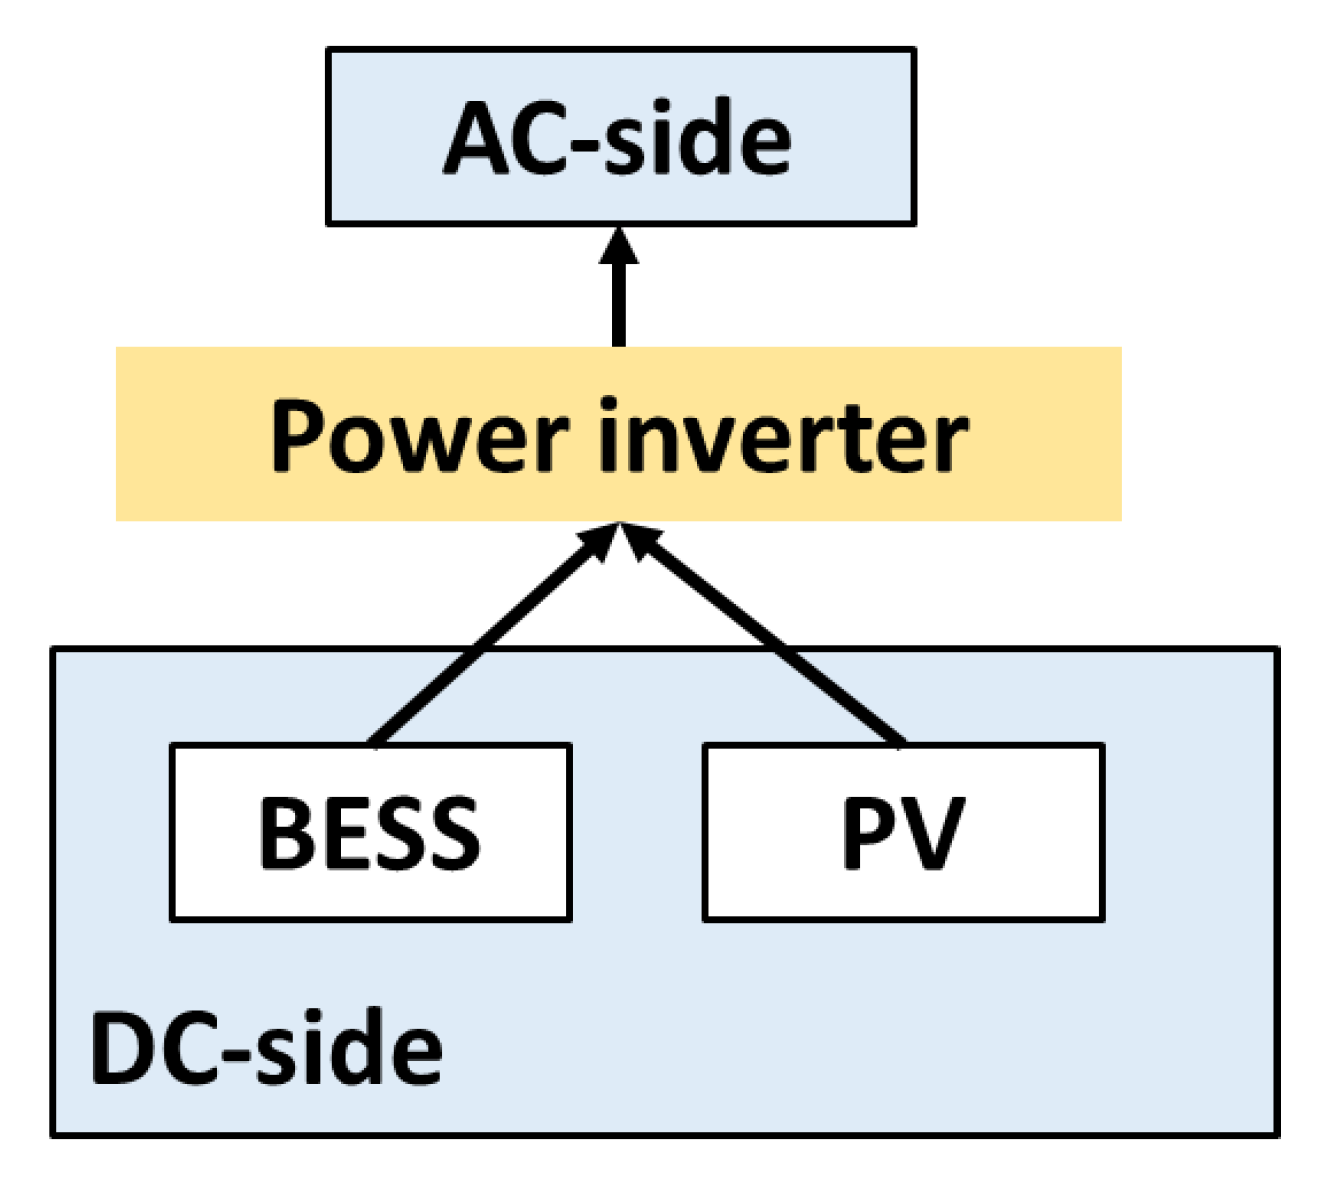
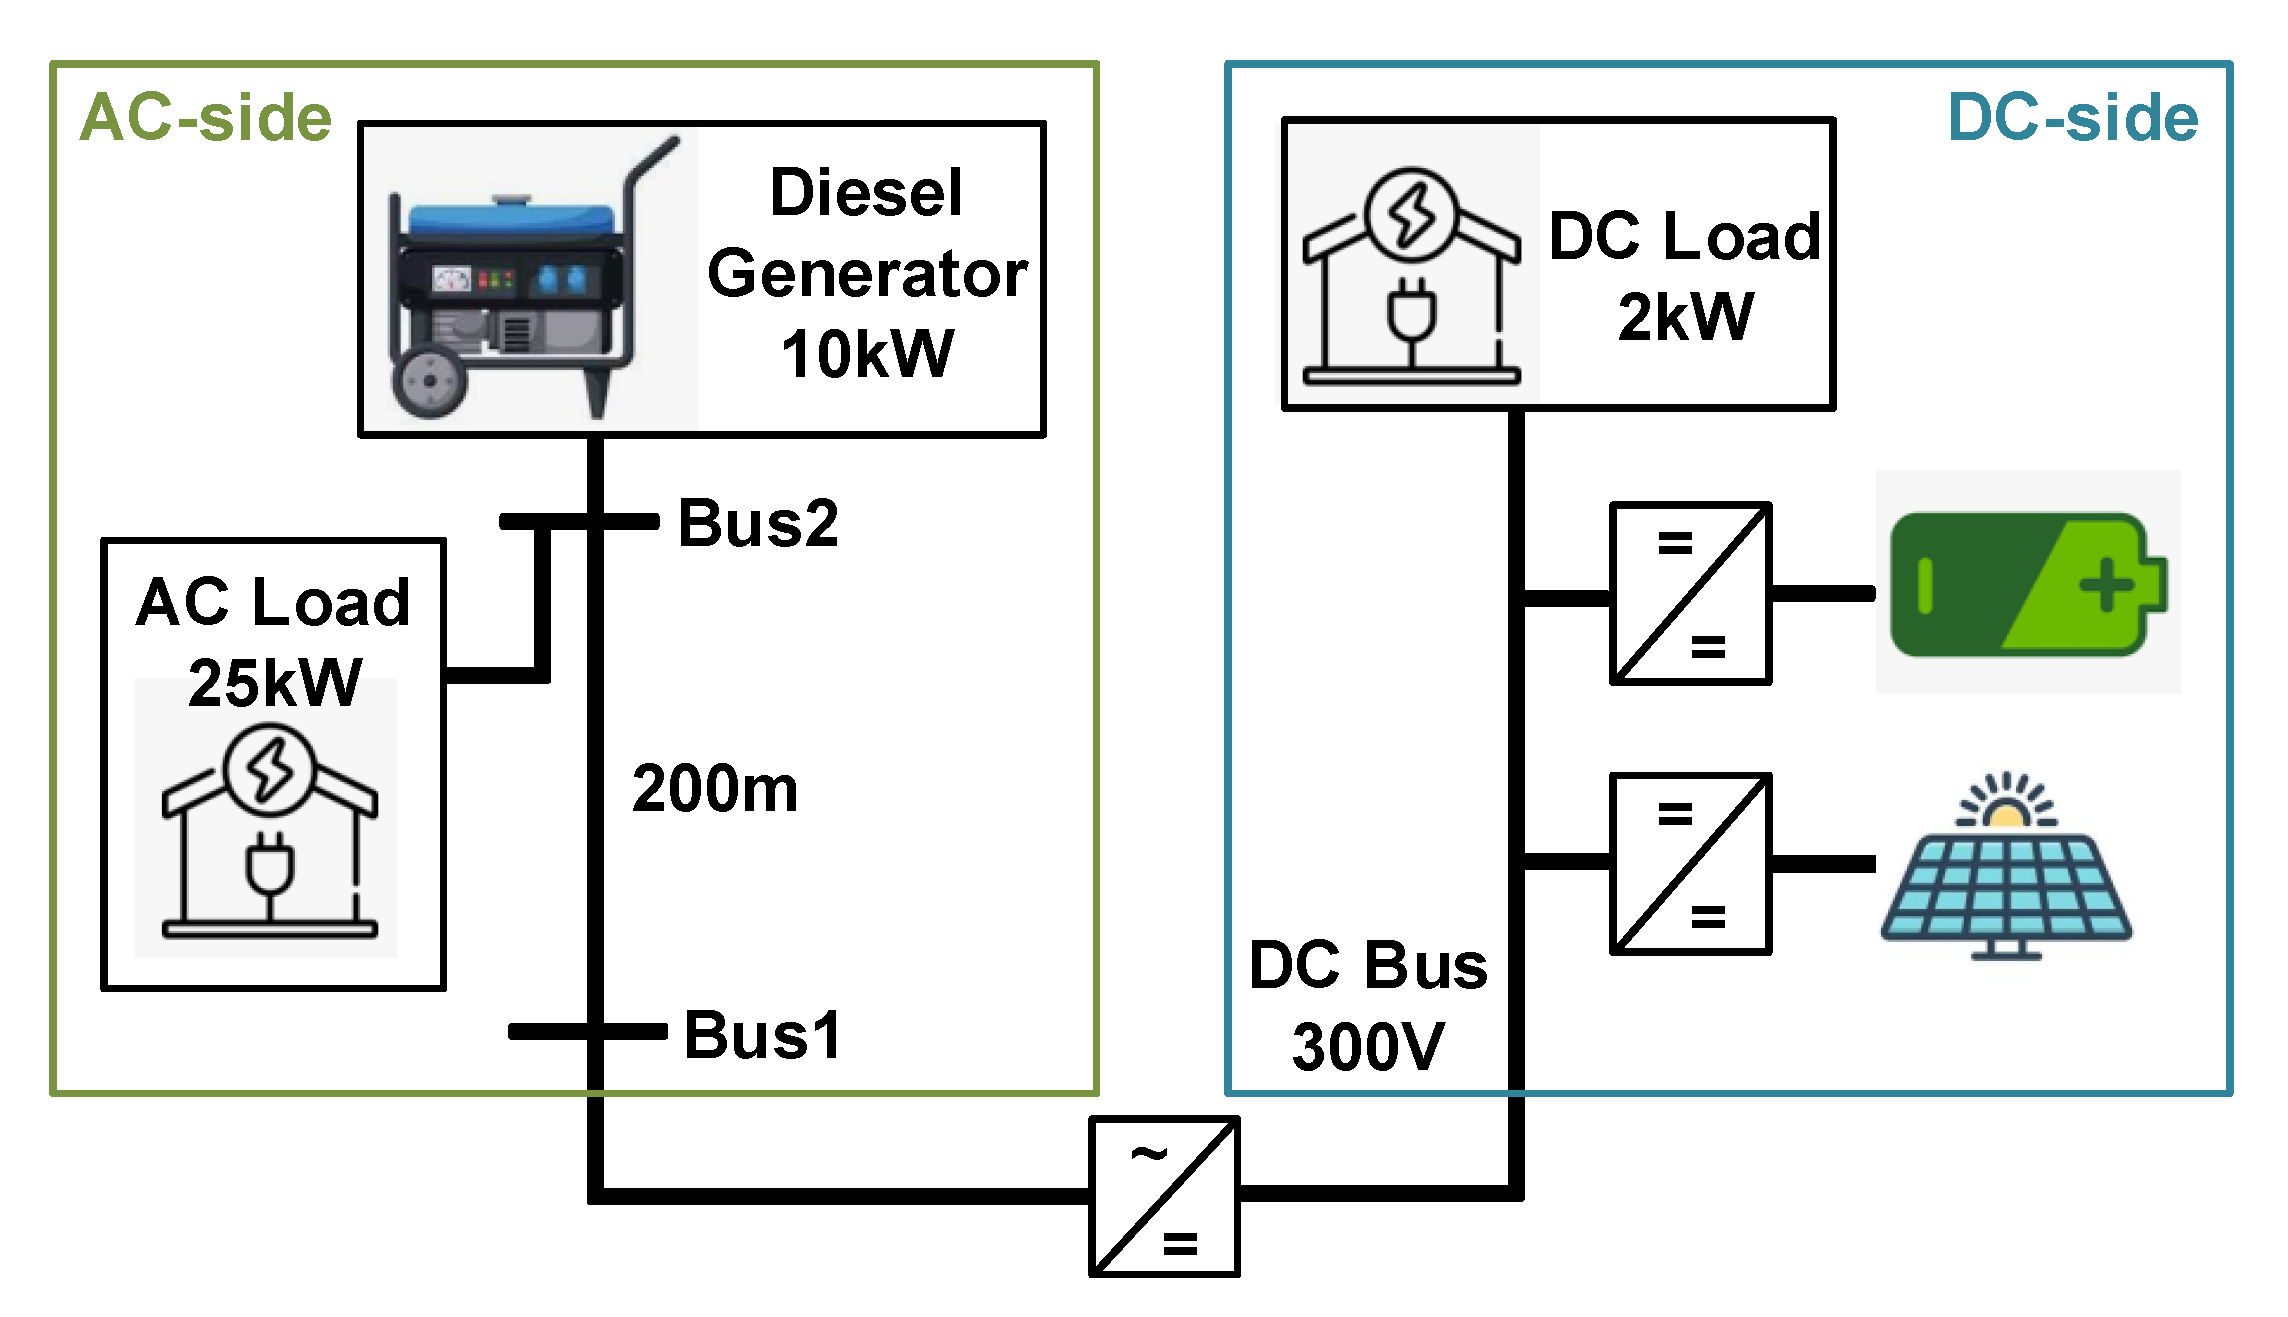
2.1. A Typical Architecture of an AC/DC Hybrid Microgrid

The diagram of a typical AC/DC hybrid microgrid is shown in Figure 2. The AC microgrid is connected to a 69 kV transmission power system in which it can work under either grid-connected mode or islanding mode. A traditional diesel generator supplies power to the AC microgrid. The AC microgrid includes the primary distribution system and the secondary distribution system, which correspond to two different voltage levels, i.e., 13.8 kV and 220 V. The X/R ratio in the primary and secondary distribution systems also differs. In the secondary distribution system, both balanced loads and unbalanced loads are considered and modeled. A grid-following power inverter works as the interface between the AC microgrid and the DC microgrid, transferring power from the DC side to the AC side as the reference of active power. In DC microgrids, renewable energy sources are installed to supply eco-friendly power. Here, we consider a BESS integrated with a grid-forming power converter and PV generation with a grid-following power converter. A DC load is connected to the DC bus directly.
A block of data acquisition is developed to simulate the functionality of the SCADA system in power grids. It can monitor voltages at critical buses and power losses of some important branches. The interface is very user-friendly in that it can be easily accessed and expanded with more variables to monitor as needed.

2.2. The Operation of an AC/DC Microgrid

It is suggested to start up the renewable energy sources on the DC side before connecting the DC microgrid to the AC microgrid. During the start-up of the hybrid microgrid, the power-electronic-device-based components are manipulated in the following steps:
(1)
Start the BESS integrated with a grid-forming converter, which support the bus voltage at the main bus of the DC microgrid.
(2)
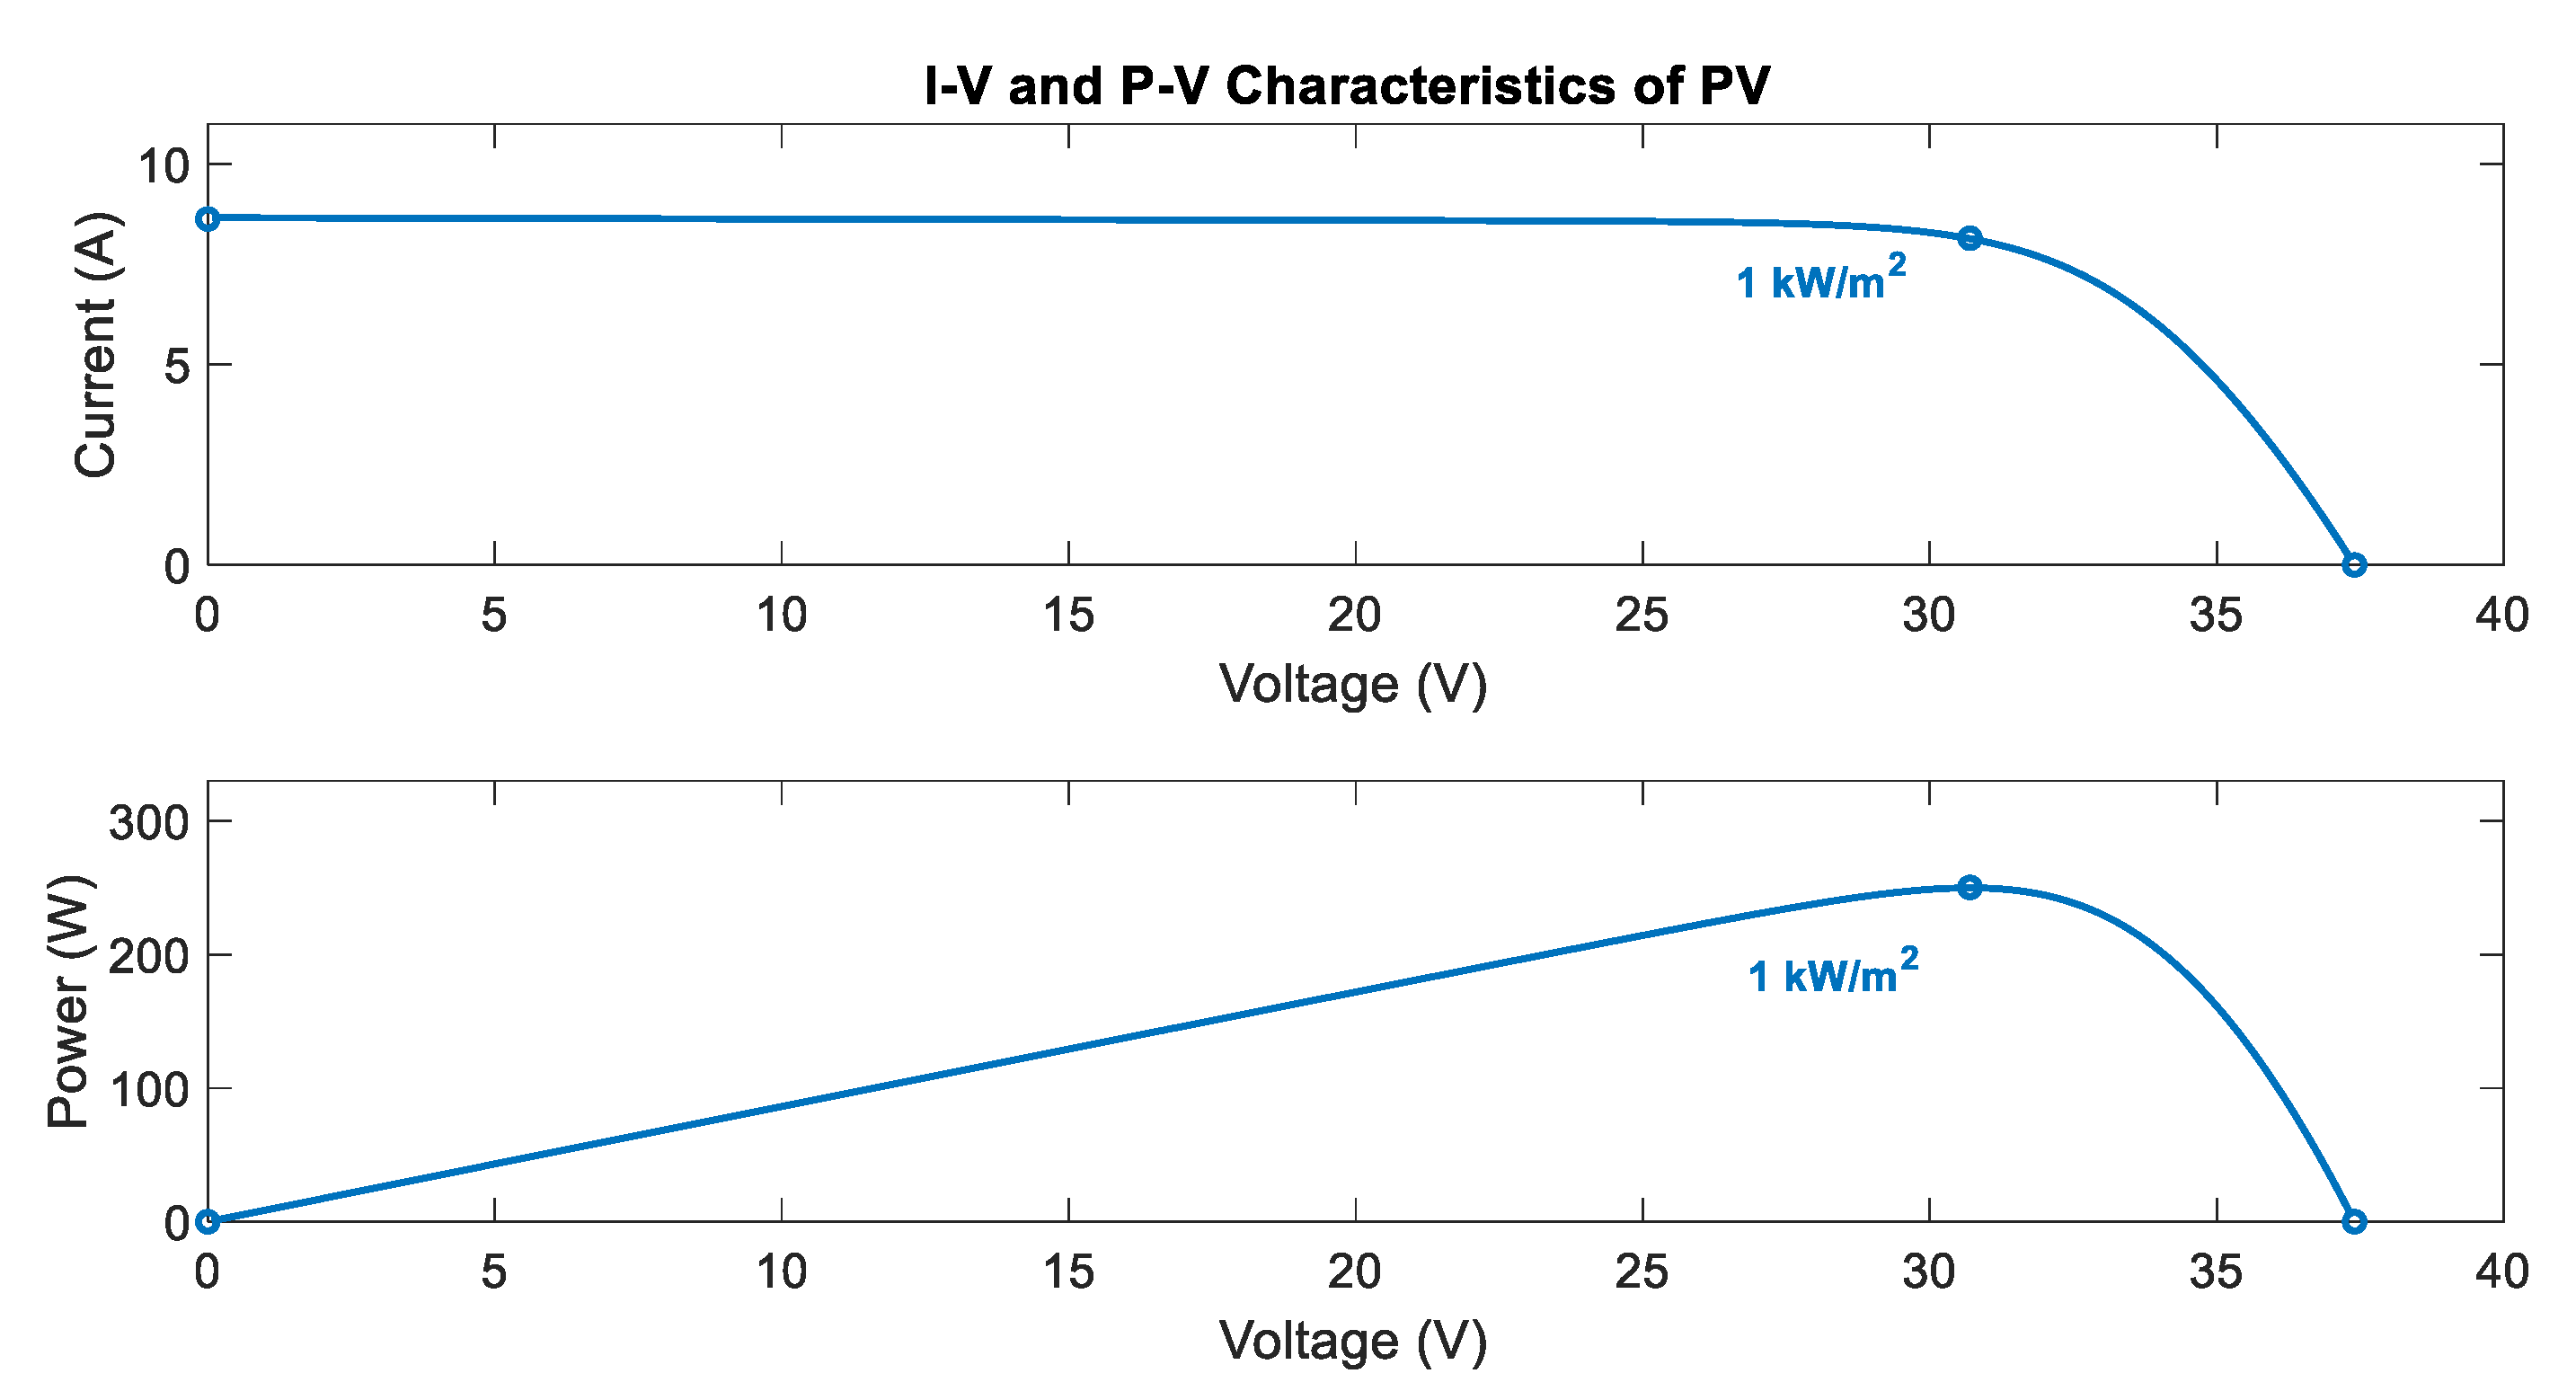
Launch the PV system integrated with a grid-following converter. It follows the bus voltage regulated by the BESS and can track the maximum power point if needed.
(3)
When the DC microgrid is in the steady state, connect it to the AC microgrid by enabling the grid-following power inverter to interface the AC/DC sides.
Suppose the PV system is connected at t = 0.05 s and the DC microgrid is connected to the AC microgrid at t = 0.07 s. We measure the signals at Bus 8 and DC bus shown below (Figure 3).
As shown in Figure 4, it is observed that both the AC side and the DC side of the hybrid microgrid system become stable in less than 0.1 s after their connection.

2.3. The Modeling of BESS and PV

The BESS is installed at the main bus of the DC microgrid. We implement a typical lithium-ion battery model in the BESS. The nominal voltage is 120 V and the rated capacity is 800 Ah. The initial state of charge (SoC) is supposed as 80%. Other key parameters are described in Table 1.
The discharge and charge process of the lithium-ion battery is described by the following equations.
E d i s c h a r = E 0 K Q Q i t · i * K Q Q i t · i t + A e B · i t , i * > 0
E c h a r = E 0 K Q i t + 0.1 Q · i * K Q Q i t · i t + A e B · i t , i * < 0
where E d i s c h a r and E c h a r are the nonlinear battery voltages (V), E 0 is the constant voltage (V), K is the polarization constant (V/Ah) or polarization resistance (Ohms), i * is the low-frequency current dynamics (A), it is the extracted capacity (Ah), Q is the maximum battery capacity (Ah), A is the exponential voltage (V), B is the exponential capacity ( Ah 1 ).
The battery is connected to a grid-forming boost converter, which can support the output voltage as the reference for the DC main bus. The boost converter allows bidirectional power flow and can accommodate both the discharging status and the charging status of the battery.
The PV generation system is also installed at the main bus of the DC microgrid. The PV array consists of 7 parallel strings of PV modules, and each string has 6 series-connected modules. The main parameters of the PV module are shown in Table 2.
All PV cells operate under an irradiance of 1000 W / m 2 and a temperature of 25 °C. The PV array has 42 modules in total, and the nominal power output is around 10.5 kW. The I-V and P-V characteristics of the PV array are described in Figure 5.
The PV array is connected to a grid-following boost converter. It steps up the voltage from 183 V to 300 V. The incremental conductance method is adopted to realize the functionality of MPPT, which guarantees high utilization of the energy from sunlight. In the MPPT controller, we design the appropriate gain and add the necessary dead zone and integral to ensure operational stability.

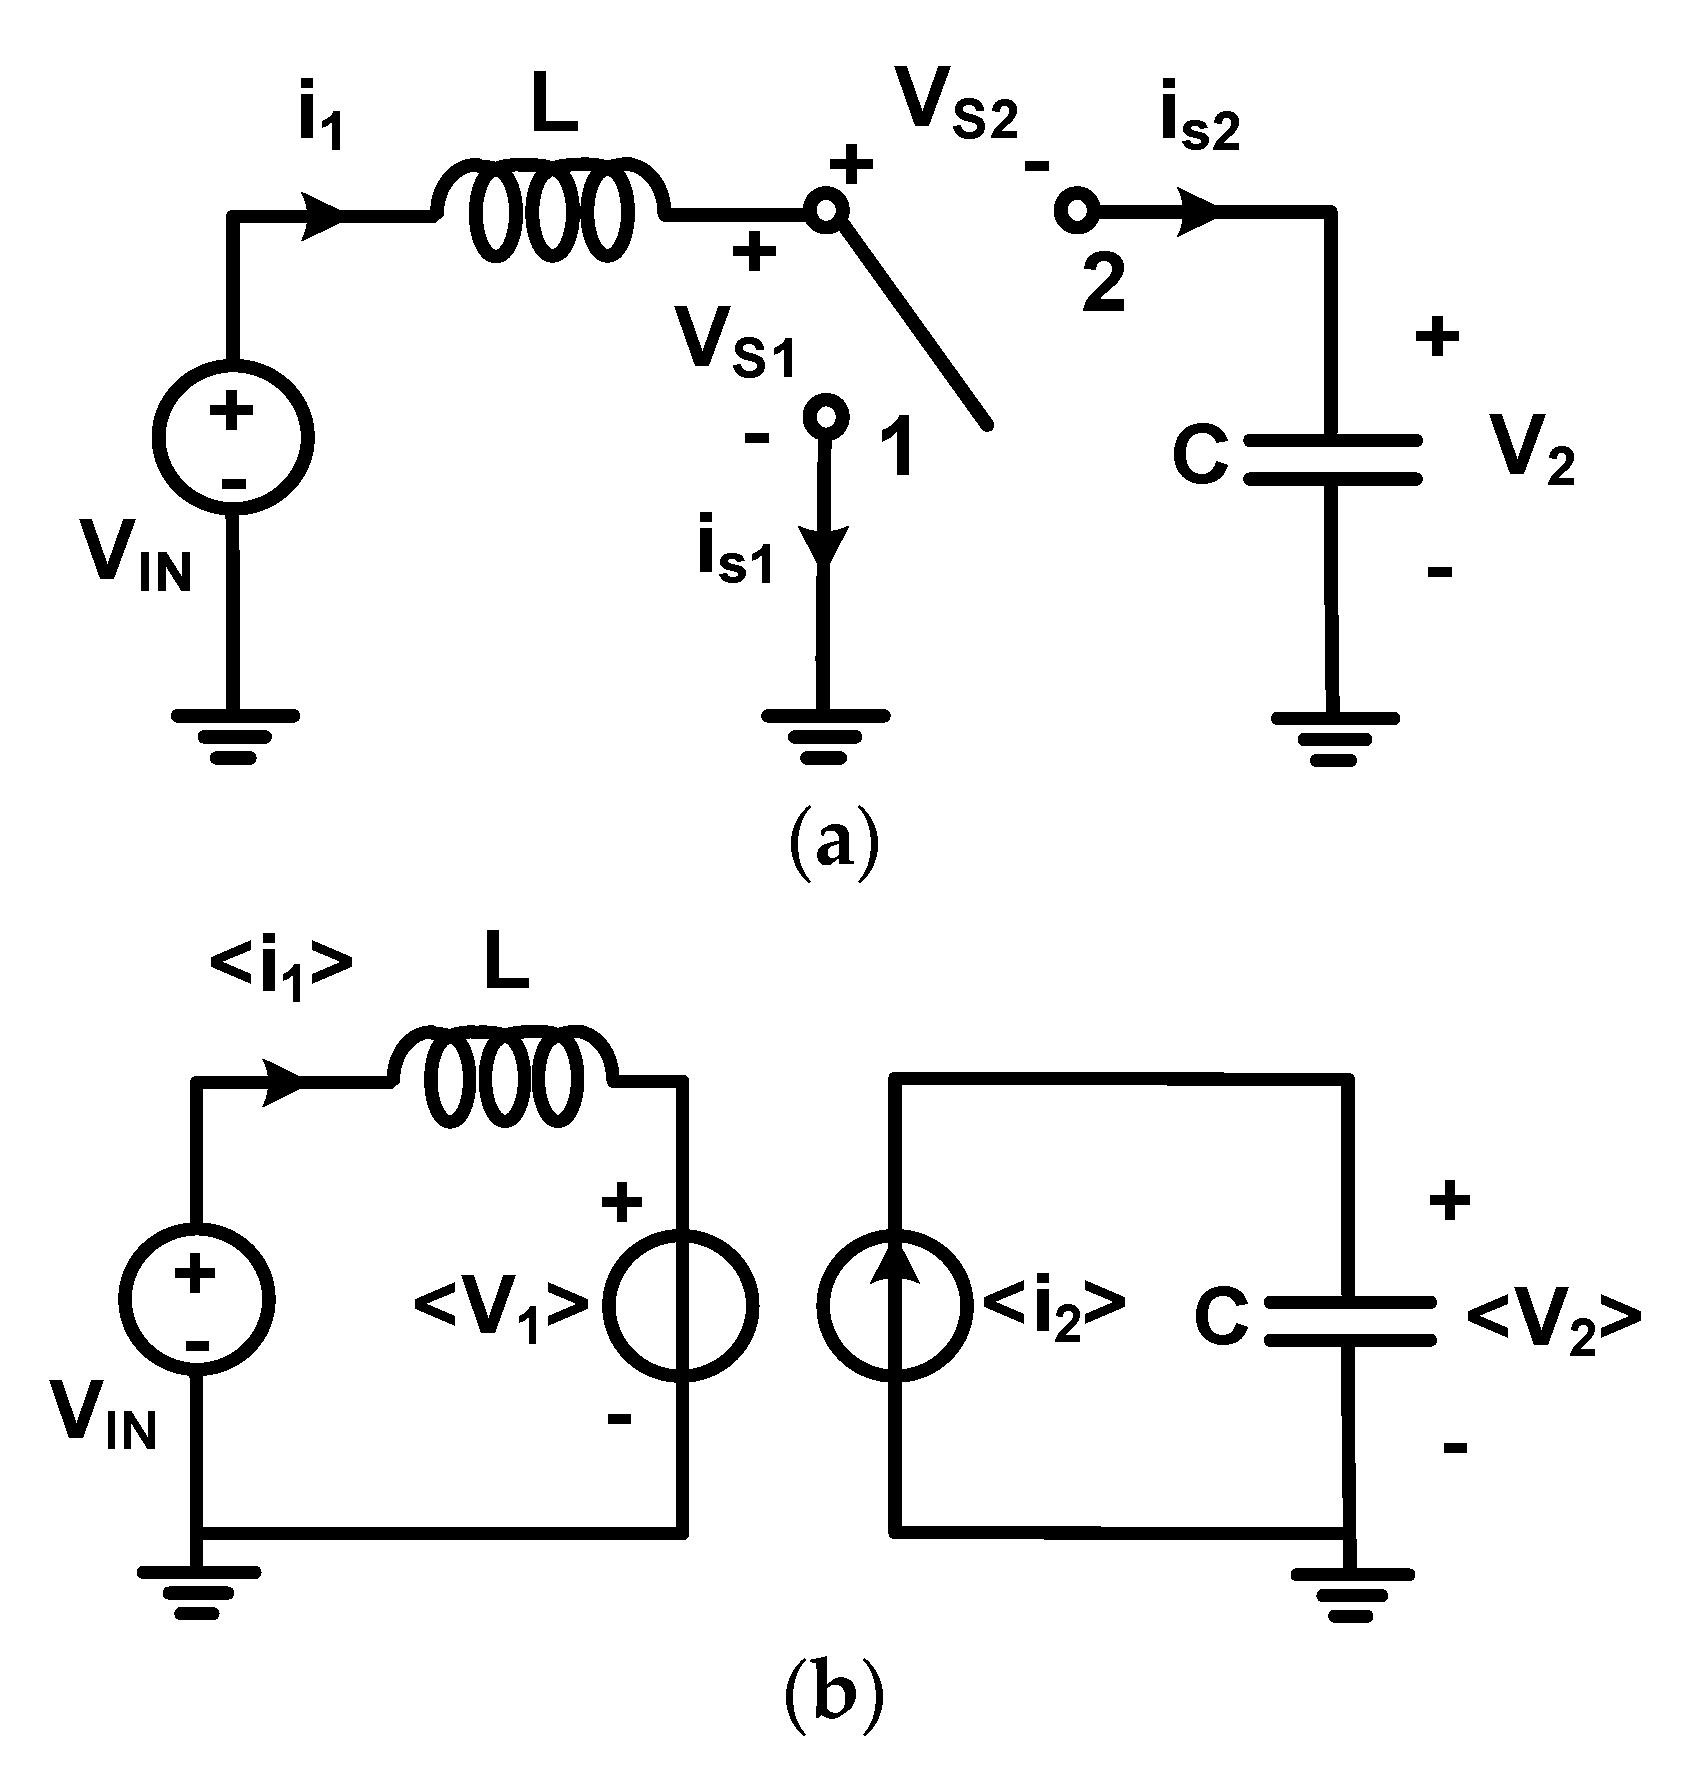
2.4. Circuit Averaging Model of Power Converter

To improve the simulation speed and develop a model with physical interpretation, we model the boost converter using the circuit averaging technique instead of state-space averaging in both the BESS and the PV generation. This method performs all manipulation on the circuit diagram directly to find an averaged switch model for the switch network. The key step is to replace the converter switches with voltage and current sources to obtain a time-invariant circuit topology. As described in Figure 6b, the equivalent modeling of the boost converter using the circuit averaging technique is formulated by the solved equivalent controlled voltage source and controlled current source. V 1 and i 2 represent the cycle-averaged value of the output voltage of the voltage source and the cycle-averaged value of the output current of the current source, respectively. · denotes the cycle-average value. The derivation of the value of V 1 and i 2 is introduced as follows.
Regarding the switch model of a boost converter in Figure 6a, consider that switch is connected at position 1 and position 2, respectively. Suppose the duty ratio is D and the period is T s in this converter; the switch is at position 1 for n T s t < ( D + n ) T s and is at position 2 for ( D + n ) T s t < ( n + 1 ) T s , where n N . Then, the following equations hold.
V S 1 ( t ) = { 0 ,   n T s t < ( D + n ) T s V 2 ( t ) ,   ( D + n ) T s t < ( n + 1 ) T s  
V S 2 ( t ) = { V 2 ( t ) ,   n T s t < ( D + n ) T s 0 ,   ( D + n ) T s t < ( n + 1 ) T s  
i S 1 ( t ) = { i 1 ( t ) ,   n T s t < ( D + n ) T s 0 ,   ( D + n ) T s t < ( n + 1 ) T s  
i S 2 ( t ) = { 0 ,   n T s t < ( D + n ) T s i 1 ( t ) ,   ( D + n ) T s t < ( n + 1 ) T s  
Next, we calculate the cycle-averaged value of the voltage source V 1 ( t ) . By definition, it is known that
V 1 ( t ) & = 1 T s t T s t V s 1 ( τ ) d τ
(1)
In the first case, we assume V s 1 ( t ) = 0 ,   ( n + 1 D ) T s < t < ( n + 1 ) T s . Hence,
V 1 ( t ) & = 1 T s t T s t V s 1 ( τ ) d τ = 1 T s n T s ( n + 1 D ) T s V 2 ( t ) d t
Since V 2 ( t ) has a very small ripple, we consider it a constant in the period [ t T s ,   t ] . Then, we have
V 1 ( t ) = 1 T s 1 1 D t T s t V 2 ( t ) d t = 1 1 D V 2 ( t )
(2)
In the second case, we assume V s 1 ( t ) = V 2 ( t ) . Similarly, we also obtain
V 1 ( t ) & = 1 1 D V 2 ( t )
Next, we calculate the cycle-averaged value of the current source i 2 ( t ) . By definition, it is known that
i 2 ( t ) & = 1 T s t T s t i 2 ( t ) d t
(1)
In the first case, we assume i s 2 ( t ) = 0 ,   ( n + 1 D ) T s < t < ( n + 1 ) T s . Hence,
i 2 ( t ) & = 1 T s t T s t i 2 ( t ) d t = 1 T s n T s ( n + 1 D ) T s i 1 ( t ) d t
Since i 1 ( t ) has a very small ripple, we consider it a constant in the period [ t T s ,   t ] . Then, we have
i 2 ( t ) = 1 T s 1 1 D n T s ( n + 1 D ) T s i 1 ( t ) d t = 1 1 D i 1 ( t )
(2)
In the second case, we assume i s 2 ( t ) = i 1 ( t ) . Similarly, we obtain
i 2 ( t ) & = 1 1 D i 1 ( t )
In conclusion, the equivalent voltage source and current source are solved as follows:
{ V 1 ( t ) = 1 1 D V 2 ( t ) i 2 ( t ) = 1 1 D i 1 ( t )
With this conclusion, we can formulate boost converters as in the model in Figure 6b.

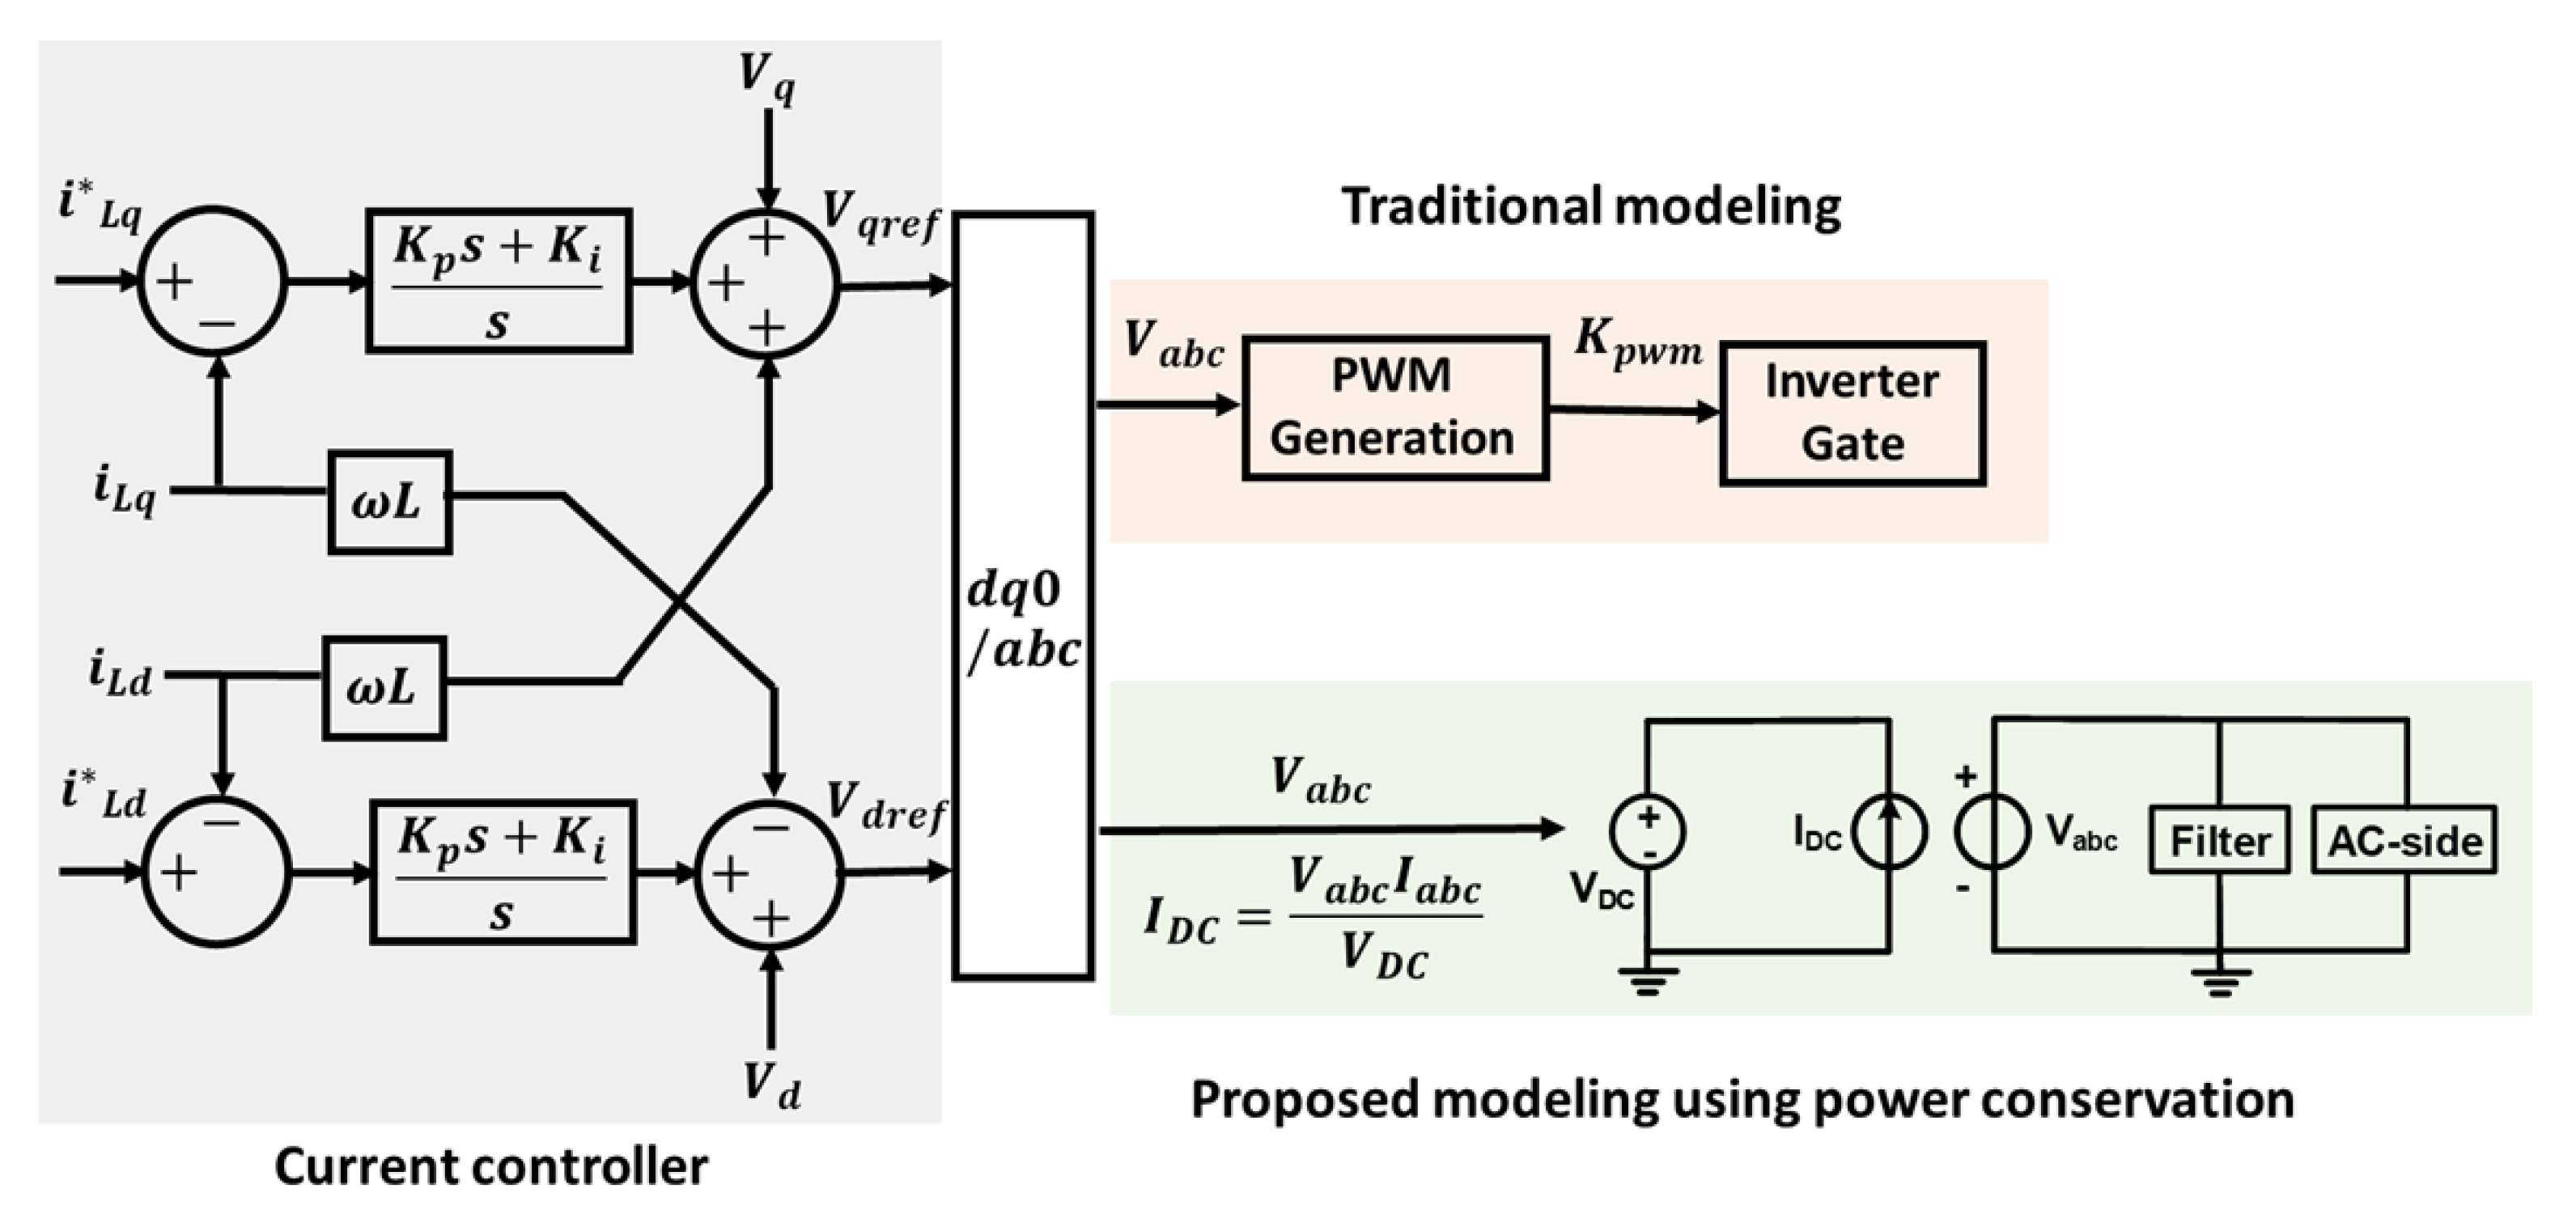
2.5. AC/DC Interfacing Power Inverter

The DC microgrid is connected to the AC microgrid through a grid-following power inverter. The grid-following inverter follows the bus voltage of the grid and controls power output as the reference values. In this hybrid microgrid, the reference of power out is set as 15 kW and 0 Var initially. The inverter is plugged in at t = 0.07 s. It can be observed from the simulation results in Figure 7 that the grid-following controller can successfully generate power as required.
To reduce the simulation runtime, we model the inverter using the signals from an equivalent controlled voltage source and current source instead of a PWM. The comparison of the modeling method between the conventional method and the proposed method is shown in Figure 8. The PWM is a very time-consuming block in the electromagnetic transient (EMT) simulation, so we replace it with a controlled voltage source on the AC side of the inverter. First, the output voltage of the controlled voltage source is regulated by an inner current controller. Then, we implement a controlled current source on the DC side of the inverter. The current value is determined by following the rule of power conservation.

3. Discussion

3.1. Stability Analysis with Faults

In this section, we discuss the stability of the AC/DC hybrid microgrid with faults. Specifically, we impose a fault on one side of the hybrid microgrid and then investigate its effects on the stability of the other side.

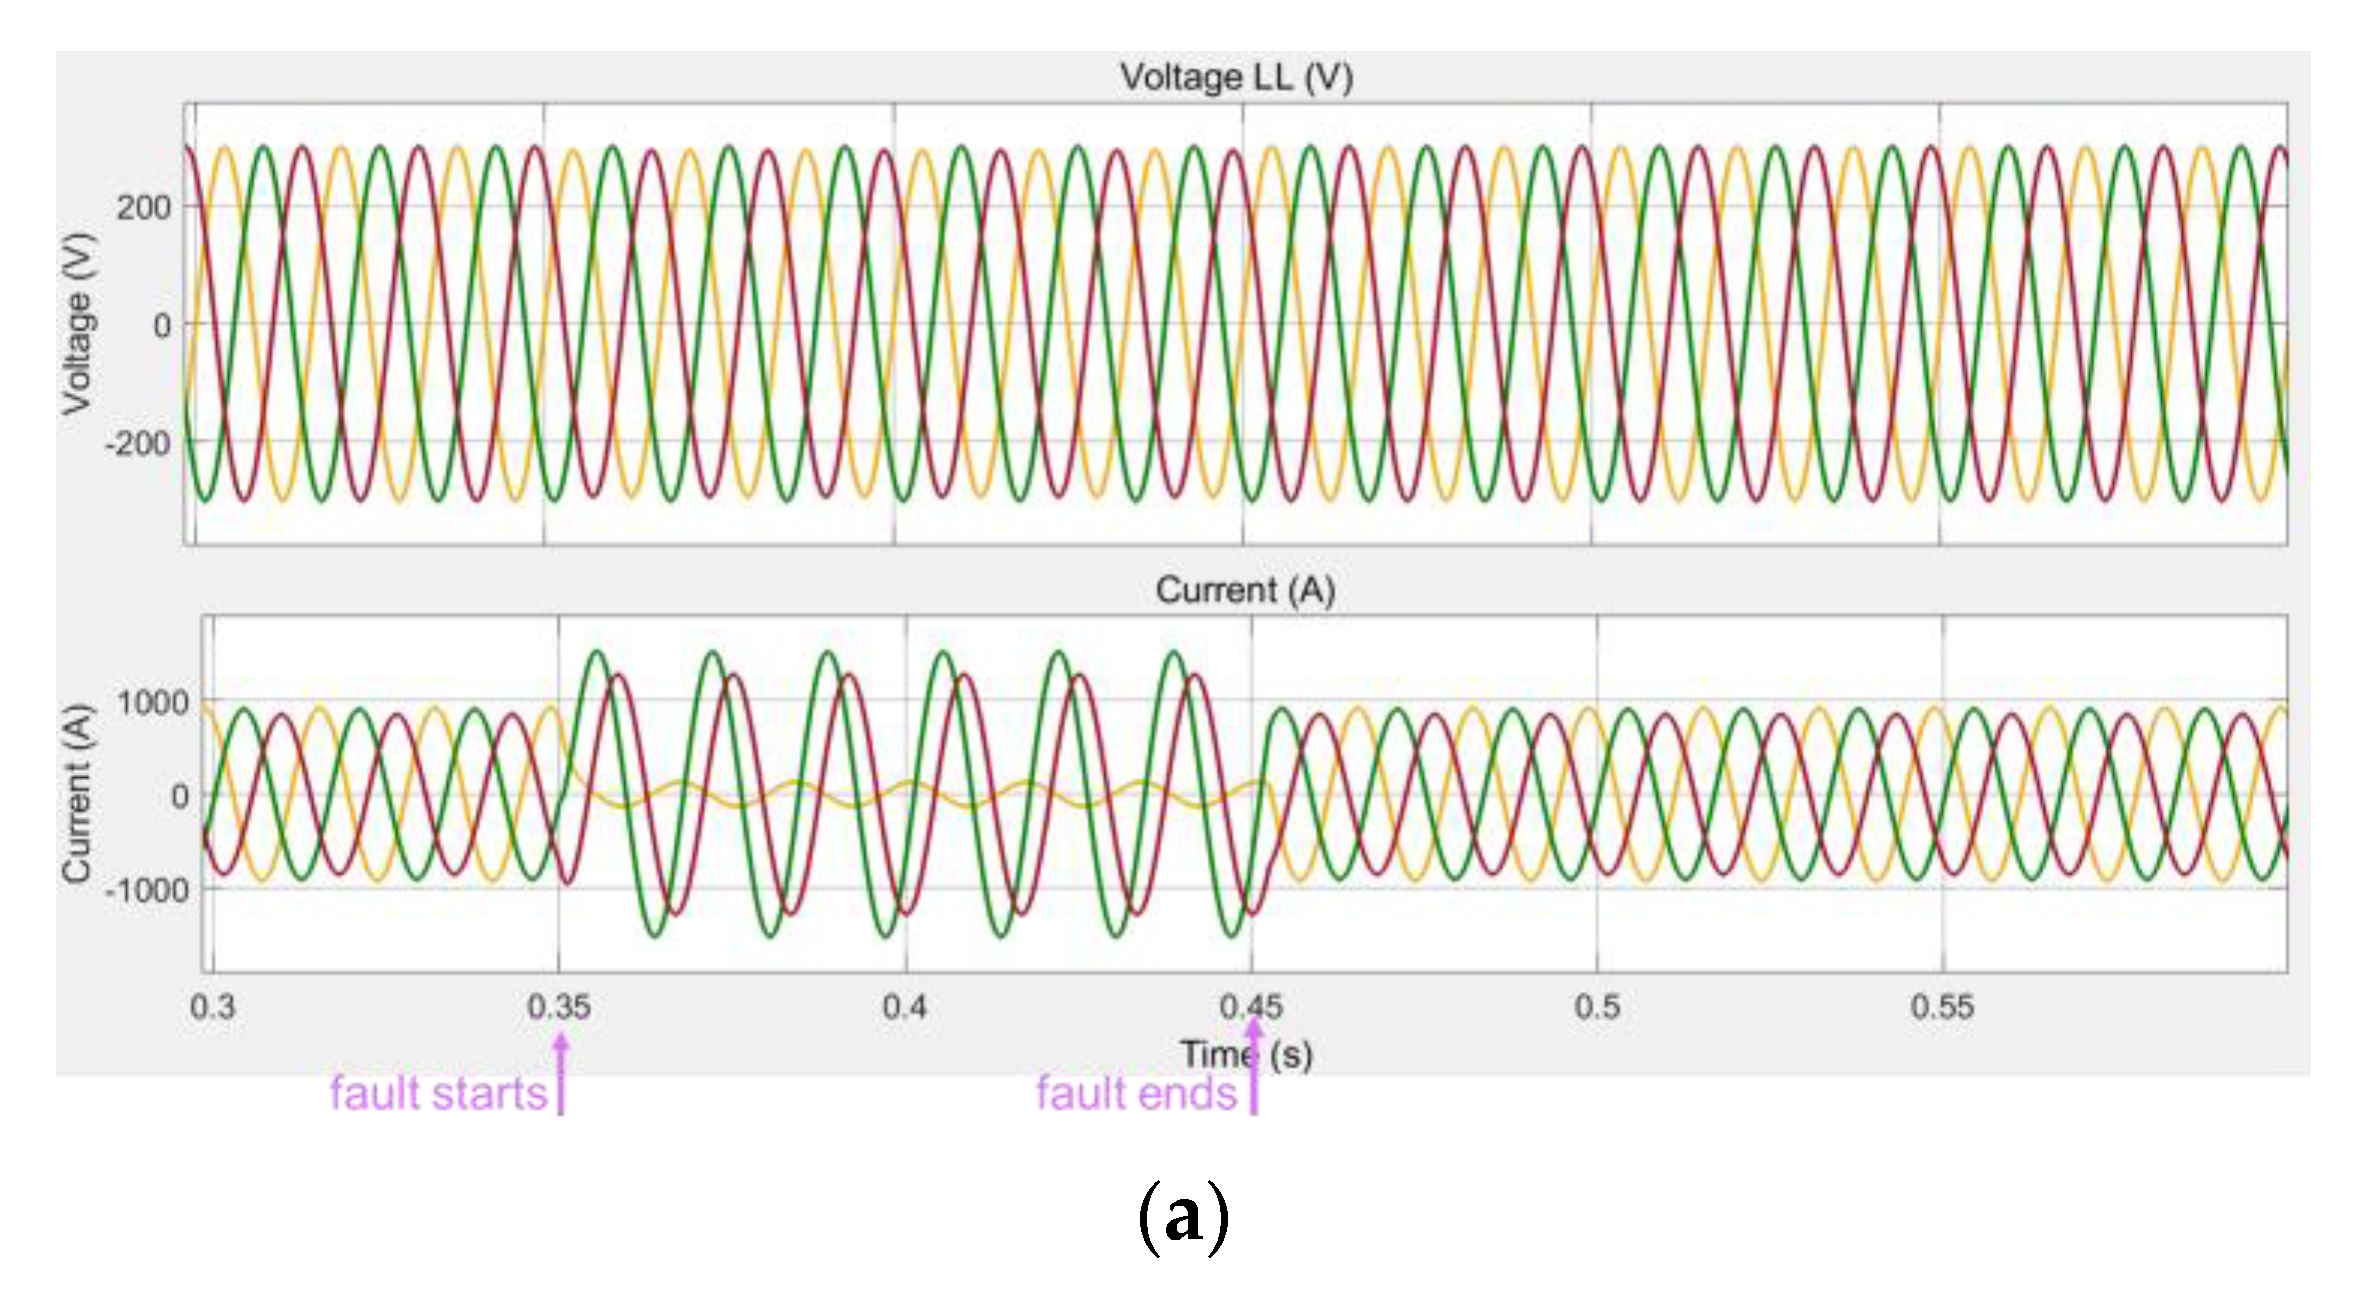
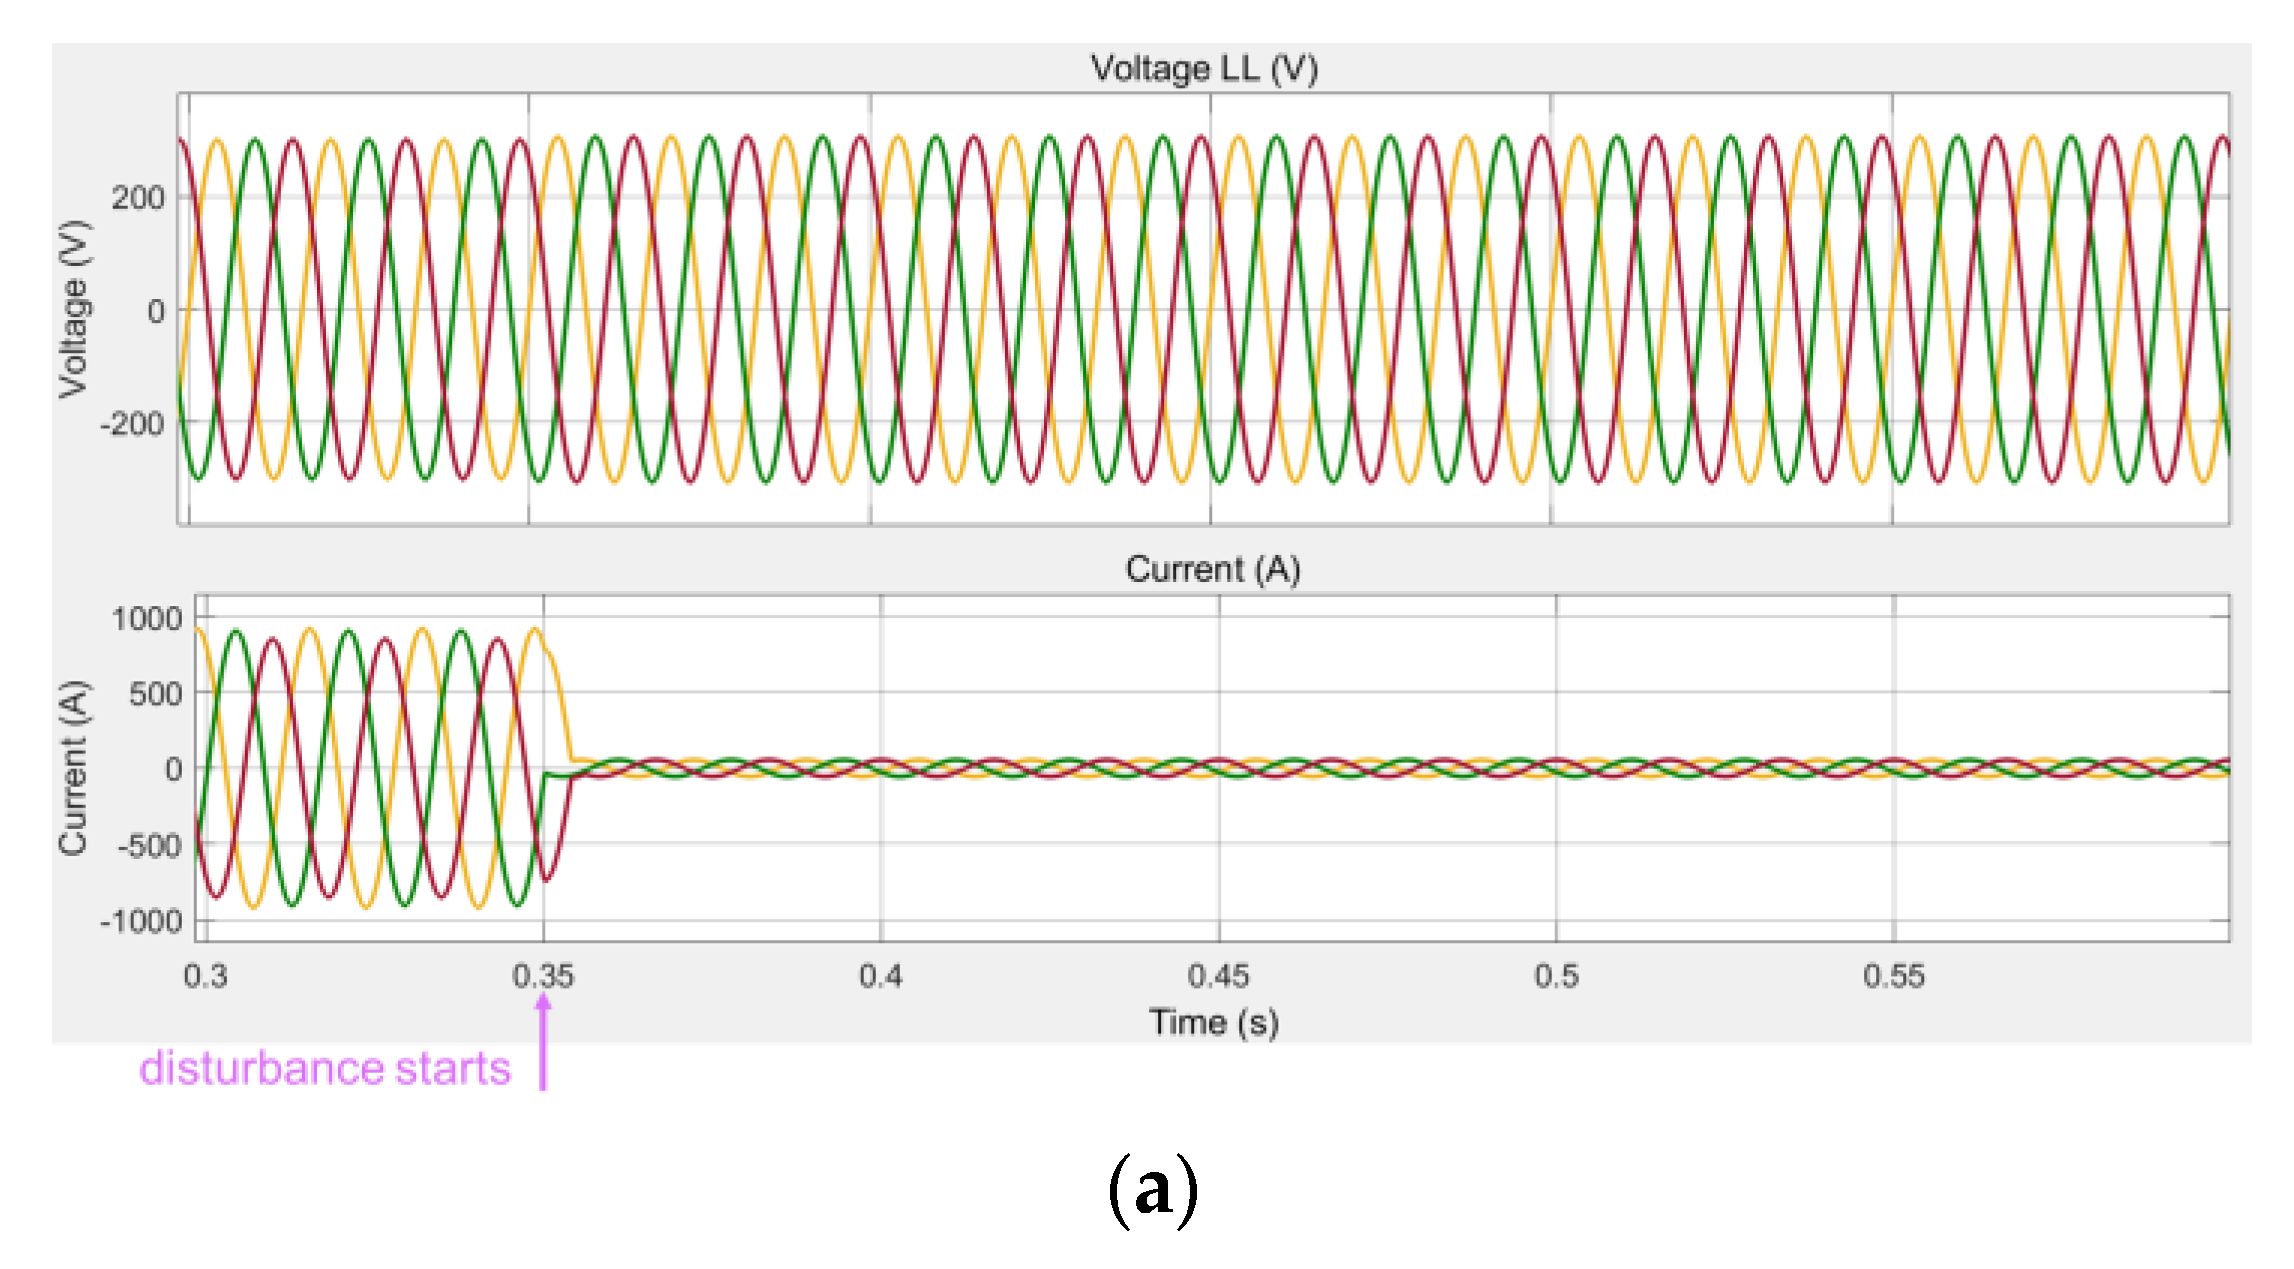
3.1.1. The Effects of an AC-Side Fault on the Stability of the DC Side
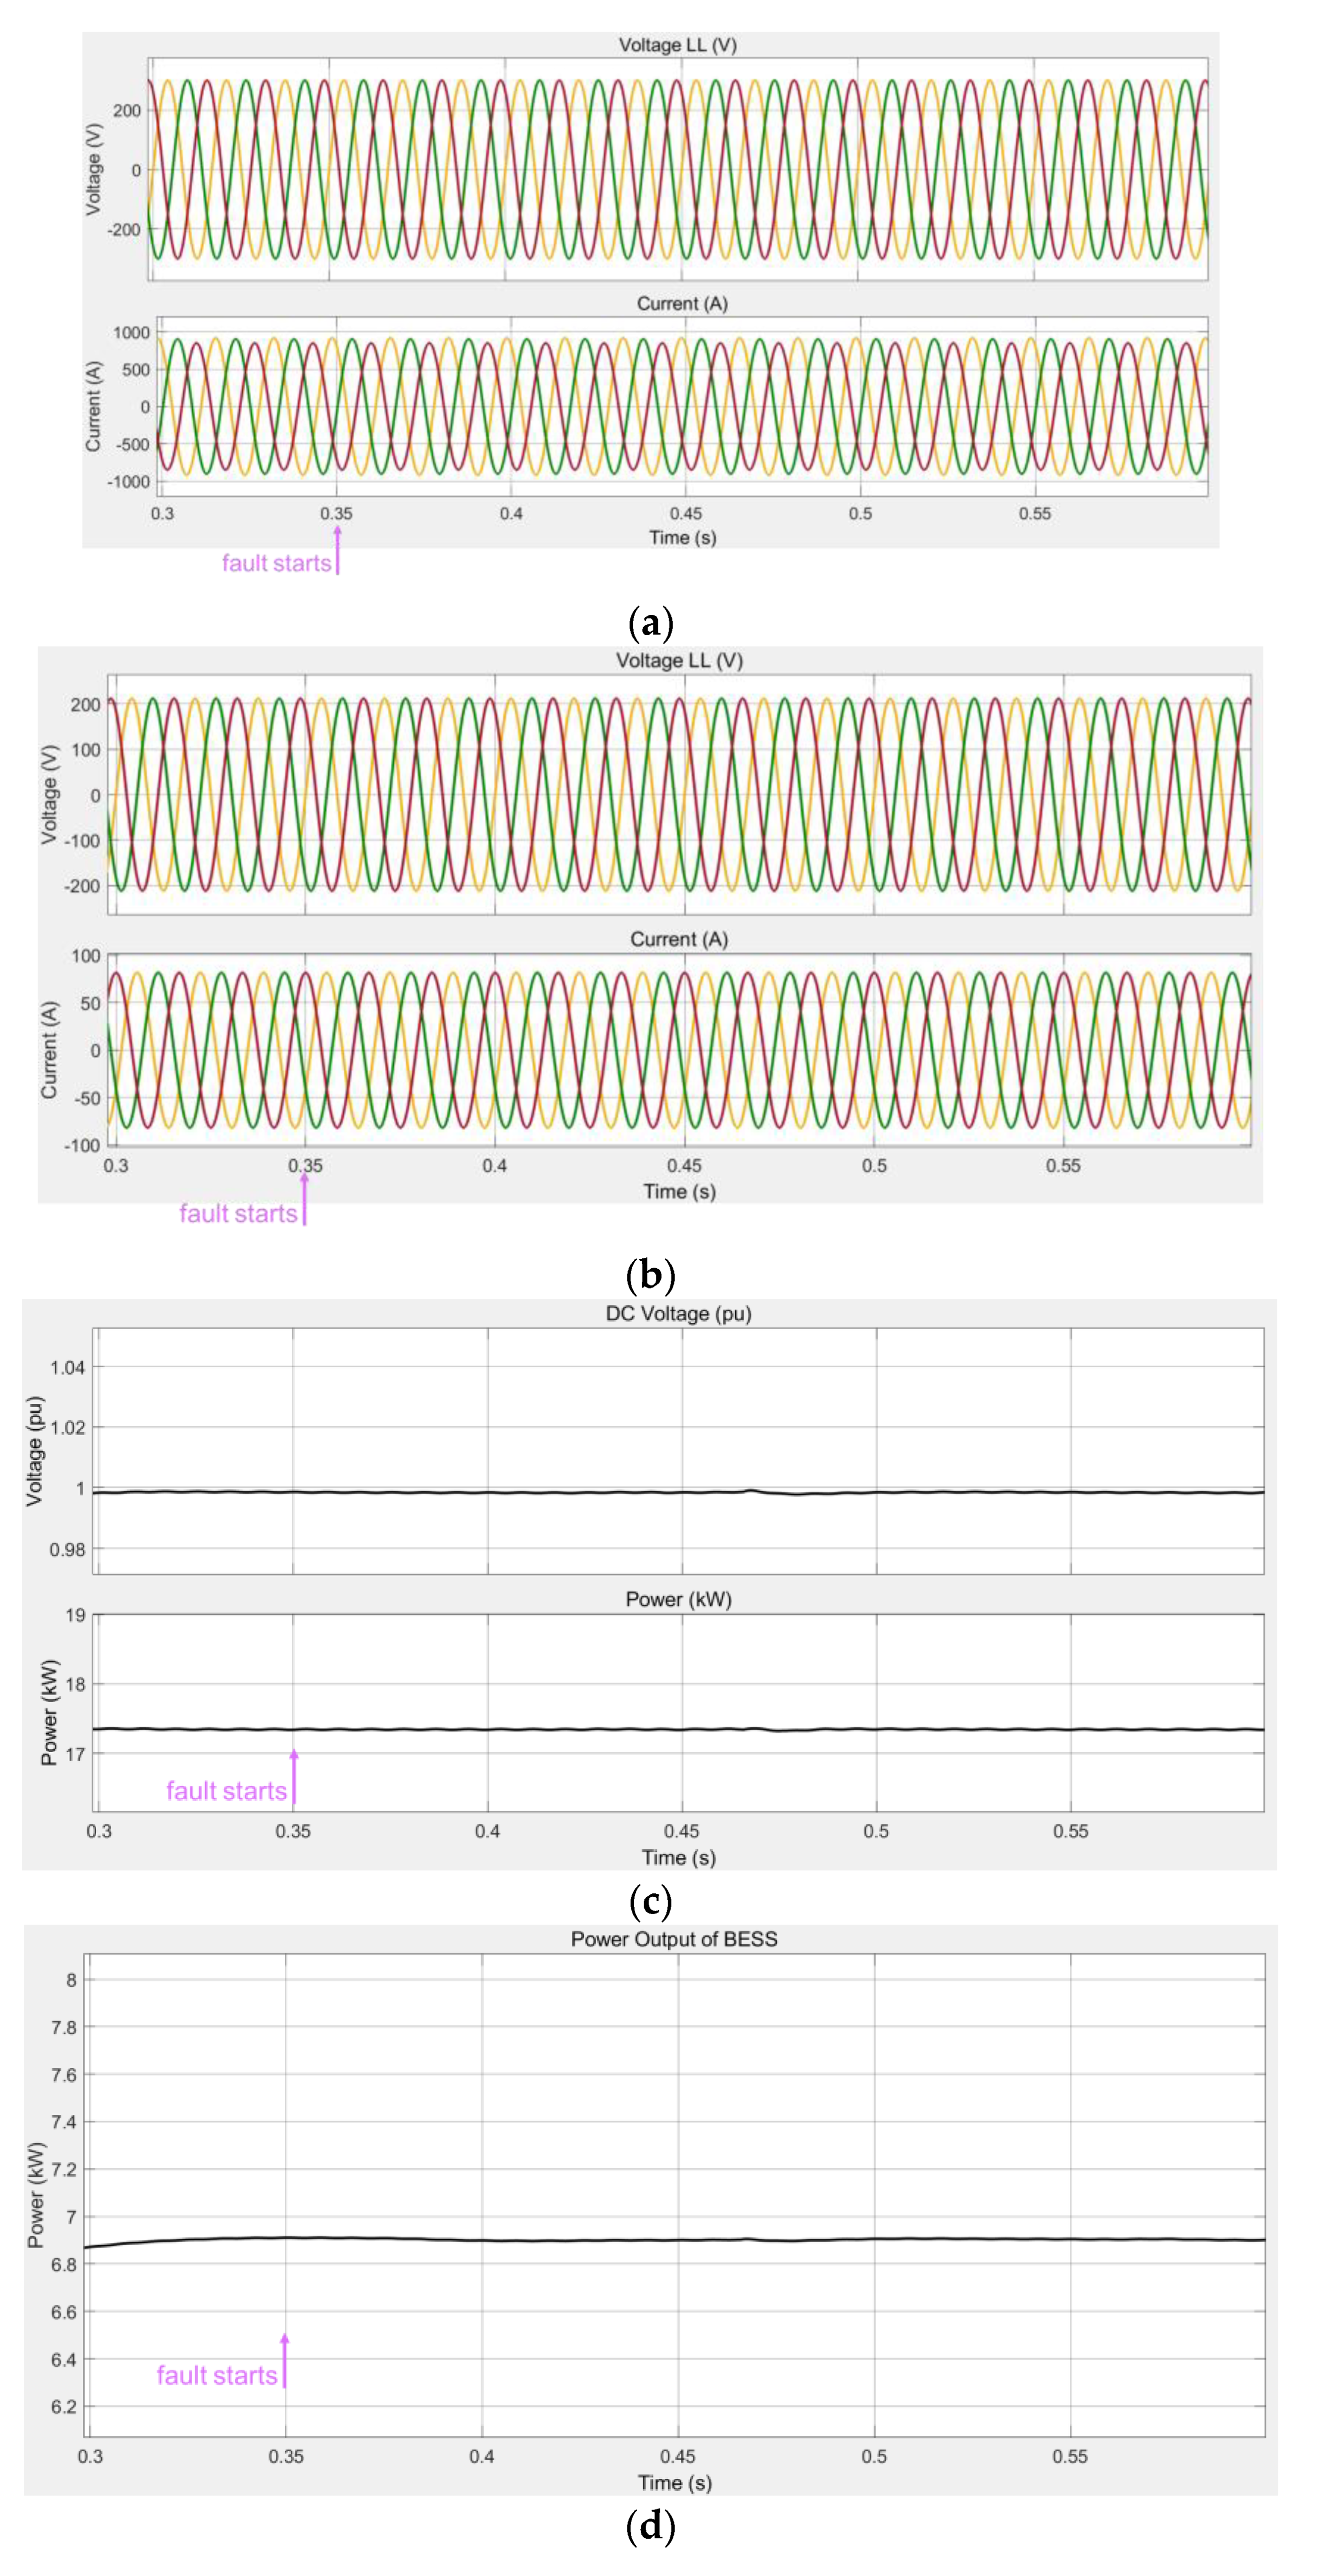
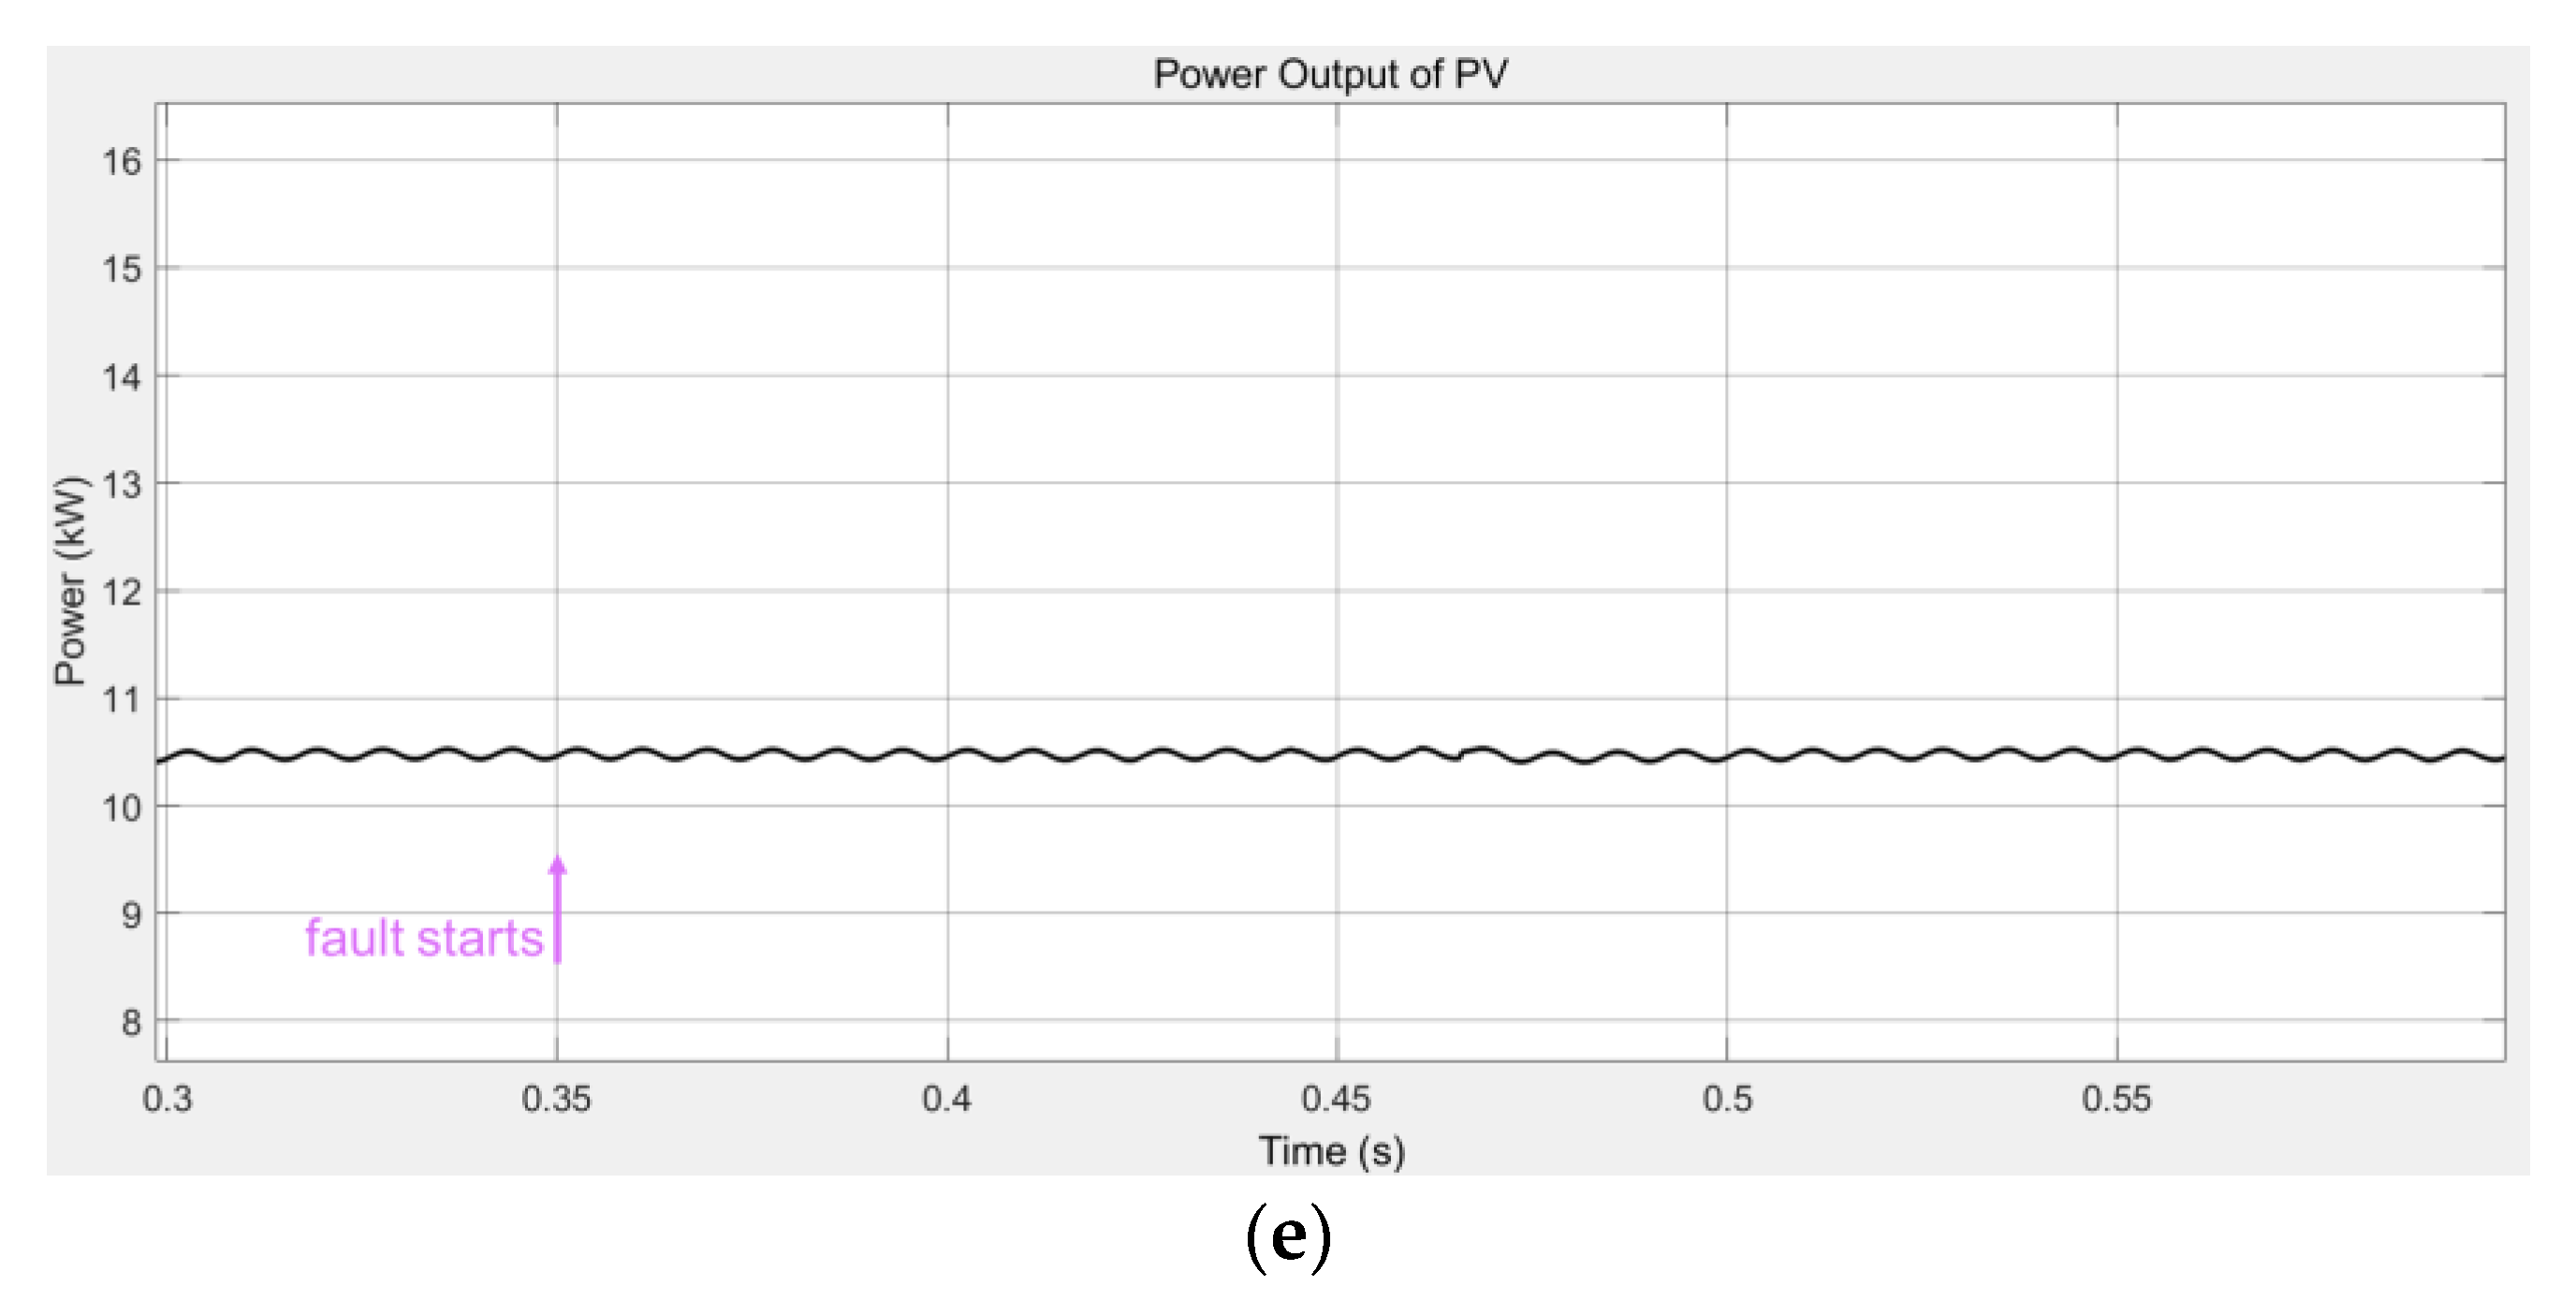
Different types of AC-side faults may have different effects on the stability of the DC side. Here, we consider two typical faults often happening in the power grid, the single phase-to-ground short circuit fault, and the phase-to-phase short circuit fault.
First, we consider a single phase-to-ground short circuit fault (suppose a phase-A-to-ground short circuit). Suppose the fault happened at the intersection between Line 5 and Line 6 during 0.35 s~0.45 s. The simulation results are shown in Figure 9.
It can be concluded from the simulation result that:
(1)
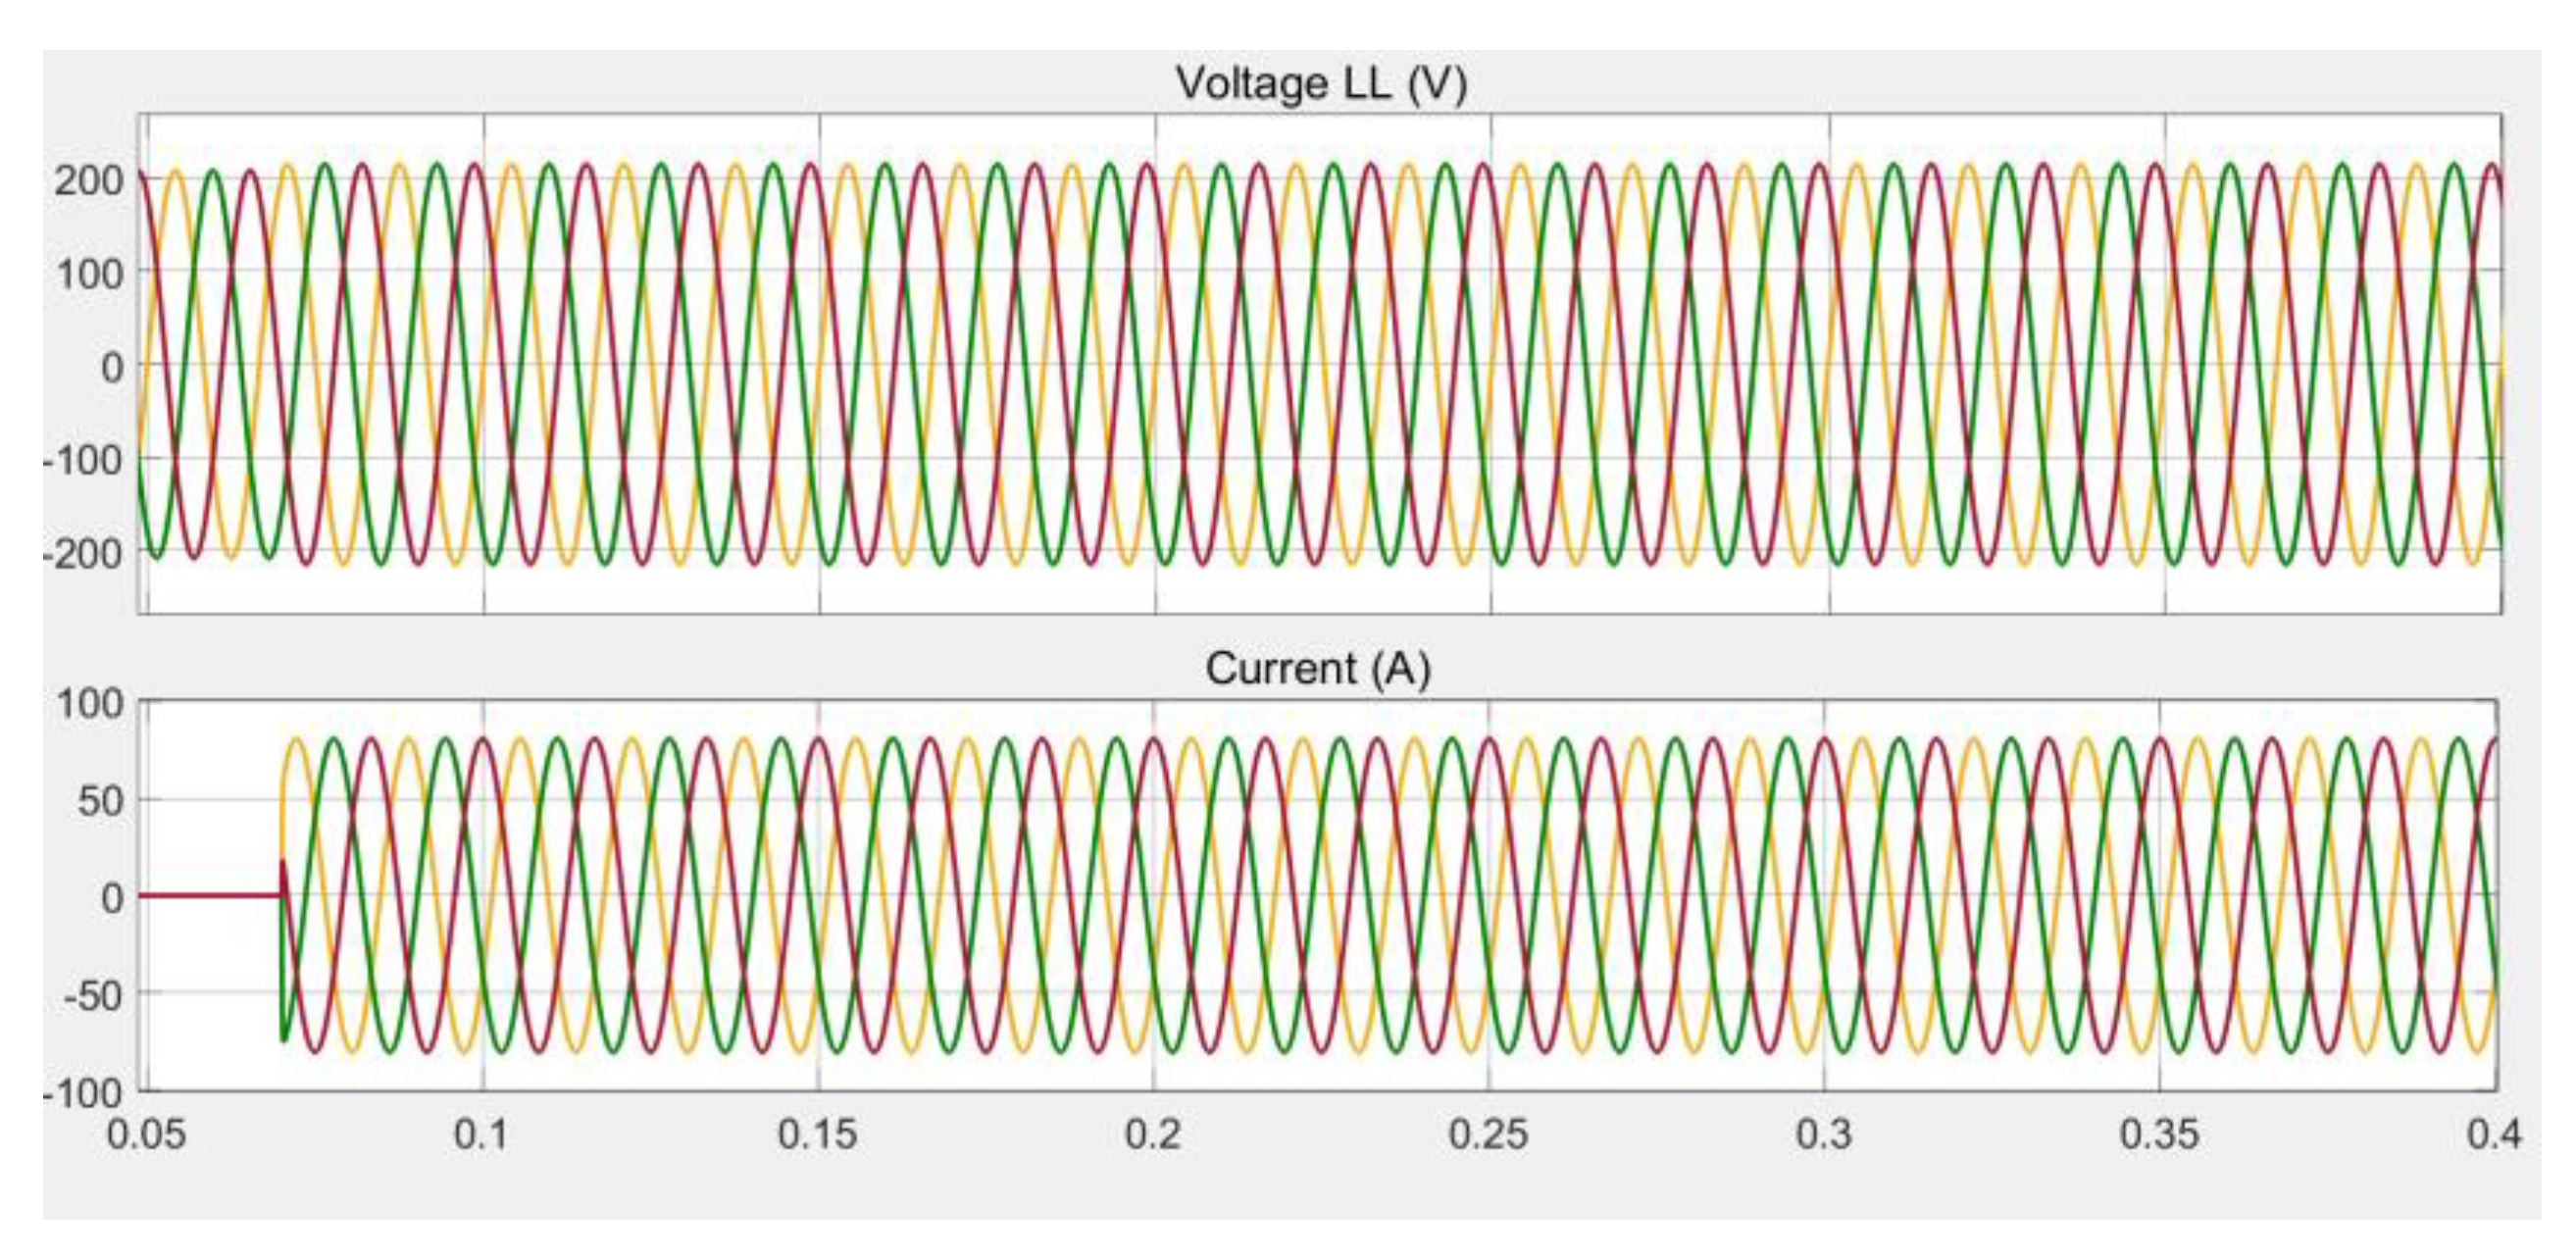
In the AC microgrid, the voltage has no fault component whereas the current has observable fault components. Two phases of the current increase a lot when the fault occurs.
(2)
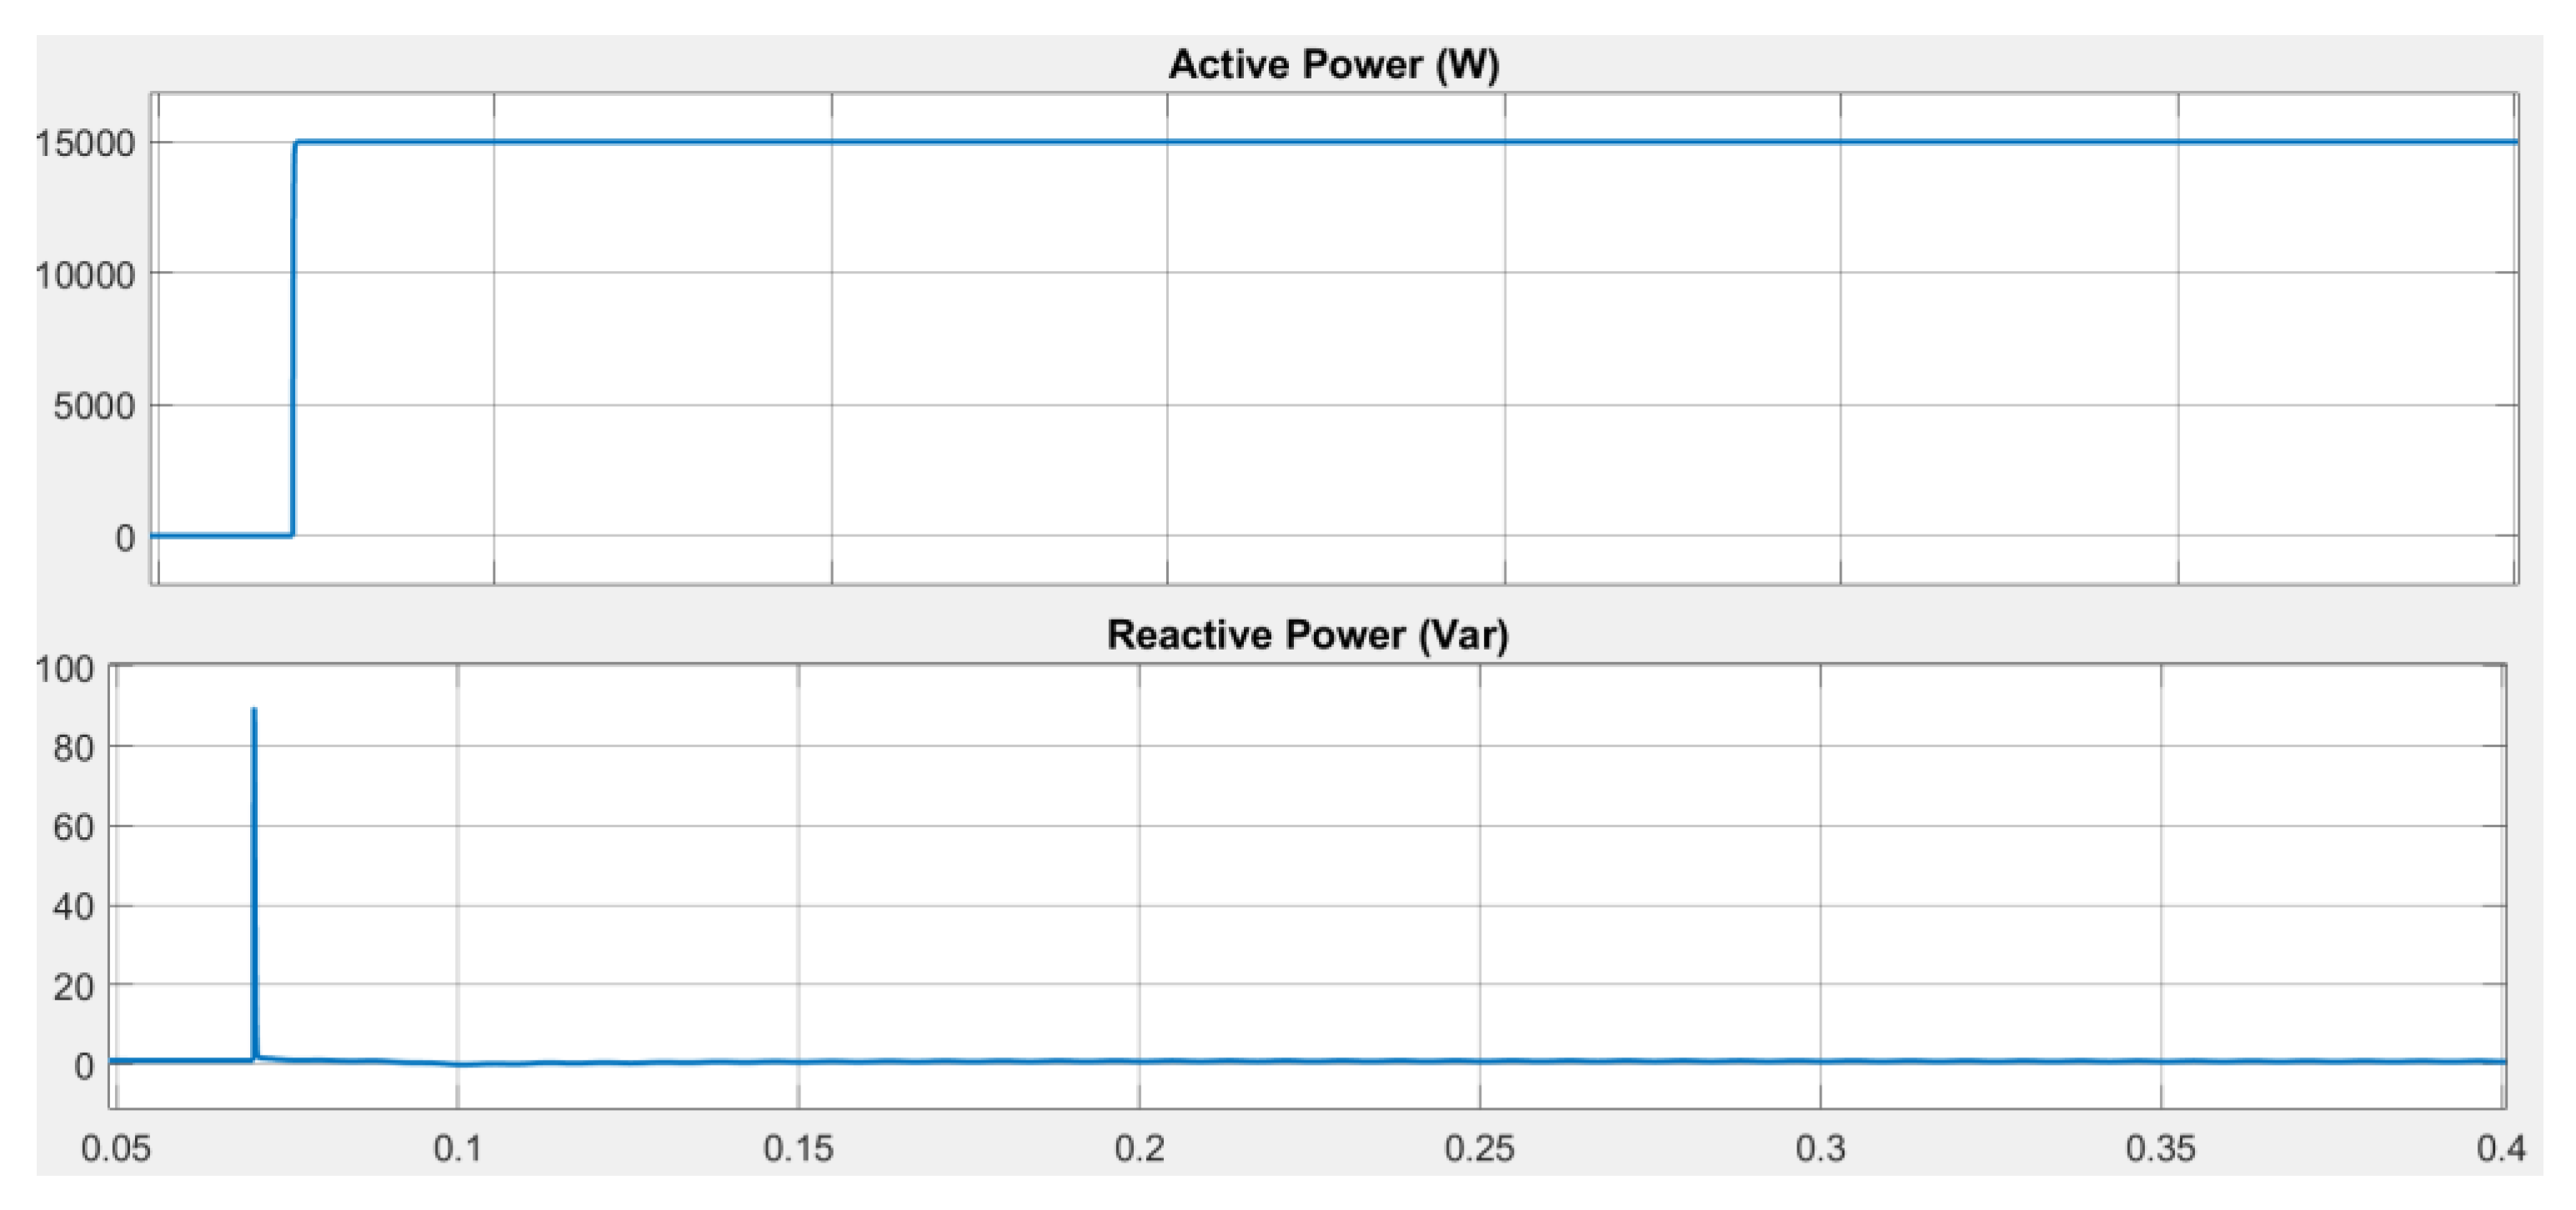
The AC/DC interfacing inverter still works well as in the normal operating condition.
(3)
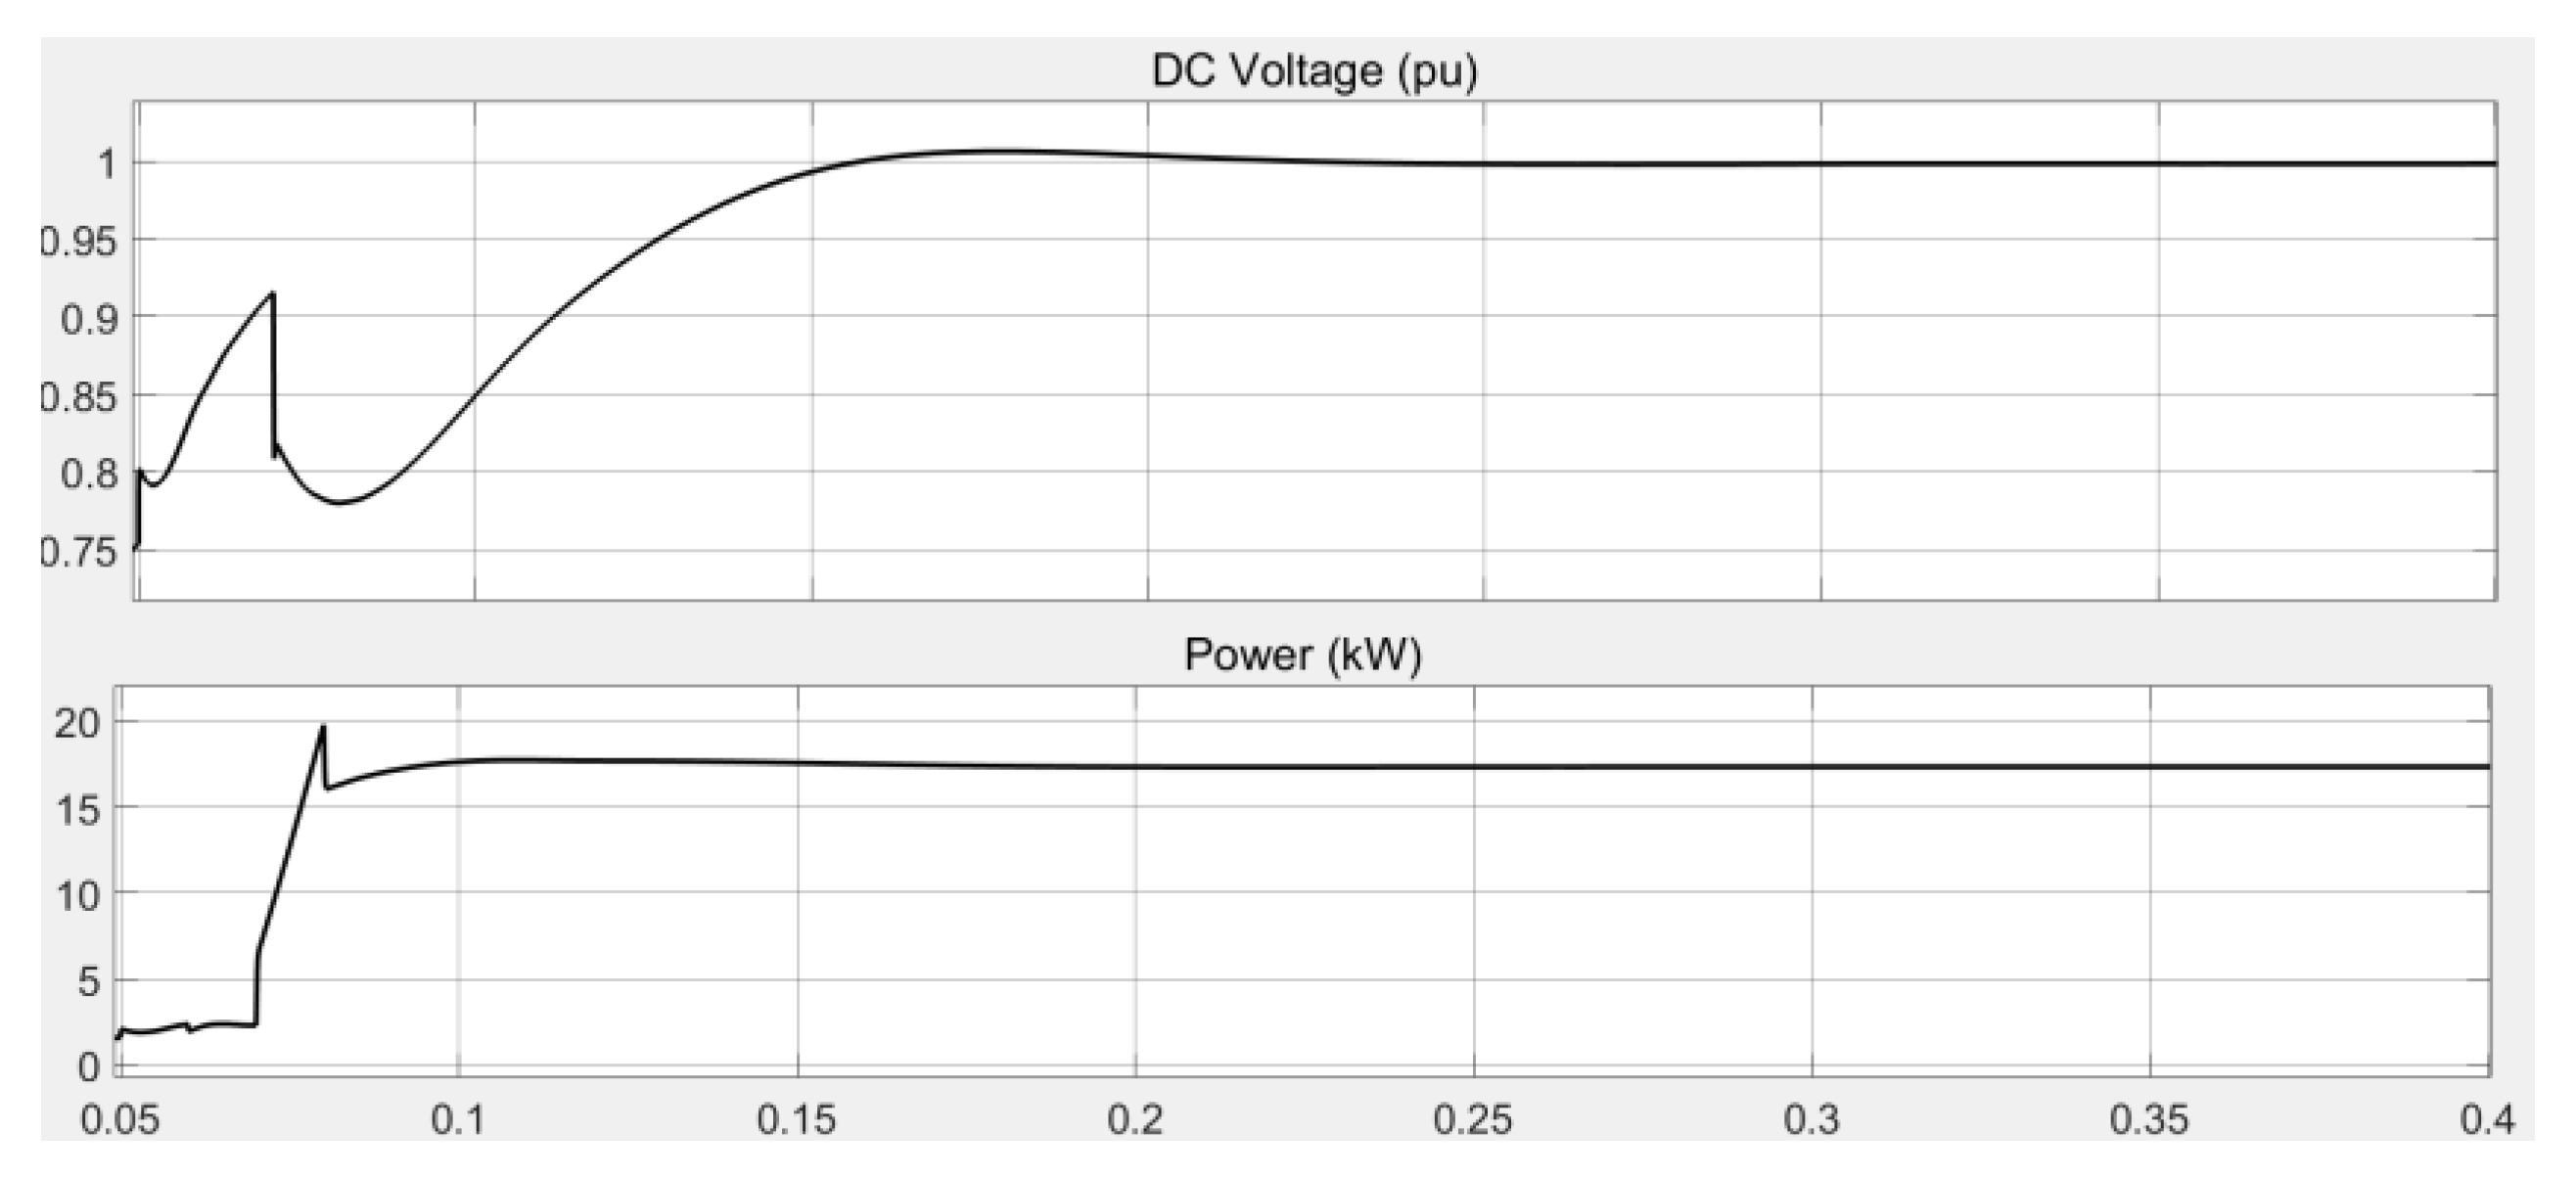
In the DC microgrid, both the main bus voltage and the power output of the generation systems have very small oscillations. Considering that the oscillation of the main bus voltage is within 5%, the DC loads can still work in the normal condition in most cases.
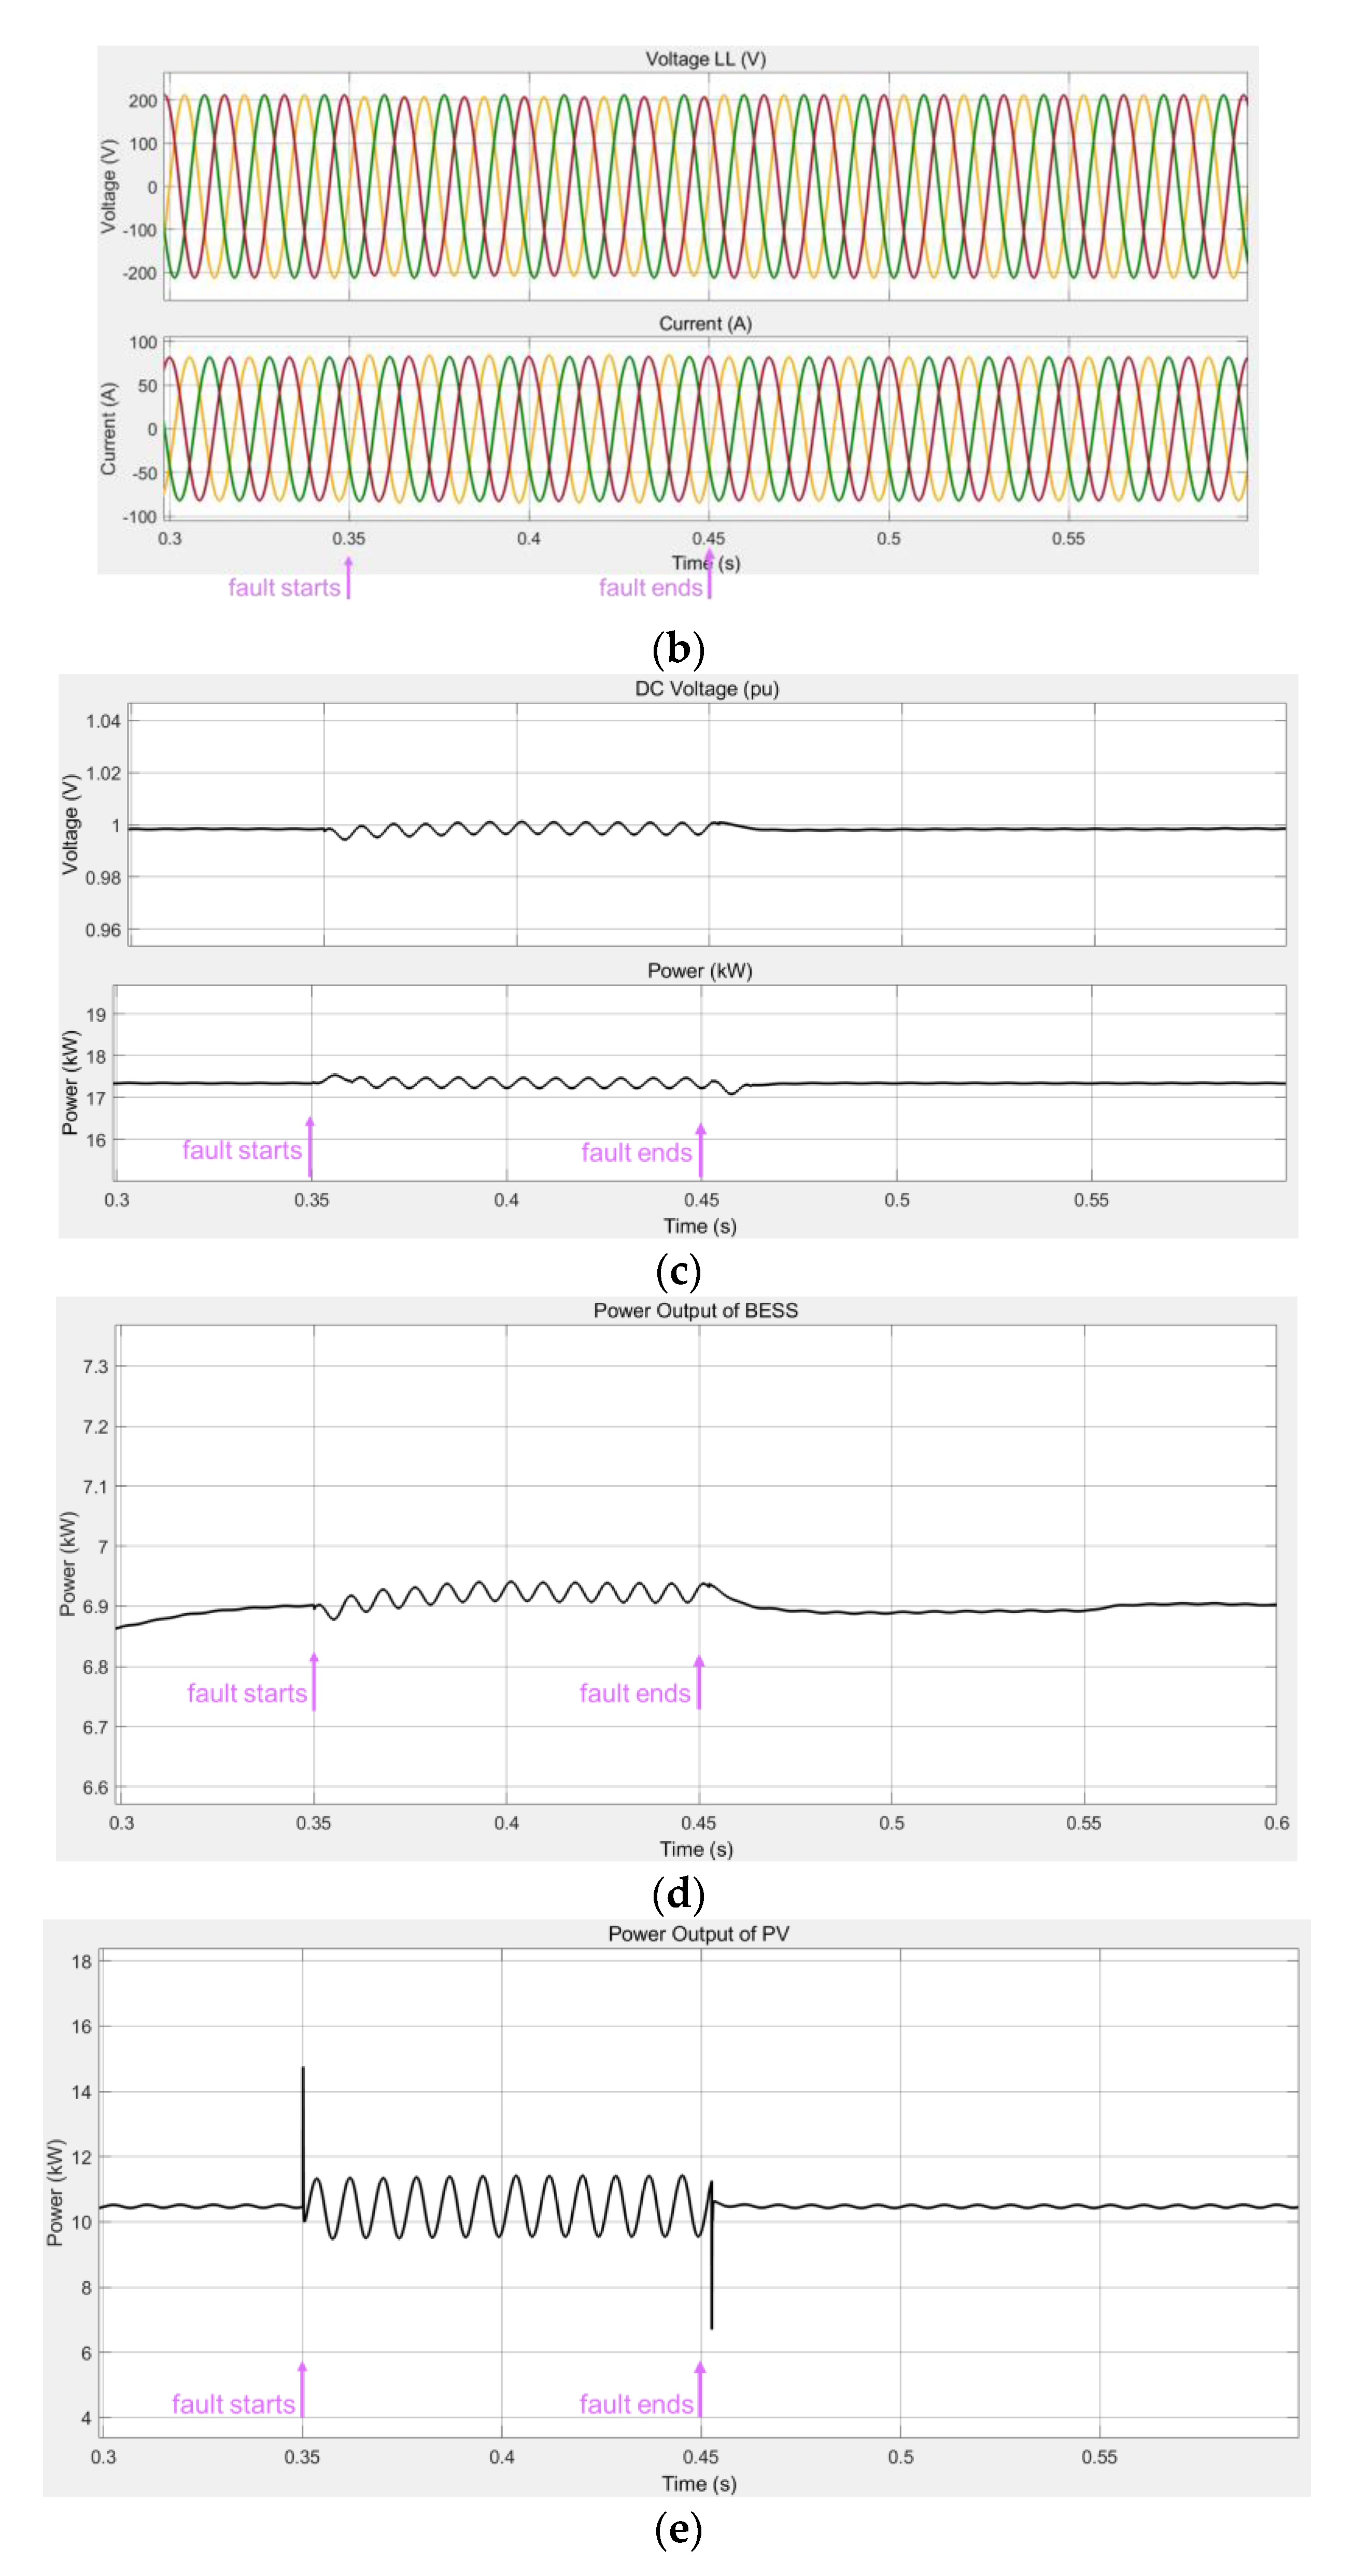
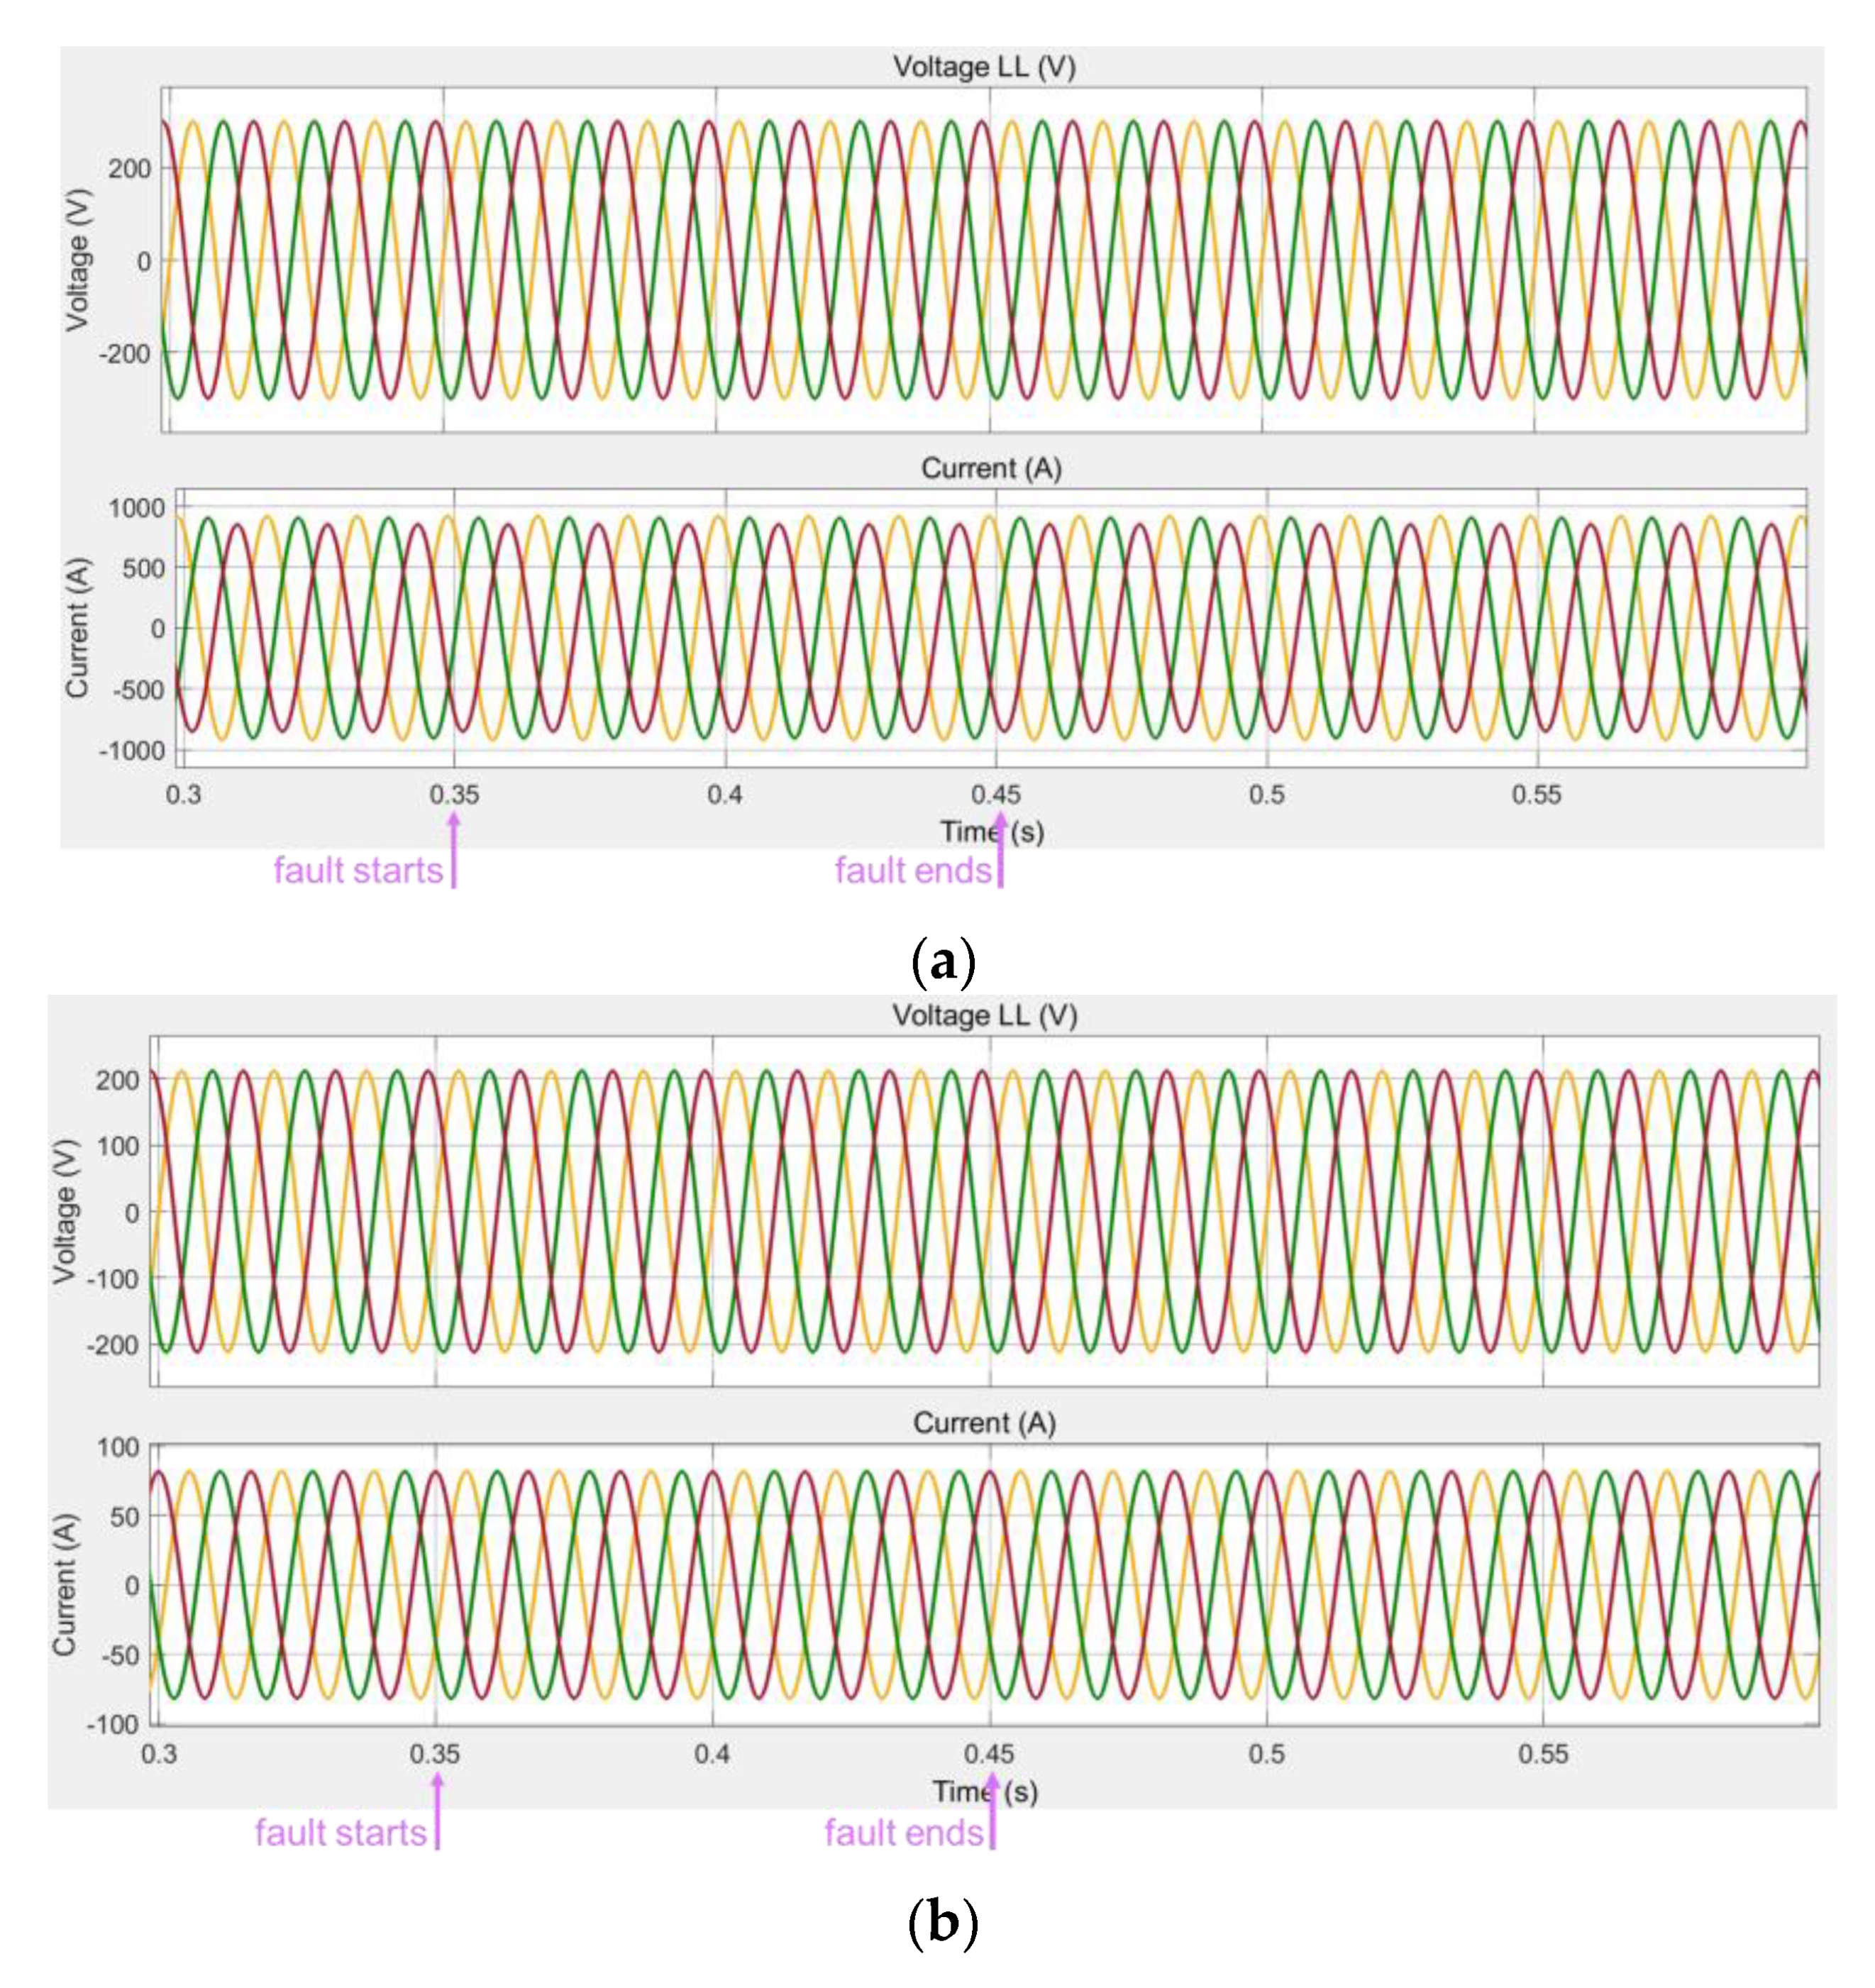
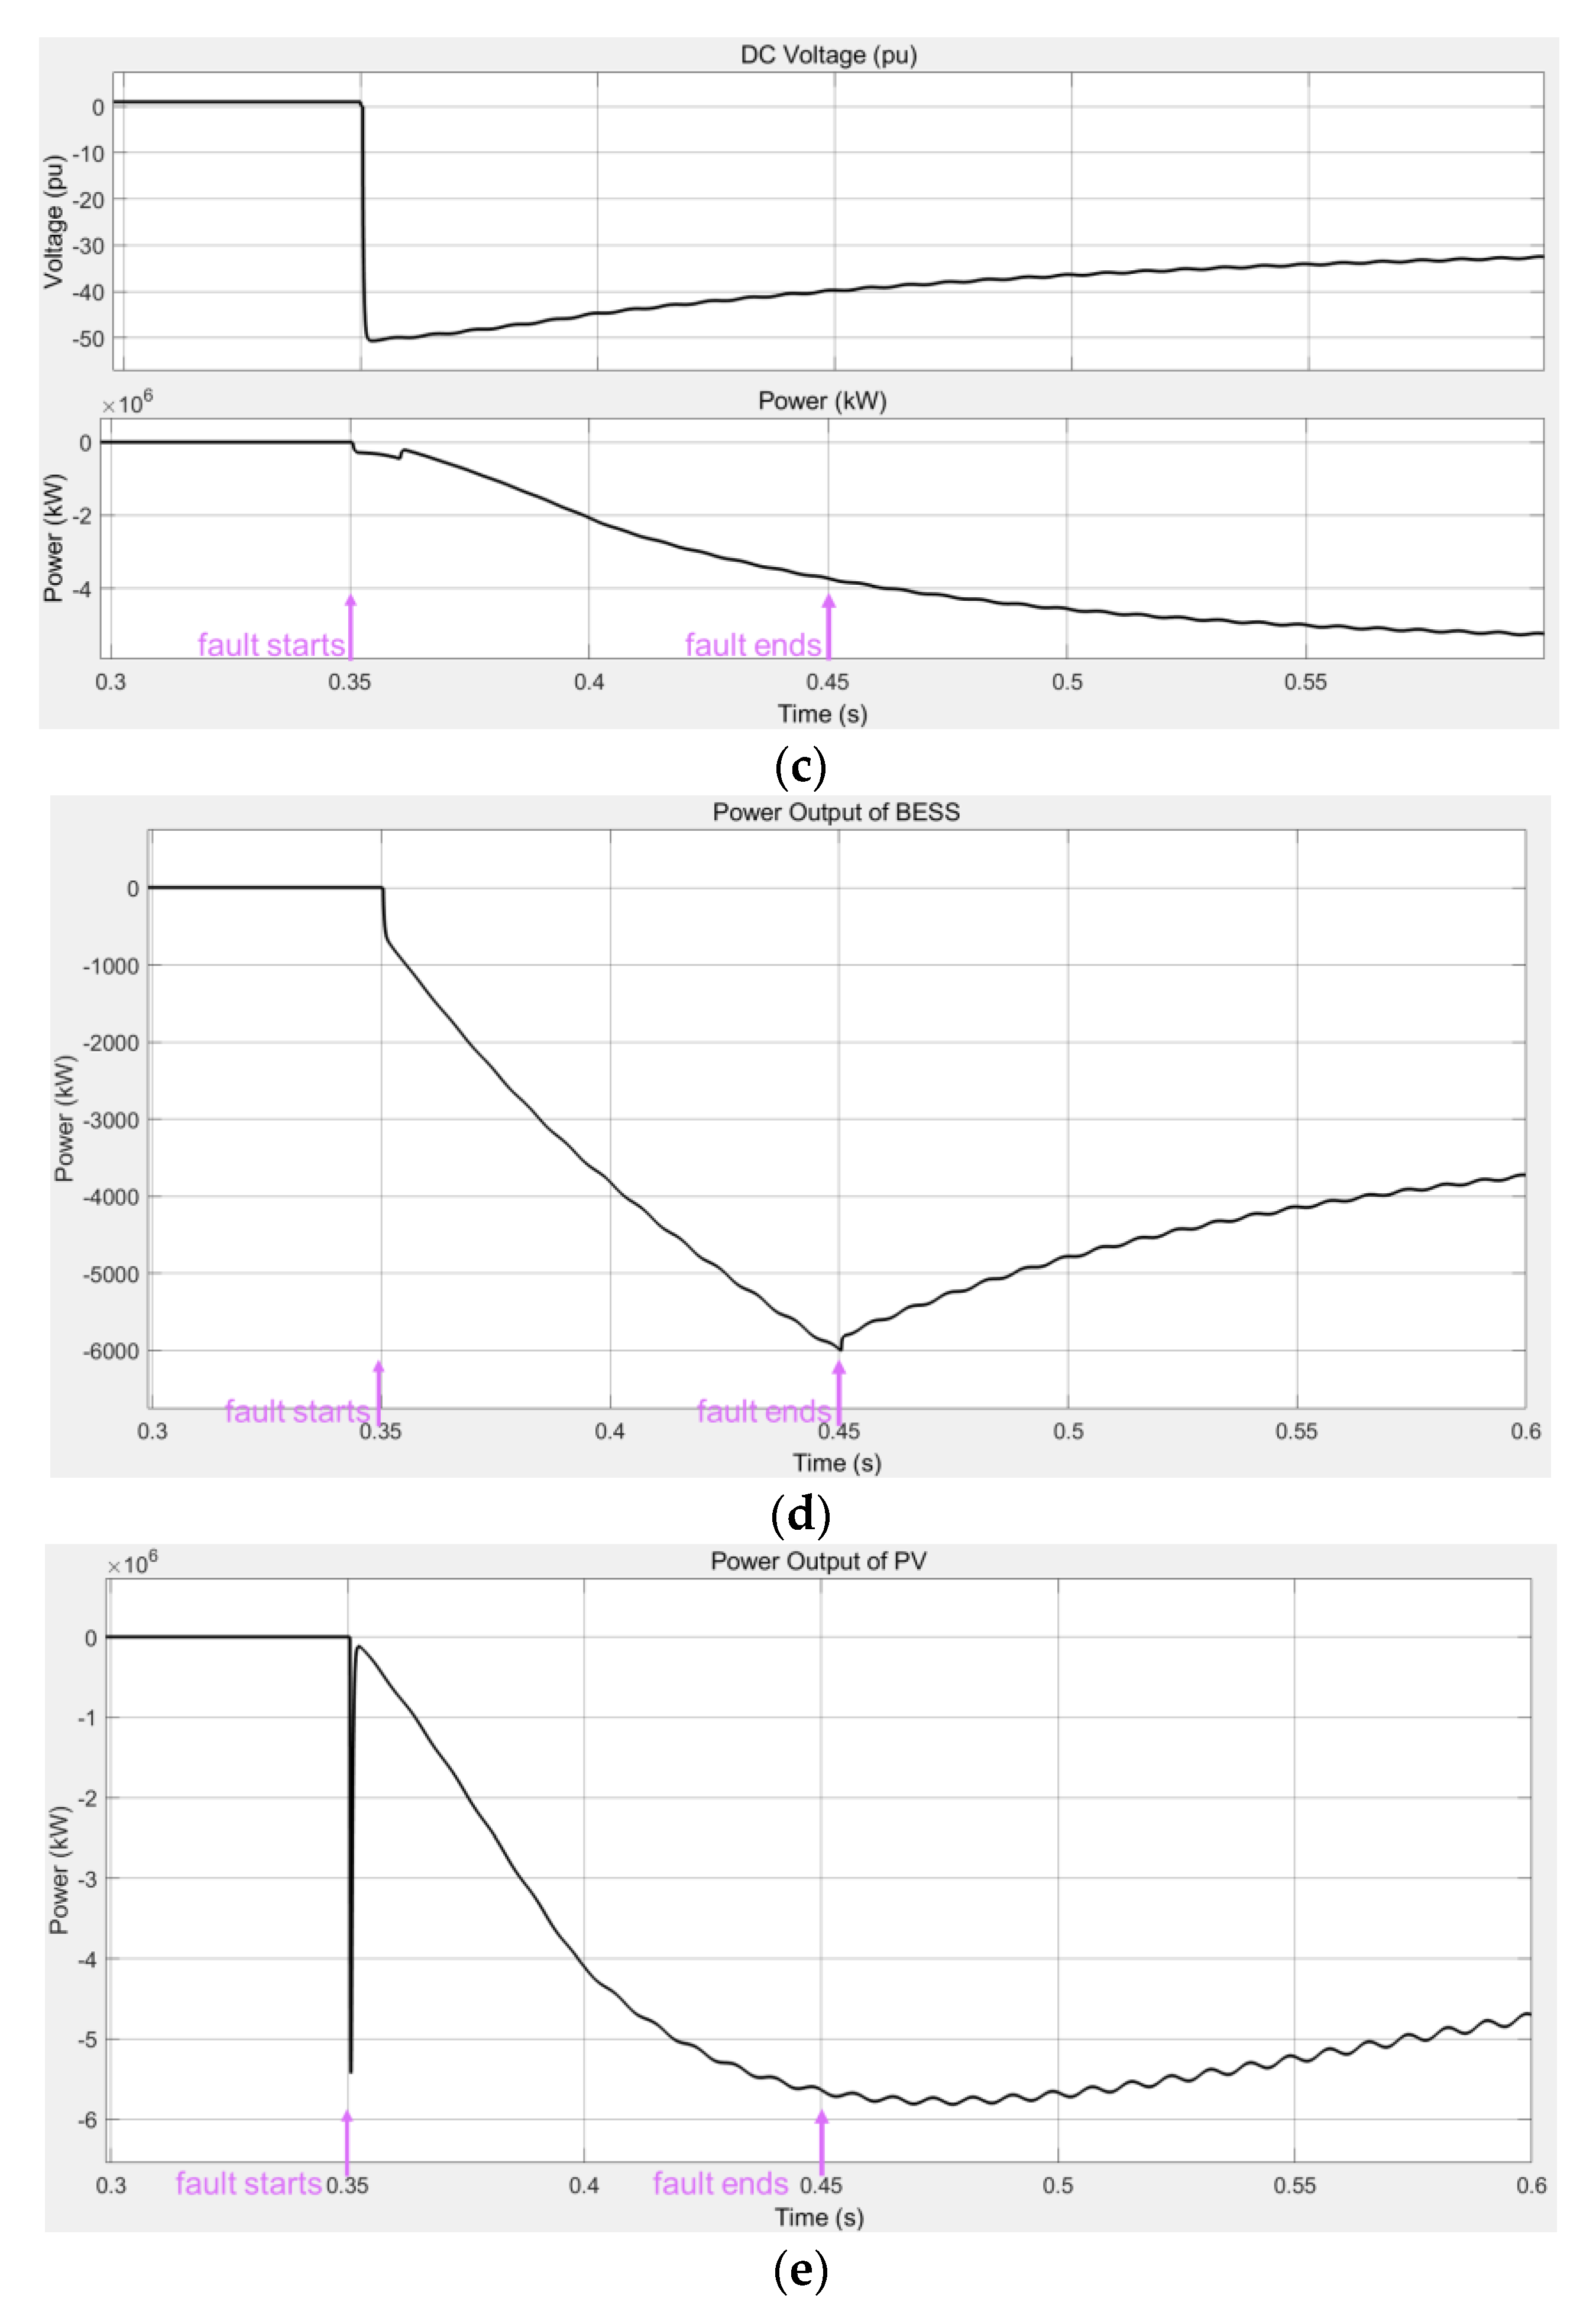
Second, we consider a phase-to-phase short circuit fault (suppose a phase-A-to-phase-B short circuit). Suppose the fault happened at the intersection between Line 5 and Line 6 during t = 0.35~0.45 s. The simulation results are shown in Figure 10.
It can be concluded from the simulation result that:
(1)
In the AC microgrid, both the voltage and the current have observable fault components. However, unlike the case with a single phase-to-ground fault, the fault current does not show any increase. Therefore, some devices on the AC side possibly still work as in the normal condition if the fault does not last long, but it may bring challenges to fault detection.
(2)
Both the voltage and the current of the AC/DC interfacing inverter become distorted. The fault current shows sharp spikes.
(3)
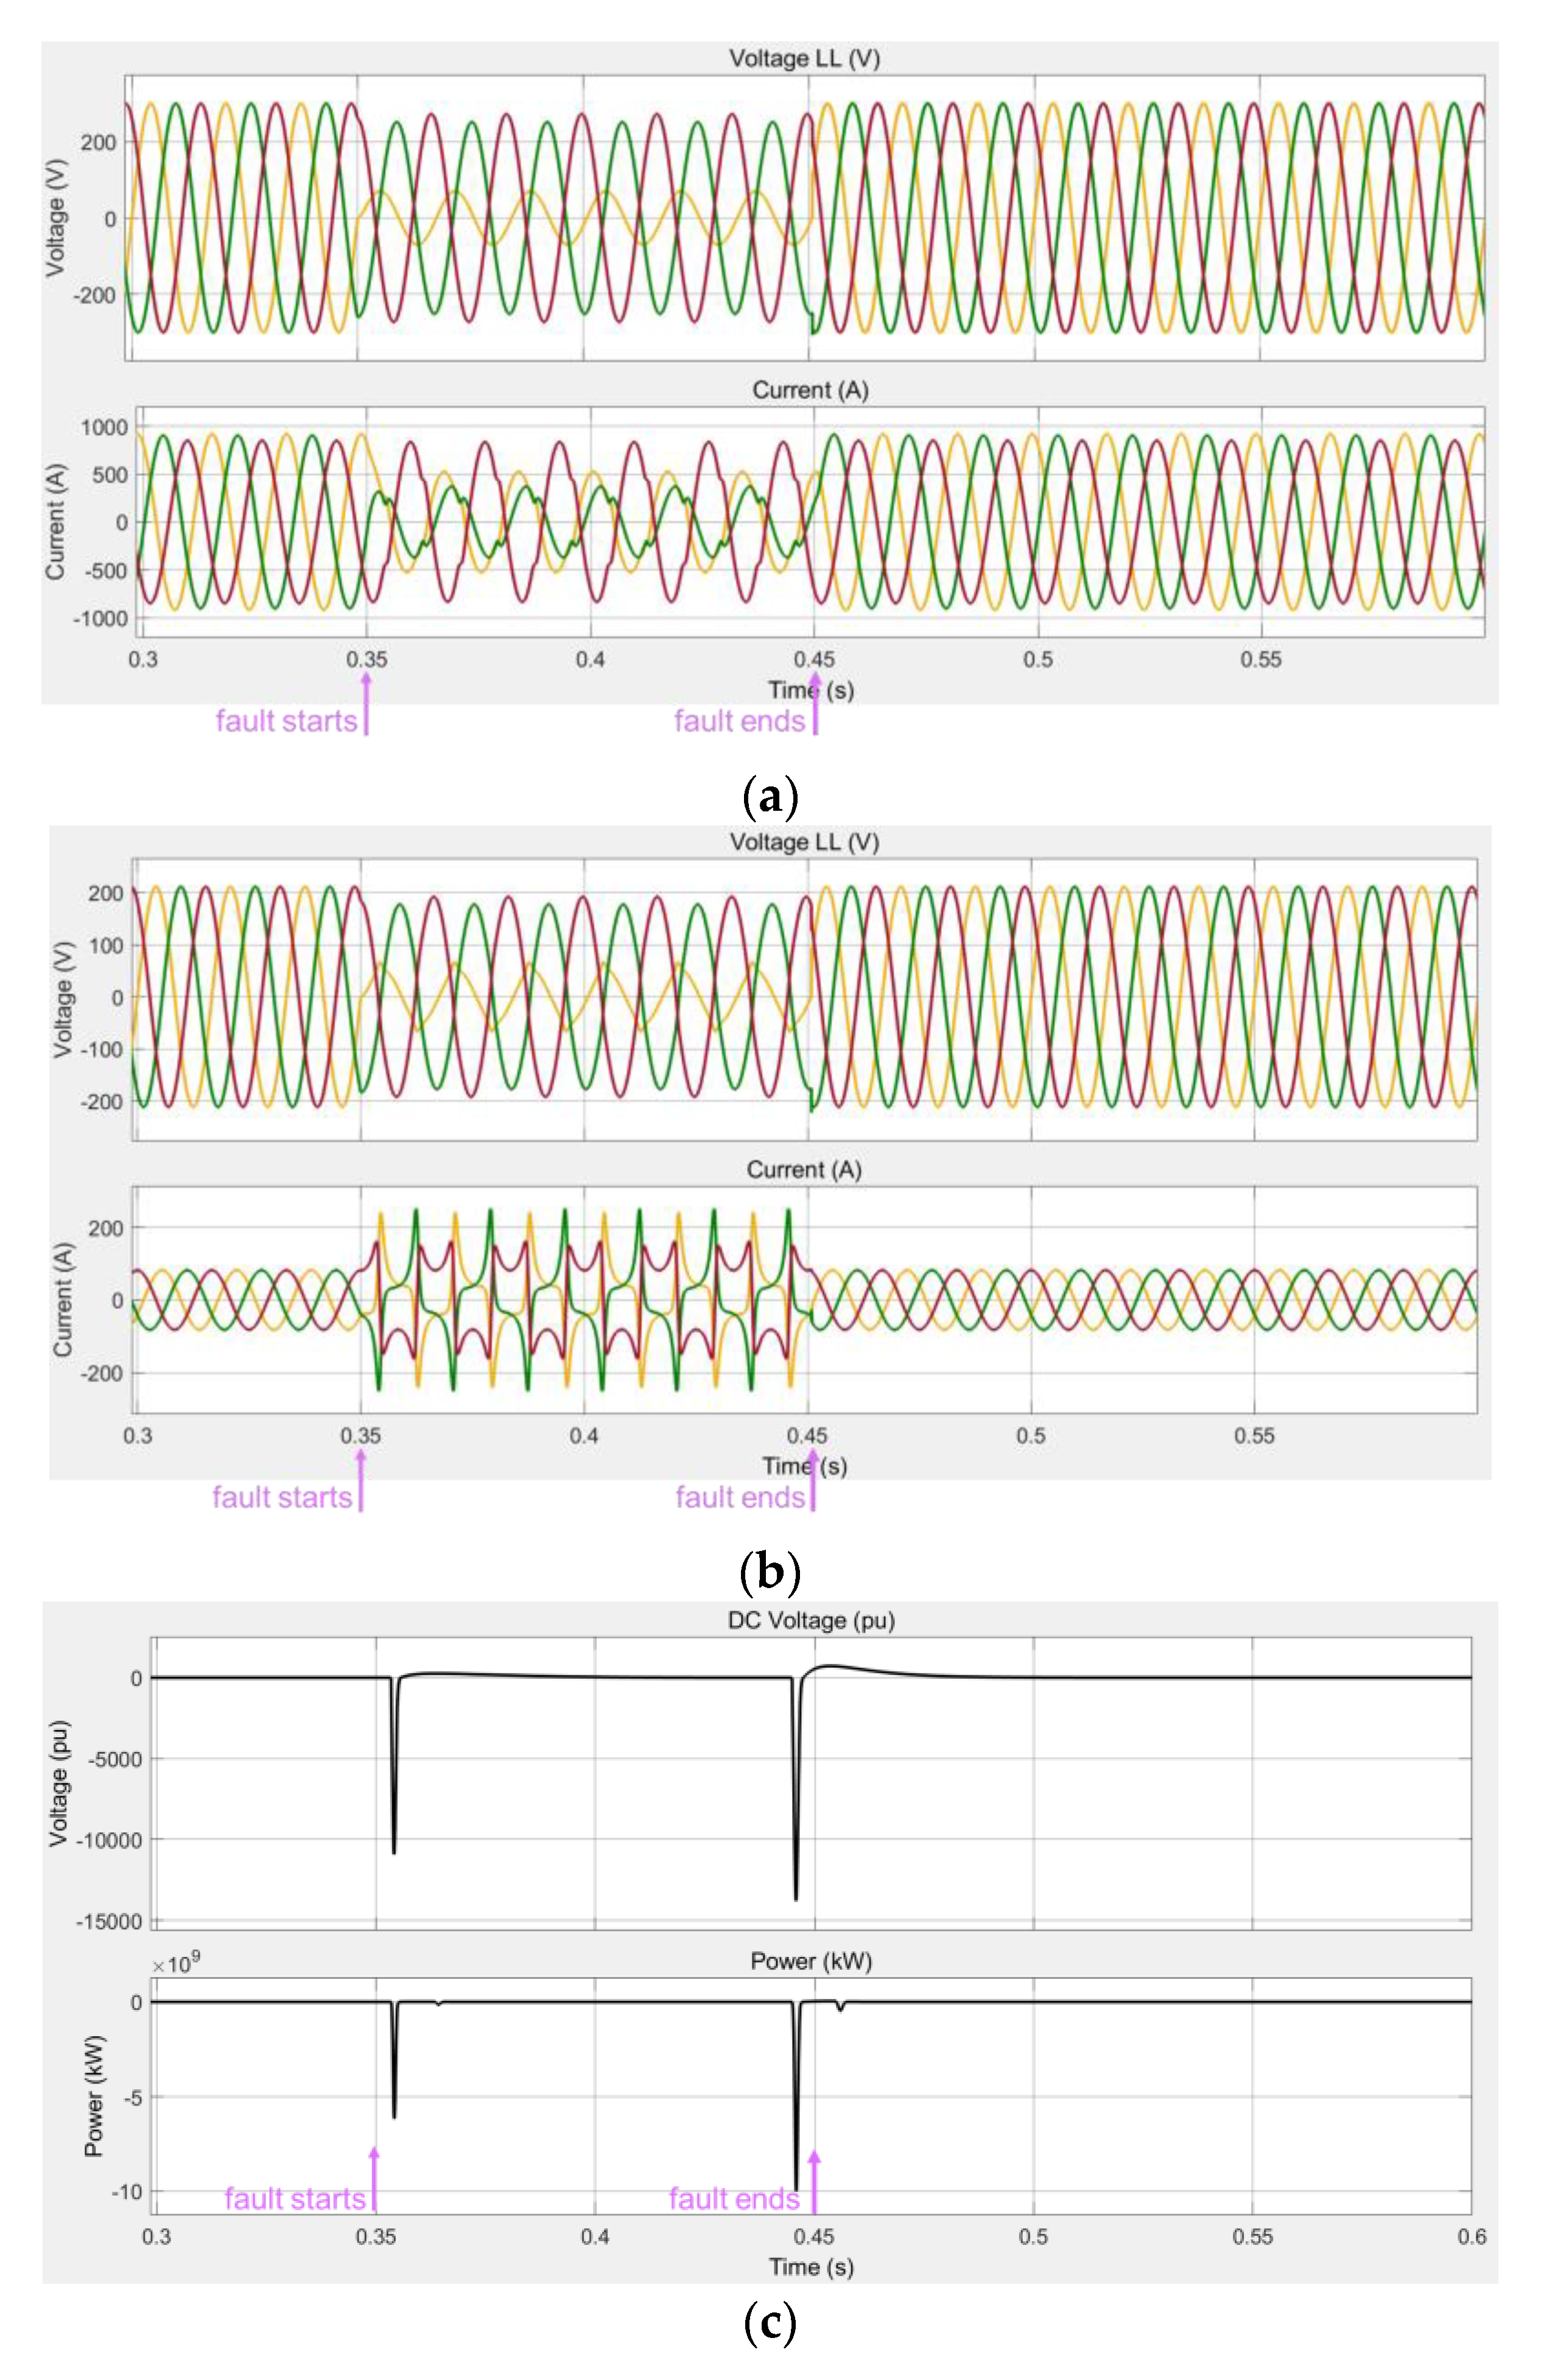
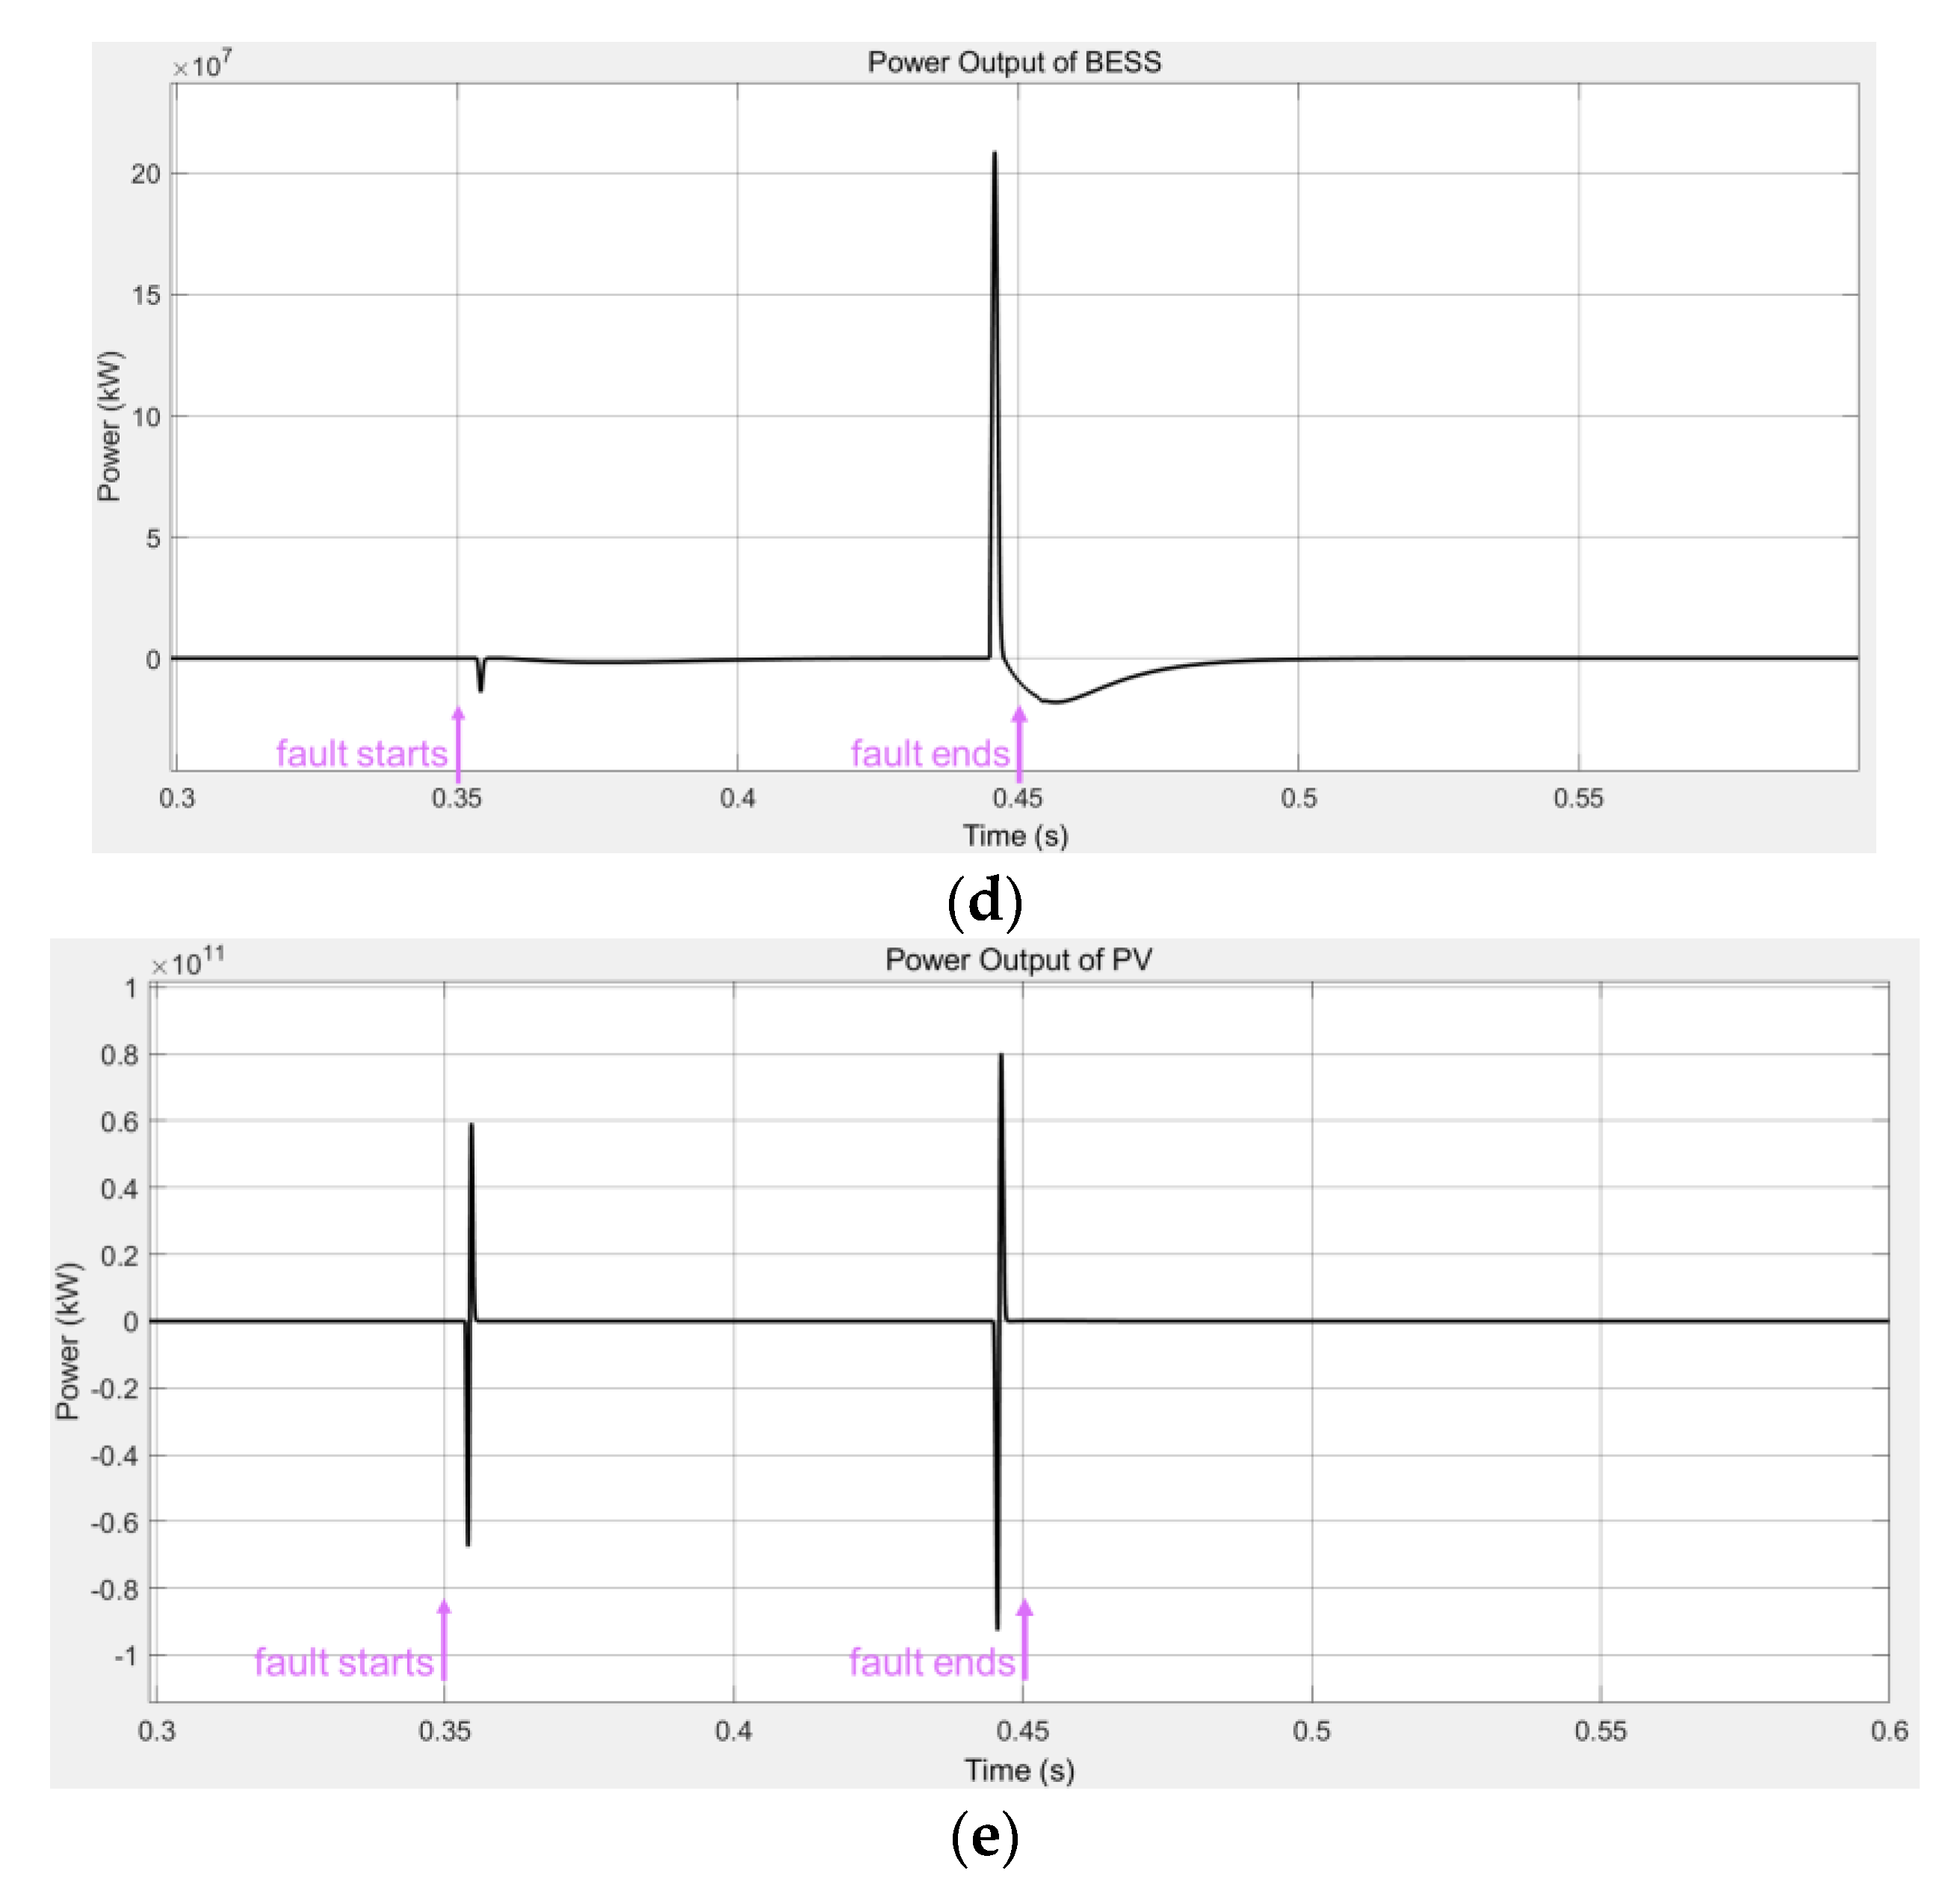
In the DC microgrid, both the main bus voltage and the power output of the generation systems have tremendous spikes, which could destroy the whole power grid. A fault protection scheme specialized for the DC microgrid is required.
In addition, the effects of a double phase-to-ground fault are similar to a phase-to-phase fault, so we skip the detailed simulation results here. Besides, the three-phase fault is destructive to the whole hybrid microgrid; the software simulation terminates less than 0.001 s after the fault occurs due to the fast blowing up of the power output of the DC-side generations.

3.1.2. The Effects of a DC-Side Fault on the Stability of the AC Side

This part presents the effects of a DC-side fault on the stability of the AC side. The common faults that happen to the DC microgrid include line disconnection and short circuit faults.
First, we suppose that a line disconnection fault happened to the main bus on the DC side during t = 0.35 s~0.6 s. The simulation results are shown in Figure 11.
It is noticed that the line disconnection fault does not result in observable damages to either the AC microgrid or the DC microgrid. In fact, the effects of a line disconnection fault depend highly on the location where the fault happens. It can be investigated further in a hybrid microgrid in which the DC side has a more complicated topology.
Second, we consider a ground fault that happened to the main bus on the DC side during t = 0.35 s~0.45 s. The simulation results are shown in Figure 12.
It can be observed that the ground fault has trivial effects on the AC microgrid such that it still works as in the normal condition and that the AC/DC interfacing inverter still works well; however, the fault has a highly detrimental impact on the DC microgrid, where both the bus voltage and the power generation show a sharp spike and large oscillation.
The following table (Table 3) shows the effects of different faults on each side of the AC/DC hybrid microgrid. In this table, we simplify the effects of faults on the microgrid into three levels: normal, faulty, and severe faults. “Normal” means that the related devices could still work in normal operation, “faulty” means that there is a limited faulty component of the related voltage or current, and “severe” means that there is a tremendous oscillation or severe instability. Detailed descriptions of the effects of faults can be obtained in previous paragraphs.

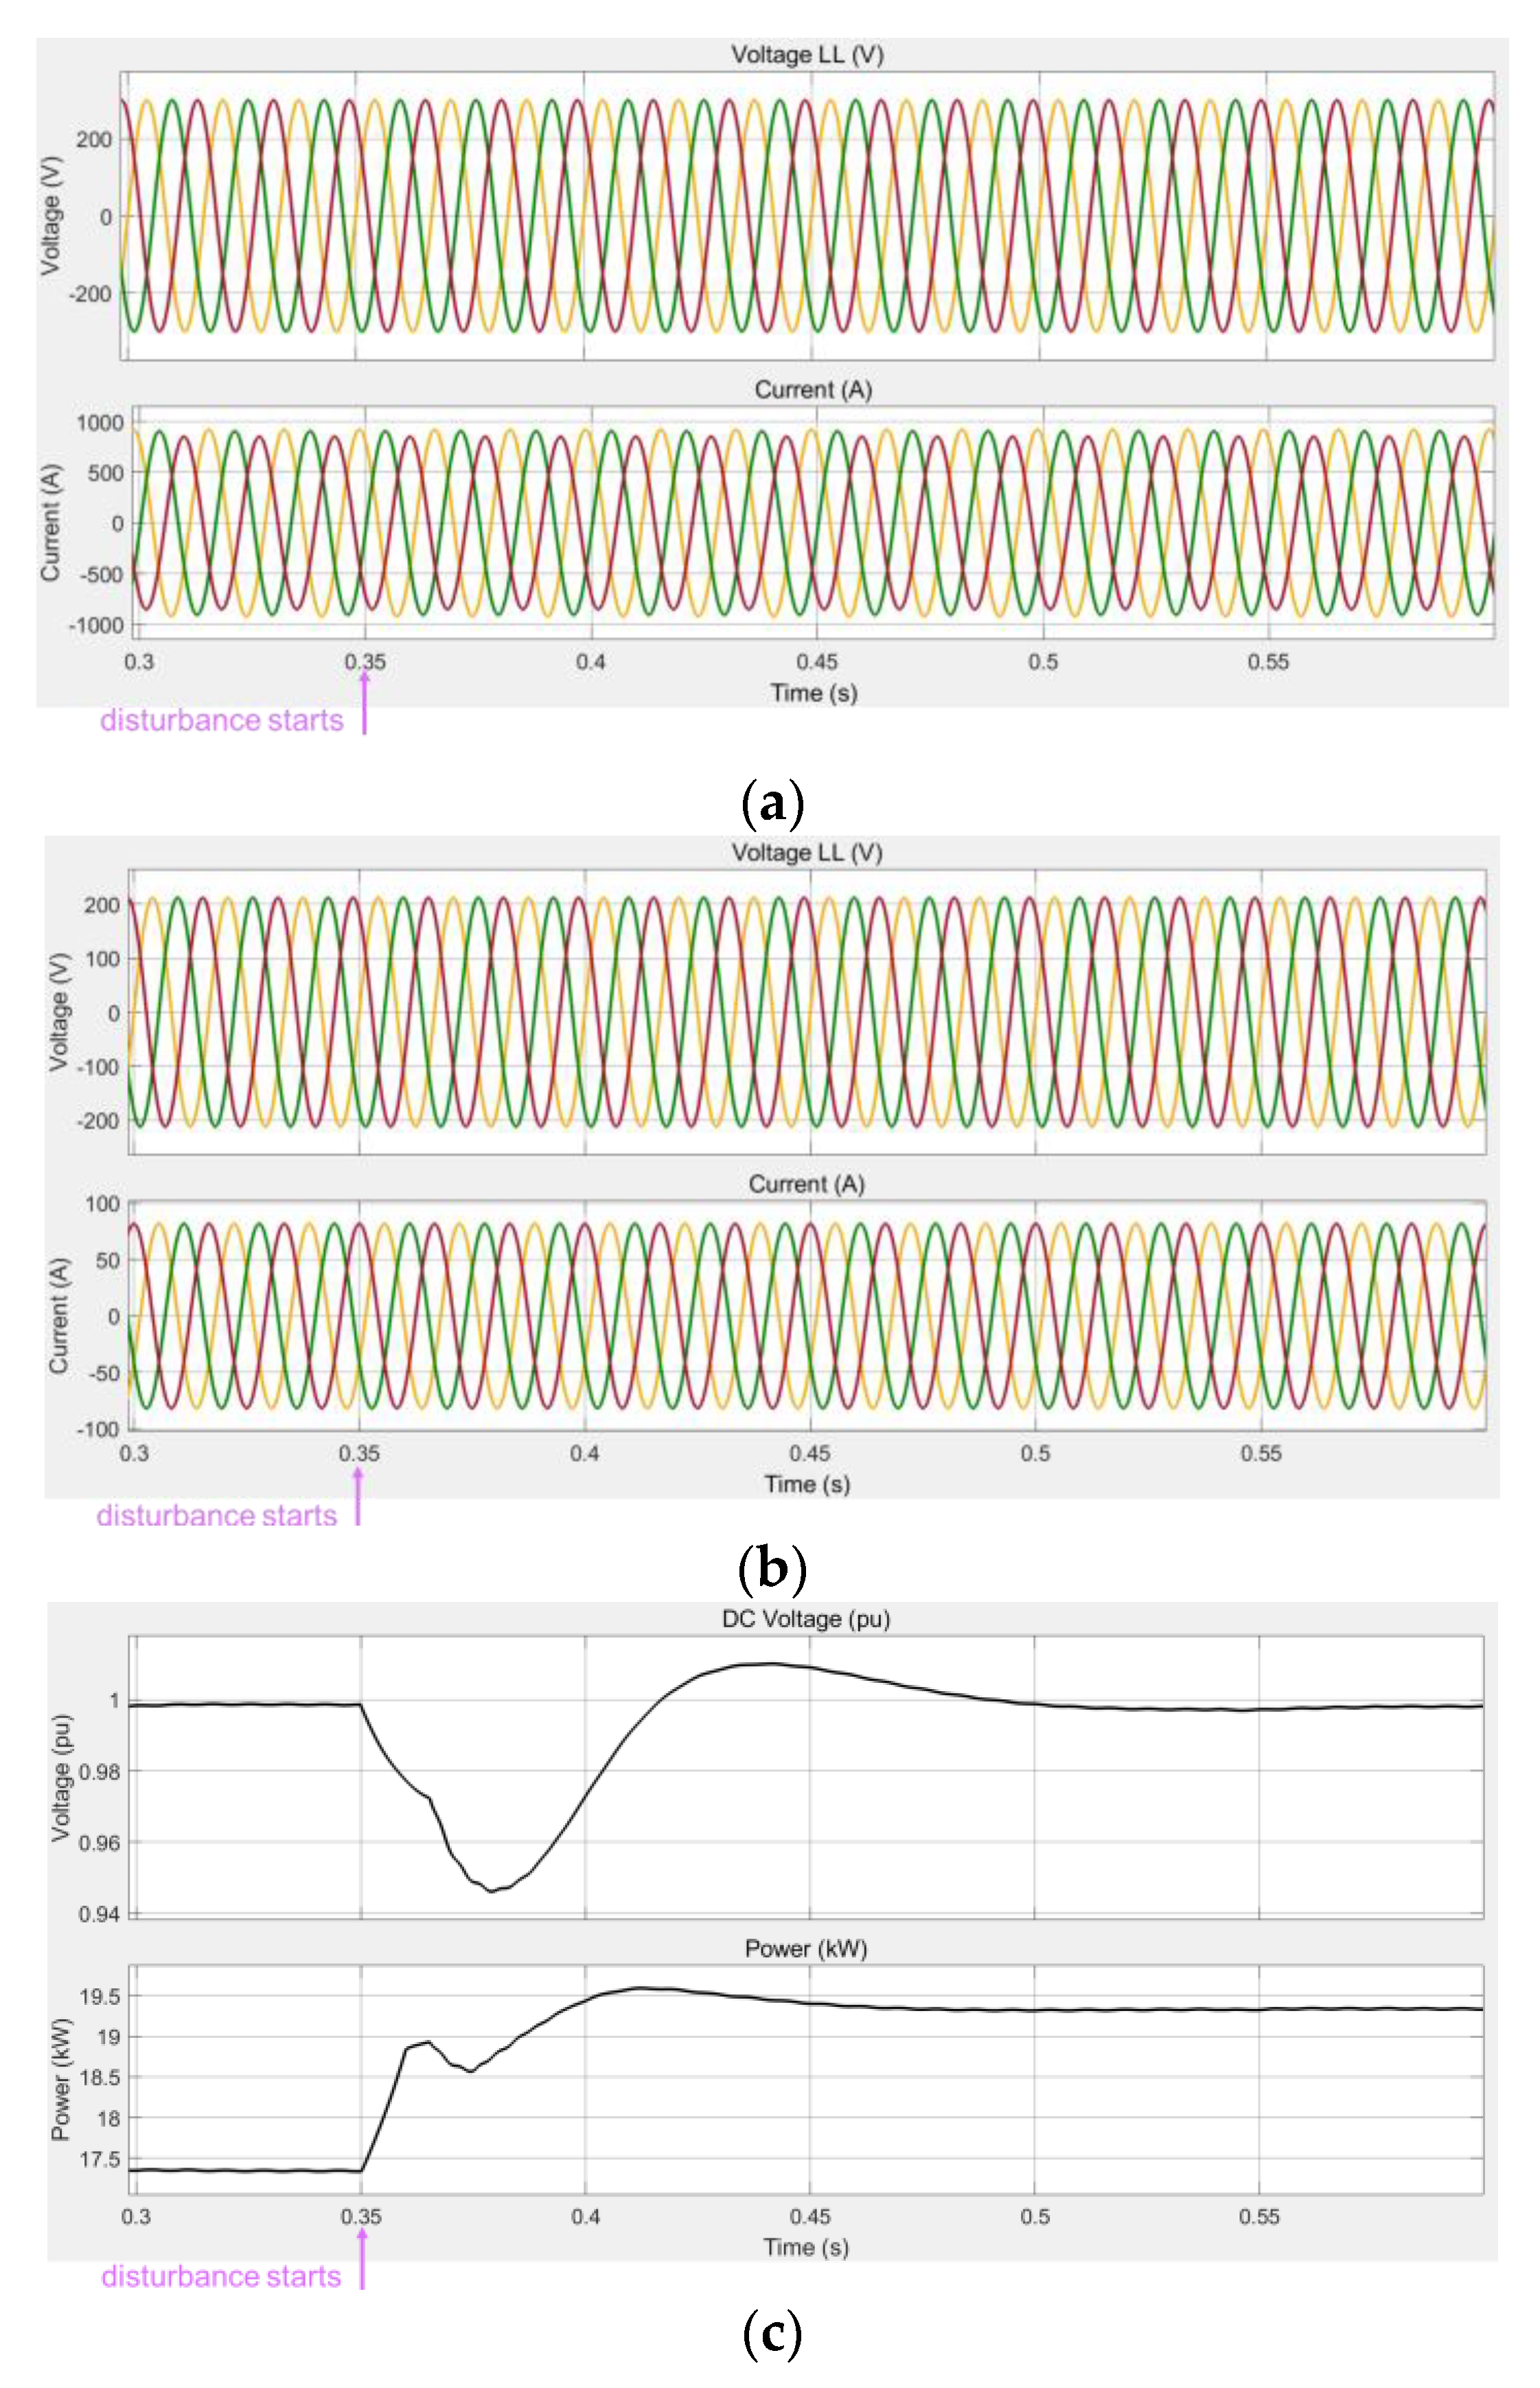
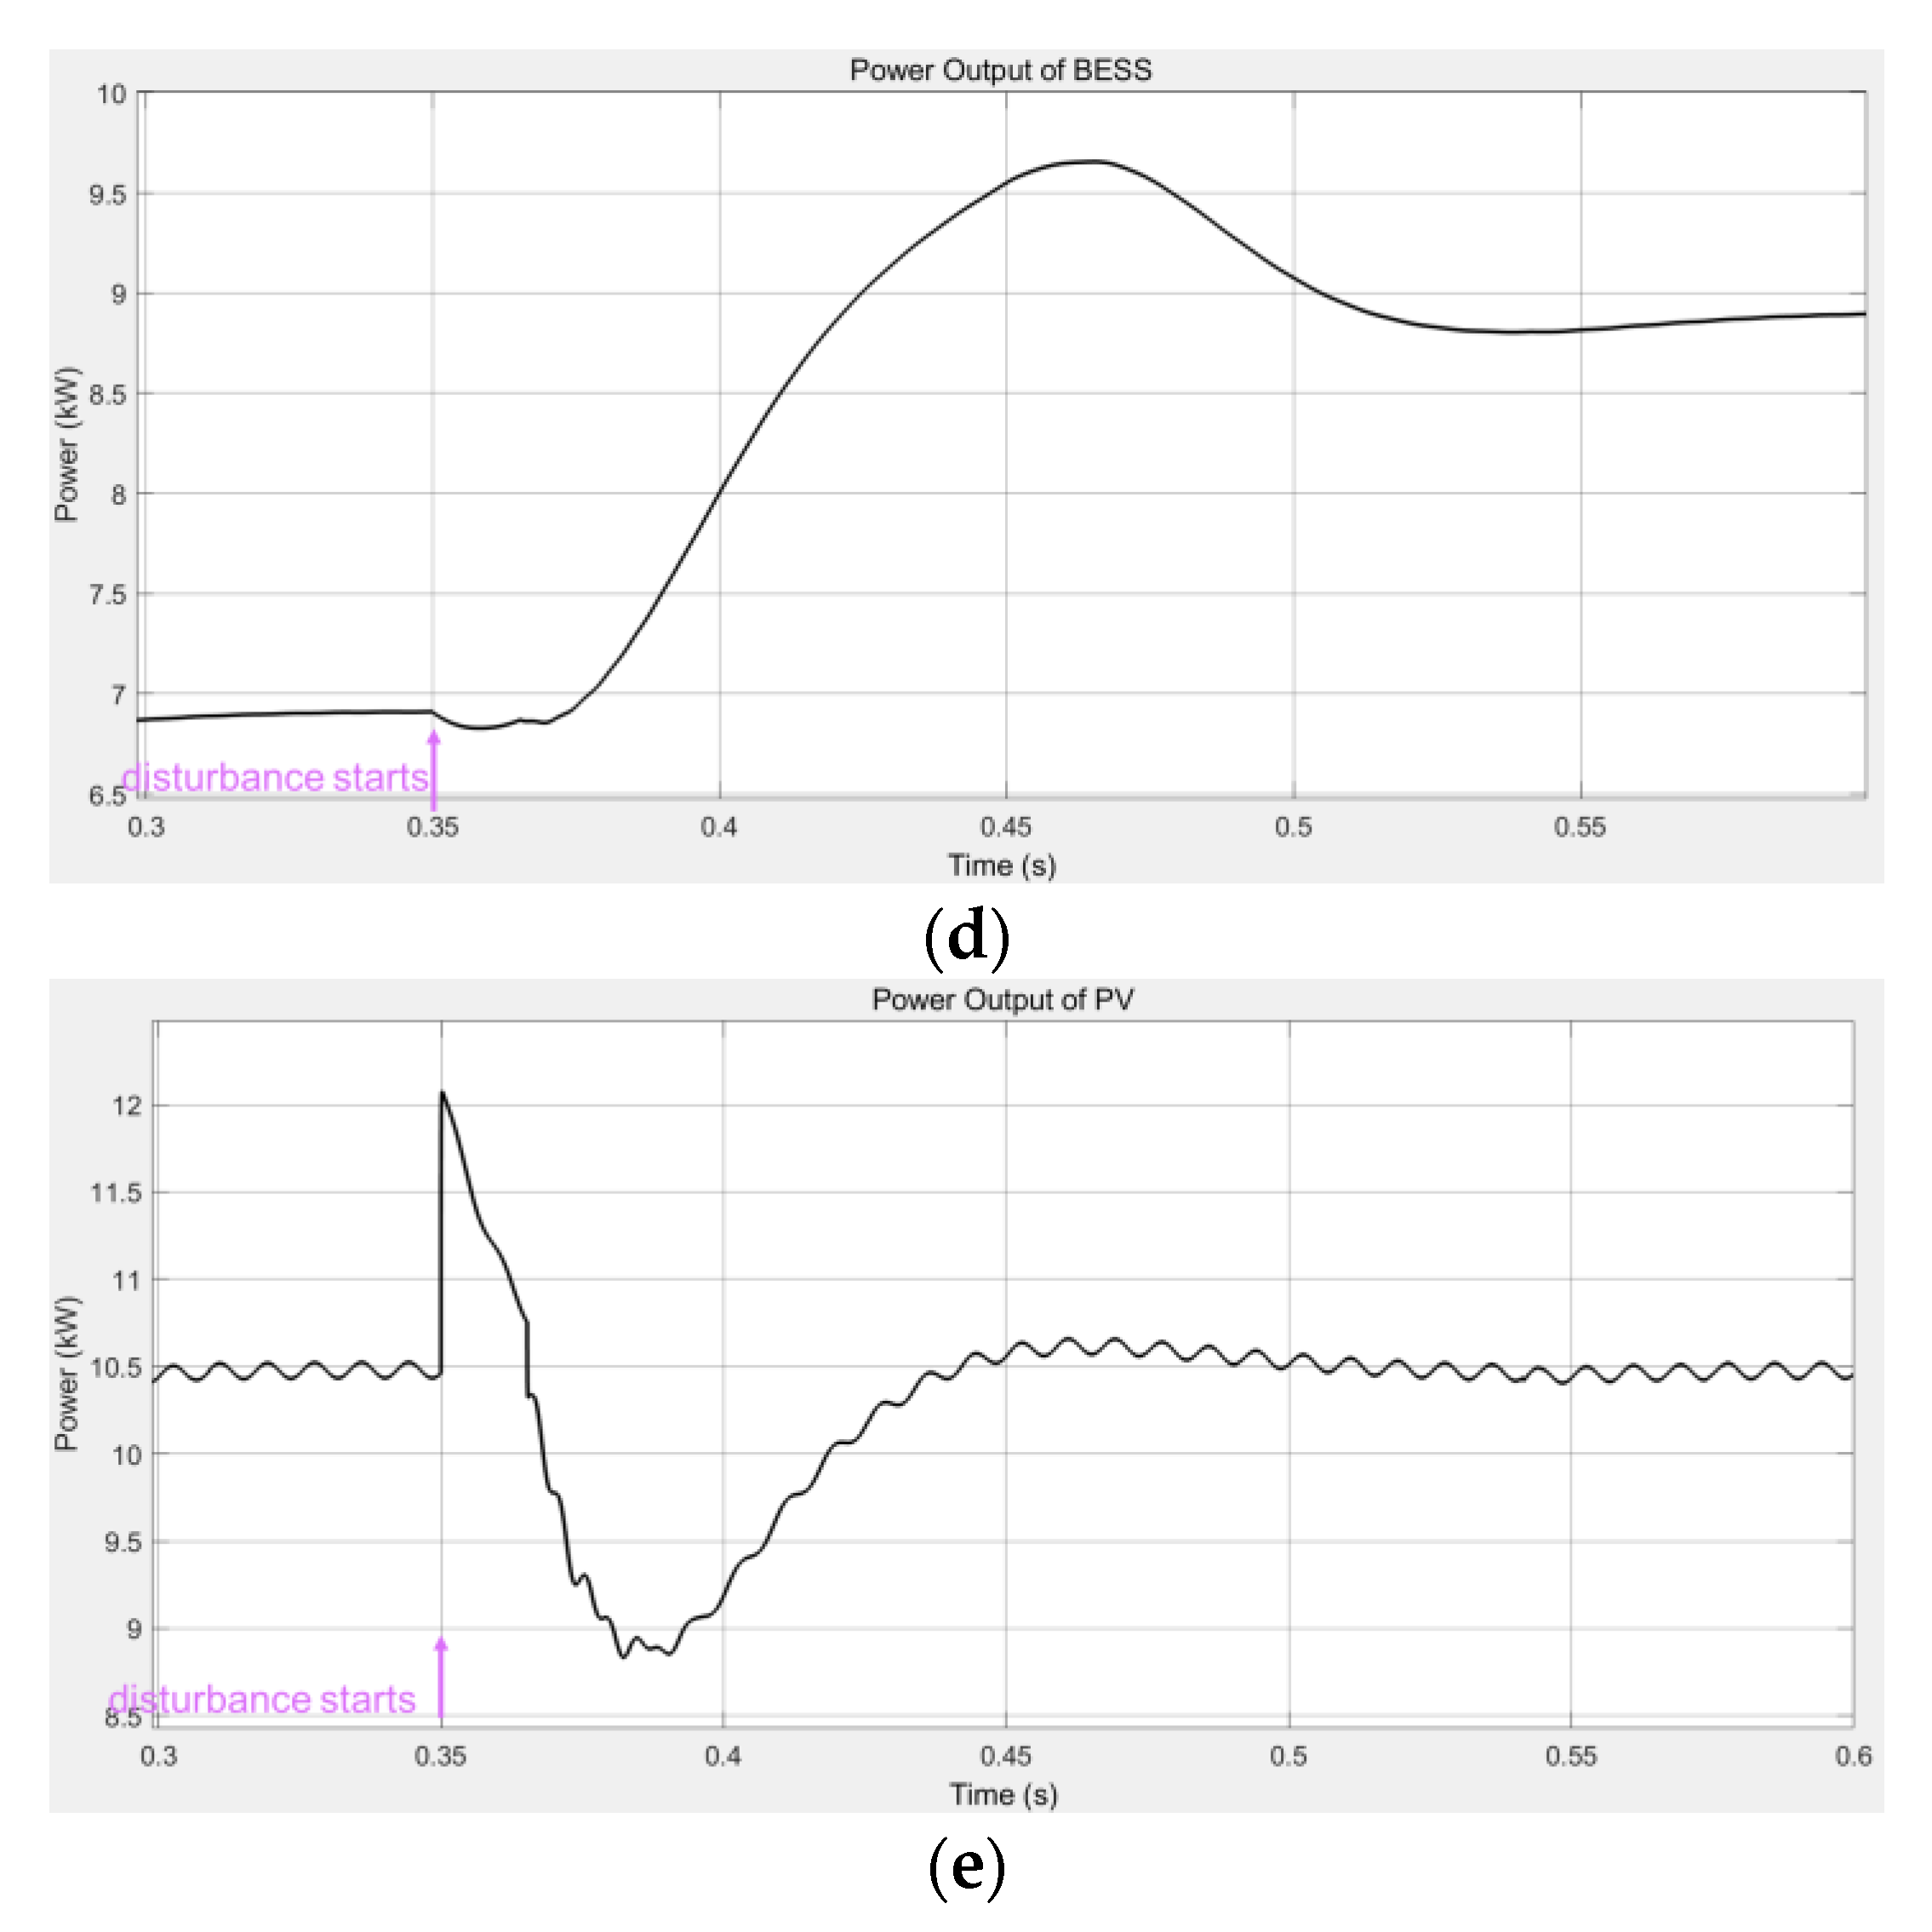
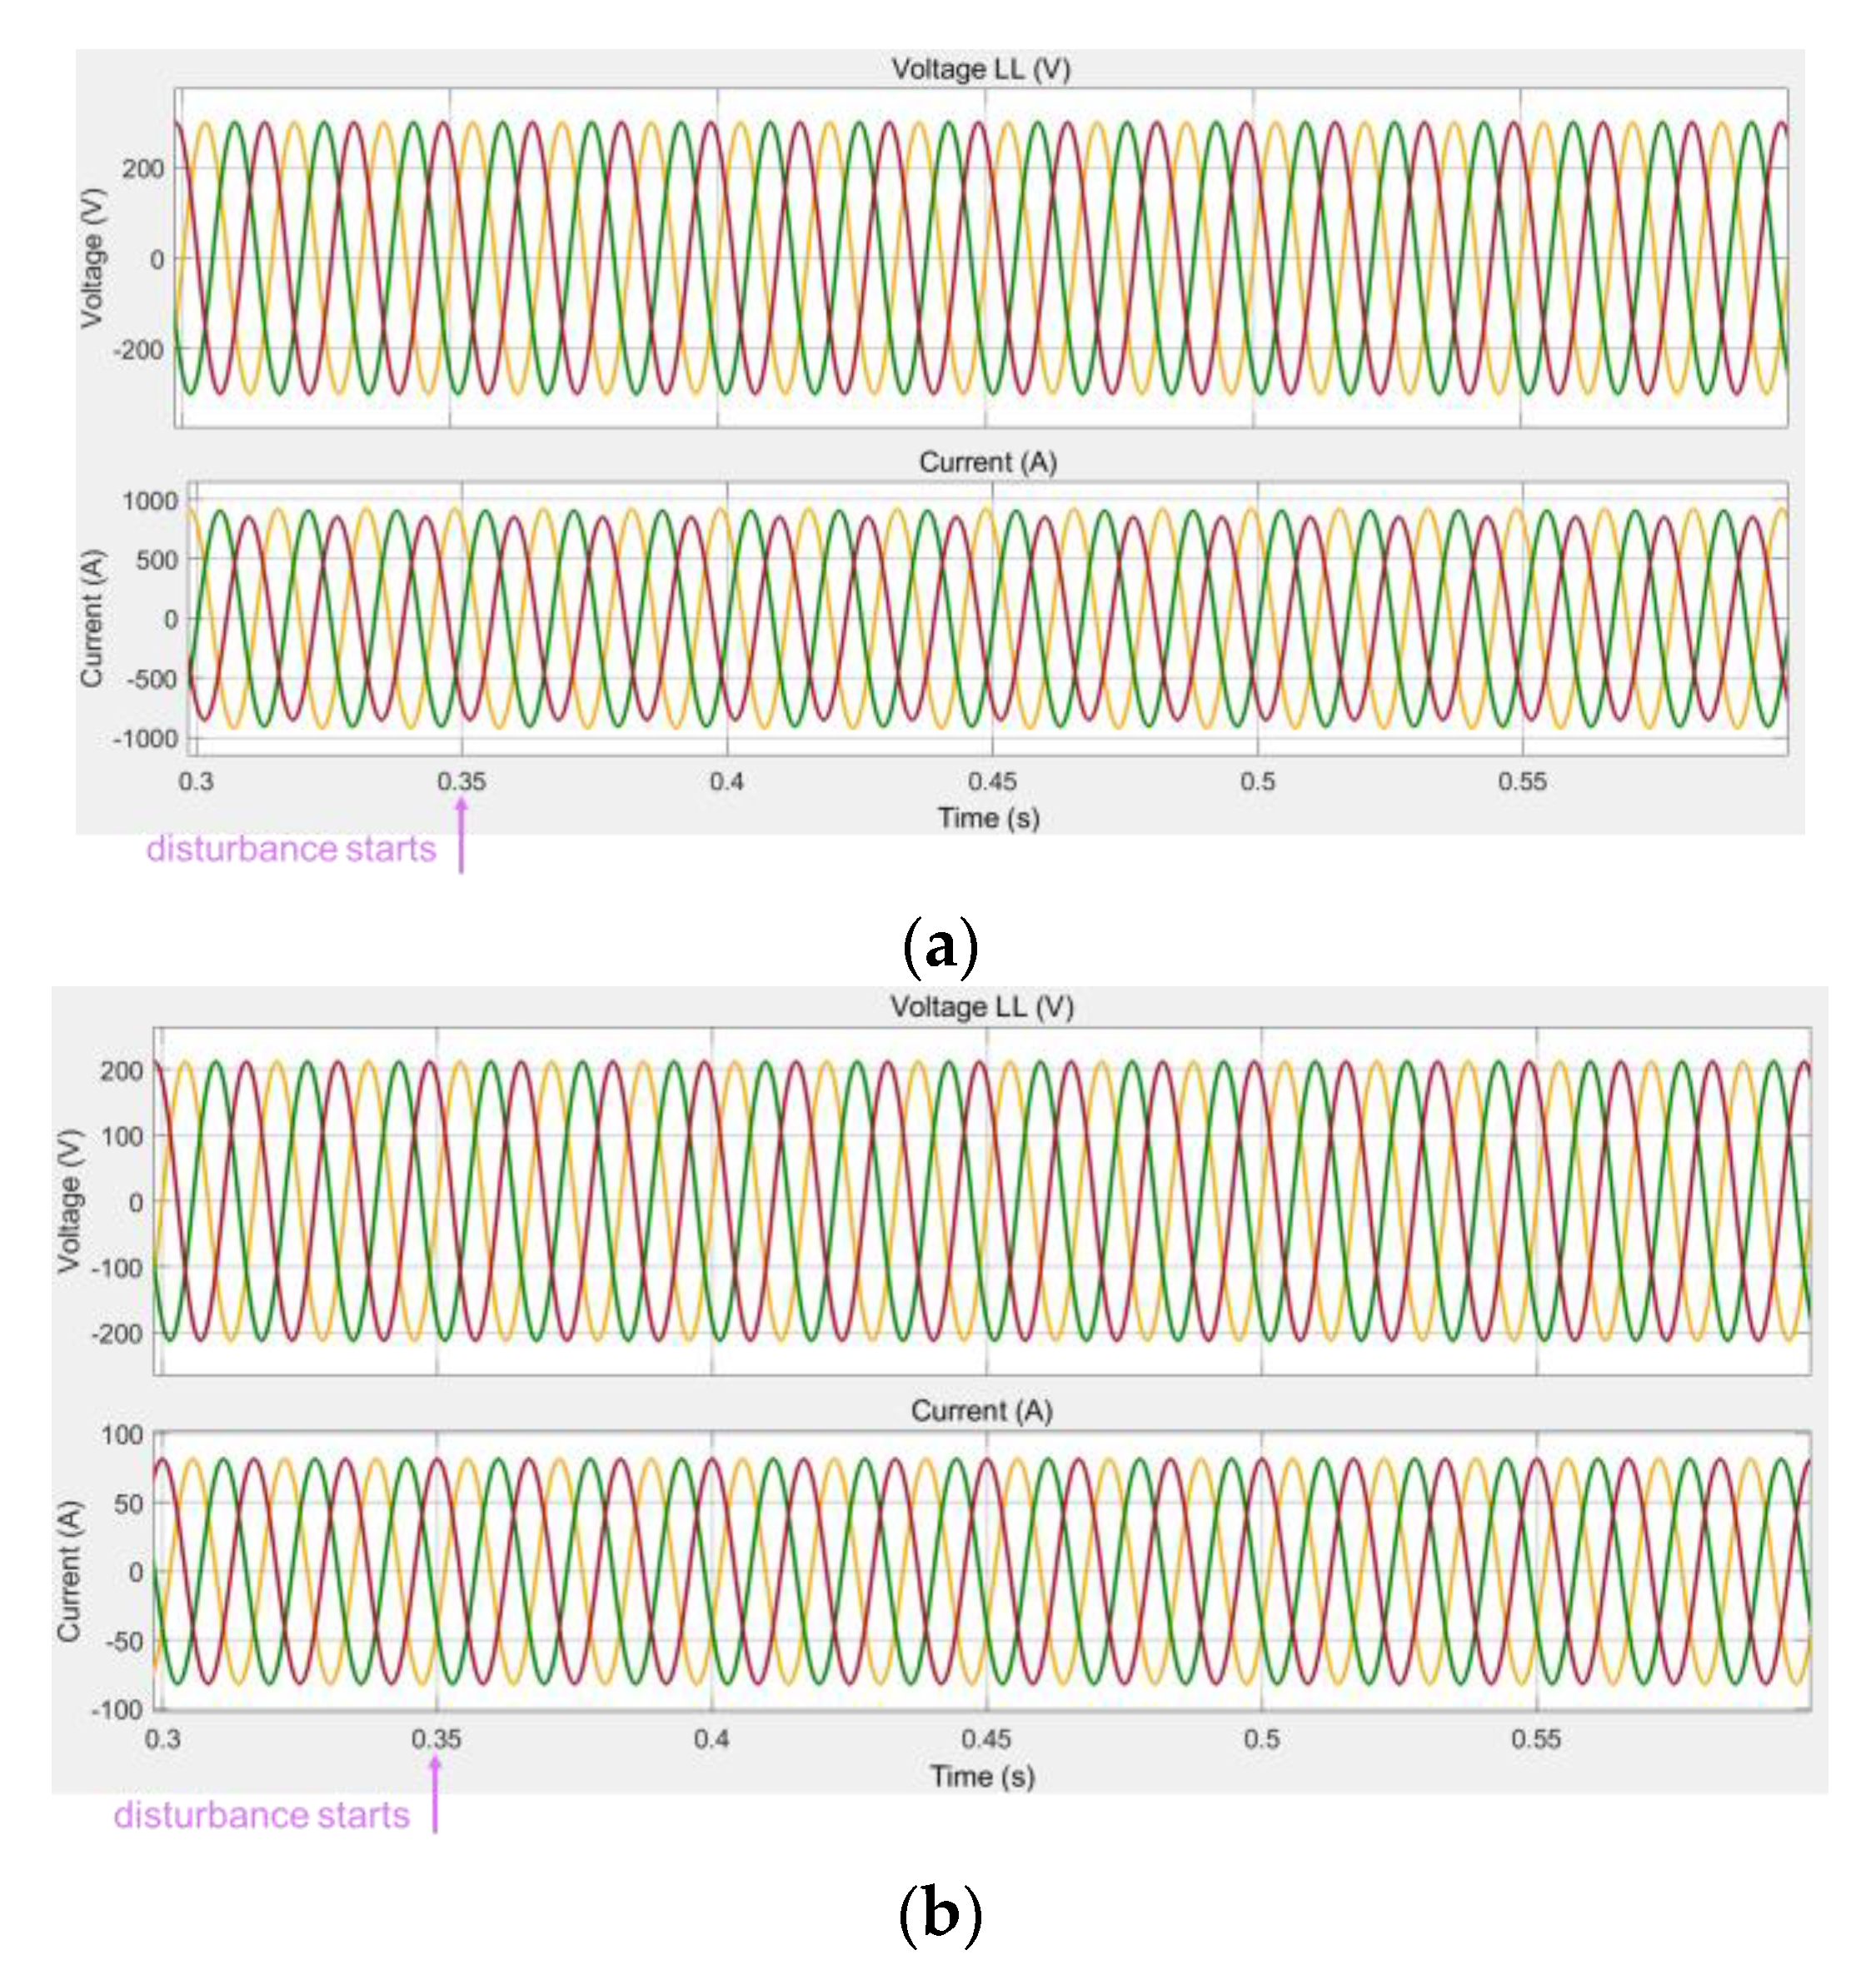
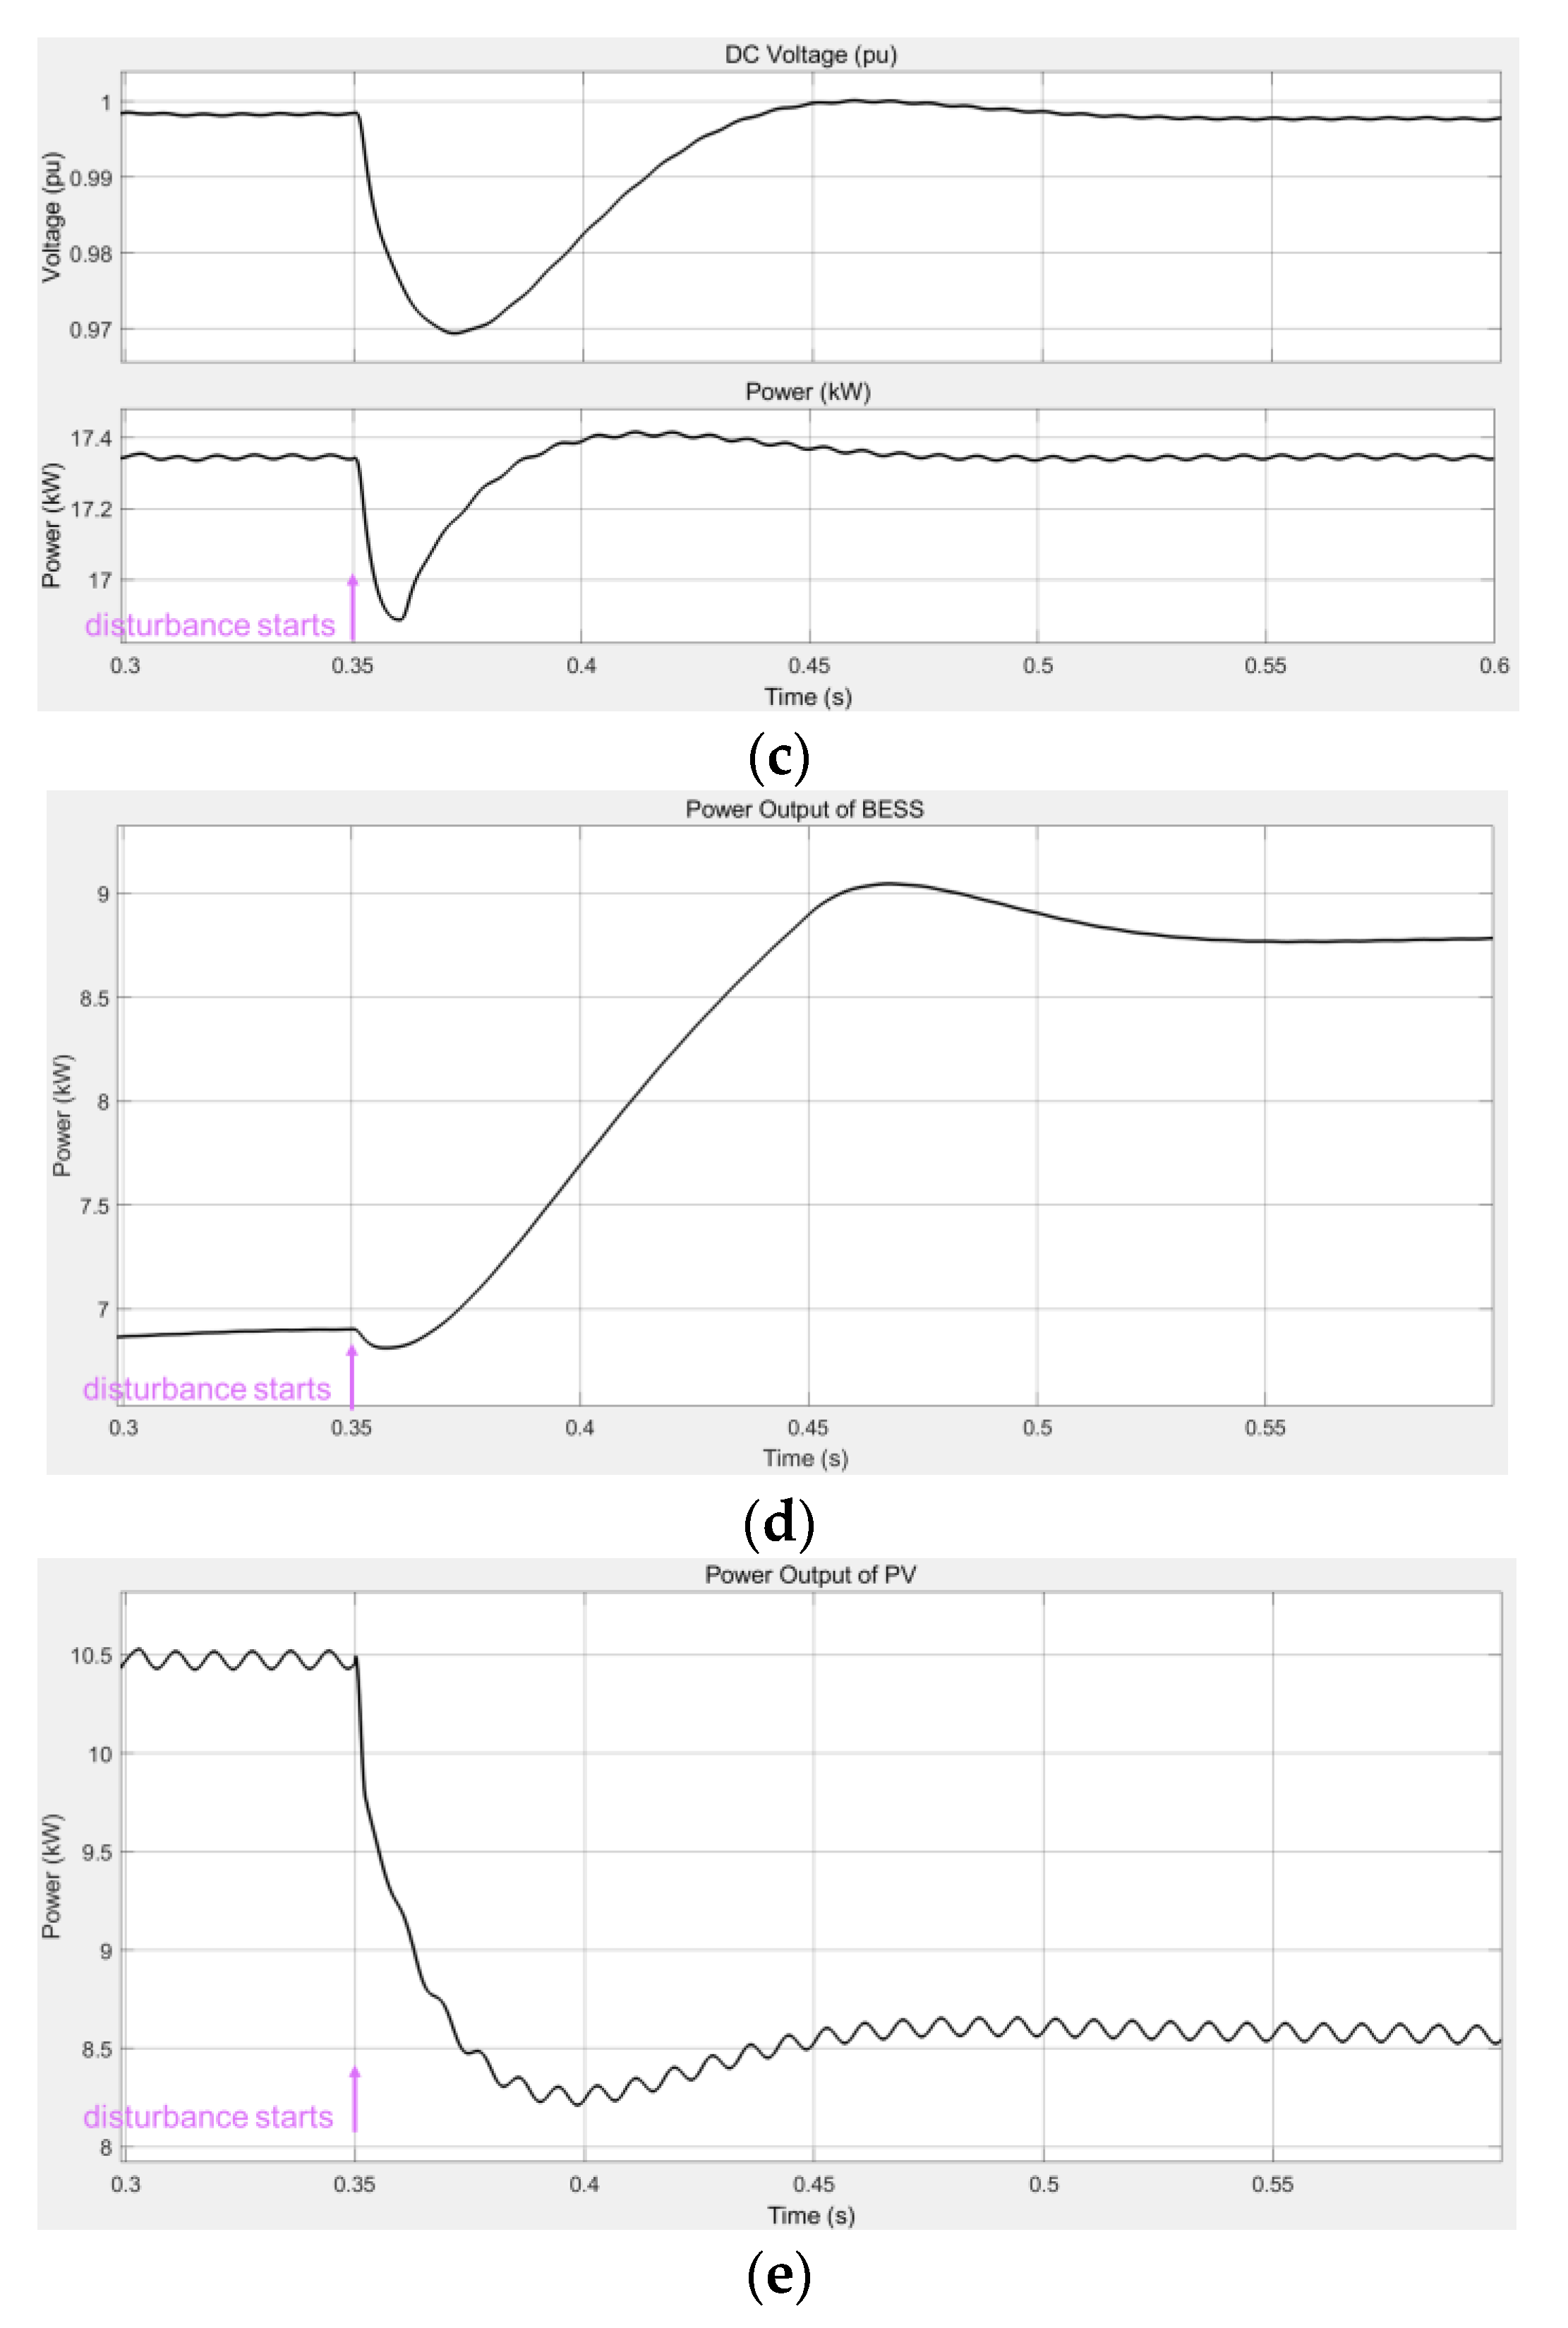
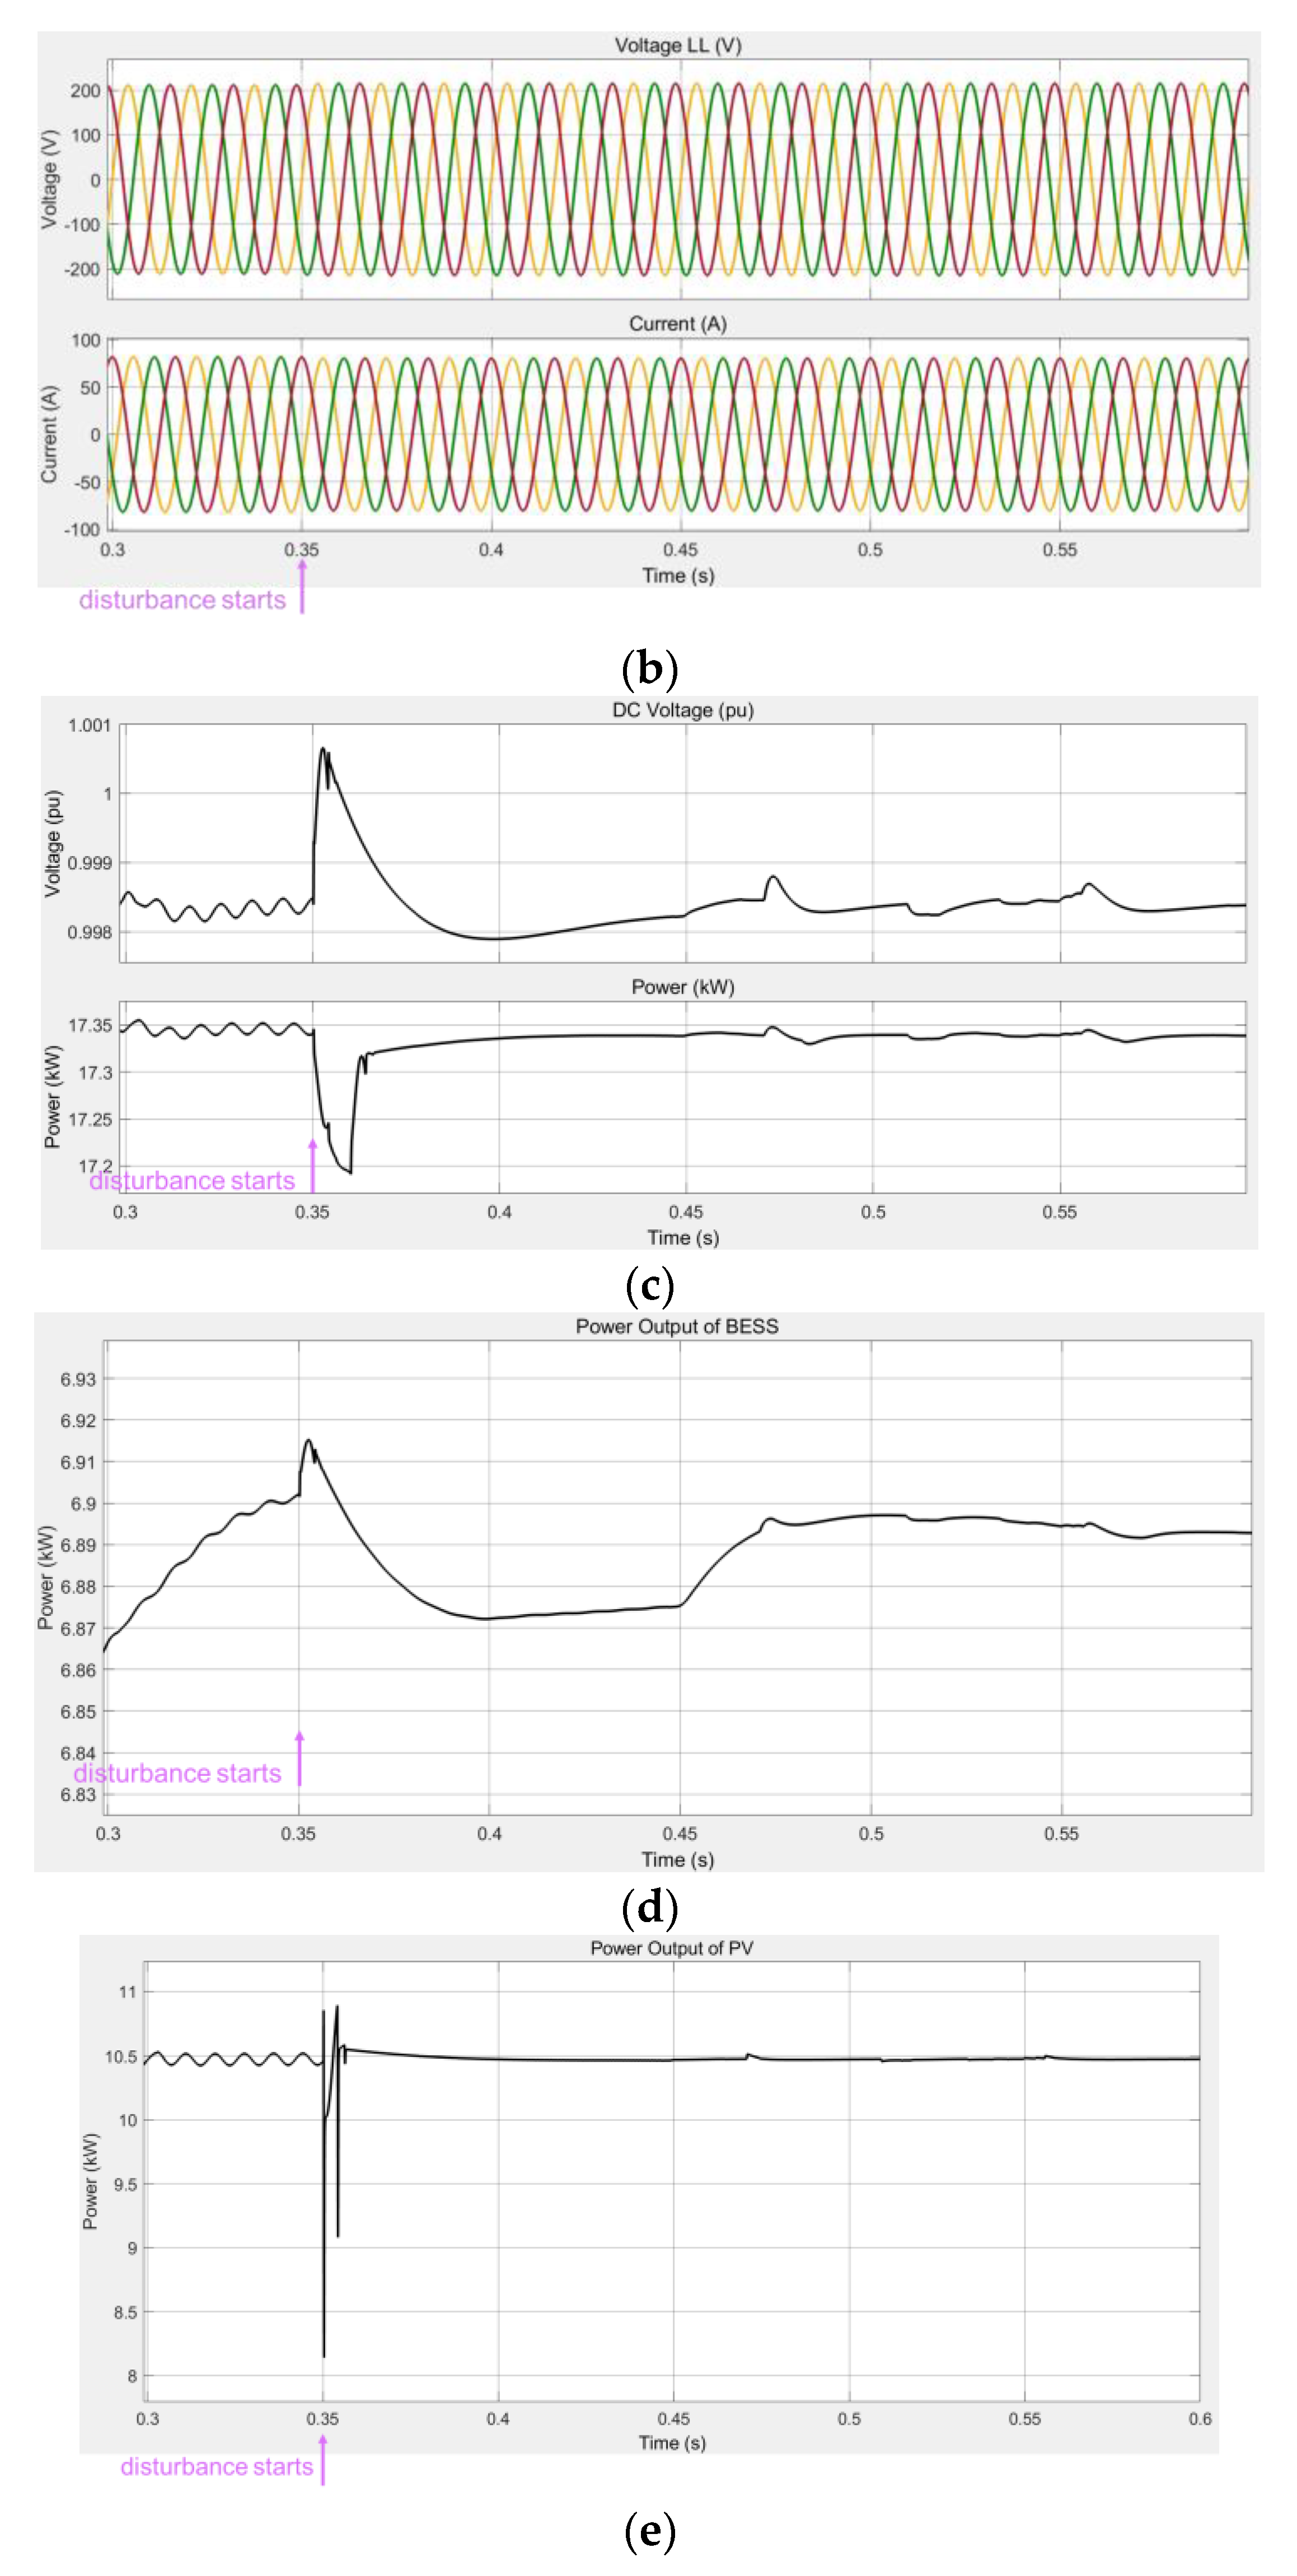
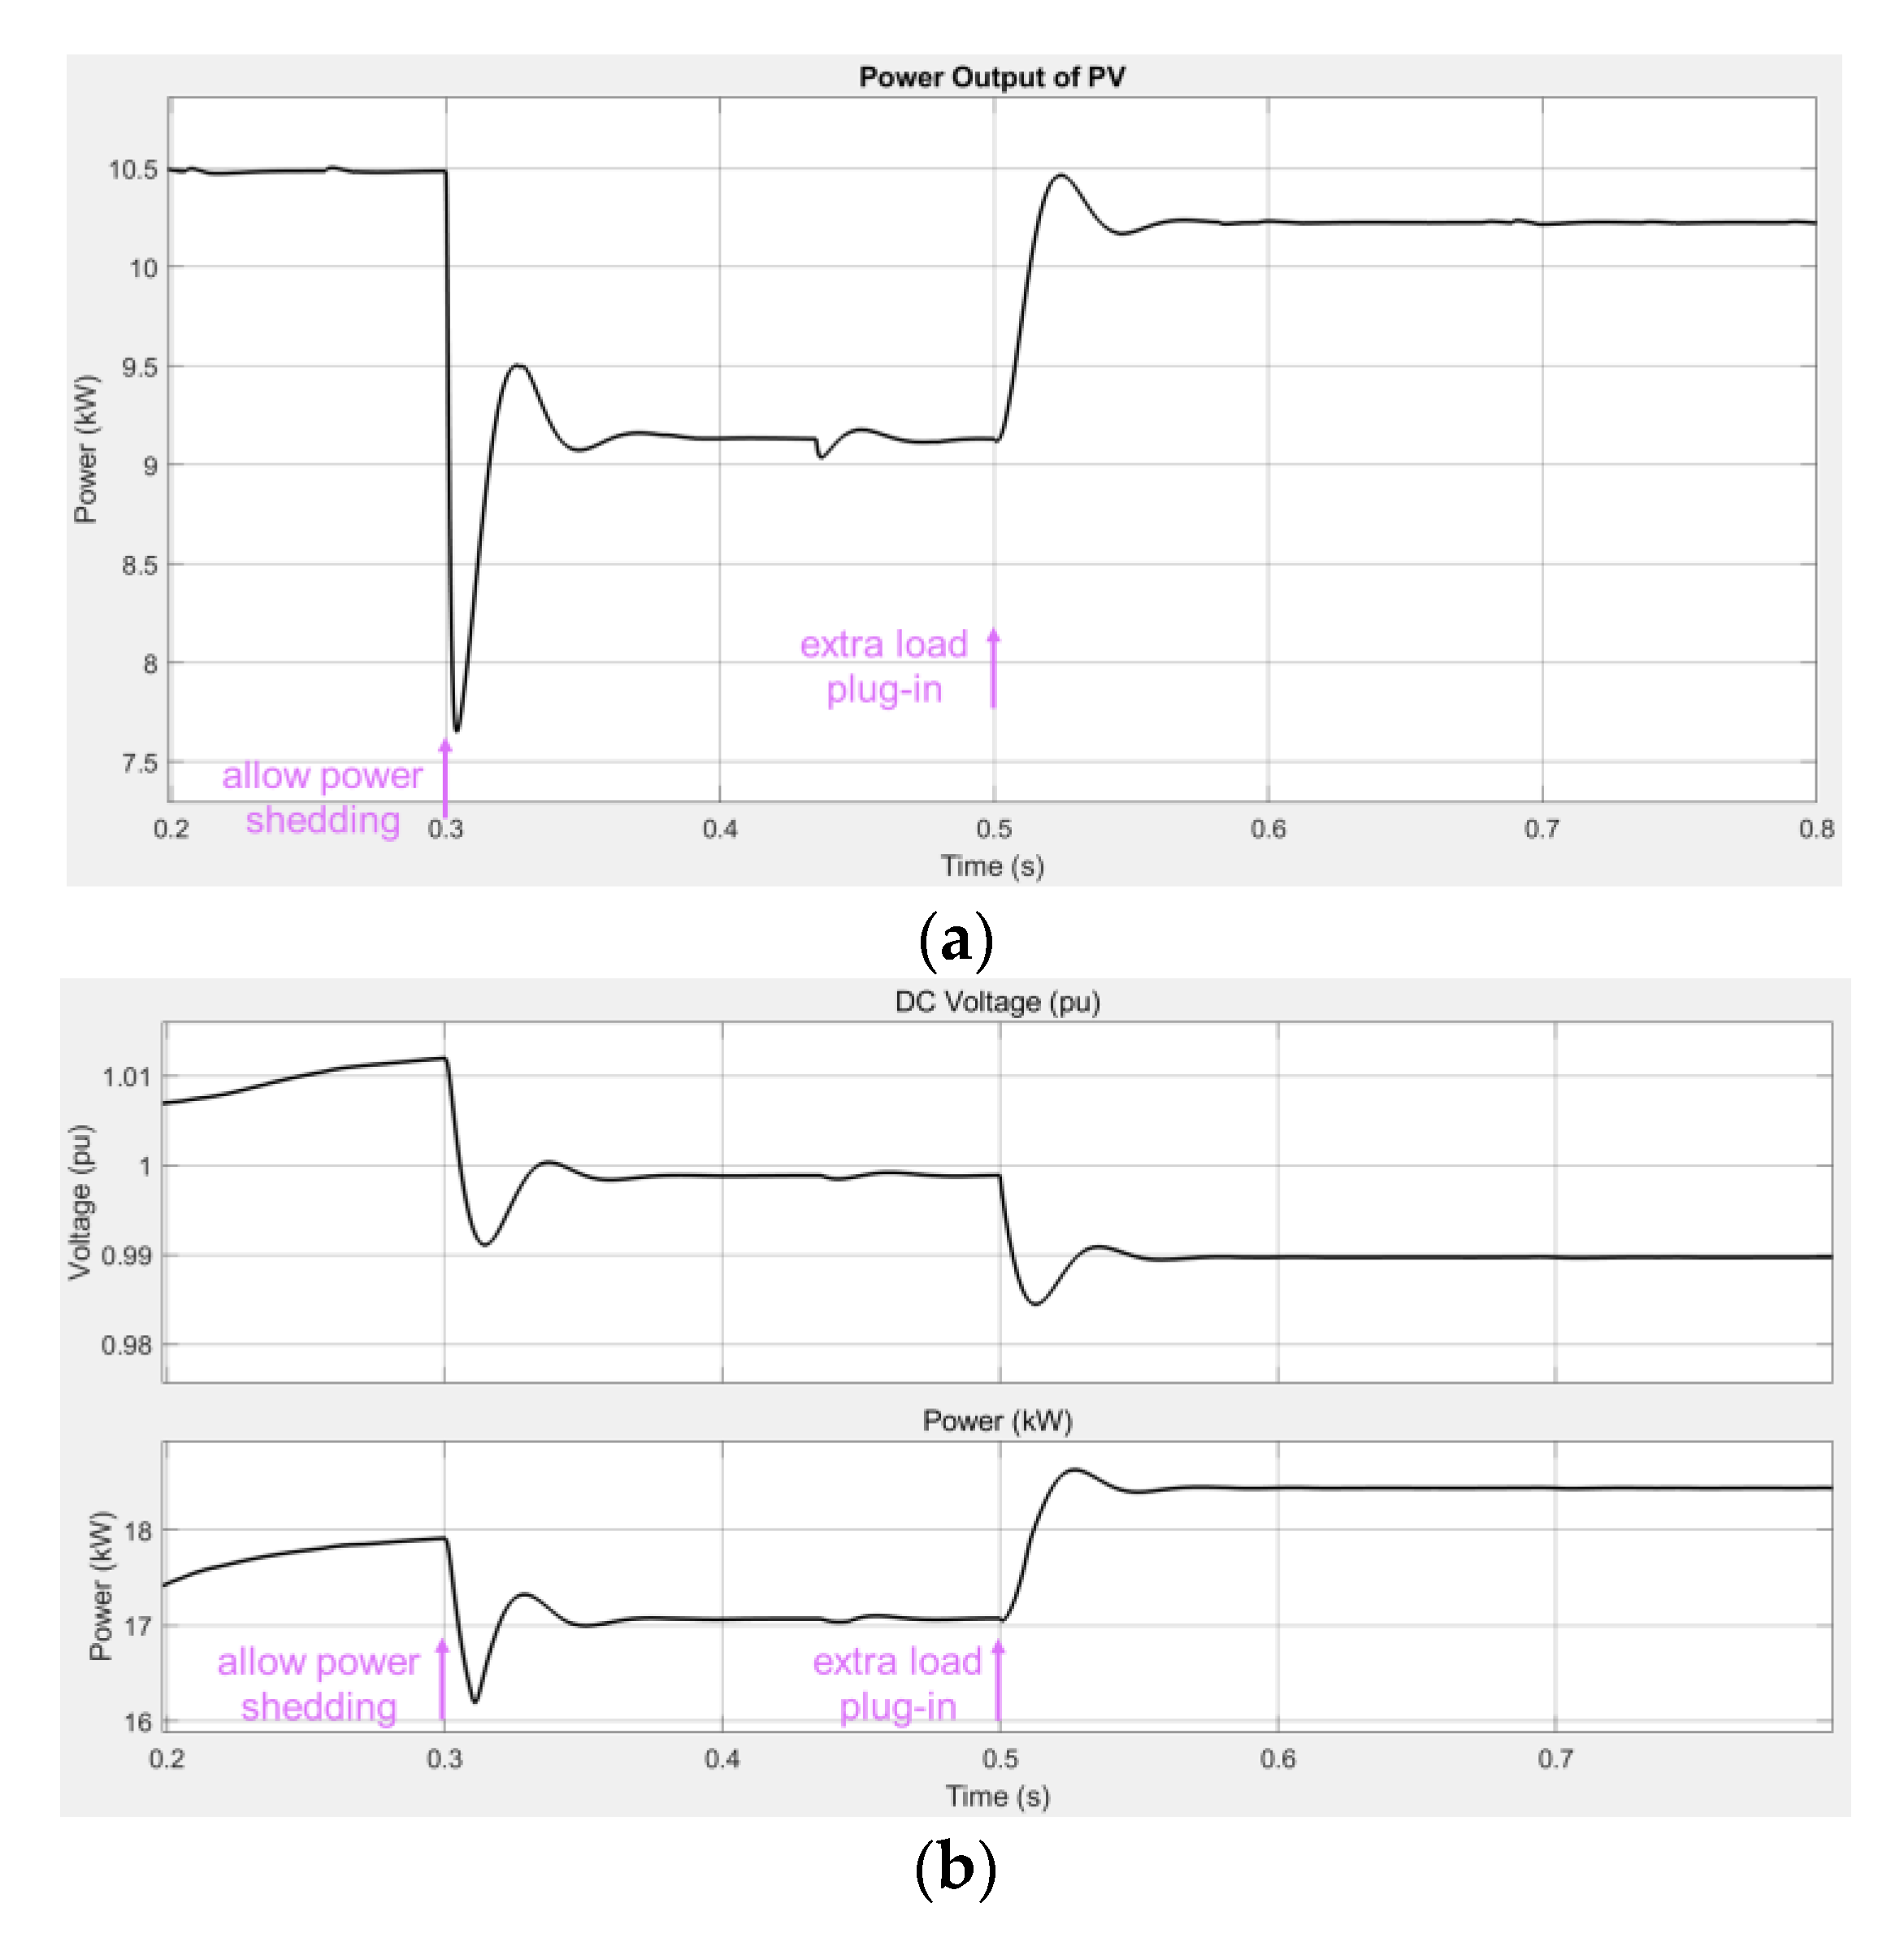
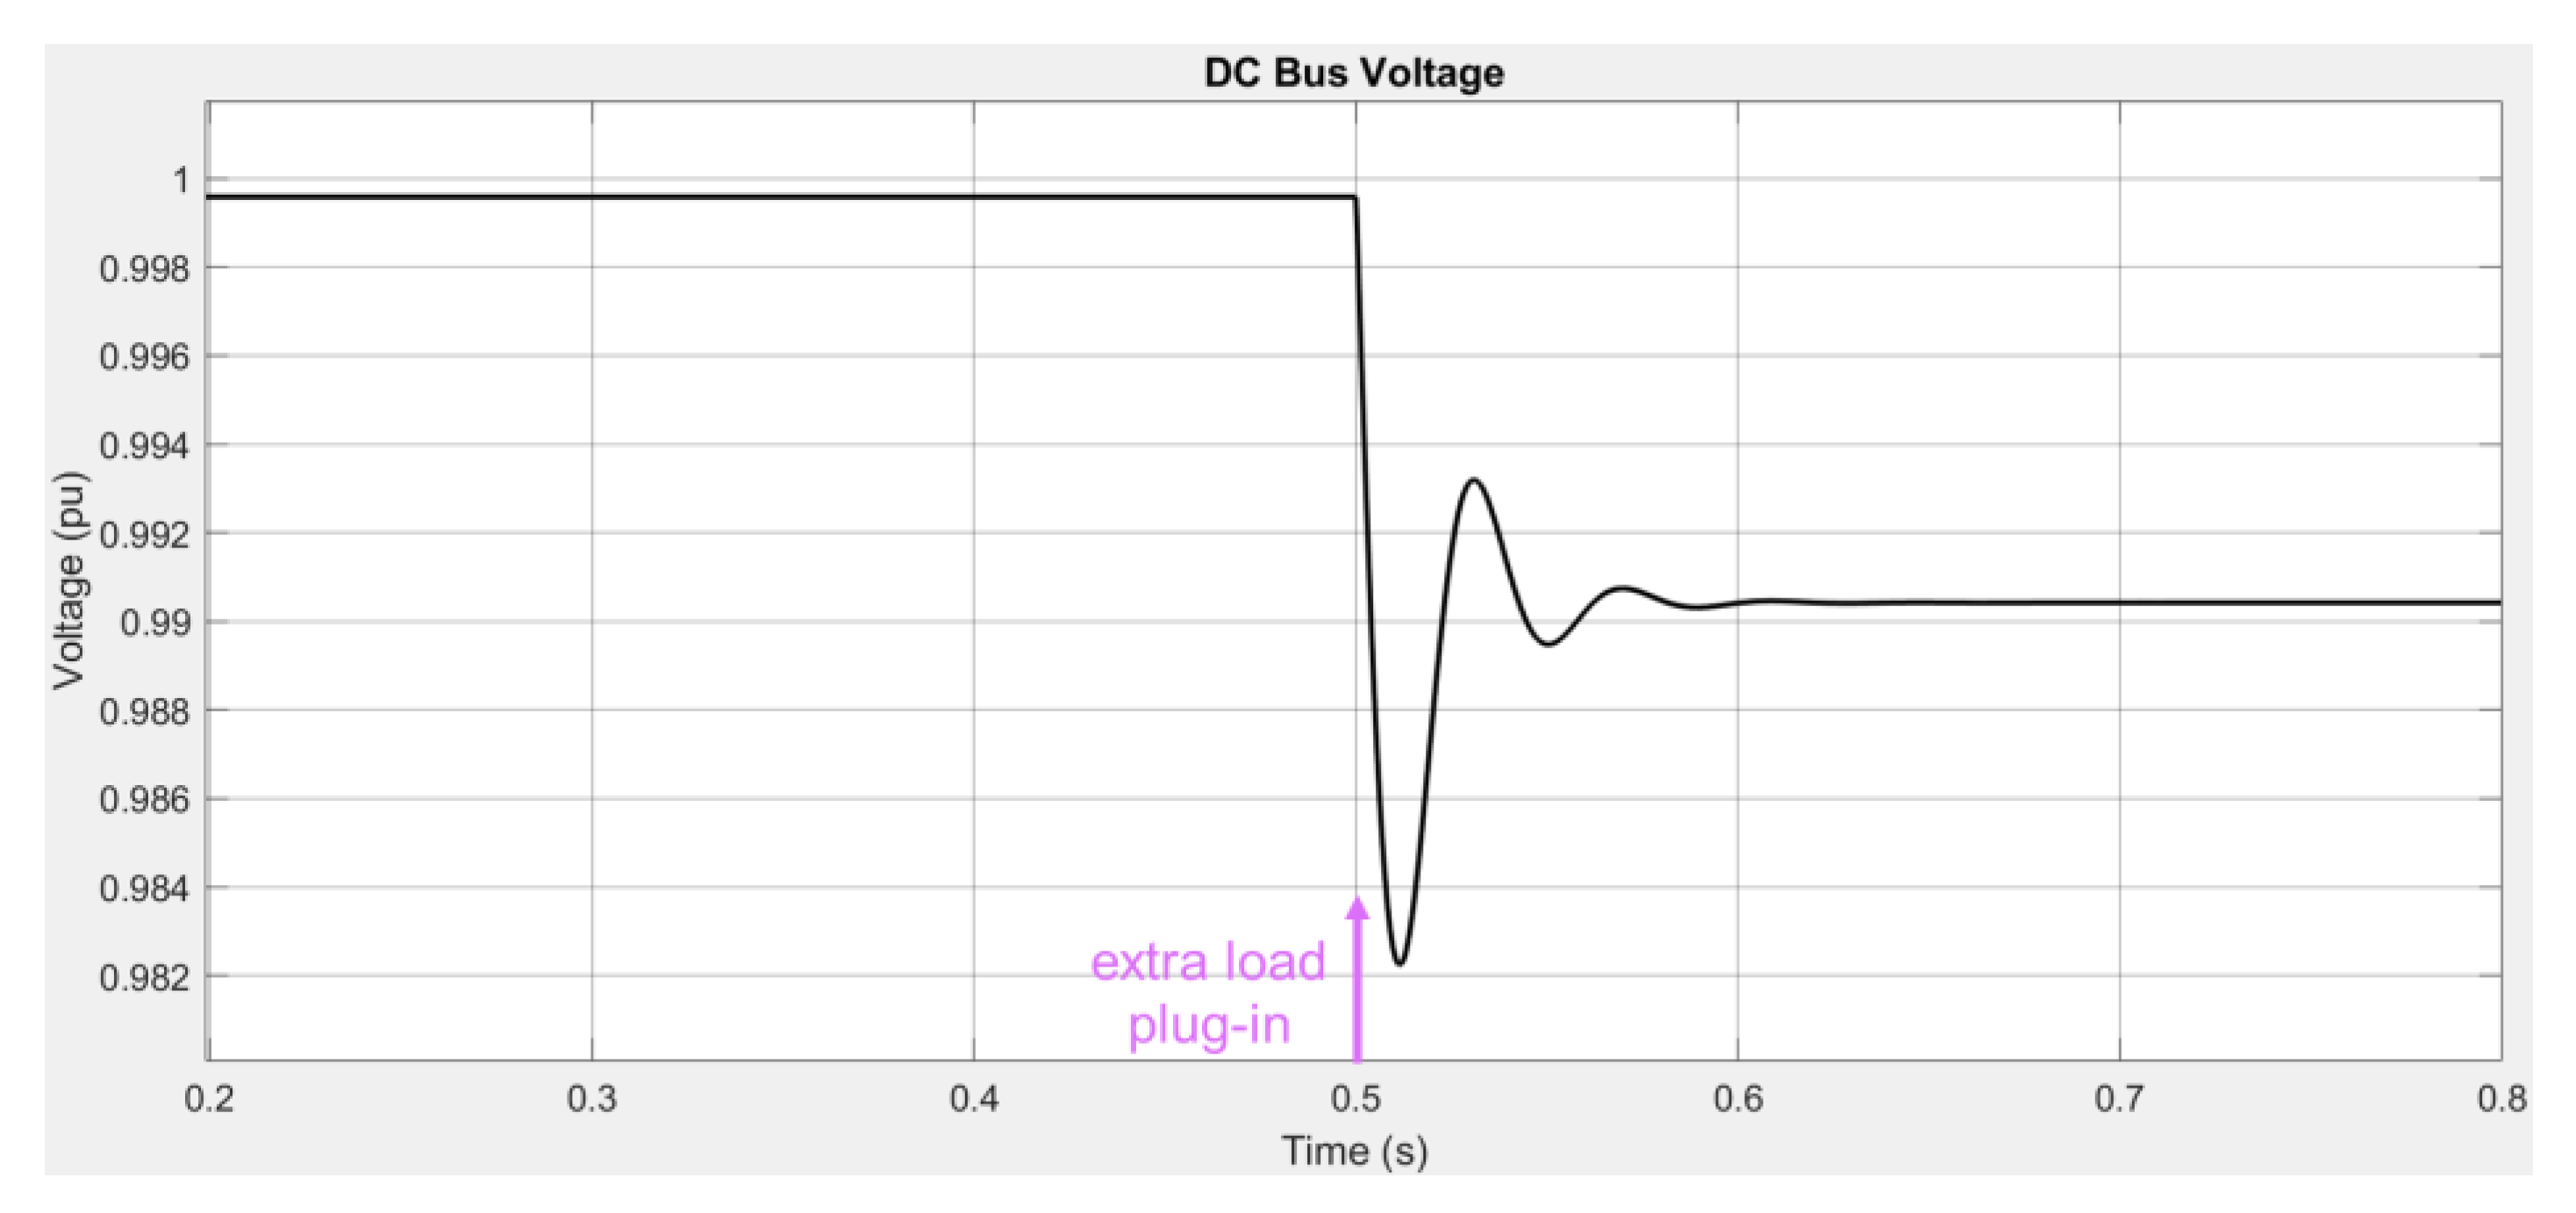
3.2. Stability Analysis with Disturbances

This section presents the stability analysis of the AC/DC hybrid microgrid with disturbances, such as surplus power generation of the renewable energy sources or surplus load consumption.
First, we take an illustrative example of the disturbance caused by a surplus load in the DC microgrid. Suppose the DC load installed at the main bus of the DC microgrid increases from 2 kW to 4 kW at t = 0.35 s. The simulation results are shown in Figure 13. The disturbance caused by a DC-side surplus load has trivial effects on the AC side of the hybrid microgrid. However, both the bus voltage and power generation on the DC side oscillate. Specifically, the bus voltage of the main DC bus has a large voltage dip of over 5%, which may result in poor power quality and threaten the normal operation of electric devices.
Second, we consider the scenario in which the operational environment of the PV generation changes. Suppose the irradiance decreases from 1000 W / m 2 to 800 W / m 2 , and the temperature decreases from 25 °C to 20 °C beginning at t = 0.35 s. The simulation results are shown in Figure 14.
The change in the operational environment of the PV generation does not lead to an evident disturbance on the AC side of the hybrid microgrid. The DC side gets into a new steady state within 0.1 s of the change happenings. A voltage dip of around 3% can be observed at the main DC bus.
Last, we consider a disturbance caused by a suddenly decreasing load in the AC microgrid. Suppose the unbalanced AC load installed at Bus 7 is shed beginning at t = 0.35 s. The simulation results are shown in Figure 15.
When an AC-side load shedding happens, the diesel generator installed in the AC microgrid can regulate its power output to fit the updated power flow. Small oscillations of bus voltage and power generation can be detected in the DC microgrid, but they are not severe enough to weaken the stable operation of the grid.
Table 4 concludes the effects of different types of disturbances on each side of the AC/DC hybrid microgrid.

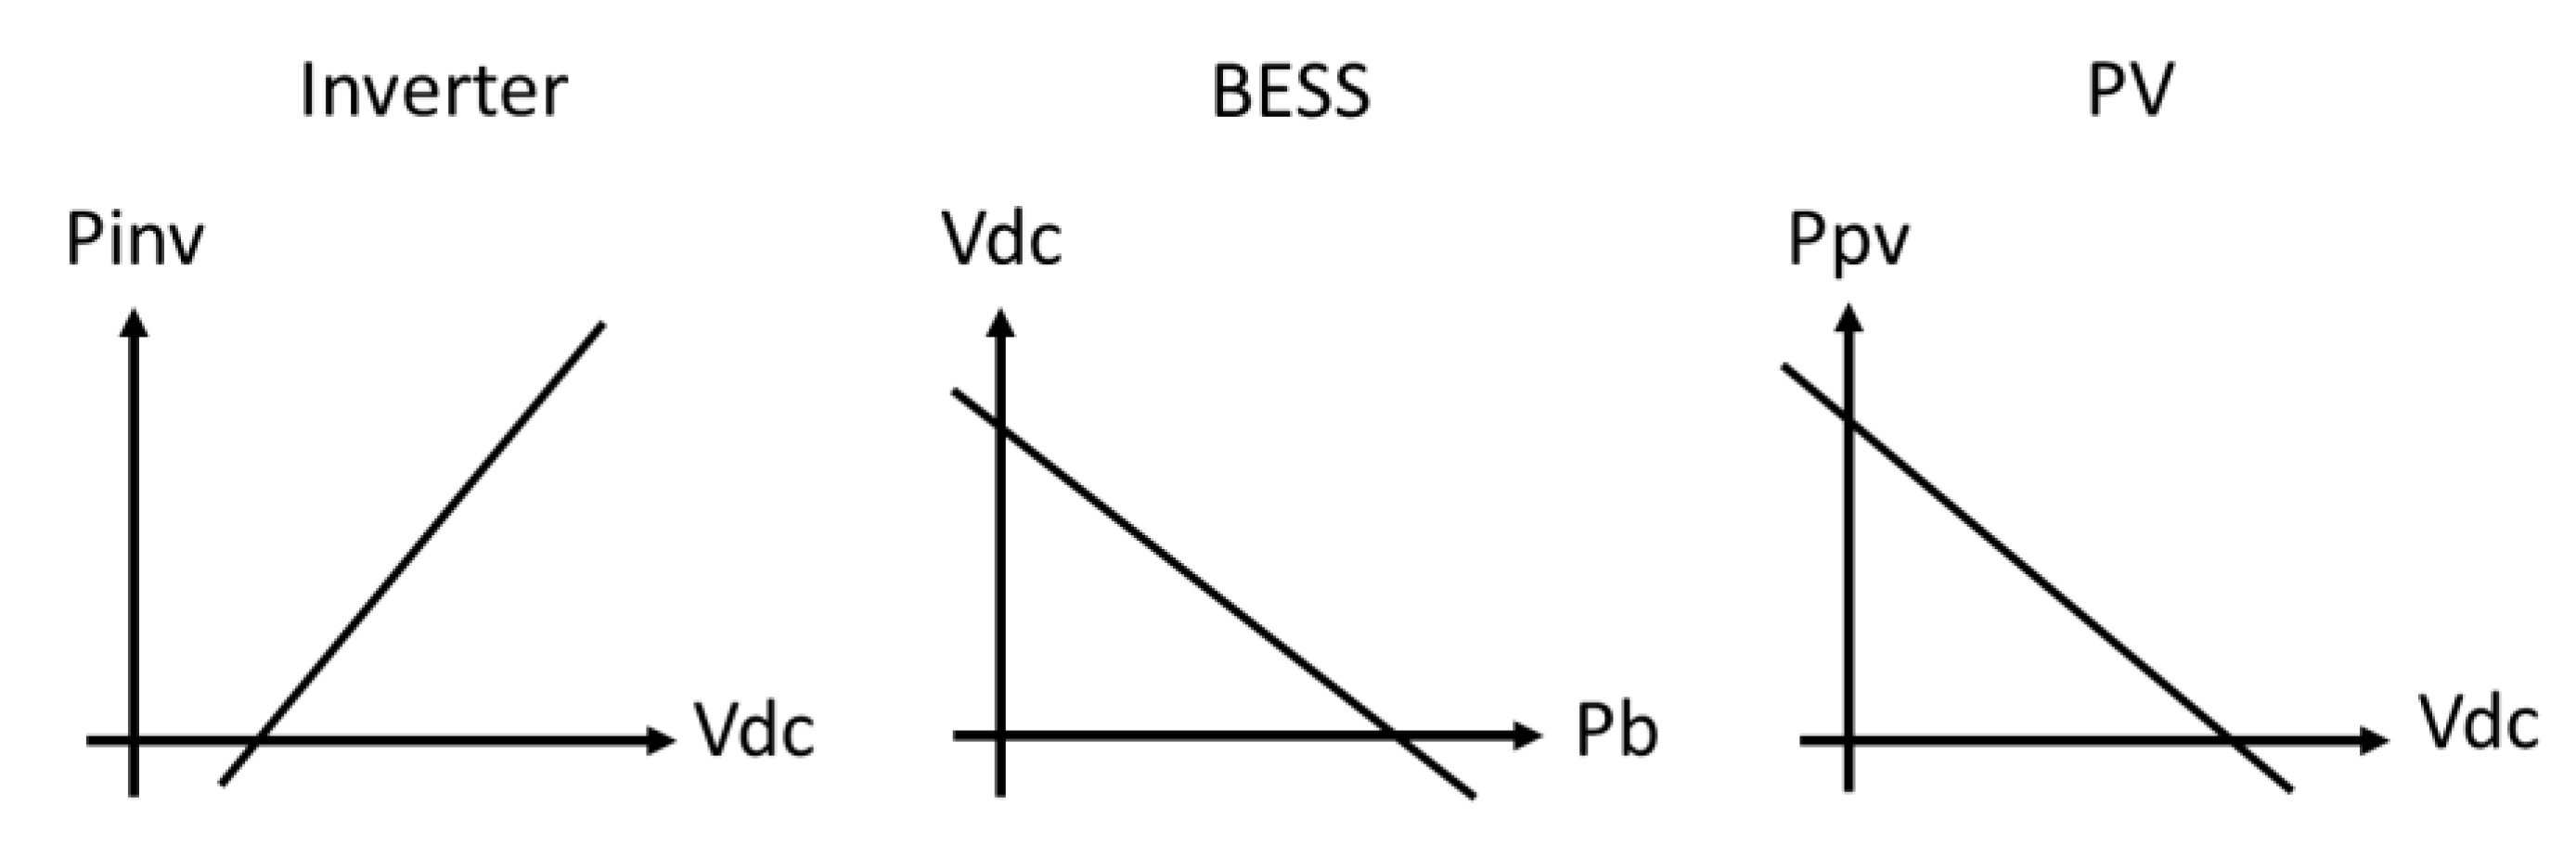
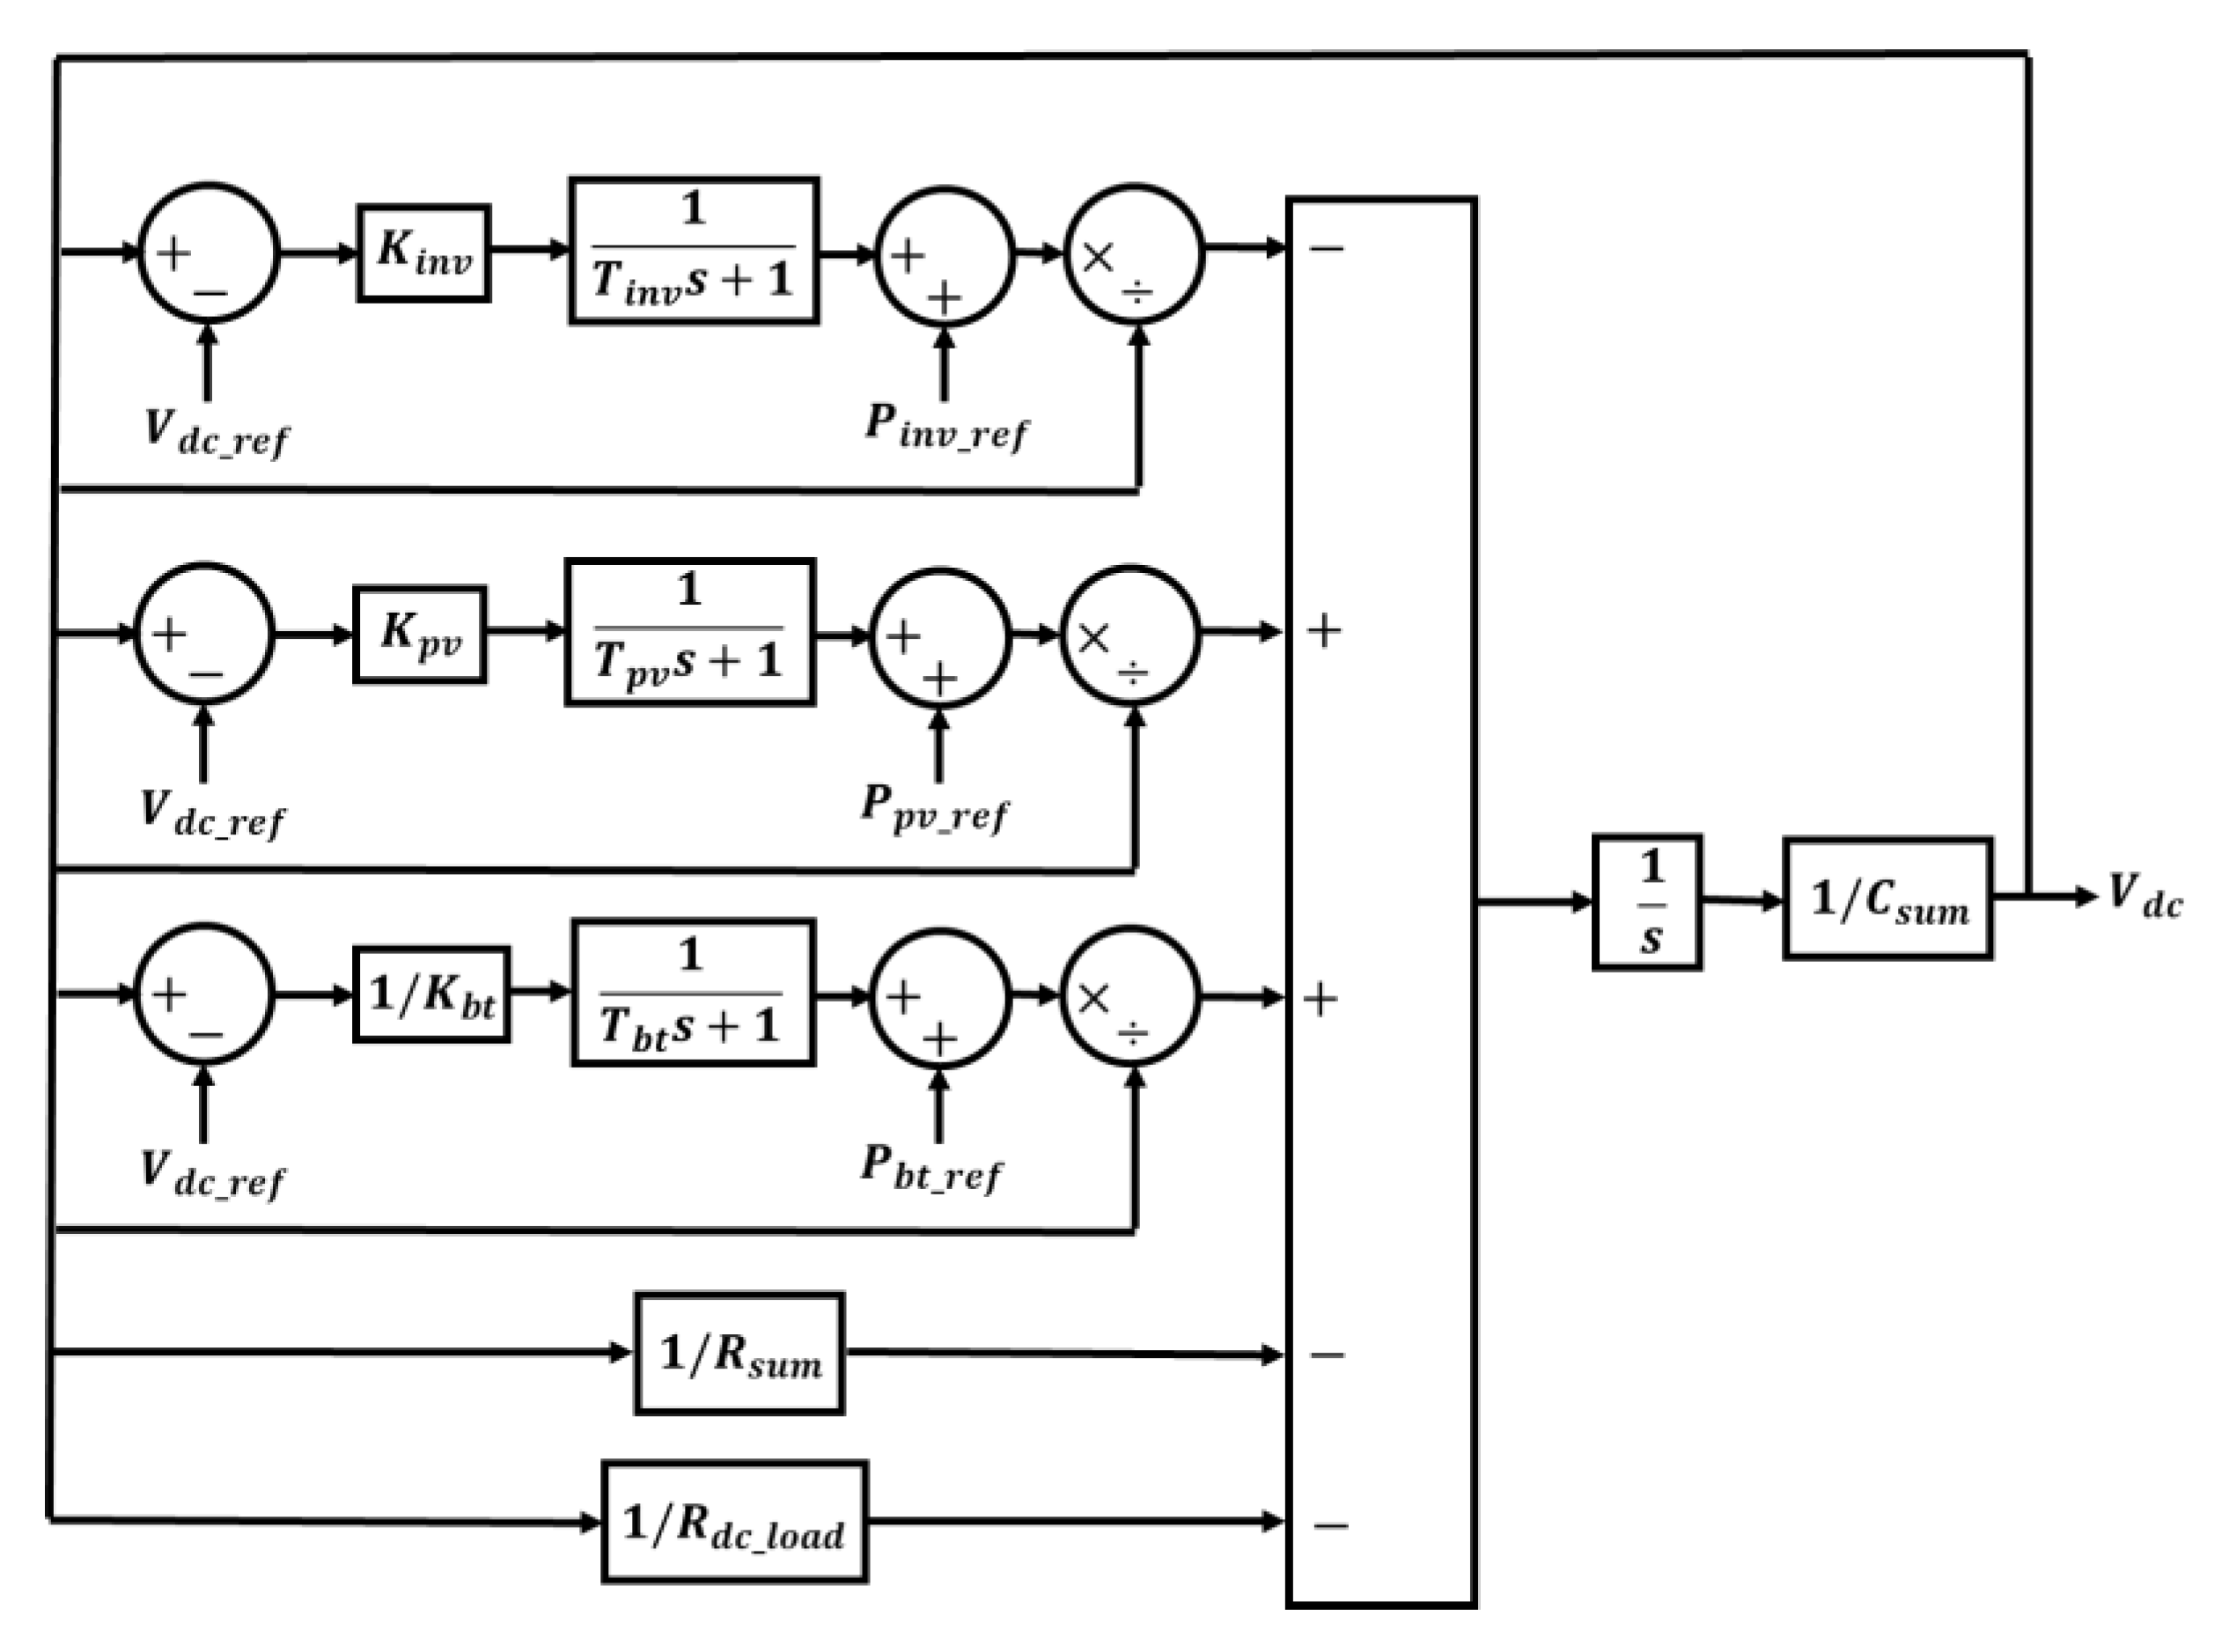
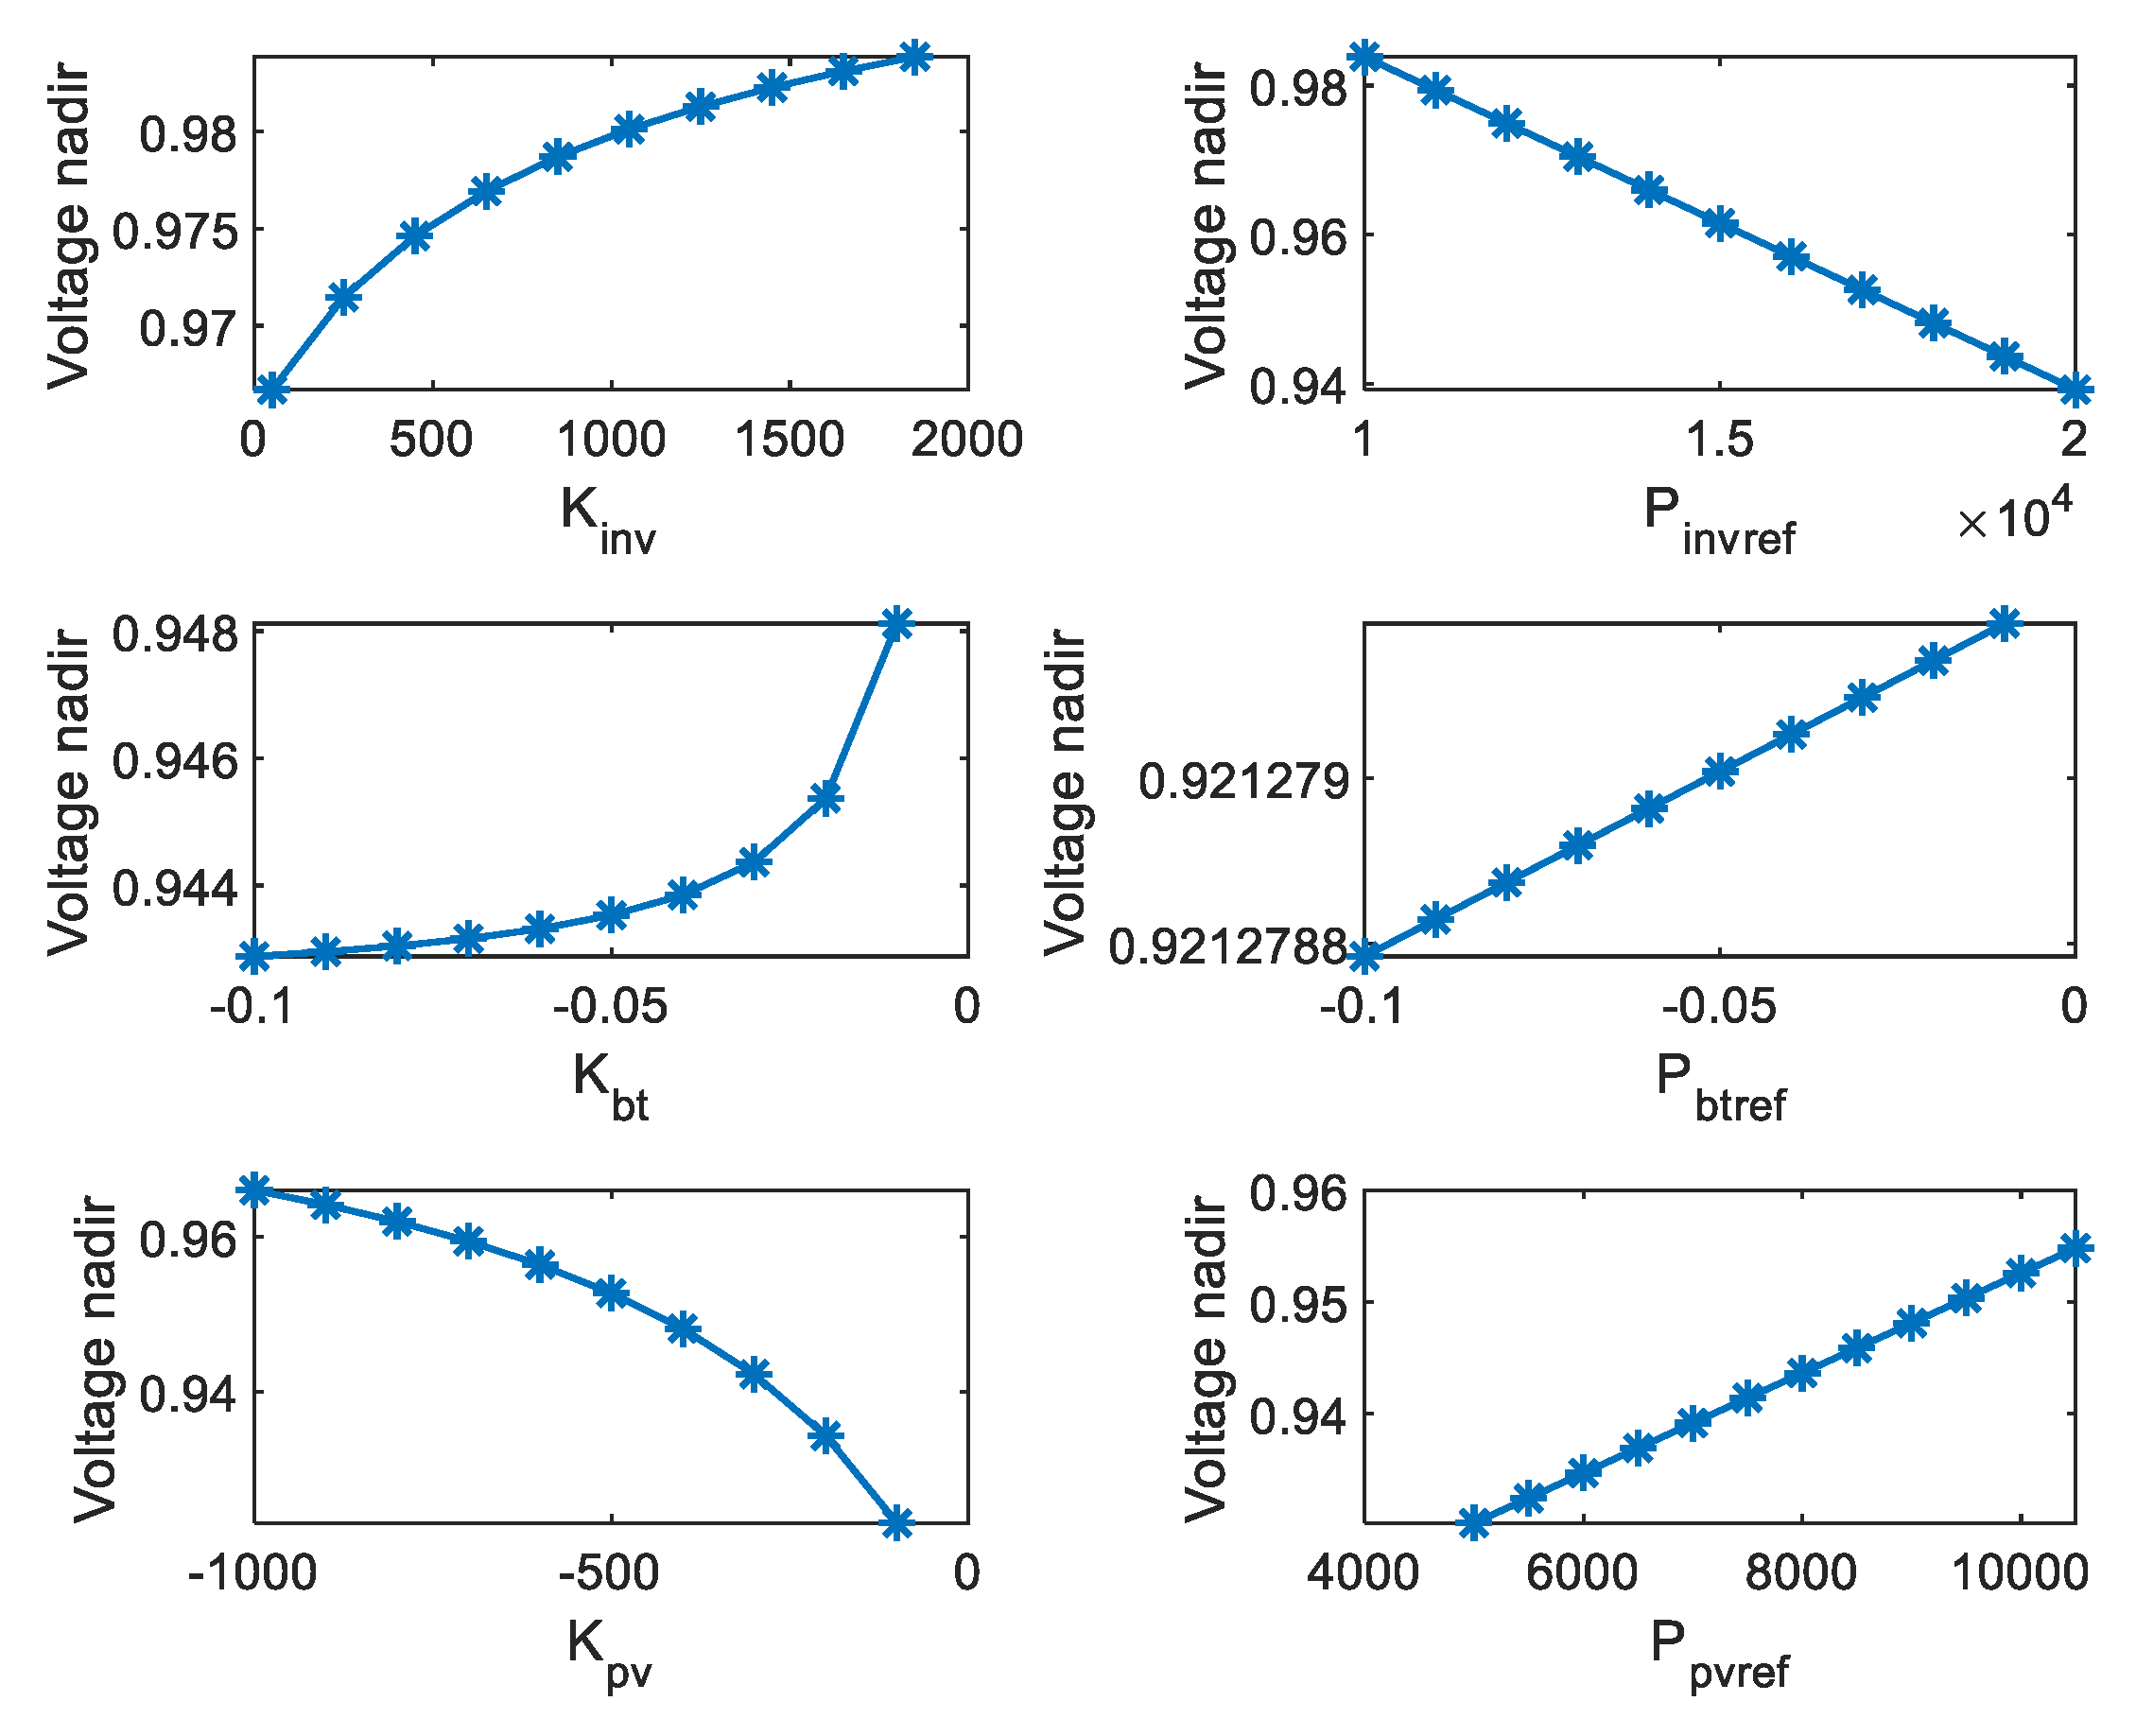
3.3. Voltage Instability Alleviation with Droop Control

We propose a droop-control-based methodology to alleviate the voltage instability (voltage dip) due to disturbances.

3.3.1. Power Flow Management Using Droop Control

A simplified power flow diagram is shown in Figure 16. In the operation of power grids, the operator first needs to balance the DC-side power generation supplied to the AC-side and the AC-side power consumption. During the power regulation, power imbalance may cause voltage instability. Therefore, our objective is to alleviate the voltage instability while at the same time regulating the power flow. Especially, the DC-side transient voltage can be investigated by examining the voltage nadir, as introduced in the next subsection.
Therefore, as shown in Figure 17, we design droop controllers for the interfacing inverter, the BESS, and the PV system, respectively.
The droop characteristics of the droop controllers are described as follows:
P i n v = P i n v _ r e f + K i n v ( V d c V d c _ r e f )
where P i n v , P i n v _ r e f is the actual power output and the reference value of the power output of the inverter, respectively, K i n v is droop gain of the inverter, V d c ,   V d c _ r e f is the actual voltage and the reference value of the voltage at the DC-side main bus, respectively,
V d c = V d c _ r e f + K b ( P b P b _ r e f )
where P b ,   P b _ r e f is the actual power output and the reference value of the power output of the BESS, respectively, K b is droop gain of the BESS,
P p v = P p v _ r e f + K p v ( V d c V d c _ r e f )
where P p v ,   P p v _ r e f is the actual power output and the reference value of the power output of the PV, respectively, K p v is droop gain of the PV.
With droop controllers installed at the interfacing power inverter, the BESS, and the PV system, the power balance between power generation and power consumption can be maintained, while the voltage at the DC-side main bus is regulated within a reasonable and desired range at the same time. The proposed power flow management method can alleviate voltage instability and oscillation by coordinating multiple power generation and loads when a disturbance happens. Besides, it is worth mentioning that the PV system can track the maximum power point and usually works in maximum power mode, but power shedding is allowed if necessary. For example, when the irradiance is large and the power generation is in excess, it is suggested to shed a part of the power output of the PV system.

3.3.2. The Evaluation of Stability Using Voltage Nadir

In this section, we evaluate the stability of the hybrid microgrid installed with droop controllers. The voltage nadir during a dynamic process caused by a disturbance is measured to reflect system stability. A small-scale AC/DC hybrid microgrid as shown in Figure 18 is taken as an illustrative example. A droop controller is installed at the power inverter, the BESS, and the PV generation system.
Considering the proposed models of power inverter and power converter in Section 2, the control diagram of the small-scale microgrid can be described in the following figure (Figure 19).
This control diagram can be utilized to investigate the voltage nadir analytically and to implement sensitivity analysis with reduced runtime. Before that, however, we first need to validate the correctness and accuracy of this control diagram by the following case study.
As shown in Figure 20, suppose the PV generation system is allowed to shed power beginning at t = 0.3 s and that an extra DC-side 2 kW load (around 45 Ohm resistive load) is plugged into the DC-side main bus beginning at t = 0.5 s. When the PV generation system is allowed to shed power at t = 0.3 s, there is instantly about 1.5 kW of power shedding considering the total power consumption in the microgrid. When an extra AC-side load is plugged in at t = 0.5 s, less power shedding (around 0.25 kW) is needed because of the increased power load consumption. In addition, it is observed that the voltage nadir caused by the plug-in surplus load is 0.9845 (p.u.) at t = 0.514 s. The steady-state voltage before the plug-in of the surplus load is 0.9989 (p.u.) during t = 0.37 s~0.5 s, and the steady-state voltage after the plug-in of the surplus load is 0.9898 (p.u.) at t = 0.63 s.
Comparably, the dynamics obtained from the proposed control diagram are shown in Figure 21. Suppose the same surplus load (an extra DC-side 2 kW load) is plugged in at t = 0.5 s. It is observed that the voltage nadir is 0.9822 (p.u.) at t = 0.511 s. The steady-state voltage before the plug-in of the surplus load is 0.9996 (p.u.) during t = 0.37 s~0.5 s, and the steady-state voltage after the plug-in of the surplus load is 0.9904 (p.u.) beginning at t = 0.63 s. The difference in the voltage dip between the microgrid simulation and the control diagram can be measured by the root mean square error (RMSE). In this case, the RMSE is 0.0333%, which means the difference is ignorable.
We implement multiple case studies with different power load disturbances to validate the equivalency of the proposed control diagram. The key parameters are measured and compared in the following table (Table 5), including the steady-state voltage before disturbance, the voltage nadir, and the steady-state voltage after disturbance. It is observed from the following table that the RMSE between the microgrid simulation and the control diagram is ignorable when we investigate voltage stability. Therefore, we can conclude that the stability-related performance of the control diagram is very close to that of the microgrid EMT simulation, which validates the equivalency and correctness of the proposed control diagram.
Next, we formulate a sensitivity analysis of the droop control to the voltage nadir. The equivalent control diagram is leveraged to reduce the runtime of the sensitivity analysis. From the sensitivity analysis results in Figure 22, it is noticed that the parameters of the droop controllers of different power devices have different impacts on the voltage nadir. Based on the sensitivity analysis of the voltage nadir, a stability-aware operation constraint for the optimization problem of power flow management can be proposed, which will be considered in our future work.
Furthermore, the proposed control diagram could also be leveraged to develop an analytical solution to the voltage nadir. Then, we can investigate more impact factors of voltage nadir, such as system designs, different types of faults, and disturbances.

4. Conclusions

In this manuscript, we propose the modeling of a typical AC/DC hybrid microgrid with renewable energy sources, including a BESS and a PV generation system. The involved power converters are modeled using the circuit-averaging technique, which has a higher simulation efficiency and further assists in the analytical study. Based on the proposed microgrid modeling, we also discuss the stability of a hybrid microgrid when a fault or disturbance occurs. In addition, we present a framework of voltage instability alleviation based on droop control, which can improve the voltage nadir and regulate power flow during grid operation. An equivalent control diagram is proposed to simulate and study the voltage dynamics of hybrid microgrid model. The equivalency is validated in our case study due to the error of voltage nadir less than 0.2%. Our future work will discuss the symmetrical component and harmonic analysis during faults or disturbances and investigate more impact factors of the voltage nadir.

Author Contributions

Conceptualization, F.C.; methodology, F.C.; software, F.C.; formal analysis, F.C.; writing—original draft preparation, F.C. and J.O.J.; writing—review and editing, J.O.J. and W.S.; supervision, W.S.; project administration, W.S. All authors have read and agreed to the published version of the manuscript.

Funding

This work was supported in part by the U.S. National Science Foundation (NSF) under Award 2034938. Any opinions, findings, and conclusions, or recommendations expressed in this material are those of the author(s) and do not necessarily reflect the views of the U.S. National Science Foundation.

Data Availability Statement

Not applicable.

Conflicts of Interest

The authors declare no conflict of interest.

References

  1. Gupta, A.; Doolla, S.; Chatterjee, K. Hybrid AC–DC Microgrid: Systematic Evaluation of Control Strategies. IEEE Trans. Smart Grid 2018, 9, 3830–3843. [Google Scholar] [CrossRef]
  2. Fotopoulou, M.; Dimitrios, R.; Fotis, S.; Spyros, V. A Review on the Driving Forces, Challenges, and Applications of AC/DC Hybrid Smart Microgrids. Smart Grids Technol. Appl. 2022. Available online: https://www.intechopen.com/chapters/80118 (accessed on 23 November 2022).
  3. Aljafari, B.; Subramanian, V.; Vairavasundaram, I.; Rhanganath, V. Optimization of DC, AC, and Hybrid AC/DC Microgrid-Based IoT Systems: A Review. Energies 2022, 15, 6813. [Google Scholar] [CrossRef]
  4. Shafiullah, M.; Refat, A.; Haque, M.; Chowdhury, D.; Hossain, M.; Alharbi, A.; Alam, M.; Ali, A.; Hossain, S. Review of Recent Developments in Microgrid Energy Management Strategies. Sustainability 2022, 14, 14794. [Google Scholar] [CrossRef]
  5. Prasad, T.; Devakirubakaran, S.; Muthubalaji, S.; Srinivasan, S.; Karthikeyan, B.; Palanisamy, R.; Bajaj, M.; Zawbaa, H.; Kamel, S. Power management in hybrid ANFIS PID based AC–DC microgrids with EHO based cost optimized droop control strategy. Energy Rep. 2022, 8, 15081–15094. [Google Scholar] [CrossRef]
  6. Tinajero, G.; Nasir, M.; Vasquez, J.; Guerrero, J. Comprehensive power flow modelling of hierarchically controlled AC/DC hybrid islanded microgrids. Int. J. Electr. Power Energy Syst. 2021, 127, 106629. [Google Scholar] [CrossRef]
  7. Eghtedarpour, N.; Farjah, E. Power Control and Management in a Hybrid AC/DC Microgrid. IEEE Trans. Smart Grid 2014, 5, 1494–1505. [Google Scholar] [CrossRef]
  8. Shair, J.; Li, H.; Hu, J.; Xie, X. Power system stability issues, classifications and research prospects in the context of high-penetration of renewables and power electronics. Renew. Sustain. Energy Rev. 2021, 145, 111111. [Google Scholar] [CrossRef]
  9. Arzani, M.; Abazari, A.; Oshnoei, A.; Ghafouri, M.; Muyeen, S. Optimal distribution coefficients of energy resources in frequency stability of hybrid microgrids connected to the power system. Electronics 2021, 10, 1591. [Google Scholar] [CrossRef]
  10. Zhang, G.; Yuan, J.; Li, Z.; Yu, S.S.; Chen, S.-Z.; Trinh, H.; Zhang, Y. Forming a Reliable Hybrid Microgrid Using Electric Spring Coupled with Non-Sensitive Loads and ESS. IEEE Trans. Smart Grid 2020, 11, 2867–2879. [Google Scholar] [CrossRef]
  11. Chang, F.; Cui, X.; Wang, M.; Su, W.; Huang, A.Q. Large-Signal Stability Criteria in DC Power Grids with Distributed-Controlled Converters and Constant Power Loads. IEEE Trans. Smart Grid 2020, 11, 5273–5287. [Google Scholar] [CrossRef]
  12. Chang, F.; Cui, X.; Wang, M.; Su, W. Potential-Based Large-Signal Stability Analysis in DC Power Grids With Multiple Constant Power Loads. IEEE Open Access J. Power Energy 2021, 9, 16–28. [Google Scholar] [CrossRef]
  13. Li, Z.; Shahidehpour, M. Small-Signal Modeling and Stability Analysis of Hybrid AC/DC Microgrids. IEEE Trans. Smart Grid 2019, 10, 2080–2095. [Google Scholar] [CrossRef]
  14. He, L.; Li, Y.; Guerrero, J.M.; Cao, Y. A Comprehensive Inertial Control Strategy for Hybrid AC/DC Microgrid With Distributed Generations. IEEE Trans. Smart Grid 2020, 11, 1737–1747. [Google Scholar] [CrossRef]
  15. Ranjan, S.; Das, D.; Sinha, N.; Latif, A.; Hussain, S.; Ustun, T. Voltage stability assessment of isolated hybrid dish-stirling solar thermal-diesel microgrid with STATCOM using mine blast algorithm. Electr. Power Syst. Res. 2021, 196, 107239. [Google Scholar] [CrossRef]
  16. Asghar, F.; Talha, M.; Kim, S. Robust frequency and voltage stability control strategy for standalone AC/DC hybrid microgrid. Energies 2017, 10, 760. [Google Scholar] [CrossRef] [Green Version]
Figure 1. The Workflow of Methodology.
Energies 16 00399 g001
Figure 2. The structure of a typical hybrid microgrid.
Energies 16 00399 g002
Figure 3. Signals at Bus 8.
Energies 16 00399 g003
Figure 4. Signals at DC bus.
Energies 16 00399 g004
Figure 5. I-V and P-V characteristics of PV panel.
Energies 16 00399 g005
Figure 6. The equivalent modeling of a boost converter. (a) Switch model of a boost converter; (b) Averaged circuit model of a boost converter.
Energies 16 00399 g006
Figure 7. Power output of the grid-following inverter.
Energies 16 00399 g007
Figure 8. Control diagram of grid-following inverter controller.
Energies 16 00399 g008
Figure 9. Performance when a single phase-to-ground fault occurs on the AC side. (a) Signals at Bus 6; (b) Signals at AC/DC interfacing Bus 8; (c) Signals at DC bus; (d) Power output of the BESS; (e) Power output of the PV generation.
Energies 16 00399 g009aEnergies 16 00399 g009b
Figure 10. Performance when a phase-to-phase fault occurs on the AC side. (a) Signals at Bus 6; (b) Signals at AC/DC interfacing Bus 8; (c) Signals at DC bus; (d) Power output of the BESS; (e) Power output of the PV generation.
Energies 16 00399 g010aEnergies 16 00399 g010b
Figure 11. Performance when a line disconnection fault occurs on the DC side. (a) Signals at Bus 6; (b) Signals at AC/DC interfacing Bus 8; (c) Signals at DC bus; (d) Power output of the BESS; (e) Power output of the PV generation.
Energies 16 00399 g011aEnergies 16 00399 g011b
Figure 12. Performance when a ground fault occurs on the DC side. (a) Signals at Bus 6; (b) Signals at AC/DC interfacing Bus 8; (c) Signals at DC bus; (d) Power output of the BESS; (e) Power output of the PV generation.
Energies 16 00399 g012aEnergies 16 00399 g012b
Figure 13. Performance when a DC-side surplus load happens. (a) Signals at Bus 6; (b) Signals at AC/DC interfacing Bus 8.; (c) Signals at DC bus; (d) Power output of the BESS; (e) Power output of the PV generation.
Energies 16 00399 g013aEnergies 16 00399 g013b
Figure 14. Performance when the PV operation environment changes. (a) Signals at Bus 6; (b) Signals at AC/DC interfacing Bus 8; (c) Signals at DC bus; (d) Power output of the BESS; (e) Power output of the PV generation.
Energies 16 00399 g014aEnergies 16 00399 g014b
Figure 15. Performance when an AC-side load shedding happens. (a) Signals at Bus 6; (b) Signals at AC/DC interfacing Bus 8; (c) Signals at DC bus; (d) Power output of the BESS; (e) Power output of the PV generation.
Energies 16 00399 g015aEnergies 16 00399 g015b
Figure 16. The simplified framework of power flow in the hybrid microgrid.
Energies 16 00399 g016
Figure 17. Droop controllers in the hybrid microgrid.
Energies 16 00399 g017
Figure 18. The framework of a small-scale hybrid microgrid.
Energies 16 00399 g018
Figure 19. The control diagram of a small-scale hybrid microgrid.
Energies 16 00399 g019
Figure 20. Voltage nadir measured in the Simulink simulation. (a) Power output of the PV generation; (b) Signals at DC bus.
Energies 16 00399 g020
Figure 21. Voltage nadir measured in the equivalent control diagram.
Energies 16 00399 g021
Figure 22. Sensitivity analysis of voltage nadir (p.u.).
Energies 16 00399 g022
Table 1. Main parameters of Lithium-ion battery.
Cut-off voltage (V)90
Fully charged voltage (V)139.6785
Nominal discharge current (A)347.8261
Internal resistance (Ohms)0.0015
Capacity (Ah) at nominal voltage723.4783
Exponential zone [voltage (V), capacity (Ah)]29.6463, 39.30435
Table 2. Main parameters of PV module.
Maximum power (W)250.205
Cells per module (Ncell)96
Open circuit voltage Voc (V)37.4
Short-circuit current Isc (A)8.63
Voltage at maximum power point Vmp (V)30.7
Current at maximum power point Imp (A)8.15
Temperature coefficient of Voc (%/deg.C)−0.34
Temperature coefficient of Isc (%/deg.C)0.05
Table 3. Effects of faults on hybrid microgrid.
Fault LocationFault TypeAC-SideDC-SideInverter
AC-sideSingle p-gfaultynormalnormal
p-pfaultyseverefaulty
Double p-gfaultyseverefaulty
Three-phasesevere
DC-sideLine disconnectionnormalnormalnormal
Groundnormalseverenormal
Table 4. Effects of disturbance on hybrid microgrid.
Disturbance LocationDisturbance TypeDC-SideAC-Side
DC-sideA surplus loadVoltage dipNormal
Operational environment changesVoltage dipNormal
AC-sideLoad sheddingNormalPower regulation
Table 5. The comparison of dynamics between simulation and control diagram.
Load Disturbance2.0 kW4.0 kW1.5 kW0.5 kW
Microgrid simulationSteady-state voltage before disturbance0.99890.99890.99890.9989
Voltage nadir0.98450.96910.98790.9953
Steady-state voltage after disturbance0.98980.97310.99200.9966
Control diagramSteady-state voltage before disturbance0.99960.99960.99960.9996
Voltage nadir0.98220.96570.98650.9952
Steady-state voltage after disturbance0.99040.98160.99270.9973
RMSE (%)0.03330.19333.7007 × 10−150.0433
Disclaimer/Publisher’s Note: The statements, opinions and data contained in all publications are solely those of the individual author(s) and contributor(s) and not of MDPI and/or the editor(s). MDPI and/or the editor(s) disclaim responsibility for any injury to people or property resulting from any ideas, methods, instructions or products referred to in the content.

