Article

Reliability Assessment under High Penetration of EVs including V2G Strategy

1
Electrical Power and Machines Department, Faculty of Engineering, Ain Shams University, Cairo 11517, Egypt
2
Department of Electrical Engineering, American University of Sharjah, Sharjah 26666, United Arab Emirates
3
Department of Electronics and Electrical Communications Engineering, Faculty of Engineering, Cairo University, Giza 12613, Egypt
4
Center of Research Excellence in Renewable Energy and Power Systems, King Abdulaziz University, Jeddah 21589, Saudi Arabia
5
Department of Electrical and Computer Engineering, Faculty of Engineering, King Abdulaziz University, Jeddah 21589, Saudi Arabia
*
Author to whom correspondence should be addressed.
Energies 2022, 15(4), 1585; https://doi.org/10.3390/en15041585
Submission received: 26 December 2021 / Revised: 14 February 2022 / Accepted: 17 February 2022 / Published: 21 February 2022
(This article belongs to the Special Issue Electric Vehicle Charging Technologies and Trends)

Abstract

:
With the increase in the penetration of battery electric vehicles (BEVs) all over the world, utilities should start considering their increased demand as part of their electric demand. Generally, the literature lacks works that consider the impact of transportation electrification on the reliability of the power system. Thus, this paper proposes a new mechanism for reliability assessment including BEVs, with both grid-to-vehicle (G2V) and vehicle-to-grid (V2G) modes. Three charging strategies: uncontrolled, controlled unidirectional, and controlled bidirectional are considered in this paper to model the interactions between the transportation and electric power systems. A dynamic stochastic consumption model for a fleet of BEVs is developed to be used in the reliability assessment for the distribution networks. This dynamic model takes into consideration the variability and uncertainty of different trip purposes, starting and ending trip times, as well as the corresponding battery consumption in weather conditions. Furthermore, it is composed of two sequential submodels: travel behavior and battery depletion. The first submodel considers trip-related information while the second considers battery-depleted energy. Simulation results on a benchmark test system show the negative impacts of uncontrolled charging on the power system’s reliability. However, they also show that controlled charging can significantly reduce or mitigate these impacts.

1. Introduction

A great challenge that is currently facing the world is finding alternatives to internal combustion engine (ICE) vehicles, as they contribute to global warming and deplete the ozone layer and fossil fuel reserves. In fact, about 70% of transportation gas emissions are caused by ICE vehicles [1,2]. Transportation electrification in conjunction with renewable energy resources results in a reduction in all the previously mentioned negative effects, thus leading to an increase in energy security [3]. However, even though battery electric vehicles (BEVs) are an emerging trend, they may have negative impacts on the electric grid if not managed properly [4,5,6,7,8].
The charging of BEVs can take place at homes, parking lots, or dedicated charging stations, which are rather limited in number at present. Furthermore, BEVs can be charged via either AC or DC charging. DC charging mainly happens at charging stations and is also called fast charging due to the high charging currents used in the process, which can reach 300 A [9,10]. Meanwhile, AC charging uses the onboard charger in each vehicle to rectify the voltage from AC to DC. AC charging can take place at homes or parking lots [11,12,13,14].
With the increased penetration of BEVs, the extra load imposed by BEV charging will cause severe consequences if not managed properly. This is due to the fact that the power system was not originally designed to accommodate this extra load. These consequences include, but are not limited to, thermal overloading, violation of voltage limits, degradation of transformers, power quality problems, and load-generation imbalance [15]. Thus, the integration of BEVs with the electric power system has a great impact on the reliability of the power system. Moreover, this integration may benefit reliability only if controlled charging strategies are applied. Therefore, utilities and power system operators are racing to quantify the impacts of BEV charging on their systems. Considerable research has been dedicated to modeling the consumption of BEVs fleets under different charging scenarios. To manage BEV charging demand, different strategies are adopted. The main objective of these strategies is to minimize the negative effect of BEVs on the power systems. Scheduling, clustering, and forecasting are the most widely used strategies to achieve this goal [16].
Nowadays, some researchers have focused on studying the impact of the integration of BEVs on the reliability of the power system. For example, the authors in [17] applied bidirectional charging modes, grid-to-vehicle (G2V), and vehicle-to-grid (V2G), to model the interaction between electric and transportation systems to determine the reliability indices. In [18], the trip chain theory was presented to describe the travel behavior of BEVs. The trip start time, end time, and different trip distances were not considered in this model while considering the traffic flow. The authors of [19] proposed an analytical model to study the impact of BEVs on the system reliability under battery-swap mode. The main advantage of the analytical model is its high calculation accuracy; however, the random spatiotemporal state of BEVs makes this model difficult to apply to BEVs. In addition, Ref [20] presented a time-varying model to compute the load profile of BEVs. The sequential Monto Carlo technique was utilized in this model to implement the reliability study. Moreover, Ref [21] utilized two charging modes (G2V, V2G) to assess the impact of power exchange between electric and transportation networks. Furthermore, the reliability indices are determined based on the minimal path technique, while load flow analysis was implemented based on the backward-forward technique. The authors in [22] assumed that the BEVs could be discharged to supply power to the home in case of power outage in the islanded mode. The authors of [23] proposed two metrics to study the impact of BEVs on power system reliability. The first index was used to determine the maximum load of BEVs which the power system can accommodate without upgrading it or affecting its reliability. In contrast, the second index was presented to determine the minimum size of the generation unit to be added to restore the power system reliability in case of exceeding the maximum load of BEVs. In [24], a heuristic-based method was implemented to determine the optimal duration for charging and discharging of BEVs, taking into consideration the grid price and normal household demand. However, a rigid arriving/departure schedule is assumed, where all BEVs were assumed to arrive at 9 PM and depart at 9 AM the next day. On a related front, the work in [25] studied the reliability of the power system, taking into consideration the charging of the BEVs using the battery-swapping mode instead of the plug-in mode. Furthermore, in [26], to study the reliability of the power system, BEV charging was considered as an interruptible load. The impact of BEV charging on the power system’s reliability was studied in [27] considering V2G scheme. However, the proposed model in this work is based on a 48 h BEV arrival and departure period, which does not reflect a real-life pattern of BEV charging, which varies from weekdays to weekends and from one month to another.
Based on the aforementioned discussion, studies on the impacts of transportation electrification on the reliability of the power system are still in their early stages. Moreover, it is evident that most of the BEV discharging models neglect real-life scenarios of BEV arrival and departure, which depend on the travel pattern of the BEV drivers. Furthermore, the uncertainty related to the travel pattern was ignored. This is in addition to the fact that seasonal impacts on the travel patterns and the BEV consumption were ignored.
Moreover, developing the energy consumption model for the BEV and introducing it in the reliability analysis results in misleading outcomes. This is due to the fact that the BEV battery can still gain the required charging energy fully or partially after the supply has been restored if it is still connected to the charger. Thus, the impacts of BEVs on power system reliability are highly dependent on travel patterns.
Therefore, the reliability analysis with the presence of significant BEV demand was not studied properly in the literature due to the lack of accurate trip models. In this paper, we propose a new mechanism for reliability assessment to establish reliability indices for the consumption of normal electric loads and the demand imposed by transportation electrification.
The main contributions of this paper can be summarized as follows:
  • We propose a new mechanism for reliability assessment for the distribution networks under high penetration of BEVs, including V2G mode, using a dynamic stochastic BEV consumption model.
  • We study the effects of different charging strategies, such as the uncontrolled charging strategy, controlled unidirectional strategy, and controlled bidirectional strategy as well as the impact of penetration of BEVs on the reliability of the power system.
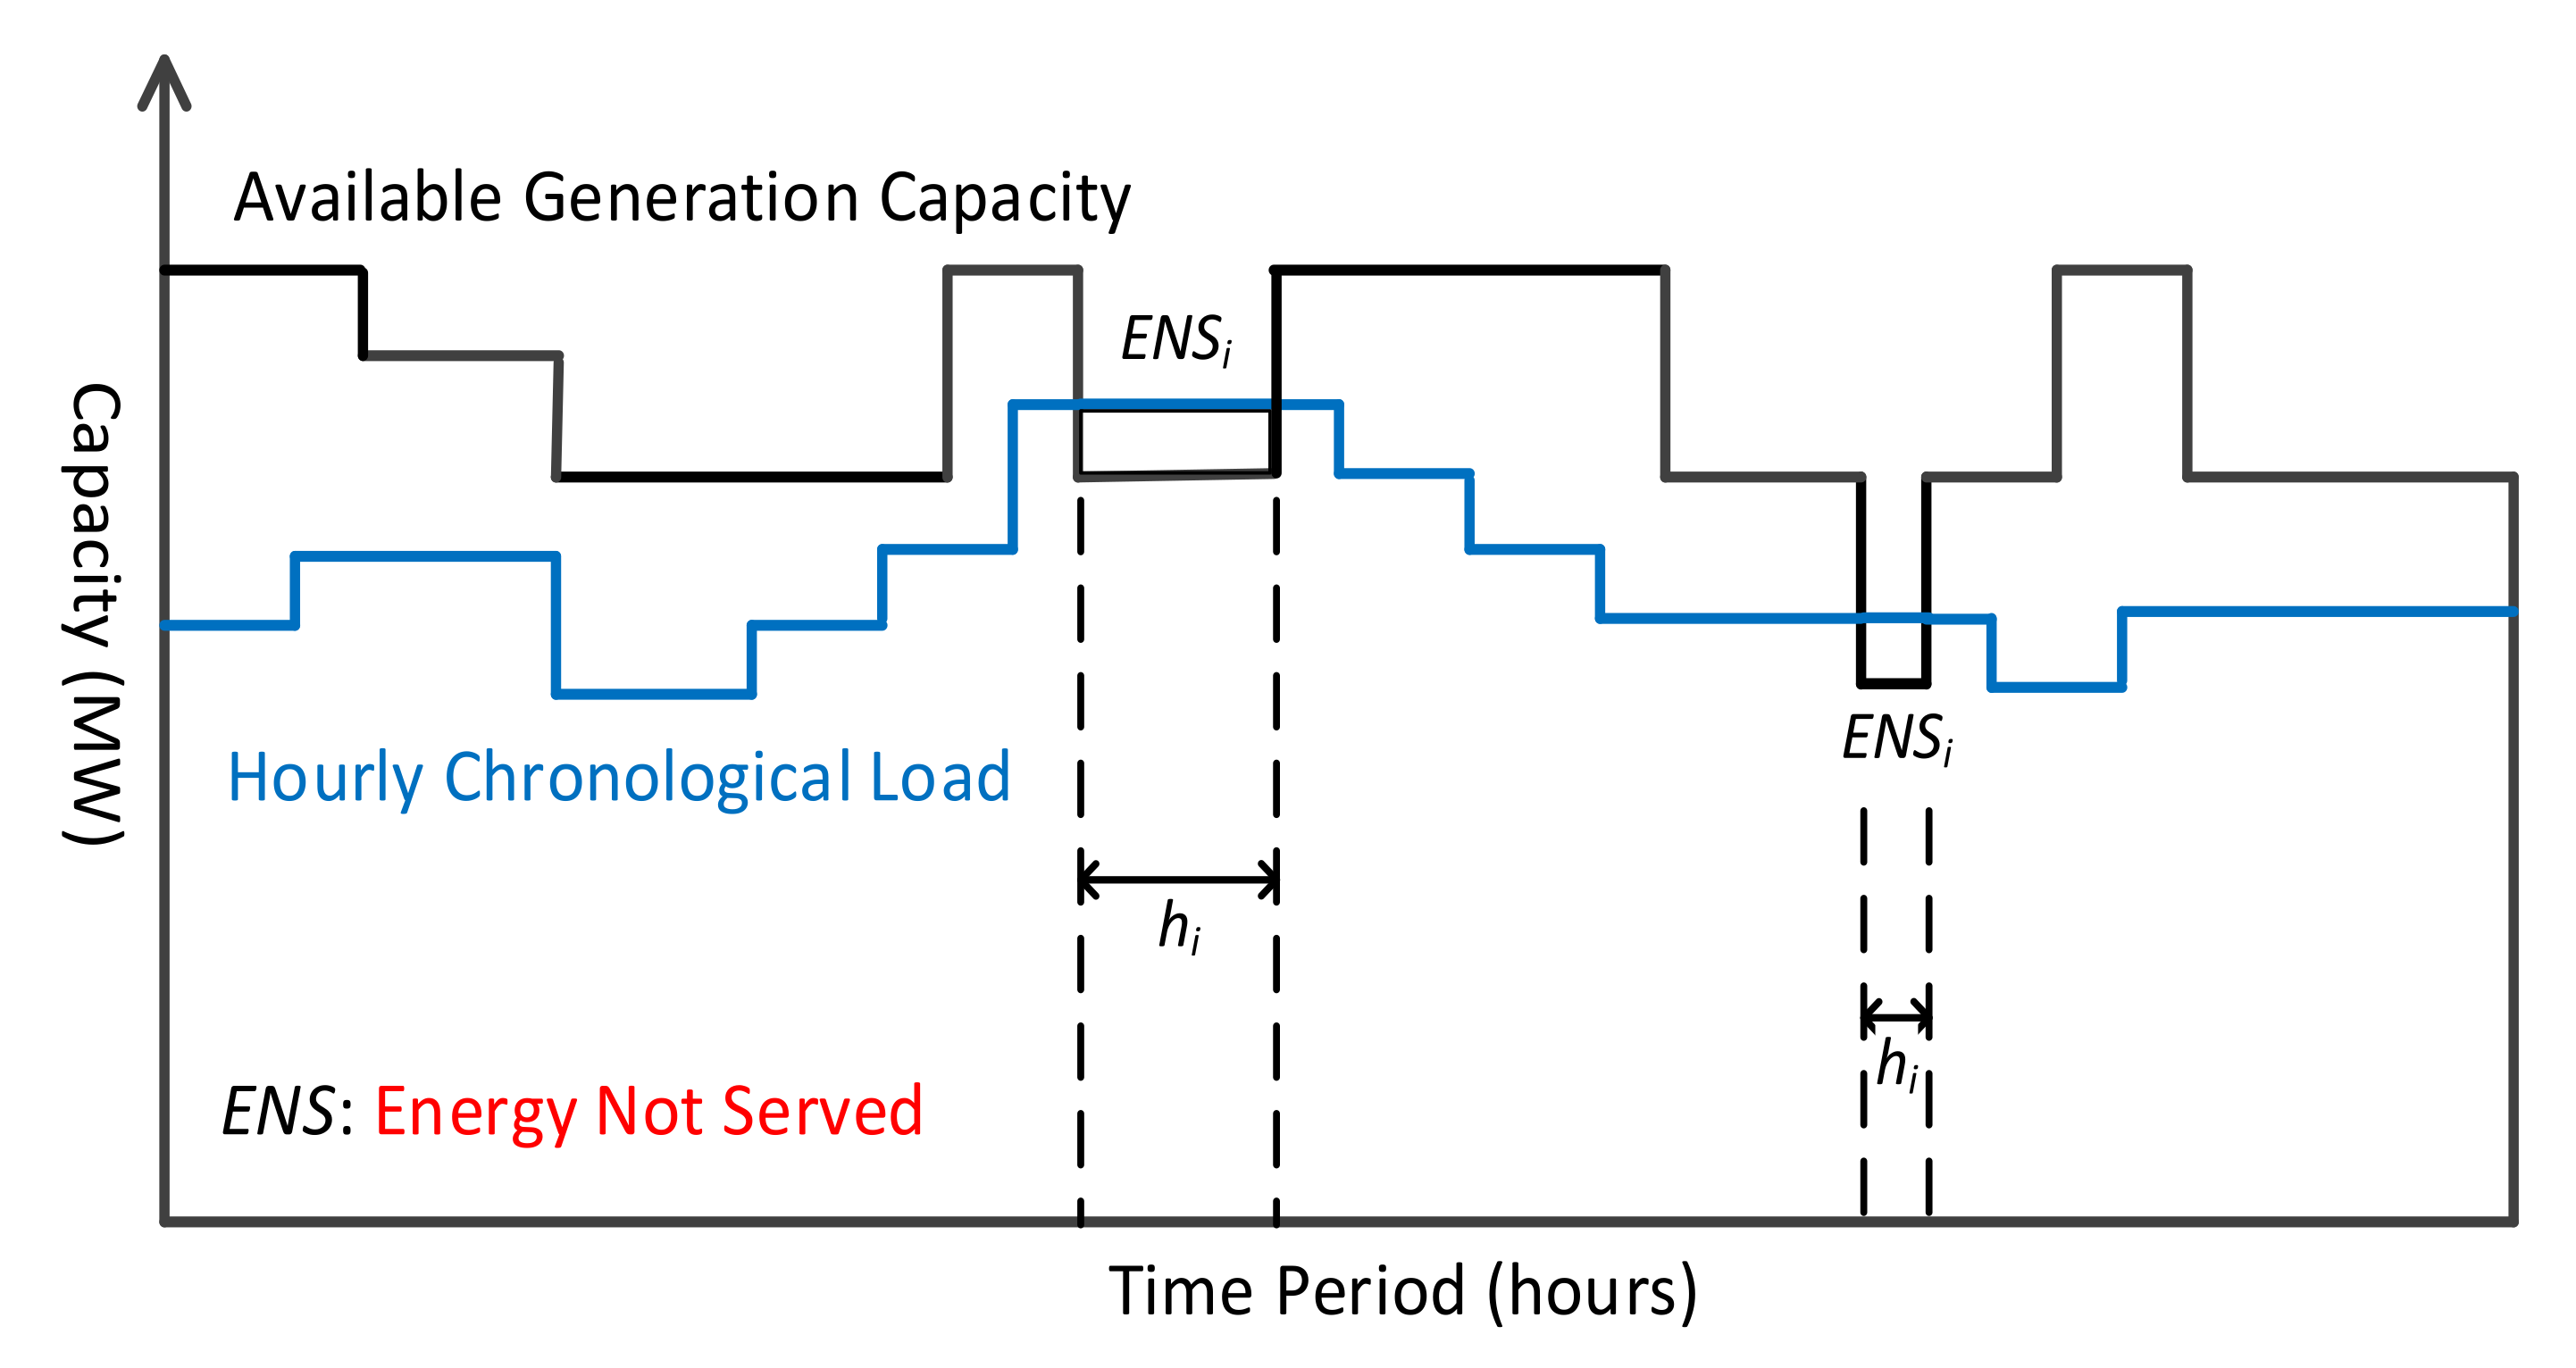
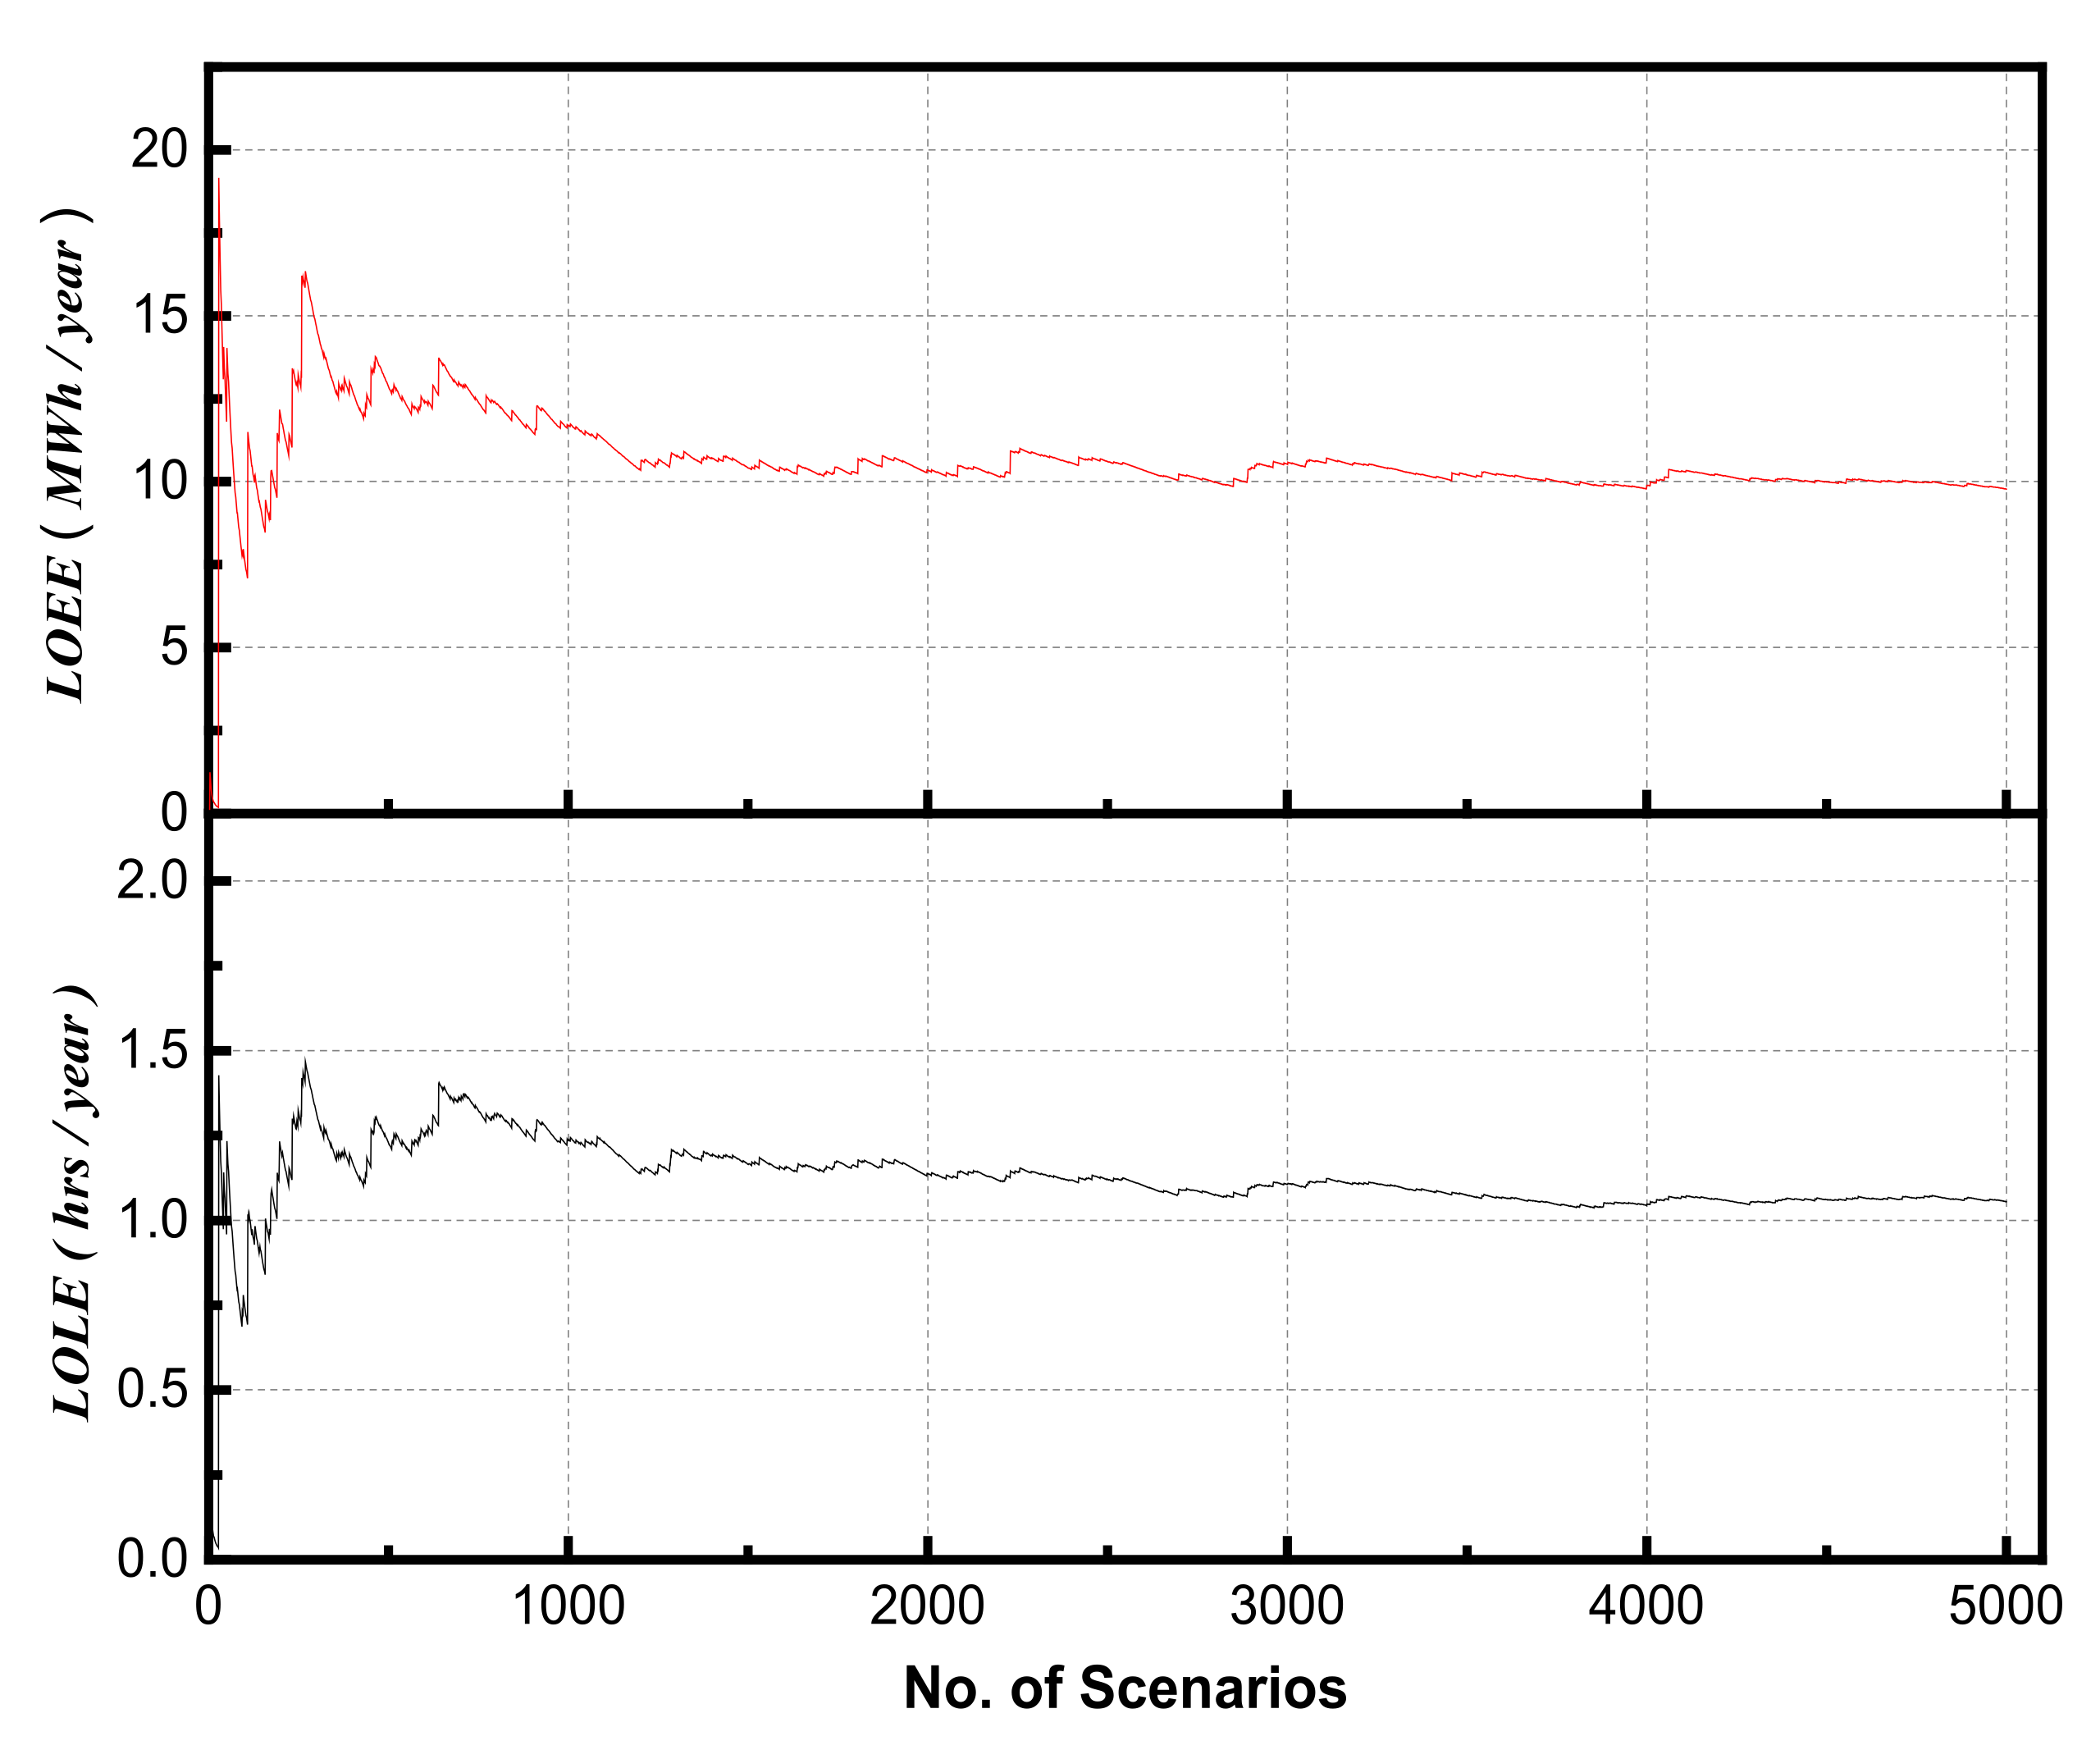
  • Various reliability indices, such as the Loss of Load Expectation (LOLE), Loss of Energy Expectation (LOEE), Loss of Load Frequency (LOLF), Energy Not Served per Interruption (ENSPI), System Average Interruption Frequency Index (SAIFI), and System Average Interruption Duration Index (SAIDI), are computed under different charging strategies to assess the impact of these strategies on the reliability of the power system.
The rest of the paper is organized as follows: Section 2 introduces the dynamic stochastic BEV consumption model, while Section 3 introduces the reliability analysis under different charging strategies. Section 4 presents the results and discussions, and Section 5 concludes the paper.

2. Dynamic Stochastic BEV Consumption Model

The stochastic model used in the reliability assessment of the power system is mainly composed of two successive submodels explained in the next subsections: the travel behavior submodel and the battery depletion submodel. The travel behavior submodel takes into consideration different trip purposes as well as the uncertainty and variability associated with trip distance, arrival, departure, and trip duration. The outcomes from the behavior submodel are used by the battery depletion submodel to estimate the energy consumed by the BEV during a trip. This energy is composed of two parts: traction effort and the energy required to maintain a comfortable temperature in the vehicle. The model is stochastic in nature and can be used for long-term studies, such as expansion planning, asset management, reliability analysis, and distributed generation allocation, among many others. For the purpose of illustration, we introduce one of the most important applications for this model: the reliability analysis of power systems.

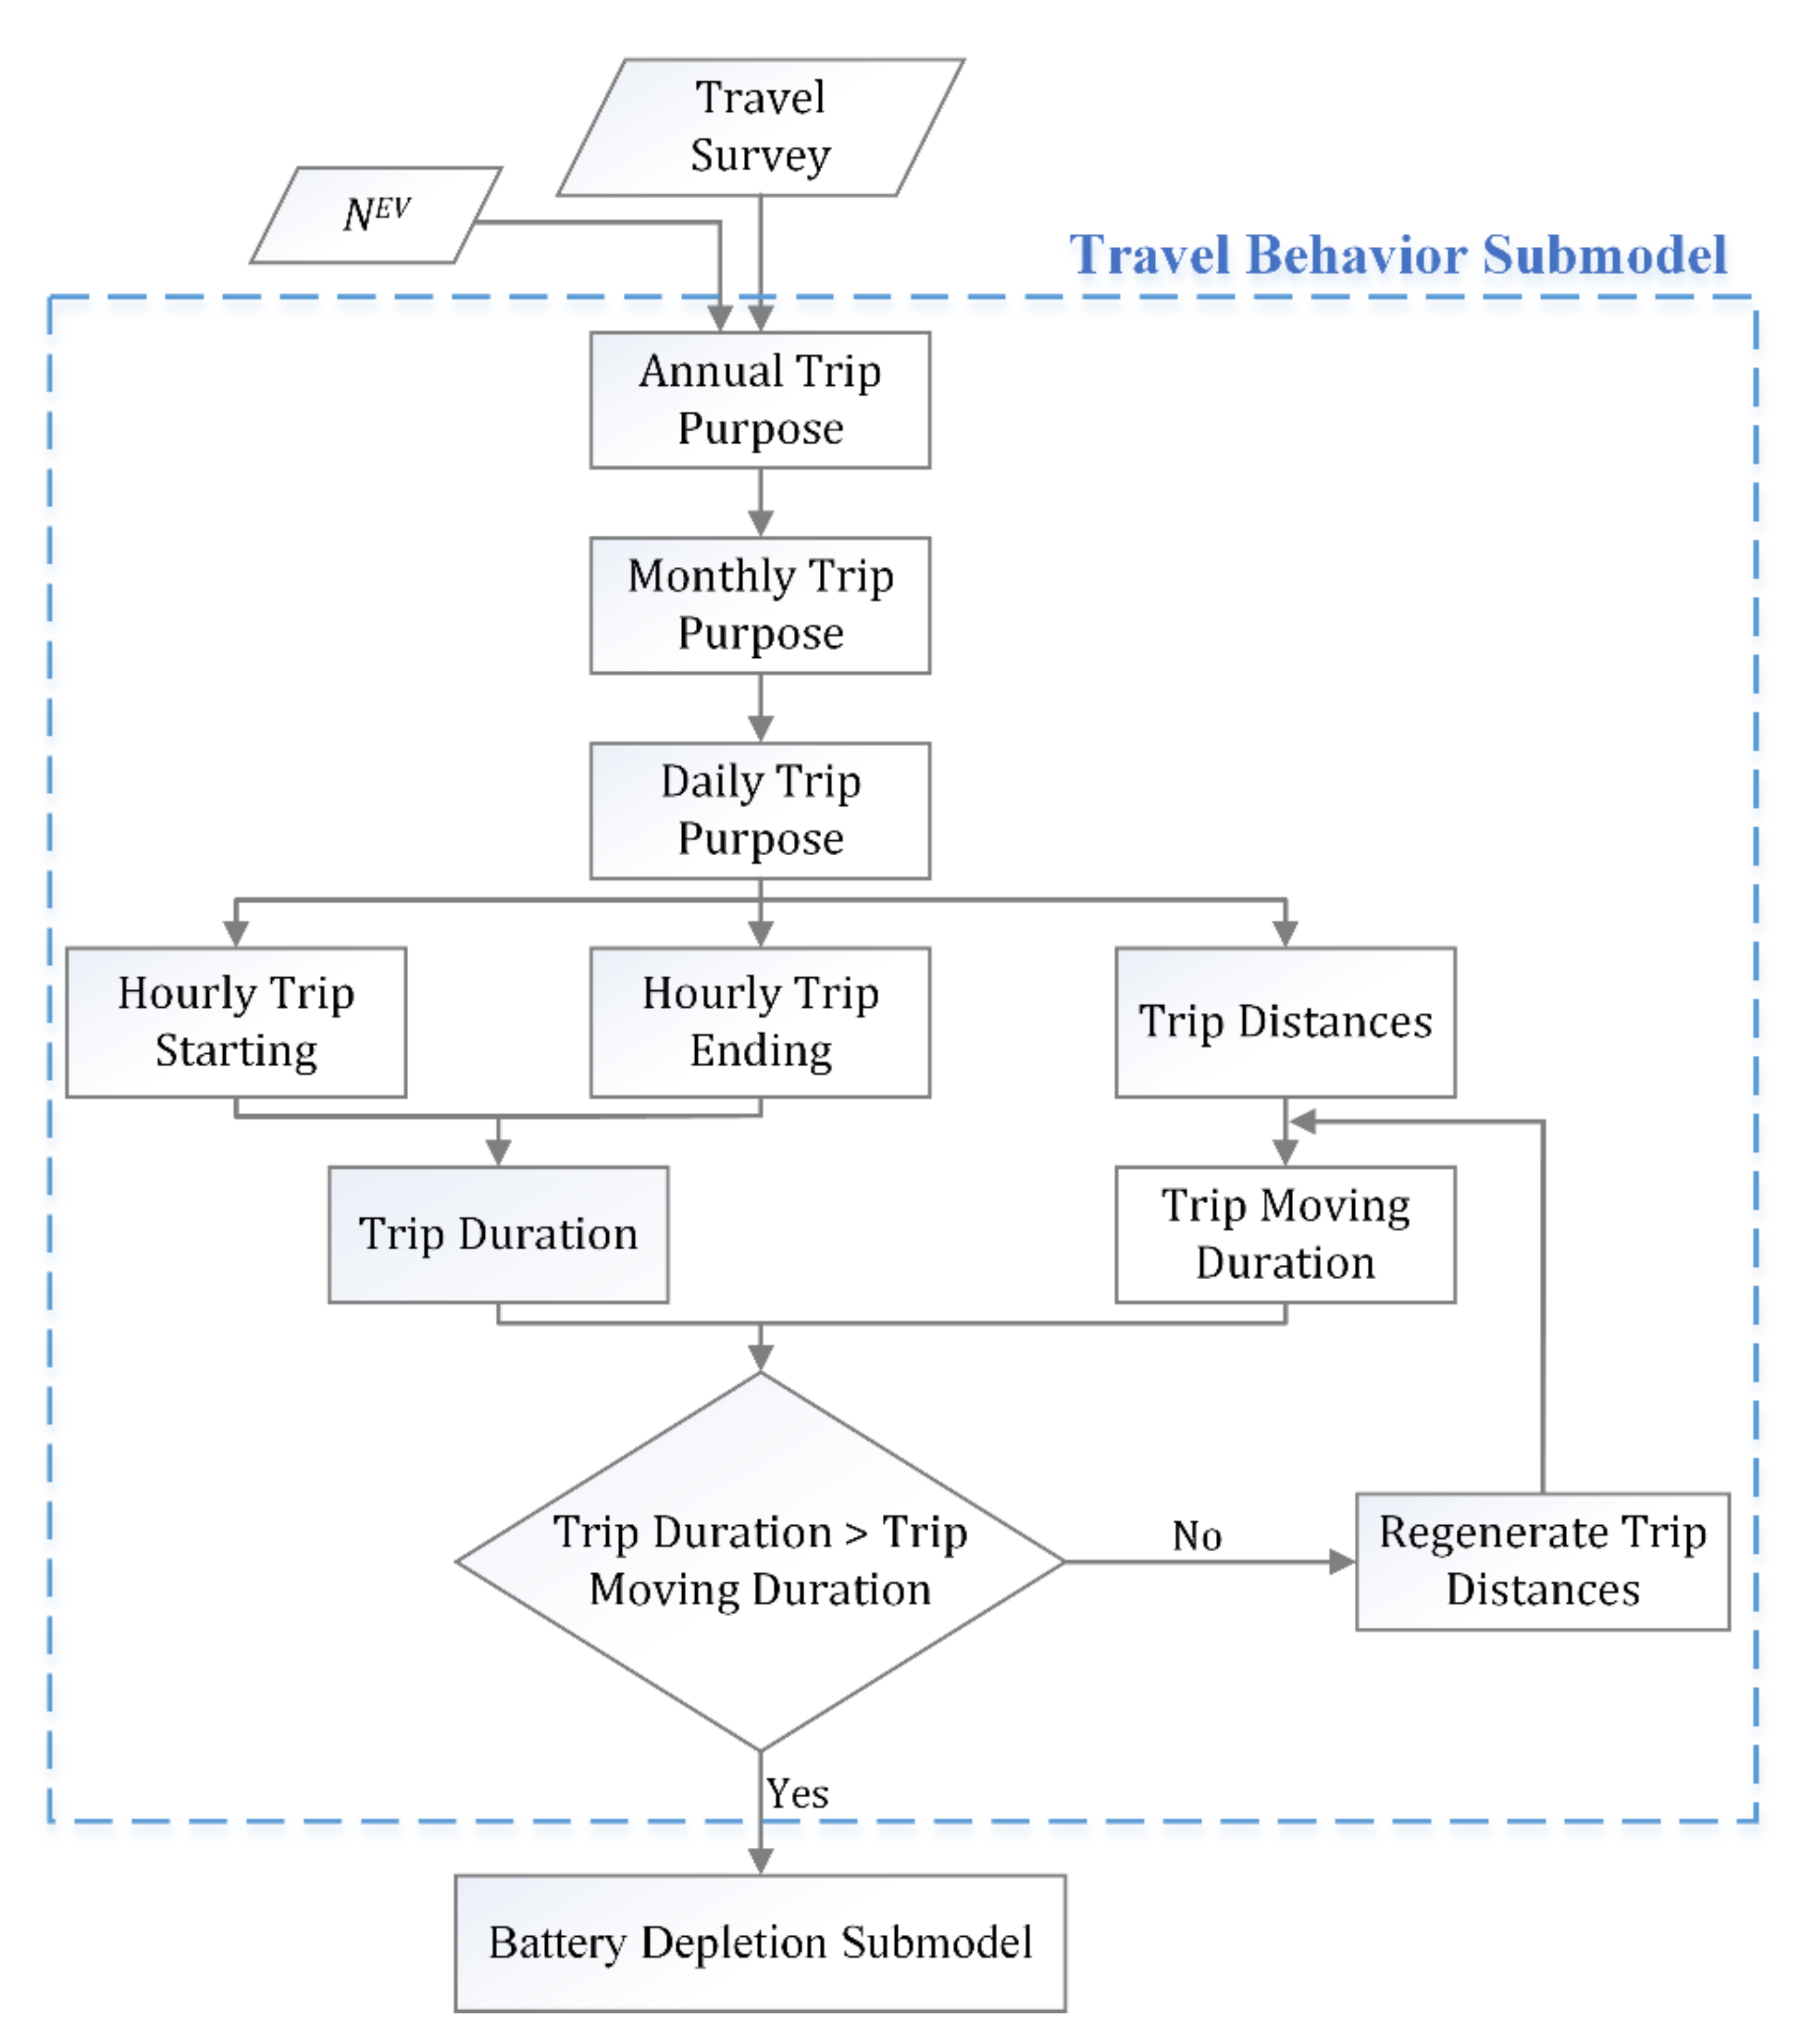
2.1. Travel Behavior Submodel

The overall model consists of two consecutive submodels. In this subsection, we introduce the details of the travel behavior submodel. This submodel is based on the nature of the various trips covered by BEV drivers. Specifically, the driving habits of BEV drivers are used to generate virtual trip scenarios including their purpose, start times, duration and distance. In our previous work in [8], we proposed a travel behavior model. This model takes into consideration the probability distribution functions (PDFs) of the trip ending times and durations, which are statistical functions that describe all of the possible values and probabilities for the trip ending times and durations within a certain range. It also considers different trip purposes, for instance, educational, shopping, or commuting, as shown in Table 1. We herein propose modifying this model to include the starting trip time of each vehicle. Therefore, another stage is added, which represents the probability of a trip of a particular purpose p to be started in a certain hour. The modified travel behavior submodel can present the starting and ending times of each vehicle in addition to the trip duration of each vehicle. This duration is used in the battery depletion submodel to calculate the dissipated energy from each vehicle’s battery, as will be shown in the sequel. The proposed travel behavior submodel is comprised of multiple steps. As shown in Figure 1, the submodel accepts the BEV fleet size N E V as an input, which is used to calculate the expected annual number of trips. These trips are then distributed according to the purpose, month, and day based on their corresponding probability distributions. Such information can be obtained through travel surveys.
Furthermore, the probability distributions of the trips’ starting times, durations and distance will be used to shape the generated trips. The details of these steps are described as follows. The first step is to generate the daily number of trips for each purpose in each month. Assuming that the size of the EV fleet is N E V and the average number of annual trips per vehicle is   N y r , the daily number of trips N p , m , d d a i l y for purpose p in month m and day d can be calculated as
N p , m , d d a i l y = N E V × N y r × P p p r p × P p , m m o n t h × P p , d d a y / N m w e e k   p 1 , , N p r p ,   m 1 , ,   12 ,   d 1 , , 7 ,
where P p p r p is the probability that the trip serves a specific purpose p , P p , m m o n t h is the probability that the trip with purpose p occurs in month m , P p , d d a y is the probability that the trip with purpose p occurs on day d , and N m w e e k is the number of weeks in month m . Note that the distribution of the monthly trips over the weeks is assumed to be uniform, which is reflected in the multiplier   1 / N m w e e k .
The probabilities in (1) belong to three categorical probability mass functions (PMFs) and are given for any random trip x as follows:
f p r p x = p = P p p r p f m o n t h ( x = m |   p ) = P p , m m o n t h f d a y ( x = d |   p ) = P p , d d a y
where f p r p , f m o n t h , and f d a y   are the PMFs for the purpose, monthly, and daily distributions of the trips, respectively. The PMF is a function that computes the likelihood of a discrete random variable, such as trip purpose, being equal to a given value.
Since the total number of starting and ending trips has to be equal to the number of daily trips, the daily trips are categorized twice according to their starting and ending time, as in (3) and (4) below
N p , m , d , h S t a r t _ h r = N p , m , d d a i l y × P p , h S t a r t _ h r     p , m , d   and   h 1 , , 24 ,
N p , m , d , h E n d _ h r = N p , m , d d a i l y × P p , h E n d _ h r     p , m , d   and   h 1 , , 24 ,
where N p , m , d , h S t a r t _ h r and N p , m , d , h E n d _ h r are the number of trips belonging to purpose p in month m on day d that start and end in every hour h , respectively.
To distribute the total number of daily trips N m , d d a i l y _ t o t = p N p , m , d d a i l y for all purposes across N E V EVs, the average number of trips per day for each vehicle is calculated as μ m , d d a i l y = N m , d d a i l y _ t o t / N E V and the relative standard deviation (RSD), defined as the ratio of the standard deviation to the mean, is assumed to be known. The RSD is used as a measure of dispersion for the lognormal distribution representing the number of daily trips per EV in which the logarithm is normally distributed.
Finally, the distances for each trip are to be assigned. This is performed by generating a virtual trip distance D p , m , d according to the purpose of each trip using the inverse cumulative distribution function (CDF) F p 1 , given the parameters of pdf for each trip purpose in Table 2, of the trip distances as
D p , m , d = F p 1 U , μ / c ,     σ / k
where U is a normally distributed random variable which has a value between 0 and 1, μ and σ are the mean and the standard deviation of Lognormal pdf respectively, and c and k are the shape and scale of the Weibull PDF respectively in Table 2. Table 2 shows the parameters of the different purposes used in the travel model illustrated in Table 1, which is acquired via the National Travel Survey [28]. In this survey, four PDFs, which are exponential, lognormal, gamma and Weibull, are used to fit the actual data of each purpose. The exponential distribution is associated with the Poisson distribution, which specifies the frequency of occurrence of an event. The exponential distribution’s “memoryless” property asserts that an object’s future lifespan will follow the same distribution as its previous lifespan. The lognormal distribution is often employed when values are favorably skewed and cannot go below zero. In the same context, the Gamma distribution is related to the lognormal, exponential, Pascal, Erlang, Poisson, and chi-square distributions and it is used to estimate the time interval between occurrences. Finally, the Weibull distribution is frequently used in reliability studies to characterize failure duration and material breaking strengths in quality control tests. Depending on the shape parameter, the Weibull distribution may reflect the exponential, Rayleigh, or other distributions. When the Weibull shape parameter is equal to 1, the Weibull distribution is comparable to the exponential distribution. With the closed PDF, for each purpose, actual data which have the highest likelihood are selected and their parameters are determined based on the highest likelihood method [28] as shown in Table 2.
For each generated trip, the generated trip distance in (5) should match the trip starting and ending times calculated from (3) and (4), i.e., D p , m , d T p , m , d e n d T p , m , d s t a r t . If not, the model will regenerate another random trip distance using (5).
The outputs of the BEV travel behavior submodel that need to be fed to the battery depletion submodel are the purpose and the distance, in addition to the starting and ending times for all the daily trips for each EV in the fleet.

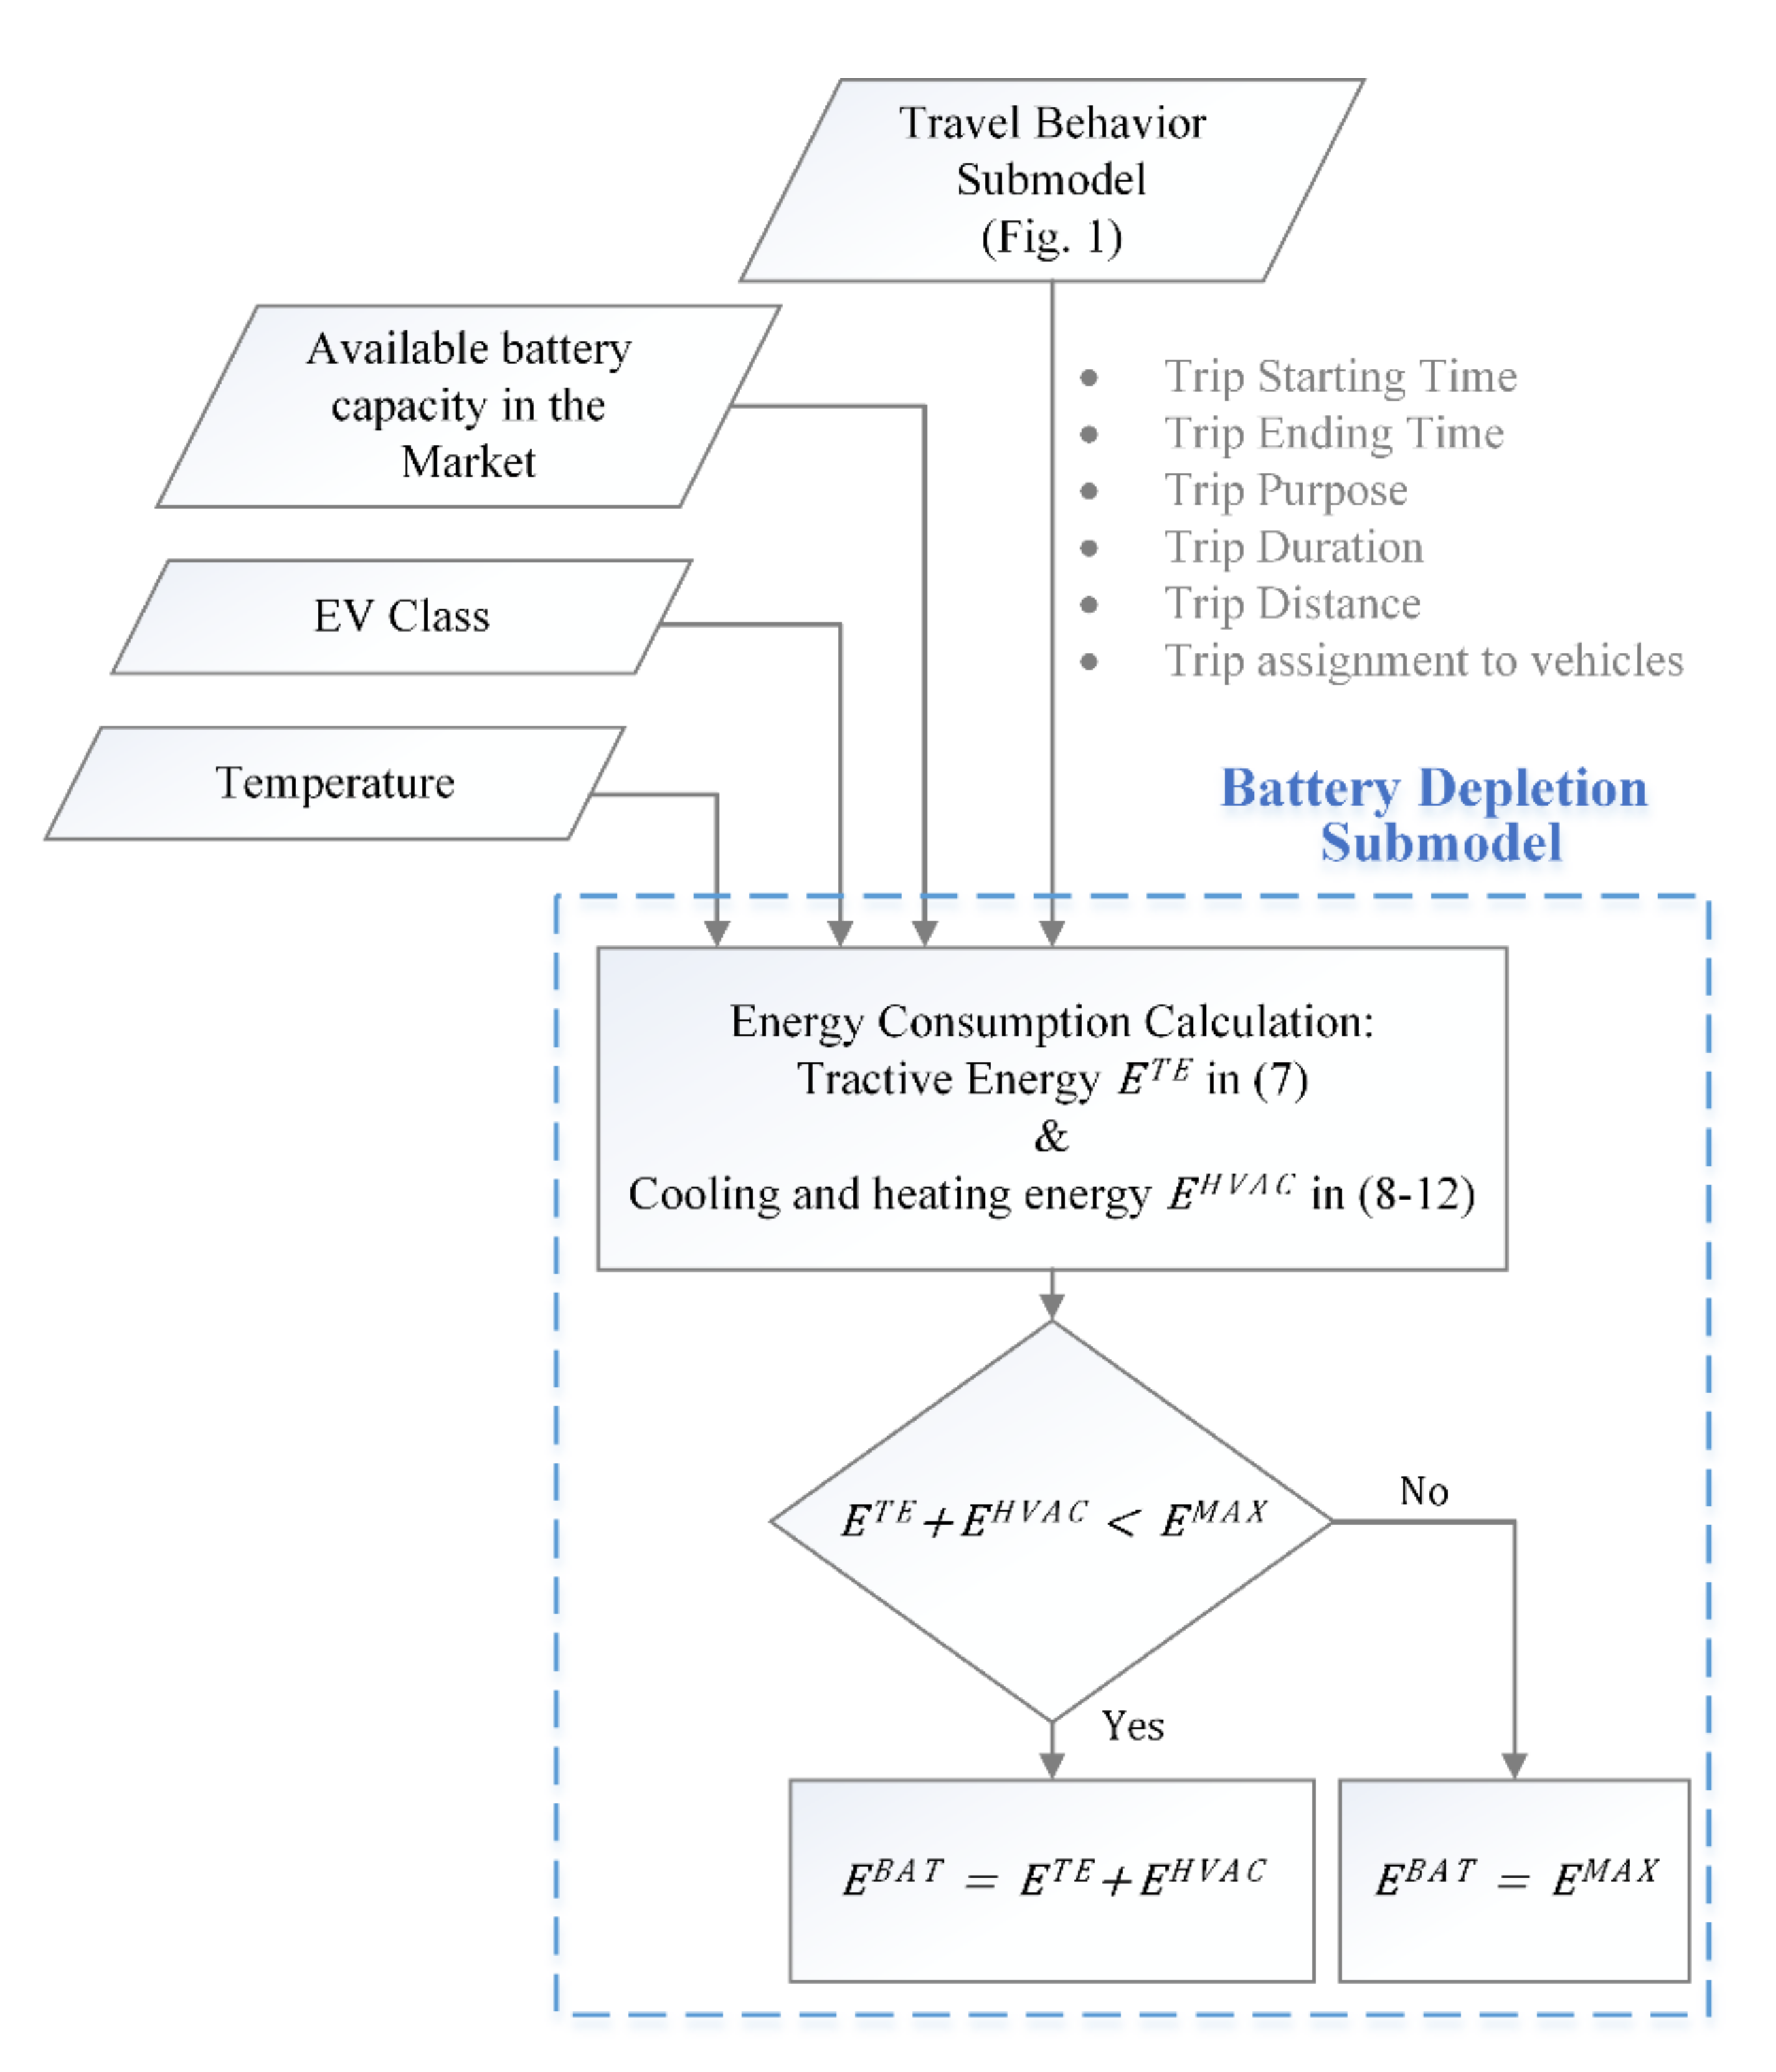
2.2. Battery Depletion Submodel

In this subsection, the submodel of the energy consumed from the onboard batteries by a fleet of BEVs is explained. This submodel utilizes the outcomes from the previously discussed travel behavior submodel.
The battery depletion submodel also considers additional energy consumption due to the usage of A/Cs or heaters based on the daily average temperature. Based on the outcome of the travel behavior submodel along with the average hourly temperature data, the battery depletion submodel is proposed as shown in Figure 2. The submodel determines the energy consumed from the battery of each BEV to cover its trips. This battery depletion submodel is built while considering the same assumptions in [8].
The associated energy depleted from the battery can then be obtained as in Equations (6)–(13), which are modified from [8]. The total depleted energy from the BEV battery is the minimum energy required to cover the trip and the maximum useful energy available in the battery, as in (7). The battery useful energy E v M A X is generated virtually for each vehicle in each class c using the CDF of the PMF extracted from the market share of available BEV models. Assuming that B represents the set of all batteries, then the PMF of class c   describing any random vehicle in this class to have the battery size corresponding to b   B can be defined as
f c B A T x = b = P b B A T
Furthermore, the energy required to cover the trip is composed of two parts: the tractive energy E v ,   t T E and the energy required for cooling or heating   E v ,   t H V A C . The tractive energy in kWh defined in (8) represents the inertia of a vehicle and the road resistance energies, where v and t are the vehicle and trip indices, respectively; T E v is the average required energy for traction per mile for vehicle v ; and η v t o t is the total efficiency, including the efficiency of the battery, the power electronics converters, and any accessories. Each vehicle v V is assigned to one of the four classes   V c V , where V c is the subset of vehicles in class   c . For all the classes, these subsets represent partitions of   V . The traveled distance D v ,   t is one of the outcomes of the travel behavior submodel.
E v ,   t B a t = min E v ,   t T E + E v ,   t H V A C ,   E v M A X ,
E v ,   t T E = D v ,   t × T E v η v t o t   ,
The E v , t H V A C defined in (9) is the energy required to keep the vehicle and the battery within acceptable ranges. In addition to the energy required by the heater E v , t H T and the A/C E v , t A C , the battery pack may need cooling as its temperature can reach critical levels as high as 65 °C in hot climates [29,30]. These high temperatures reduce the battery life as well as increasing self-discharge [29,30,31]. To cool the battery pack, the refrigeration circuit of the A/C and a secondary coolant circuit are used, which are powered by the battery itself. Thus, we define the third part of E v , t H V A C to be the energy required E v , t B C for cooling the battery. Θ A C ,   Θ H T and Θ B C are the temperature thresholds in °C for operating the A/C, the heater, and the battery cooling system, respectively. S t A V G t r i p is the average speed in mph for a trip t . Using the travel behavior submodel, each trip t is assigned to one of the N p r p purposes, where each purpose has a unique average speed S p A V G p u r p o s e . The trip duration T v , t D in h can be calculated as in (10). W A / C v S t a r t and W H T v S t a r t are the consumed power in kW by the A/C and the heater during the starting period T A / C S t a r t and T H T S t a r t for A/C and heater, respectively. W A / C v C o n t and W H T v C o n t are the consumed power in kW by the A/C and the heater, respectively, during continuous operation for the passengers. Finally, W v B C is the power in kW consumed by the battery cooling system.
As shown in (11) and (12), the energy consumed by the A/C or the heater is the energy consumed during the starting period plus the energy consumed during normal continuous operation. For the battery cooling system, the power consumption is constant whenever the temperature exceeds Θ B C , as in (13).
E v ,   t H V A C = E v ,   t A C + E v ,   t B C + E v ,   t H T ,
T v , t D = D v ,   t S t A V G t r i p ,
E v ,   t A C = W A / C v S t a r t   T v , t D T v , t D T A / C S t a r t W A / C v S t a r t T A / C S t a r t + W A / C v C o n t T v , t D T A / C S t a r t T v , t D > T A / C S t a r t Θ A C Θ t A V G , 0 elsewhere
E v ,   t H T = W H T v S t a r t   T v , t D T v , t D T H T S t a r t W H T v S t a r t T H T S t a r t + W H T v C o n t T v , t D T H T S t a r t T v , t D > T H T S t a r t Θ H T Θ t A V G , 0 elsewhere
E v ,   t B C = W v B C   T v , t D Θ B C Θ t A V G 0 elsewhere ,

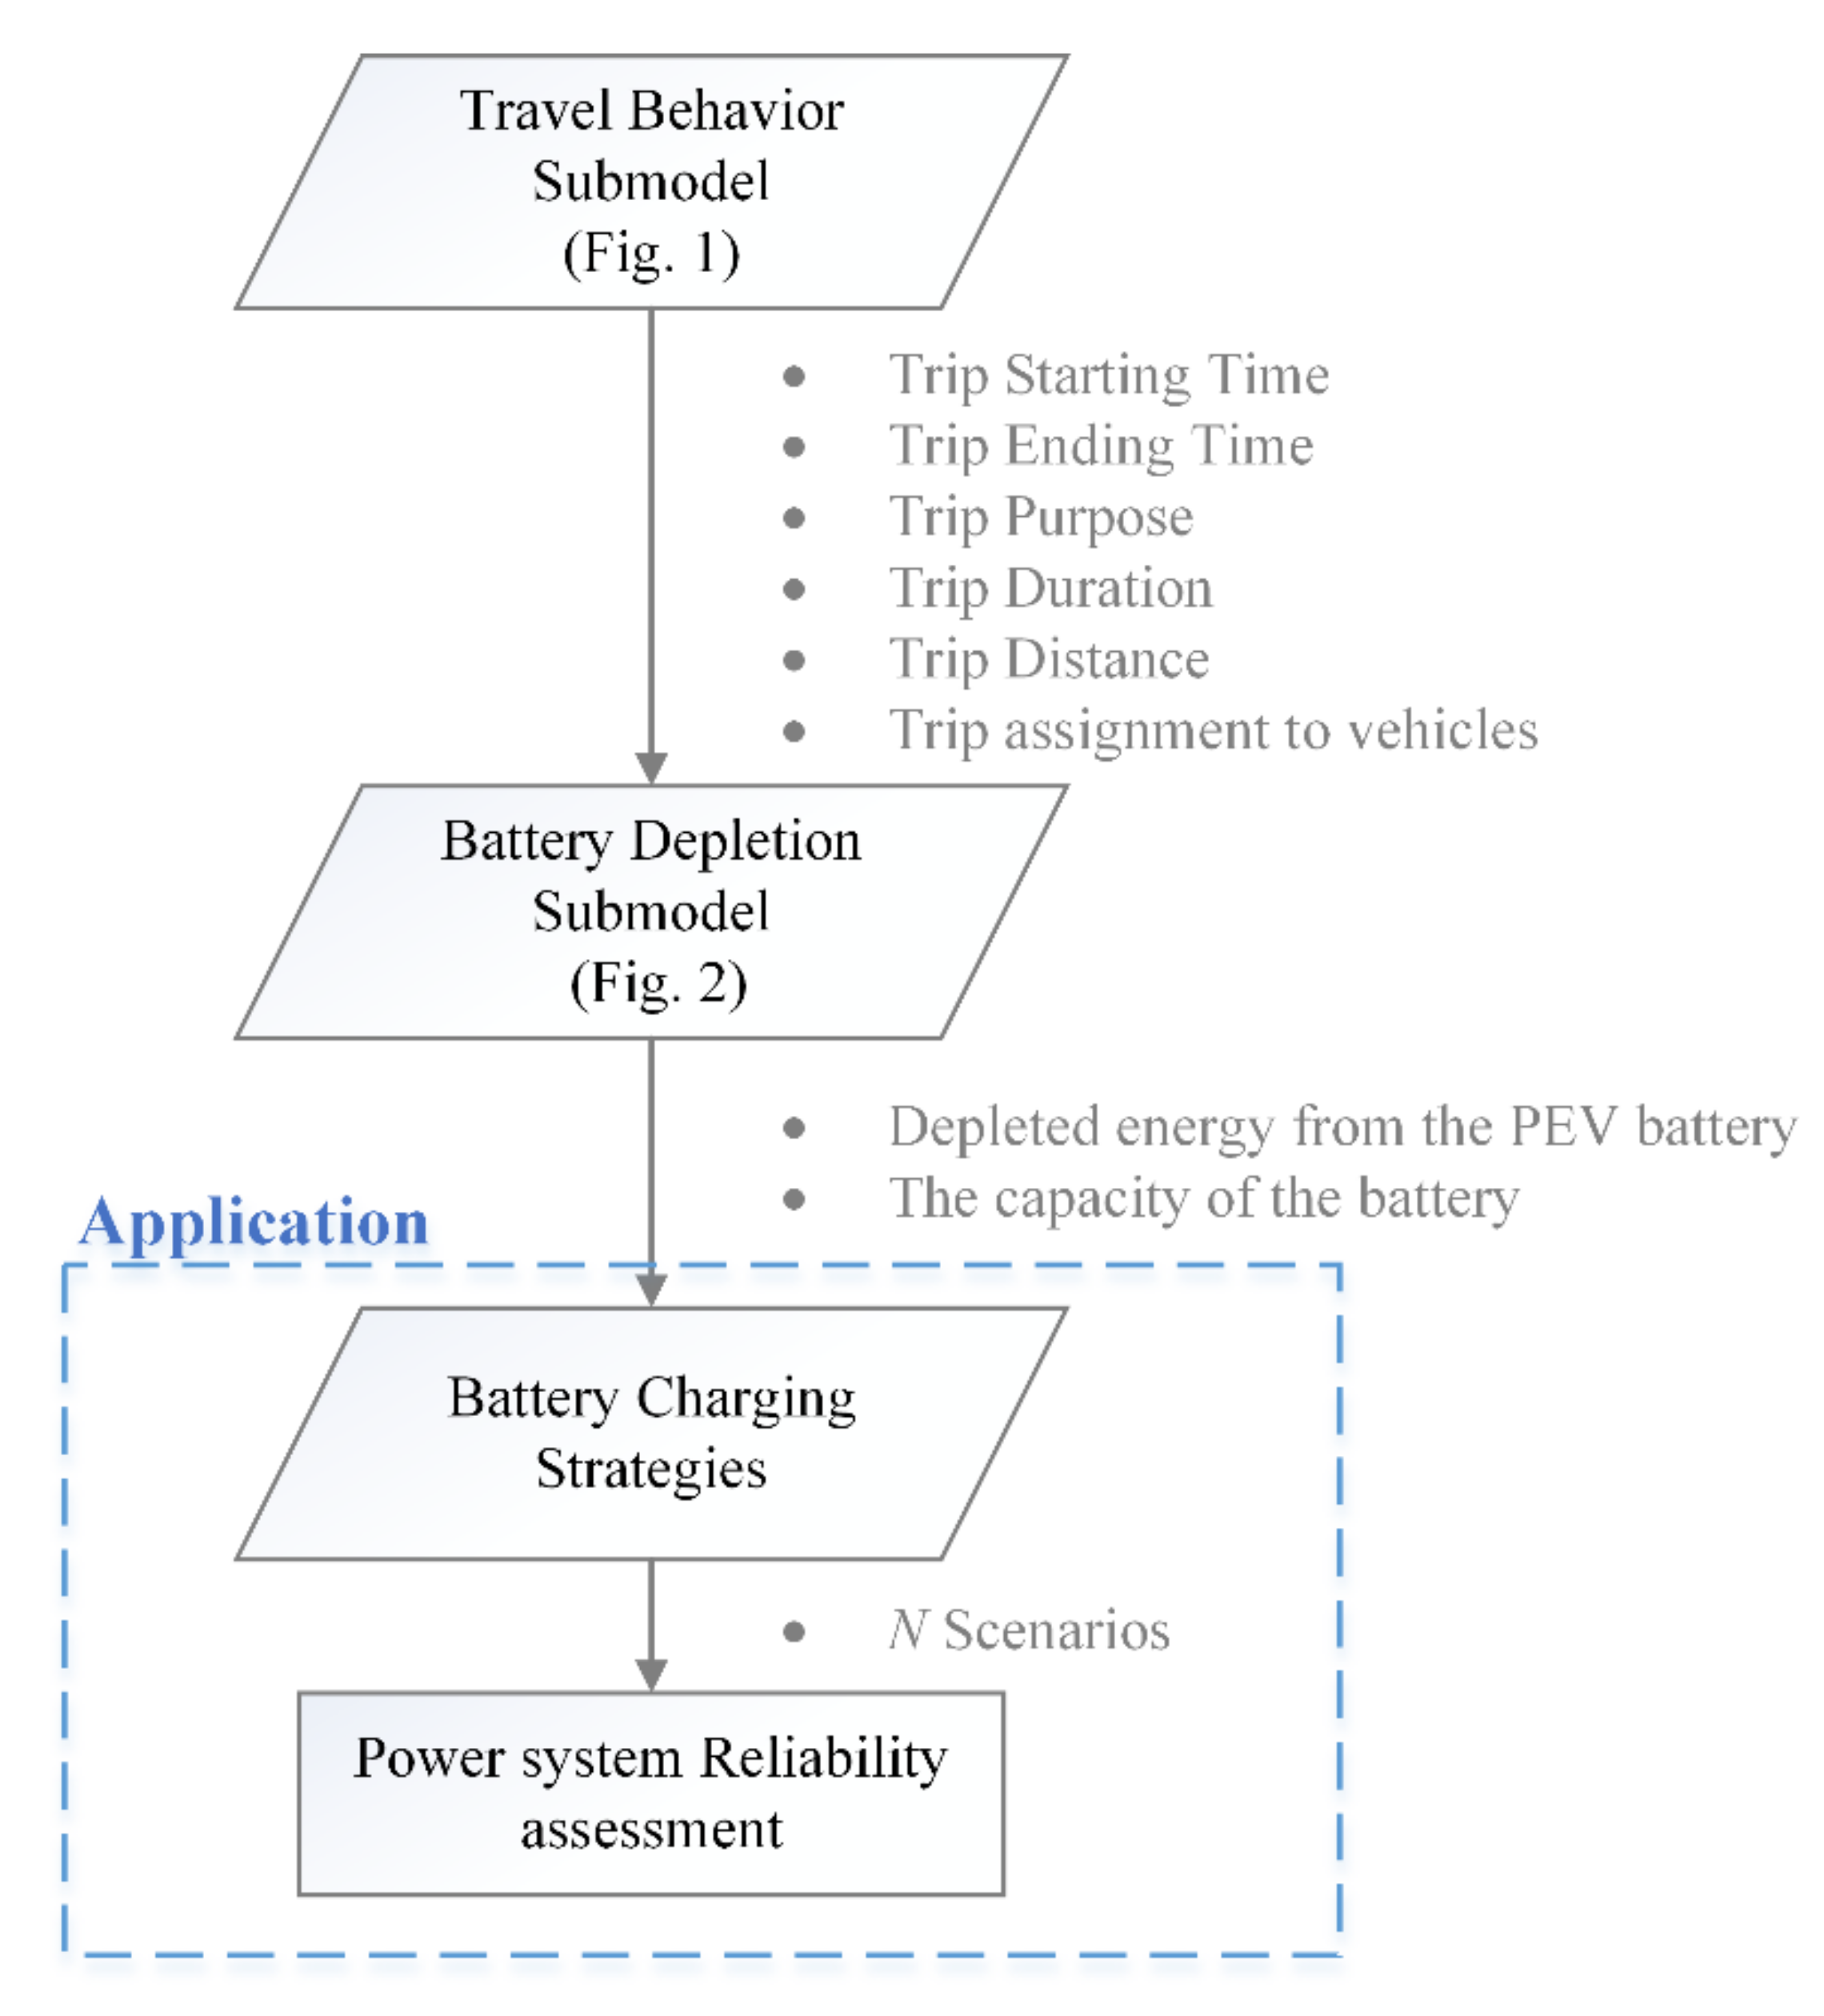
3. Reliability Assessment under Different Strategies

Reliability studies are usually conducted based on analytical or chronological probabilistic models. Since the EV consumption has to be modeled chronologically, the study will follow the chronological probabilistic modeling approach, where virtual scenarios of generation and demand have to be developed and used to calculate the reliability indices.
In this work, the conventional generating units are represented by two states—fully rated or failed state. To generate virtual scenarios of the time-to-fail ( T T F ) and the time-to-repair ( T T R ), we use the exponential CDF as in (14) and (15), where M T T F and M T T R are the mean-time-to-fail and the mean-time-to-repair in years, respectively. U f is a uniformly distributed random number between 0 and 1, corresponding to interruption f .
T T F f = M T T F 8760 L n   U f  
T T R f = M T T R 8760 L n   U f
Failures in the generation units may cause load interruption, as shown in Figure 3. Then, for any interruption   i , the amount of energy not served E N S i and the duration h i can be determined, as shown in Figure 3.
The different reliability indices can be categorized into two types: annual system and interruption indices. The annual system indices category includes the Loss of Load Expectation (LOLE) in h/yr, Loss of Energy Expectation (LOEE) in MWh/yr, and Loss of Load Frequency (LOLF) in interruption/yr (int./yr), while the Energy Not Served per Interruption (ENSPI) in MWh/int., System Average Interruption Frequency Index (SAIFI) in interruption/customer (int./cu.) and System Average Interruption Duration Index (SAIDI) in h/cu. can be considered interruption indices. For N I interruptions in N   years, these reliability indices can be calculated as in (16)–(21).
L O L E = i = 1 N I h i N ,
L O E E = i = 1 N I E N S i N ,
L O L F = N I N ,
E N S P I = i = 1 N I E N S i N I = L O E E L O L F   ,
S A I F I = T h e   n u m b e r   o f   c u s t o m e r s   i n t e r p u t i o n s T o t a l   c u s t o m e r s   s e r v e d ,
S A I D I = T o t a l   d u r a t i o n s   o f   c u s t o m e r s   i n t e r p u t i o n s T o t a l   c u s t o m e r s   s e r v e d
For the normal load, the Roy Billinton Test System (RBTS) load profile will be used in this study. On the other hand, for the BEV consumption, the outcomes from the dynamic model in Section 2 are utilized to assess the power system reliability and thus, establish reliability indices for the integrated normal electric demand and transportation electrification demand under different charging strategies. As shown in Figure 4, the developed group of virtual trips with different start and end times, including the depleted energy from the batteries, are fed to the reliability assessment stage. The reliability assessment stage then translates the outcome of our model to energy consumption based on the desired charging strategy to model the interactions between the integrated systems, and thus study the effect of BEV penetration on the power system reliability.
Examples of the different charging strategies in Figure 4 may include:
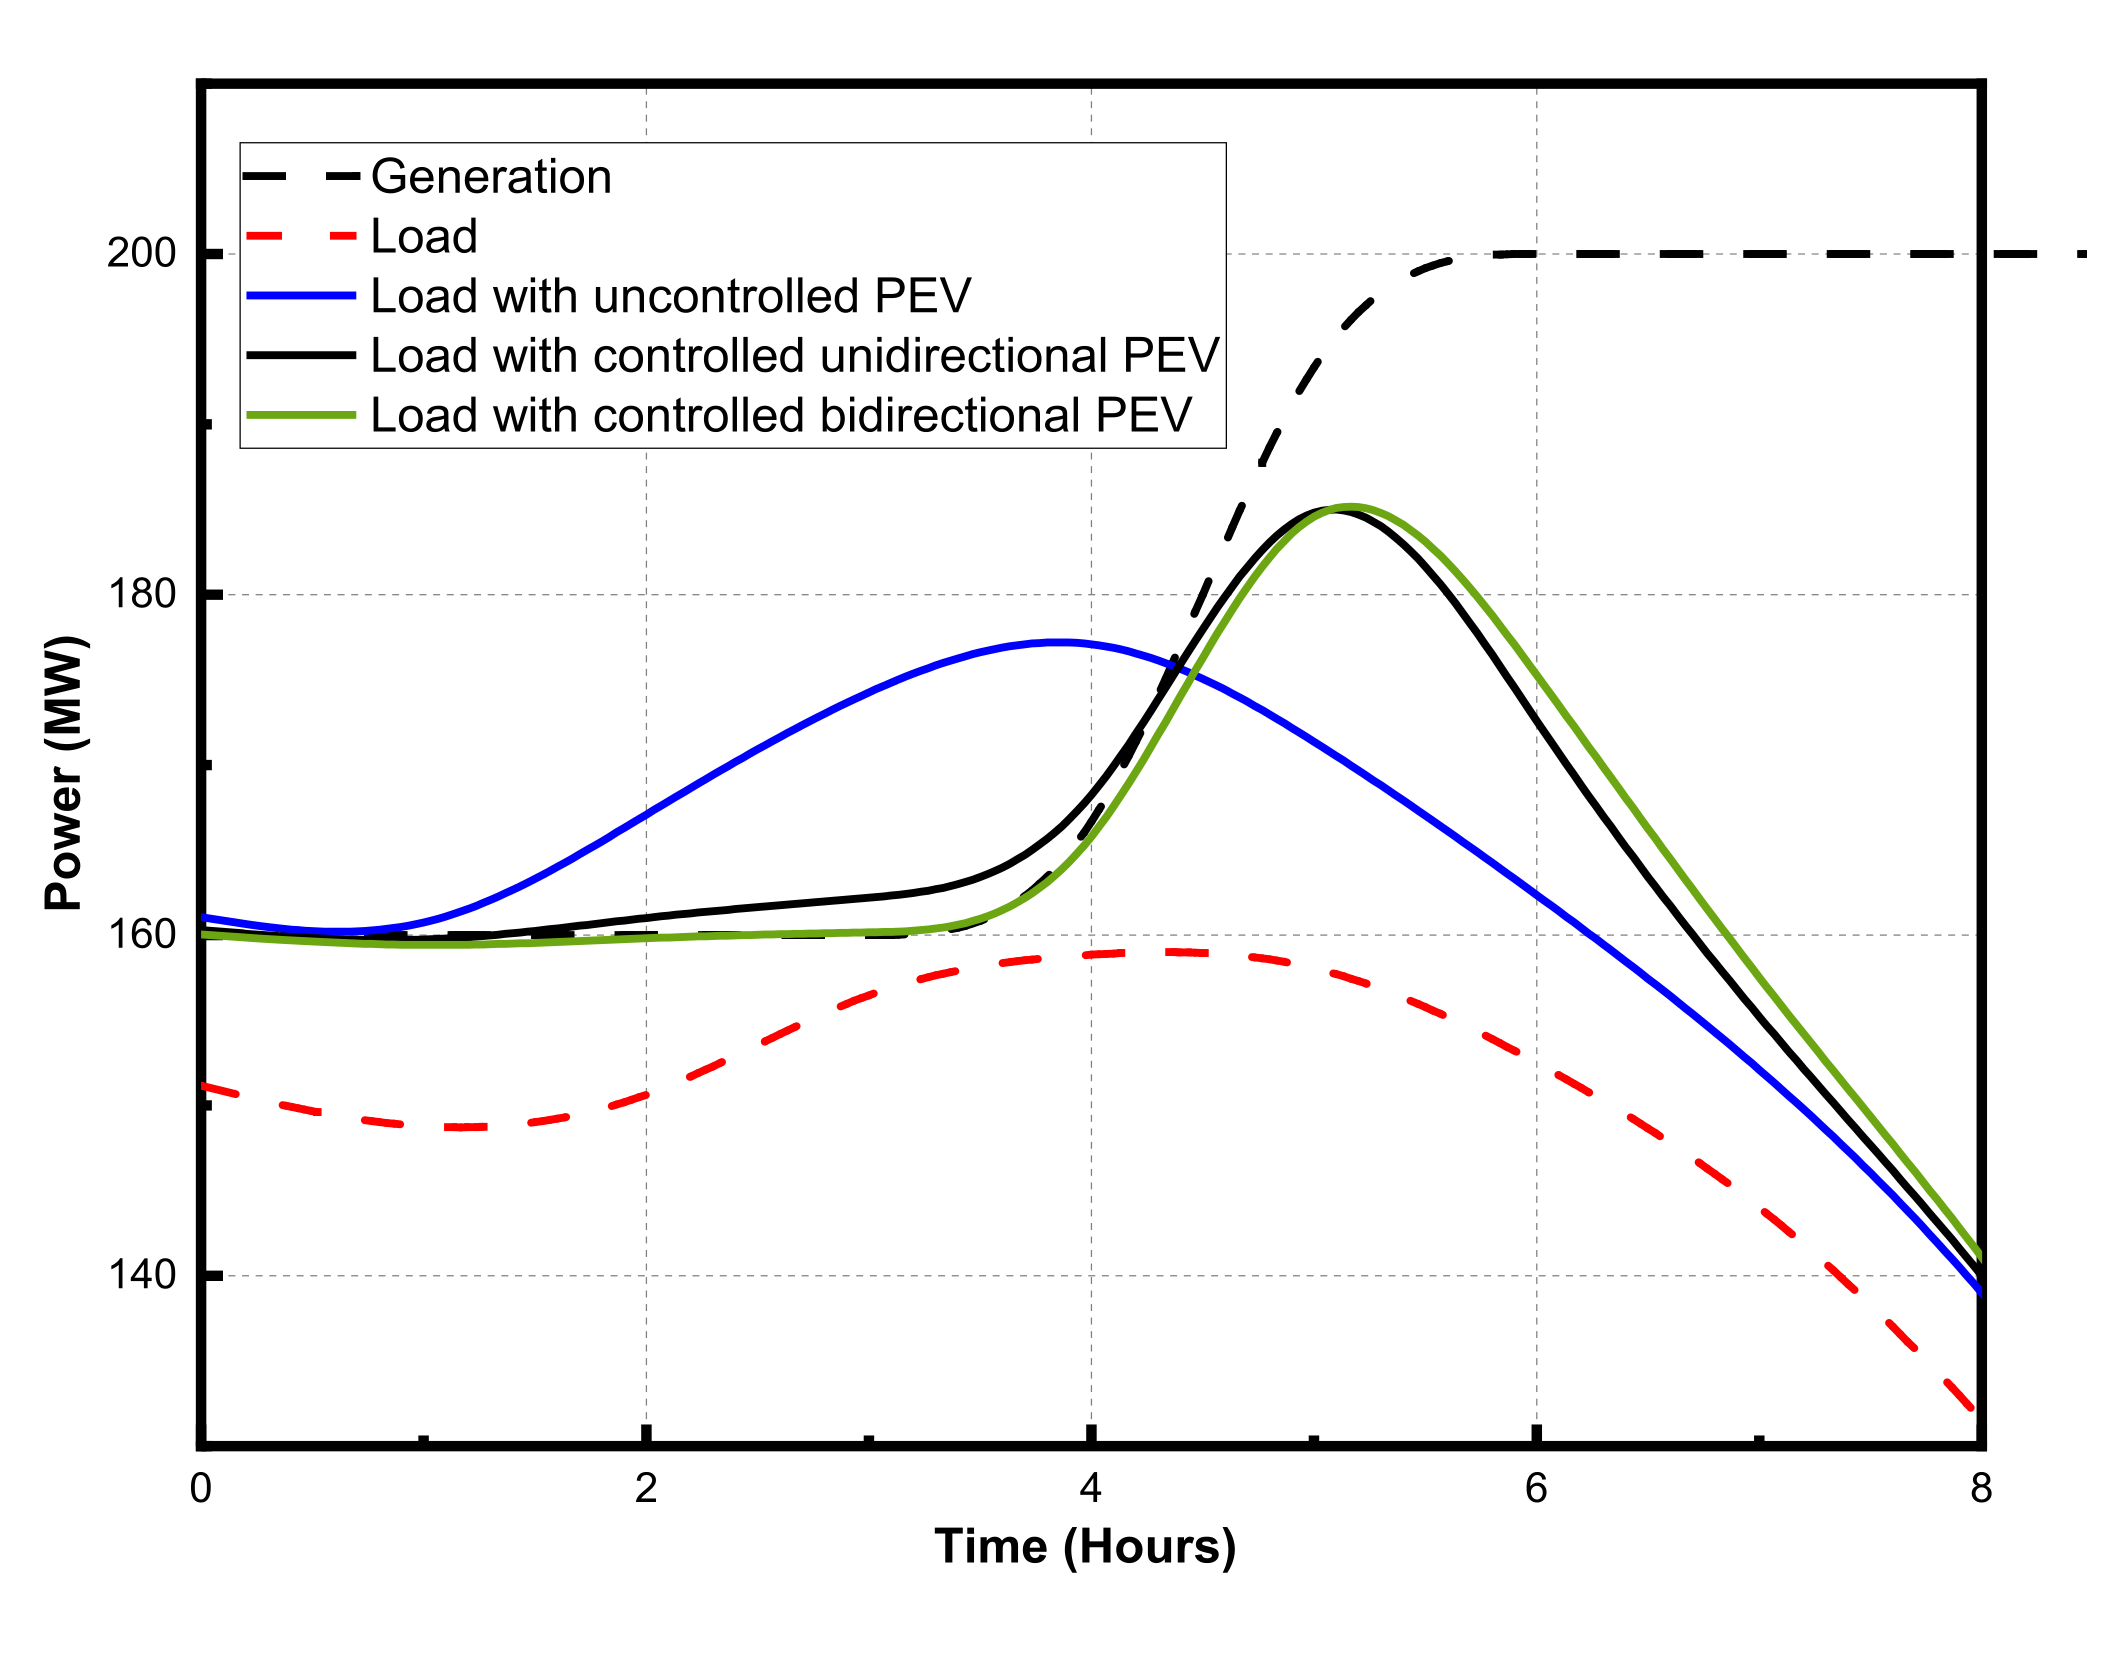
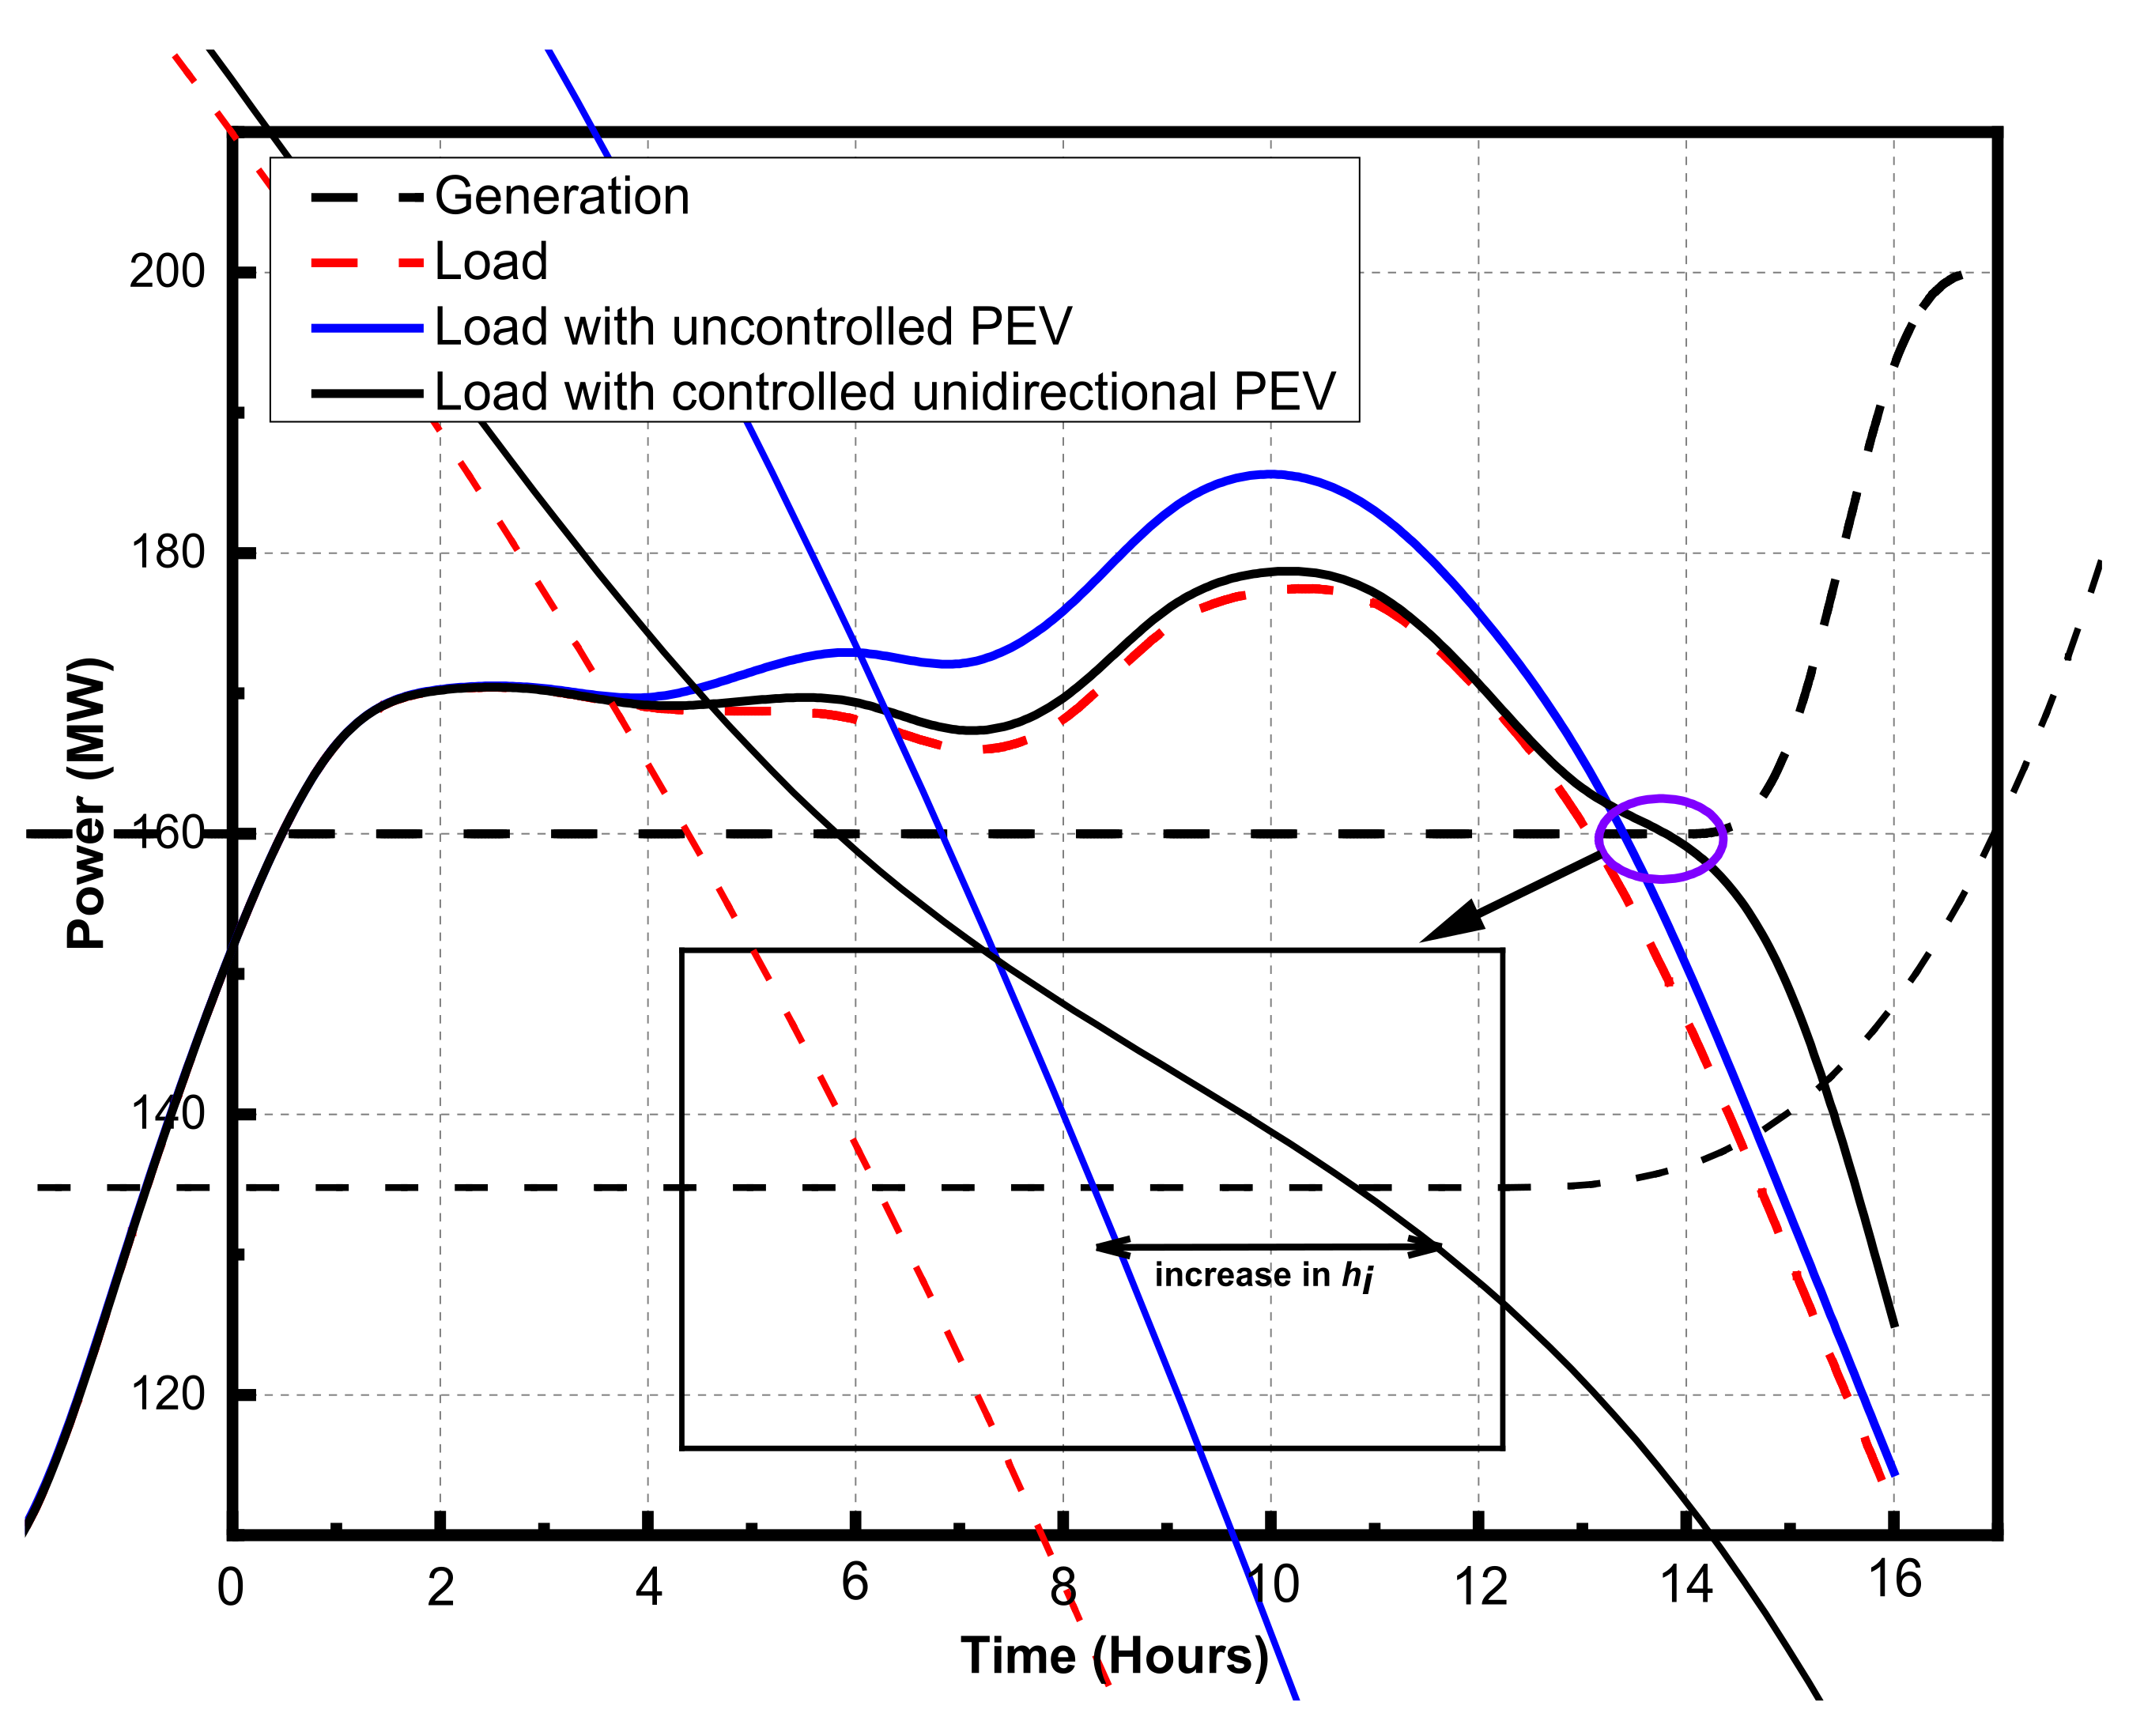
  • Uncontrolled G2V charging strategy [32], where the power flow is only unidirectional from the grid to the BEV. The BEVs start charging once plugged into the charger without supervision.
  • Controlled G2V charging strategy [33], where the power flow is still in one direction from the grid to the BEV. However, the EV chargers accept external control signals to enable/disable the charging process and control the level of charging. This external control signal can be sent by the BEV owner, the utility, or a third party subject to appropriate contracts or agreements.
  • Controlled Bidirectional Strategy [34], where the power flow may be in two directions, G2V or V2G. The BEV may discharge to the grid during load peak periods, which can help enhance the power system reliability and stability as well as relief congestions.
  • Indirect Controlled Bidirectional Strategy [35]; in this strategy, the power flow can be in both directions. The advantage of this approach is that smart coordination can be used to determine the optimal periods of charging to decrease the energy cost in addition to the advantages of the controlled bidirectional strategy, where the charging is indirectly affected by energy prices.
Thus, utilities can compare between uncoordinated and coordinated charging, which can be enforced by setting different tariffs or by controlling the chargers from the utility side.
In the next section, the outcomes of the overall proposed model along with different charging strategies are used to estimate the effect of the different penetration levels of BEVs on the reliability of the power system. Three strategies are considered: the uncontrolled G2V, controlled G2V, and controlled bidirectional. As in typical chronological-based reliability analysis, Monte Carlo simulations are used to generate virtual scenarios for the generation units’ availability and normal demand. Then, the proposed model is used to generate virtual scenarios of BEV arrivals and departures along with the battery-depleted energy. Applying different charging strategies allows translating the model outcome into consumed energy, which is then added to the normal demand and included in the reliability analysis.

4. Simulation Results

In this section, the reliability of the power system is studied, taking into consideration BEV charging based on three levels of BEV penetration: 20%, 40%, and 60%. In addition, two chargers with ratings of 7.2 kW and 9.6 kW are considered. The temperature used in the proposed model is the average daily temperature of the United Arab Emirates (UAE). The simulation period is one year, which is equivalent to 8760 h. Each month in this year is represented by one week. The simulation time slot is one hour.
To test the proposed model, we use the IEEE-RBTS model shown in Figure 5 for the reliability studies [36]. In the IEEE-RBTS system, there are 11 generating units with a total capacity of 240 MW. The peak value of the load in this system is 185 MW.
We carried out reliability analysis for the IEEE-RBTS with the BEV consumption superimposed on normal demand. Sequential Monte Carlo simulations are used to generate 5000 years, i.e.,   N = 5000 , of synthetic samples until the reliability indices reach convergence, as shown in Figure 6. The reliability analysis is carried out for three different strategies and two different chargers. The results for three different charging strategies for different BEV penetrations are summarized in Table 3.
Firstly, we want to study the impact of M T T R and M T T F variations on the reliability indices with 0% penetration of BEV (base case). Table 4 illustrates the different reliability indices with various values of M T T R and M T T F . The reliability of the system is enhanced with increasing M T T R or decreasing M M T F as explained in Table 4, as each generating unit will require less time to repair if M T T R is decreased and this generating unit will operate for longer until the next failure if M T T F is increased.

4.1. Uncontrolled Charging

For the uncontrolled scenario, it is assumed that charging occurs once the BEV is plugged in. During an outage, the energy not supplied to the BEV cannot be shifted. Thus, any charging energy will increase the E N S i and h i for any interruption   i , which results in higher LOLE and LOEE. In addition, the increase in the total load due to BEVs may result in load interruption that did not exist in the case without BEVs, which causes the LOLF to increase. On the other hand, the ENSPI may decrease due to the increase in the number of interruptions with smaller E N S i that caused the LOLF to increase. A sample is shown in Figure 7, where the normal load is not interrupted during an incident of generation outage. However, with uncontrolled BEV consumption superimposed on the normal load, the total load exceeds the available generation capacity, leading to increased   E N S i .
In contrast, the SAIFI and SAIDI are determined based on the following assumption, where the customers are assumed to be residential customers with an average consumption of 5 kWh. The number of customer interruptions as well as the duration of the interruptions will be increased in this scenario, as there is no control over BEV charging and thus the energy for BEVs cannot be shifted, which results in higher values of SAIFI and SAIDI compared to the values of these indices in the case without BEVs.
For penetrations of 20%, 40%, and 60%, the LOLE increases by 69.3%, 180.74%, and 467.9%, respectively. A higher charger rating would increase the LOLE further. For example, for 20% BEV penetration, the LOLE is 4.5% higher with a 9.6 kW charger compared to the 7.2 kW charger. On the same context, the SAIFI increases by 115.68%, 354.85%, and 954.42% for the different BEV penetrations. However, the variation in the charger rating has almost no impact on both SAIFI and SAIDI indices.

4.2. Controlled Charging

In this strategy, BEV charging is controlled during an interruption to shift any charging requirement to a later time if possible. Figure 7 illustrates the load profile with BEV demand for one scenario during an interruption period using uncontrolled and controlled G2V strategies. As shown, when the charging of BEV batteries is controlled, the shifting in the charging requirements can definitely reduce the E N S i or, in the worst case, not change it. However, this may be accompanied by an increase in the interruption duration, as illustrated in Figure 8. Thus, for 20% BEV penetration, although the LOEE in the case of controlled charging is reduced by 37.3% compared to the case of uncontrolled charging, the LOLE increased by 4.8%. In addition, for 20% BEV penetration, we can notice a severe reduction in the ENSPI by 35.45% compared to the uncontrolled case, due to the ability of the controlled G2V strategy to reduce   E N S i . Furthermore, the SAIFI and SAIDI are increased only by 17.85%, 11.49%, respectively for 20% penetration compared to the case without BEV.

4.3. Controlled Charging/Discharging

The controlled unidirectional strategy can lead to a reduction in E N S i by shifting the charging energy, but it cannot eliminate the occurrence of interruptions if the load without BEV penetration is higher than the generation capacity. However, in the case of the controlled bidirectional charging strategy, the BEV batteries can discharge to support the generation and may overcome the interruption. Therefore, the controlled bidirectional strategy can lead to a reduction in both the interruption periods in addition to the amount of energy not served. As shown in Table 3, the bidirectional-controlled strategy reduced all the reliability indices compared to the case without BEV. For example, for 20% BEV penetration and a 7.2 kW charger rating, the V2G strategy reduced the LOLE, LOEE, SAIFI, and SAIDI by 16.5%, 32.6%, 38.82%, and 32.52% compared to the case without BEVs, respectively. Moreover, the LOLF and ENSPI are reduced by 5% and 29%, respectively.
The discharging of BEV batteries in this scenario which has a great impact on enhancing the system reliability can be implemented through a contract between the owner of BEV and the owner of the parking lot to compensate the BEV owner for the battery degradation caused by the discharging of his battery, and this can be implemented through reducing the charging price for these clients.

5. Conclusions

In this paper, a new mechanism for reliability assessment under high penetration of BEVs is proposed. Three charging strategies are considered to establish reliability indices and assessment methods for the integrated electric and transportation systems: the uncontrolled G2V, controlled G2V, and controlled bidirectional (G2V, V2G). A dynamic stochastic consumption model that includes travel behavior and battery depletion submodels for a fleet of BEVs is utilized in the reliability assessment. The travel behavior model takes into consideration different trip purposes, trip distances, and variations in driver behavior. The outcomes from this model are the starting times, ending times, trips distances, and trips durations. The battery depletion model utilizes the outcomes from the previous model, considering the environmental conditions to determine the BEV battery depletion by the end of a trip. The outcomes of these models are used to study the impact of different BEV penetrations on the power system reliability using three charging strategies, which can translate the model outcomes to power consumption to study the interactions between the integrated systems.
The reliability indices are determined for three charging strategies. The results show that the increase in BEV penetration leads to a decrease in the reliability of the power system as the interruption periods and the energy not served during the interruption will both increase. However, the impacts of BEV penetrations can be reduced by considering the different control strategies. The controlled unidirectional strategy succeeds in reducing the amount of energy not used. However, it results in an increase in the interruption duration. On the contrary, the use of the controlled bidirectional strategy leads to a reduction in both the interruption duration and the amount of energy not served by discharging the BEV batteries to the grid to prevent the expected interruption.

Author Contributions

Conceptualization, H.F.S., M.F.S. and M.H.I.; methodology, M.M. and M.R.; software, M.M. and M.R; validation, M.F.S. and M.M.; formal analysis, M.F.S. and M.M.; investigation, M.F.S. and M.M.; resources, H.F.S. and M.F.S.; data curation, H.F.S., M.F.S. and M.H.I.; writing—original draft preparation, M.M. and M.R.; writing—review and editing, H.F.S., M.F.S. and M.H.I.; visualization, M.F.S. and M.M.; supervision, H.F.S. and M.F.S.; project administration, H.F.S.; funding acquisition, H.F.S. All authors have read and agreed to the published version of the manuscript.

Funding

This project was funded by the Deanship of Scientific Research (DSR), King Abdulaziz University, Jeddah, under grant No. (G:1542-135-1440). The authors, therefore, gratefully acknowledge DSR technical and financial support.

Conflicts of Interest

The authors declare no conflict of interest.

References

  1. Mokhtar, M.; Shaaban, M.F.; Zeineldin, H.; El-Saadany, E.F. Optimal Operation of Virtual Charging Systems for Plug-In Electric Vehicles. IEEE Syst. J. 2022. [Google Scholar] [CrossRef]
  2. Mokhtar, M.; Shaaban, M.F.; Zeineldin, H.; El-Saadany, E.F. A Customer-Centered Smart Charging Strategy Considering Virtual Charging System. IEEE Access 2021, 9, 117993–118004. [Google Scholar] [CrossRef]
  3. Moghaddam, Z.; Ahmad, I.; Habibi, D.; Phung, Q.V. Smart charging strategy for electric vehicle charging stations. IEEE Trans. Transp. Electrif. 2018, 4, 76–88. [Google Scholar] [CrossRef]
  4. Shafiee, S.; Fotuhi-Firuzabad, M.; Rastegar, M. Investigating the impacts of plug-in hybrid electric vehicles on power distribution systems. IEEE Trans. Smart Grid 2013, 4, 1351–1360. [Google Scholar] [CrossRef]
  5. Shalaby, A.A.; Shaaban, M.F.; Mokhtar, M.; Zeineldin, H.H.; El-Saadany, E.F. Optimal Day-ahead Operation for a PV-based Battery Swapping Station for Electric Vehicles. In Proceedings of the 2021 6th International Symposium on Environment-Friendly Energies and Applications (EFEA), Sofia, Bulgaria, 24–26 March 2021; pp. 1–8. [Google Scholar] [CrossRef]
  6. Darabi, Z.; Ferdowsi, M. An event-based simulation framework to examine the response of power grid to the charging demand of plug-in hybrid electric vehicles. IEEE Trans. Ind. Inform. 2014, 10, 313–322. [Google Scholar] [CrossRef]
  7. Malhotra, A.; Binetti, G.; Davoudi, A.; Schizas, I.D. Distributed power profile tracking for heterogeneous charging of electric vehicles. IEEE Trans. Smart Grid 2017, 8, 2090–2099. [Google Scholar] [CrossRef]
  8. Shaaban, M.F.; Atwa, Y.M.; El-Saadany, E.F. PEVs modeling and impacts mitigation in distribution networks. IEEE Trans. Power Syst. 2013, 28, 1122–1131. [Google Scholar] [CrossRef]
  9. Mouli, G.R.C.; Kaptein, J.; Bauer, P.; Zeman, M. Implementation of dynamic charging and V2G using Chademo and CCS/Combo DC charging standard. In Proceedings of the 2016 IEEE Transportation Electrification Conference and Expo (ITEC), Dearborn, MI, USA, 27–29 June 2016; pp. 1–6. [Google Scholar]
  10. Fadlullah, Z.M.; Quan, D.M.; Kato, N.; Stojmenovic, I. GTES: An optimized game-theoretic demand-side management scheme for smart grid. IEEE Syst. J. 2014, 8, 588–597. [Google Scholar] [CrossRef]
  11. Geng, B.; Mills, J.K.; Sun, D. Two-stage charging strategy for plug-in electric vehicles at the residential transformer level. IEEE Trans. Smart Grid 2013, 4, 1442–1452. [Google Scholar] [CrossRef]
  12. Han, S.; Han, S.; Sezaki, K. Development of an optimal vehicle-to-grid aggregator for frequency regulation. IEEE Trans. Smart Grid 2010, 1, 65–72. [Google Scholar]
  13. Tan, J.; Wang, L. Integration of plug-in hybrid electric vehicles into residential distribution grid based on two-layer intelligent optimization. IEEE Trans. Smart Grid 2014, 5, 1774–1784. [Google Scholar] [CrossRef]
  14. Negarestani, S.; Fotuhi-Firuzabad, M.; Rastegar, M.; Rajabi-Ghahnavieh, A. Optimal sizing of storage system in a fast charging station for plug-in hybrid electric vehicles. IEEE Trans. Transp. Electrif. 2016, 2, 443–453. [Google Scholar] [CrossRef]
  15. Richardson, P.; Flynn, D.; Keane, A. Impact assessment of varying penetrations of electric vehicles on low voltage distribution systems. In Proceedings of the IEEE PES General Meeting, Providence, RI, USA, 25–29 July 2010; pp. 1–6. [Google Scholar]
  16. Al-Ogaili, A.S.; Hashim, T.J.T.; Rahmat, N.A.; Ramasamy, A.K.; Marsadek, M.B.; Faisal, M.; Hannan, M.A. Review on scheduling, clustering, and forecasting strategies for controlling electric vehicle charging: Challenges and recommendations. IEEE Access 2019, 7, 128353–128371. [Google Scholar] [CrossRef]
  17. Hou, K.; Xu, X.; Jia, H.; Yu, X.; Jiang, T.; Zhang, K.; Shu, B. A Reliability Assessment Approach for Integrated Transportation and Electrical Power Systems Incorporating Electric Vehicles. IEEE Trans. Smart Grid 2018, 9, 88–100. [Google Scholar] [CrossRef]
  18. Zhang, Q.; Zhu, Y.; Wang, Z.; Su, Y.; Li, C. Reliability Assessment of Distribution Network and Electric Vehicle Considering Quasi-Dynamic Traffic Flow and Vehicle-to-Grid. IEEE Access 2019, 7, 131201–131213. [Google Scholar] [CrossRef]
  19. Farzin, H.; Moeini-Aghtaie, M.; Fotuhi-Firuzabad, M. Reliability studies of distribution systems integrated with electric vehicles under battery-exchange mode. IEEE Trans. Power Del. 2016, 31, 2473–2482. [Google Scholar] [CrossRef]
  20. Liu, W.; Zhang, M.; Zeng, B.; Wu, L.; Zhang, J. Analyzing the impacts of electric vehicle charging on distribution system reliability. In Proceedings of the IEEE PES Innovative Smart Grid Technologies, Tianjin, China, 21–24 May 2012; pp. 1–6. [Google Scholar]
  21. Mozafar, M.R.; Amini, M.H.; Moradi, M.H. Innovative appraisement of smart grid operation considering large-scale integration of electric vehicles enabling V2G and G2V systems. Electr. Power Syst. Res. 2018, 154, 245–256. [Google Scholar] [CrossRef]
  22. Xu, N.Z.; Chung, C.Y. Reliability evaluation of distribution sys-tems including vehicle-to-home and vehicle-to-grid. IEEE Trans. Power Syst. 2016, 31, 759–768. [Google Scholar] [CrossRef]
  23. Kamruzzaman, M.; Benidris, M. Reliability-Based Metrics to Quantify the Maximum Permissible Load Demand of Electric Vehicles. IEEE Trans. Ind. Appl. 2019, 55, 3365–3375. [Google Scholar] [CrossRef]
  24. Rana, R.; Prakash, S.; Mishra, S. Energy management of electric vehicle integrated home in a time-of-day regime. IEEE Trans. Transp. Electrif. 2018, 4, 804–816. [Google Scholar] [CrossRef]
  25. Cheng, L.; Chang, Y.; Lin, J.; Singh, C. Power system reliability assessment with electric vehicle integration using battery exchange mode. IEEE Trans. Sustain. Energy 2013, 4, 1034–1042. [Google Scholar] [CrossRef]
  26. Cheng, L.; Chang, Y.; Wu, Q.; Lin, W.; Singh, C. Evaluating charging service reliability for plug-in EVs from the distribution network aspect. IEEE Trans. Sustain. Energy 2014, 5, 1287–1296. [Google Scholar] [CrossRef]
  27. Xu, N.Z.; Chung, C.Y. Well-being analysis of generating systems considering electric vehicle charging. IEEE Trans. Power Syst. 2014, 29, 2311–2320. [Google Scholar] [CrossRef]
  28. Department of Transportation. National Travel Survey 2009; Department of Transportation: London, UK, 2009.
  29. Shojaei, S.; McGordon, A.; Robinson, S.; Marco, J. Improving the performance attributes of plug-in hybrid electric vehicles in hot climates through key-off battery cooling. Energies 2017, 10, 2058. [Google Scholar] [CrossRef] [Green Version]
  30. Neubauer, J.; Wood, E. Thru-life impacts of driver aggression, climate, cabin thermal management, and battery thermal management on battery electric vehicle utility. J. Power Sources 2014, 259, 262–275. [Google Scholar] [CrossRef]
  31. Guan, T.; Sun, S.; Gao, Y.; Du, C.; Zuo, P.; Cui, Y.; Zhang, L.; Yin, G. The effect of elevated temperature on the accelerated aging of LiCoO2/mesocarbon microbeads batteries. Appl. Energy 2016, 177, 1–10. [Google Scholar] [CrossRef]
  32. Mukherjee, J.C.; Gupta, A. A review of charge scheduling of electric vehicles in smart grid. IEEE Syst. J. 2015, 9, 1541–1553. [Google Scholar] [CrossRef]
  33. Wu, D.; Ke, X.; Radhakrishnan, N.; Reiman, A. Optimization methods for evaluating PEV charging considering customer behavior. In Proceedings of the 2018 IEEE Power & Energy Society General Meeting (PESGM), Portland, OR, USA, 5–10 August 2018; pp. 1–5. [Google Scholar]
  34. Kisacikoglu, M.C.; Kesler, M.; Tolbert, L.M. Single-phase on-board bidirectional PEV charger for V2G reactive power operation. IEEE Trans. Smart Grid 2015, 6, 767–775. [Google Scholar] [CrossRef]
  35. Yusuf, J.; Ula, S. Impact of building loads on cost optimization strategy for a plug-in electric vehicle operation. In Proceedings of the 2019 IEEE Transportation Electrification Conference and Expo (ITEC), Detroit, MI, USA, 19–21 June 2019; pp. 1–5. [Google Scholar]
  36. Bertling, L.; Bangalore, P.; Tuan, L.A. On the use of reliability test systems: A literature survey. In Proceedings of the 2011 IEEE Power and Energy Society General Meeting, Detroit, MI, USA, 24–28 July 2011. [Google Scholar]
Figure 1. Proposed travel behavior submodel flow chart.
Energies 15 01585 g001
Figure 2. Battery depletion submodel.
Energies 15 01585 g002
Figure 3. Load and generating profiles.
Energies 15 01585 g003
Figure 4. The integration of the proposed model with the Reliability assessment.
Energies 15 01585 g004
Figure 5. RBTS–IEEE study system [36].
Energies 15 01585 g005
Figure 6. The convergence of reliability indices in the case of no BEV.
Energies 15 01585 g006
Figure 7. Load consumption for one scenario during an interruption period with 40% BEV penetration and 7.2 kW charger rating.
Energies 15 01585 g007
Figure 8. Load consumption for one scenario during an interruption period with 20% BEV penetration and 7.2 kW charger rating.
Energies 15 01585 g008
Table 1. Different trip purposes.
p Purpose p Purpose
1Commuting6Business
2Education7Escort education
3Shopping8Other escort and personal business
4Visit friends9Holiday trip
5Day trip10Others (entertainment, public activity, etc.)
Table 2. Fitted PDFs parameters for different purposes.
p Fitted pdfParameters p Fitted pdfParameters
1Lognormal μ = 3.27 σ   = 1.026Lognormal μ = 3.02 σ   = 1.32
2Weibull c   = 111.75 k = 1.277Weibull c = 83.81 k = 0.93
3Lognormal μ = 2.48 σ = 1.168Weibull c = 176.47 k = 2.67
4Lognormal μ = 2.16 σ = 1.389Weibull c = 79.63 k = 1.19
5Lognormal μ = 2.76 σ = 1.1810Lognormal μ = 3.42 σ = 1.29
Table 3. Reliability indices for different BEV penetrations and different chargers’ ratings.
BEV PenetrationReliability IndicesCharger Rating = 7.2 kWCharger Rating = 9.6 kW
UncontrolledUnidirectionalBidirectionalUncontrolledUnidirectionalBidirectional
0 %LOLE (h/yr)1.0562
LOEE (MWh/yr)9.7788
LOLF (int./yr)0.2078
ENSPI (MWh/int.)47.058
SAIFI (int./cu.)0.1154
SAIDI (h/cu.)0.5283
20%LOLE (h/yr)1.78821.880.88181.87281.960.884
LOEE (MWh/yr)17.373610.89586.594718.04611.14486.1485
LOLF (int./yr)0.43520.42280.19740.45380.44820.2138
ENSPI (MWh/int.)39.920925.770633.407639.766324.865728.75
SAIFI (int./cu.)0.24890.1360.07060.24730.13920.0668
SAIDI (h/cu.)0.93910.5890.35650.97550.60240.3323
40%LOLE (h/yr)2.96523.2091.113.19123.43981.1558
LOEE (MWh/yr)32.26513.18565.317934.696514.20844.929
LOLF (int./yr)0.82220.81700.37060.81220.82040.4134
ENSPI (MWh/int.)39.24316.13914.349542.719117.318911.923
SAIFI (int./cu.)0.52490.18230.06270.51050.19730.0624
SAIDI (h/cu.)1.74410.71270.28751.87750.7680.2664
60%LOLE (h/yr)5.99826.261.5816.70966.94261.6984
LOEE (MWh/yr)63.374218.4684.815470.381221.5354.6879
LOLF (int./yr)2.0162.0140.71382.02842.06220.779
ENSPI (MWh/int.)31.43569.16986.746134.697910.44276.0178
SAIFI (int./cu.)1.21680.31490.06551.16350.36640.0722
SAIDI (h/cu.)3.42560.99830.26033.80441.16410.2534
Table 4. Reliability indices for different MTTR and MMTF values with 0% BEV penetration.
Base Case20% Increase in MTTR20% Decrease in MTTR20% Increase in MTTF20% Decrease in MTTF20% Increase in MTTR & MTTF20% Decrease in MTTR & MTTF
LOLE1.05621.67800.61660.58541.76921.01780.9846
LOEE9.778815.40545.09214.525116.65119.0379.6237
LOLF0.20780.32400.13280.12820.35000.2020.2006
ENSPI47.05847.547538.343335.297147.574544.737647.9745
Publisher’s Note: MDPI stays neutral with regard to jurisdictional claims in published maps and institutional affiliations.

