Article

Numerical Analysis on the Hydraulic Thrust and Dynamic Response Characteristics of a Turbine Pump

1
Fujian Xianyou Pumped Storage Co., Ltd., Xianyou 351200, China
2
Department of Energy and Power Engineering, Tsinghua University, Beijing 100084, China
*
Author to whom correspondence should be addressed.
Energies 2022, 15(4), 1580; https://doi.org/10.3390/en15041580
Submission received: 11 January 2022 / Revised: 17 February 2022 / Accepted: 18 February 2022 / Published: 21 February 2022
(This article belongs to the Special Issue Multiphysics Coupling Investigation of Turbomachinery)

Abstract

:
Pumps as turbines are widely used in the world, wherein the hydraulic thrust of a turbine pump is one of the key factors affecting the safe and stable operation of a unit. There are a lot of difficulties to evaluate the hydraulic thrust by site observation and experiment. These difficulties can be resolved if a numerical simulation is applied. The present work aims to analyze the axial and radial hydraulic thrust of a prototype turbine pump in turbine mode, and then to determine the dynamic response characteristics of the turbine pump shafting. The axial hydraulic thrust in the turbine mode is upward, with a fluctuation range of 155 t to 175 t. The pressure fluctuation in the runner can be 16% of the unit head. The simulation results provide a good reference for understanding the hydraulic performance of the turbine pump and useful guidance for the operation of the unit. The structure analysis shows that the runner has asymmetrical deformation in the axial and radial directions. The amplitude of the dynamic stress on the shafting is about 10 MPa, and the dominant frequency of the dynamic stress on the runner is 20fn. The results could provide guidance for the operating and optimization of the unit, which helps the safe and stable operation of the station.

1. Introduction

Pumps as turbines are widely used in engineering due to their safety and stability. The Chinese government announced that China will achieve the goal of peaking carbon by 2030 [1], which means the use of renewable energy will be increased greatly in the future. However, renewable energy, such as wind energy and solar energy, is not stable enough. Thus, the pumped-storage power plant plays a significant role in the grid system [2]. The pumped-storage power plant has the function of peak, frequency, and phase modulation, emergency reserve, etc., wherein the turbine pump is the key component of the pump storage unit, and a lot of researchers have tried to improve the energy efficiency of the turbine pump in water-energy systems [3,4].
As the key component of the plant, the turbine pump usually works at a high rotational speed and needs to start and stop frequently. Thus, the stable operation of the turbine pump is essential to the plant. The operation of the turbine pump is affected by hydraulic excitation, mechanical force, electromagnetic force, etc., wherein the hydraulic thrust has a great effect on the unit. Excessive upward hydraulic thrust may cause unit lifting, while excessive downward hydraulic thrust may cause bearing pad burning [5] or upper bracket deformation [6]. In engineering, it is difficult to evaluate the hydraulic thrust by experimental test, as the rotating part of the unit usually weighs hundreds even thousands of tons and the measuring equipment is difficult to be installed. Compared with the experimental test, the numerical method is not limited by the site conditions. Hence, the numerical study on the axial and radial hydraulic thrust of the turbine pump is important for the stable operation of the unit.
The hydraulic thrust is the pressure integrated on the runner surface [7], which is affected by the following factors [8]: the operating head, rotational speed, flow rate, etc. The axial hydraulic thrust has been studied by a number of researchers because of its great influence on the stable operation of the unit. Some studies found that the axial hydraulic thrust in the crown gap and band gap is considerably high [9]. In some transient operating conditions, the axial hydraulic thrust is more complicated. A study carried out by Mao et al. [10] found the axial hydraulic thrust might have different directions at different positions, which showed the complexity of the axial hydraulic thrust during the start-up process. During the load rejection process, the direction of axial thrust load on the runner blade might be reversed in a rotating period [11]. In addition, the axial hydraulic thrust might increase greatly in the rotating stall process [8], so as to increase the risks of accidents. However, the radial hydraulic thrust of the turbine pump has not been studied thoroughly.
Numerical simulation is both economical and time-saving for studying the hydraulic thrust. In order to improve the accuracy of the numerical results, firstly, it is necessary to select the appropriate number of elements based on a suitable criterion and to verify the grid independence before simulation [12]. In addition, a time-step sensitivity evaluation might be needed for the transient simulation [13]; secondly, it is important to construct the turbulence model for the simulation. The k ε model (used in Kaplan turbine [14] and Francis turbine [15]), RNG k ω model, and the shear stress transport (SST) k ω model [16,17,18,19] performed well in predicting the flow characteristics of the hydraulic machinery. The RNG k ε model showed good performance in predicting the entropy generation characteristics of a turbine. The SST k ω model has both the advantages of the k ε model and the k ω model, and it is widely used in predicting the pressure pulsation characteristics of a pump [20] or turbine [21].
The dynamic response of the structure based on the fluid-structure interaction is widely used to determine the deformation and the stress level of the structure. Dompierre et al. [22], Pei et al. [23], and Luo et al. [24] studied the stress characteristics of the runner, and the numerical results were proved by the experimental test [25]. However, the above literature cannot determine the stress and the displacement distribution of the shafting. Recently, the development of computing technology makes it possible for calculating the shafting of the hydraulic turbine. Mao et al. [10] studied the structural characteristics of a turbine pump in the pump mode, and the FEM model analyzed in the study considered the rotating parts and the stationary components of the unit. However, studies on the dynamic characteristics of the shafting are still few in number.
In this paper, the rated operating condition under turbine mode is selected for the numerical simulation to analyze the radial and axial hydraulic thrust of a prototype turbine pump and the pressure fluctuations in the flow passage, and the relationship between the unit component and the fluctuation is discussed. Then, the hydraulic pressure on the fluid-structure interaction (FSI) interface is applied to the FEM model, and the dynamic response of the shafting is calculated. Both the deformation and the dynamic stresses are analyzed.
This paper overcomes the shortcomings of the existing research which does not establish a complete calculation model. A complete CFD model considering the pressure balance pipe could be used to improve the accuracy of the flow calculation results, and an FEM model which considers the shaft could obtain the dynamic behavior of shafting. The numerical method developed in this paper can also be used in other types of hydro turbines’ shafting. The results in this paper are helpful for understanding the hydraulic thrust performance of the turbine pump in the turbine mode, and for revealing the dynamic characteristics of the turbine pump shafting under the effect of the hydraulic excitation, which can be used to guide the operation of the unit and to assure the safe and stable operation of the unit.

2. Objective and Methods

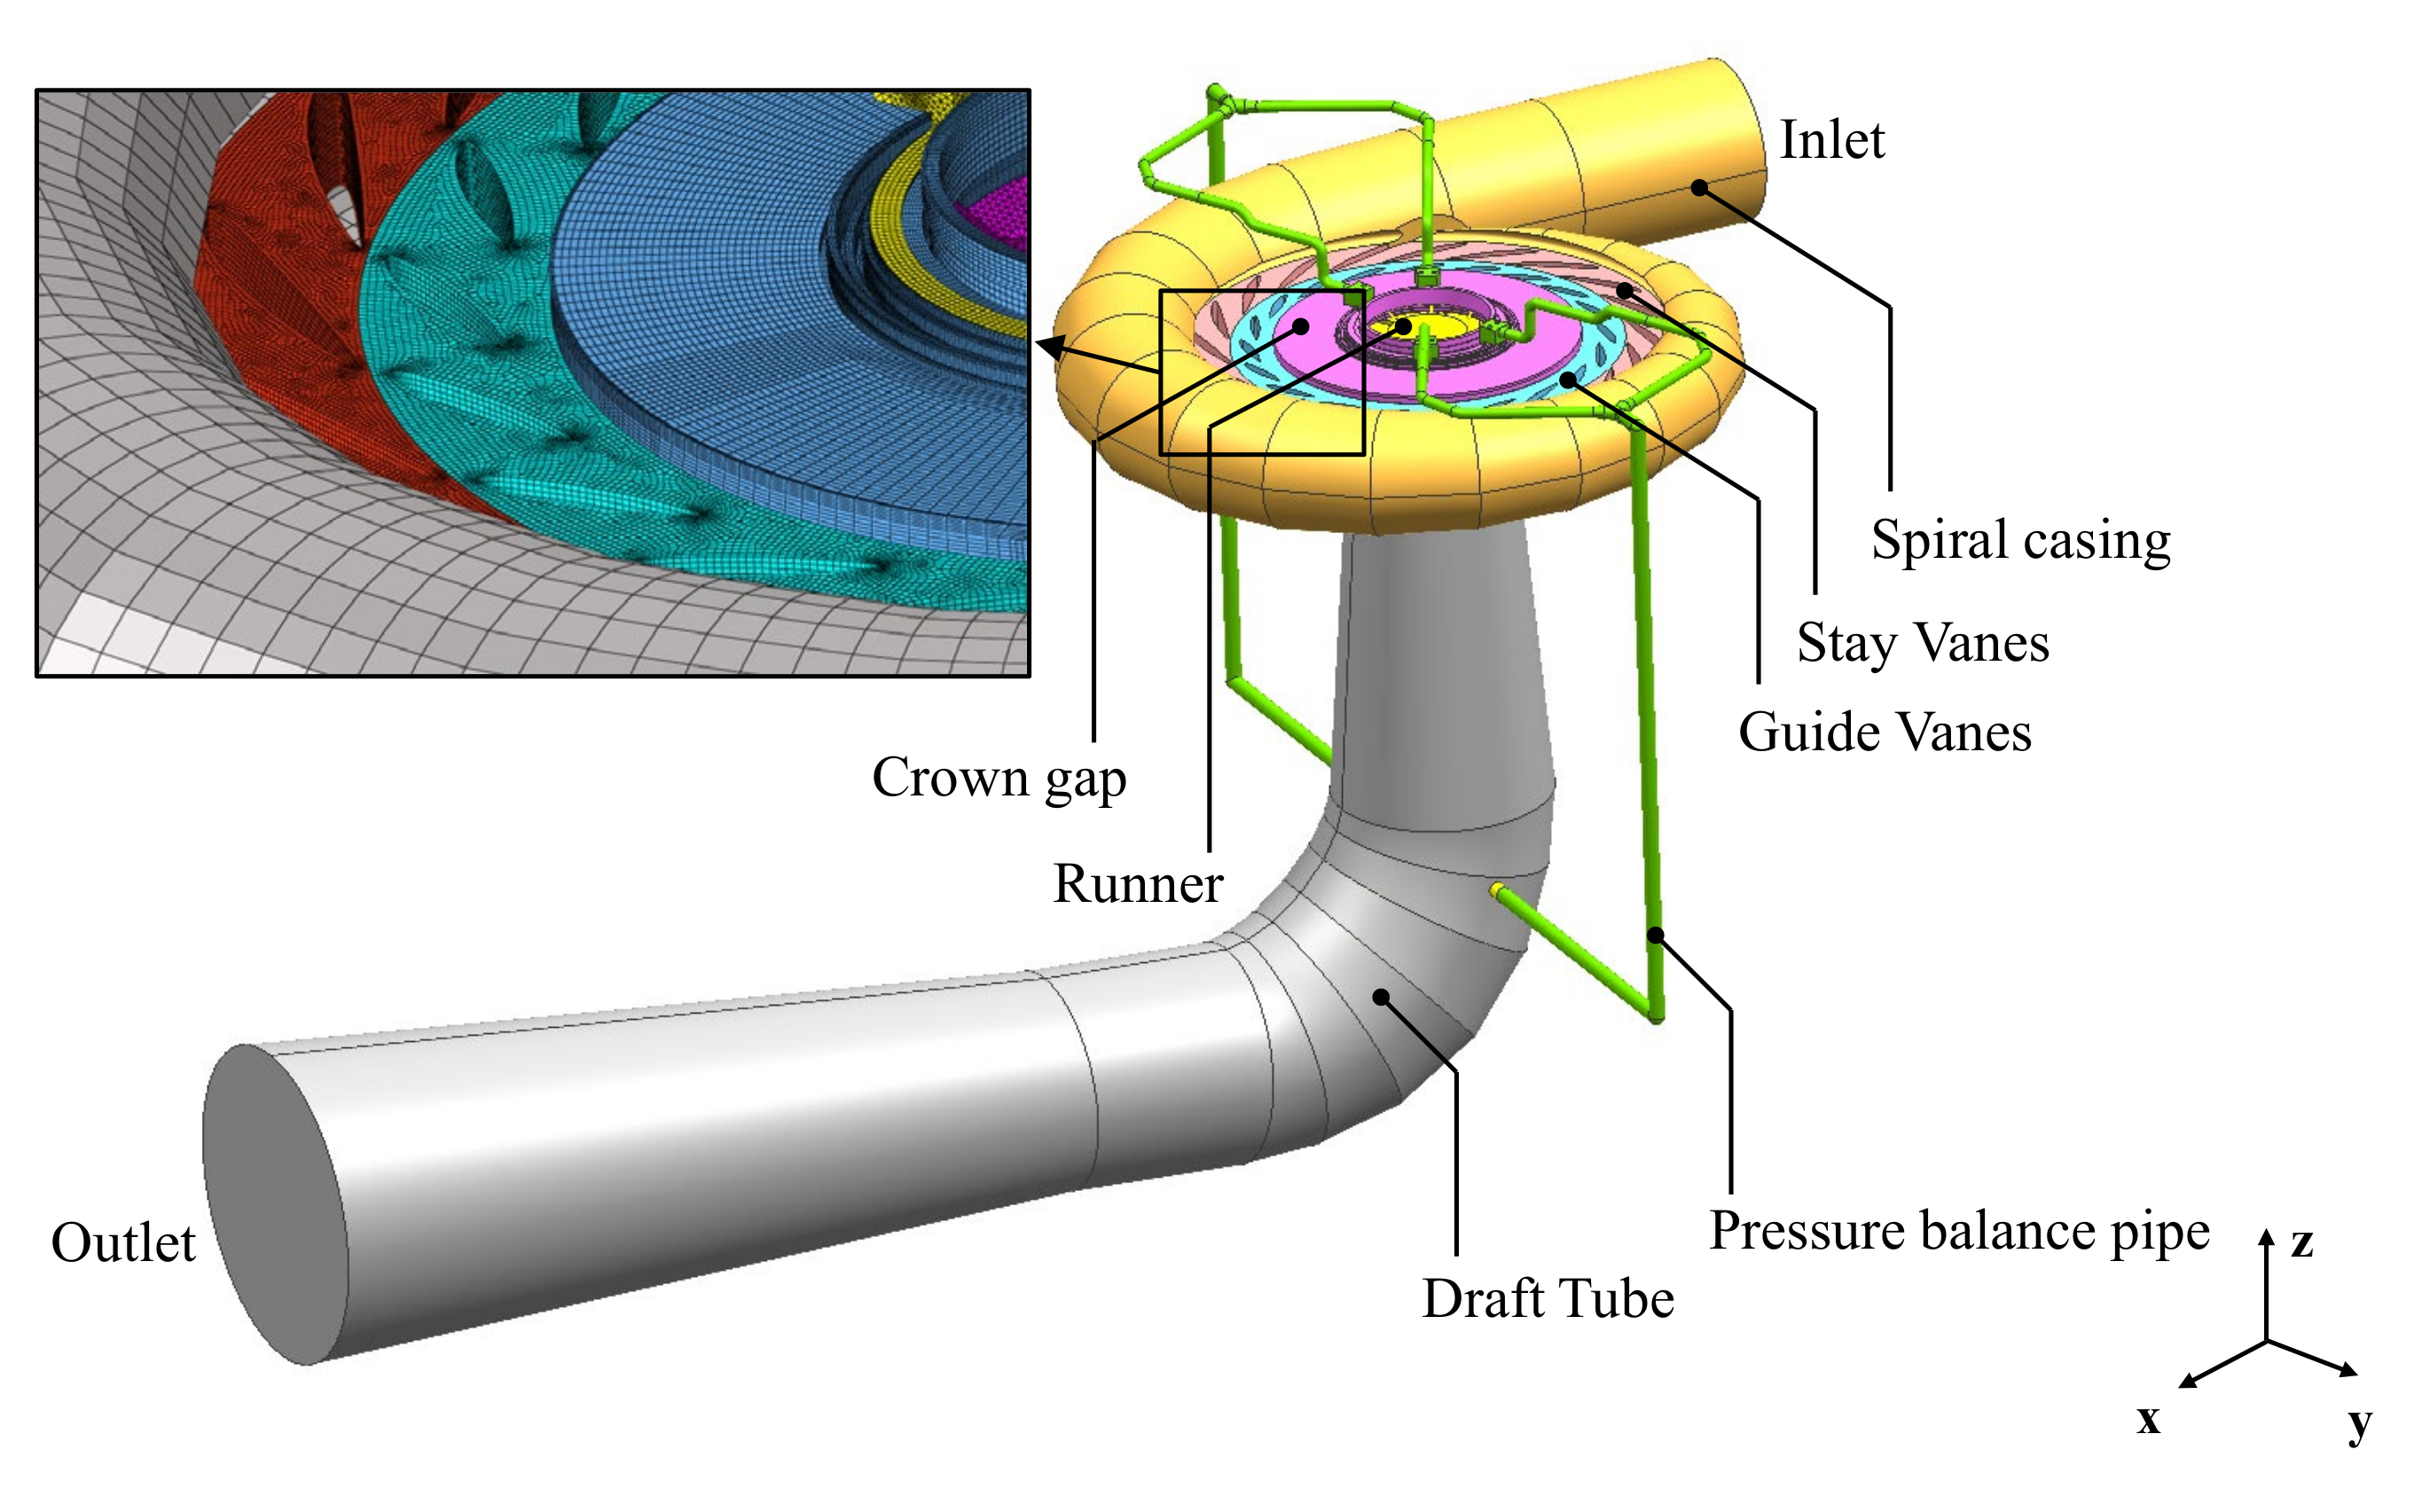
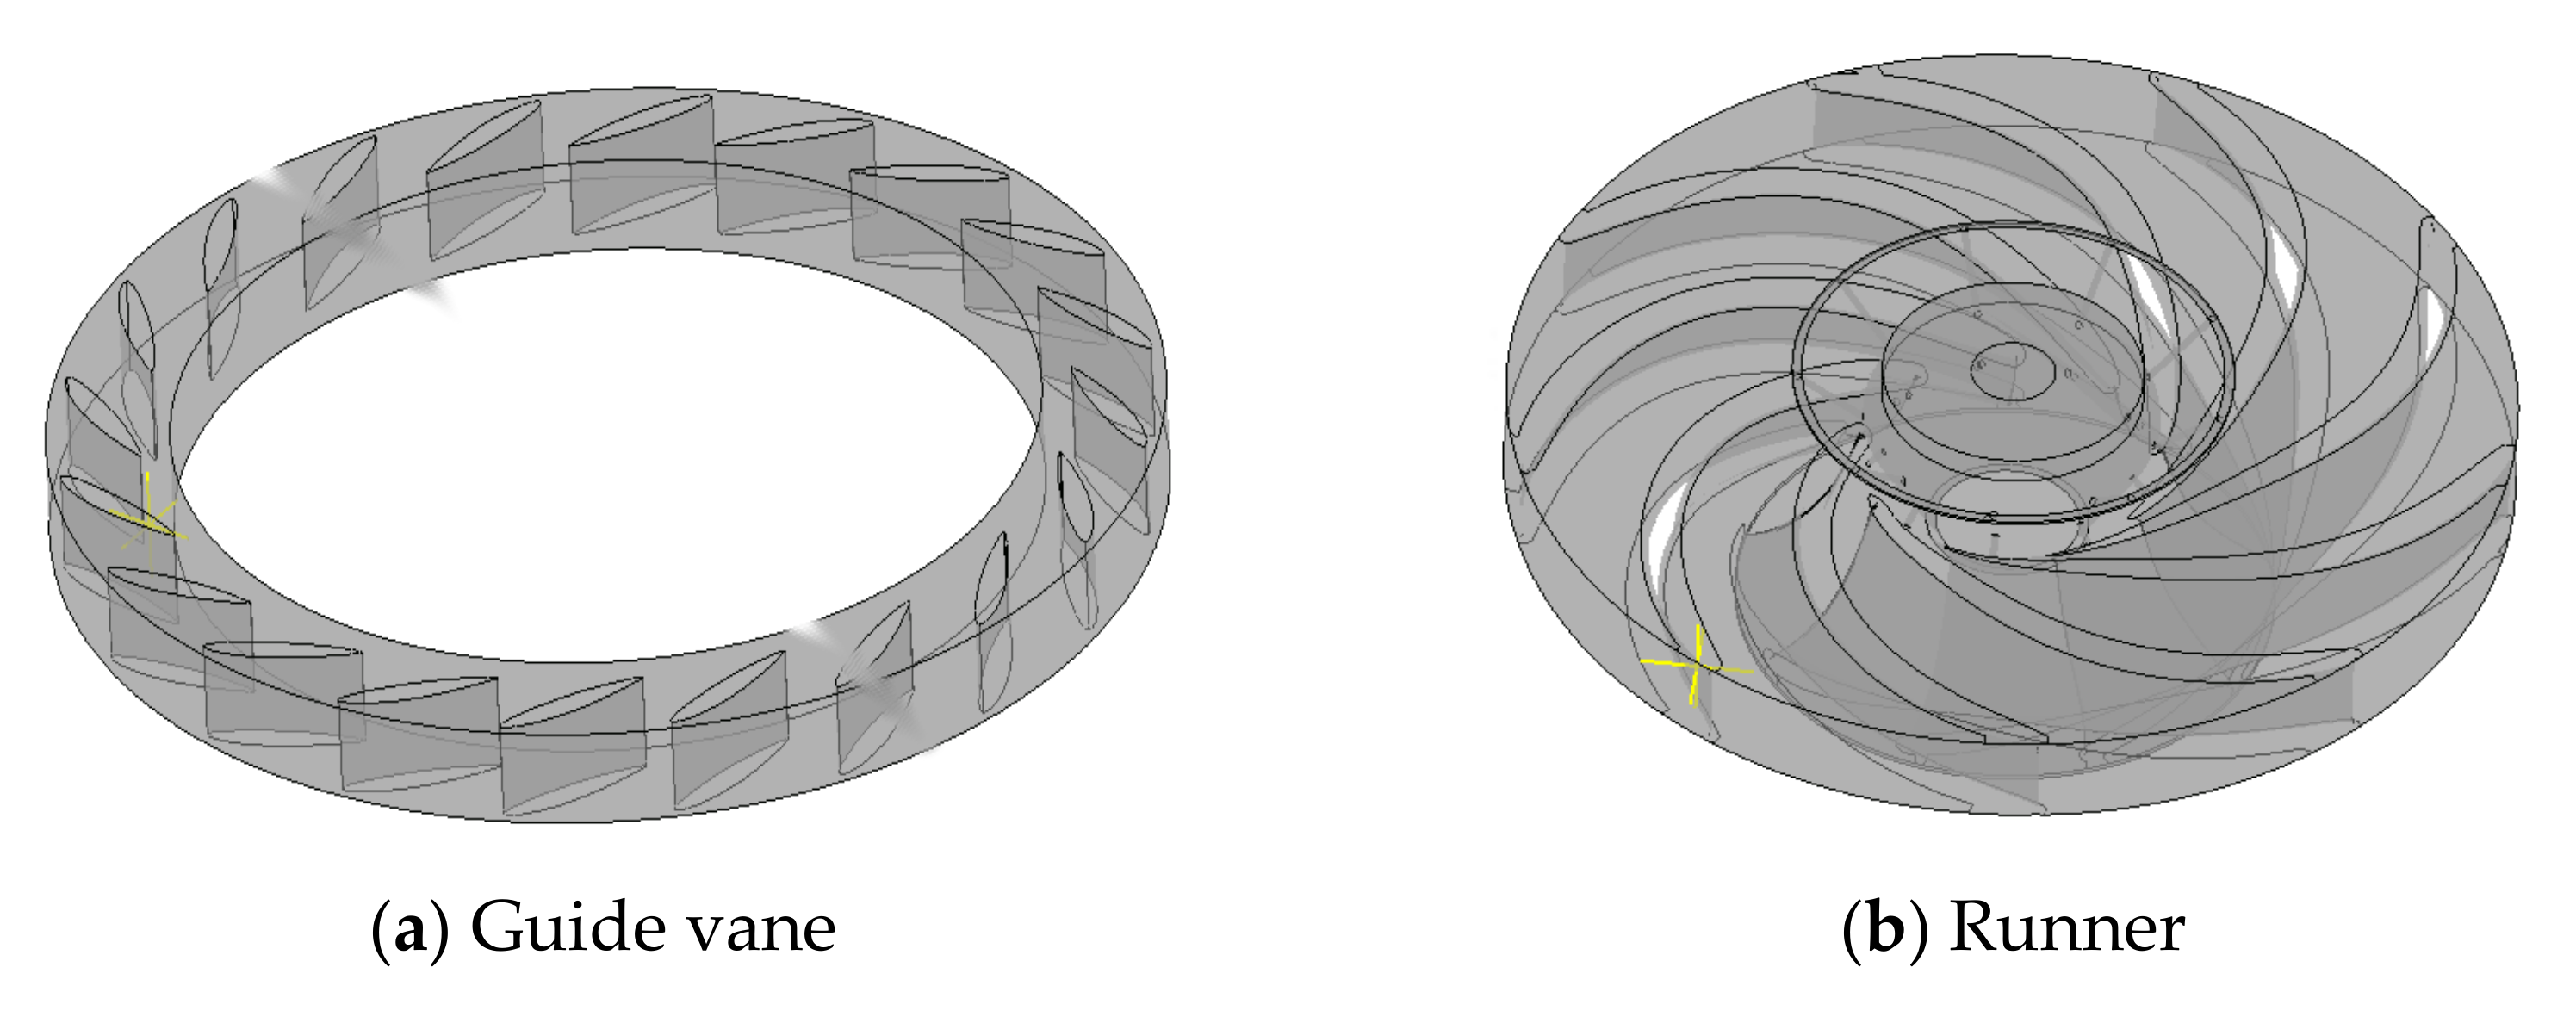
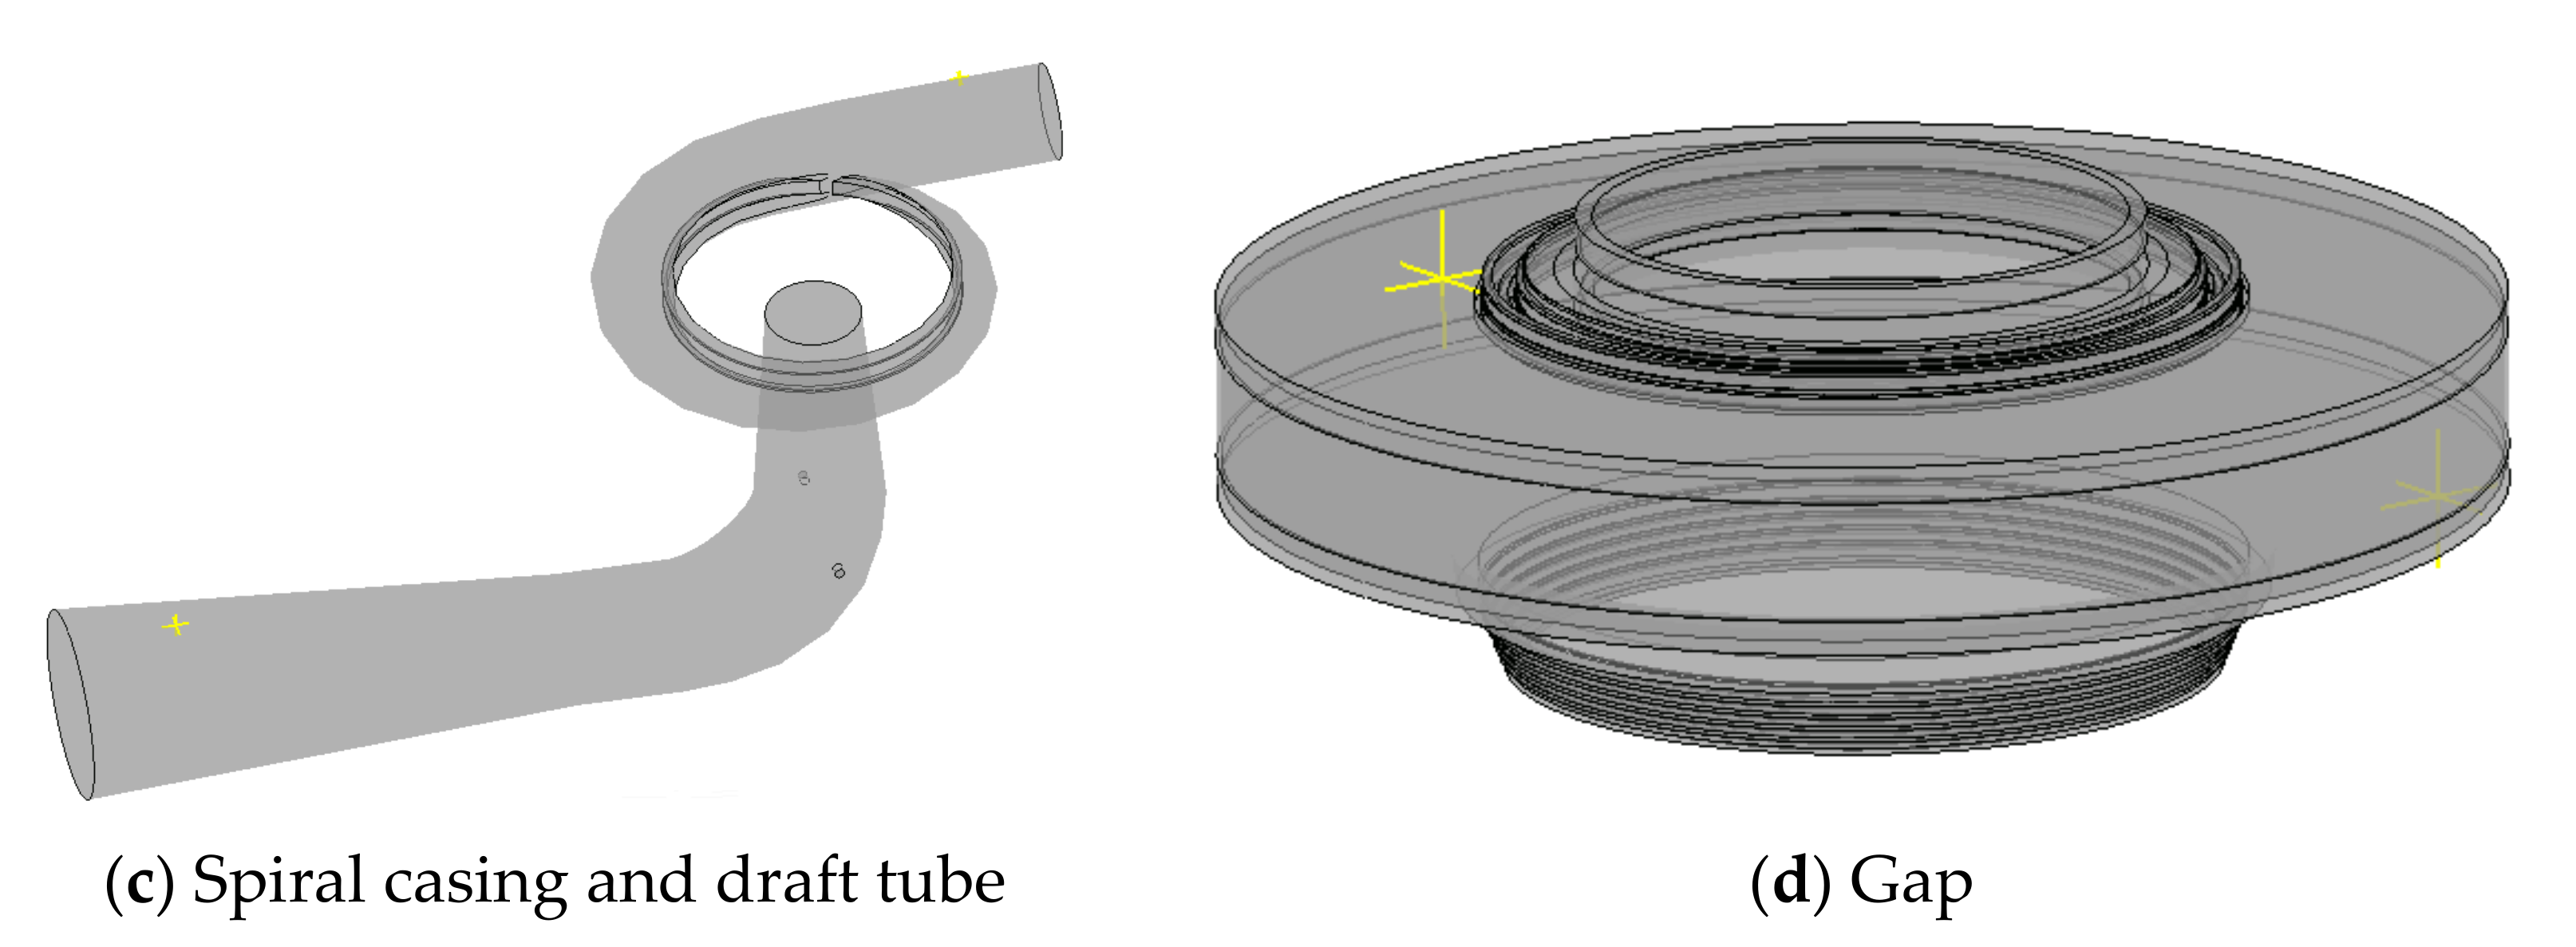
2.1. Turbine Pump Flow Model

The fluid domain of the turbine pump analyzed in this paper is composed of a spiral casing, 20 stay vanes, 20 guide vanes, a runner with 9 blades, and a draft tube, as shown in Figure 1. The turbine pump design parameters provided by the manufacturer at turbine mode are as follows: runner diameter of 4.16 m, rated head of 430 m, rated rotational speed of 428.6 rpm (the rotating direction is +Z), rated flow discharge 79.16 m3/s, and rated power of 306.1 MW.
A mesh with 5,384,011 elements was finally employed for the whole flow passage, and the detailed information of the mesh element type and the number of each component is shown in Table 1, where the hexahedral elements were applied for the crown gap, band gap, stay vanes, guide vanes, and spiral casing, and the hybrid elements were applied for the runner, pressure balance pipe, and draft tube. Finally, the mesh was fine enough to satisfy y + < 200 near the wall and the required features of pressure fluctuation could be obtained.

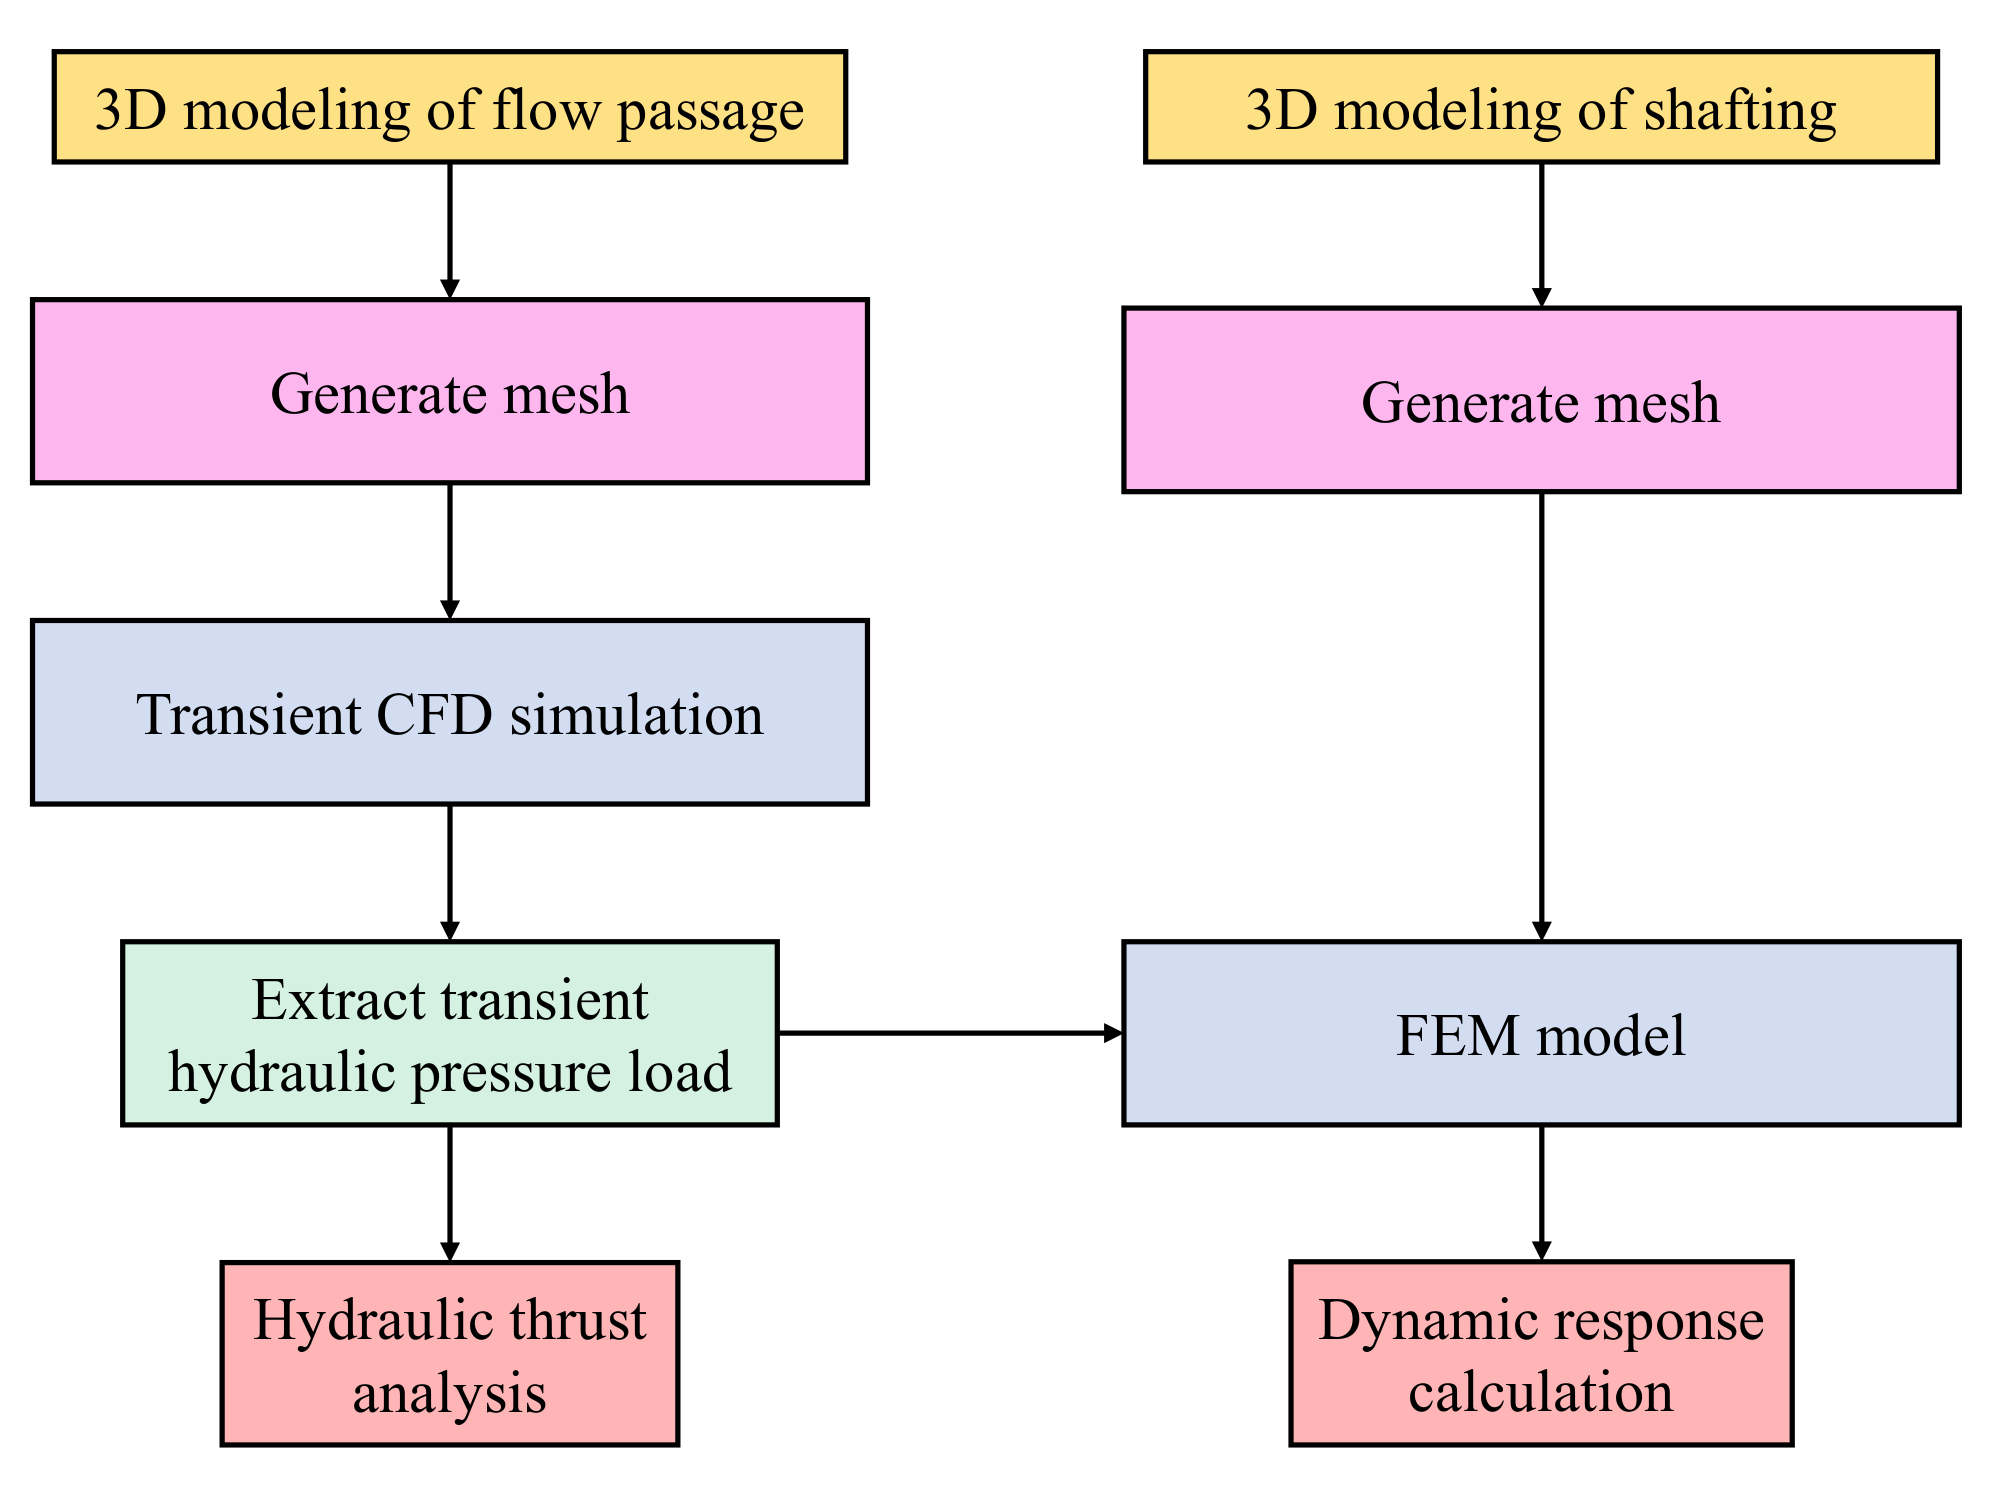
2.2. CFD Simulation Theory and Setup

The Reynolds averaged Navier-Stokes (RANS) equations based on the computational fluid dynamics (CFD) were used to calculate the entire flow passage field in the prototype pump-turbine [26]. The SST k ω model [27] was adopted as the turbulence model.
The continuity equation and momentum equation are [26]:
u i ¯ x i = 0
ρ u i ¯ t + ρ u j ¯ u i ¯ x j = ρ f i p ¯ x i + x j μ u i ¯ x j ρ u i u j ¯
where u i ¯ denotes the Reynolds averaged velocity components along the Cartesian coordinate axes, x i , ρ u i u j ¯ is the Reynolds stresses for the turbulent flow, p ¯ is the averaged pressure, ρ is the fluid density, μ is the kinetic viscosity of the fluid, and f i are the body forces acting on the unit volume fluid.
The RANS equation with the SST k ω model can be written as [28,29]:
ρ k t + ( ρ u i k ) x i = P ρ k 3 2 l k ω + x i μ + σ k μ t k x i
ρ ω t + ( ρ u i ω ) x i = C ω P β ρ ω 2 + x i μ l + σ ω μ t ω x i + 2 1 F 1 ρ σ ω 2 ω k x i ω x i
where l k ω = k 1 2 β k ω is the turbulence scale, μ is dynamic viscosity, term P is the production term, C ω is the production term coefficient, F 1 is the blending function, and σ k , σ ω , and β k are model constants.
A total pressure type inlet boundary was given at the spiral casing inlet and a static pressure type outlet was given at the draft tube outlet. The runner domain was set as the rotating domain with a rotational speed of 428.6 rpm and the other domains were set as the stationary domain. Domain interfaces were given between each two domains for data transfer and the transient rotor-stator-type interface was set for the rotor–stator interfaces with the pitch angle of 360°. No slip wall boundaries were given on all the solid walls. In the CFD simulation, the fluid medium was set as water at 25 °C. The simulation results calculated in the steady frame were used as the initial values for the transient simulation. The guide vane opening at the rated operating condition was 30°. The time step is set as T0/180 (T0 is the runner rotational period). The convergence criterion root mean square (RMS) was set as 1 × 10⁻⁵ and the value of all residuals was less than 1 × 10⁻³ after the simulations are converged.
The pressure pulsation in the flow passage was monitored at the pressure monitoring points, the location of the points is shown in Figure 2.

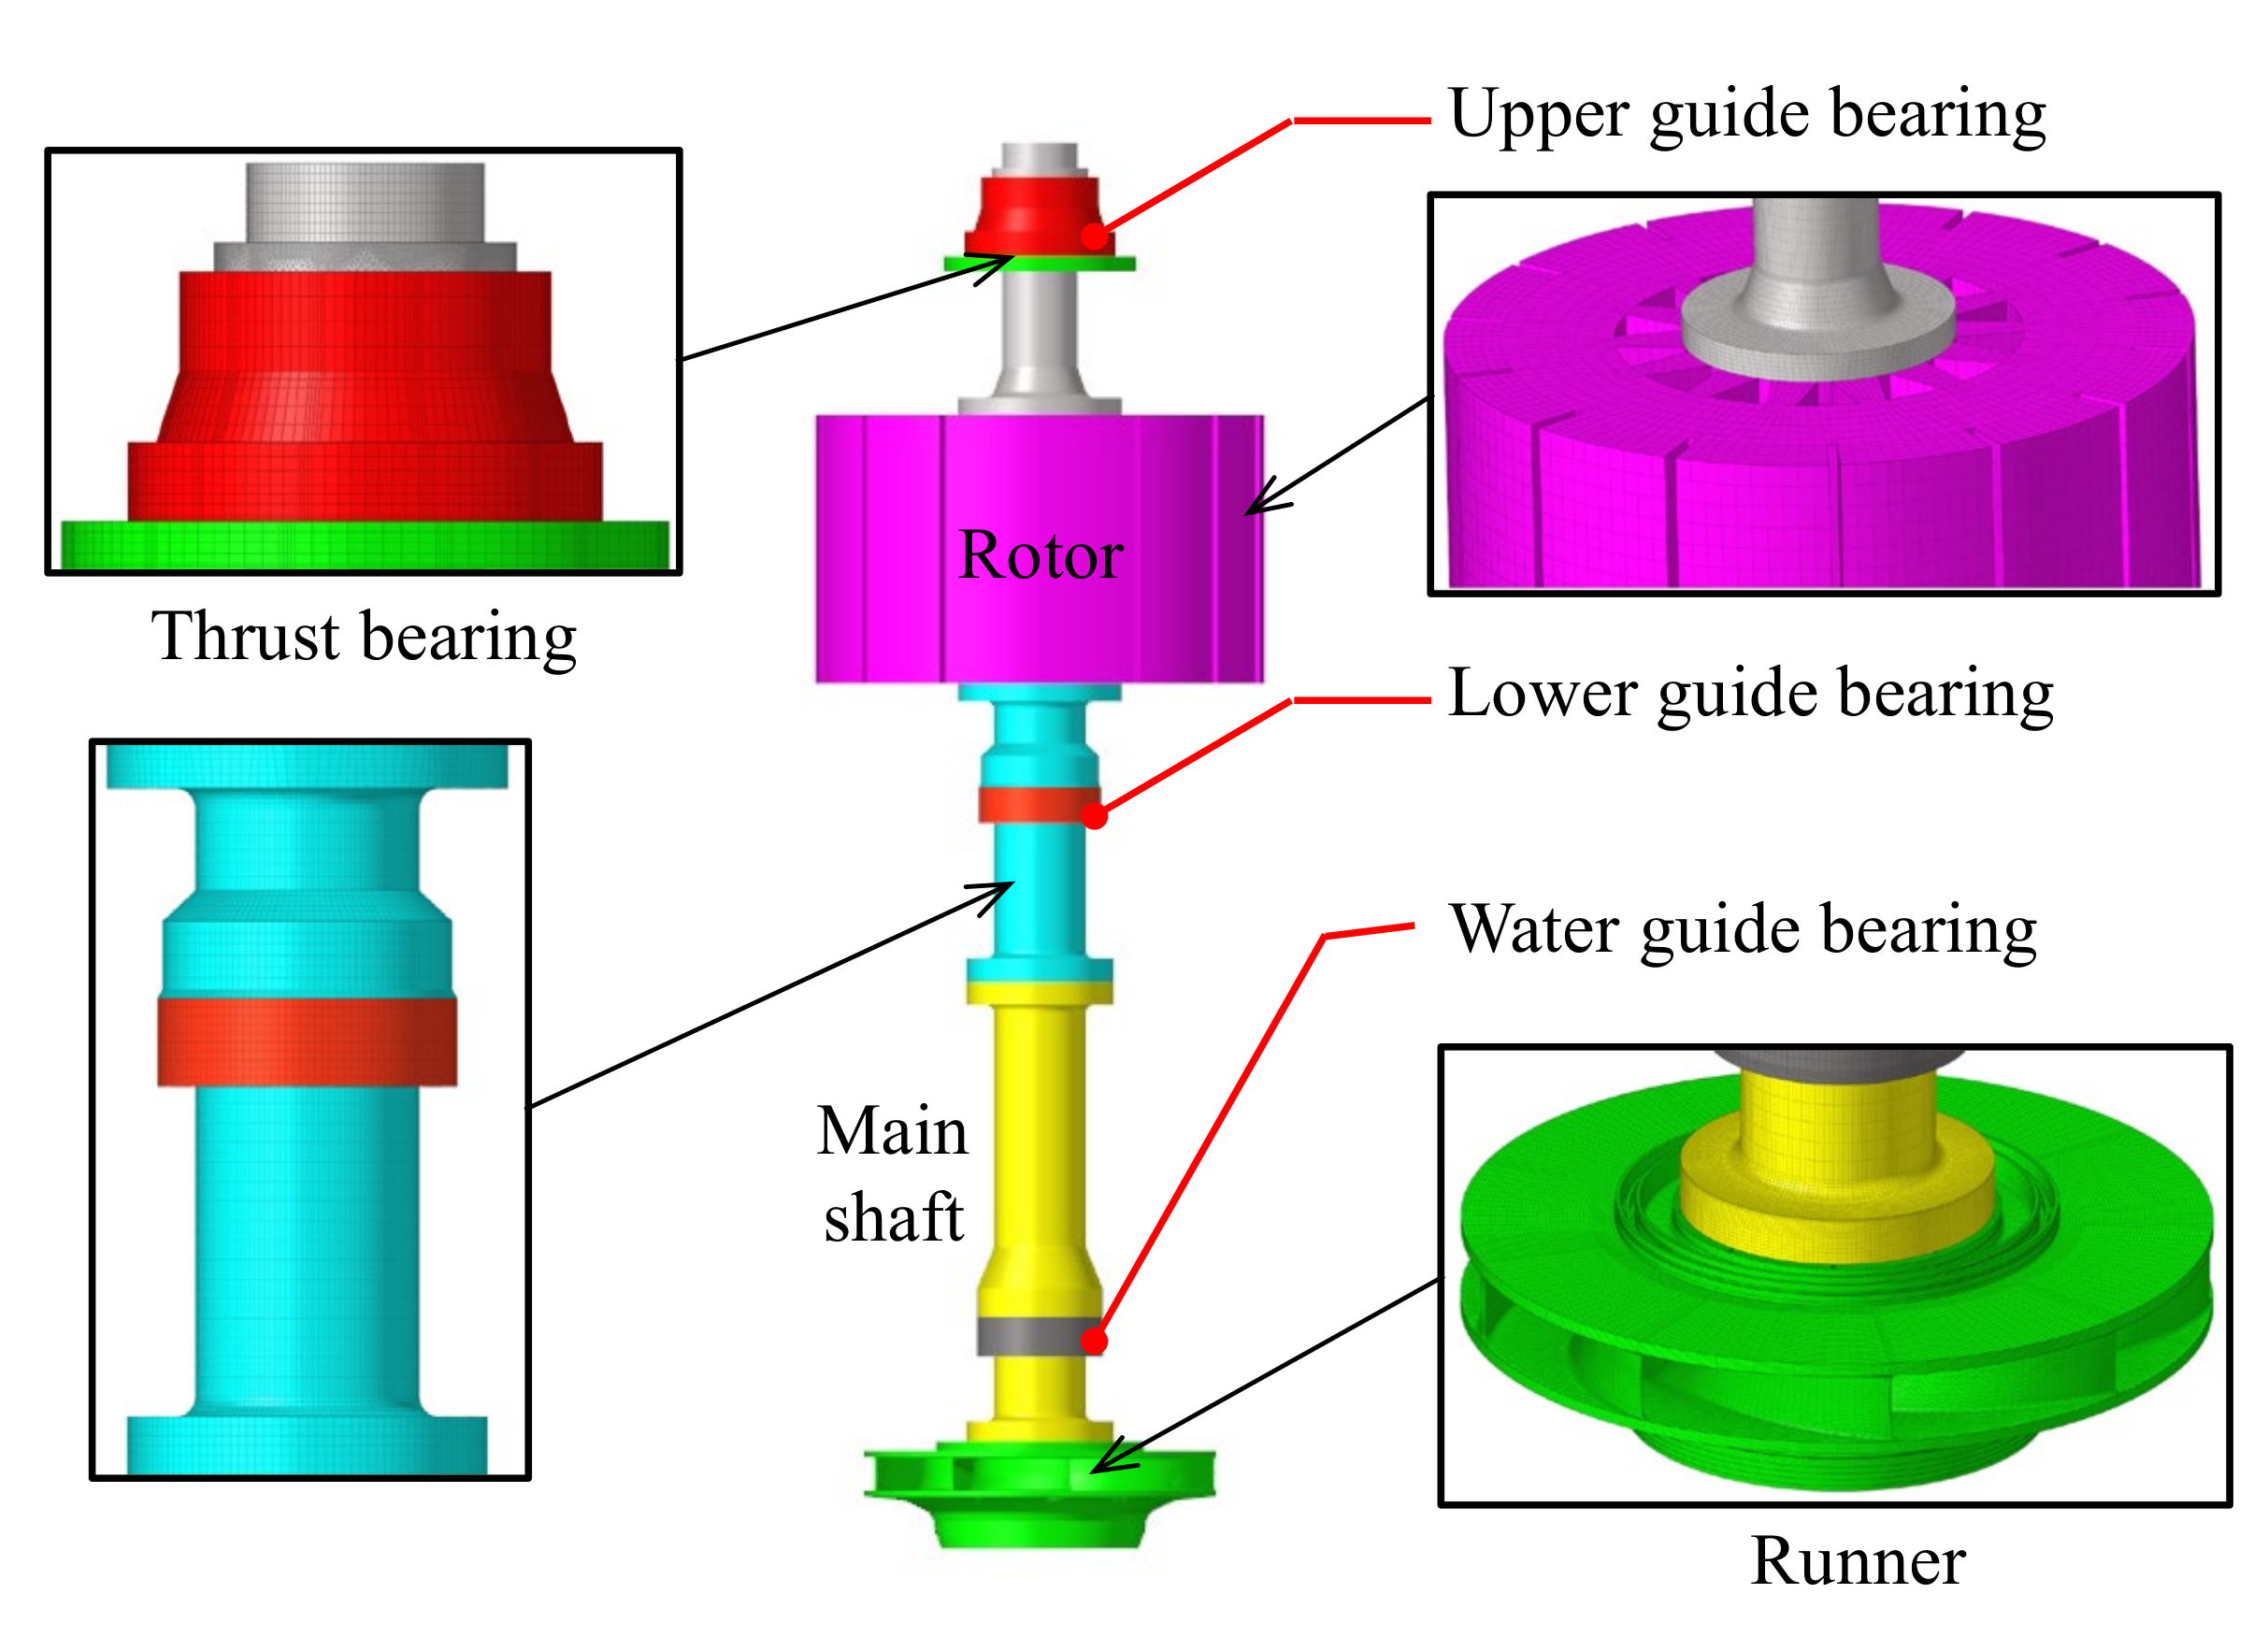
2.3. Shafting FEM Model and Setup

The rotating part of the unit consists of runner, main shaft, and generator rotor, etc., as shown in Figure 3, wherein the weight of the rotating part is 550 tons.
The material of the shafting was the structural steel with the theoretical density of 7850 kg/m3, the Young’s modulus was 200 GPa, and the Poisson’s ratio was 0.3. The mesh of the FEM model was generated using ANSYS mechanical APDL, wherein the solid185 element was used for FEM model, the tetrahedral element was used for the runner, and the hexahedral element for the other parts. The hydraulic pressure obtained from the CFD simulation was applied on the runner surfaces. The gravitational acceleration was applied with 9.8 m/s2, and the rotational speed of 426.8 rpm was applied to take into account the centrifugal force. The upper guide bearing the stiffness coefficient was set as 2 × 10¹⁰ N/m, the lower guide bearing the stiffness coefficient was set as 2 × 10¹⁰ N/m, the water guide bearing the stiffness coefficient was set as 3 × 10¹⁰ N/m, and the thrust bearing the stiffness coefficient was set as 5.5 × 10¹¹ N/m. The equivalent von Mises stress was adopted to evaluate the stress level of the runner, which can be calculated using the fourth strength theory [30]:
σ = 1 2 σ 1 σ 2 2 + σ 2 σ 3 2 + σ 3 σ 1 2
The FEM model was solved on the basis of the linear dynamic equilibrium equation, and the discretized form can be expressed as [31]:
M u ¨ + C u ˙ + K u = F
where M , C , and K are respectively, mass matrix, damping matrix, and stiffness matrix (n × n matrix, n is the degree of freedom (DOF)); u ¨ , u ˙ , and u are respectively, acceleration, velocity, and displacement; F is the nodal load vector determined by gravitational, centrifugal, and hydraulic forces on FSI boundaries.
The ANSYS mechanical APDL is used as the solver, and the dynamic response characteristics of the turbine pump shafting are calculated in a transient scheme. The flowchart of the numerical simulation is shown in Figure 4.

3. Results and Discussion

3.1. Hydraulic Performance

The designed performance parameters which are supplied by the manufacturer are adopted to verify the accuracy of the numerical results. The hydraulic performance of the simulation results is compared with the designed performance parameters, as shown in Table 2. The error is less than 2.71%, which proves the reliability of the numerical method used in this paper.
The pressure distribution of the runner’s inner surface, crown surface, and band surface are shown in Figure 5. The pressure on the runner’s inner surface is symmetrical and gradually decreases from the leading edge to the trailing edge of the blades, and the maximum value locates at the leading edge, about 60 MPa. For the crown surface and the band surface, the pressure distribution is uniform and symmetrical; the pressure gradually decreases from the outer radius to the inner radius, and the maximum pressure is located at the outer radius and can reach about 5 MPa.
The pressure distribution on the runner inner surface in one rotating cycle is shown in Figure 6. It can be seen that there are only a few differences between different times of the pressure distribution on the runner inner surface, i.e., pressure distribution is stable in one rotating cycle.
The streamline in the flow passage is also analyzed in this paper, as shown in Figure 7. It can be seen that the streamline is smooth in the spiral casing, stay vane, and guide cane, and then rotating with the runner, the maximum relative velocity is located in the runner with a value of 80 m/s. In the draft tube, it can be seen that a vortex rope exists.

3.2. Pressure Pulsation Characteristics

The pressure fluctuation in the flow passage is an important parameter to evaluate the safety of the unit. The pressure fluctuation of six monitoring points located in the spiral casing, guide vane, runner, band gap, crown gap, and draft tube are analyzed, as shown in Figure 8. It can be seen that the maximum pressure is located in the spiral casing, but the peak-to-peak value of the pressure fluctuation is small, whereas the largest is in the runner.
In order to evaluate the peak-to-peak value of the pressure fluctuation, a dimensionless parameter R P is defined in this paper to evaluate the relative pressure fluctuation amplitude:
R P = P ρ g H
where P is the peak-to-peak value of the pressure fluctuation, ρ is the density of the fluid, g is the gravitational acceleration, and H is the head.
The relative pressure fluctuation amplitude in the spiral casing, guide vane, runner, band gap, crown gap, and the draft tube is shown in Figure 9. It can be seen that the pressure fluctuation amplitude in the runner reaches about 16% of the head, then the guide vane reaches about 8% of the head. The pressure fluctuation amplitude in the crown gap and the band gap is about 2~3% of the head. The pressure fluctuation in the draft tube is the smallest.
The frequency spectra of the pressure fluctuation are also analyzed in this paper, as shown in Figure 10. The dominant frequency of the pressure fluctuation in the runner is 20 f n , which is the guide vane passing frequency. In the guide vane, the dominant frequency is 9 f n , which is the runner blade passing frequency. In the spiral casing, crown gap, band gap, and draft tube, the dominant frequency is 18 f n , which is twice the runner blade passing frequency.

3.3. Hydraulic Thrust

In engineering, the value of hydraulic thrust is difficult to be obtained on site, as the rotating part of the prototype hydraulic unit usually weighs hundreds or even thousands of tons, which greatly increases the difficulties of evaluation. Furthermore, the hydraulic thrust is the integration of the pressure on the runner surface, which means it cannot be obtained by test directly. Unlike the site evaluation, computational fluid dynamics is a convenient method for studying hydraulic thrust. The hydraulic thrust analyzed is expressed in tons, so as to compare it with the weight of the rotating part, and the positive value of the axial hydraulic thrust means the direction is upward.
The time history and frequency of the axial and the radial hydraulic thrust are shown in Figure 11 and Figure 12, respectively. The axial hydraulic thrust is about 170 t and the direction is upward, which offsets the weight of the rotating parts, thus reducing the load on the thrust bearing. However, the fluctuation of the axial hydraulic thrust can reach to about 20 t, thus affecting the stability of the shafting. The frequency spectra show that the dominant frequency is 0.4 f n , but there is also the runner blade passing frequency (9 f n ). In some transient processes, such as the start-up and the shutdown process, there is a point of time in which the rotational speed is the same as the dominant frequency of the axial hydraulic thrust and the risk of the resonance of the unit is increased at this point.
The radial hydraulic thrust mainly affects the load on the guide bearing and the seal, and the direction of the radial hydraulic thrust always changes along with the rotating runner. The value of the radial hydraulic thrust is far less than the axial hydraulic thrust, but the fluctuation of the radial hydraulic thrust can reach to about 10 t. The frequency spectra show the dominant frequency is 28.2 f n , but there is also the existence of frequencies as low as 1 f n .

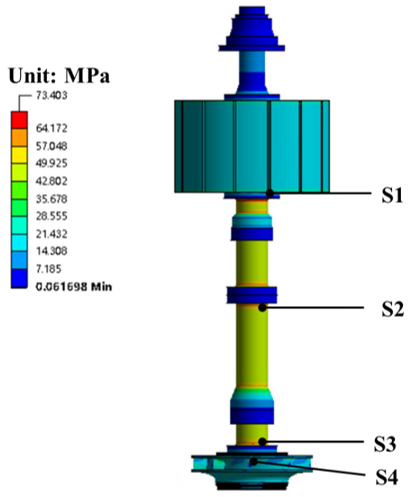
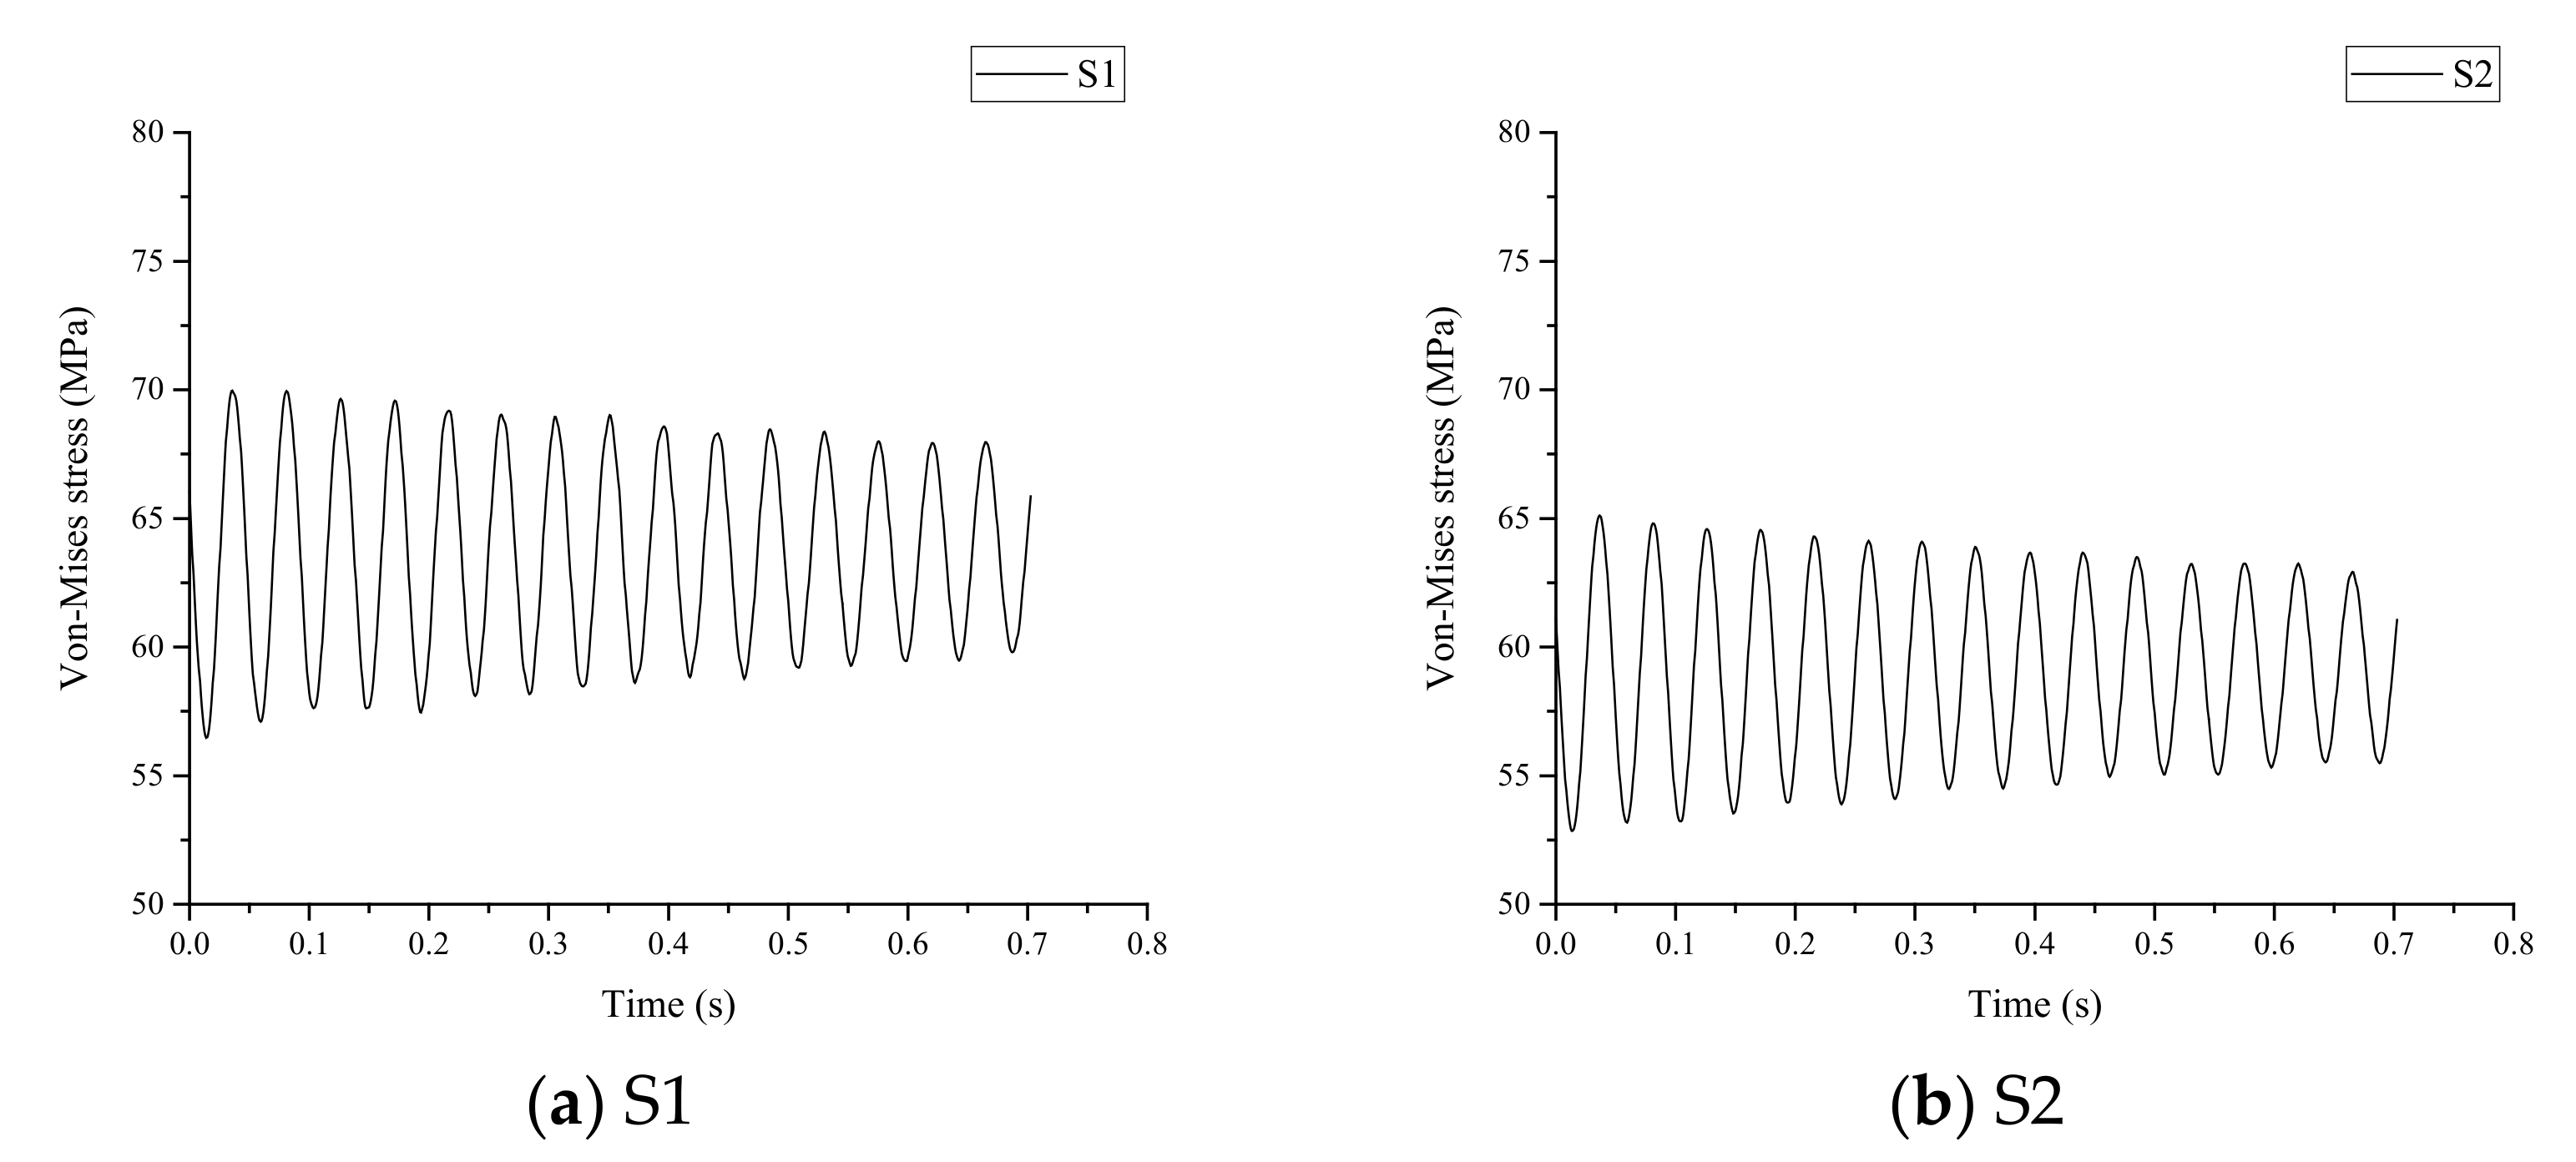
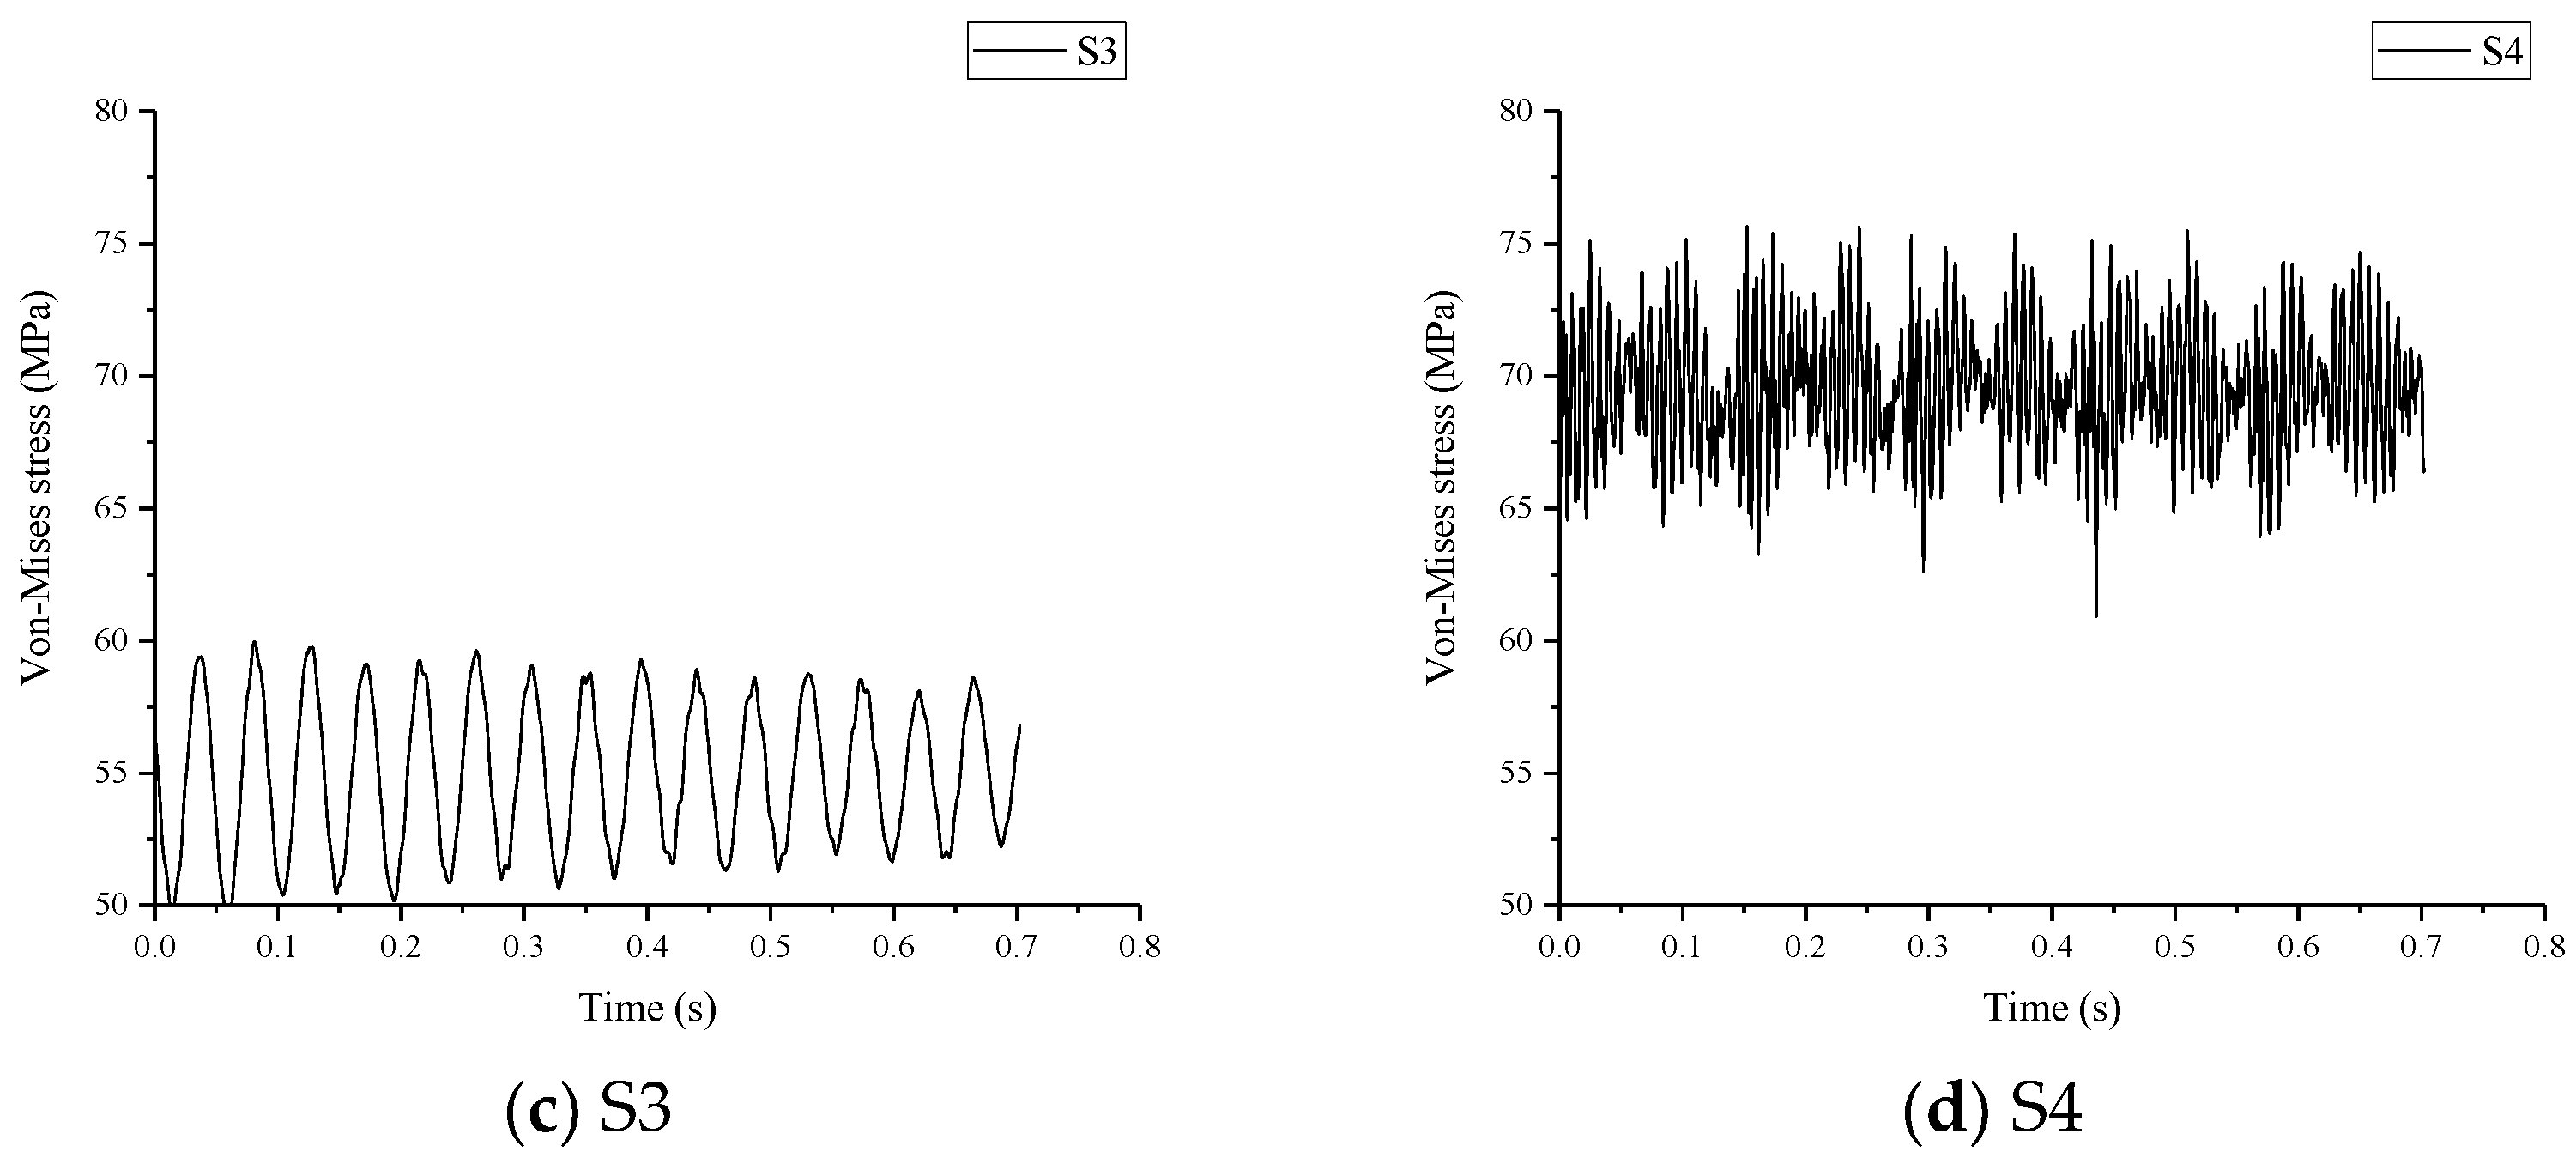
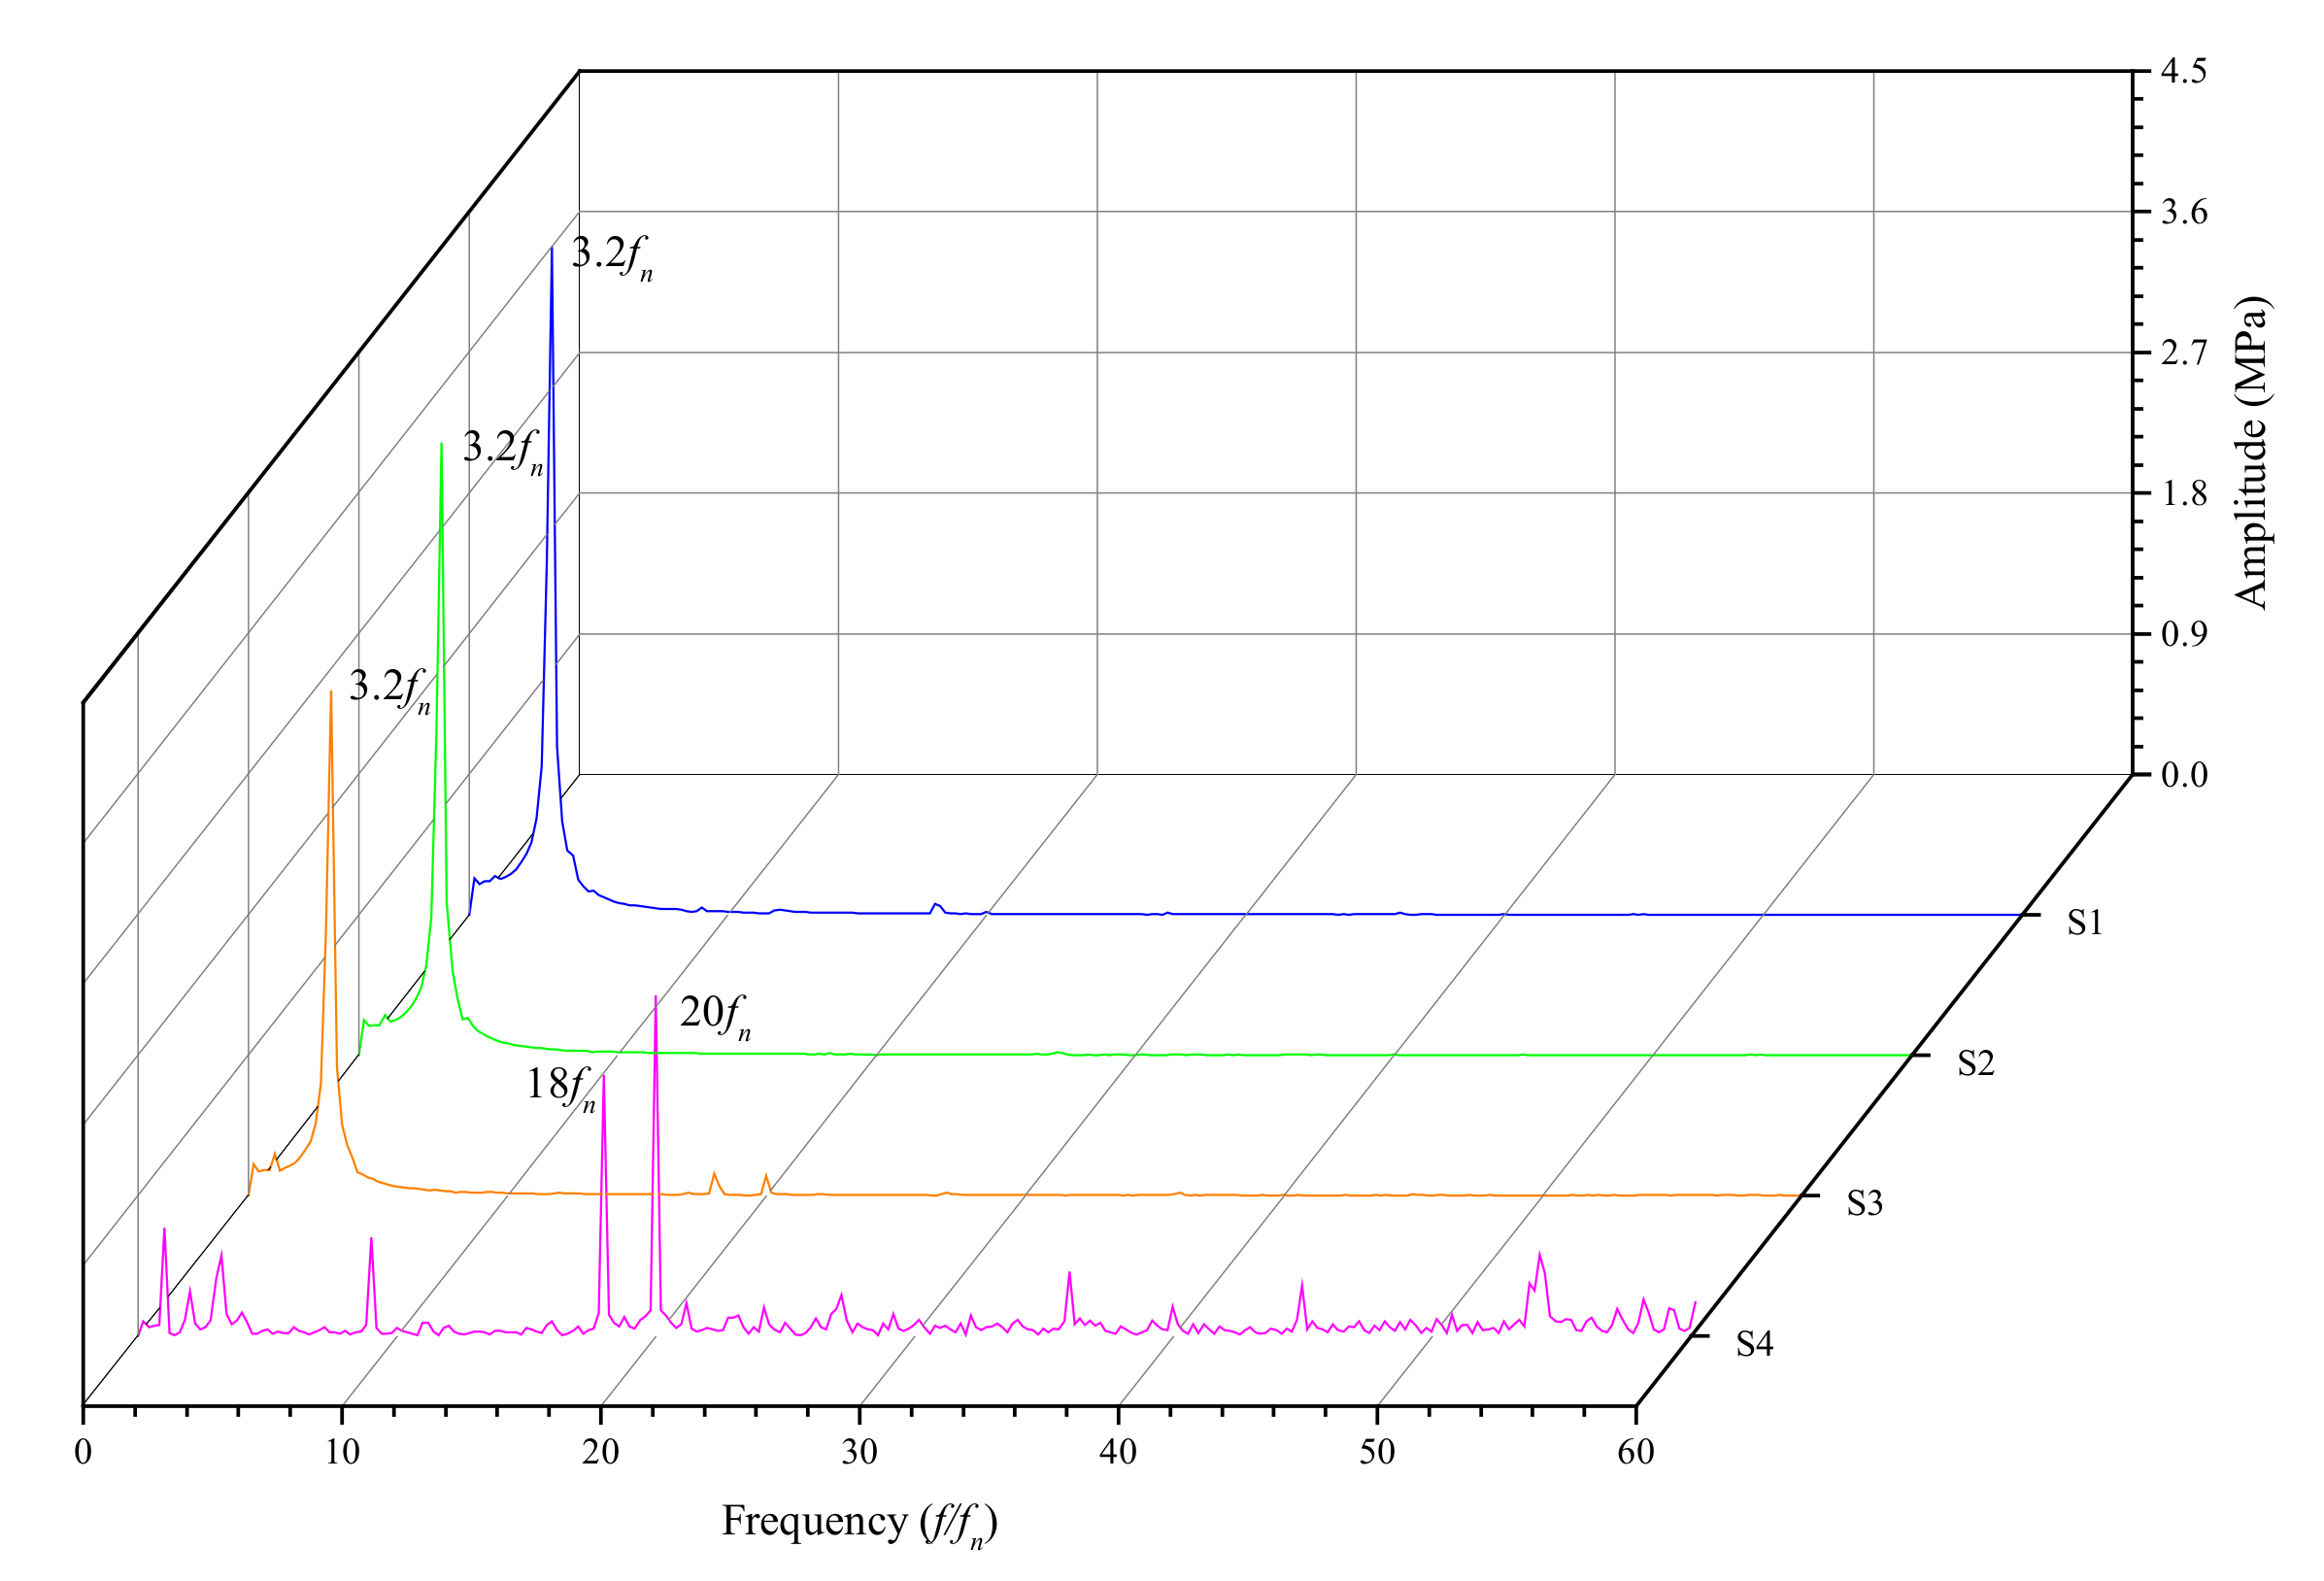
3.4. Dynamic Response of the Shafting

The hydraulic pressures on the runner surfaces in the rated operating condition under the turbine mode are applied on the FSI interfaces, and the dynamic response of the shafting is then determined; the radial and the axial deformation of the shafting are shown in Figure 13.
The radial and axial displacement on the shafting are symmetrical around the axis, except for the runner. This means the unbalanced hydraulic force is mainly balanced by the water guide bearing. In some serious operating conditions, the water guide bearing failure case might occur due to excessive axial hydraulic thrust. The axial and radial deformation on the runner show asymmetrical law; the runner band has upward deformation, but is also accompanied by a slight tilting.
The stress distribution on the shafting is shown in Figure 14. The stress concentration is located at the flange root and the runner blade. Four stress monitoring points named as S1–S4 are placed on the shaft to analyze the dynamic stress and the frequency characteristics.
The dynamic stresses on the monitoring points are shown in Figure 15. It can be seen that the dynamic stress on the shaft is stable, with an amplitude about 10 MPa. The dynamic stress on the runner has an amplitude of 10 MPa, but the variation is more complex. Hence, the frequency spectra of the dynamic stresses are analyzed, as shown in Figure 16.
The dominant frequency of the stress on the shaft is 3.2 f n , while the dominant frequency on the runner is 20 f n , which is the guide vane passing frequency.

4. Conclusions

In the present work, a complete CFD model considering the pressure balance pipe and a complete shafting FEM model are established to overcome the shortcomings of the existing study. Then, a transient simulation of a turbine pump in the turbine mode is carried out. The pressure fluctuation characteristics in the flow passage, the axial hydraulic thrust, and the radial hydraulic thrust are analyzed, and the dynamic behavior of the shafting is determined. The main conclusions drawn are as follows:
(a)
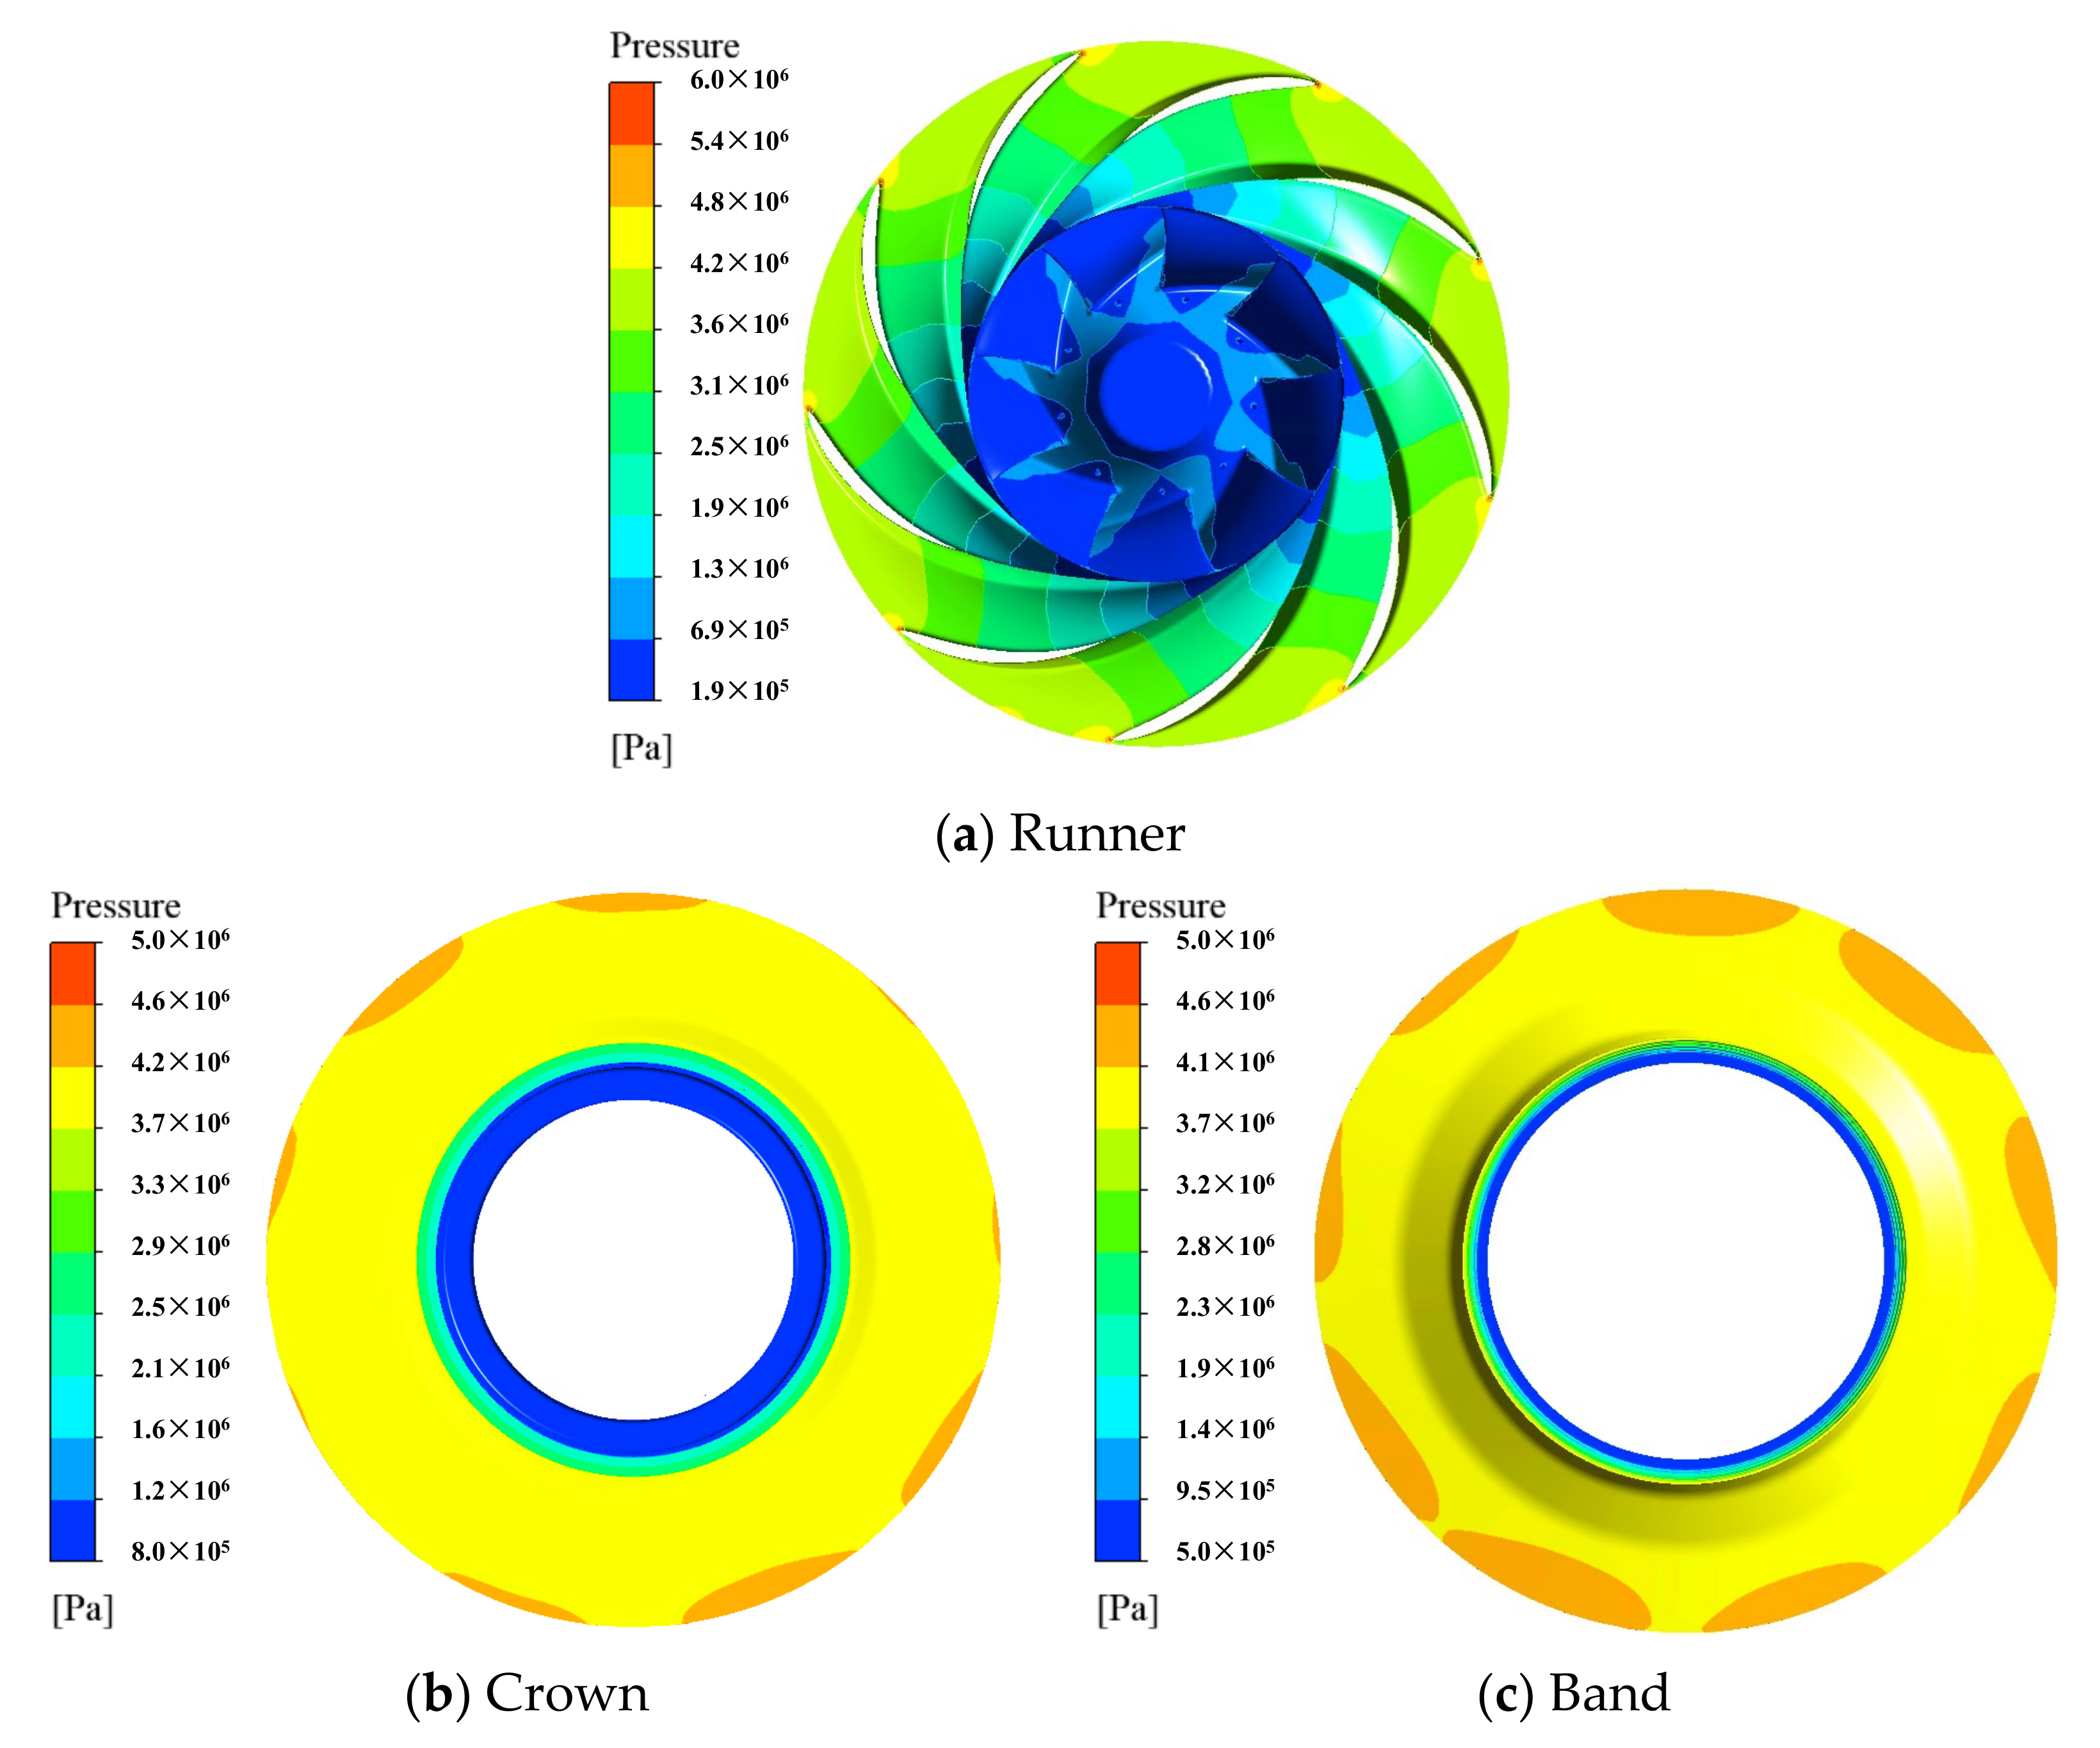
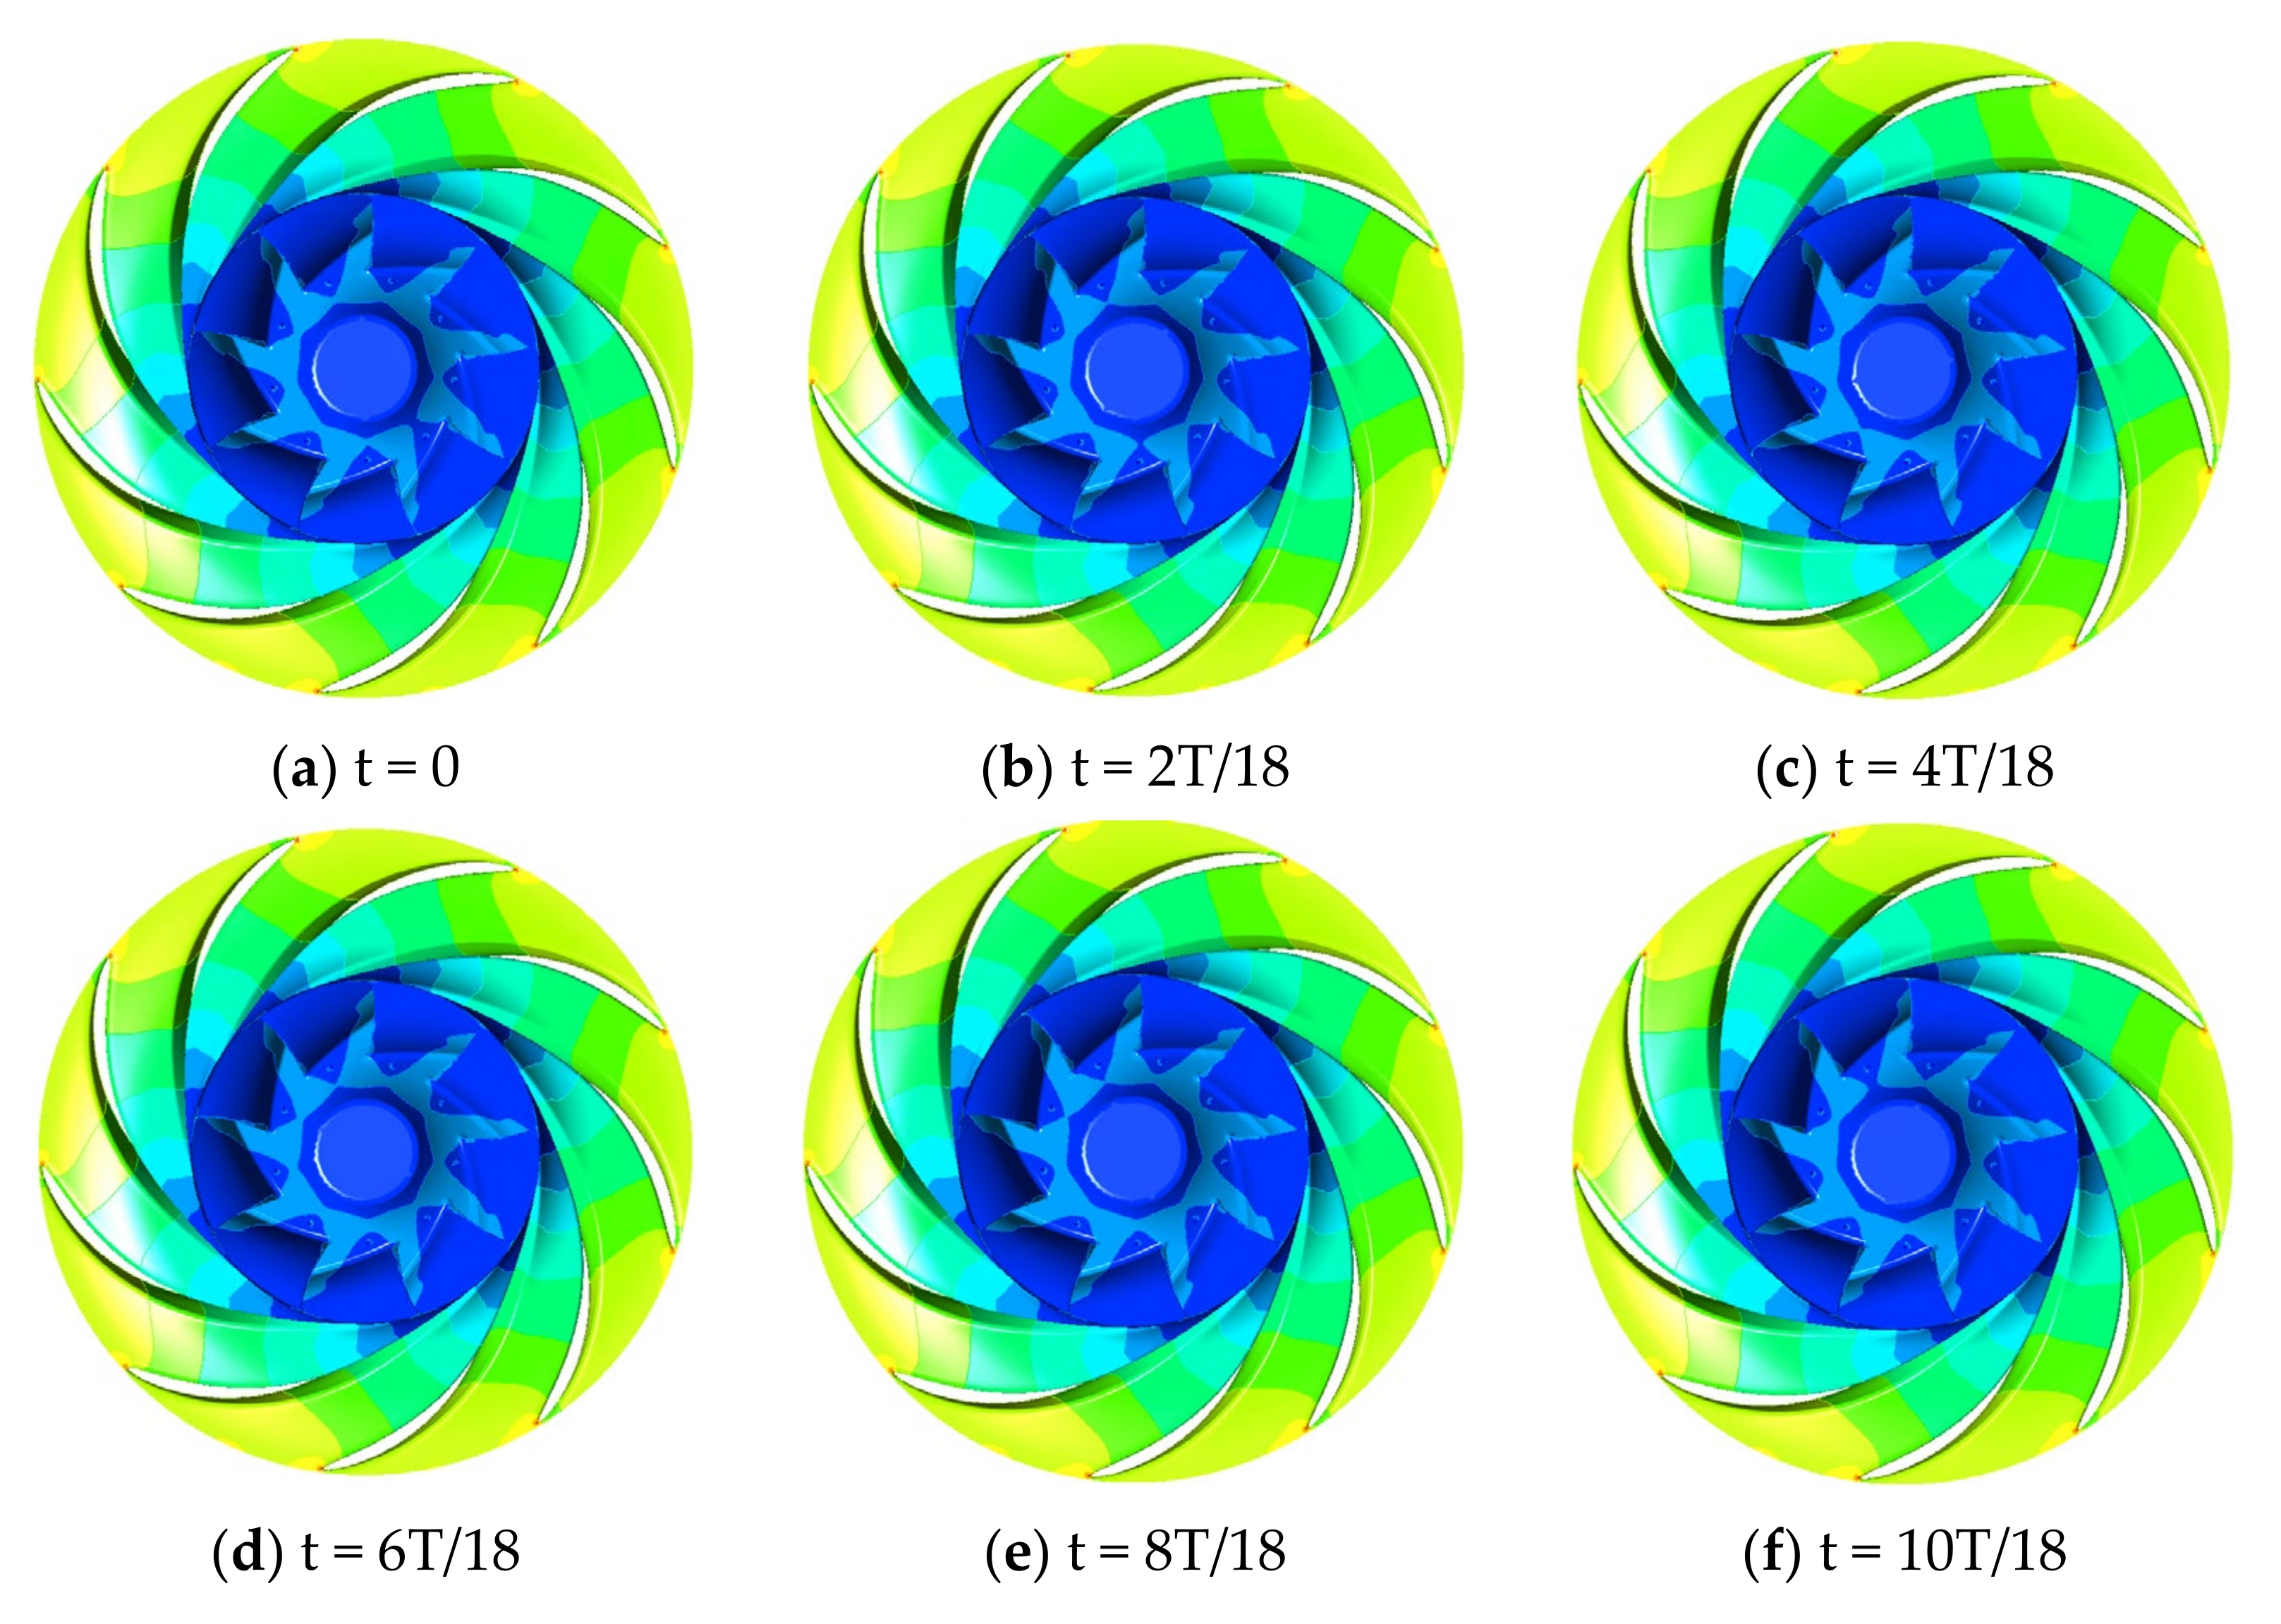
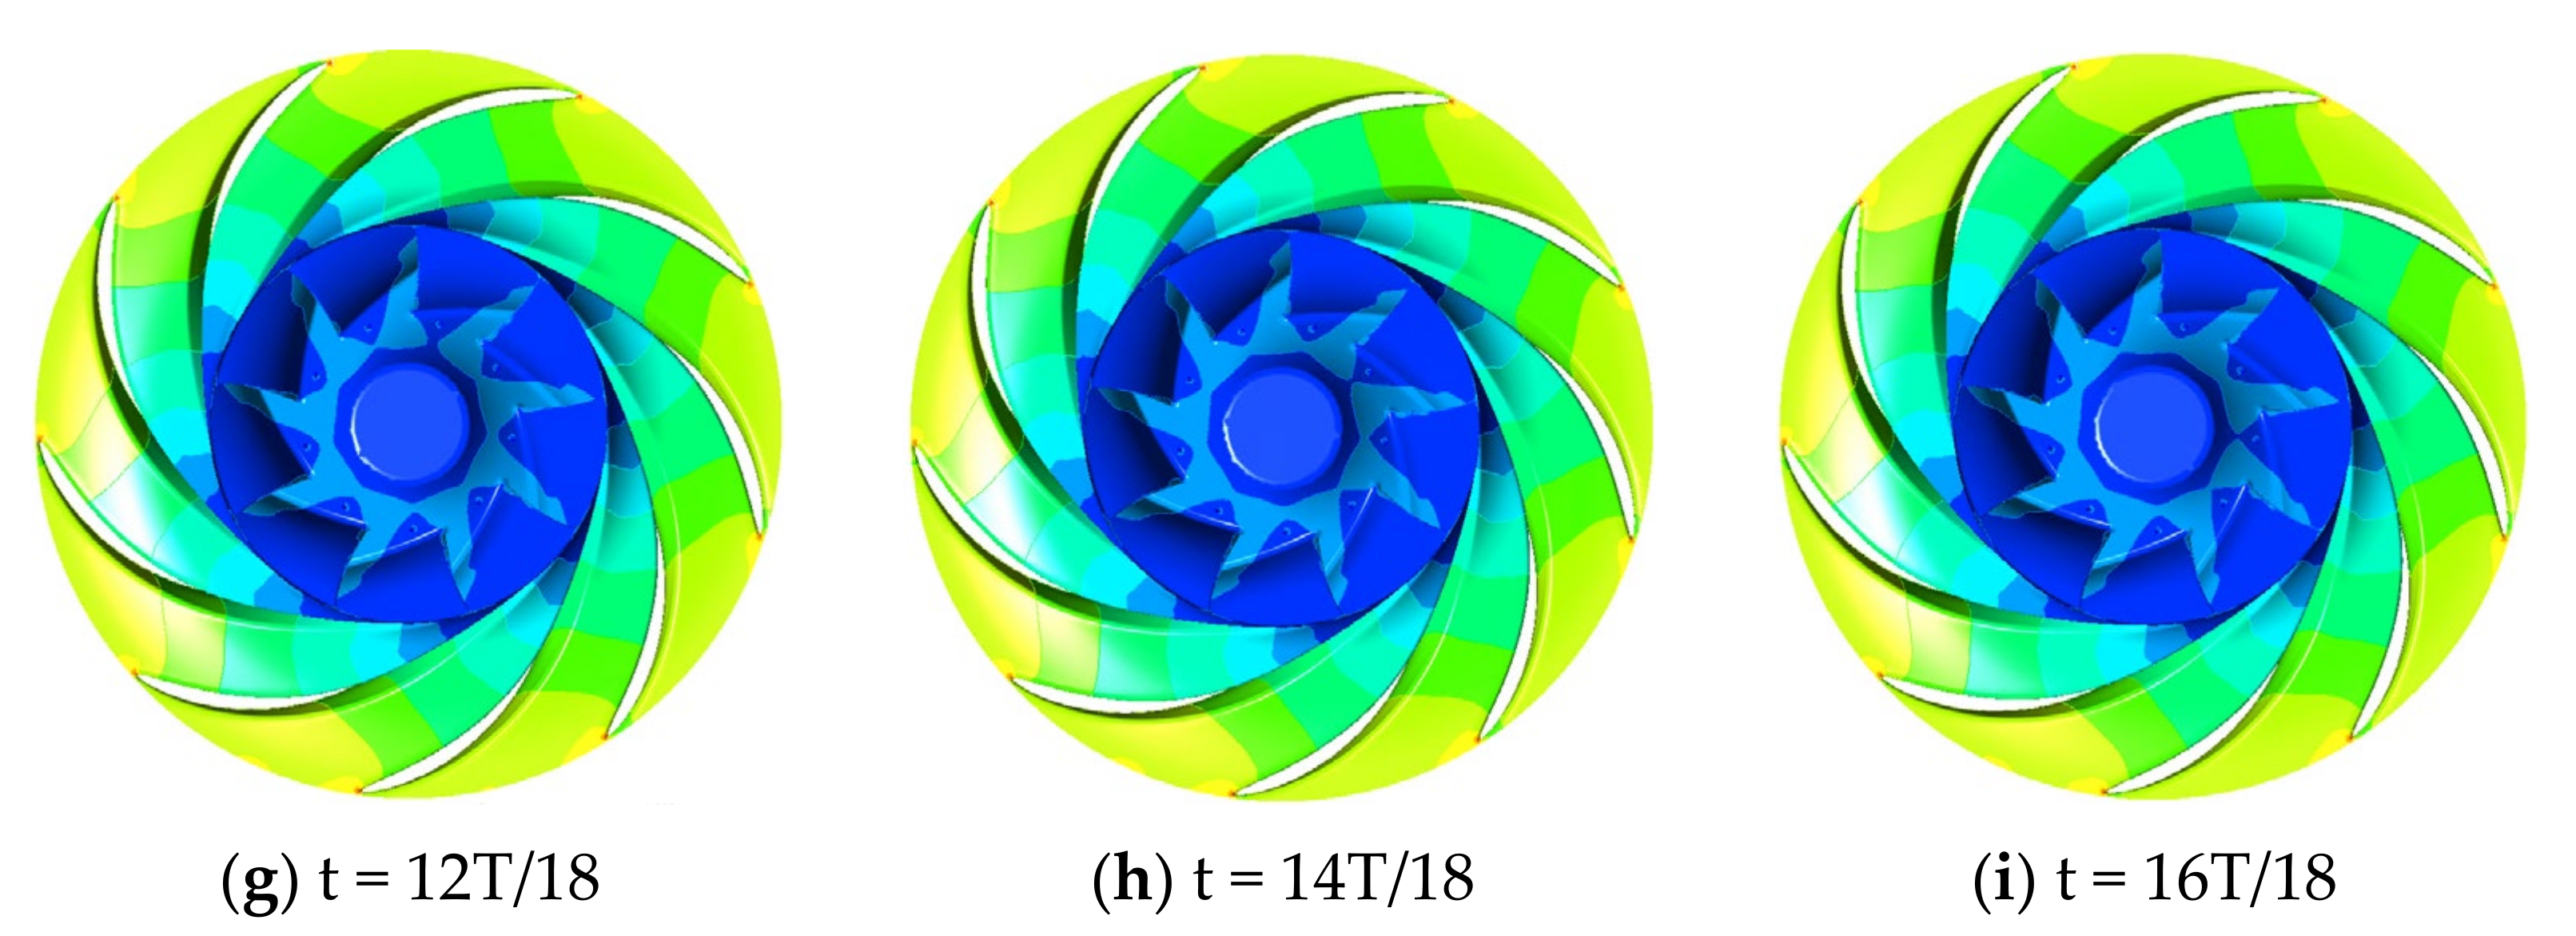
The hydraulic performance calculated by the CFD shows good agreement with the designed parameters; the pressure distribution in the flow passage is symmetrically distributed and gradually decreases from the spiral casing to the draft tube, and the pressure distribution on the runner surface is stable in one rotating circle.
(b)
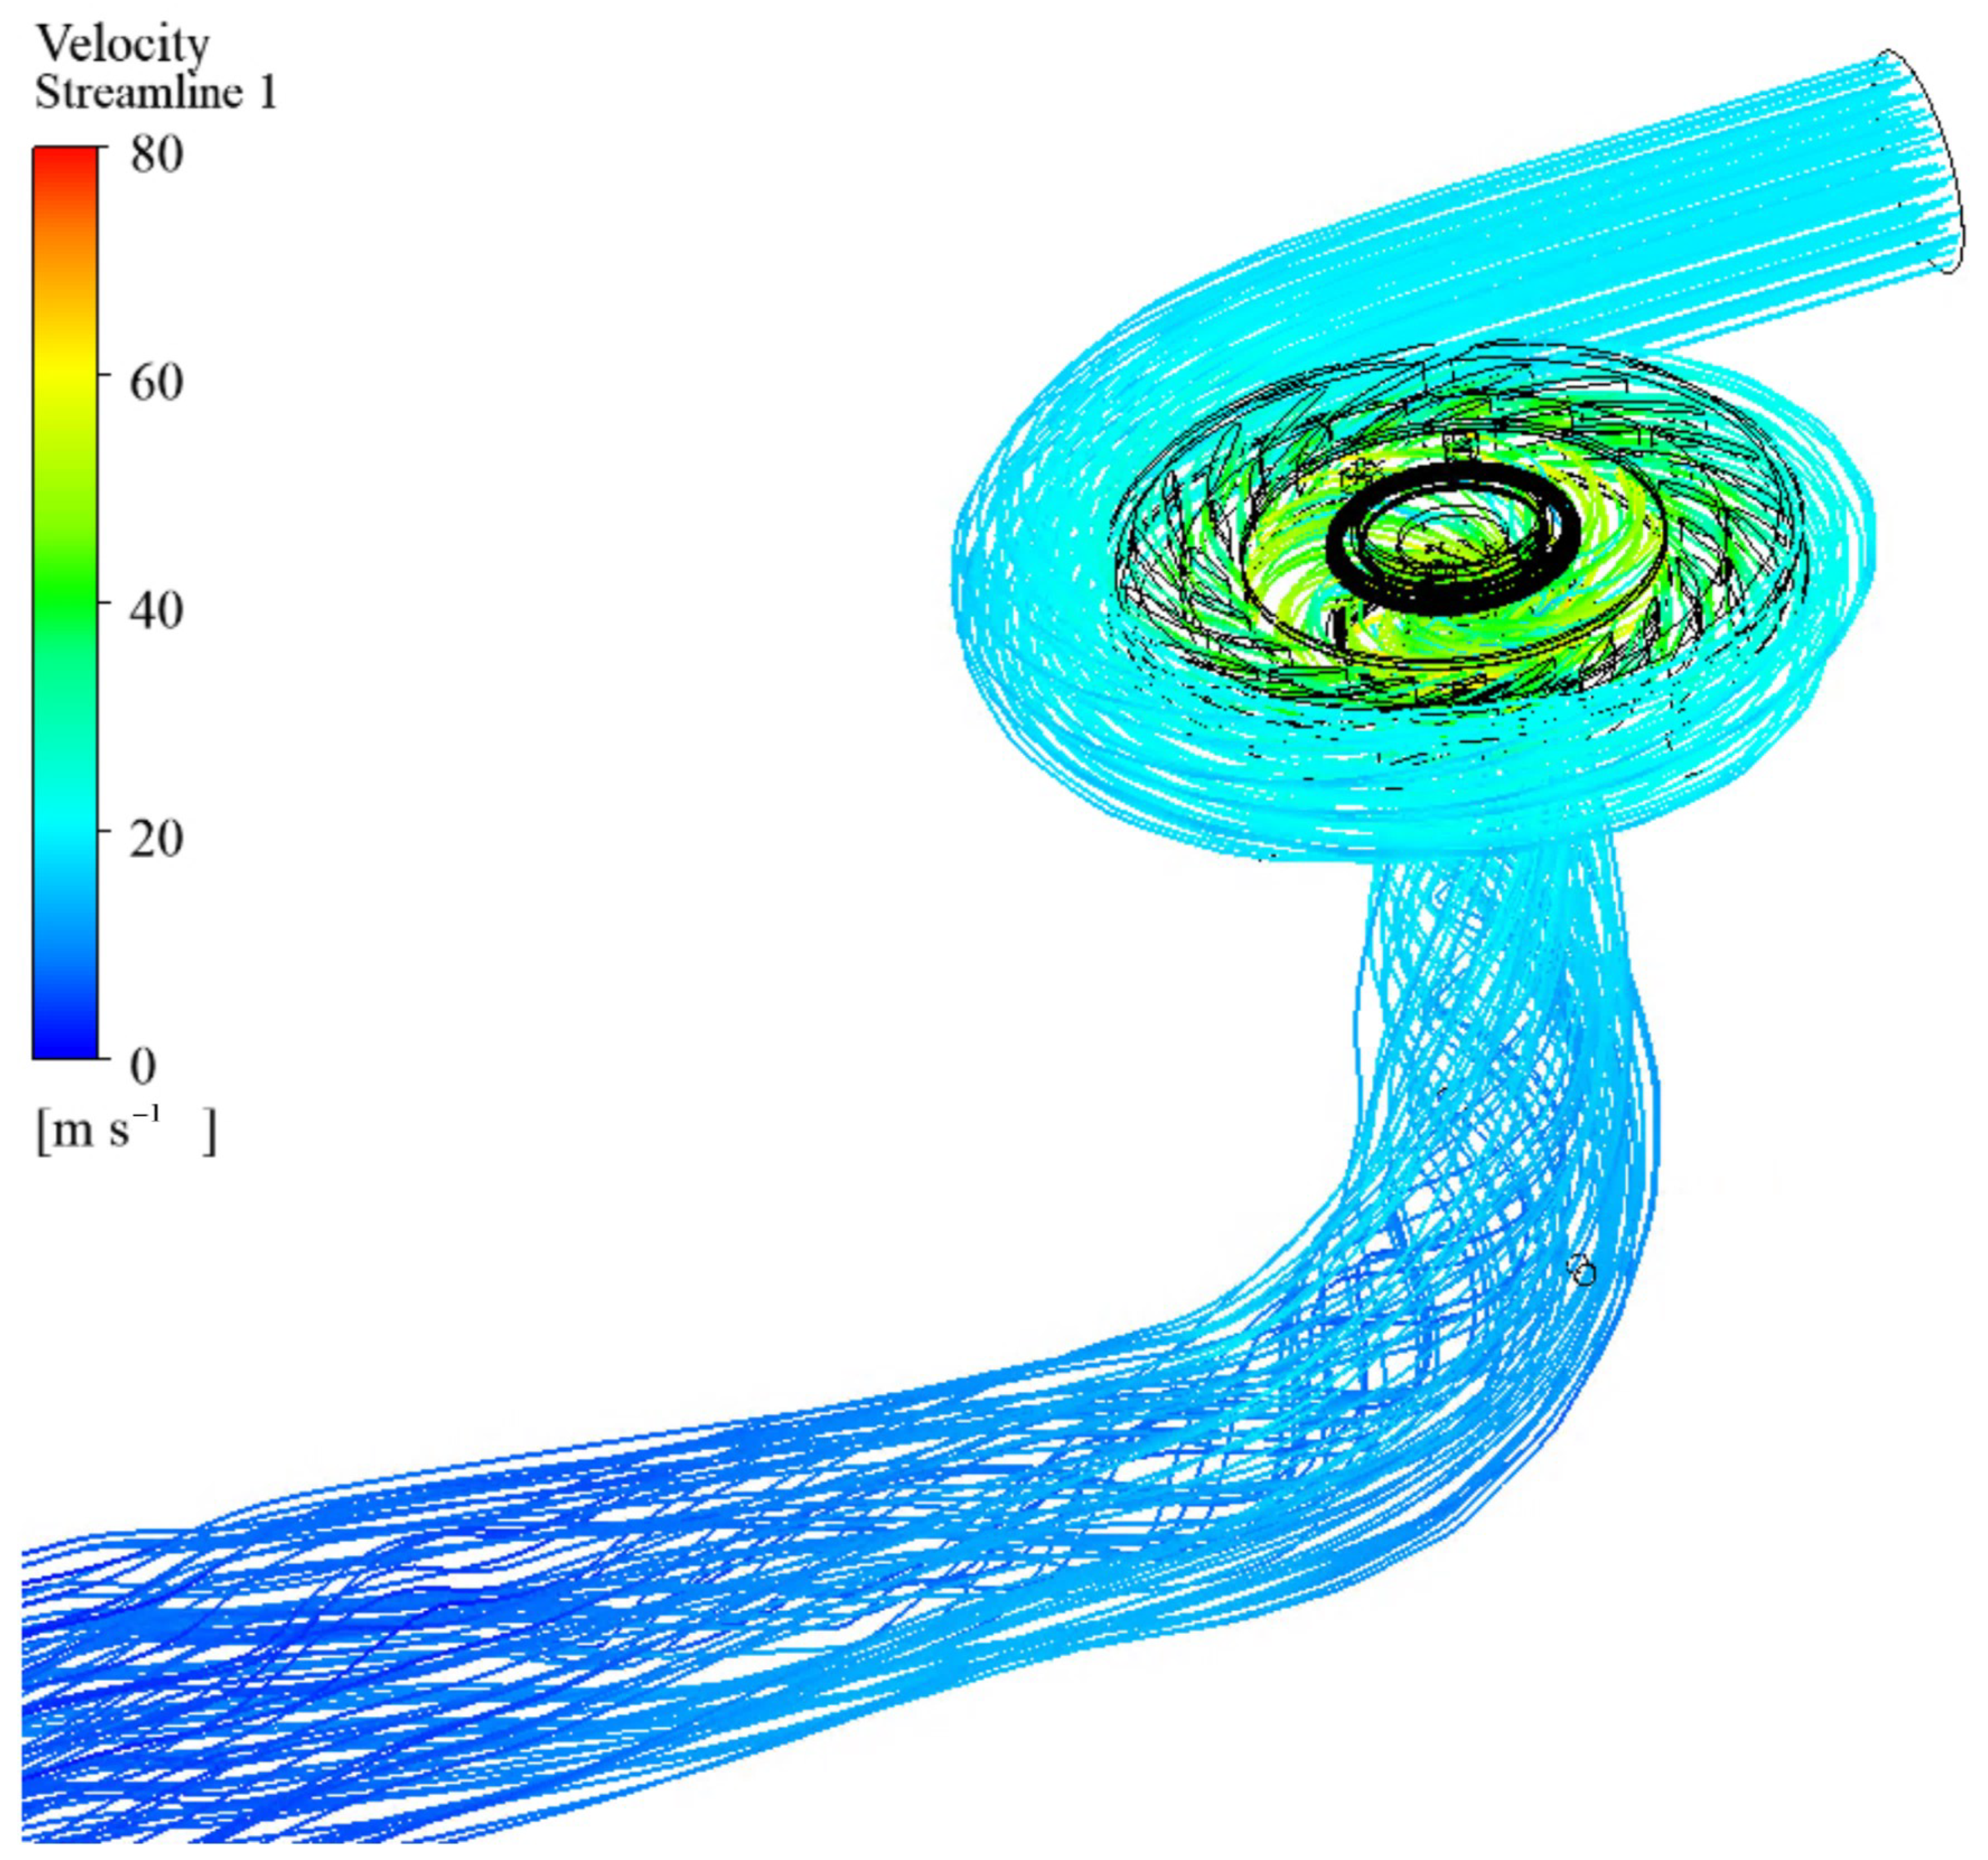
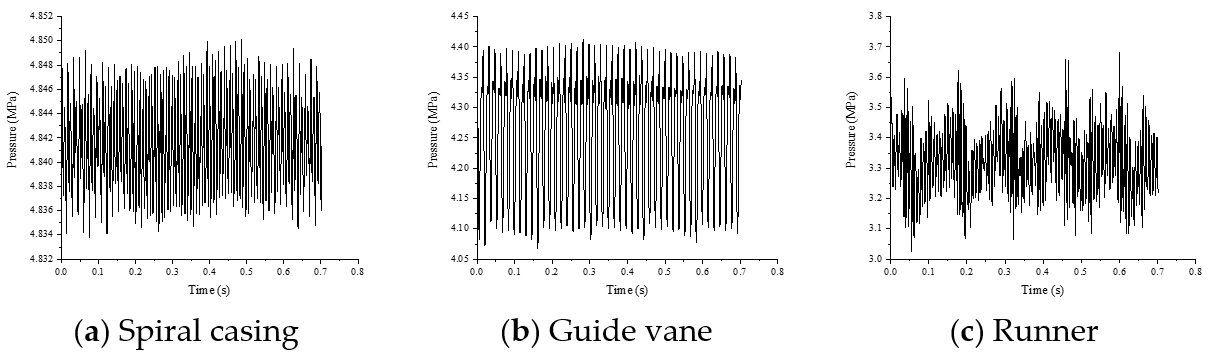
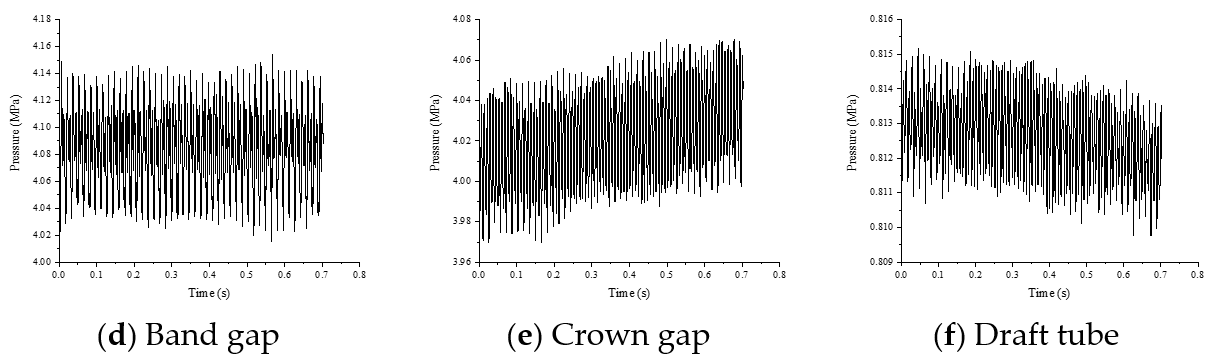
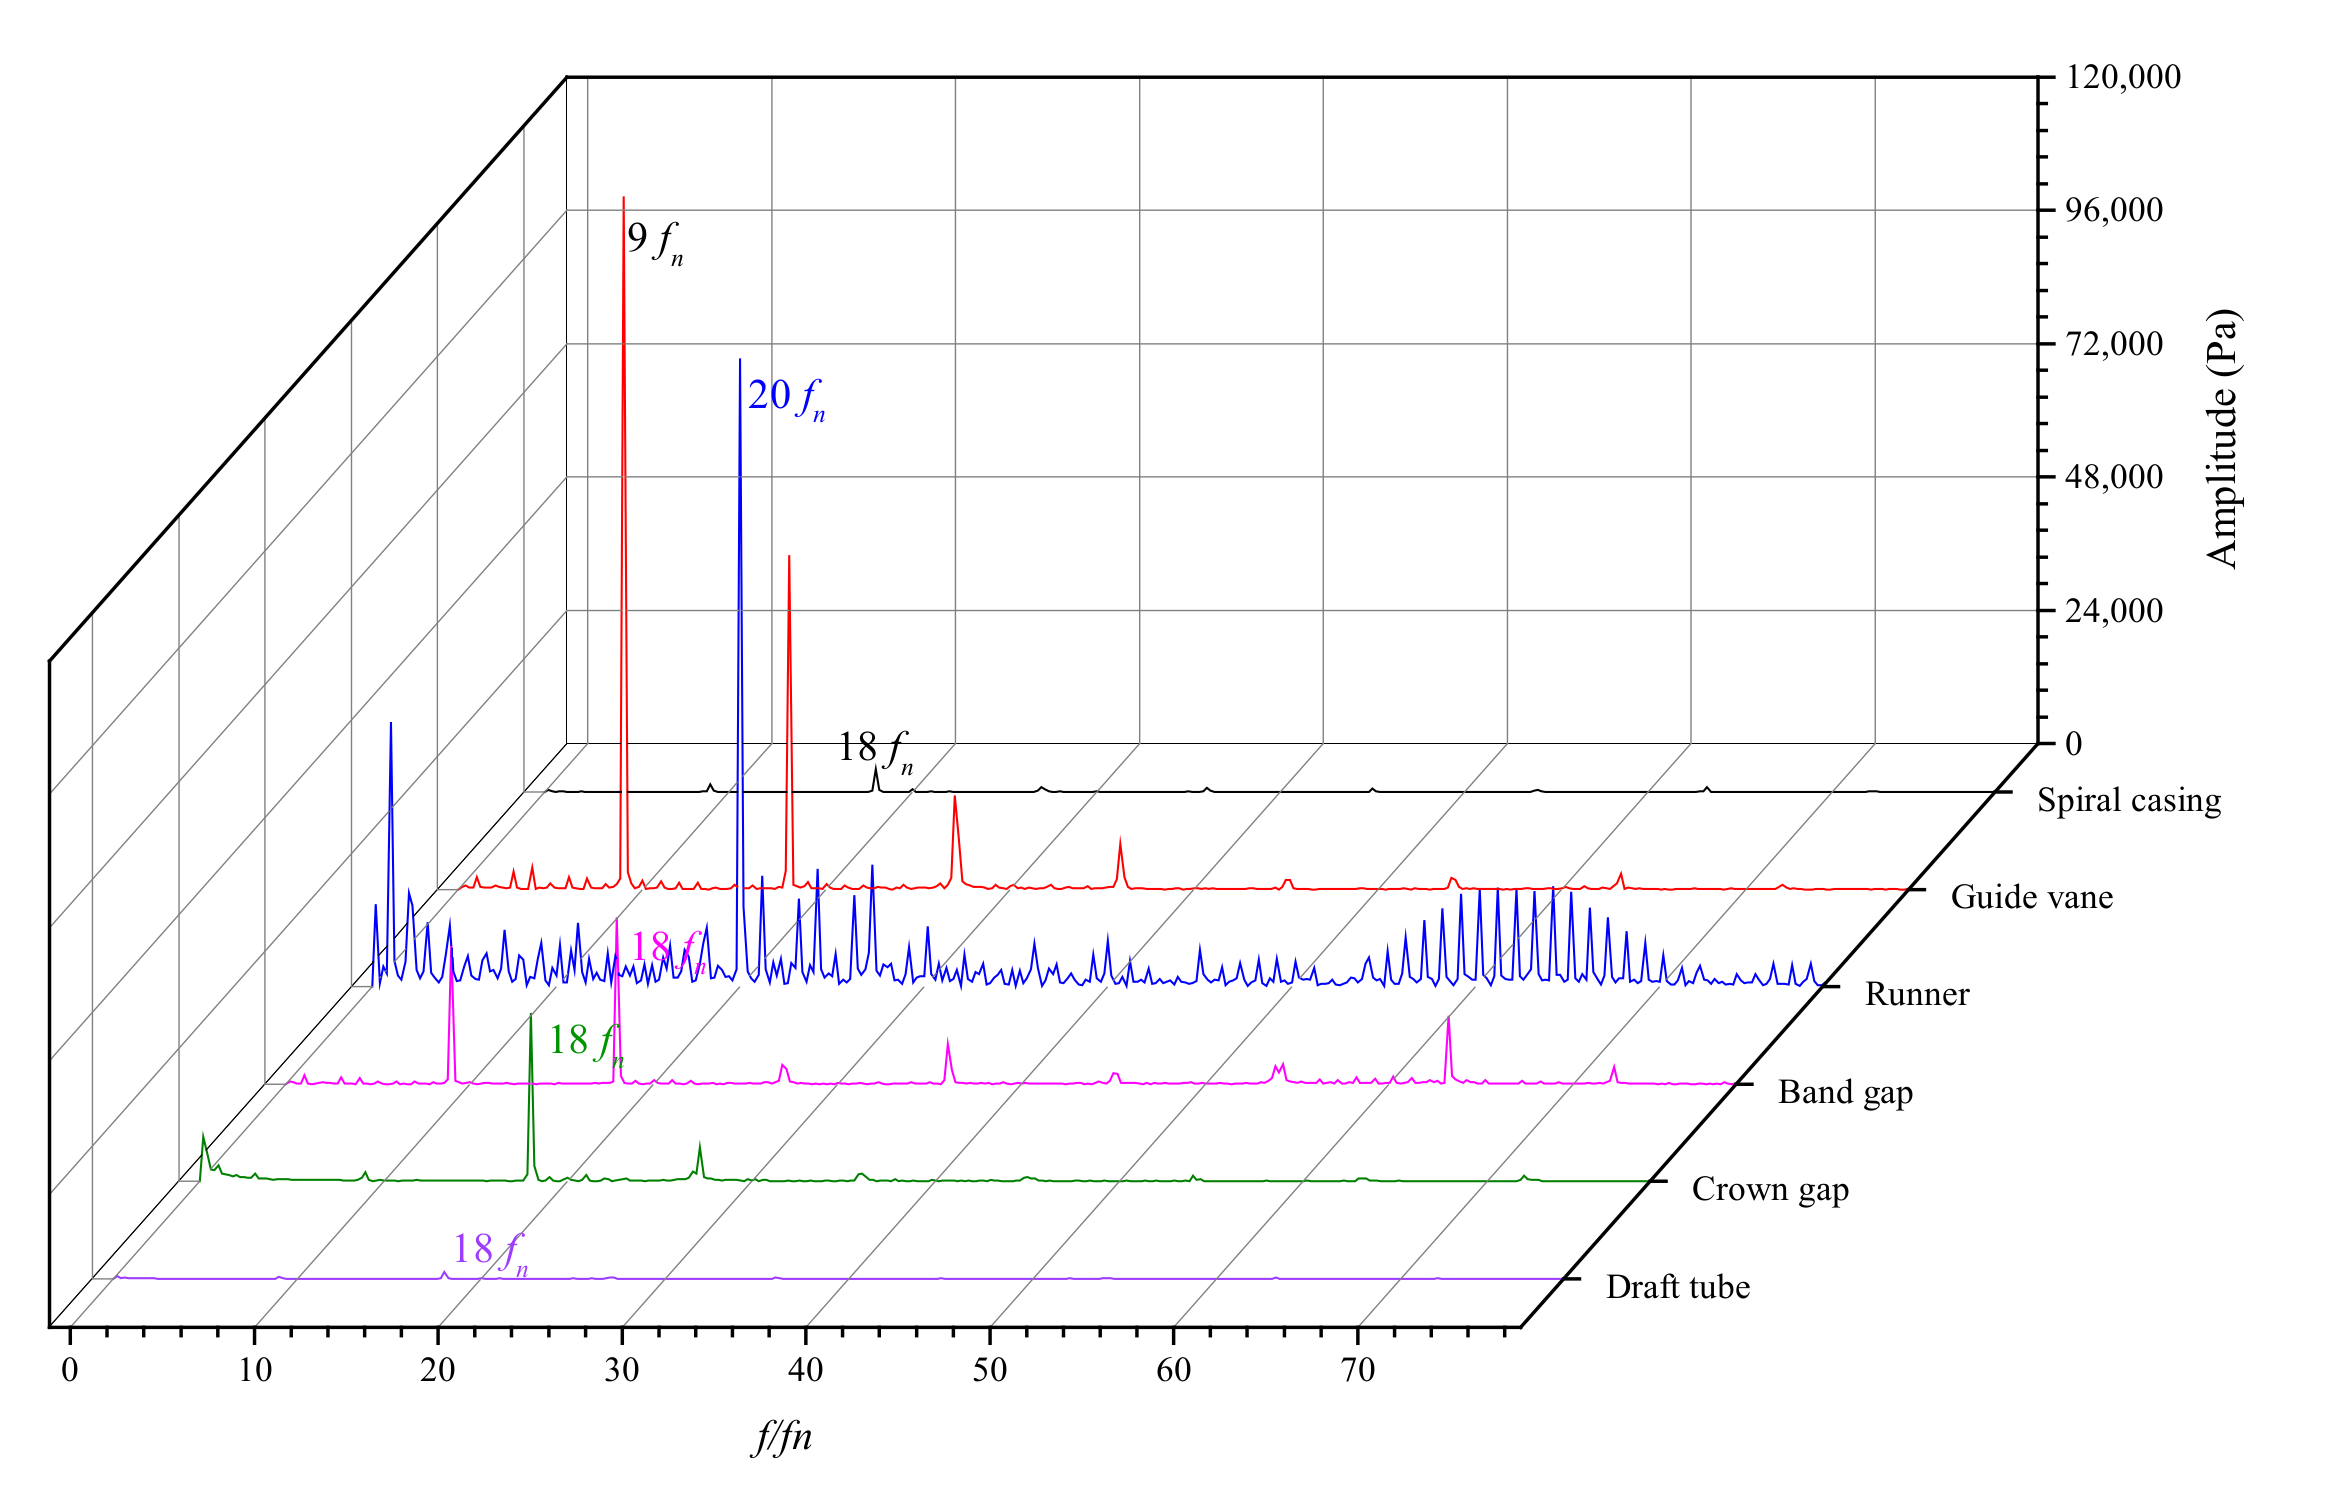
The streamline is smooth in the whole flow passage with one vortex rope in the draft tube. The pressure fluctuation of the runner reaches 16% of the head, which is greater than other flow passages. The typical dominant frequencies are found in the runner and the guide vane; the guide vane passing frequency in the runner and the runner blade frequency in the guide vane.
(c)
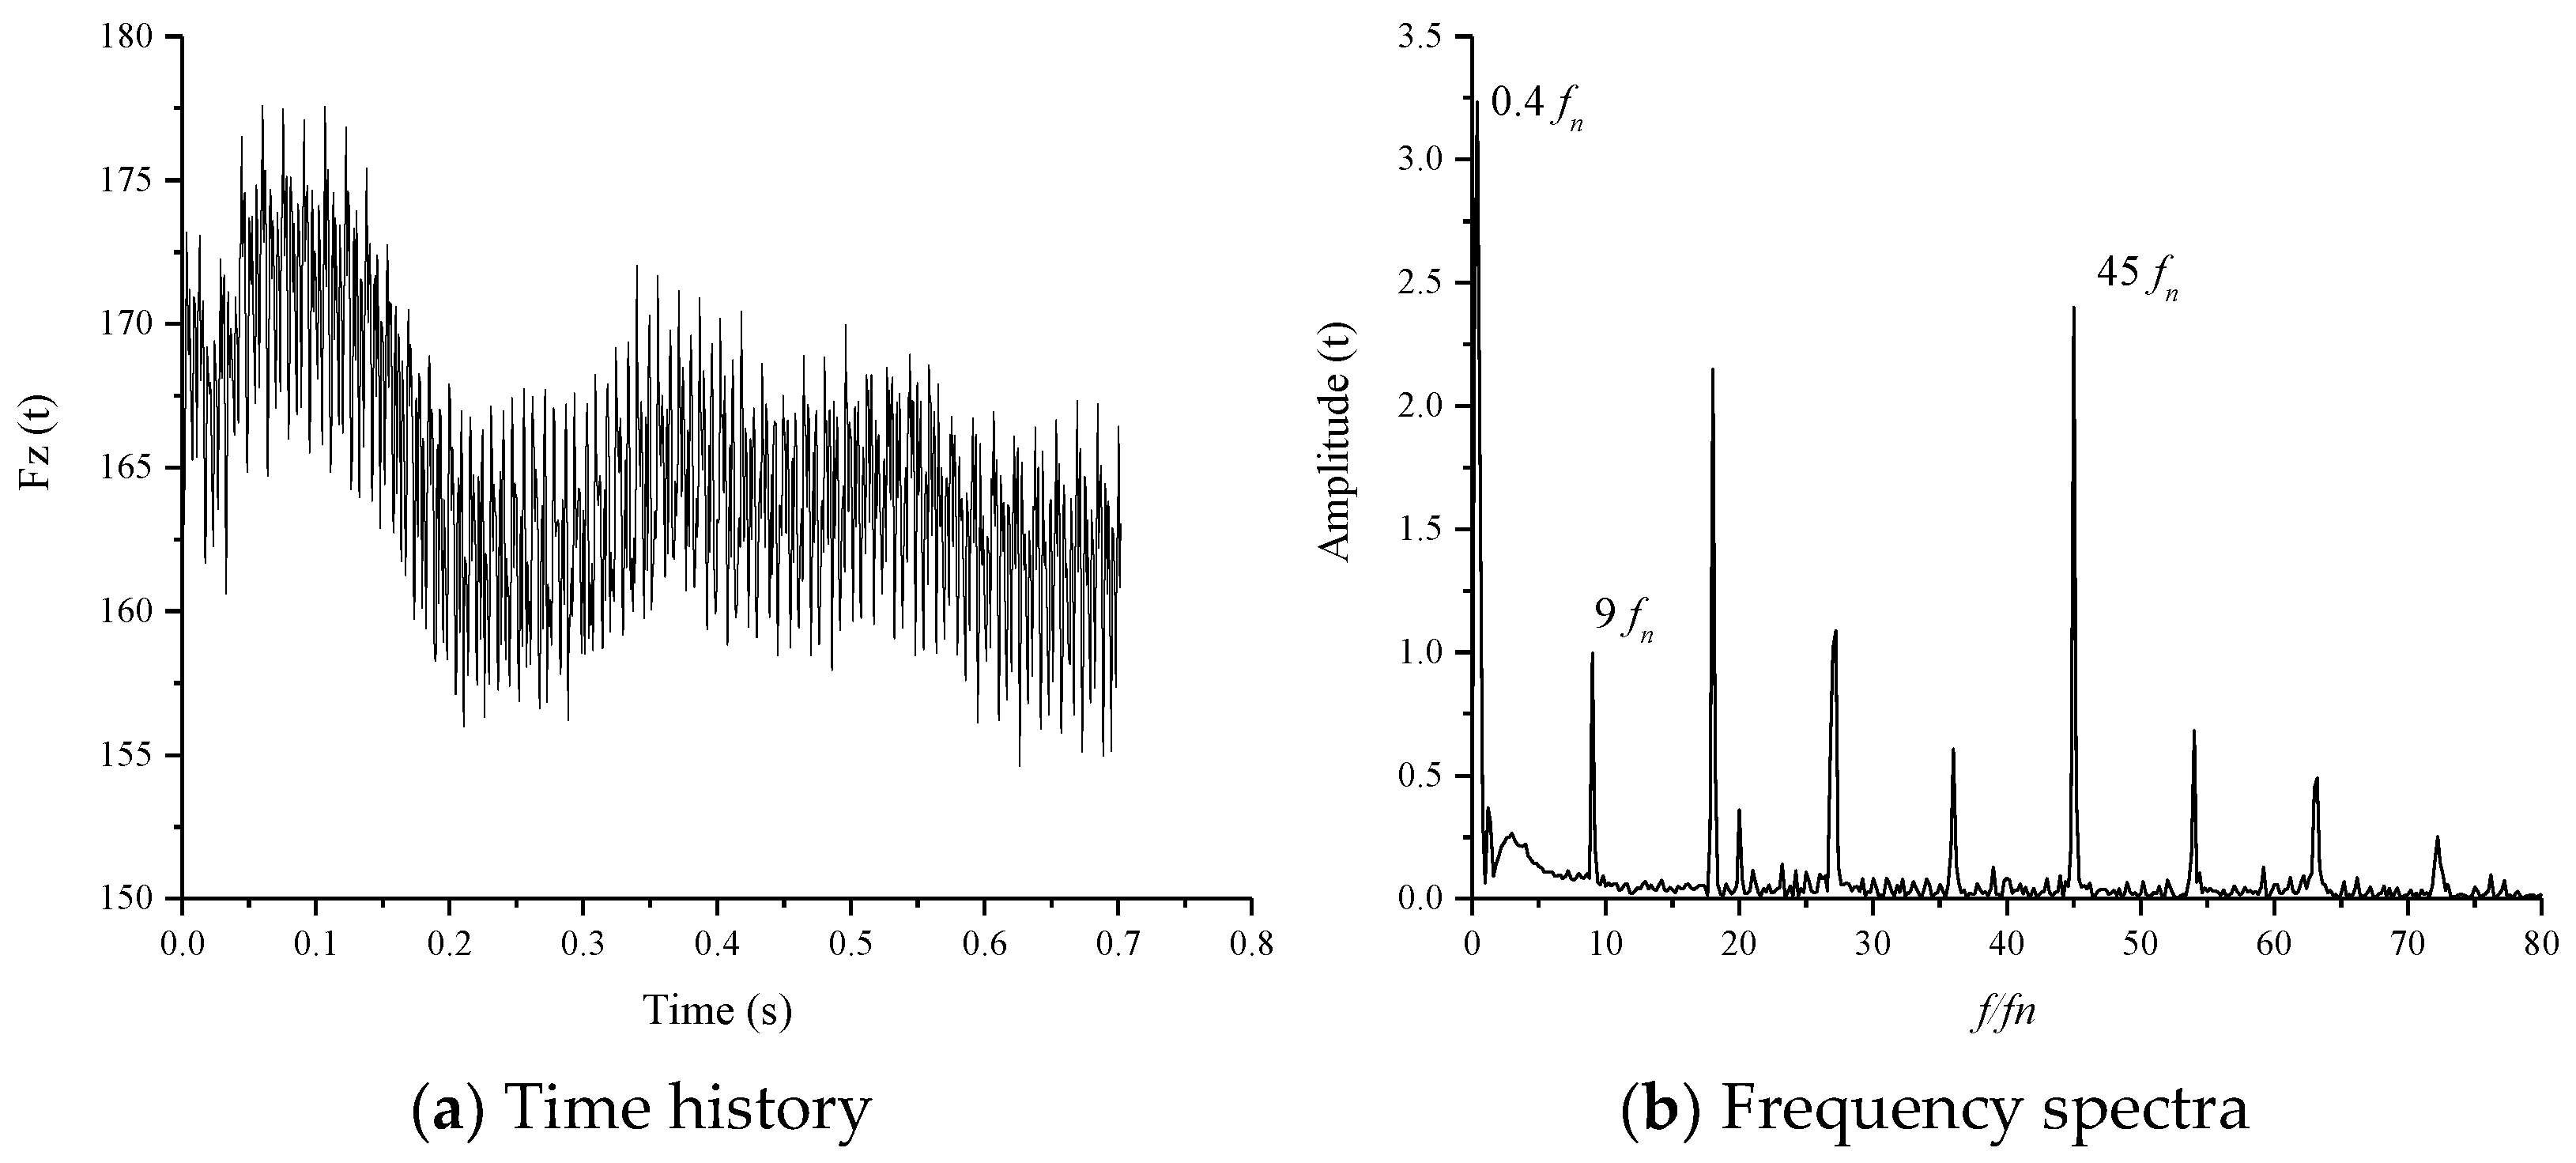
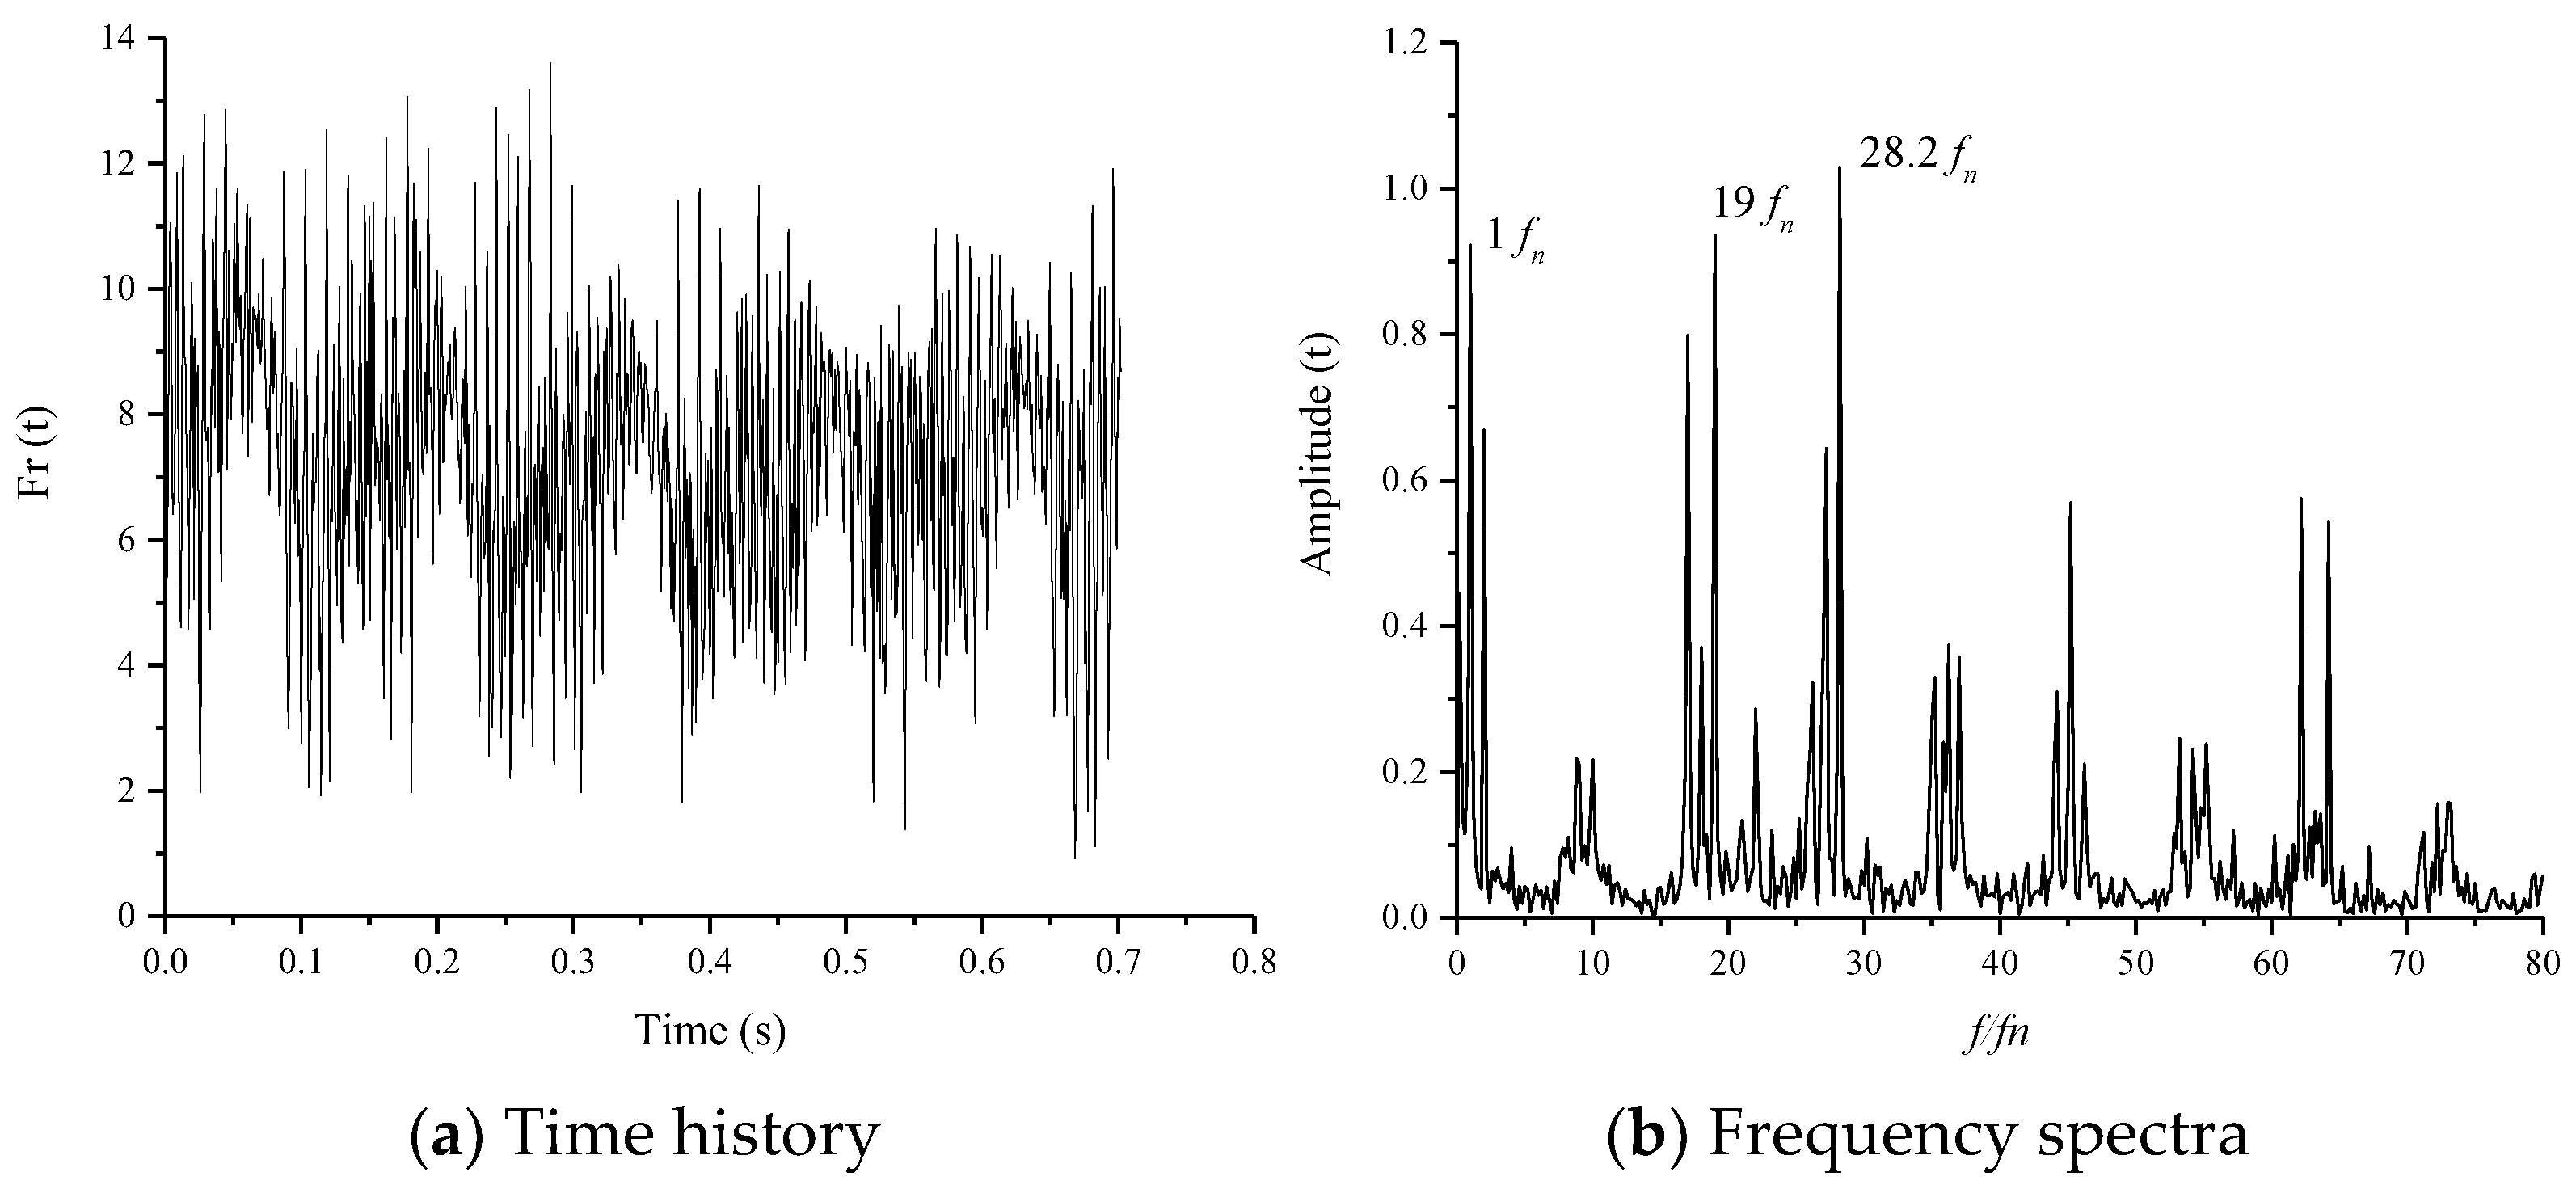
The radial hydraulic thrust is much smaller than the axial hydraulic thrust. The axial hydraulic thrust fluctuates from about 155 t to 175 t, and the dominant frequency is only 0.4 f n . The unit has the risk of resonance caused by axial hydraulic thrust in the start-up and shutdown processes. The radial hydraulic thrust fluctuates from about 2 t to 13 t.
(d)
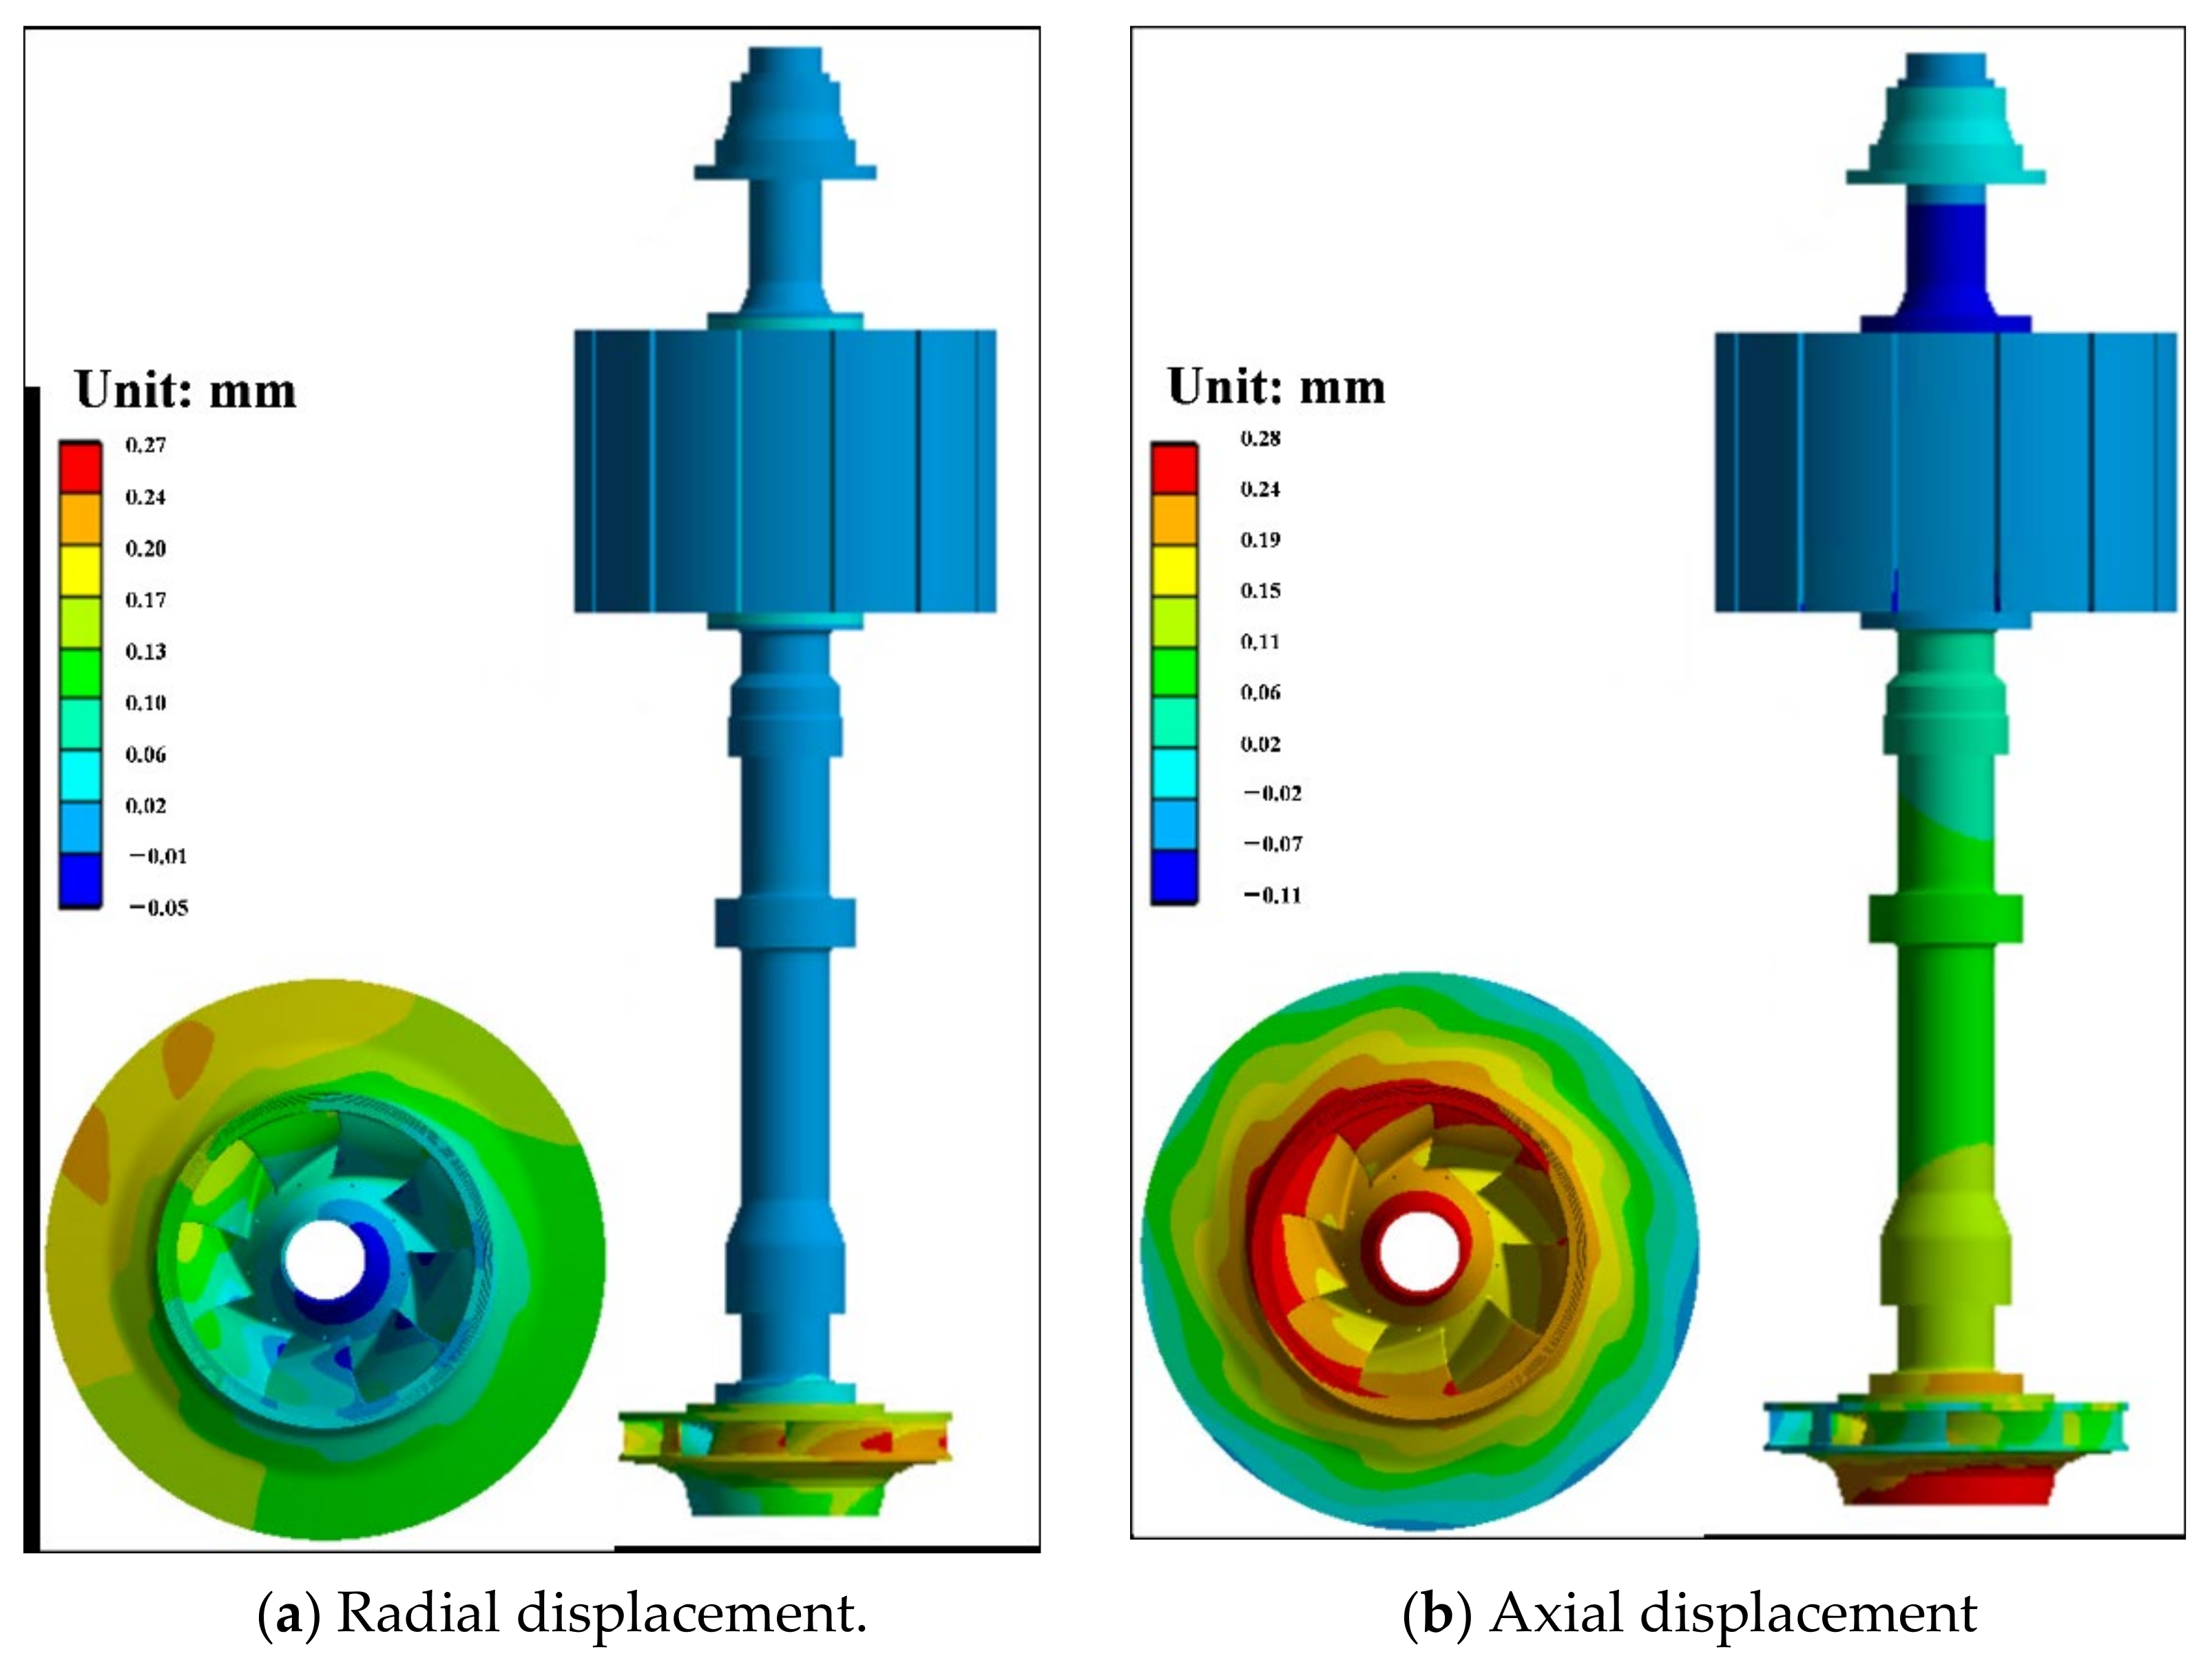
The runner has asymmetrical deformation in the axial and radial direction. The maximum stress on the shafting is about 73 MPa, the amplitude of the dynamic stress on the shafting is about 10 MPa, and the dominant frequency of the dynamic stress on the runner is 20 f n .
Overall, the analysis by numerical simulation in this paper enhances the studies of the hydraulic thrust on the runner, and will improve the design of the unit, such as the design of thrust bearing and guide bearing, hence the safety and stability of the unit can be more guaranteed. In addition, the numerical simulation helps decrease the research and development cost, and the numerical method could also guide the operation of the unit by helping to define the operation region.

Author Contributions

Data curation, L.K.; investigation, J.C.; formal analysis, X.L.; methodology, X.Z.; project administration, H.H.; software, T.W.; validation, S.G., W.L. and Z.Z.; funding acquisition, Z.W.; writing—review and editing, Y.L. All authors have read and agreed to the published version of the manuscript.

Funding

This research was funded by Science and Technology Project of State Grid Corporation of China.

Institutional Review Board statement

Not applicable.

Informed Consent Statement

Not applicable.

Data Availability Statement

Not applicable.

Conflicts of Interest

The authors declare no conflict of interest.

References

  1. National Energy Administration. Medium and Long Term Development Planning of Pumped Storage (2021–2035); National Energy Administration: Beijing, China, 2021.
  2. Li, D.; Wang, H.; Qin, Y.; Han, L.; Wei, X.; Qin, D. Entropy production analysis of hysteresis characteristic of a pump-turbine model. Energy Convers. Manag. 2017, 149, 175–191. [Google Scholar] [CrossRef]
  3. Moazeni, F.; Khazaei, J. Optimal energy management of water-energy networks via optimal placement of pumps-as-turbines and demand response through water storage tanks. Appl. Energy 2021, 283, 116335. [Google Scholar] [CrossRef]
  4. Sambito, M.; Piazza, S.; Freni, G. Stochastic Approach for Optimal Positioning of Pumps As Turbines (PATs). Sustainability 2021, 13, 12318. [Google Scholar] [CrossRef]
  5. Zhai, L.; Luo, Y.; Wang, Z.; Liu, X.; Xiao, Y. A review on the large tilting pad thrust bearings in the hydropower units. Renew. Sustain. Energy Rev. 2017, 69, 1182–1198. [Google Scholar] [CrossRef]
  6. Ji, X.-Y.; Li, X.-B.; Su, W.-T.; Lai, X.; Zhao, T.-X. On the hydraulic axial thrust of Francis hydro-turbine. J. Mech. Sci. Technol. 2016, 30, 2029–2035. [Google Scholar] [CrossRef]
  7. Kazakov, Y.A.; Pelinskii, A.A. Experimental investigation of the axial force in a submersible, electric well pump. Chem Petrol Eng. 1970, 6, 262–263. [Google Scholar] [CrossRef]
  8. Xia, L.; Cheng, Y.; Yang, Z.; You, J.; Yang, J.; Qian, Z. Evolutions of Pressure Fluctuations and Runner Loads during Runaway Processes of a Pump-Turbine. J. Fluids Eng. 2017, 139, 091101. [Google Scholar] [CrossRef]
  9. Liu, D.; You, G.; Wang, F.; Zhang, J. Calculation and analysis of axial thrust acting on turning wheel of flow-mixing reversible hydraulic turbines. J. Hohai Univ. (Nat. Sci.) 2004, 5, 557–561. [Google Scholar]
  10. Mao, Z.; Tao, R.; Chen, F.; Bi, H.; Cao, J.; Luo, Y.; Fan, H.; Wang, Z. Investigation of the Starting-Up Axial Hydraulic Force and Structure Characteristics of Pump Turbine in Pump Mode. J. Mar. Sci. Eng. 2021, 9, 158. [Google Scholar] [CrossRef]
  11. Mao, X.L.; Lu, J.H.; Yang, J.G.; Wei, D.; Li, T.; Zhang, N. Analysis of Inter-blade Vortex and Runner Blades Force of Pump Turbine during Load Rejection Period. IOP Conf. Ser. Earth Environ. Sci. 2021, 701, 012033. [Google Scholar] [CrossRef]
  12. Fu, X.; Li, D.; Wang, H.; Zhang, G.; Li, Z.; Wei, X. Numerical Simulation of the Transient Flow in a Pump-Turbine during the Load Rejection Process with Special Emphasis on the Cavitation Effect. J. Fluids Eng. 2020, 142, 1–12. [Google Scholar] [CrossRef]
  13. Luo, Y.; Wang, Z.; Liu, X.; Xiao, Y.; Chen, C.; Wang, H.; Yan, J. Numerical prediction of pressure pulsation for a low head bidirectional tidal bulb turbine. Energy 2015, 89, 730–738. [Google Scholar] [CrossRef]
  14. Liu, S.; Li, S.; Wu, Y. Pressure Fluctuation Prediction of a Model Kaplan Turbine by Unsteady Turbulent Flow Simulation. J. Fluids Eng. 2009, 131, 101102. [Google Scholar] [CrossRef]
  15. Wang, Z.; Zhou, L. Simulations and Measurements of Pressure Oscillations Caused by Vortex Ropes. J. Fluids Eng. 2006, 128, 649–655. [Google Scholar] [CrossRef]
  16. Ahn, S.-H.; Zhou, X.; He, L.; Luo, Y.; Wang, Z. Numerical estimation of prototype hydraulic efficiency in a low head power station based on gross head conditions. Renew. Energy 2020, 153, 175–181. [Google Scholar] [CrossRef]
  17. Ahn, S.-H.; Xiao, Y.; Wang, Z.; Zhou, X.; Luo, Y. Numerical prediction on the effect of free surface vortex on intake flow characteristics for tidal power station. Renew. Energy 2017, 101, 617–628. [Google Scholar] [CrossRef]
  18. Hanjalic, K.; Launder, B.E. A Reynolds stress model of turbulence and its application to thin shear flows. J. Fluid Mech. 1972, 52, 609–638. [Google Scholar] [CrossRef]
  19. Wilcox, D.C. Formulation of the k-w Turbulence Model Revisited. AIAA J. 2008, 46, 2823–2838. [Google Scholar] [CrossRef] [Green Version]
  20. Zhao, X.; Xiao, Y.; Wang, Z.; Luo, Y.; Cao, L. Unsteady Flow and Pressure Pulsation Characteristics Analysis of Rotating Stall in Centrifugal Pumps under Off-Design Conditions. J. Fluids Eng. 2018, 140, 021105. [Google Scholar] [CrossRef] [Green Version]
  21. Zhou, L.; Wang, Z.; Xiao, R.; Luo, Y. Analysis of dynamic stresses in Kaplan turbine blades. Eng. Comput. 2007, 24, 753–762. [Google Scholar] [CrossRef]
  22. Dompierre, F.; Sabourin, M. Determination of turbine runner dynamic behaviour under operating condition by a two-way staggered fluid-structureinteraction method. IOP Conf. Ser. Earth Environ. Sci. 2010, 12, 012085. [Google Scholar] [CrossRef]
  23. Pei, J.; Yuan, S.; Yuan, J. Dynamic stress analysis of sewage centrifugal pump impeller based on two-way coupling method. Chin. J. Mech. Eng. 2014, 27, 369–375. [Google Scholar] [CrossRef]
  24. Luo, Y.; Wang, Z.; Zhou, L.; Peng, G.; Sun, G. Computation of Static and Dynamic Stresses of a Bulb Tubular Turbine. In Proceedings of the 2008 ASME Fluids Engineering Conference, Jacksonville, FL, USA, 10–14 August 2008. [Google Scholar]
  25. Trivedi, C.; Cervantes, M.J. Fluid-structure interactions in Francis turbines: A perspective review. Renew. Sustain. Energy Rev. 2017, 68, 87–101. [Google Scholar] [CrossRef]
  26. Terentiev, L. The Turbulence Closure Model Based on Linear Anisotropy Invariant. Doctoral Thesis, Friedrich-Alexander University, Erlangen-Nuremberg, Germany, 2006. [Google Scholar]
  27. Huang, B.; Zhao, B.; Wang, L.; Wang, P.; Zhao, H.; Guo, P.; Yang, S.; Wu, D. The effects of heave motion on the performance of a floating counter-rotating type tidal turbine under wave-current interaction. Energy Convers. Manag. 2022, 252, 115093. [Google Scholar] [CrossRef]
  28. Zhou, D.; Sun, X. Influences of Geometrical Parameters of Upstream Deflector on Performance of a H-Type Vertical Axis Marine Current Turbine. Energies 2021, 14, 4087. [Google Scholar] [CrossRef]
  29. Menter, F.; Rumsey, C. Assessment of two-equation turbulence models for transonic flows. In Proceedings of the Fluid Dynamics Conference, Colorado Springs, CO, USA, 20–23 June 1994. [Google Scholar]
  30. ANSYS. ANSYS® Academic Research Mechanical; Version 18.1; Help System, Mechanical APDL Documentation; ANSYS, Inc.: Canonsburg, PA, USA, 2017. [Google Scholar]
  31. Bathe, K.-J. Finite Element Procedures; Prentice Hall: Hoboken, NJ, USA; Pearson Education, Inc.: London, UK, 2016. [Google Scholar]
Figure 1. Turbine pump CFD domain and mesh.
Energies 15 01580 g001
Figure 2. Monitoring points in the flow passage.
Energies 15 01580 g002aEnergies 15 01580 g002b
Figure 3. FEM model of the turbine pump shafting.
Energies 15 01580 g003
Figure 4. Flowchart of numerical simulation.
Energies 15 01580 g004
Figure 5. Pressure distribution on the runner surface.
Energies 15 01580 g005
Figure 6. Pressure distribution on the runner surface in one rotational period.
Energies 15 01580 g006aEnergies 15 01580 g006b
Figure 7. Streamline in the flow passage.
Energies 15 01580 g007
Figure 8. Pressure pulsations in the flow passage.
Energies 15 01580 g008aEnergies 15 01580 g008b
Figure 9. Relative pressure fluctuation amplitude.
Energies 15 01580 g009
Figure 10. Frequency spectra of the pressure pulsation.
Energies 15 01580 g010
Figure 11. Time history and frequency spectra of the axial thrust.
Energies 15 01580 g011
Figure 12. Time history and frequency spectra of the radial thrust.
Energies 15 01580 g012
Figure 13. Radial and axial displacement on the shafting.
Energies 15 01580 g013
Figure 14. The von Mises stress on the shaft.
Energies 15 01580 g014
Figure 15. The von Mises stress at the monitoring points.
Energies 15 01580 g015aEnergies 15 01580 g015b
Figure 16. Frequency spectra of the dynamic stresses.
Energies 15 01580 g016
Table 1. Mesh element number and type.
ComponentElement TypeElement Number
Spiral casingHexahedral72,588
Stay vanesHexahedral579,660
Guide vanesHexahedral434,160
RunnerHybrid2,086,433
Crown gap and band gapHexahedral753,330
Pressure balance pipeHexahedral295,652
Draft tubeHybrid1,162,188
Total-5,384,011
Table 2. Comparison of the simulation results and the designed parameters.
ItemHead (m)Discharge (m3/s)Power (MW)
Simulation429.6078.27297.80
Designed Parameter430.0079.16306.10
Error (%)−0.09%−1.12%−2.71%
Publisher’s Note: MDPI stays neutral with regard to jurisdictional claims in published maps and institutional affiliations.

