Article

Geological and Engineering Integrated Shale Gas Sweet Spots Evaluation Based on Fuzzy Comprehensive Evaluation Method: A Case Study of Z Shale Gas Field HB Block

1
School of Earth and Space Sciences, Peking University, Beijing 100871, China
2
PetroChina Research Institute of Petroleum Exploration and Development, Beijing 100083, China
3
China National Shale Gas Research and Development (Experiment) Center, Langfang 065007, China
*
Author to whom correspondence should be addressed.
Energies 2022, 15(2), 602; https://doi.org/10.3390/en15020602
Submission received: 2 December 2021 / Revised: 10 January 2022 / Accepted: 13 January 2022 / Published: 14 January 2022

Abstract

:
As an emerging unconventional energy resource, shale gas has great resource potential and developmental prospects. The effective evaluation of geological sweet spots (GSS), engineering sweet spots (ESS) and comprehensive sweet spots (CSS) is one of the main factors for a high-yield scale and economic production of shale gas. Sweet spot evaluation involves a comprehensive analysis based on multiple parameters. Conventional evaluation methods consider relatively simple or single factors. Although the main influencing factors are understood, the influence of different factors is as of yet unknown, and a comprehensive consideration may strongly affect the evaluation results. In this paper, the fuzzy mathematics method is introduced for shale gas sweet spot evaluation. With the help of fuzzy mathematics tools, such as membership function, the objective of comprehensive sweet spots evaluation based on multiple parameters is realized. Additionally, the reliability of the evaluation of sweet spots is improved. Firstly, previous research results are used for reference, and the evaluation factor system of geological and engineering sweet spots of shale gas is systematically analyzed and established. Then, the basic principle of the fuzzy comprehensive evaluation method is briefly introduced, and a geological engineering integrated shale gas sweet spots evaluation method, based on the fuzzy comprehensive evaluation method, is designed and implemented. Finally, the data from HB blocks in the Z shale gas field in China are adopted. According to the evaluation results, the modified method is tested. The results show that the method proposed in this paper can synthesize a number of evaluation indices, quickly and effectively evaluate the GSS, ESS and CSS in the target area, and the results have high rationality and accuracy, which can effectively assist in well-pattern deployment and fracture design.

1. Introduction

As an unconventional oil and gas resource, shale gas is one of the most important pillars for China and the world in terms of increasing energy reserves and production and to optimize resource structures in future [1,2,3,4]. The sweet spot is a relatively high-yield layer and area in a shale gas reservoir, which at least has the characteristics of high-quality source rock, good reservoir physical properties, high oil-bearing property, strong transformation potential and a large resource scale. Sweet spots can be divided into GSS, ESS, the economic sweet spot and CSS. In order to develop shale gas resources with high efficiency, rationality and scale benefit, the geological engineering integration method must be adopted. Through an evaluation and analysis, sweet spots can be correctly identified. Shale gas development needs horizontal wells and large-scale hydraulic fracturing. One of the main goals of shale gas production is to select optimal areas and distinguish the sweet spot from this area. At present, according to the research objective, the research on sweet spots evaluation methods can be divided into two categories, one is the research on sweet spots feature recognition technology; the other is the research on multi parameter comprehensive evaluation method.
The research of sweet-spot feature recognition technology mainly studies the acquisition of key parameters for sweet spots evaluation, which can provide more, and better quality, parameter support for sweet spots evaluation, or directly extract the sweet spots of logging or seismic response evaluation, which can provide a more simple and effective method for sweet spots evaluation. The composition of shale reservoirs is normally obtained by X-ray diffraction (XRD) and X-ray Fluorescence (XRF) logging technology to analyze mineral composition and rock brittleness [5,6]. For organic matter, some analyses have been conducted using Rock Evaluation, Pyrolysis, AFM-IR, Raman spectrography and so on. Array acoustic logging, nuclear magnetic resonance logging, electrical imaging logging and element capture energy spectrum logging are used to obtain rock mechanics parameters, reservoir physical properties, oil-bearing properties, in situ stress anisotropy, mineral composition and lithology identification [7,8,9]. Pre-stack seismic inversion, high-resolution seismic exploration, Vertical Seismic Profile (VSP) logging is used to obtain rock physical parameters, seismic geomorphology and natural fractures for thin layer identification and oil and gas contents analysis [10,11,12,13]. Combining core analysis, well logging and seismic data is an important method by which to obtain reservoir evaluation parameters. Principal component analysis, factor analysis, regression analysis, artificial neural network and deep learning have become widely used data-processing methods [14,15,16,17]. In addition, this kind of research generally focuses on the relationship between certain attributes or parameters of the sweet spots, and focuses on the acquisition process of these attributes or parameters. Meanwhile, these studies also focus on sweet spots identification and single factor evaluation, rather than the comprehensive evaluation method of integrating multiple factors. Although some advanced observational technologies, such as borehole imaging logging, acoustic array logging and micro-CT tomography, have good observations on shale reservoirs, however the cost of these analysis is always high. The research on conventional logging and seismic parameters still has strong practical value [18].
The multi-parameter comprehensive evaluation method for sweet spots identification mainly studies the use of a variety of evaluation index parameters to achieve qualitative or quantitative evaluation of sweet spots. It pays attention to the comprehensive utilization of the parameters in the evaluation index system of sweet spots, and also comprehensively utilizes’ the parameters obtained from the research of the sweet spots feature recognition technology. It includes four main categories: (1) The comprehensive evaluation method based on the superposition of favorable conditions. Through comprehensive study of geological, geochemical and geophysical data, combined with petroleum geology theories, experts qualitatively evaluate the distribution range and quality of sweet spots according to experience or statistical standards, and point out the pre-development scenic sweet spots, such as attribute distribution map superposition, polyphase zone matching analysis, etc., [19,20]. (2) Evaluation method based on resource evaluation, which regards the area with large amount of resources as favorable exploration area or sweet spot area as the focus of next exploration or development [21,22,23]. (3) Multi parameter fusion evaluation method based on experience, which integrates mathematical method with artificial experience, uses computer to carry out qualitative and quantitative evaluation, such as analytic hierarchy process and grey correlation analysis [24,25,26,27]. (4) The multi parameter fusion evaluation method based on machine learning. The correlation between evaluation index and sweet spots is established through the machine learning method, and sweet spots are evaluated. Generally, productivity is regarded as the evaluation target, and the high-yield reservoir location are regarded as sweet spots. Many machine learning methods such as traditional neural networks, and deep learning networks are gradually explored and applied [28,29,30].
The research on sweet spots evaluation methods is mainly focused on the recognition of sweet spot characteristics, such as porosity, permeability, flow zone index, brittleness index and so on. In practice, it also emphasizes the use of geophysical means to identify the characteristics of sweet spots. This kind of research is more direct in the use of the evaluation index parameters of sweet spots. However, when using the research results of sweet spots evaluation index system, the indices are considered relatively singular. Although the main influencing factors, such as porosity, gas content and TOC (Total organic carbon), the influence of different factors are grasped, salient factors such as matrix permeability, horizontal pressure difference and so on, cannot be neglected [31,32,33]. Thus, the evaluation results lack comprehensive consideration. For example, horizontal pressure difference, Young modulus, Poisson ration and other factors are not considered in the sweet spot evaluation. The multi parameter comprehensive evaluation is based on obtaining the attribute parameters of the target reservoir. It gives higher weight to the main controlling factors and lower weight to other influencing factors, and comprehensively considers the geological, engineering, economic as well as other factors. However, this evaluation needs more attribute parameters of reservoir, and the acquisition of the aforementioned factors may face some difficulties in equipment and cost. At the same time, the weights of different parameters are often subjective.
The analytic hierarchy process (AHP) is a common multi parameter evaluation method in sweet spot evaluation [34,35]. In the analytic hierarchy process, according to the actual conditions of the study area, the degree of various attributes contribution to the sweet spots is judged. However, it is difficult to accurately classify the attribute values near the boundary of each good and bad grade division interval. There is a certain uncertainty, which easily leads to two close attribute values being classified into two completely different evaluation intervals; this phenomenon is also called ‘fuzziness’ in mathematics.
The fuzzy phenomenon is an objective existence, which describes the phenomenon with clear connotation and unclear extension. For example, the concepts of ‘very good’, ‘good’, ‘general’ and ‘poor’ in the evaluation of attributes are all fuzzy concepts. Fuzzy mathematics is a mathematical subject that accurately describes fuzzy phenomena. Fuzzy mathematics method is an effective method to deal with fuzzy phenomena. It mainly studies the uncertainty in the division of things. Both the fuzzy cluster analysis theory and fuzzy comprehensive evaluation principle are widely used in engineering quality analysis, resource comprehensive evaluation, feasibility study, disaster prediction and forecast [34,35]. In this paper, the fuzzy mathematics method is introduced into the evaluation of sweet spots. With the help of fuzzy mathematics tools such as fuzzy set and membership function, the objective evaluation of each attribute value is realized, and the reliability of sweet spots evaluation is improved.
Firstly, this paper systematically analyzes previous and current studies, and establishes an evaluation index system for shale gas geological sweet spots (GSS), engineering sweet spots (ESS) and comprehensive sweet spots (CSS), which is suitable for multiple parameter comprehensive evaluation. Then, the basic mathematical background of fuzzy comprehensive evaluation method is briefly introduced, and a prediction method of shale gas sweet spots based on fuzzy comprehensive evaluation method is designed. Finally, the method proposed in this paper is tested by using the actual data of a shale gas field, the test results are analyzed systematically, and the relevant conclusions are put forward.

2. Evaluation System for Geological and Engineering Sweet Spots

The establishment of a reasonable evaluation system for sweet spots is the basis of sweet spots evaluation. According to the different evaluation objectives of GSS, ESS and CSS, the evaluation system should include different evaluation indexes.
A series of studies have systematically analyzed the sweet spot evaluation factors of unconventional oil and gas resources such as tight oil, shale oil and shale gas. Ten key indexes, such as reservoir thickness and matrix permeability, reservoir porosity, organic matter content, reservoir fluid maturity, etc., are put forward by Jia [36]. Zhao proposed 11 parameters in three aspects, five for source rock (organic carbon content, hydrocarbon generation potential, vitrinite reflectance, thickness and distribution area), four for reservoir (area, thickness, physical property and brittleness) and two for economy (burial depth and resource scale) for sweet spots [18]. Zou et al. considered that unconventional oil and gas sweet spots should be comprehensively evaluated through the ‘six properties’. The six properties include reservoir lithology and physical property, brittleness, oil bearing property, source rock property and stress anisotropy, and the dissolution facies or fracture zone in the reservoir [37]. This study also pointed out that sweet spots are composed of hydrocarbon generation intensity, source reservoir contact area, reservoir physical property, reservoir thickness, fault zone and local structure, etc., [38]. In addition, it further summarizes unconventional oil and gas sweet spots, including geological sweet spots, engineering sweet spots and economic sweet spots [39]. Wang et al. took reservoir area, thickness and porosity, total organic carbon and organic matter maturity of source rocks, structural background, surface conditions, oil and gas display and burial depth as the optimization criteria of the sweet spots area [23]. Yang et al. summarized the characteristics of source rock organic matter maturity, reservoir lithology, physical properties, brittle mineral content, crude oil viscosity and natural fractures in the sweet spots development area, and took maturity as the primary factor controlling the distribution of sweet spots [40]. Guo et al. established an evaluation system with lithology, physical property, oil-bearing property, source rock condition, brittleness, in situ stress condition and economy as the main indicators [22]. Petroleum industry standard (SY/T 6943-2013) in China for tight oil geological evaluation approach proposed that sweet spots evaluation includes source rock evaluation (total organic carbon content, organic matter type, evolution and distribution, hydrocarbon generation rate, hydrocarbon generation intensity), resource potential evaluation (source reservoir relationship, determination of evaluation unit, hydrocarbon generation, migration and accumulation characteristics, occurrence mechanism, preservation conditions, etc.), reservoir evaluation (reservoir physical properties, pore structure, heterogeneity, thickness, etc.) and productivity prediction (analysis of crude oil properties, reservoir pressure, temperature, depth and oil saturation, movable fluid saturation, reservoir characteristics, production test, production performance of oil wells, etc.) [41]. The national standard of shale gas geological evaluation method of China (GB/T 31483-2015) and the national standard of tight oil geological evaluation method of China (GB/T 34906-2017) further put forward the classification index and evaluation weight of 20 parameters in lithology, physical property, oil bearing property, source rock characteristics, brittleness factor, in situ stress characteristics and economy [42,43]. This kind of research can be found in important literature reviews, monographs, industry standards or national standards. Many studies not only give considerations, but also put forward the reference range of relevant parameters for shale gas sweet spot evaluation [18,22,23,36,37,38,39,40,41,42,43,44].
Different studies have reached different conclusions on the evaluation indices of sweet spots in the aspects of consideration factors, selection parameters and specific division. However, the factors considered can be divided into the following three categories: geology, engineering and economy. Among them, geological and engineering factors are the main focus for petroleum geology and petroleum engineering. They are also the basics of geological and engineering integration. In terms of the geological aspects, it primarily considers the properties of source rock, reservoir physical properties, degree of reservoir fracture development, reservoir pressure, reservoir scale and other indicators. In the aspect of engineering, it mainly considers the reservoir fracturing, reservoir stress and other indicators. Geological and engineering factors mainly provide the objective judgment of whether there is gas and whether it is favorable for exploitation, while economic factors constitute the decision-making issues affecting exploitation. For shale gas, which is an important strategic resource, the economic factors are not only related to the development conditions and oil price changes, but also deeply affected by the national strategy, economic cycle and international situation. At present, the evaluation of economic sweet spots fluctuates greatly. Therefore, this paper does not integrate the economic sweet spots indices into the evaluation of comprehensive sweet spots. At the same time, in order to make the evaluation index system practical, we also need to make clear which parameters are expressed qualitatively or quantitatively, and consider how to obtain an adequate number of evaluation parameters accurately.
Considering the previous research results, aiming at the multiple parameter comprehensive evaluation of shale gas reservoir, an evaluation system has been established. In the evaluation system of GSS, the organic matter abundance, organic matter maturity, organic matter type, target layer thickness, high-quality reservoir thickness, formation depth, gas saturation, gas content, adsorbed gas content or free gas content, natural fracture index, porosity and permeability are considered. In the evaluation system of ESS, six main factors, including rock mechanics parameters, brittleness index, horizontal principal stress, vertical stress, formation dip angle and pressure coefficient, are considered. The two evaluation index systems listed above constitute the comprehensive evaluation index system of shale gas sweet spots, as shown in Figure 1.

3. Mathematical Background of Fuzzy Comprehensive Evaluation Method

According to the number of levels in the model, the fuzzy comprehensive evaluation method can be divided into one-stage fuzzy comprehensive evaluation and multi-stage fuzzy comprehensive evaluation [34,35,45]. In the study of sweet spots evaluation, because there are many factors that need to be considered and because each factor has its own level of importance, it is necessary to evaluate GSS and ESS separately, and use this as a basis to evaluate comprehensive sweet spots, or to evaluate comprehensive sweet spots directly through the evaluation indexes of GSS and ESS. Therefore, multi-level fuzzy comprehensive evaluation is proposed to solve the problem of systematic evaluation.
Let a target to be evaluated and U = { u 1 , u 2 , , u n } be a set of influencing factors, which is composed of N factors. M different evaluation grades (or comments) composed the evaluation set V = { v 1 , v 2 , , v m } . In the multi-level fuzzy comprehensive evaluation, these factors will constitute an input of the upper level evaluation, which will be calculated upward in turn. The specific steps are as follows:
1.
Single factor evaluation
It is often difficult to determine the comprehensive evaluation result for a thing affected by many factors. However, in terms of single factor, it is relatively easy to do. In terms of factor u i , the evaluation result is written as Equation (1).
r i = { r i 1 , r i 2 , , r i m } 0 r i j 1 i = 1 , 2 , , n j = 1 , 2 , , m
In the Equation (1), r i is the evaluation result set of factor u i , r i j indicates the degree to which the factor u i has comment v j , that is, the degree to which the object u i to be evaluated belongs to the comments v j . Equation (1) is usually set according to the statistical distribution of reservoir attributes or expert opinions.
2.
Construction of comprehensive evaluation matrix
All single-factor evaluation results consist the fuzzy relationship matrix R from U to V, as shown in Equation (2), and R is called the comprehensive evaluation matrix.
R = [ r 1 r 2 r n ] = [ r 11 r 11 r 1 m r 21 r 22 r 2 m r n 1 r n 2 r n m ]
3.
Determine factor weight
For the factor set U = { u 1 , u 2 , , u n } , due to the different degree of effect of each factor on the evaluation object, we should try to give different weights, and set the weight set as A , as shown in Equation (3).
A = a 1 , a 2 , , a n
In the Equation (3), a i represents the weight of the i factor, i = 1 n a i = 1 . The relative weight calculation mainly includes expert estimation method, fuzzy inverse equation method, objective weighting method and subjective and objective weighting method.
4.
Fuzzy transformation
According to the selection of influencing factors in the influencing factors set, assume A U and R U × V . The membership degree of comprehensive evaluation result is obtained by fuzzy transformation, B = { b 1 , b 2 , , b m } B V .
B = A ° R = { a 1 , a 2 , , a n } ° [ r 11 r 11 r 1 m r 21 r 22 r 2 m r n 1 r n 2 r n m ] = { b 1 , b 2 , , b m }
In the Equation (4), ° represents the matrix operator, and the commonly used operators also include, such as M ( , ) ,   M ( , ) ,   M ( , ) ,   M ( + , ) . Among them, M ( , ) . is the traditional Zadeh operator, M ( + , ) is the weighted average model, can make full use of all information, use relatively ideal. The membership degree of comprehensive evaluation B = { b 1 , b 2 , , b m } is obtained by Equation (4), and the evaluation result is obtained by membership function, the fuzzy distribution method, maximum membership principle method and weighted average method.
Fuzzy distribution method as follows: if B does not meet the requirements of normalization, normalize B, as shown in Equations (5) and (6).
b k = b i / i = 1 m b i ( k m )
B = { b 1 , b 2 , , b m }
In the Equations (5) and (6), b k is the percentage of the evaluation object in the evaluation grade v k . This method contains a lot of information, so it is appropriate to use this method for the evaluation of information that should not be lost.
Maximum membership principle method as follows: the maximum membership principle is shown in Equation (7).
b i 0 = m a x { b i } , 1 i m
In the Equation (7), b i 0 is the comprehensive evaluation result as the i 0 grade, and the principle of maximum membership degree is simple and easy, but there is a lot of information lost, and when the membership degrees of more than two grades are the maximum, it is difficult to make an accurate evaluation.
Weighted average method: take the membership degree of the evaluation grade as the weight, and take each weighted average value as the evaluation result, as shown in Equation (8).
S = i = 1 m b i v i / i = 1 m b i
In the Equation (8), S is the evaluation grade of the evaluation index. If the elements in the evaluation concentration are not quantified, each number needs to be quantified when using the weighted average method. In order to get a comprehensive quantitative value of double sweet spots, different methods can be used to evaluate the results.

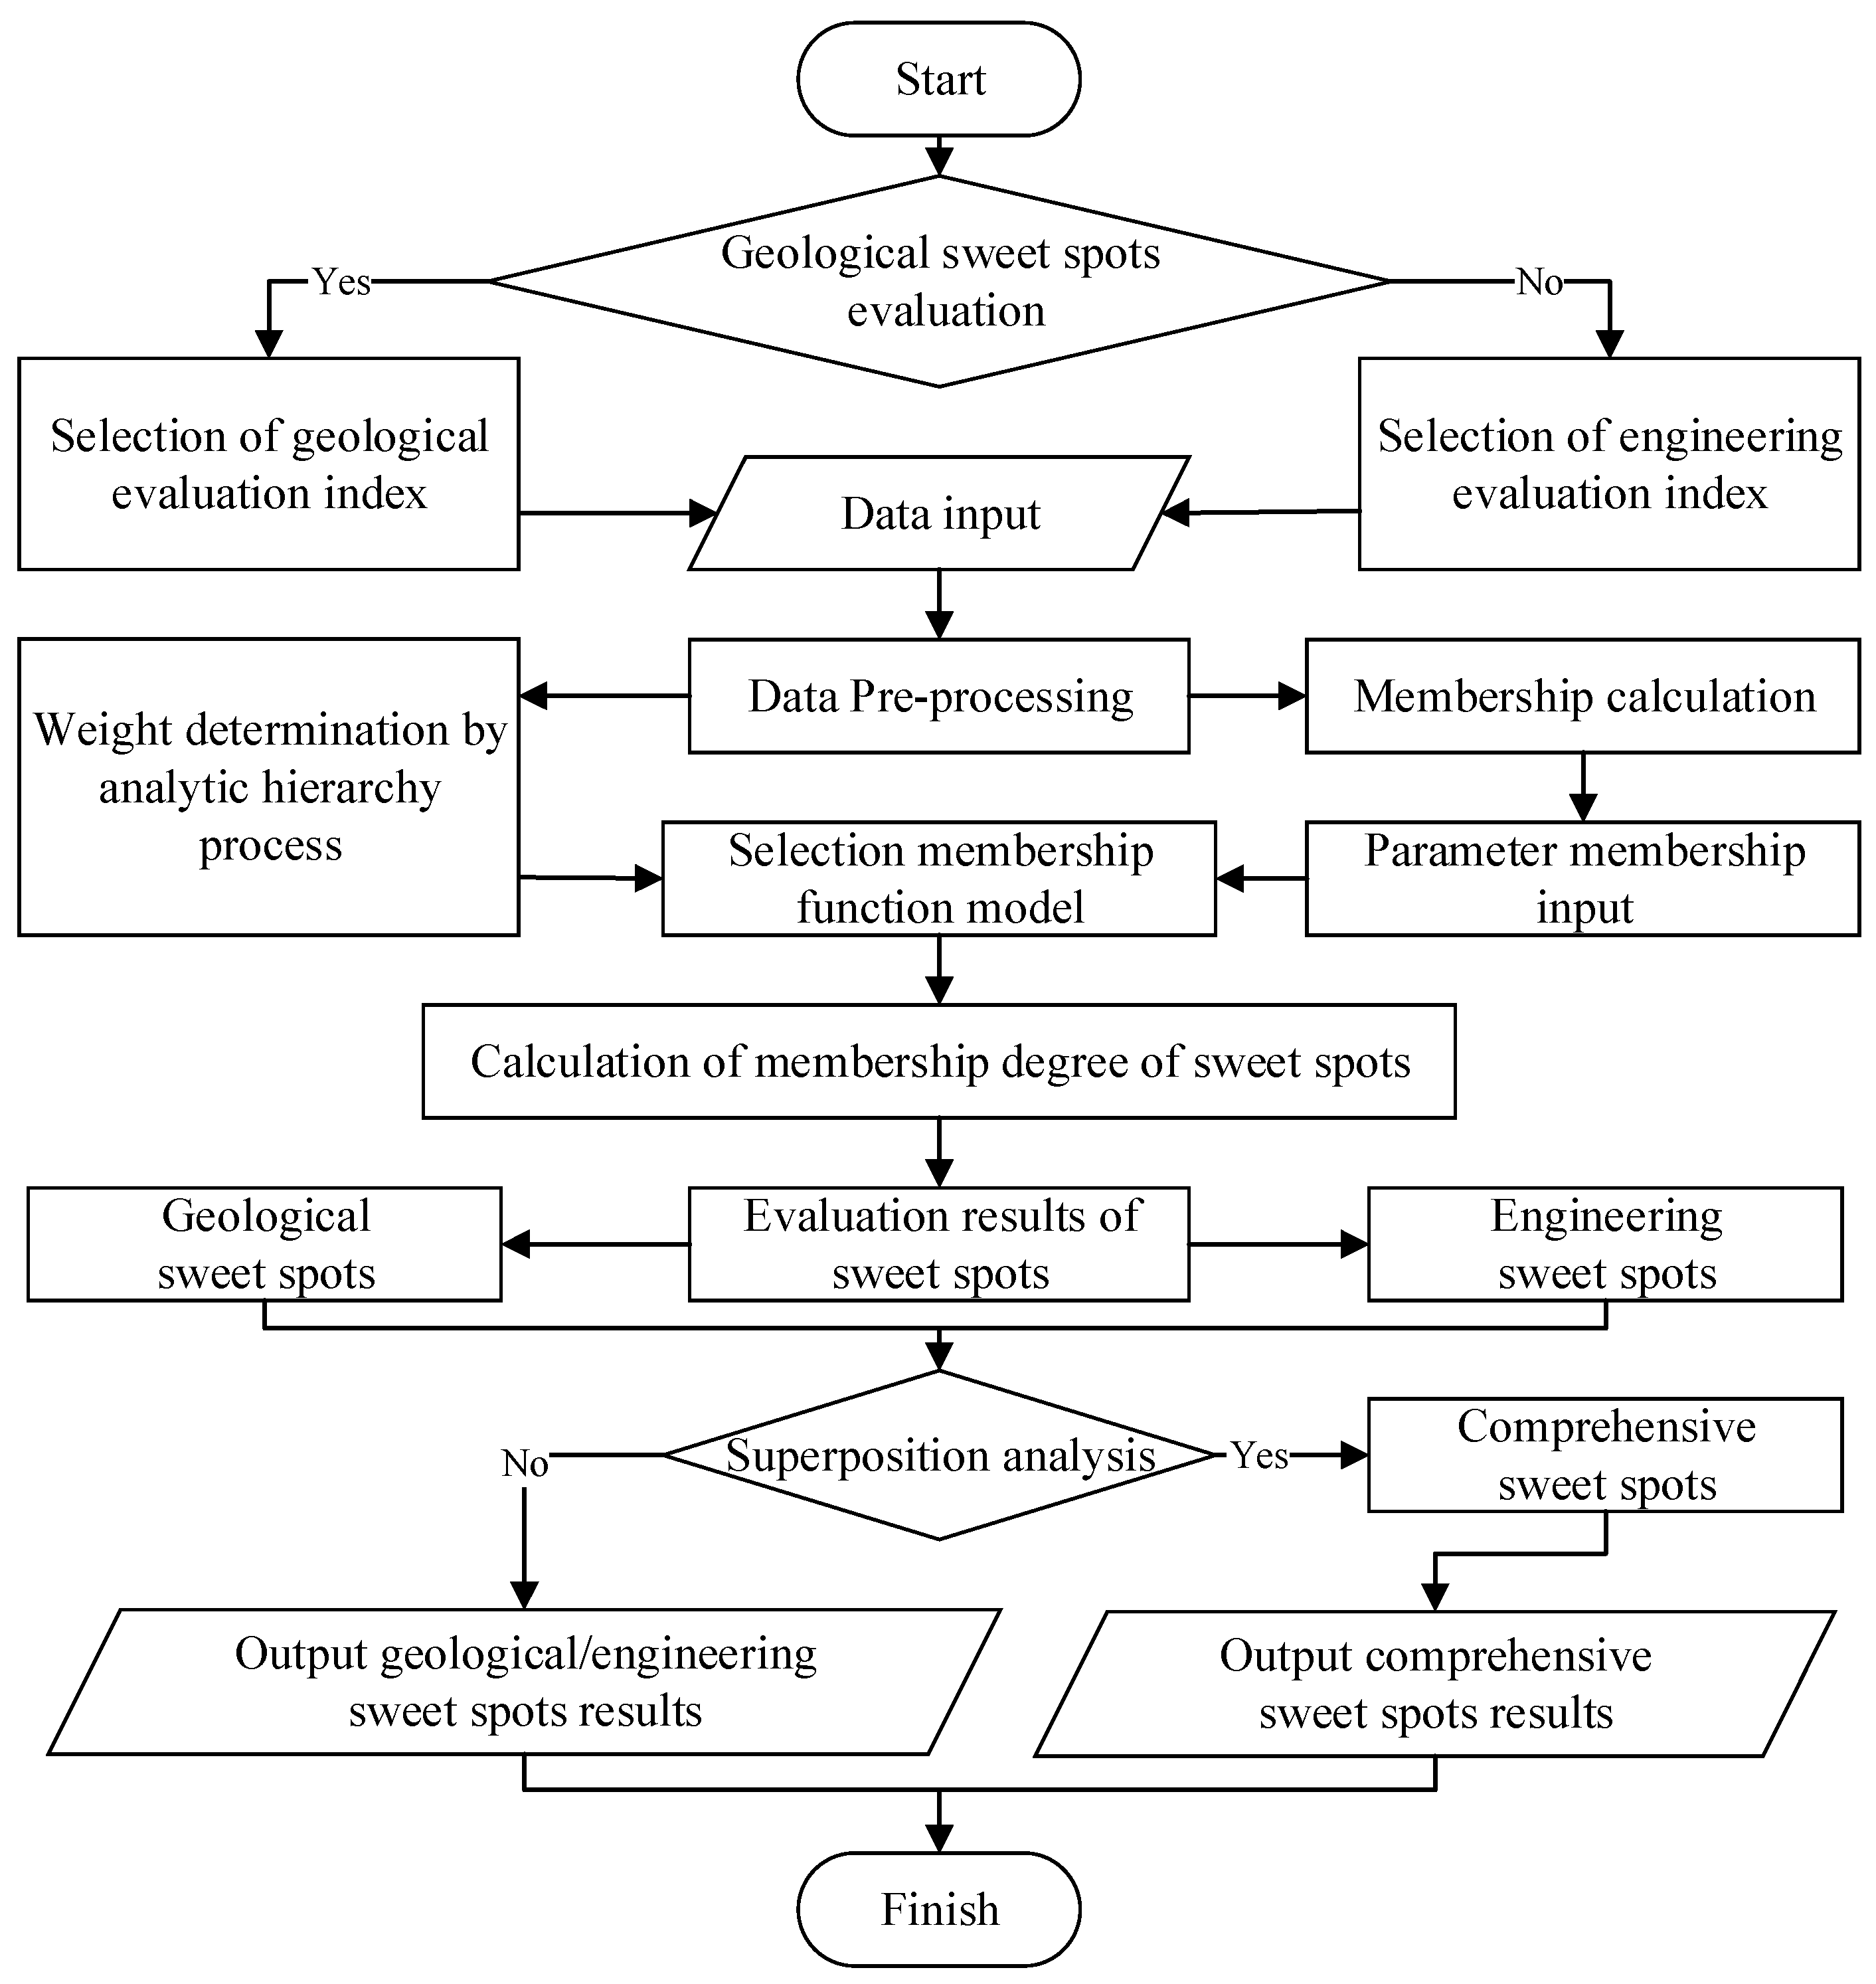
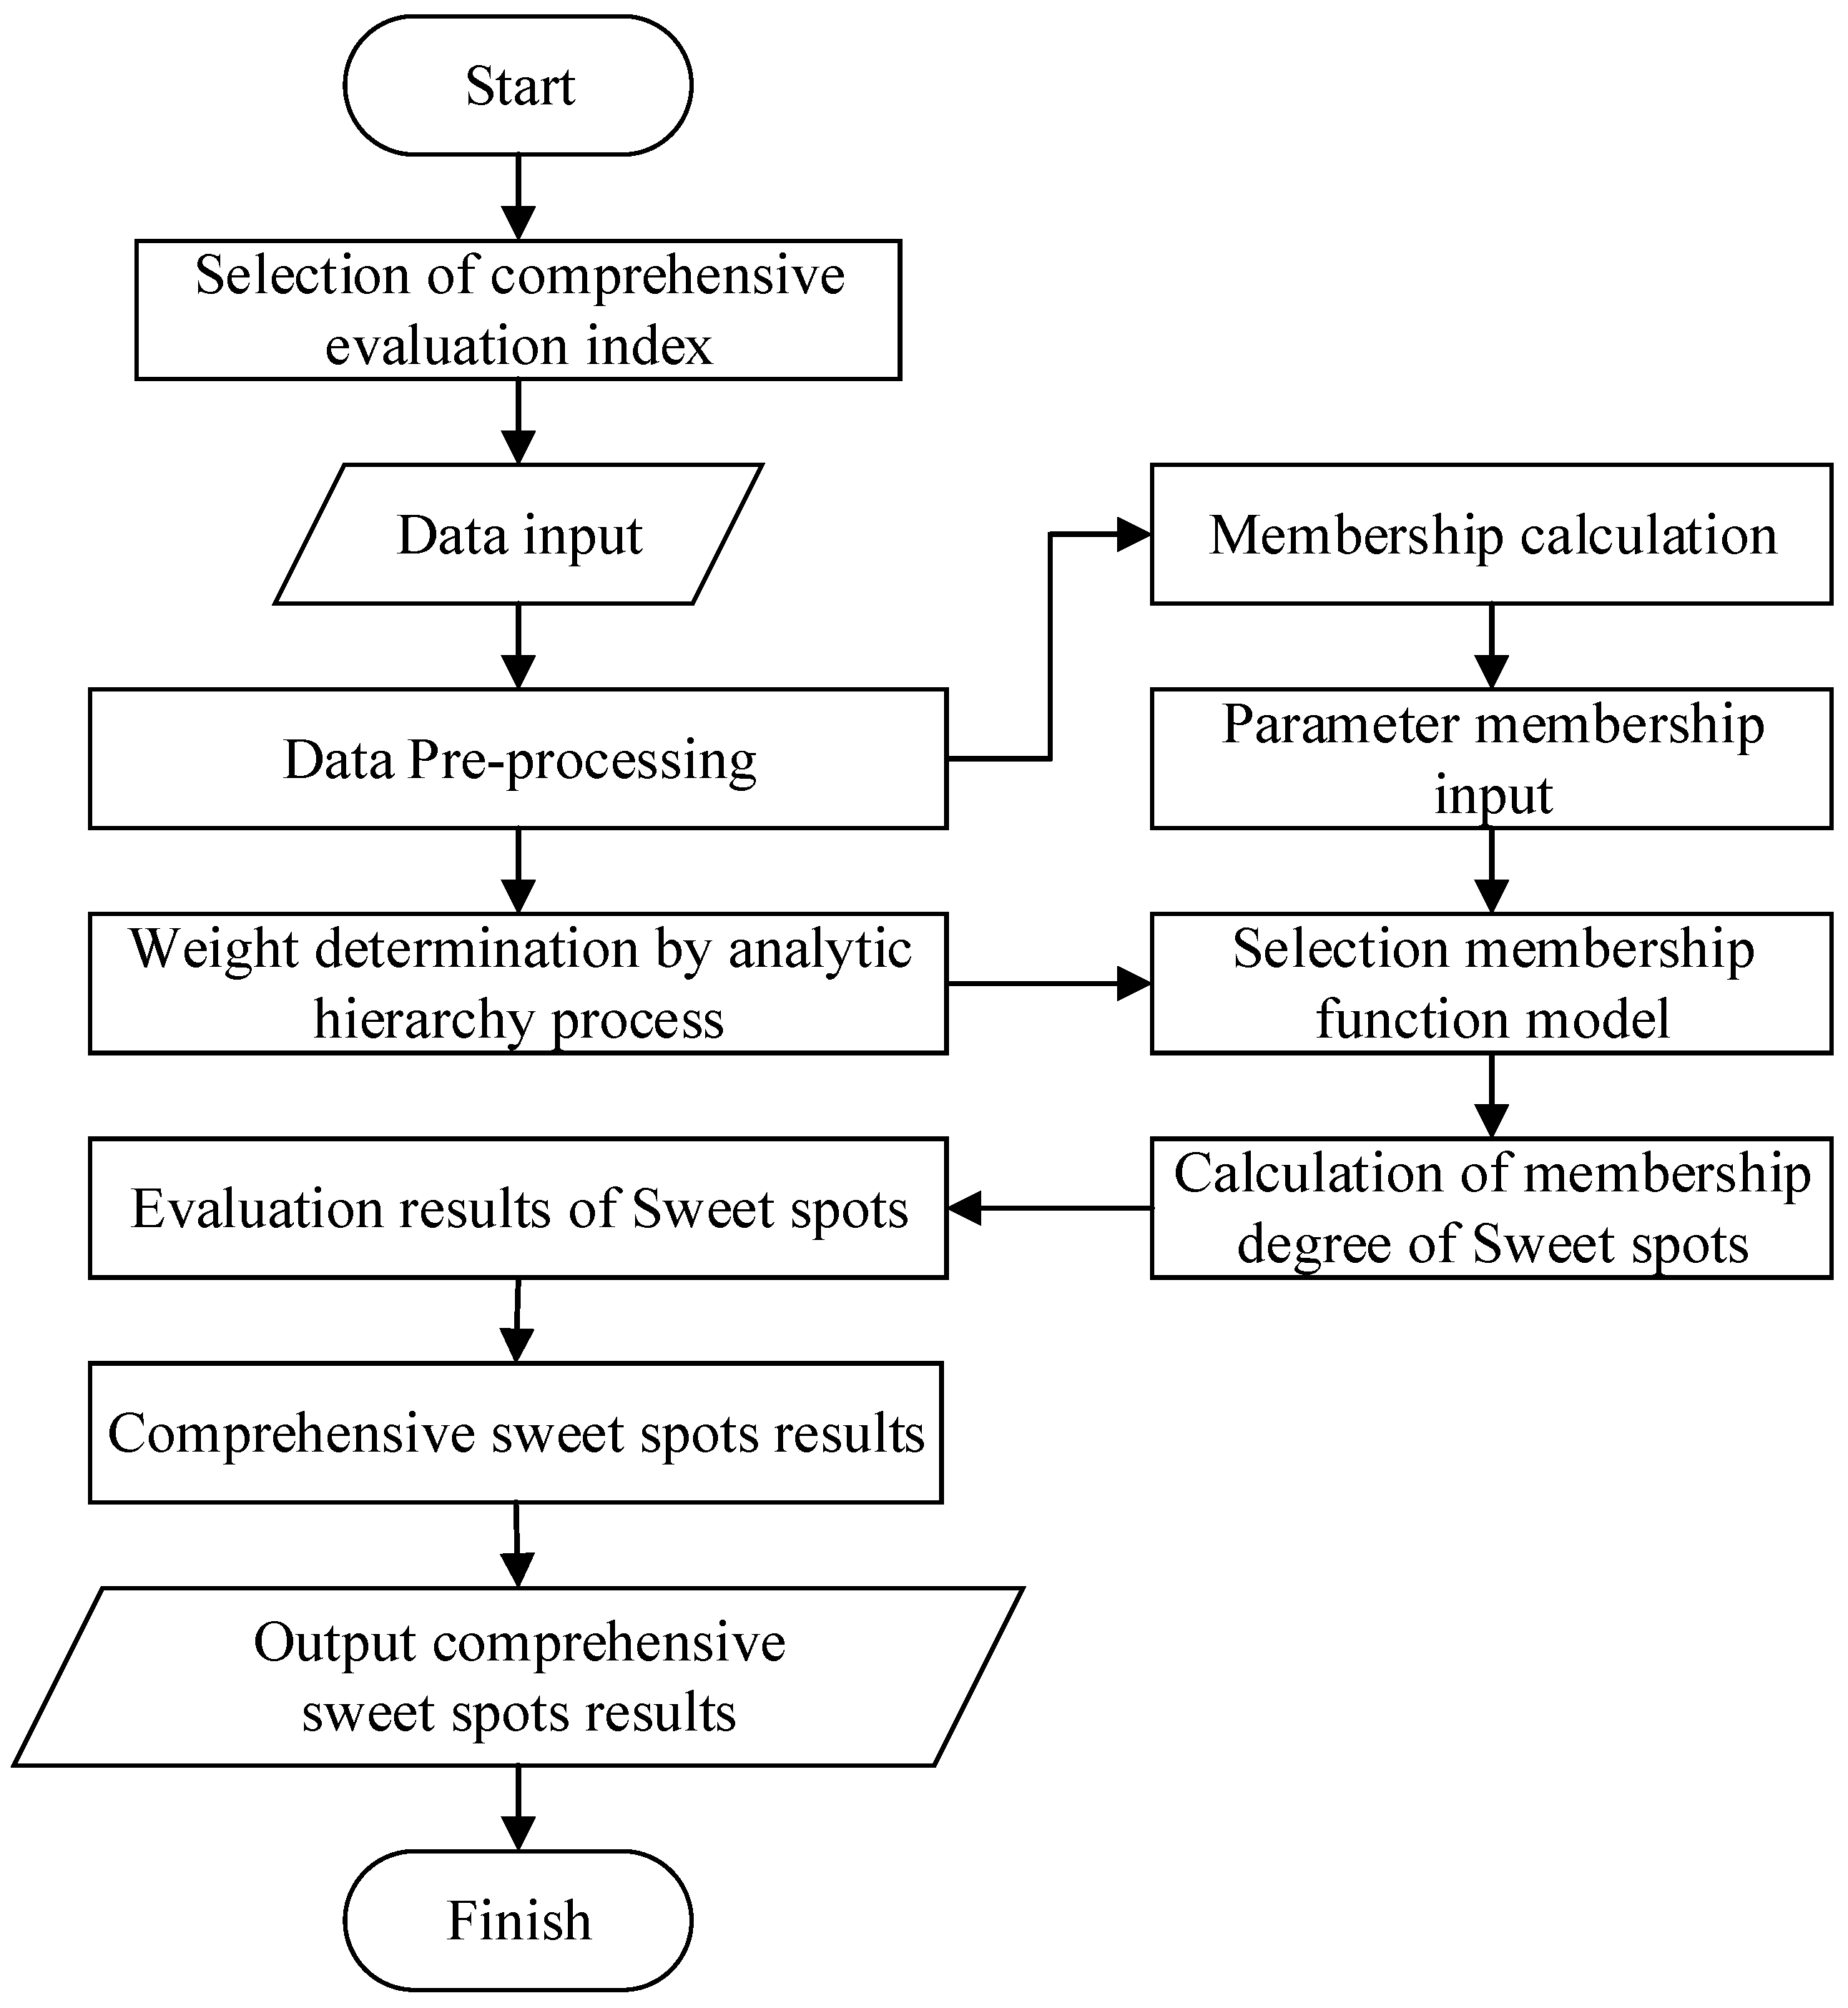
4. Technical Process of Shale Gas Sweet Spots Evaluation Based on Fuzzy Comprehensive Evaluation

A series of universal index standards are often formulated for sweet spots evaluation, but for some specific regions, there may be several parameters that are not under the conditions of the dominant sweet spots, but the high-yield oil and gas flow can still be obtained in the process of production practice. At the same time, AHP [34,35], as a common sweet spots evaluation method, through the judgment of the contribution degree of various attributes to the sweet spots, according to the actual situation of the study area. However, for the values near the classification boundary, it is difficult to accurately classify them into the same category and there is a level of uncertainty. As a result, it can easily lead to two close attribute values being divided into two completely different evaluation elements, which can affect the evaluation results. In view of the above problems, the fuzzy comprehensive evaluation method is introduced into the evaluation of shale gas sweet spots, and the reliability and accuracy of sweet spots evaluation are improved through fuzzy and comprehensive decision-making of multiple parameters.
Based on the evaluation system of GSS and ESS, combined with the fuzzy comprehensive evaluation method, the evaluation technology of shale gas sweet spots based on fuzzy comprehensive evaluation is established. First of all, using a geological survey, remote sensing, geochemistry, seismic, well logging, core analysis, well testing production and so on, all kinds of reservoir information can be obtained, which has a clear spatial location. Then, using the obtained reservoir information, according to the application stage and evaluation objectives, different methods such as spatial interpolation algorithm are used to establish the concept, planar or three-dimensional model of reservoir or source rock with different scales, and to obtain the basic data of comprehensive evaluation. Based on the regional distribution of attributes, the fuzzy evaluation index system was used to evaluate the regional distribution of sweet spots. Finally, according to the evaluation results of sweet spots, combined with the specific data distribution in the study area, the distribution and quality of sweet spots were obtained.
As an evaluation method, such as the fuzzy comprehensive evaluation method, can not only evaluate GSS and ESS, but also directly evaluate CSS based on evaluation indices. In addition, the regional distribution of GSS and ESS obtained by fuzzy comprehensive evaluation can also be obtained by simple superposition algorithm.
According to the fuzzy comprehensive evaluation of GSS and ESS, the corresponding technical process is designed, as shown in Figure 2. In this technical process, the CSS is obtained by the superposition algorithm.
Firstly, the sweet spots to be evaluated are determined, that is, the ESS or GSS are selected. According to the evaluation objectives and the actual data of the study area, the selection of evaluation parameters, the input of parameters and the preprocessing of input data are carried out. Based on the input evaluation parameters, the membership degree of the evaluation parameters is calculated to obtain the membership degree of the input parameters. Combined with the relative weight value of the parameters determined by the analytic hierarchy process and the membership function model, the membership degree of the sweet spots is calculated to obtain the evaluation results of the sweet spots. The sweet spots evaluation results obtained here are continuous values distributed from −1 to 3, which can be called the sweetness of sweet spots, which is used to characterize the relative advantages and disadvantages of this type of sweet spot. The regions with values less than 0 are generally non-sweet spots regions, and the regions with values greater than 0 are sweet spots regions. Different numerical values represent the relative merits of sweet spots regions. In general, the larger the value, the better sweet spots are. Combined with the actual situation of the region, sweet spots can be divided into several categories according to the demand, and the evaluation results of GSS and ESS can be directly output. The evaluation results of CSS can be obtained by simple superposition method using GSS and ESS, and the evaluation results can be output too.
The evaluation method of sweet spots, based on the fuzzy comprehensive evaluation method, proposed in this paper can also help to directly evaluate the CSS based on the evaluation index system using the combination indices of GSS and ESS, as shown in Figure 3. When this process is employed, the GSS and ESS cannot be output. Only the CSS can be evaluated and outputted.
In the first step, the indices used to evaluate GSS and ESS are selected as the parameters for comprehensive sweet spots evaluation, the indices are input, and the data preprocessed. In the second step, the membership of the selected indices is calculated using the membership model. In the third step, the relative weight of each index is determined by analytic hierarchy process, and the appropriate membership function model is selected. In the fourth step, the membership degree of each parameter and the relative weight of each parameter are jointly calculated to obtain the membership degree of the comprehensive sweet spots. Finally, different membership evaluation principles are selected to comprehensively evaluate the membership of CSS, and the evaluation results of CSS are obtained and outputted.
In the process of sweet spots evaluation, according to the data of different research areas, the evaluation index model or data contained in the evaluation index system may be incomplete. Currently, it is necessary to select the appropriate evaluation index.
In the evaluation index system of sweet spots, the selection of evaluation parameters should first grasp the main contradictions and consider the overall situation. Although different parameters have different contributions to the evaluation results of sweet spots, we focus on the main controlling index of sweet spots in the practice of sweet spots evaluation, because it is more difficult to obtain the parameters of unconventional reservoirs such as shale gas than conventional reservoirs.
Meanwhile, the value range of evaluation parameters is determined, and it is formulated accurately according to local conditions. The systematic studies and the learnings from other areas can provide a certain comparative reference for the early exploration. With the deep understanding of the petroleum geology in this area, the corresponding parameter ranges and different grades of sweet spots should be adjusted in time according to the systematic study and relevant standards.
At the same time, the relationship between geological evaluation indices and engineering evaluation indices should be coordinated and considered as a whole. Geological indices reflect geological conditions such as reservoir space, seepage condition and gas abundance, and are the basis of sweet spots productivity. The development of shale gas requires hydraulic fracturing, and the effect of fracturing has a significant impact on the actual production capacity. The engineering indices should also be fully considered. The coordination of GSS and ESS in space is an important condition for sweet spots, so as to achieve high-yield production. Therefore, when the available parameters are limited, the selection of sweet spots evaluations parameters should consider both geological and engineering aspects as much as possible.

5. A Case Study of Z Shale Gas Field HB Block

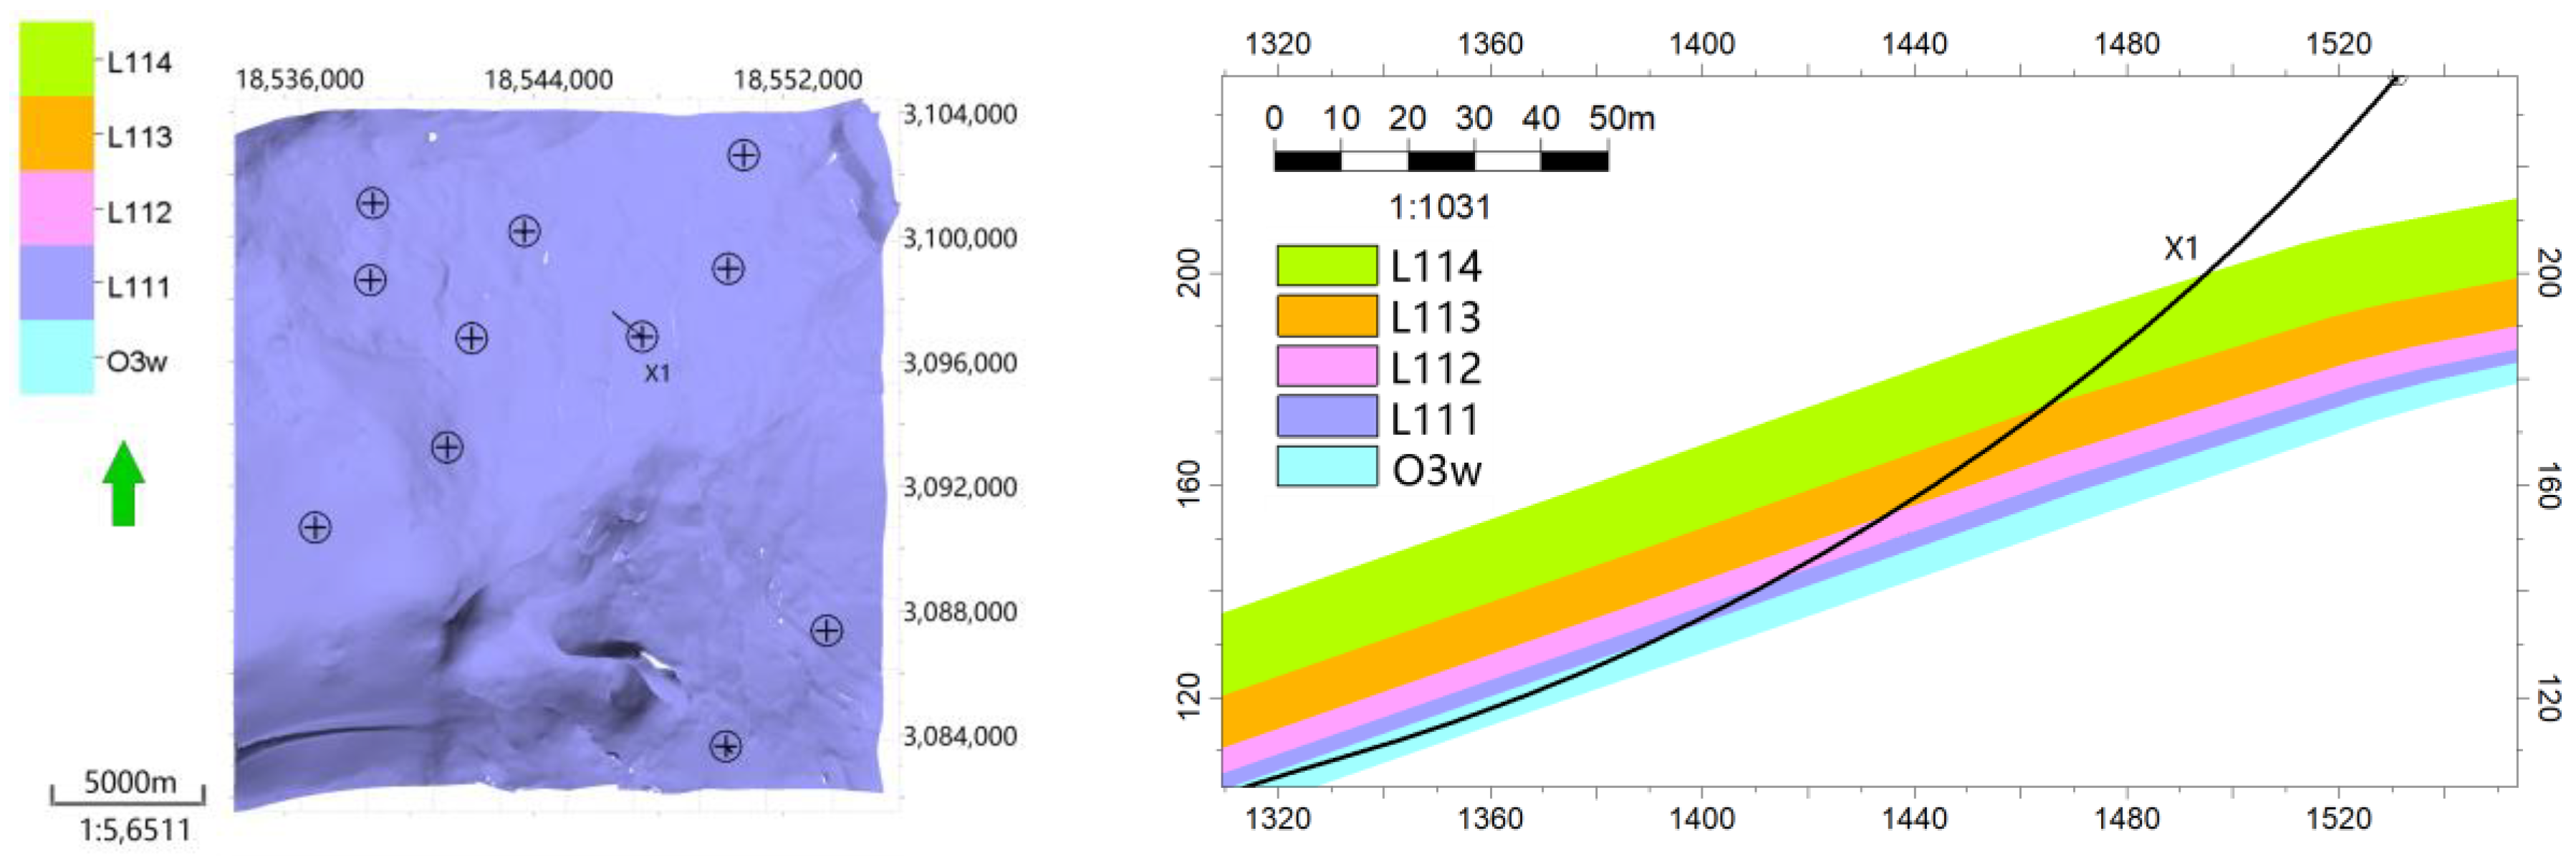
5.1. Geological Background

Taking HB block of Z shale gas field in China as an example, HB block is mainly located in Xuyong County, Luzhou City, Sichuan Province, China. It is a middle mountain and low mountain landform with a surface elevation of 570~1450 m. The annual average temperature is 17.9 °C, sunshine is 1170.3 h, rainfall is 1172.6 mm, and frost occurs for only 2.5 days. The area is rich in water resources, the main rivers are Lengshui River, Yongning River and so on.
Structurally, the study area is mainly located in the northwest of the connecting part between the South Sichuan low steep fold belt and the North Yunnan Guizhou depression. Folds and faults are developed, and the main structural form is nearly EW anticline. The northern and southern edges of the block are limited by Yunshanba syncline and Hualang syncline.
The main target formation in the study area are from the Ordovician Wufeng Formation to the Silurian Longmaxi formation. The sedimentary facies of the target formation are the deep-sea shelf and shallow-sea shelf. The main development formations are from the Wufeng Formation to the first sub-formation of the Longmaxi formation. The first sub-formation of the Longmaxi formation consists of four layers, namely, the first layer (Long111), the second layer (Long112), the third layer (Long113) and the fourth layer (Long114), as shown in Table 1. A three-dimensional geological model of the study area is shown in Figure 4, which mainly includes four layers in the first sub formation of the Silurian Longmaxi formation along with the Ordovician Wufeng Formation.

5.2. Reservoir Properties in the Study Area

Combining well logging data and remote sensing analysis, the overall buried depth of the study area is found to be less than 2000 m. The shallow area with less than 2000 m buried depth is 327.27 km2, accounting for 84.2%. In the shallow region, the area with 500–1500 m buried depth is 189.46 km2, accounting for 48.8%.a Furthermore, the ultra-shallow area with 250–500 m buried depth is 56.41 km2, accounting for 14.5% and 35.44 km2 area with less than 250 m buried depth, accounting for 9.1%. With an area of 61.62 km2, with a buried depth of more than 2000 m, there is only a small amount of distribution in the south of the block, accounting for 15.8%.
The thickness of main-development formation in the study area ranges from 35.8 to 50.1 m, with an average of 40.0 m based on well logging data. Among them, the thickness of Wufeng Formation ranges from 2.0 m to 9.7 m, the thickness of the first sub-formation of Longmaxi (L11) ranges from 28.5 m to 33.5 m, the thickness of L111 layer ranges from 1.25 m to 2.32 m, whereas the thickness of L112 layer ranges from 5.8 m to 10.9 m, the thickness of L113 layer ranges from 5.7 m to 14.8 m, and the thickness of L114 layer ranges from 10.17 m to 17.48 m.
According to the development of fractures, the fracture in L114 layer are mainly high resistive fractures, L113 layer are mainly stratabound fractures, L112 layer are mainly high resistive fractures, stratabound fractures and micro non-stratabound fractures are also developed, L111 layer are mainly drilling-induce tensile fractures, and there are many types of fractures in Wufeng Formation, such as high-resistive fractures and drilling-induced tensile fractures.
Reservoir properties in the study area are listed in Table 2. Considering the evaluation indices, based on the well logging and laboratory core analysis, the total organic carbon (TOC) content ranged from 0.85% to 6.06%, and the average TOC content was 3.3%. The TOC content of the first layer (L111) was the highest, and the horizontal distribution was stable. The TOC content of L111 was 5.1%, the L112 was 3.6%, the Wufeng formation was 3.3%, the L113 was 3.0%, and the L114 was 1.5%.
By using micro-telescope technology, the kerogen type is found to be mainly humic-sapropelic type (II1), with a small amount of humic-sapropelic type (II2) and sapropelic type (I). The thermal evolution degree of organic matter in HB block is high. The refractive index of vitrinite in Wufeng formation and the first sub-formation of Longmaxi ranges from 1.80% to 2.47%, with an average of 2.29%.
Gas saturation is acquired by the combination of laboratory core sample analysis and well logging. The distribution range of average gas saturation in the study area is 11.25–81.00%, and the average gas saturation is 60.00%. The vertical gas saturation from large to small is L111 (average content is 74%), L112 (average content is 67%), Wufeng Formation (average content is 62%), L113 (average content is 55%) and L114 (average content is 40%).
Gas content is also acquired by the combination of laboratory core sample analysis and well logging. The distribution range of well logging gas content in the study area is 0.7–6.0 m3/t, and the average gas content is 3 m3/t. Vertically, the gas content from large to small is L111 (average content is 4.4 m3/t), L112 (average content is 3.2 m3/t), Wufeng Formation (average content is 3.1 m3/t), L113 (average content is 2.6 m3/t) and L114 (average content is 1.4 m3/t).
The shale of the main development formation in the study area has a good adsorption capacity. Absorbed gas content is acquired by the combination of laboratory core sample analysis and well logging. The measured average adsorption gas volume is 2.75 m3/t, the distribution range of logging adsorption gas content is 0.5–3.5 m3/t, and the average adsorption gas content is 2.66 m3/t. From the vertical perspective, the average adsorption gas content is L111 (average content is 2.8 m3/t), L112 (average content is 2.1 m3/t), and Wufeng Formation (average content is 2.03 m3/t) L113 (average content is 1.8 m3/t) and L114 (0.9 m3/t).
Porosity is acquired by the combination of laboratory core sample analysis and well logging. In the study area, the porosity distribution ranges from 2.3% to 7.2%, and the average porosity is 4.0%. Vertically, from large to small, the range is L111 (average content is 5.1%), Wufeng Formation (average content is 4.2%), L112 (average content is 4.1%), L113 (average content is 3.8%), L114 (average content is 2.7%).
The distribution range of the well logging matrix permeability in the study area is 1.94–278.39 nD, and the average permeability is 75.18 nD. From the vertical perspective, L111 (average content is 186.16 nD), L112 (average content is 184.67 nD), Wufeng Formation (average content is 167.32 nD), L113 (average content is 165.96 nD), L114 (average content is 111.51 nD).
For the consideration of mineral composition, XRD and XRF is employed, combined with well logging, and quartz (30–61%, average content is 40%) and clay minerals (23–47%, average content is 27%) are the main mineral components, followed by calcite (14–27%, average content is 20%), whereas feldspar and dolomite are relatively low. Vertically, the content of clay in L111 is the lowest, with an average of 20 ~ 30%. Illite is the main clay mineral, followed by illite and montmorillonite mixed layer. The content of brittle minerals ranges from 61% to 75.2%, with an average of 66%.
Pre-stack seismic inversion, in situ well test, in-house core sample test and well logging is employed to obtain the rock mechanic attributes and stress distribution. In terms of rock mechanics parameters, the distribution range of Young modulus is 23.60–37.40 GPa, with an average of 29.60 GPa, and the distribution range of Poisson’s ratio is 0.110–0.201, with an average of 0.164.
The maximum principal stress distribution is 7.9–81 MPa, the minimum principal stress distribution is 5.9–60 MPa, the horizontal stress difference is 2–22 MPa, the maximum horizontal principal stress azimuth is NE, the azimuth is 40–65 degrees.
The Eastern and Northern strata in the study area are relatively flat, with dip angles of less than 15 degrees in the east, 10–20 degrees in the north, larger than 30 degrees in the south, and larger in the west, gradually increasing from north to south.
The average formation pressure coefficient in the study area is 1.03–1.60, with an average of 1.25, which is a micro over-pressure and over-pressure area.

5.3. Sweet Spots Evaluation Using Fuzzy Comprehensive Evaluation Method in HB Block of Z Shale Gas Field

The existing evaluation system of sweet spots in the study area is relatively simple, based on only three indicators, including Total Organic Carbon (TOC), effective porosity and gas content. That is, mainly for the evaluation of GSS, there is a lack of relevant ESS evaluation indicators such as rock mechanics parameters.
The current regional evaluation indicators are shown in Table 3, among which type I (TOC > 3%, effective porosity > 4%, gas content > 3 m3/t), type II (2% < TOC < 3%, 3% < effective porosity < 4%, 2 m3/t < gas content < 3 m3/t), type III (1% < TOC < 2%, 2% < effective porosity < 3%, 1 m3/t < gas content < 2 m3/t), type IV (TOC < 1%, effective porosity < 2%, gas content < 1 m3/t).
Based on the in-house development software platform that combines geology and engineering indices, the algorithm proposed in this paper is realized. The interface of evaluation parameter selection, segmented interval setting and parameter weight design are shown in Figure 5.
Based on the existing two-dimensional geological map of the study area, the map is digitized, and combined with the regional well, seismic and experimental data, and the deterministic modeling algorithm and stochastic modeling algorithm are used to establish the regional 3D geological structural model. Taking geological map distribution and seismic inversion results as spatial constraints, based on logging data, the sequential Gaussian co-location collaborative simulation algorithm is used to establish regional related 3D attribute model. In situ stress simulation mainly adopts the method proposed by other scholars [46,47,48]. Based on the 3D corner grid-rock mechanics parameter model, the finite element numerical simulation algorithm is used to establish the regional correlation high-resolution 3D in situ stress model. Based on the method proposed in this paper, combined with the evaluation index model of 3D GSS (as shown in Figure 6) and ESS (as shown in Figure 7) in the study area, an evaluation of engineering, geological and comprehensive sweet spots in the region is carried out.
Based on the method proposed in this paper, the sweet spots evaluation result is a continuous attribute distribution interval (as shown in Figure 8a,b,d), which is the comprehensive performance of regional multi-parameter attributes, and also the characterization of the relative advantages and disadvantages of the sweet spot region. This parameter can also be called the sweetness of the sweet spot. The sweetness can be used to determine the relative merits of different regions (the larger the parameter is, the better the attribute is). Several discrete intervals can also be delimited by the sweetness, and different regions such as I, II, III and IV can be divided, as show in Table 4. The evaluation results show that, through the method proposed in this paper, the distribution of organic matter abundance (TOC), organic matter maturity, organic matter type, target layer thickness, high-quality reservoir thickness, formation depth, gas saturation, gas content, adsorbed gas content, natural fracture index, porosity and permeability can be comprehensively considered in the process of GSS evaluation, and the GSS regional evaluation can be carried out. Compared with the original single factor, the reliability of the evaluation results is higher. In the evaluation process of ESS, the rock mechanics parameters, brittleness index, horizontal principal stress, formation dip angle, pressure coefficient and other factors are comprehensively considered to evaluate the regional ESS. Combined with the evaluation results of GSS and ESS, the CSS area in the evaluation area is delineated from the perspective of geological engineering integration, as shown in Figure 8c, which makes the evaluation of sweet spots more reasonable.
The sweet spots can also be evaluated directly based on the geological and engineering indices combination, and the sweetness of CSS can be obtained, as shown in Figure 8d. According to the evaluation results, it can also better delineate the development priority of different areas, and guide the subsequent deployment of horizontal wells and the design of fracturing operation.
The proposed approach is performed on multiple 3D models with different attributes. Some factors may affect the results accuracy of shale gas sweet spot evaluation. Firstly, the input data are the multiple 3D models, the models’ accuracy can have strong effects on the shale gas sweet spot evaluation results accuracy. Secondly, the indices number and selection also have a strong effect on the results accuracy. Thirdly, considering the evaluation procedure, the weight determination using AHP can also affect the results accuracy.

6. Conclusions

This paper firstly systematically analyzed the indices involved in the evaluation of geological and engineering sweet spots. Additionally, an evaluation index system of geological sweet spots, engineering sweet spots and comprehensive sweet spots for shale gas, according to the geological and engineering integration for shale gas, was designed. Then, the fuzzy comprehensive evaluation method was briefly introduced for multi-parameter comprehensive evaluation of shale gas sweet spots. Aiming to resolve the problems of geological, engineering and comprehensive sweet spots evaluation, a geological and engineering integrated shale gas sweet spot evaluation method based on the fuzzy comprehensive evaluation method was established. Finally, the modified method was tested in HB block of Z shale gas field in China, which can more accurately predict the distribution of geological and sweet spots in the region. Several conclusions came up from this research.
(1)
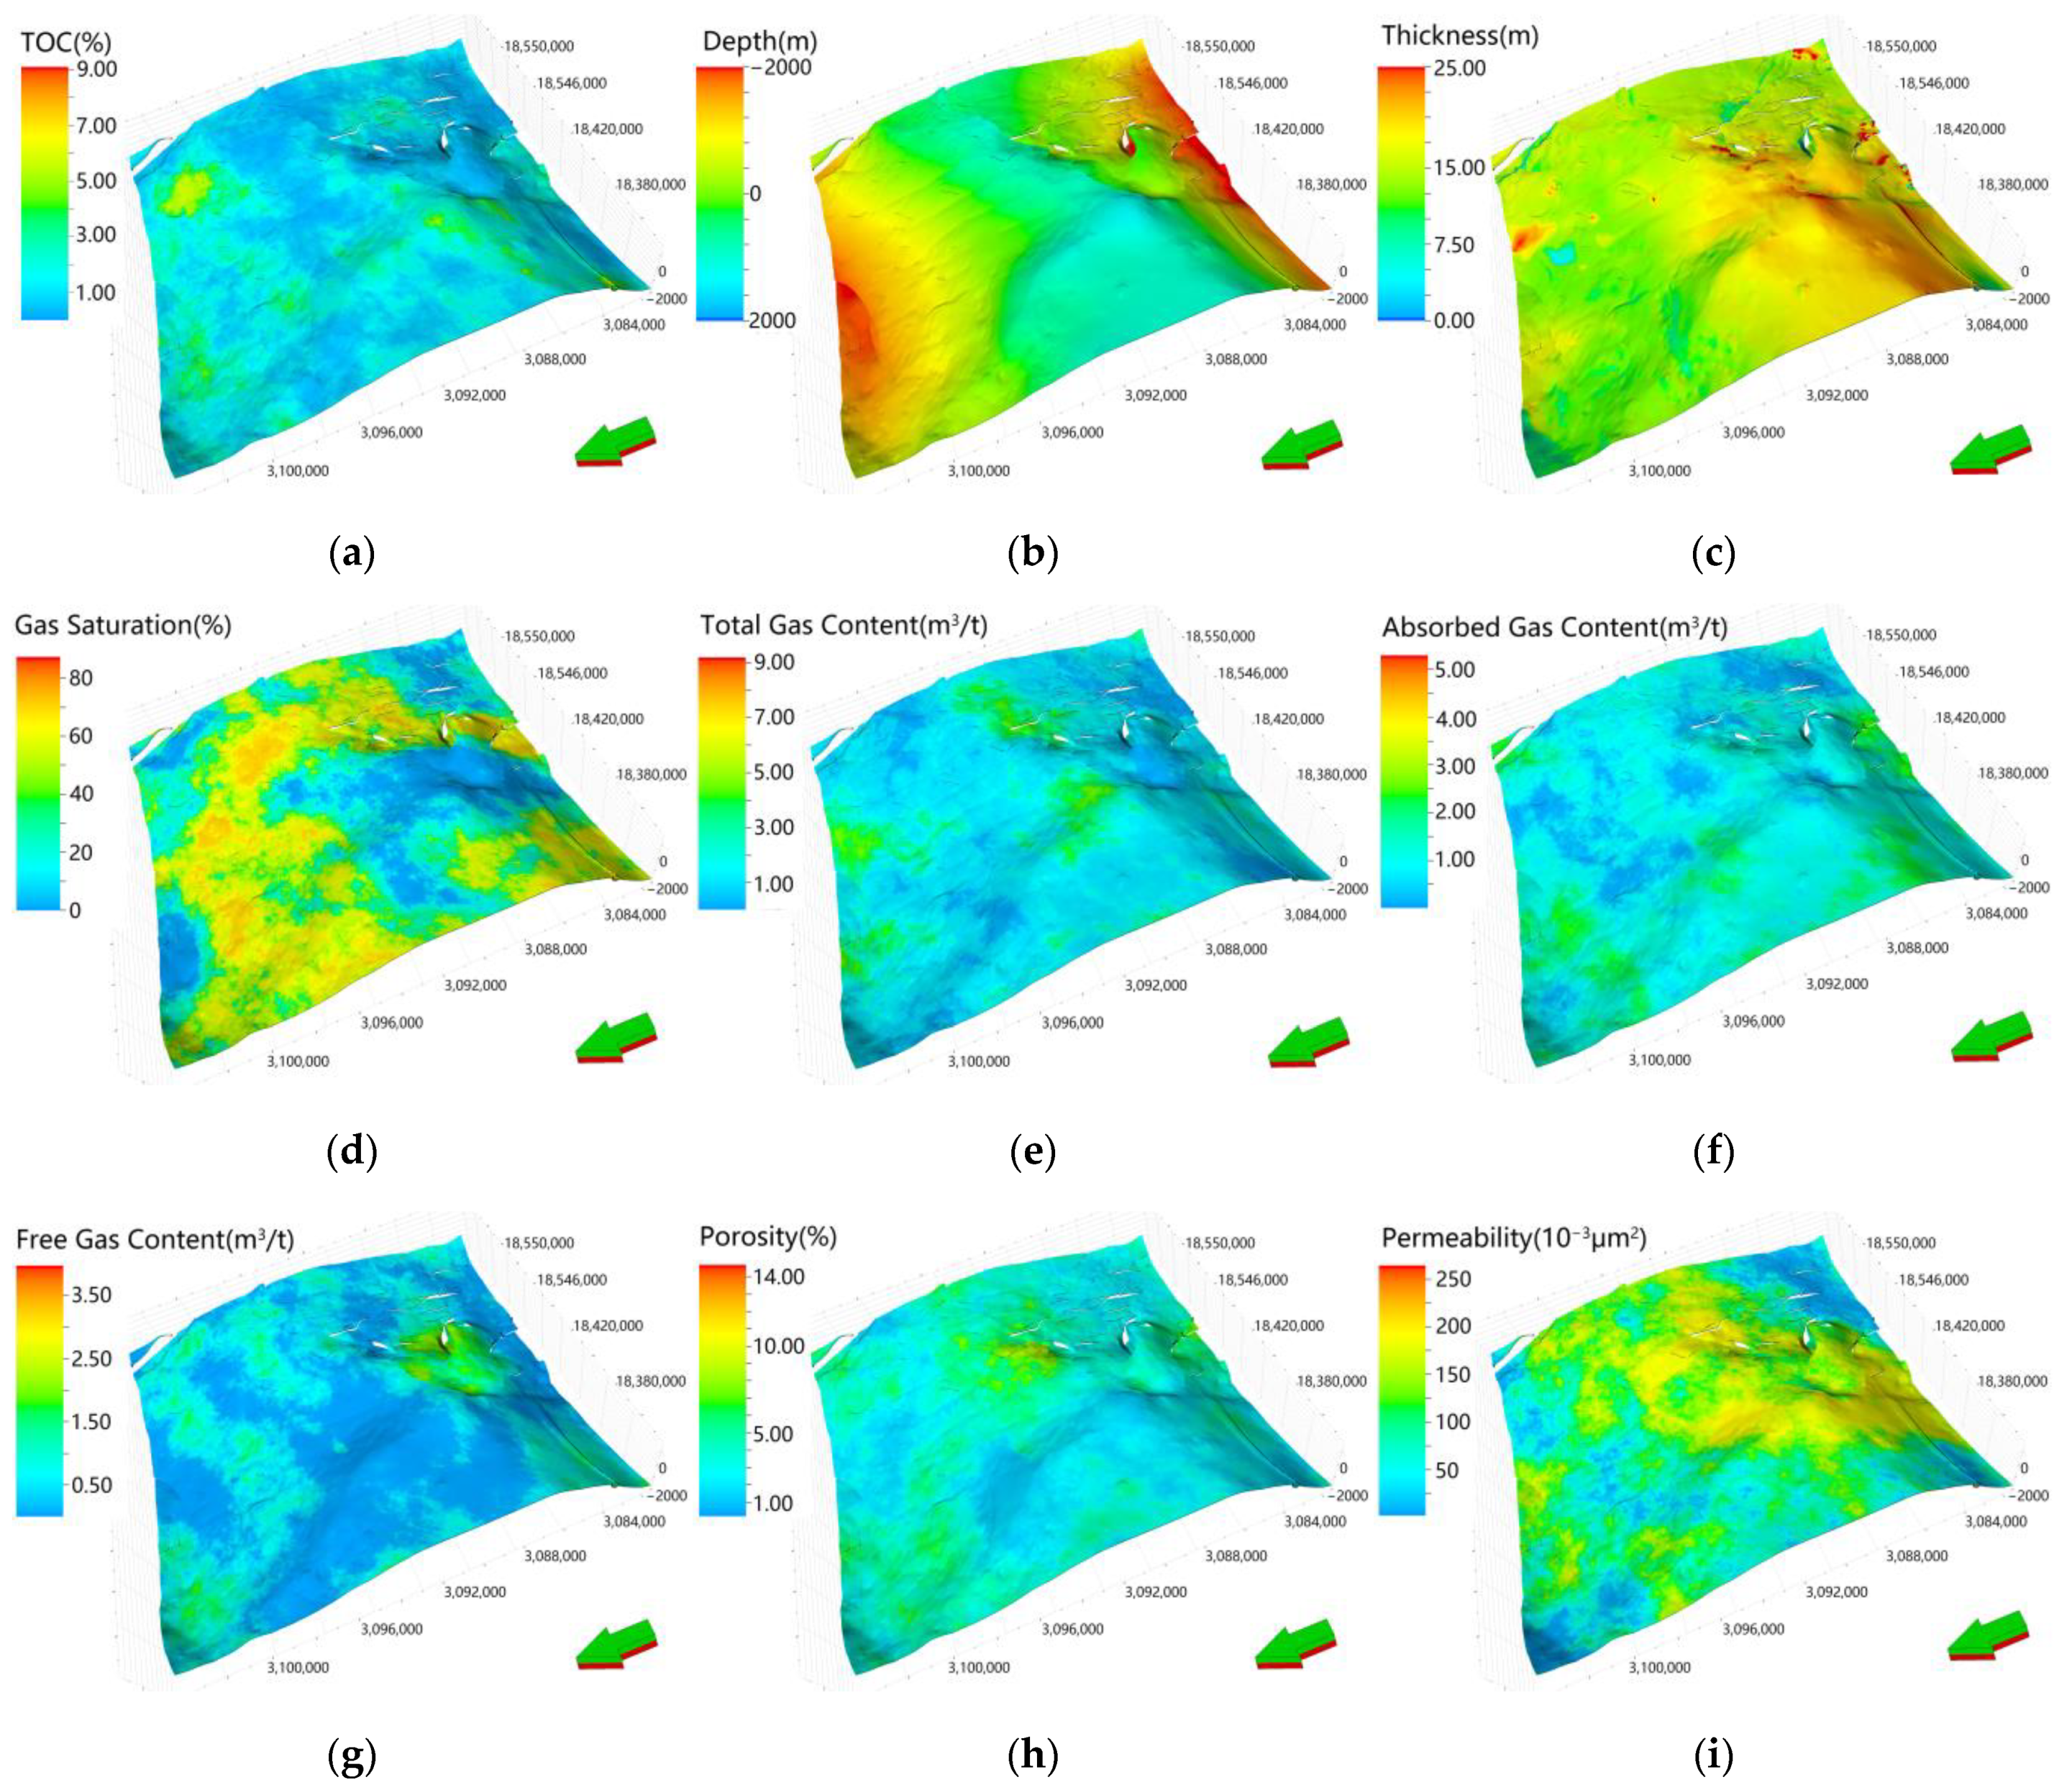
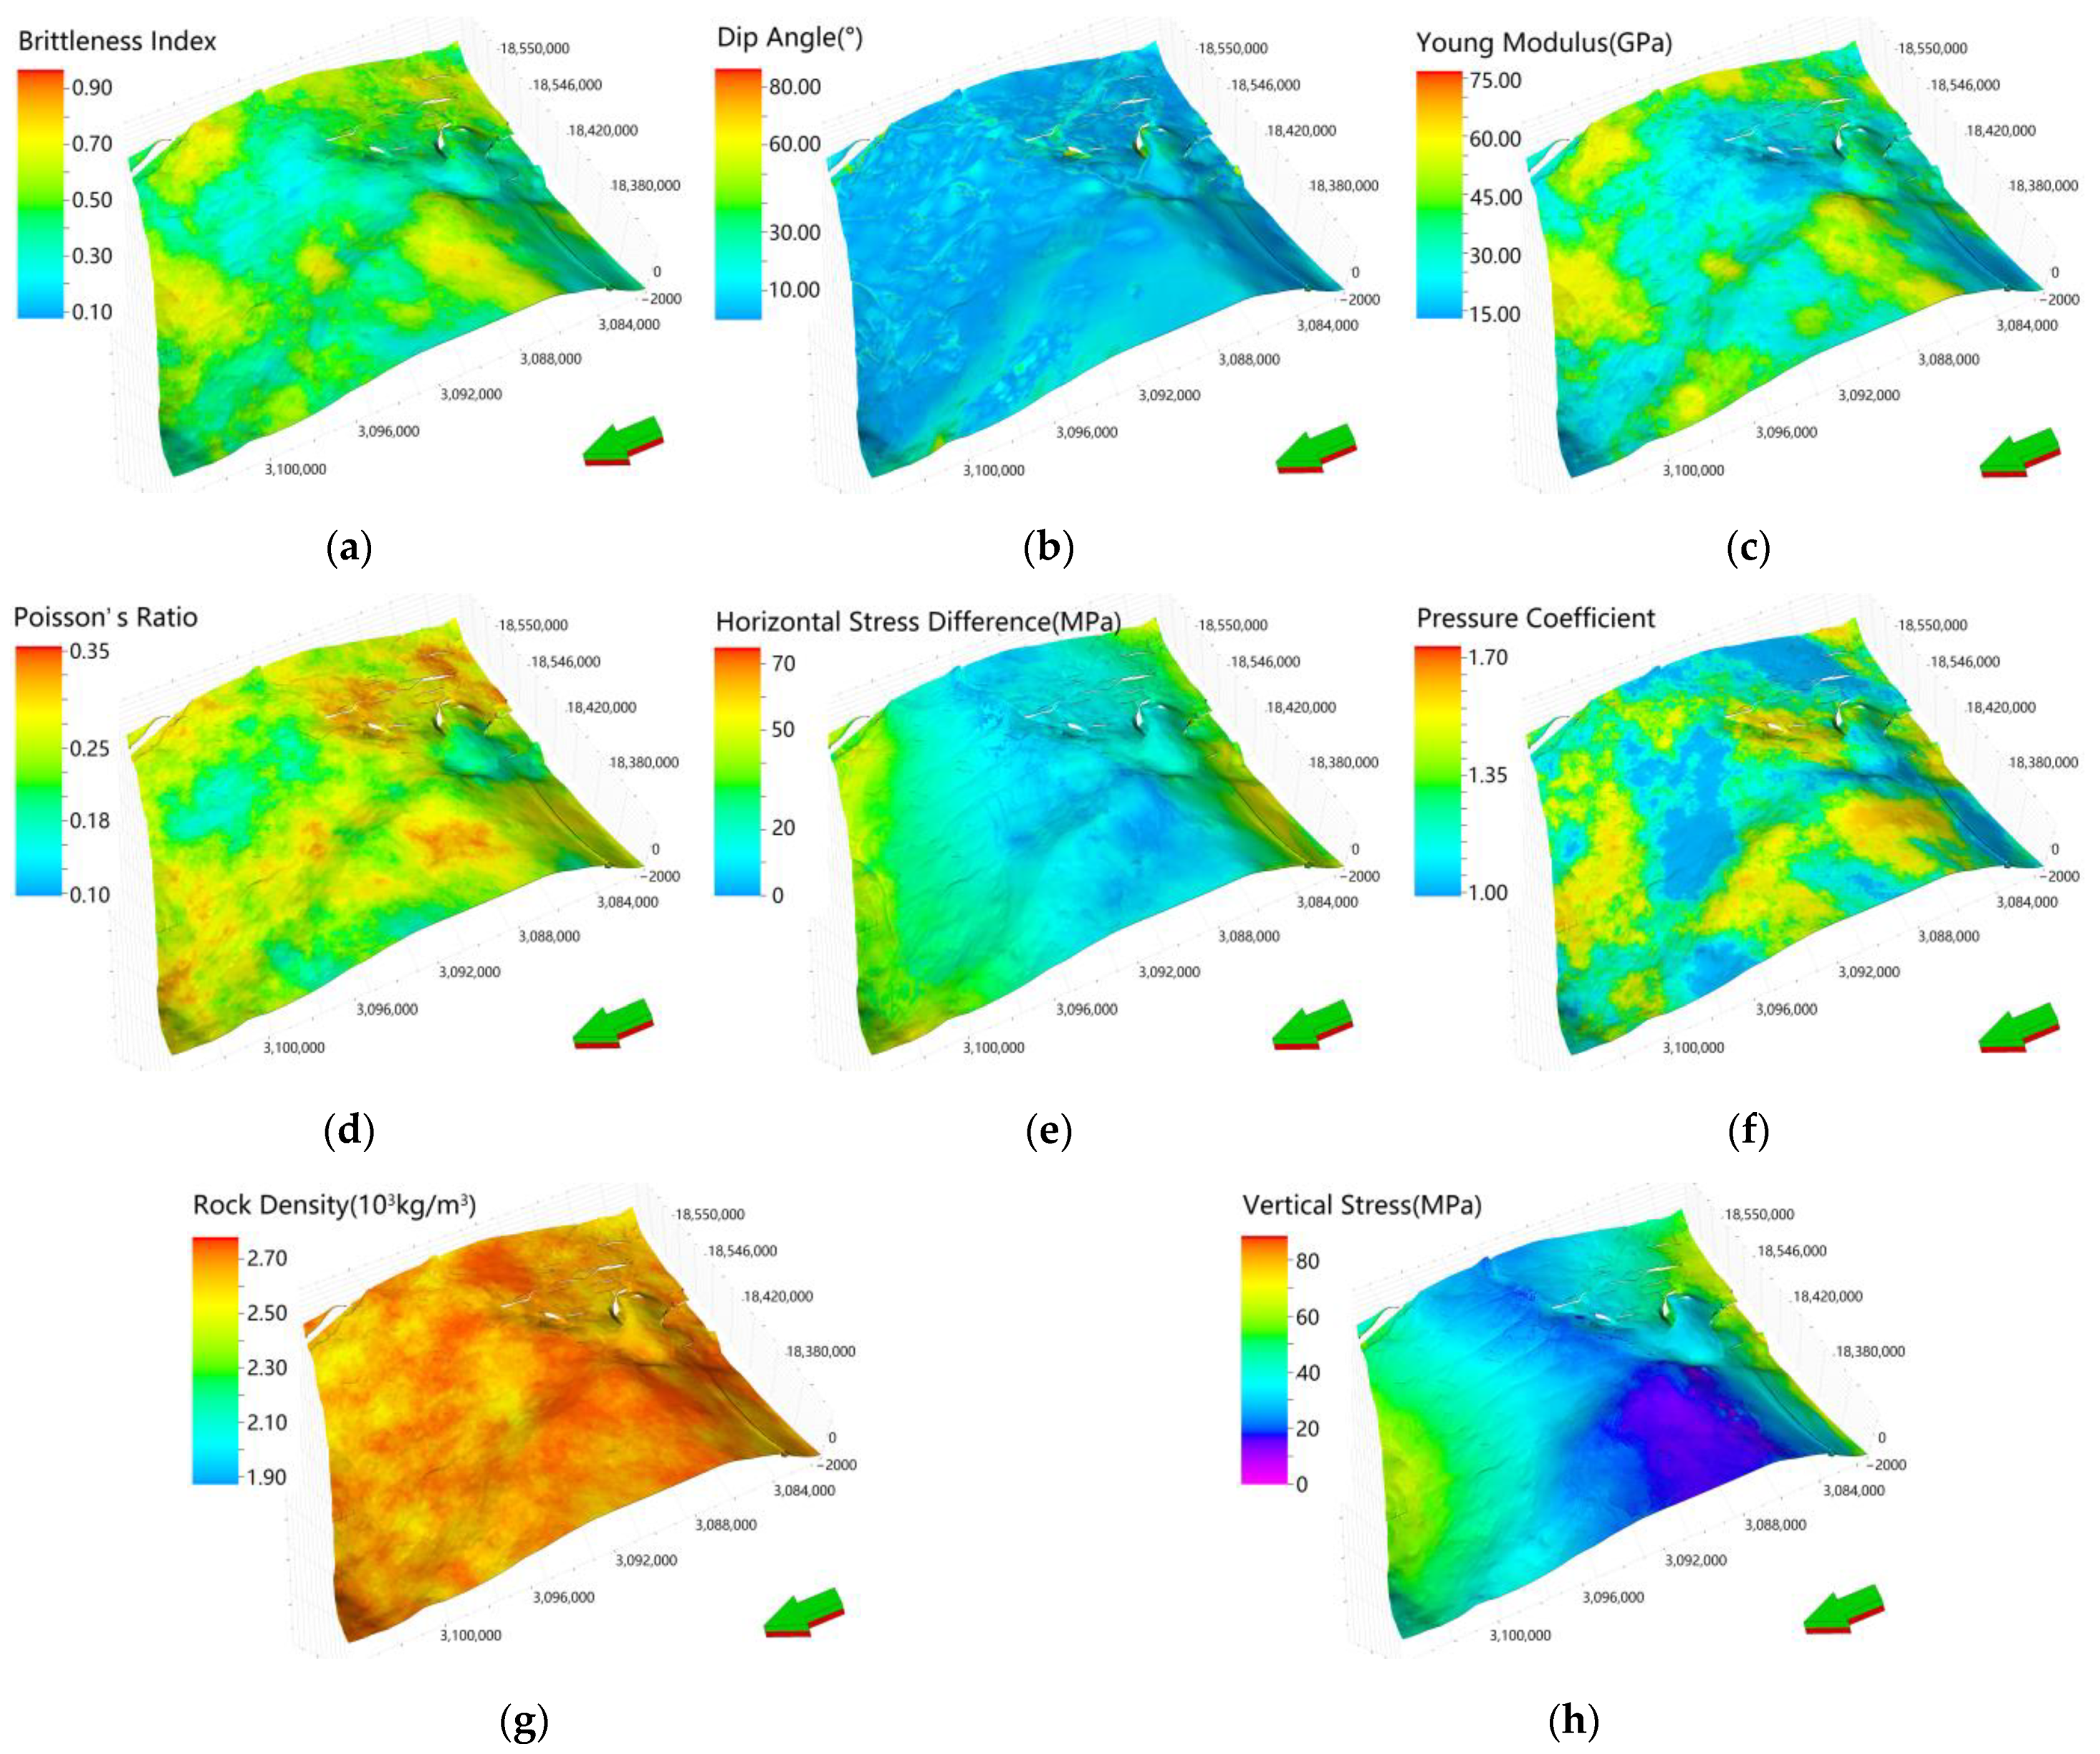
In the evaluation index system of shale gas geological sweet spots, twelve factors have been introduced, including organic matter abundance, organic matter maturity, organic matter type, formation thickness, high-quality reservoir thickness, formation depth, gas saturation, gas content, adsorbed gas content or free gas content, natural fracture index, porosity and matrix permeability are considered. In the evaluation index system of engineering sweet spot of shale gas, six main factors including rock mechanics parameters, brittleness index, horizontal principal stress, vertical stress, formation dip angle and pressure coefficient have been considered. The aforementioned two evaluation systems constitute the comprehensive sweet spots evaluation index system of shale gas. The evaluation system can contribute detailed indices to the shale gas sweet spot evaluation.
(2)
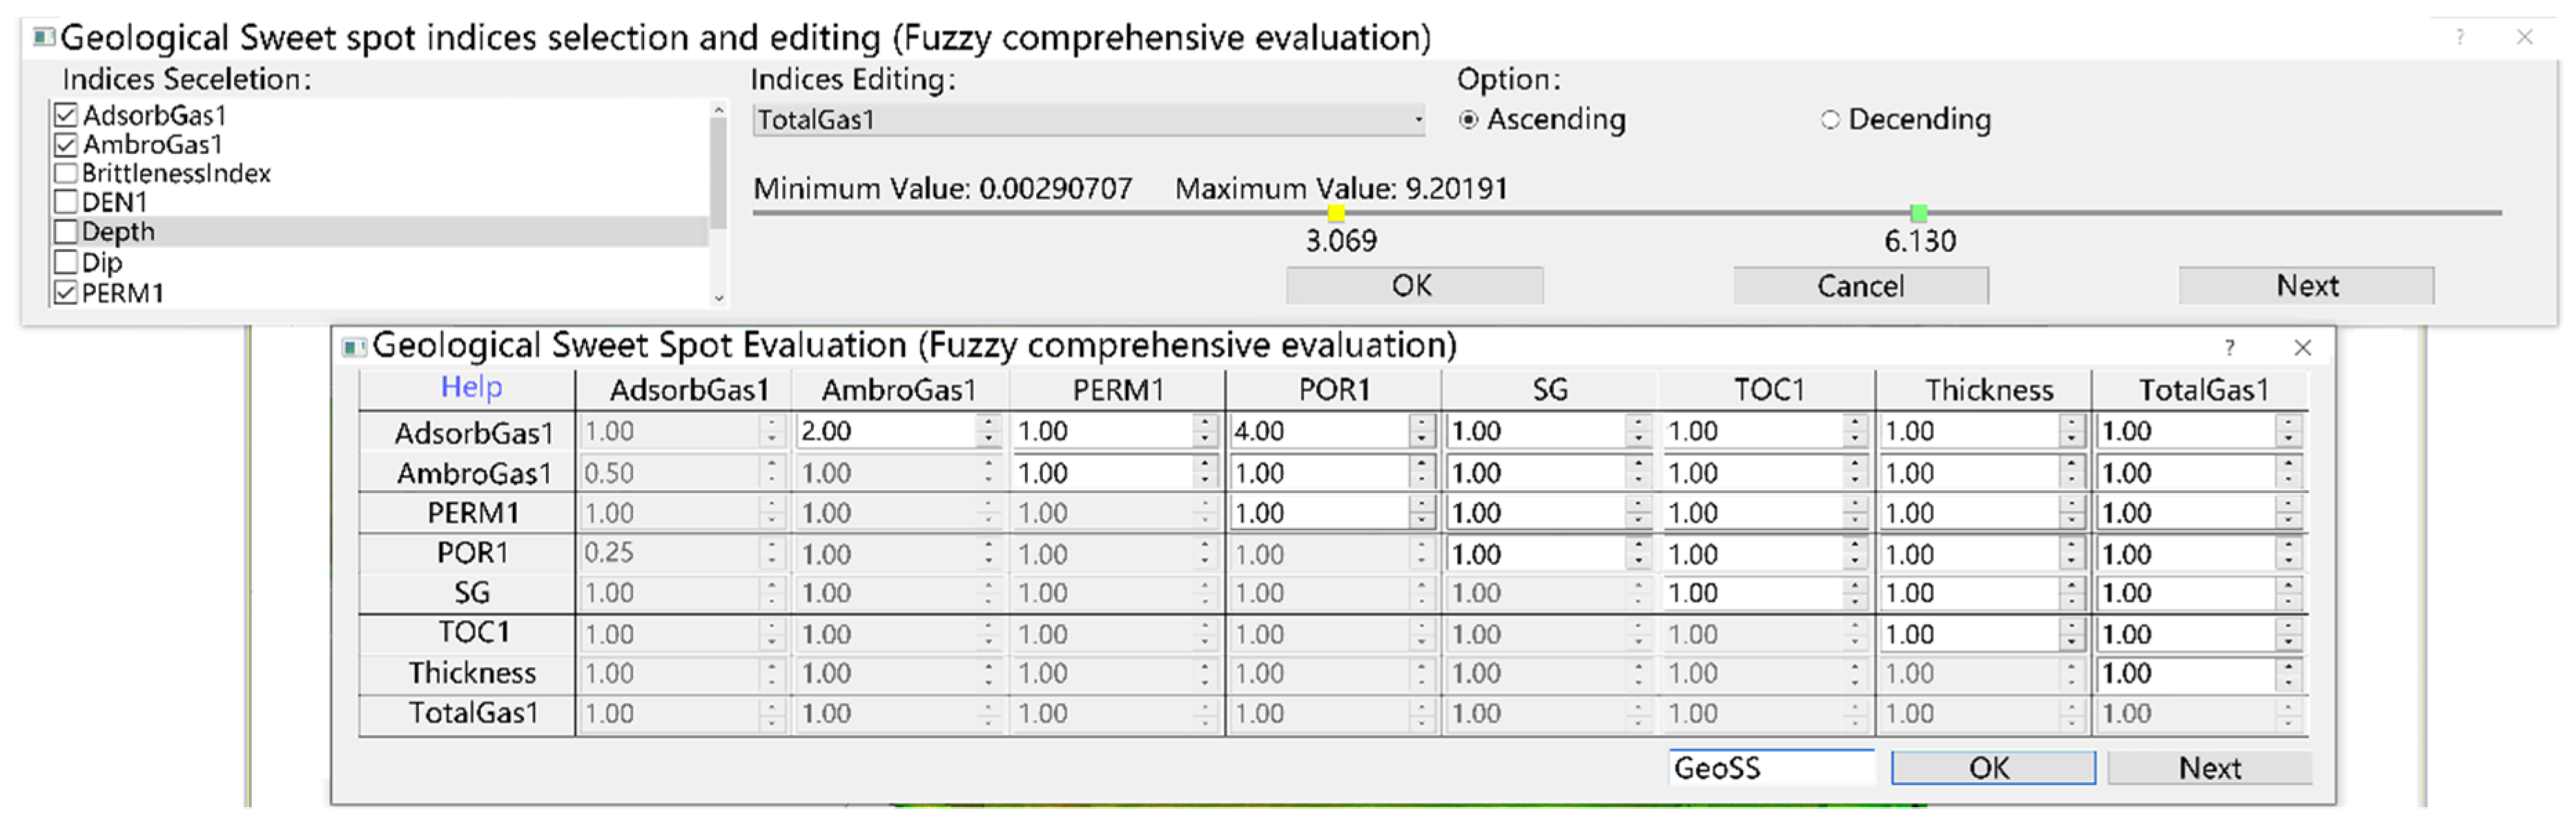
It is a typical multi-attribute decision-making problem to determine the weight value of each evaluation index of geological sweet spots, engineering sweet spots and comprehensive sweet spots. In this paper, fuzzy comprehensive evaluation method is used to determine the weight value of each key evaluation index. Furthermore, an in-house computer platform was developed to calculate the fuzzy mathematical indices according to the proposed methodology. The fuzzy comprehensive evaluation method is a decision-making analysis method that combines expert experience with quantitative analysis. It uses less quantitative information to mathematicise the decision-making thinking process, and makes people’s thinking process hierarchical and quantitative. It not only considers the attributes of things themselves, but also includes the experience judgment of experts (decision-makers), and introduces the fuzzy logic mathematical method to solve the complex problem of fuzzy quantitative of each attribute parameter, and improves the accuracy and rationality of the evaluation.
(3)
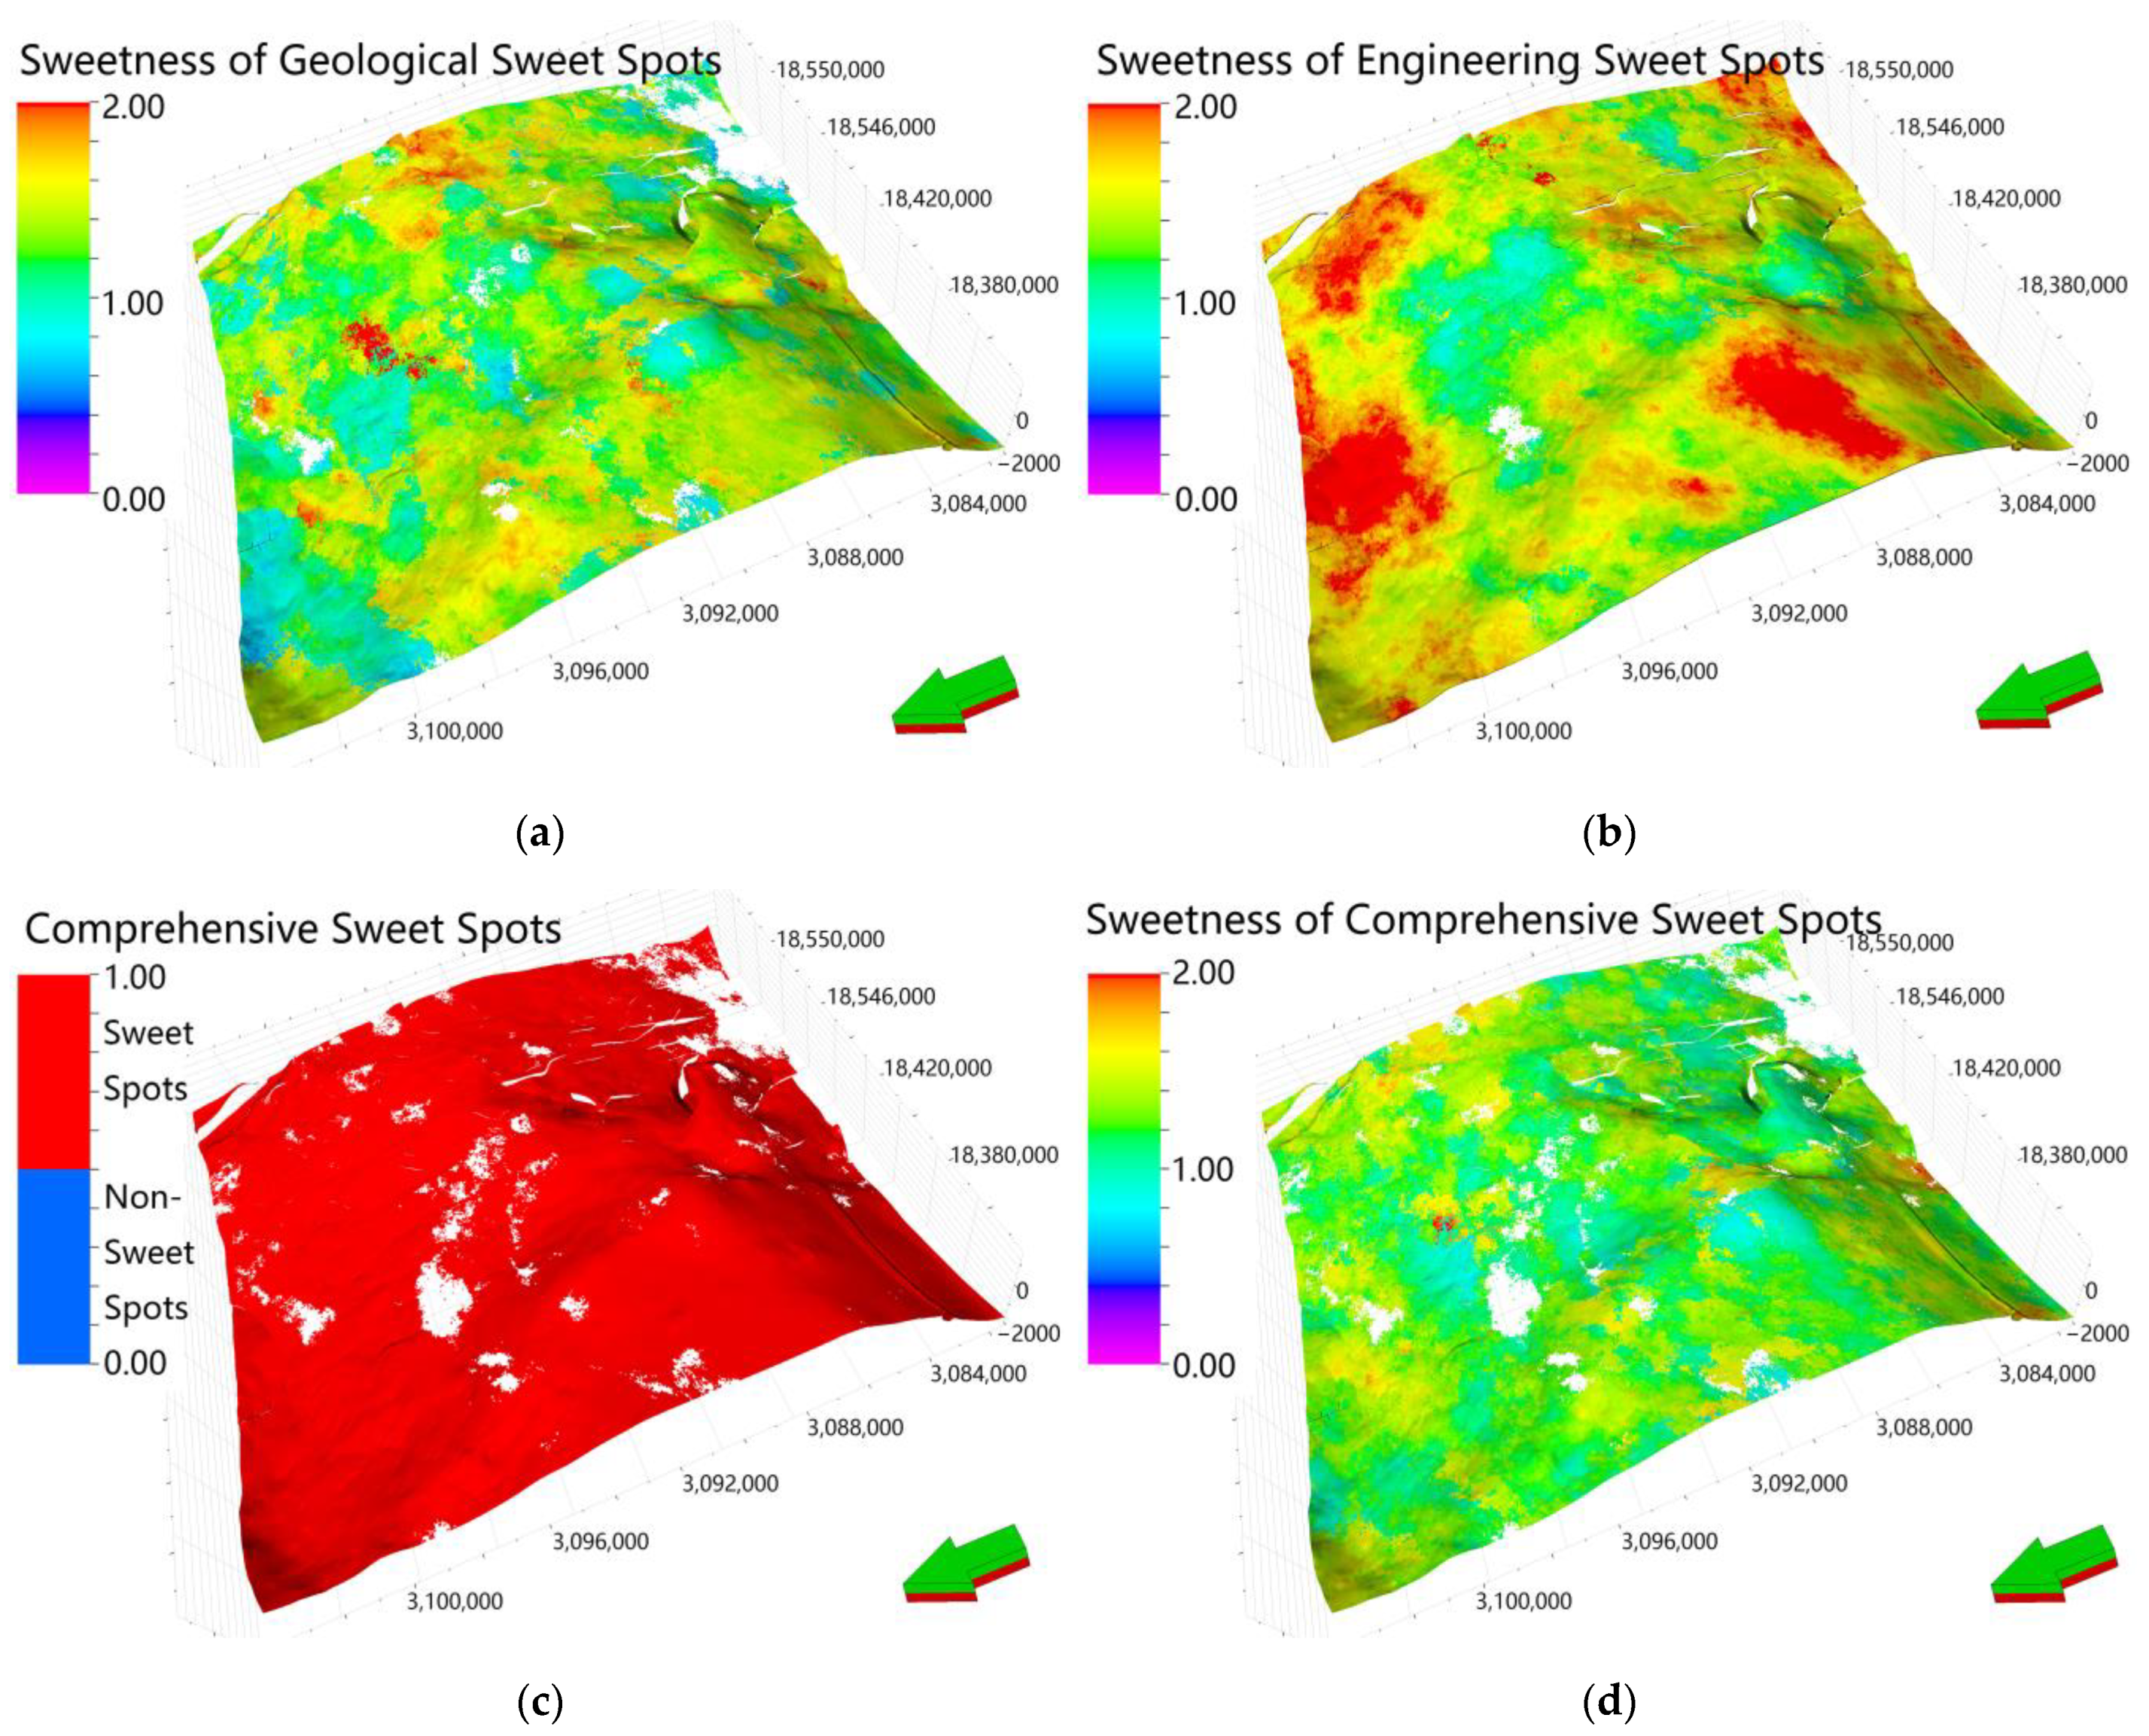
Taking HB block of Z shale gas field in China as an example, based on the multivariate three-dimensional attribute parameter models, such as organic matter maturity, porosity in the study area, etc., and based on the geological engineering integrated fuzzy comprehensive evaluation algorithm proposed in this paper, the geological sweet spots, engineering sweet spots and comprehensive sweet spots in the study area are predicted, which effectively verifies the feasibility and accuracy of this method.

Author Contributions

Conceptualization, Y.L., S.L. and X.Z.; methodology, Y.L., S.L. and X.Z.; software, Y.L.; validation, Y.L. and W.G.; formal analysis, Y.L. and W.G.; investigation, Y.L. and L.K.; resources, Y.L. and R.Y.; data curation, Y.L. and Y.S.; writing—original draft preparation, Y.L., S.L. and X.Z.; writing—review and editing, Y.L., W.G., L.K., R.Y. and Y.S.; visualization, Y.L. and W.G.; supervision, S.L. and X.Z.; project administration, S.L. and X.Z.; funding acquisition, S.L., X.Z., W.G. and Y.S. All authors have read and agreed to the published version of the manuscript.

Funding

The work was supported by the funding of Major national science and technology projects of China (2016ZX05037-006-005, 2016ZX05037-006, 2016ZX05035-004) and project of R&D Department of Petrochina (No. 2021DJ2005). The APC was supported by the funding of Major national science and technology projects of China (2016ZX05037-006-005, 2016ZX05037-006, 2016ZX05035-004) and project of R&D Department of Petrochina (No. 2021DJ2005).

Institutional Review Board Statement

Not applicable.

Informed Consent Statement

Not applicable.

Data Availability Statement

The data used to support the findings of this study are included within the article.

Acknowledgments

The work was supported by the funding of Major national science and technology projects of China (2016ZX05037-006-005, 2016ZX05037-006, 2016ZX05035-004) and project of R&D Department of Petrochina (No. 2021DJ2005).

Conflicts of Interest

The authors declare that there are no conflict of interest regarding the publication of this paper.

References

  1. Ma, X.; Xie, J. The progress and prospects of shale gas exploration and exploitation in southern Sichuan Basin, NW China. Pet. Explor. Dev. 2018, 45, 161–169. [Google Scholar] [CrossRef]
  2. Ma, X. A golden era for natural gas development in the Sichuan Basin. Nat. Gas Ind. 2017, 37, 1–10. [Google Scholar] [CrossRef]
  3. Liu, Y.; Ma, X.; Zhang, X.; Guo, W.; Kang, L.; Yu, R.; Sun, Y. A deep-learning-based prediction method of the estimated ultimate recovery (EUR) of shale gas wells. Pet. Sci. 2021, 18, 1450–1464. [Google Scholar] [CrossRef]
  4. Liu, Y.; Ma, X.; Zhang, X.; Guo, W.; Kang, L.; Yu, R.; Sun, Y. Shale gas well flowback rate prediction for Weiyuan field based on a deep learning algorithm. J. Pet. Sci. Eng. 2021, 203, 108637. [Google Scholar]
  5. Hashmy, K.; Abueita, S.; Barnett, C.; Jonkers, J. Log-Based Identification of Sweet Spots for Effective Fracs in Shale Reservoirs. In Proceedings of the Canadian Unconventional Resources Conference (Society of Petroleum Engineers SPE-149278-MS), Calgary, AB, Canada, 15–17 November 2011; pp. 1–11. [Google Scholar]
  6. Tinnin, B.; Mcchesney, M.D.; Bello, H. Multi-Source Data Integration: Eagle Ford Shale sweet Spot Mapping. In Proceedings of the Unconventional Resources Technology Conference (Unconventional Resources Technology Conference URTEC-2154534-MS), San Antonio, TX, USA, 20–22 July 2015; pp. 1–9. [Google Scholar]
  7. Naides, C.H. Petrophysical Analysis Method To Identify “Sweet Spots” in Tight Gas Reservoirs: Case Study From Punta Rosada Formation in Neuquen Basin, Argentina. In Proceedings of the SPE Latin American and Caribbean Petroleum Engineering Conference (Society of Petroleum Engineers SPE-121313-MS), Lima, Peru, 1–3 December 2010; pp. 1–16. [Google Scholar]
  8. Wu, S.; Yuan, L.; Xiao, H.; Lu, M.; Tang, Y.; She, Y.; Branch, C. A Method for Calculating Reservoir Parameters of Tight Clastic Rocks in Northeast Sichuan Based on Element Captured Spectrum Log Data. Well Logging Technol. 2019, 43, 167–172. [Google Scholar]
  9. Liu, D.; Zhang, C.; Luo, Q.; Zhang, Y.; Gao, Y.; Zhang, Y.; Zhu, D.; Wang, J. Development characteristics and controlling factors of natural fractures in Permian Lucaogou Formation tight reservoir in Jimsar sag, Junggar Basin. China Pet. Explor. 2017, 22, 36–47. [Google Scholar]
  10. Reeves, J.J. Advancing 3D Seismic Interpretation Methods to Find the Sweet Spots In Tight Gas Reservoirs. In Proceedings of the 2006 SEG Annual Meeting. Society of Exploration Geophysicists (Society of Exploration Geophysicists SEG-2006-1018), New Orleans, LA, USA, 1–6 October 2006; pp. 1–5. [Google Scholar]
  11. Goodway, B.; Varsek, J.; Abaco, C. Practical applications of P-wave AVO for unconventional gas Resource Plays Part 2: Detection of fracture prone zones with Azimuthal AVO and coherence discontinuity. CSEG Rec. 2006, 31, 53–65. [Google Scholar]
  12. Singh, S.; Kanli, A.I. Estimating shear wave velocities in oil fields: A neural network approach. Geosci. J. 2016, 20, 221–228. [Google Scholar] [CrossRef]
  13. Zhou, J.; Ma, G.; Sui, B.; Xu, W.; Zhang, W.; Zeng, Y. Application of reservoir parameters rock physics inversion in the prediction of “Sweet Spot”: A case study in W17 oilfield. Prog. Geophys. 2019, 34, 1159–1169. [Google Scholar]
  14. Kormaksson, M.; Vieira, M.R.; Zadrozny, B. A Data Driven Method For Sweet Spot Identification In Shale Plays Using Well Log Data. In Proceedings of the SPE Digital Energy Conference and Exhibition (Society of Petroleum Engineers SPE-173455-MS), Woodlands, TX, USA, 3–5 March 2015; pp. 1–9. [Google Scholar]
  15. Jiang, T.; Jain, V.; Belotserkovskaya, A.; Nwosu, N.K.; Ahmad, S. Evaluating Producible Hydrocarbons and Reservoir Quality in Organic Shale Reservoirs using Nuclear Magnetic Resonance (NMR) Factor Analysis. In Proceedings of the SPE/CSUR Unconventional Resources Conference (Society of Petroleum Engineers SPE-175893-MS), Calgary, AB, Canada, 20–22 October 2015; pp. 1–9. [Google Scholar]
  16. Zhao, T.; Li, F.Y.; Marfurt, K. Automated input attribute weighting for unsupervised seismic facies analysis. In Proceedings of the 2017 SEG International Exposition and Annual Meeting (Society of Exploration Geophysicists SEG-2017-17740318), Houston, TX, USA, 24–27 September 2017; pp. 2122–2126. [Google Scholar]
  17. Duan, Y.; Zheng, X.; Hu, L. Seismic facies analysis based on deep encoder clustering. In Proceedings of the 2018 SEG International Exposition and Annual Meeting (Society of Exploration Geophysicists SEG-2018-2997763), Anaheim, CA, USA, 14–19 October 2018; pp. 2152–2156. [Google Scholar]
  18. Zhao, Z.; Du, J. Tight Oil and Gas; Petroleum Industry Press: Beijing, China, 2012. [Google Scholar]
  19. Carrasco, J.; Trillo, E.M. Sweet Spot Geological Techniques for Detecting Oil Field Exploration Locations. In Proceedings of the SPE Latin American and Caribbean Petroleum Engineering Conference (Society of Petroleum Engineers SPE-177035-MS), Quito, Ecuador, 18–20 November 2015; pp. 1–13. [Google Scholar]
  20. Zhang, G.; Wang, Z.; Guo, X.; Zhou, K.; Pan, L.; Sun, L. Characteristics and ‘sweet spot’ prediction of dolomitic tight oil reservoirs of the Fengcheng Formation in Wuxia area, Junggar Basin. Oil Gas Geol. 2015, 36, 219–229. [Google Scholar]
  21. Guo, Q.; Li, F.; Chen, N.; Song, H.; Yang, Z.; Li, D. Methodology, new software system and key technology for tight oil resources assessment. Nat. Gas Geosci. 2016, 27, 1566–1575. [Google Scholar]
  22. Guo, Q.; Cao, H. Tight Oil Sweet Spot Prediction; Geological Publishing House: Beijing, China, 2018. [Google Scholar]
  23. Wang, S.; Li, F.; Guo, Q.; Wang, S. Tight oil resource assessment methods and key parameters. Nat. Gas Geosci. 2016, 27, 1576–1582. [Google Scholar]
  24. Wang, S.; Li, J.; Guo, Q.; Li, D. Application of AHP Method to Favorable Area Optimization for Tight Oil: A Case Study in Daanzhai Formation, Jurassic, Central of the Sichuan Basin. Adv. Earth Sci. 2015, 30, 715–723. [Google Scholar]
  25. Sun, C.; Li, H.; Guo, S. Shale Reservoir Evaluation of Upper Paleozoic in the East Ordos Basin Based on AHP-FCE Method. Adv. Geosci. 2015, 5, 43–52. [Google Scholar] [CrossRef]
  26. Liu, F.; Xie, C.; Liu, C.; Zhang, H.; Gao, J. Tight Oil Reservoir Quantitative Evaluation Based on Gray Correlation Analysis Method. Geol. Sci. Technol. Inf. 2016, 35, 168–175. [Google Scholar]
  27. Zou, C.; Ding, Y.; Lu, Y.; Liu, X.; Chen, J.; Wang, X.; Yang, Z.; Cai, B.; Yang, Z.; He, C.; et al. Concept, technology and practice of “man-made reservoirs” development. Pet. Explor. Dev. 2017, 44, 144–154. [Google Scholar] [CrossRef]
  28. Bansal, Y.; Ertekin, T.; Karpyn, Z.; Ayala, L.; Nejad, A.; Suleen, F.; Balogun, O.; Liebmann, D.; Sun, Q. Forecasting Well Performance in a Discontinuous Tight Oil Reservoir Using Artificial Neural Networks. In Proceedings of the SPE Unconventional Resources Conference-USA (Society of Petroleum Engineers SPE-164542-MS), The Woodlands, TX, USA, 10–12 April 2013; pp. 1–12. [Google Scholar]
  29. Zhan, L.; Guo, B.; Yu, Y.; Yang, C.; Xu, X. Analysis of main controlling factors of tight oil production based on deep learning method. In Proceedings of the CPS/SEG Beijing 2018 International Geophysical conference and Exhibition (Editorial Department of petroleum geophysical exploration), Beijing, Chian, 24–27 April 2018; pp. 1375–1379. [Google Scholar]
  30. Hu, H.; Yue, X.; Yu, J.; Li, W.; Qin, R.; Jiang, M.; Li, F. Application Research on Unconventional Coalbed Methane Production Capacity Level Based on Deep Learn. Ocean. Eng. Equip. Technol. 2019, 6, 454–457. [Google Scholar]
  31. Ismail, A.; Raza, A.; Gholami, R.; Rezaee, R. Reservoir characterization for sweet spot detection using color transformation overlay scheme. J. Pet. Explor. Prod. Technol. 2020, 10, 2313–2334. [Google Scholar] [CrossRef]
  32. Sena, A.; Castillo, G.; Chesser, K.; Voisey, S.; Estrada, J.; Carcuz, J.; Carmona, E.; Hodgkins, P. Seismic reservoir characterization in resource shale plays: Stress analysis and sweet spot discrimination. Lead. Edge 2011, 30, 713–824. [Google Scholar] [CrossRef] [Green Version]
  33. Guo, R.; Lin, H.; Zhang, Y.; Xiao, M. Sweet Spot Interpretation from Multiple Attributes: Machine Learning and Neural Networks Technologies. In Proceedings of the International Geophysical Conference (Society of Geophysics), Beijing, China, 24–27 April 2018; p. 1821. [Google Scholar]
  34. Saaty, T.L. A scaling method for priorities in hierarchical structures. J. Math. Psychol. 1977, 15, 234–281. [Google Scholar] [CrossRef]
  35. Saaty, T.L. How to make a decision: The analytic hierarchy process. Eur. J. Oper. Res. 1990, 48, 9–26. [Google Scholar] [CrossRef]
  36. Jia, C.; Zou, C.; Li, J.; Li, D.; Zheng, M. Assessment criteria, main types, basic features and resource prospects of the tight oil in China. Acta Pet. Sin. 2012, 33, 343–350. [Google Scholar]
  37. Zou, C. Unconventional Petroleum Geology, 2nd ed.; Geological Publishing House: Beijing, China, 2013. [Google Scholar]
  38. Zou, C.; Zhang, G.; Yang, Z.; Tao, S.; Hou, L.; Zhu, R.; Yuan, X.; Ran, Q.; Li, D.; Wang, Z. Geological concepts, characteristics, resource potential and key techniques of unconventional hydrocarbon: On unconventional petroleum geology. Pet. Explor. Dev. 2013, 40, 385–399. [Google Scholar] [CrossRef]
  39. Zou, C.; Tao, S.; Bai, B.; Yang, Z.; Zhu, R.; Hou, L.; Yuan, X.; Zhang, G.; Wu, S.; Pang, Z.; et al. Differences and Relations between Unconventional and Conventional Oil and Gas. China Pet. Explor. 2015, 20, 1–16. [Google Scholar]
  40. Yang, Z.; Hou, L.; Tao, S.; Cui, J.; Wu, S.; Lin, S.; Pan, S. Formation conditions and “sweet spot” evaluation of tight oil and shale oil. Pet. Explor. Dev. 2015, 42, 555–565. [Google Scholar]
  41. Petroleum Geological Exploration Professional Standardization Committee. Industrial Standard for Evaluation Method of SY/T 6943-2013; Petroleum Industry Press: Beijing, China, 2013. [Google Scholar]
  42. Administration of Quality Supervision, Inspection and Quarantine of the People’s Republic of China (AQSIQ), Standardization Administration of the People’s Republic of China (SA). National Standard for Geological Evaluation Method of Shale Gas GB/T 31483-2015; Standards Press of China: Beijing, China, 2015. [Google Scholar]
  43. Administration of Quality Supervision, Inspection and Quarantine of the People’s Republic of China (AQSIQ), Standardization Administration of the People’s Republic of China (SA). National Standard for Geological Evaluation Method of Tight GB/T 34906-2017; Standards Press of China: Beijing, China, 2017. [Google Scholar]
  44. Wang, S. Tight Oil Resource Evaluation Technology and Its Application; Petroleum Industrial Press: Beijing, China, 2014. [Google Scholar]
  45. Huang, Y.; Zhang, W. Analysis and Discernment of Market Risks in Enterprises’ Technological Innovation Based on Multistage Fuzzy Comprehensive Evaluation. In Proceedings of the 2006 International Conference on Machine Learning and Cybernetics, Dalian, China, 13–16 August 2006; pp. 1936–1941. [Google Scholar] [CrossRef]
  46. Liu, Y.; Liu, S.; Pan, M. Finite Element Simulation of Oil and Gas Reservoir in Situ Stress Based on a 3D Corner-point Grid Model. Math. Probl. Eng. 2020, 2020, 1–14. [Google Scholar] [CrossRef]
  47. Liu, Y.; Pan, M.; Liu, S. Petrel2ANSYS Accessible software for simulation of crustal stress fields using constraints provided by multiple 3D models that employ different types of grids. J. Cent. South Univ. 2019, 26, 2447–2463. [Google Scholar] [CrossRef]
  48. Liu, Y.; Liu, S.; Pan, M.; Lei, Z. Research of Crustal Stress Simulation Using Finite Element Analysis Based on Corner Point Grid. Acta Sci. Nat. Univ. Pekin. 2019, 55, 643–653. [Google Scholar]
Figure 1. Evaluation index system and evaluation indices of shale gas sweet spots.
Energies 15 00602 g001
Figure 2. Technical process of geological and engineering sweet spots evaluation and comprehensive sweet spots superposition evaluation based on fuzzy comprehensive evaluation.
Energies 15 00602 g002
Figure 3. Technical process of comprehensive sweet spots using fuzzy comprehensive evaluation directly based on evaluation parameters.
Energies 15 00602 g003
Figure 4. Three-dimensional geological model of the study layer: green layer represents Long 114; orange layer is related to Long 113; pink layer is L112; purple layer connects to L111 and cyan layer are Ordovician Wufeng Formation (the model is visualized by Schlumberger Petrel software).
Energies 15 00602 g004
Figure 5. Schematic diagram of parameter selection, sectional interval setting and parameter weight design (in-house development software platform interface).
Energies 15 00602 g005
Figure 6. Three-dimensional evaluation index model of geological sweet spots in the study area: (a) organic matter abundance (TOC); (b) reservoir formation thickness; (c) reservoir burial depth; (d) gas saturation; (e) total gas content; (f) adsorbed gas content; (g) free gas content; (h) porosity; (i) matrix permeability (models visualized by Schlumberger Petrel software).
Energies 15 00602 g006
Figure 7. Three-dimensional evaluation index model of engineering sweet spots in the study area: (a) brittleness index; (b) formation dip angle; (c) Young modulus; (d) Poisson’s ratio; (e) horizontal stress difference; (f) pressure coefficient; (g) rock density; (h) vertical stress (models visualized by Schlumberger Petrel software).
Energies 15 00602 g007
Figure 8. Evaluation results of geological sweet spots, engineering sweet spots and comprehensive sweet spots in the study area: (a) sweetness of 3D geological sweet spots based on evaluation indexes of geological sweet spots; (b) sweetness of 3D engineering sweet spots based on evaluation indexes of engineering sweet spots; (c) evaluation results of 3D comprehensive sweet spots based on the combination of geological sweet spots and engineering sweet spots; (d) sweetness of 3D comprehensive sweet spots directly based on the evaluation indexes of geological sweet spots and engineering sweet spots (only the sweet spots area is reserved, models visualized by Schlumberger Petrel software).
Energies 15 00602 g008
Table 1. Stratigraphic column table in the study area.
SystemStage/Formation
SilurianShiniulan
LongmaxiLong2
Long1Long12
Long11 *Long114 (L114) *
Long113 (L113) *
Long112 (L112) *
Long111 (L111) *
OrdovicianWufeng (O3w) *
Baota
* formation layers in 3D models.
Table 2. Summary of the reservoir properties of every layers in study area.
WFL111L112L113L114
TOC (%)3.35.13.631.5
Thickness (m)2.0–9.71.25–2.325.8–10.95.7–14.810.17–17.48
Gas Saturation (%)6274675540
Gas Content (m3/t)3.14.43.22.61.4
Adsorption Gas Content (m3/t)2.032.82.11.80.9
Free Gas Content (m3/t)1.071.61.10.80.5
Porosity (%)4.25.14.13.82.7
Permeability (nD)167.32186.16184.67165.96111.51
Quartz Content (%)41.4855.0549.9539.7036.43
Clay Minerals Content (%)23.9022.3521.9033.7034.32
Young modulus (GPa)27.2326.0627.7524.3830.88
Poisson’s Ratio0.210.160.170.200.25
Maximum Horizontal Stress (MPa)47.1345.7847.246.7849.7
Minimum Horizontal Stress (MPa)35.0533.4834.0534.7836.28
Horizontal Stress Difference (MPa)12.0812.313.1512.0313.48
Table 3. Current evaluation index model of sweet spots in study area.
Sweet Spot TypeTotal Organic Carbon (TOC)Effective PorosityGas Content
I>3%>4%>3 m3/t
II2–3%3–4%2–3 m3/t
III1–2%2–3%1–2 m3/t
IV<1%<2%<1 m3/t
Table 4. Sweet spots division standard based on sweetness in study area.
Sweet Spot TypeSweetness
I>1.5
II1.0–1.5
III0.5–1.0
IV0–0.5
Non-sweet spot<0
Publisher’s Note: MDPI stays neutral with regard to jurisdictional claims in published maps and institutional affiliations.

