Article

Shale Reservoir Heterogeneity: A Case Study of Organic-Rich Longmaxi Shale in Southern Sichuan, China

1
College of Engineering Science, University of Chinese Academy of Sciences, Beijing 100049, China
2
Institute of Porous Flow and Fluid Mechanics, University of Chinese Academy of Sciences, Langfang 065007, China
3
Research Institute of Petroleum Exploration & Development, Beijing 100083, China
4
School of Petroleum Engineering, Chongqing University of Science and Technology, Chongqing 401331, China
*
Authors to whom correspondence should be addressed.
Energies 2022, 15(3), 913; https://doi.org/10.3390/en15030913
Submission received: 15 December 2021 / Revised: 30 December 2021 / Accepted: 10 January 2022 / Published: 27 January 2022

Abstract

:
Shale reservoir heterogeneity is strong, which seriously affects shale gas reservoir evaluation and reserves estimation. The Longmaxi Formation shale of the Luzhou block in southern Sichuan was taken as an example to characterize the pore distribution of shale over the full scale using micro-computed tomography (CT), focusing on ion beam scanning electron microscopy (FIB-SEM) and small-angle neutron scattering (SANS); further, the heterogeneity of the shale pore distribution over the full scale was explored quantitatively within different scales. The results show that shale micropores are dominated by microfractures that are mainly developed along the bedding direction and associated with organic matter, contributing 1.24% of porosity. Shale nanopores are more developed, contributing 3.57–4.72% porosity and have strong heterogeneity locally at the microscale, but the pore distribution characteristics show lateral homogeneity and vertical heterogeneity at the macroscale. In the same layer, the porosity difference is only 0.1% for the sheet samples with 2 cm adjacent to each other. Therefore, in shale core experiments in which parallel samples are needed for comparison, parallel samples should be in the same bedding position. This paper explores the extent of heterogeneity over the full scale of pore distribution from macro to micro, which has important significance for accurately characterizing the pore distribution of shale and further carrying out reservoir evaluation and estimation of reserves.

1. Introduction

Reservoir heterogeneity refers to the spatial inhomogeneity of reservoir parameters, which is a common feature of reservoirs [1,2]. The heterogeneity of shale greatly influences the accumulation and migration of shale gas predominantly in the following ways: (1) macroscopically—the mineral composition of shale reservoirs is complex, and its mineral petrological composition and organic matter composition play an important role in the occurrence and enrichment of shale gas; (2) microscopically—the heterogeneity of shale nanoscale pore structure and distribution and the development characteristics of fractures and microfractures cause differences in the gas–water distribution, gas content, and gas release capacity of shale reservoirs, and can even affect shale gas production [3]. At present, some research into shale heterogeneity has been carried out at home and abroad, and relevant achievements have been attained [4,5]. However, research into the heterogeneity of shale microscopic pore distribution characteristics is limited by the accuracy of applicable experimental methods and sample size. Studies on the heterogeneity of the nanopore distribution of shale development are often conducted at the micron scale, which leads to a lack of representative experimental results.
Based on their connectivity, pores can be divided into open pores and closed pores, and most experimental methods can characterize open pores [6]. However, in recent studies, some scholars have proposed the concept of universal connectivity in shale reservoirs; that is, all micro–nanopore spaces of shale reservoirs are connected at the molecular scale, and gas molecules can freely flow, diffuse, and move within the reservoir space as a single molecule, molecular group, or continuous gas under certain conditions of temperature and pressure [7]. Therefore, it is of great significance to comprehensively characterize the total pore (open pores and closed pores) distribution within shale. However, at present, the methods used to characterize shale total porosity are relatively simple; the most common analytical methods are scanning electron microscopy (SEM), micro-computed tomography (CT), and focused on ion beam scanning electron microscopy (FIB-SEM) [8]. Scanning electron microscopy can intuitively and quickly observe pores, obtain images, and analyze them, but it can only analyze the pore distribution at the surface of the sample [9,10,11]. Micro/nano-CT can stereoscopically image and characterize the three-dimensional pore distribution of shale, but its accuracy is poor. High-precision nano-CT can only characterize pore spaces greater than 50 nm and, thus, cannot fully characterize shale with developed nanopores [12,13,14,15,16]. The FIB-SEM method can characterize the total pore space of shale with high accuracy down to a pore space of 2 nm. However, the experimental area is small, generally only 104 μm3, and it cannot fully characterize the pore distribution of shale when applied to shale with strong heterogeneity [17,18,19]. Therefore, to better characterize the porosity of shale, it is necessary to introduce new shale pore distribution characterization methods in conjunction with traditional methods to jointly characterize shale pore distribution.
Small-angle neutron scattering (SANS) technology has been used to characterize the pore distribution of shale [20,21,22,23,24]. SANS technology has the following advantages over traditional technologies: (1) high measurement accuracy down to a pore space of 1 nm [25,26], (2) use of sample sizes as large as 1011 μm3 for high precision characterization [27], and (3) full characterization of the total pore space (open pores + closed pores) in shale [20,28,29,30]. Sun [31] used SANS to further study the pore size distribution of nanopores in southern Sichuan shale and calculated the porosity and pore size distribution of shale using the Porod invariant equation and polydisperse sphere (PDSP) model.
In summary, the traditional experimental methods for studying the total pore distribution, such as SEM, micron CT, and FIB-SEM, are limited by the inverse proportional relationship between the resolution of the research method and the sample size and cannot study the pore distribution characteristics of nanoscale total pores in tens of cubic millimeters of volume samples. Therefore, it is necessary to study the heterogeneity of shale total pore distribution by combining small-angle neutron scattering technology with traditional research methods. Among them, the small-angle neutron scattering technique will be innovatively used to study the heterogeneity characteristics of nanoscale pore distribution in millimeter-scale shale samples.
In this paper, micro-CT technology, FIB-SEM technology, and SANS were used to jointly explore the homogeneity and heterogeneity of shale full-scale pore distribution at the micro and macroscales. Micro-CT technology was used to explore the distribution of micropores, FIB-SEM technology was used to explore the distribution of nanopores in the micron region, and SANS was used to explore the distribution of nanopores in millimeter samples. Understanding the heterogeneity of pore distribution at the micro–nano level expands our current understanding of shale pore distribution and provides a reference for laboratory research into shale pore characteristics from a unique perspective.

2. Materials and Methods

In this paper, deep shale in southern Sichuan will be used as experimental samples. The pore size distribution in shale is widespread, and a single research method cannot completely study the pore distribution characteristics of shale. SANS, Micro-CT, and FIB-SEM methods will be used to study shale pores of different sizes.

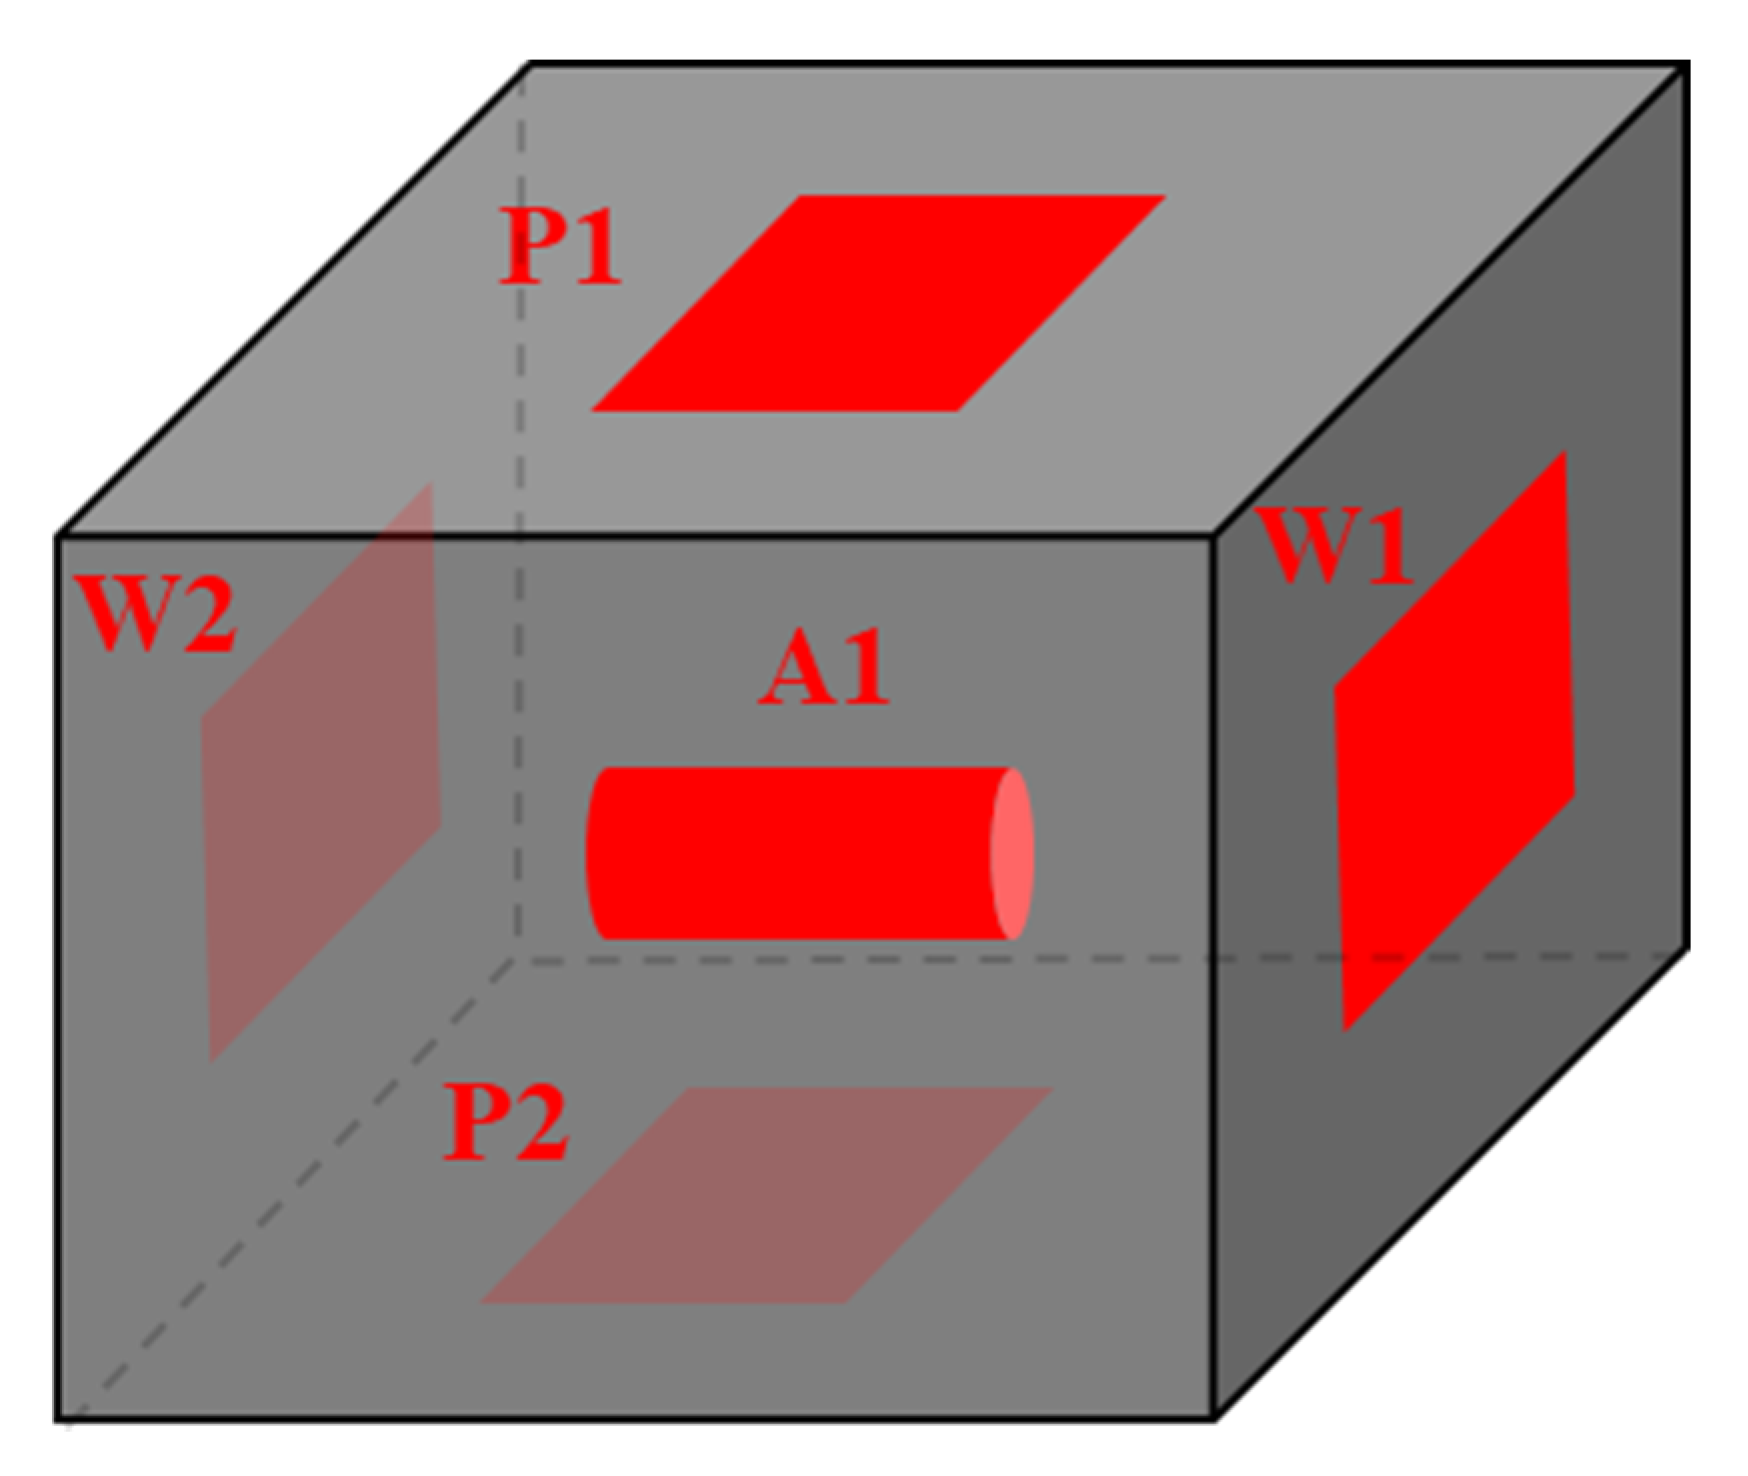
2.1. Sample Preparation

In this paper, fresh shale samples were collected from the first layer of the Longmaxi Formation, a deep shale gas well in the Luzhou block in southern Sichuan, China. In the absence of any reports of liquid, a core was drilled in the gas window. After drilling, the core was wrapped in the field with plastic to prevent weathering. In the laboratory, the samples were divided into bulk samples of 20 × 20 × 20 mm using dry environment wire cutting technology. The bulk samples were dried at 105 °C for 24 h, and the dried samples were cooled to 25 °C in a drying dish. Once dry, experimental samples for micro-CT, FIB-SEM, and neutron scattering were prepared. The specific sample preparation process is shown in Figure 1. A cylindrical sample (A1) with a diameter of 4 mm and a length of 6 mm was extracted from the parallel bedding direction for the micro-CT experiment. A 10 × 10 × 0.7 mm sample slice (P1, P2) was placed on the upper and lower surfaces of the block in the parallel bedding direction, and a 10 × 10 × 0.7 mm sample slice (W1, W2) was placed on the left and right surfaces of the block in the vertical bedding direction. The FIB-SEM experiment was performed on the samples underneath the block.

2.2. SANS Experiments

SANS experiments were carried out on a GP-SANS instrument with a neutron wavelength of λ = 6 Å ( Δ λ / λ ~ 0.15 ). The distances from the sample to the detector were 18.5 m, 10 m, and 1 m, and a scattering vector (Q) of 0.005 < Q < 0.6 Å−1 was covered, where Q = 4 π λ 1 s i n ( θ ) and 2θ is the scattering angle [31]. According to Radlinski [32], for polydispersed samples, the empirical equation for the scattering vector (Q) has a relationship with the pore radius (r) of r ≈ 2.5/Q. Based on this relationship, it can be calculated that the pore diameter range of samples that can be detected in the experiment is about 1–100 nm. Multiple scattering varies with wavelength and sample thickness. The experimental conditions of this paper were similar to those of previous studies. Shale samples with a thickness of less than 1 mm will have high neutron transmittance, making the multiple scattering of most samples less than 10%. Before the experiment, the samples were dried in an oven at 105 °C for more than 24 h until the mass remained constant. The samples were then placed in a quartz sample cell with an inner diameter of 1 mm for the SANS experiment.

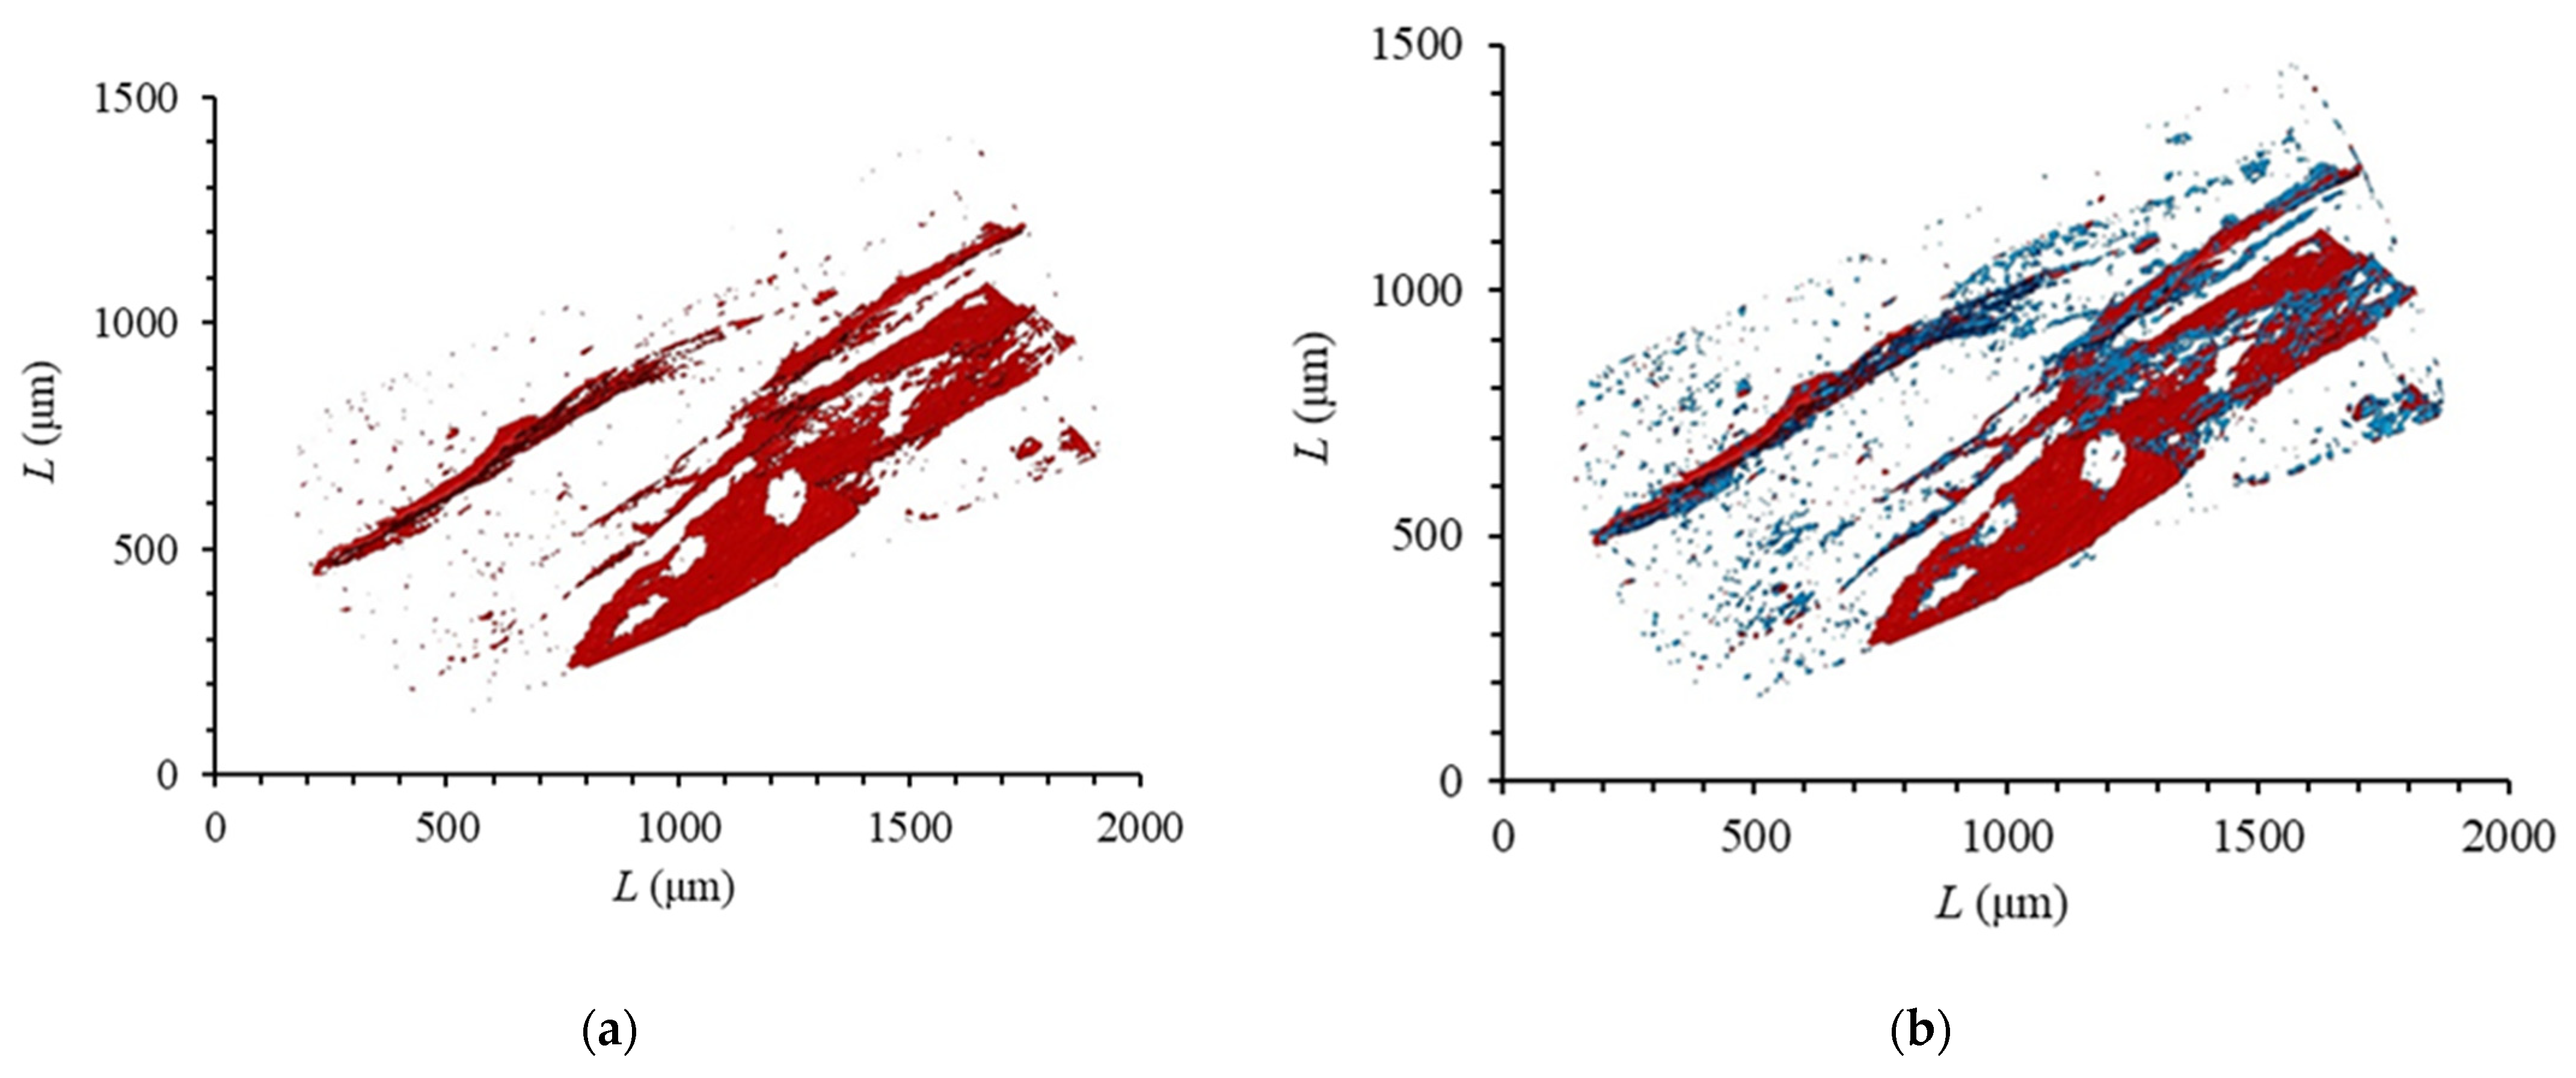
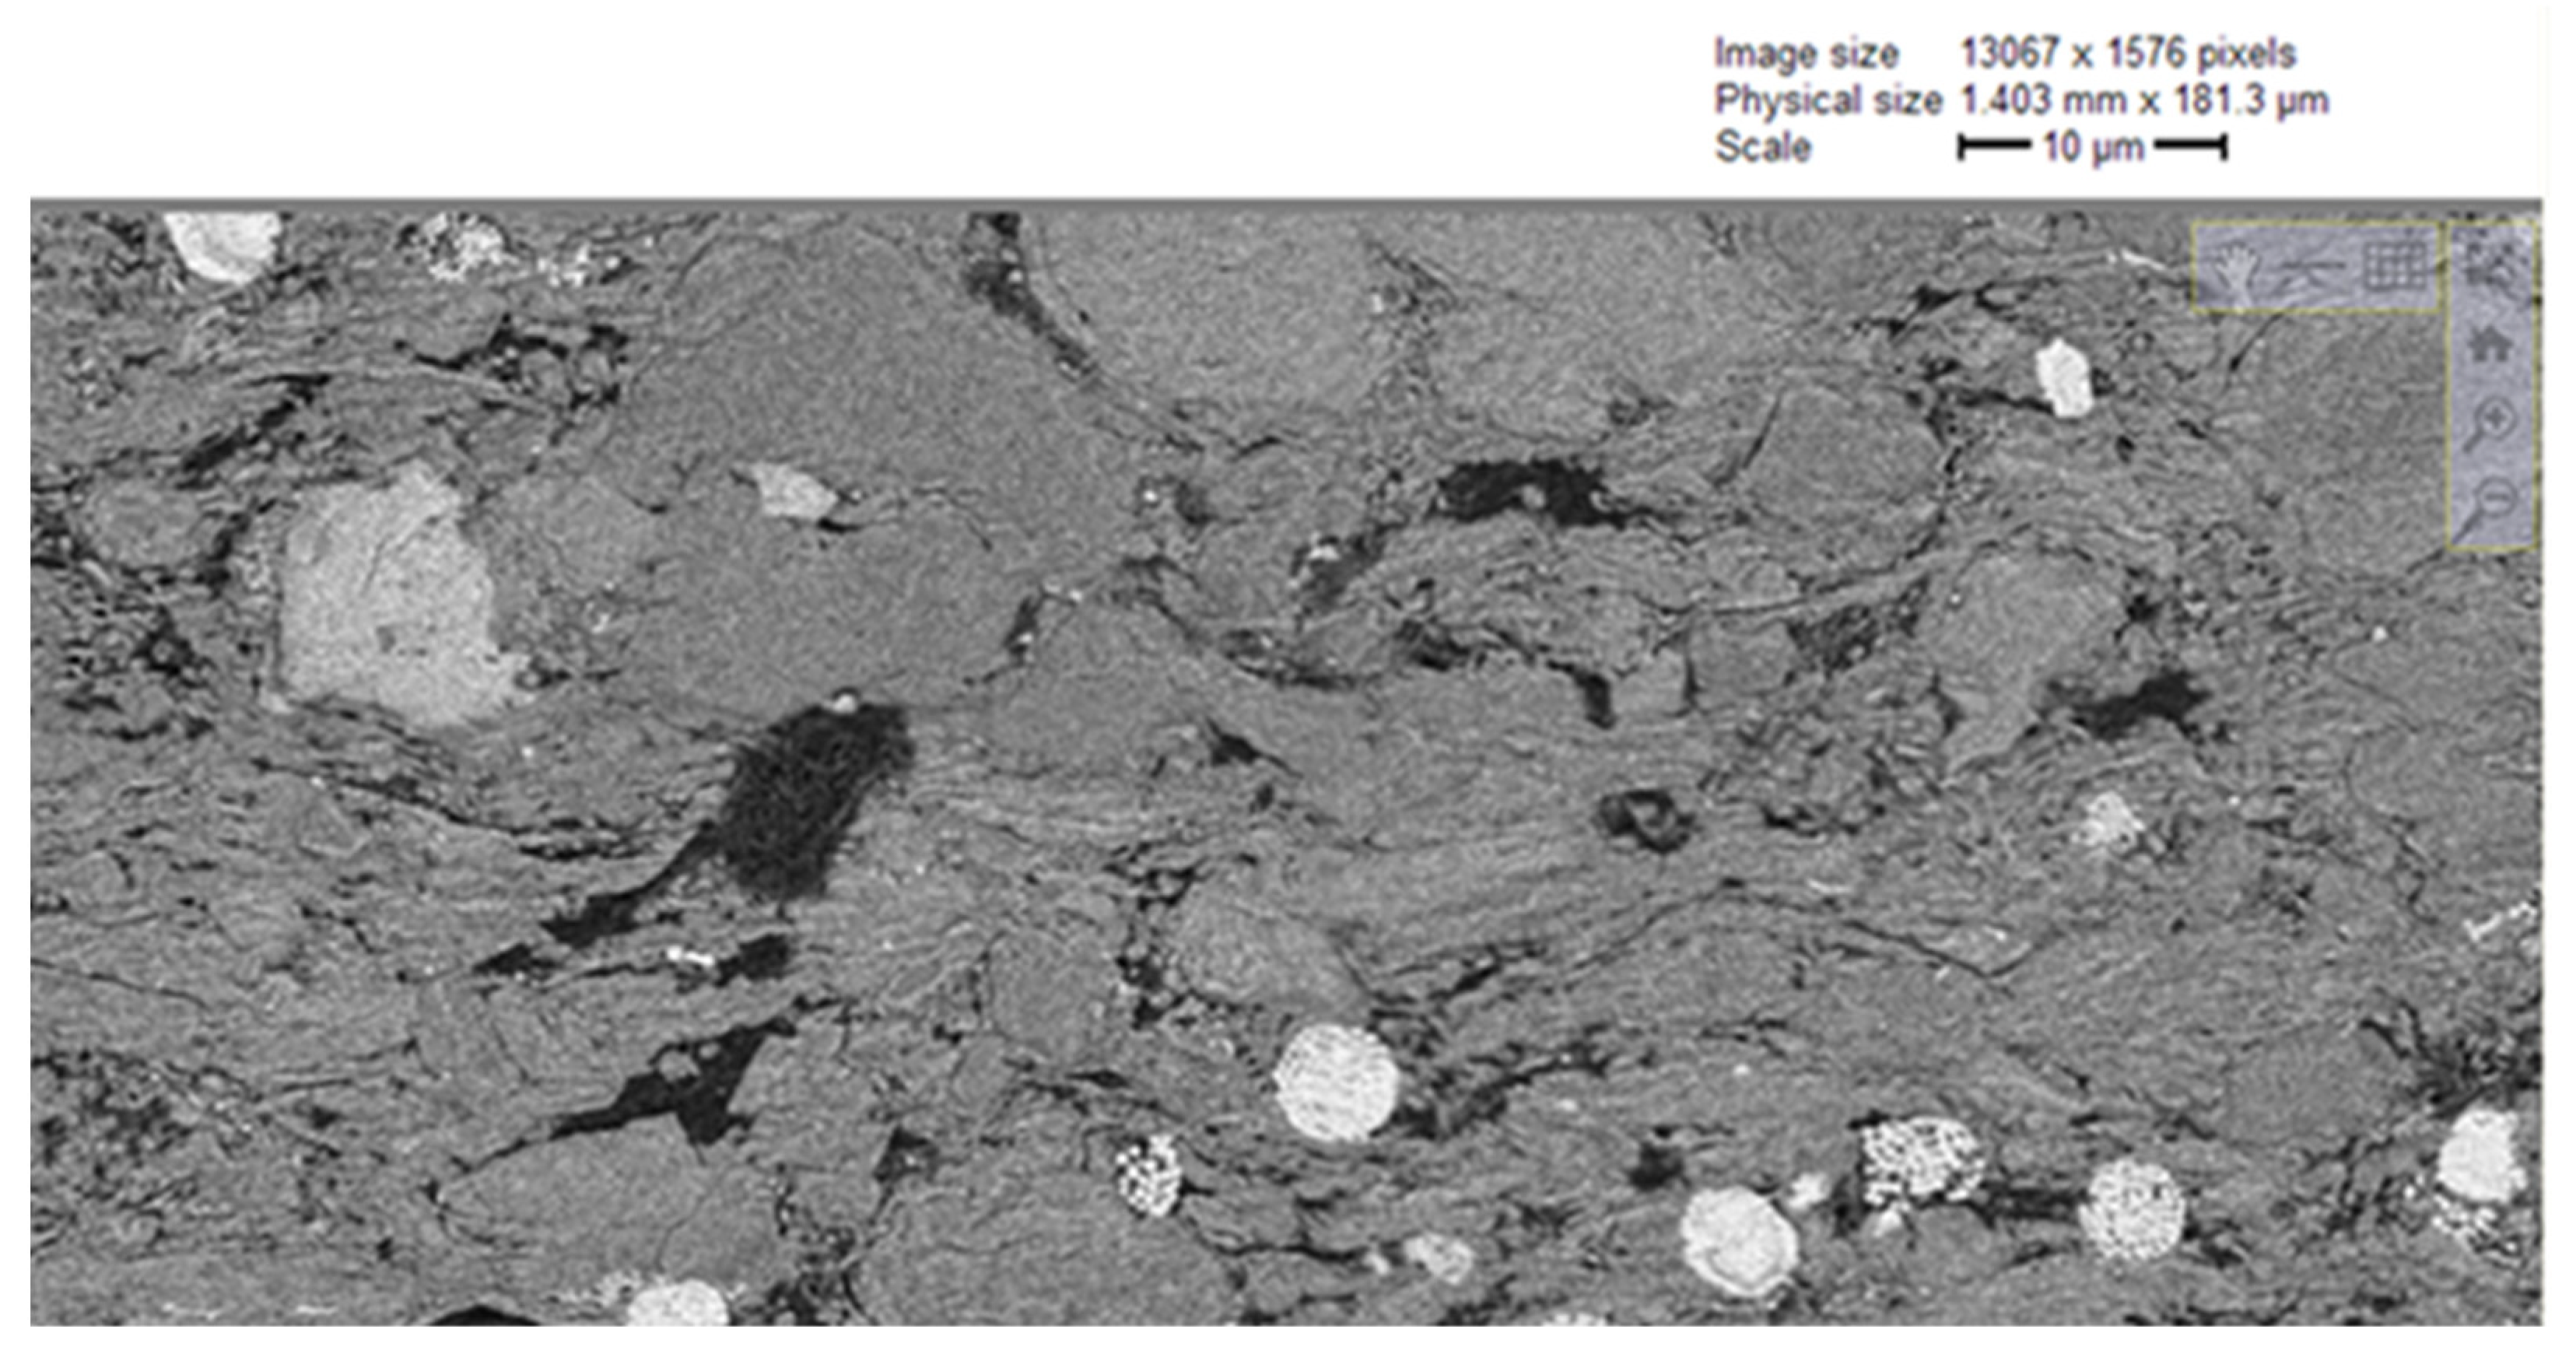
2.3. Micro-CT Experiment

The micro-CT experiment was completed at the China Petroleum Exploration and Development Research Institute (Langfang). The instrument used was an Xradia 400 Versa 3D X-ray microscope (model: XRM-400) from Zeiss company, and the resolution limit was 700 nm. Before the micro-CT experiment, a cylindrical rock sample with a diameter of about 4 mm and a length of about 6 mm was drilled along the bedding direction of the sample. After the rock sample was fixed, it was placed vertically into the micro-CT scanning instrument. The single exposure time was set to 2 s, the scanning voltage was 60 kV, and the experimental temperature was 20 °C. A two-dimensional plane image along the Z-axis direction (about 1024) was obtained, and a three-dimensional stereo data volume was superimposed in turn [33]. Avizo software (version: Avizo 2019.1) was used for three-dimensional data reconstruction and analysis.

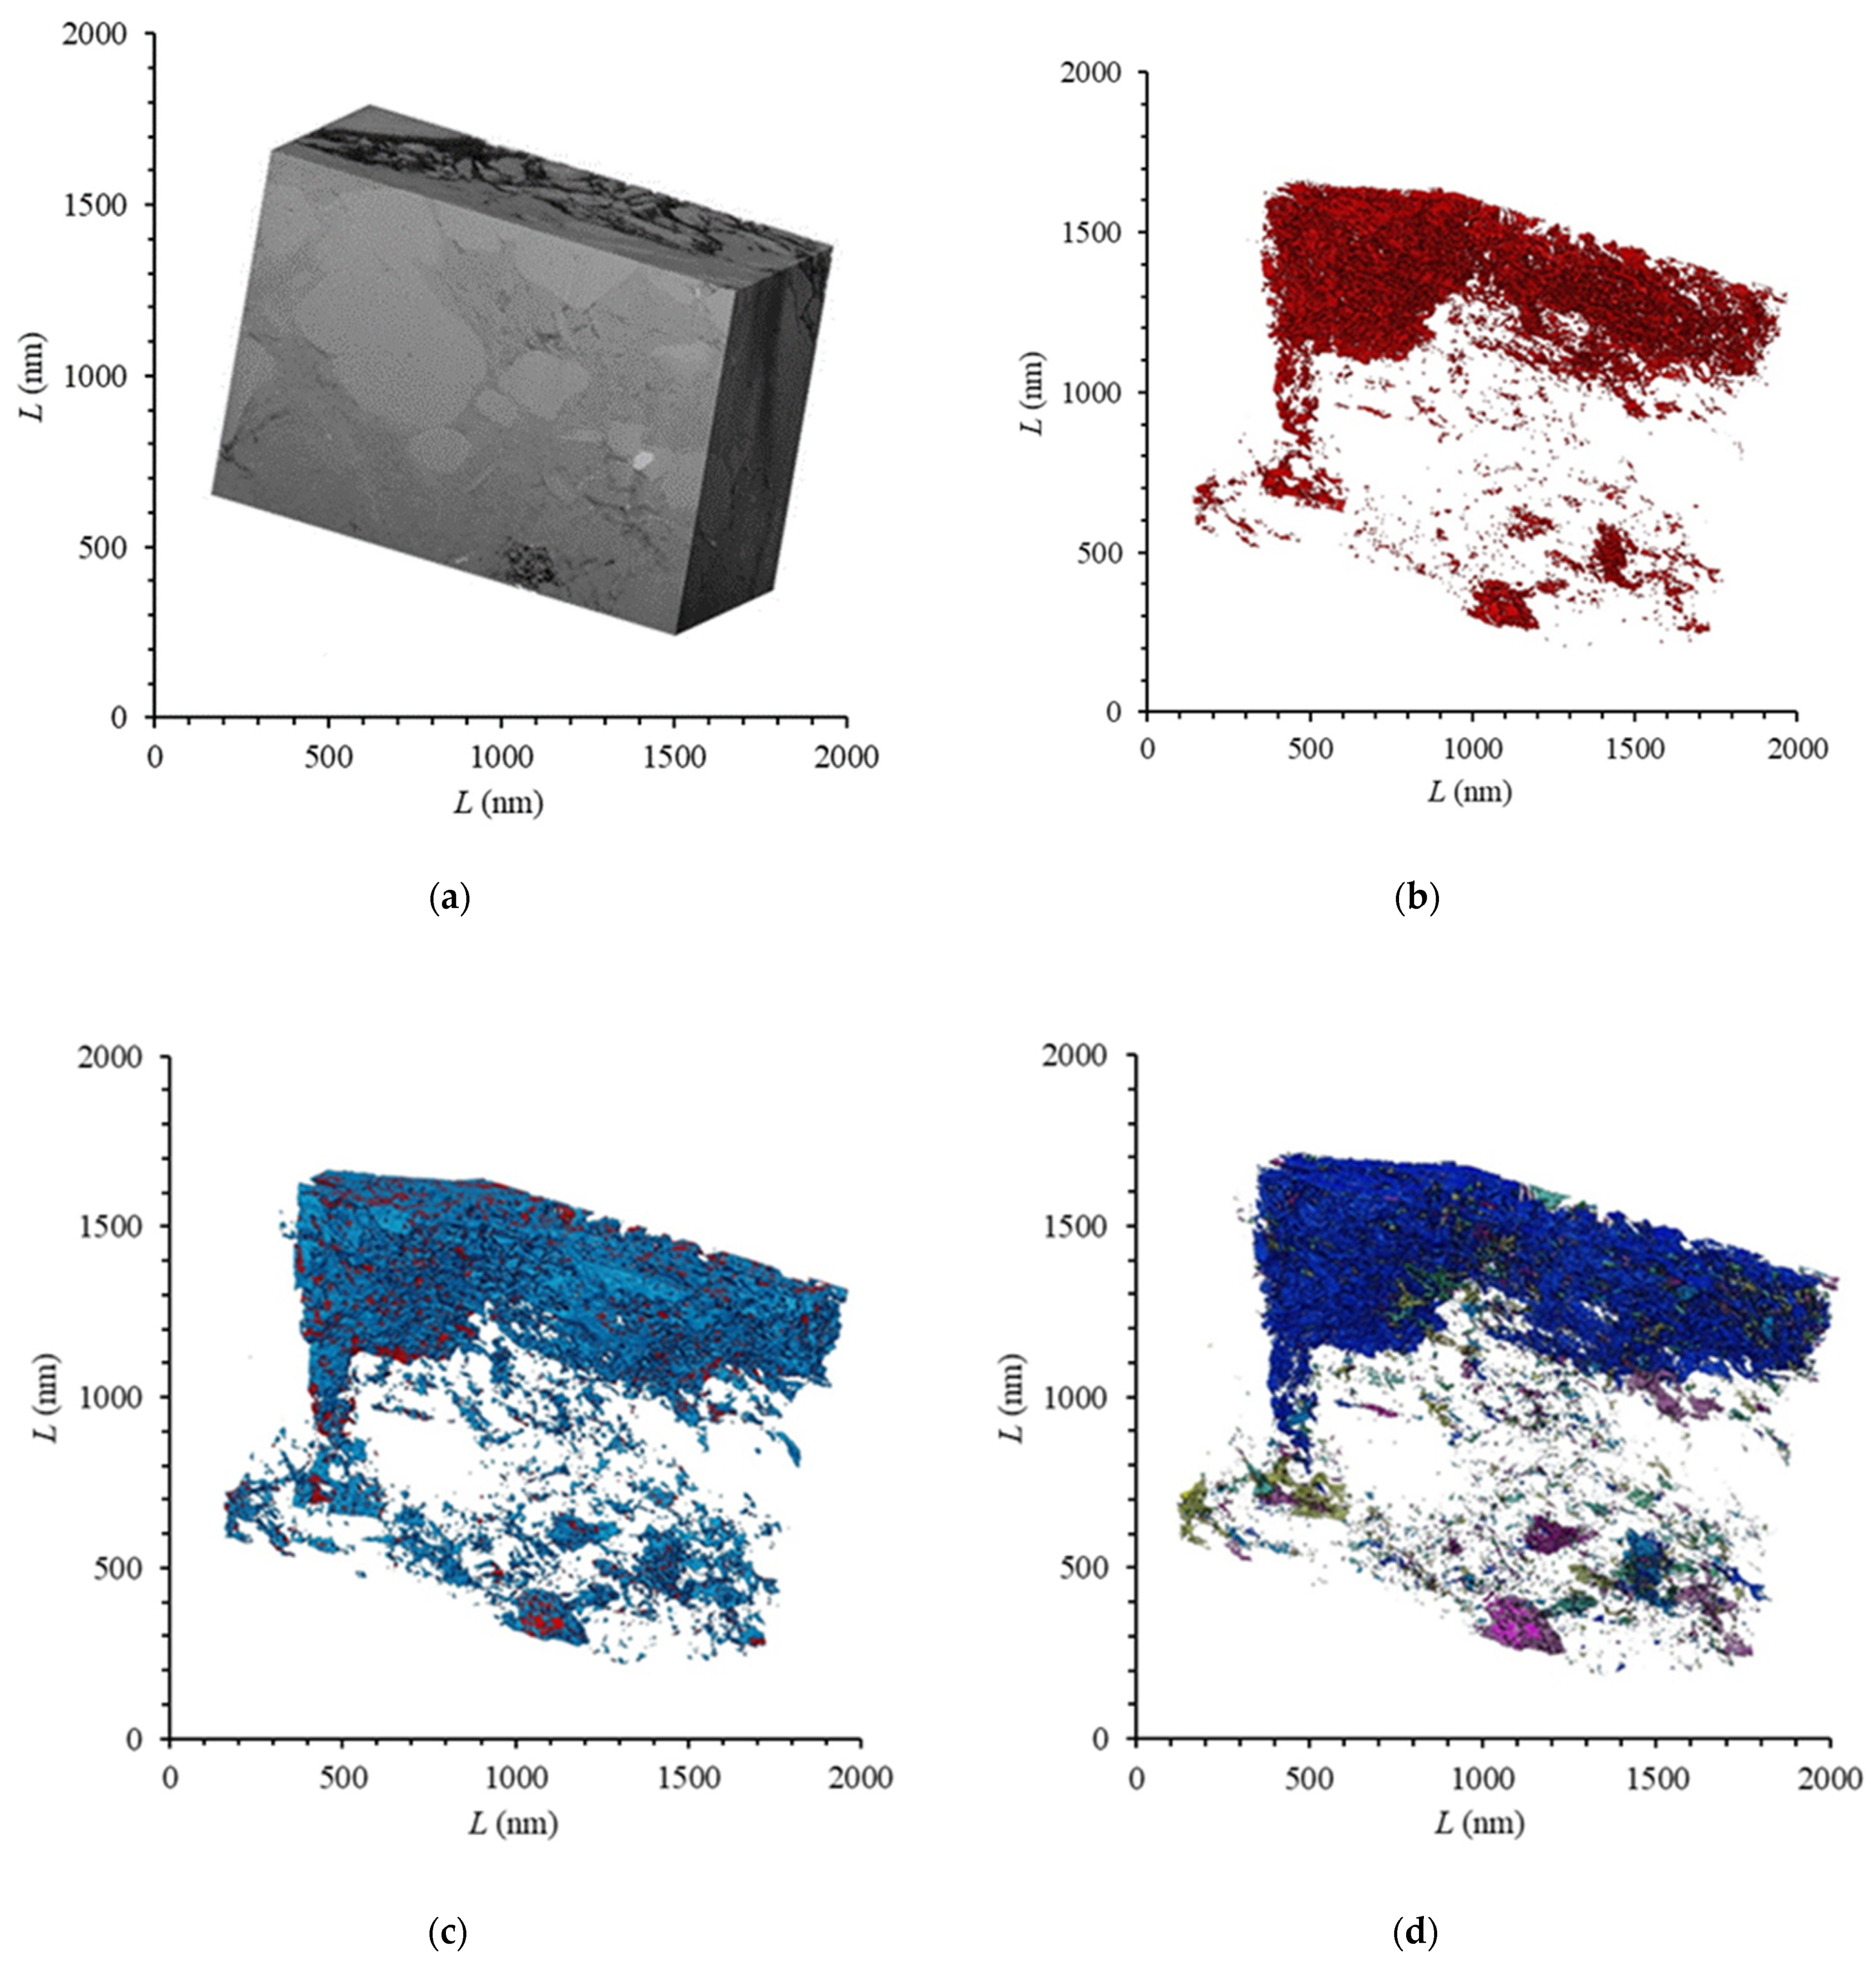
2.4. FIB-SEM Experiment

The FIB-SEM experiment was completed at the Experimental Center of China Petroleum Exploration Institute. Before the experiment, the sample surface was roughly polished with sandpaper and polishing solution, and then the sample was finely polished and carbonized using a 685C argon ion polishing instrument produced by Gatan Company. The polishing voltage was 3 kV, and the polishing time was 4 h. When the sample is not cut by the ion beam, the electron gun is perpendicular to the sample surface, and the ion gun is 38° to the sample surface. In this state, the sample surface can be scanned by high-resolution scanning electron microscopy. When the ion beam is used to cut the sample, the sample stage needs to be rotated by 52° so that the ion gun is perpendicular to the sample surface (XZ plane) and the electron beam is no longer perpendicular to the imaging surface (XY plane). When the ion beam is continuously cut along the Z direction, the electron beam will be continuously imaged so that the internal structure of the sample can be observed. After FIB-SEM cutting and imaging, 500 continuous images clearly showing the microscopic pore structure of shale were obtained with a resolution of 10 nm and a field of view of 20 × 20 × 10 μm. Avizo software was used to combine these images and three-dimensional reconstruction and analysis.

3. Results and Discussion

Shale pores can be divided into nanometer pores and micron pores. Different pores have different heterogeneity characteristics and contributions to porosity. Shale pores can also be divided into organic pores and inorganic pores, which show great differences in pore distribution characteristics.

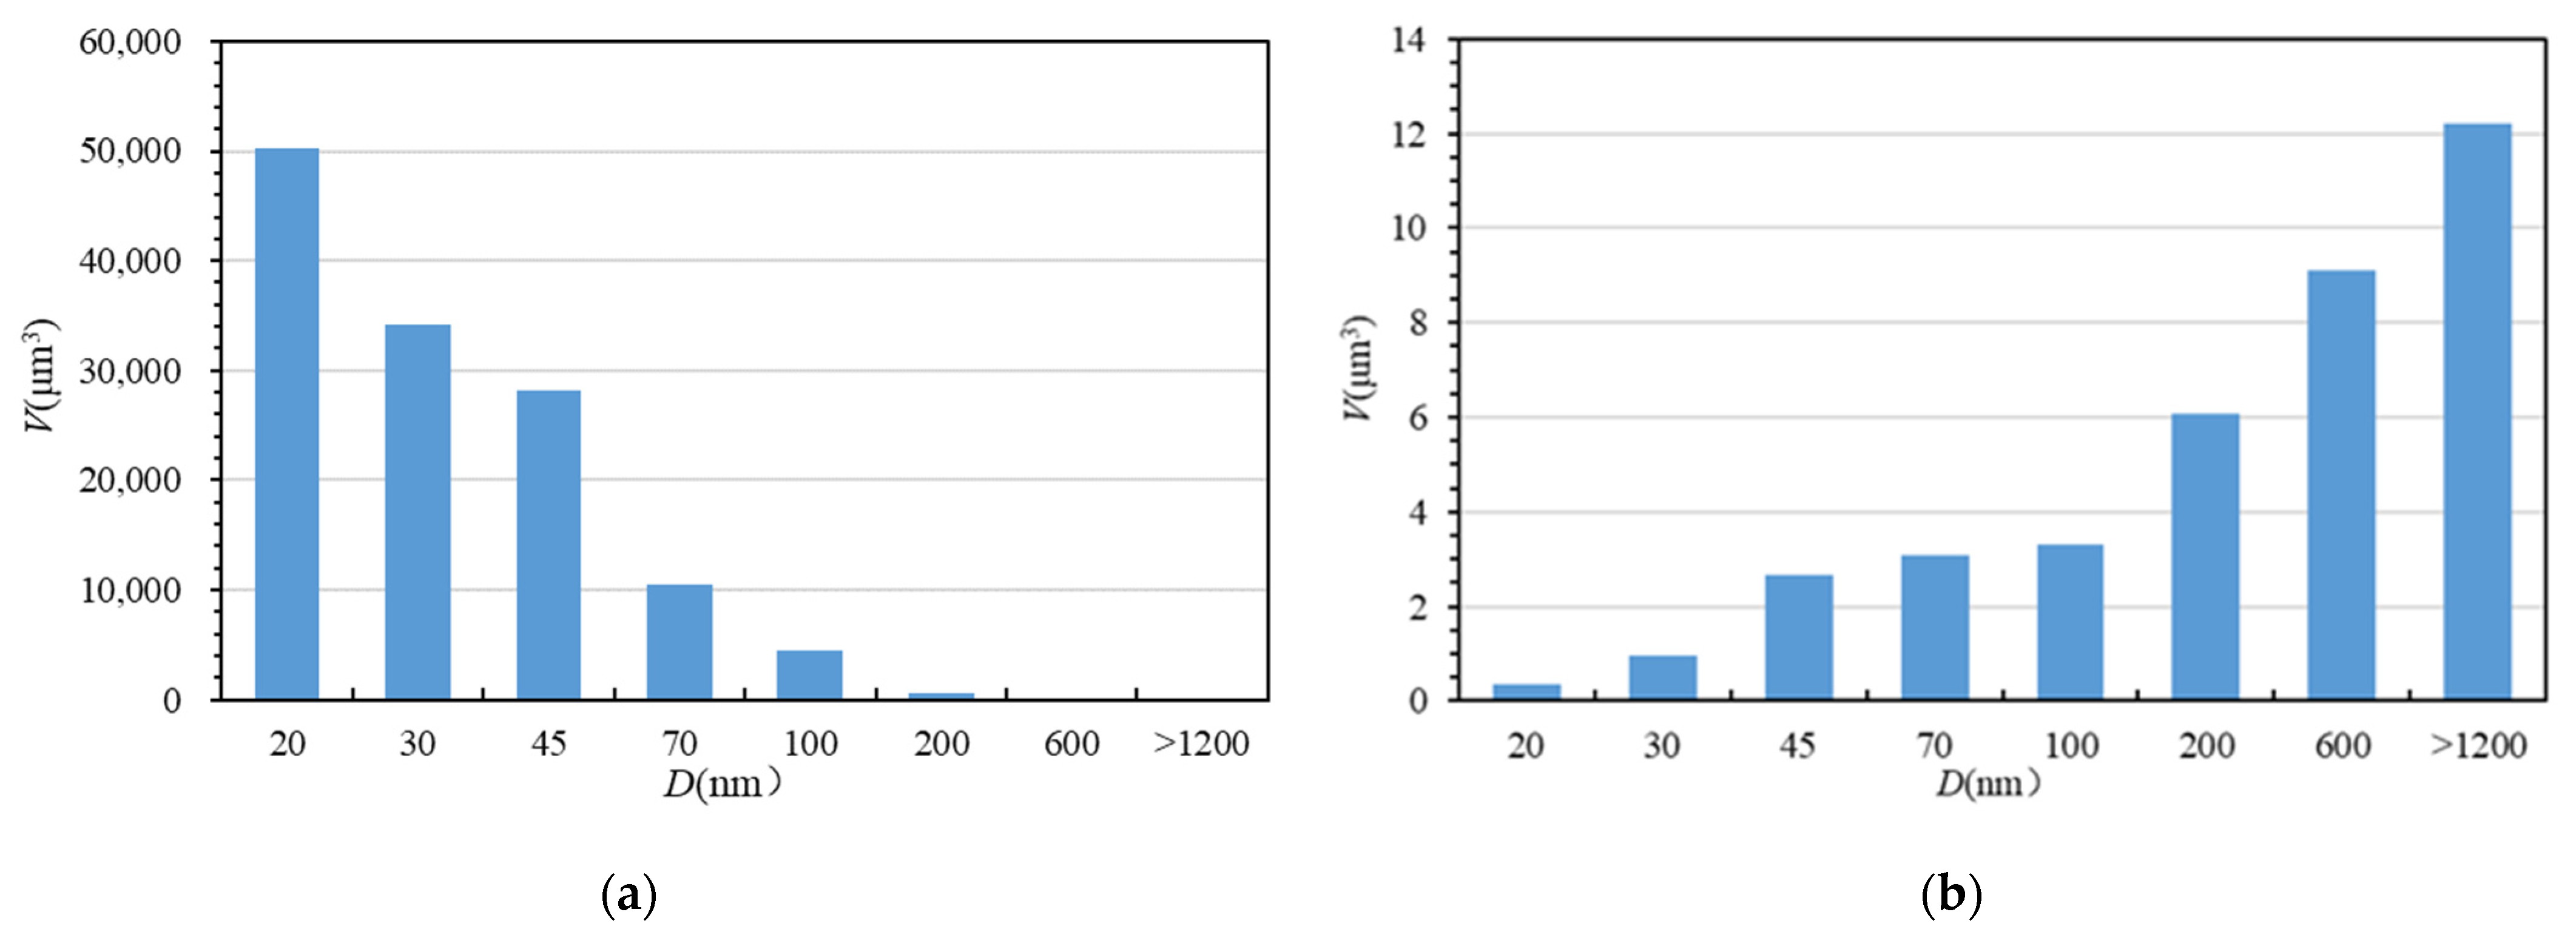
3.1. Micron Pore Distribution

Micro-CT imaging is based on density difference using grayscale to distinguish different components of the sample. Among them, the high-density components show bright gray to light gray (such as quartz, carbonate minerals, and clay minerals), low-density components show dark gray (such as organic matter), and pores (cracks) show black. The samples from the Longmaxi Formation were scanned by micro-CT technology. Red is used to represent shale pores, and blue is used to represent organic matter. The three-dimensional macroscopic pore distribution model of shale was obtained, as shown in Figure 2. The porosity of the sample calculated based on the experimental results was 1.24%. It can be seen from Figure 2 that the development degree of micron-level pores in the longitudinal direction presents strong heterogeneity. The pore morphology of the sample was analyzed, and the shape of the pores was found to be irregular, with the ellipsoid type being the most common. The development area was mainly distributed along the horizontal direction, which is consistent with the bedding direction, indicating that the main form of micron pores is the Lamellation fracture. Therefore, it can be seen that the distribution of shale micron pores in millimeter-scale samples shows heterogeneity horizontally and heterogeneity vertically.
Further analysis of the spatial correspondence between the distribution of organic matter and the distribution of micron-sized pores in shale showed that most of the micron-sized pores have a good correspondence with the distribution of organic matter. The reason may be that the main body of the Longmaxi Formation in the Luzhou area was a deep-water continental shelf sedimentary environment. The water body was relatively quiet and showed strong reducibility due to the blocking of the middle paleo-uplift in the surrounding Sichuan, which was very favorable for the development of organic matter and foliation. It is easy for organic matter to form pores during the later thermal evolution process. In the later formation uplift process, with the release of overpressure from inside the formation, it is easy to form fabric selective fractures (foliation cracks) along the direction of foliation. Therefore, the bedding seam and organic matter display good correspondence. Lamellation fractures play an important role in the development of shale oil and gas, and not only provide the reservoir space for shale gas but also effectively provide an advantageous channel for shale gas to flow from matrix pores into the bottom hole.

3.2. Nanoscale Pore Distribution

The pore size of the shale reservoir is very small, and the pore structure is complex. Shale gas generally exists in nanopores in adsorption and dissociative states. Therefore, it is of great significance to study the nanoscale pore structure of shale gas reservoirs for shale gas resource evaluation and reservoir forming mechanism research, and even shale gas exploration and development.

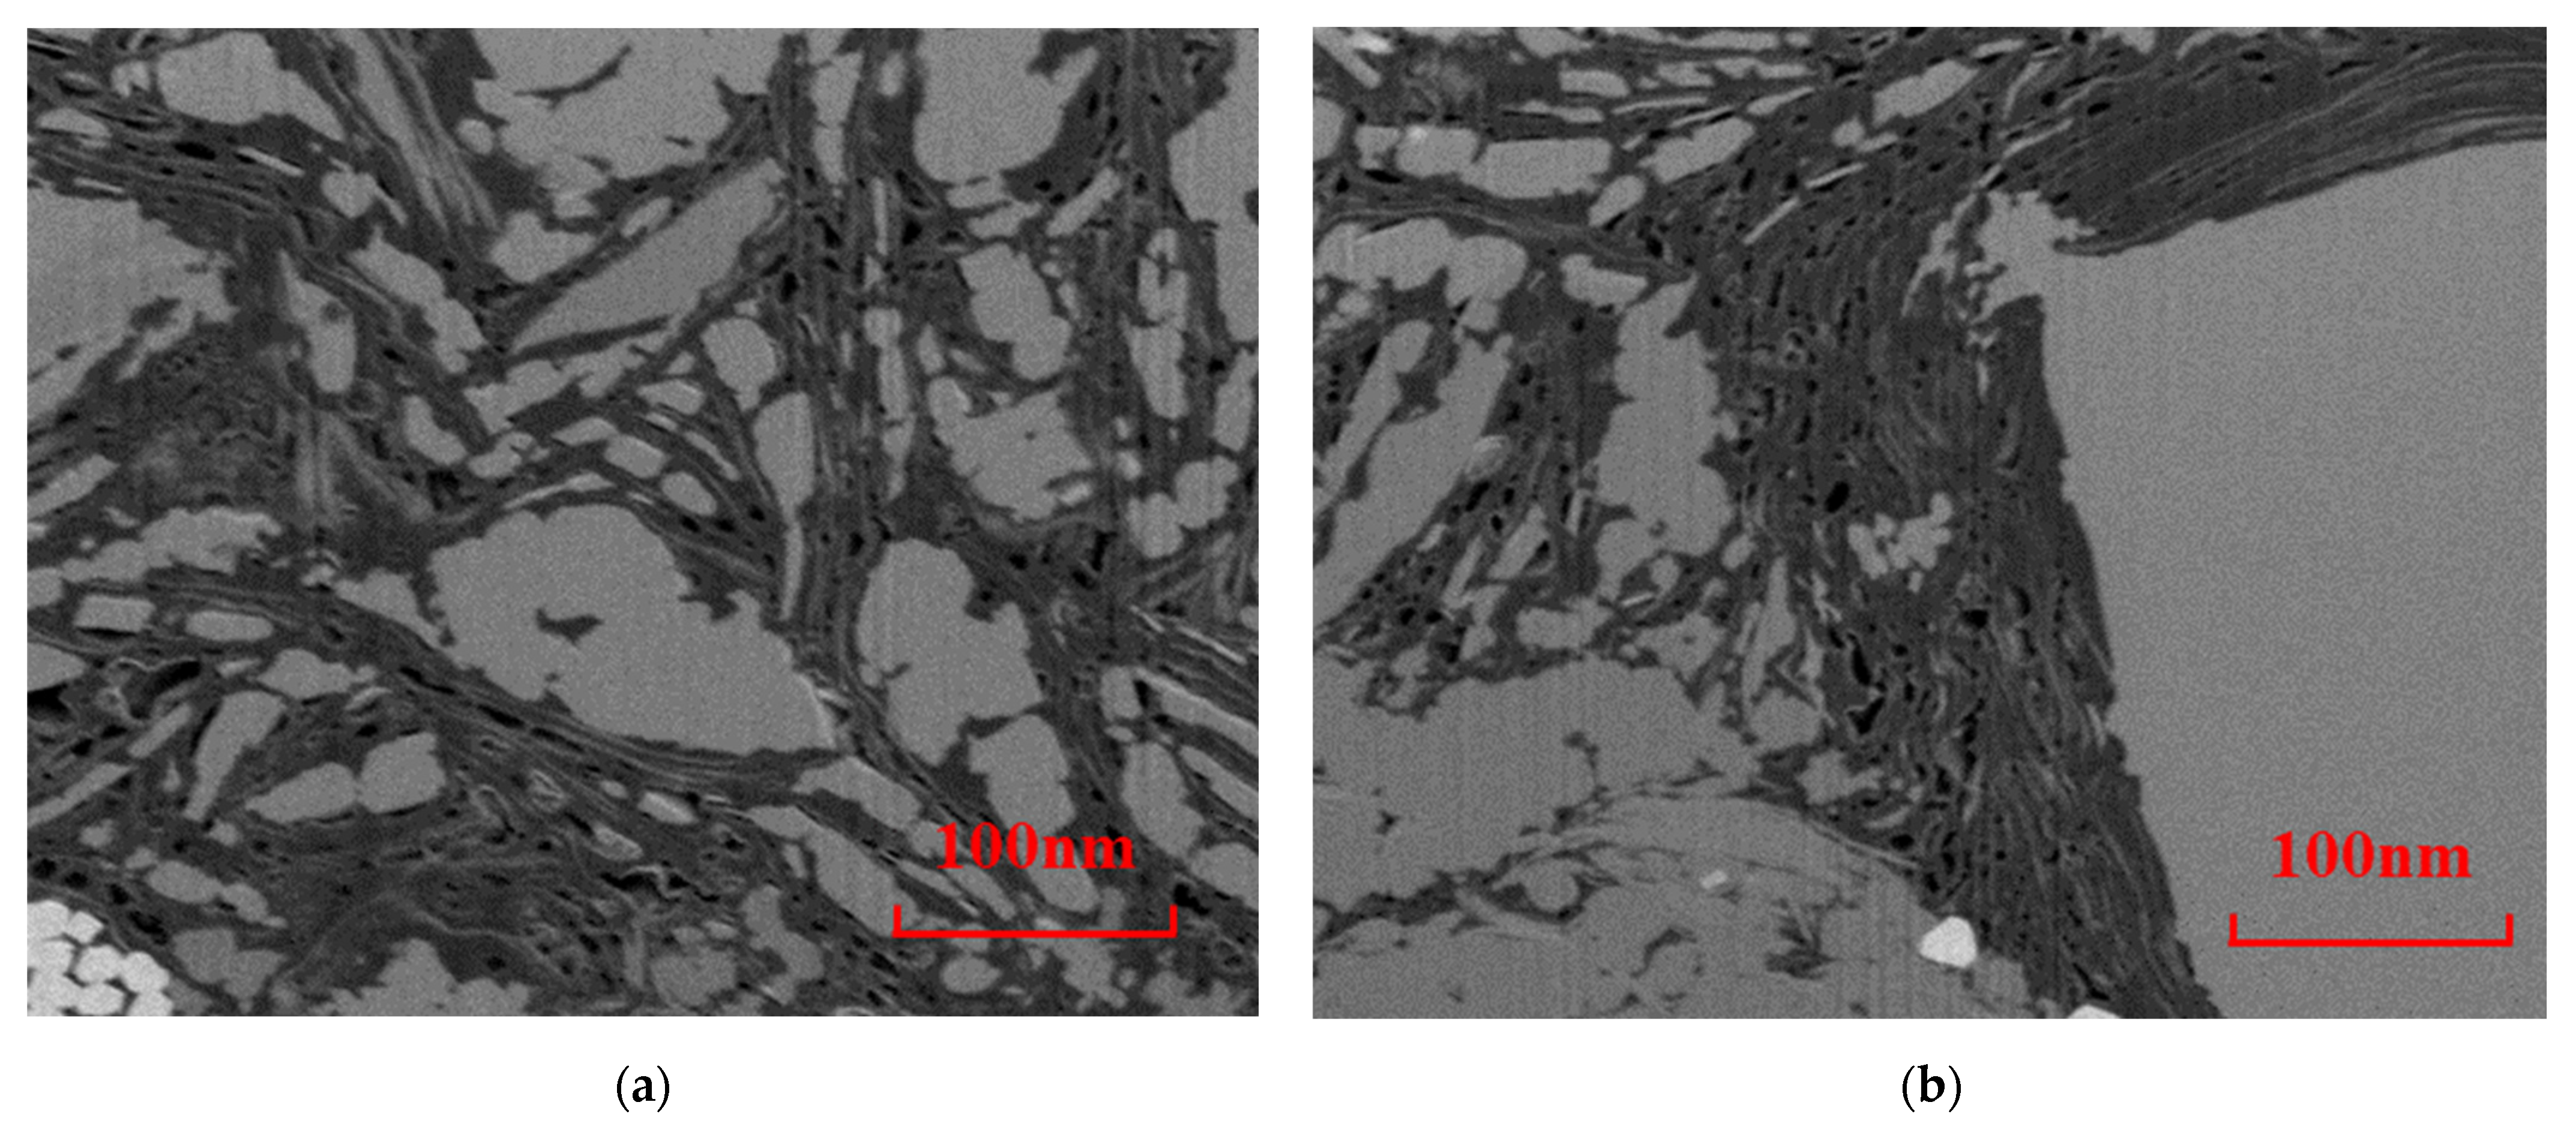
3.2.1. Analysis of FIB-SEM Results

In this experiment, the spatial distribution characteristics of organic matter pores in shale were demonstrated by cutting and imaging the organic matter particles in shale. A series of backscattered images of shale were obtained after 500 consecutive ion beam cuts and electron beam imaging. Each image represents a 20 nm thick layer of shale. The spatial distribution of the shale microstructure was reconstructed using 500 backscattered images (Figure 3a). The dimensions of the sample were 20 × 20 × 10 μm. Based on the results of the micro-CT experiments, the spatial distribution of shale pores has great heterogeneity in the longitudinal direction. Therefore, sample selection plays a vital role in characterizing the shale pore structure. For FIB-SEM with a small experimental area, the correct selection of shale area is very important.
As shown in Figure 4, there are two main types of pores in Longmaxi Formation shale. One type is honeycomb organic pores, which are widely developed inside the organic matter. The other type is fracture-type interface pores, developed at the boundary of organic matter and inorganic minerals, where organic matter pores and intergranular pores are developed. Images of the boundary area between organic matter pores and inorganic minerals were selected from the SEM series of slice images, and the three-dimensional reconstruction of the boundary’s structure was carried out to explore the pore space of the shale organic matter pore structure and inorganic mineral area.
As shown in Figure 3, FIB-SEM was used for the three-dimensional reconstruction of the experimental area. The FIB-SEM gray values of different components in shale were significantly different. For example, the gray value was low est for pores, and higher for organic matter, followed by inorganic minerals, while bright minerals such as pyrite had the highest gray values. The gray threshold values for organic matter and pores in each shale are set and adjusted to achieve the best matching effect with the real distribution, and then the organic matter and pores in the shale can be segmented and extracted (Figure 3c), where red represents shale pores and blue represents organic matter. The selection of the gray threshold image is largely subjective, which directly affects the results of subsequent data processing. However, the error caused by this subjectivity is unavoidable, and the threshold of each component can only be adjusted to the extent possible to minimize the associated error.
Based on the microstructure of shale and the three-dimensional distribution characteristics of extracted organic matter and pores (Figure 3), the pore distribution of the sample shows strong heterogeneity. The pores are mainly developed inside the organic matter network, and the organic matter shows wormhole-like interconnection. The porosity of the shale samples was 2.4%, and the porosity calculated in the organic matter network was as high as 16.1%, and the actual value may be even higher. In this experiment, due to limitations in the measurement accuracy, only pores with a pore size greater than 10 nm were considered, and, thus, no shale pores with a pore size less than 10 nm were measured, so this result may underestimate the porosity value in organic matter. The porosity of the inorganic mineral component development zone in the lower half of the sample was only 0.37%, which was much lower than that of the organic matter development zone. Therefore, in the research domain of the micron scale, due to the uneven distribution of organic matter and mineral components, the pore distribution shows strong heterogeneity.
While using Avizo software to obtain three-dimensional spatial distribution images of different components, the spatial position and volume of each component can also be quantitatively expressed. Assuming that the pore is a sphere, its diameter can be calculated based on the volume of a single pore, and the number and volume of pores in different diameter intervals can be counted, as shown in Figure 5. The pore size distribution was found to range between 10 nm and 2092 nm. Although the number of pores with a diameter between 20 nm and 100 nm was the largest, larger pores with a diameter greater than 200 nm contributed the most to the porosity (Figure 5). In comparison, the diameter of a single organic matter pore based on the two-dimensional observations (Figure 6) was between 30 nm and 150 nm, and the larger pores (diameter greater than 200 nm) may have resulted from aggregates of multiple organic matter pores, especially in the case of the largest pore with a diameter of 2092 nm. This also illustrates that organic matter pores are interconnected to form a pore network, as shown in Figure 3d. The organic matter pore network provides a good channel for gas migration in shale, and these organic matter pores also contribute greatly to the permeability of shale. However, a large number of organic pores with smaller pore sizes are attached to the periphery of larger pores. These smaller pores have a strong methane adsorption capacity and are the main space for adsorbed gas storage [34,35].

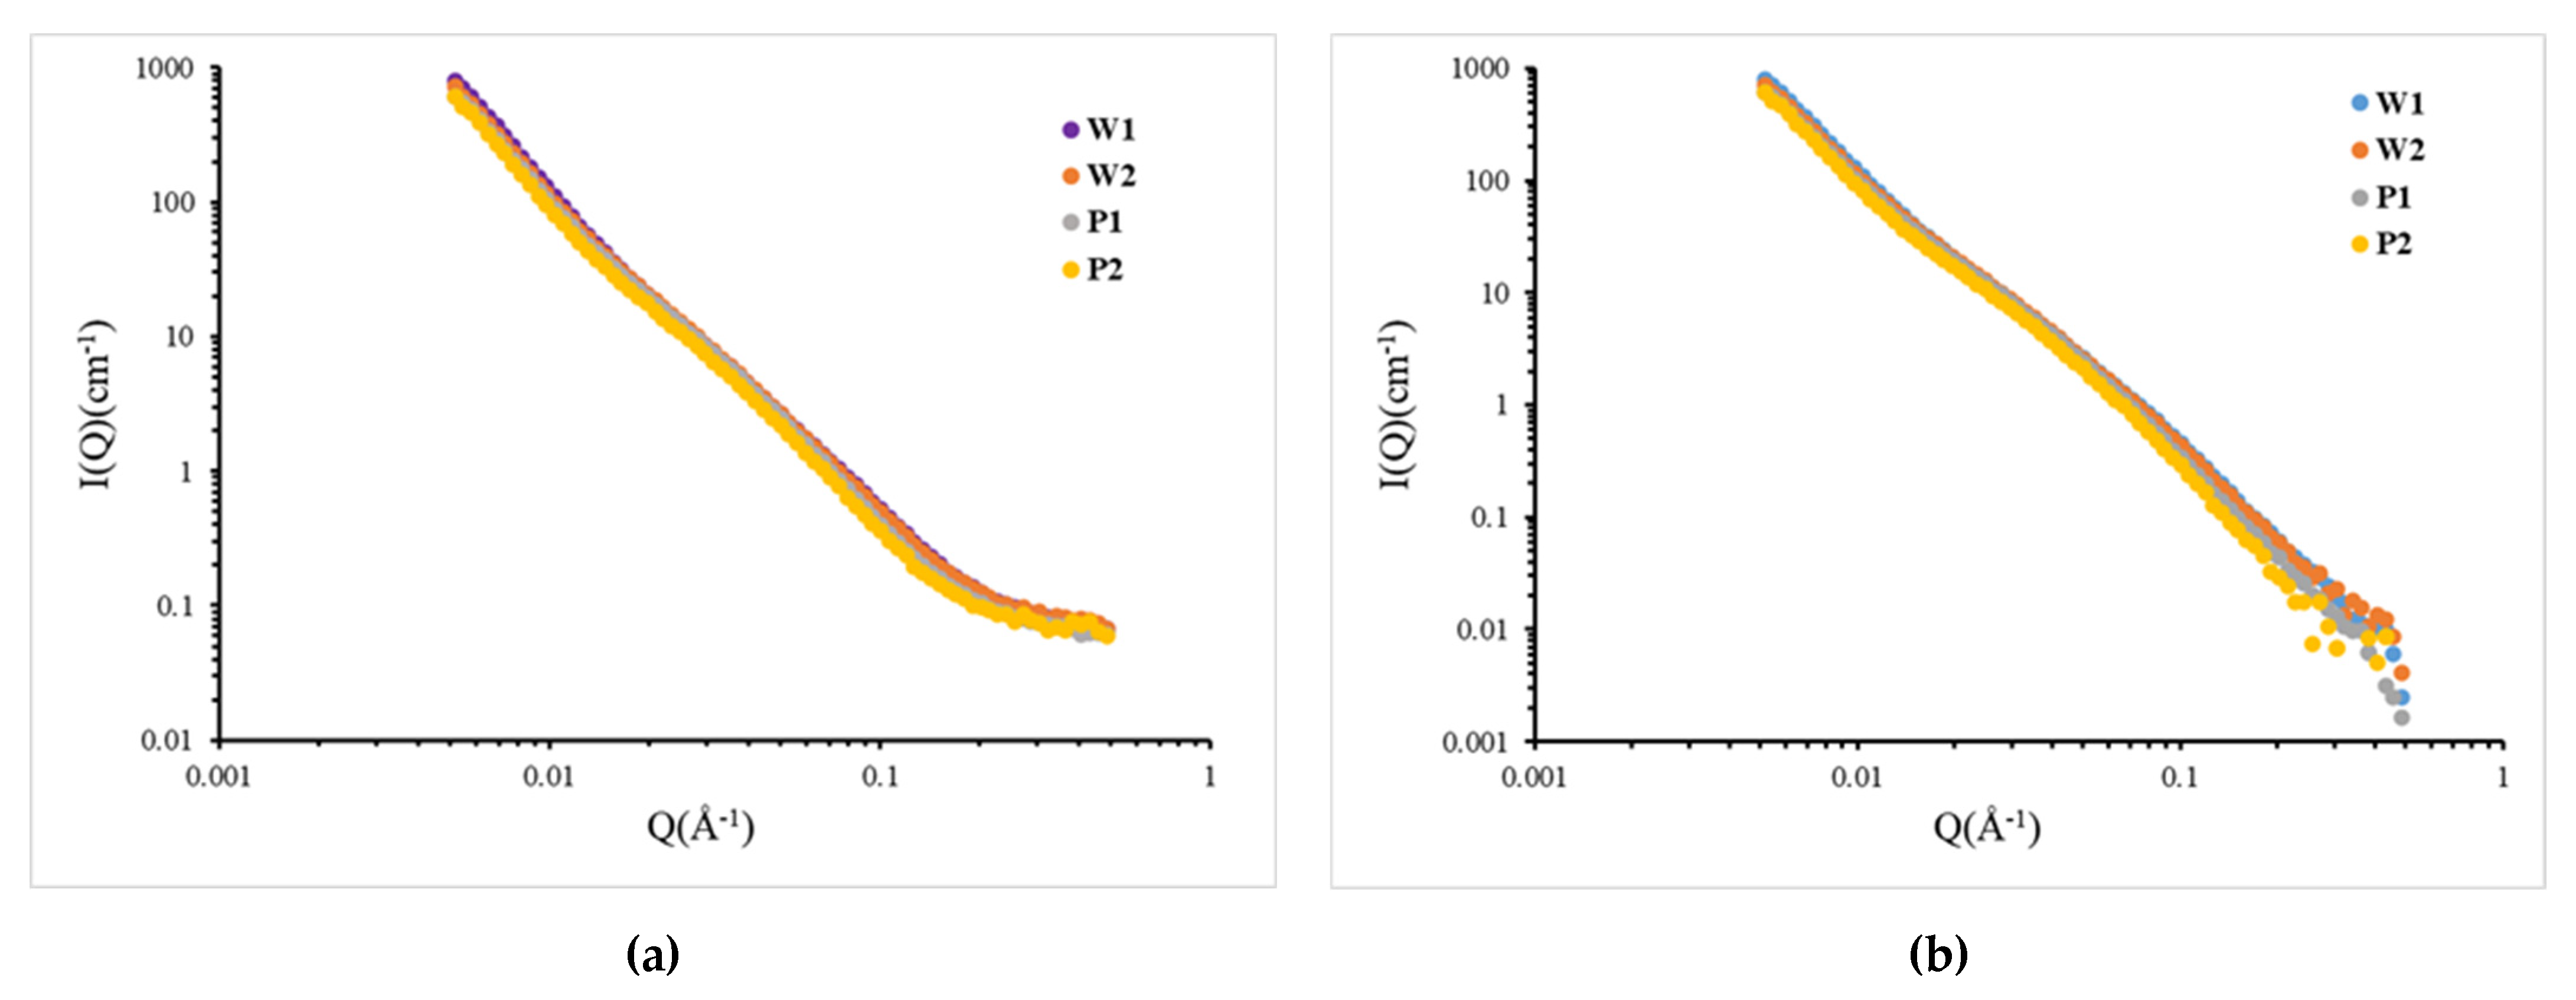
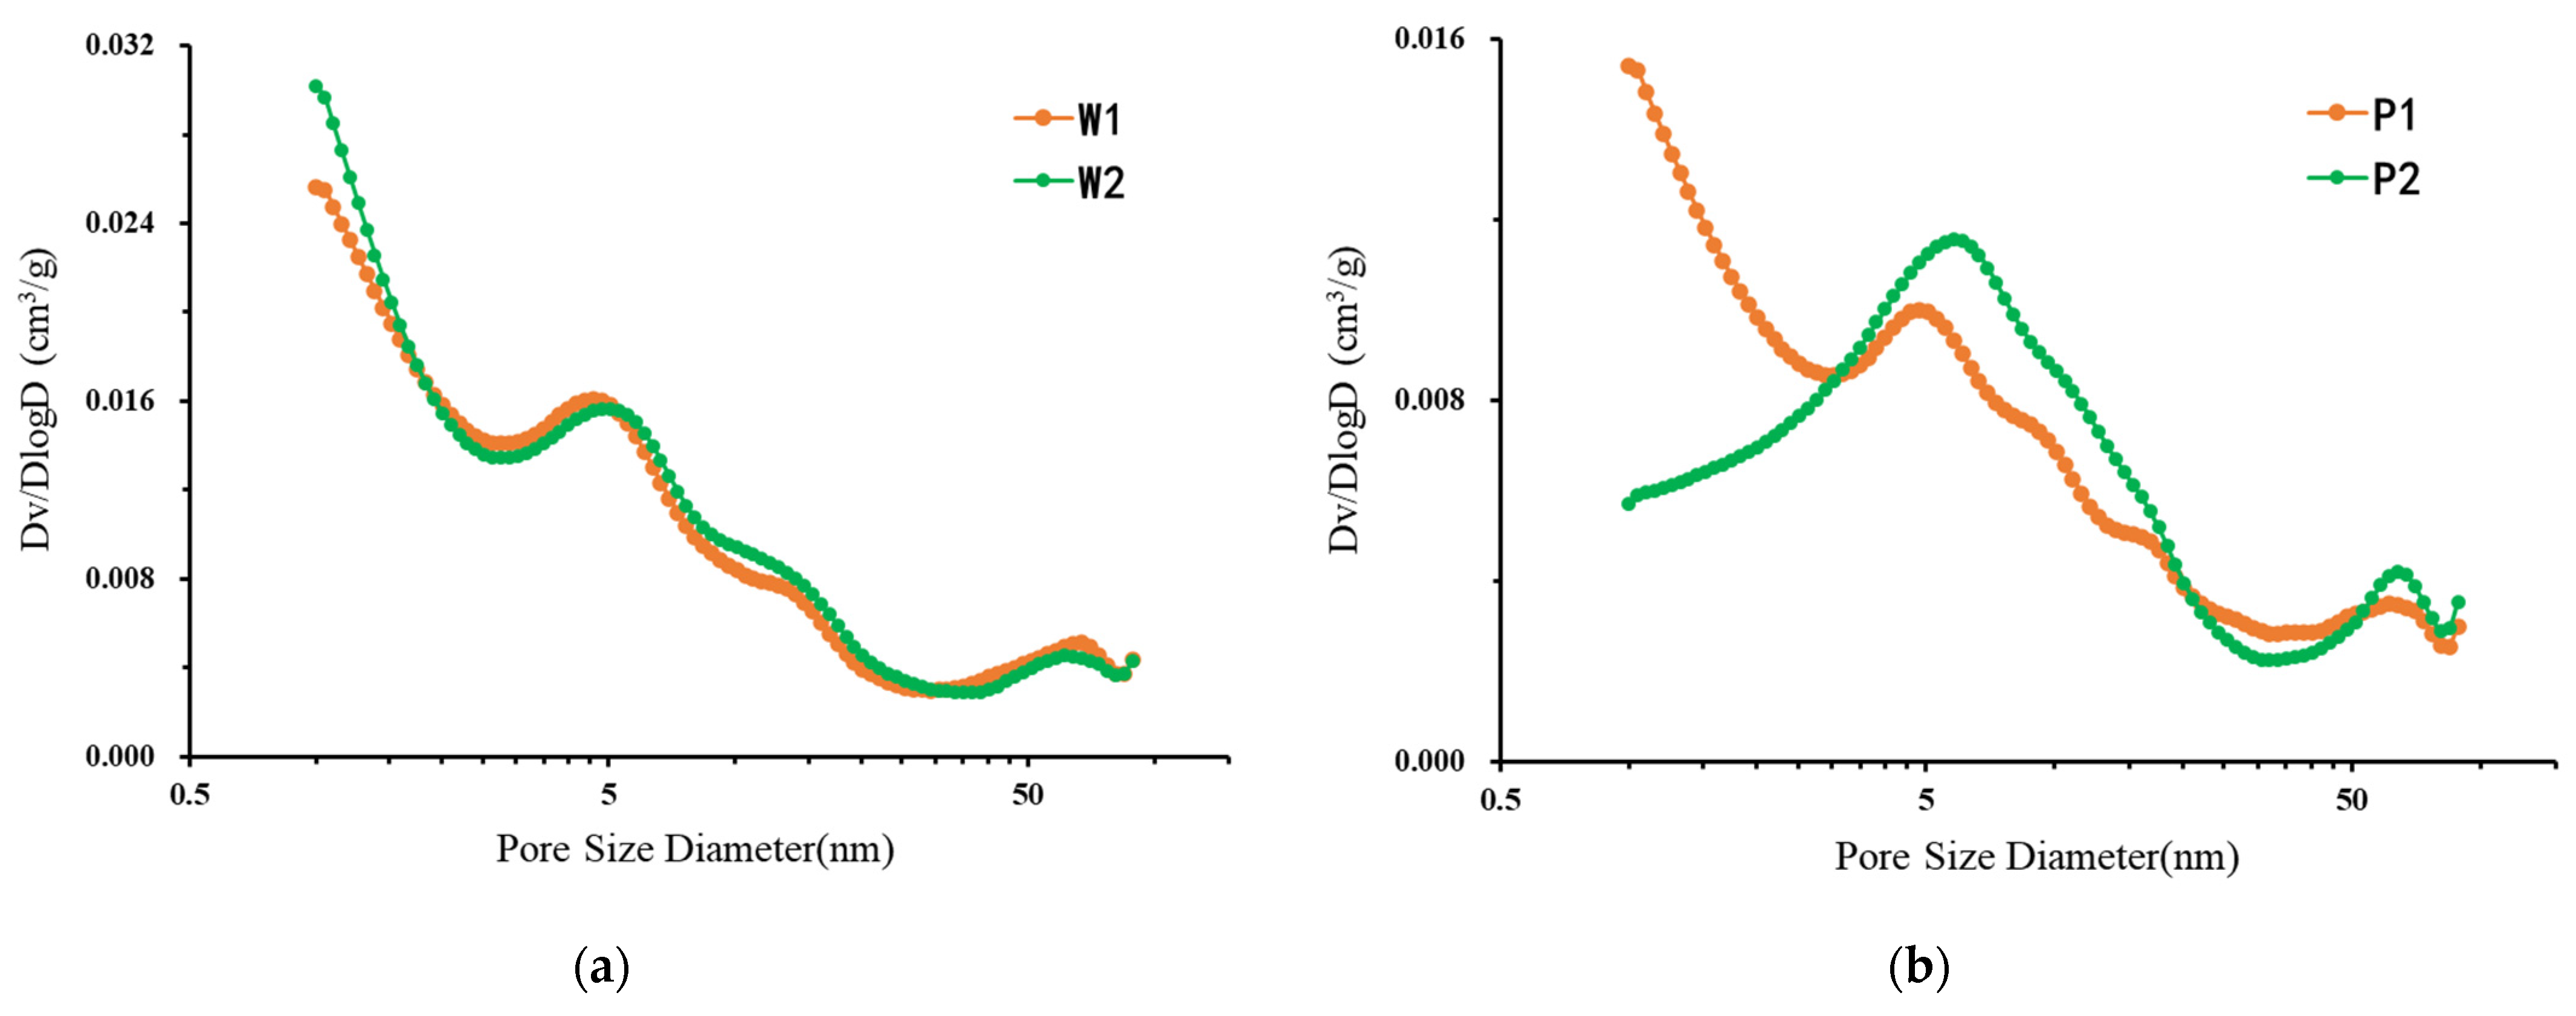
3.2.2. Analysis of SANS Results

Information on the composition of the samples is provided in Table 1, including total organic carbon (TOC) and mineral composition. The volume of each component in the sample is calculated based on its density.
Calculation of shale pore structure by SANS usually assumes that shale is a two-phase porous medium (i.e., pores and components). The SLD of shale components (including inorganic components and organic components) is obtained by the SLD volume average of each component (see Table 2), as shown in the following equation [36]:
S L D ( s h a l e ) = i n v o l % ( i ) S L D ( i ) 100
where i represents the component, and n represents the total number of components.
The SLD of shale organic components is calculated from the relationship between organic matter maturity and organic matter SLD proposed by Ruppert [30]. The calculated SLD of each shale sample is shown in Table 3.
The experimental samples W1 and W2 are positioned in the same layer of two different blocks. The thin sections taken from the vertical bedding were used in the experiment. A1 and A2 are the thin sections taken from different bedding planes within the experimental core. The SANS profiles of shale samples are shown in Figure 7a. Affected by the background signal, the scattering intensity of each scattering profile at Q = 0.5 Å−1 often obtains a “flat”, large Q background, which causes a deviation in the calculation of pore content of small aperture. This value comes from the background scattering interference of hydrogen atoms in shale samples, and the background quotation interference is calculated according to the weight percentage of each component in the sample.
Figure 7b shows the SANS section after the background values (Table 3) were subtracted from the original experimental data. After background subtraction, the SANS curves of the samples are shown to roughly follow the power-law correlation (I(Q) ~ Qp, where p is the Porod exponent), which is due to the fractal distribution of the pore size in shale [26,29,37,38]. The power index (D) can distinguish the fractal part and non-fractal part of shale [39]. When the power index (D) is between 3 and 4, this represents that shale conforms to the surface fractal, and its fractal dimension is equal to 6-D. If the power index (D) is less than 3, this represents that shale conforms to the mass fractal, and its fractal dimension is equal to D. The power index (D) of the four shale samples in this paper were all less than 3, so the fractal dimensions that were measured by SANS were all mass fractals. The fractal dimensions are presented in Table 3.
In the following analysis, we focused on the Q range 0.00515 to 0.58, corresponding to pore radii ranging from 1 to 100 nm. The SANS curve of shale samples was fitted by the non-negative least squares method, and then the porosity, pore number density (number of pores per unit volume), and pore size distribution were obtained using the polydisperse pore size distribution model (PDSM). The scattering intensity I(Q) in the PDSM model is defined as follows:
I ( Q ) = ( ρ 1 ρ 2 ) 2     P ( Q , r ) 2 F ( r ) V ( r ) 2   N Δ r
where ρ 1 and ρ 2 represent the SLD values of shale components and pores, and the SLD of pores is usually assumed to be 0; r represents shale pore radius; Q represents the shape factor of spherical pores with radius r ; F ( r ) represents the pore size distribution function of shale; V ( r ) represents the volume of spherical pores with radius r; and n represents the number of pores.
For the two-phase system (shale matrix and pores), porosity ( ) can be calculated by the equation using scattering contrast ( Δ ρ ) [36]:
0 Q 2 I ( Q ) d Q = 2 π 2 ( Δ ρ ) 2 ( 1 )
The physical parameters of the obtained shale samples are shown in Table 3. The pore size distributions (PSD)s (pore radii range from 1 to 100 nm) of the four shale samples are shown in Figure 8.
The PDSM porosity measured by samples W1 and W2 was 4.62% and 4.72%, respectively, reflecting the homogeneity of the lateral distribution of shale nanopores. From further analysis of the pore size distribution, as shown in Figure 8, it is obvious that the pore size distribution of samples W1 and W2 in the pore size range of 1–100 nm is essentially the same. This proves that the pore distribution of shale samples is the same in the horizontal direction at the sample scale (i.e., centimeter-level samples) applied in conventional laboratory core testing; that is, it reflects strong homogeneity. The distribution characteristics of shale micropores were analyzed in detail. Shale nanopores were found to be developed. Pores with a pore size range of 1–100 nm provide a large amount of pore space for shale, and their contribution to porosity reached 4.3%. A large number of pore spaces are concentrated in micropores and mesoporous regions with small space. The experimental samples were in the pore size range of 1–100 nm, and the median pore diameter was 3.78 nm on average (the median pore diameter refers to the pore size corresponding to 50% of the total pore volume value), which proves that the shale micropores are very developed. This also reflects the necessity of using SANS to study the micropores of shale. So far, SANS is the only research method that can be used to explore the total pore space of shale at the micro–nano scale with millimeter-scale samples.
Compared with the parallel samples in the longitudinal direction, the porosity of samples P1 and P2 was 3.51% and 3.42%, respectively, which seems to reflect that the nano-reservoir space of shale in the longitudinal direction is also homogeneous. However, the pore size distribution of samples P1 and P2 was further analyzed. As shown in Figure 8, the pore size distribution in the range of 1–100 nm is quite different, which indicates that the nanoscale pore space is strongly heterogeneous in the millimeter-scale size in the longitudinal direction, and the pore size distribution is also quite different. Micropores and small aperture mesopores were developed in sample P1, while mesopores were mainly developed in sample P2. This difference could be further quantitatively studied through SANS experimental data. The distribution curves of the P1 and P2 samples in the small-aperture region intersected at 2.85 nm. The pore volume of the P1 sample was 167.8% of the pore volume of the P2 sample in the pore size range of 1–2.85 nm, while the pore volume of the P1 sample was only 79.8% of the pore volume of the P2 sample in the pore size range of 2.85–22.3 nm, which more intuitively reflects the vertical heterogeneity of the shale pore space distribution.
Although the pore size distribution of samples P1 and P2 was quite different, the pore size distribution of 20 μm thin sections within the same sample was similar. The pore size distribution of the two groups of samples was quite different except for in the microporous area. The trend of the pore size distribution curve in the mesoporous and macropore areas was roughly the same, and there was a pore enrichment at about 5 nm. The reason for this result may be that the micropores of shale are mainly organic pores. Therefore, when the characteristics of organic matter, such as thermal maturity, are similar, the development of micropores is consistent with that of organic matter. Combined with the above experimental results of micro-CT, it can be observed that the development of organic matter in shale is along the horizontal bedding direction, and the TOC content of P1 is greater than that of P2. Therefore, in the two shale parallel bedding samples selected in this experiment, P1 may contain more layered organic matter than P2, resulting in the content of P1 micropores being much larger than that of P2, and the difference between mesopores and macropores was only 2 cm in the longitudinal direction. The sedimentary tectonic movement received in the two samples was the same, so the distribution of pores is roughly the same.

3.3. Implications of Heterogeneity in Shale Pore Distribution Research

The method of selecting the sample and sample size will greatly influence the determination of shale pore distribution by different measurement methods. For the same complete shale samples, due to the heterogeneity of the shale pore distribution, testing at different sampling locations may produce different results. Therefore, how to select and prepare representative rock samples is of great significance.
For example, helium injection, SANS, mercury injection, nuclear magnetic resonance, and micro-CT were all used to study the pore distribution of shale samples at the millimeter level, as shown in Figure 2 and Figure 4, in which the pore distribution of shale shows homogeneity in the horizontal direction and heterogeneity in the vertical direction. Therefore, when the same sample is measured by multiple means, parallel samples should be selected and prepared from the same layer from adjacent areas within a reasonable range. Especially for experiments that require the preparation of flake samples such as SANS, it is suggested that the preparation of flake samples is along the vertical bedding direction. In addition, when the sample selection itself is relatively small, such as for FIB-SEM, nano-CT, and other research methods that use micron-level samples, because the shale pores are strongly heterogeneous in the micro-region, the sample size will have a significant impact on the experimental results. Therefore, supplementary methods such as FIB-SEM and nano-CT should be included in the experiment to conduct a detailed analysis of the micro-region. For example, in this paper, FIB-SEM was used to analyze the development of shale organic matter pores.

4. Conclusions

In this paper, micro-CT technology, FIB-SEM technology, and SANS technology were used to jointly explore the heterogeneity of shale pore distribution.
  • The distribution of micron-sized pores in shale with rich bedding structure of high-quality reservoirs shows strong heterogeneity in the vertical direction, and its form is dominated by bedding fractures distributed along the bedding and consistent with the distribution of organic matter. They not only provide 1.24% of shale porosity but also provide shale with a dominant channel for gas flow.
  • The distribution of nanopores in shale reservoirs shows strong heterogeneity at the micron scale. At the micron scale, organic matter, inorganic minerals, and clay are irregularly arranged. Among them, the porosity in organic matter is as high as 16.1%, while the porosity in the mineral component development area is only 0.37%.
  • Shale pore space is mainly concentrated in nanoscale pores, and 1–100 nm pore size pores can provide 4.3% of the shale porosity, which is much higher than the 1.24% porosity provided by that of pore micron space. In this paper, a SANS experiment was used to quantitatively characterize for the first time the strong heterogeneity of nanopore distribution in the transverse direction and the strong heterogeneity in the longitudinal direction in a millimeter sample.
  • For the commonly used millimeter-level experimental samples, the nano–micro pore distribution of shale reflects the horizontal homogeneity and the vertical heterogeneity. Among the shale samples adjacent to the same bedding position, the pore difference is only 0.1%, and the pore size distribution is basically the same. Therefore, it is suggested that when parallel samples are used in the study of the pore structure of shale reservoirs in the laboratory, the parallel samples should be adjacent samples within the same layer.

Author Contributions

Writing—original draft preparation, H.Z.; resources, X.L. and J.Z.; funding acquisition, Z.H.; methodology, X.L.; software, F.F.; investigation, F.F. All authors have read and agreed to the published version of the manuscript.

Funding

This research was funded by the Demonstration Project of the National Science and Technology Major Project of the Ministry of Science and Technology of China (No. 2016ZX05062−002−001) and the General Program of Chongqing Natural Science Foundation (No. cstc2020jcyj-msxmX0659).

Acknowledgments

The authors sincerely thank the China Spallation Neutron Source for its small-angle neutron scattering experiment. The authors would like to thank LetPub (www.letpub.com accessed on 7 December 2021) for its linguistic assistance during the preparation of this manuscript.

Conflicts of Interest

The authors declare no conflict of interest.

References

  1. Chen, L.; Lu, Y.; Jiang, S.; Li, J.; Guo, T.; Luo, C. Heterogeneity of the Lower Silurian Longmaxi Marine Shale in the Southeast Sichuan Basin of China. Mar. Pet. Geol. 2015, 65, 232–246. [Google Scholar] [CrossRef]
  2. Tang, X.; Jiang, S.; Jiang, Z.; Li, Z.; He, Z.; Long, S.; Zhu, D. Heterogeneity of Paleozoic Wufeng-Longmaxi Formation Shale and Its Effects on the Shale Gas Accumulation in the Upper Yangtze Region, China. Fuel 2019, 239, 387–402. [Google Scholar] [CrossRef]
  3. Wang, Z.; Jin, X.; Wang, X.; Sun, L.; Wang, M. Pore-Scale Geometry Effects on Gas Permeability in Shale. J. Nat. Gas Sci. Eng. 2016, 34, 948–957. [Google Scholar] [CrossRef]
  4. Zhang, L.; Li, B.; Jiang, S.; Xiao, D.; Lu, S.; Zhang, Y.; Gong, C.; Chen, L. Heterogeneity Characterization of the Lower Silurian Longmaxi Marine Shale in the Pengshui Area, South China. Int. J. Coal Geol. 2018, 195, 250–266. [Google Scholar] [CrossRef]
  5. Li, L.; Huang, B.; Tan, Y.; Deng, X.; Li, Y.; Zheng, H. Geometric Heterogeneity of Continental Shale in the Yanchang Formation, Southern Ordos Basin, China. Sci. Rep. 2017, 7, 6006. [Google Scholar] [CrossRef] [Green Version]
  6. Sun, J.; Dong, X.; Wang, J.; Schmitt, D.R.; Xu, C.; Mohammed, T.; Chen, D. Measurement of Total Porosity for Gas Shales by Gas Injection Porosimetry (GIP) Method. Fuel 2016, 186, 694–707. [Google Scholar] [CrossRef]
  7. Liu, D.; Cheng, L.; Sun, J.; Zhang, B.; Li, J.; Yang, W.; Zheng, A. Pan Connected Characteristics and Occurrence Modes of Gas in Shale Reservoirs. Acta Pet. Sin. 2021, 42, 1192–1201. [Google Scholar] [CrossRef]
  8. Liu, H.; Zhang, S.; Song, G.; Zhang, S.; Hao, X.; Xie, Z.; Xu, N.; Liu, P. A Discussion on the Origin of Shale Reservoir Inter-Laminar Fractures in the Shahejie Formation of Paleogene, Dongying Depression. J. Earth Sci. 2017, 28, 1064–1077. [Google Scholar] [CrossRef]
  9. Li, J.; Zhang, P.; Lu, S.; Chen, C.; Xue, H.; Wang, S.; Li, W. Scale-Dependent Nature of Porosity and Pore Size Distribution in Lacustrine Shales: An Investigation by BIB-SEM and X-Ray CT Methods. J. Earth Sci. 2019, 30, 823–833. [Google Scholar] [CrossRef]
  10. Wu, Y.; Misra, S.; Sondergeld, C.; Curtis, M.; Jernigen, J. Machine Learning for Locating Organic Matter and Pores in Scanning Electron Microscopy Images of Organic-Rich Shales. Fuel 2019, 253, 662–676. [Google Scholar] [CrossRef]
  11. Cui, Z.; Han, W. In Situ Scanning Electron Microscope (SEM) Observations of Damage and Crack Growth of Shale. Microsc. Microanal. 2018, 24, 107–115. [Google Scholar] [CrossRef] [PubMed]
  12. Garum, M.; Glover, P.W.J.; Lorinczi, P.; Drummond-Brydson, R.; Hassanpour, A. Micro- And Nano-Scale Pore Structure in Gas Shale Using Xμ-CT and FIB-SEM Techniques. Energy Fuels 2020, 34, 12340–12353. [Google Scholar] [CrossRef]
  13. Kim, T.W.; Yun, W.; Kovscek, A.R. Application of Digital Volume Correlation to X-Ray Computed Tomography Images of Shale. Energy Fuels 2020, 34, 13636–13649. [Google Scholar] [CrossRef]
  14. Guo, X.; Shen, Y.; He, S. Quantitative Pore Characterization and the Relationship between Pore Distributions and Organic Matter in Shale Based on Nano-CT Image Analysis: A Case Study for a Lacustrine Shale Reservoir in the Triassic Chang 7 Member, Ordos Basin, China. J. Nat. Gas Sci. Eng. 2015, 27, 1630–1640. [Google Scholar] [CrossRef]
  15. Ma, T.; Chen, P. Study of Meso-Damage Characteristics of Shale Hydration Based on CT Scanning Technology. Pet. Explor. Dev. 2014, 41, 249–256. [Google Scholar] [CrossRef]
  16. Sun, Y.; Zhao, Y.; Yuan, L. Quantifying Nano-Pore Heterogeneity and Anisotropy in Gas Shale by Synchrotron Radiation Nano-CT. Microporous Mesoporous Mater. 2018, 258, 8–16. [Google Scholar] [CrossRef]
  17. Liu, S.; Sun, L.; Gao, J.; Li, K. A Fast Curtain-Removal Method for 3D FIB-SEM Images of Heterogeneous Minerals. J. Microsc. 2018, 272, 3–11. [Google Scholar] [CrossRef]
  18. Zhou, S.; Yan, G.; Xue, H.; Guo, W.; Li, X. 2D and 3D Nanopore Characterization of Gas Shale in Longmaxi Formation Based on FIB-SEM. Mar. Pet. Geol. 2016, 73, 174–180. [Google Scholar] [CrossRef]
  19. Tong, S.; Dong, Y.; Zhang, Q.; Elsworth, D.; Liu, S. Quantitative Analysis of Nanopore Structural Characteristics of Lower Paleozoic Shale, Chongqing (Southwestern China): Combining FIB-SEM and NMR Cryoporometry. Energy Fuels 2017, 31, 13317–13328. [Google Scholar] [CrossRef]
  20. Mastalerz, M.; He, L.; Melnichenko, Y.B.; Rupp, J.A. Porosity of Coal and Shale: Insights from Gas Adsorption and SANS/USANS Techniques. Energy Fuels 2012, 26, 5109–5120. [Google Scholar] [CrossRef]
  21. Gu, X.; Cole, D.R.; Rother, G.; Mildner, D.F.R.; Brantley, S.L. Pores in Marcellus Shale: A Neutron Scattering and FIB-SEM Study. Energy Fuels 2015, 29, 1295–1308. [Google Scholar] [CrossRef]
  22. Yang, R.; He, S.; Hu, Q.; Sun, M.; Hu, D.; Yi, J. Applying SANS Technique to Characterize Nano-Scale Pore Structure of Longmaxi Shale, Sichuan Basin (China). Fuel 2017, 197, 91–99. [Google Scholar] [CrossRef]
  23. Zhang, J.; Cheng, G. Technical Aspects of the Pore Structure in Shale Measured by Small-Angle and Ultrasmall-Angle Neutron Scattering: A Mini Review. Energy Fuels 2021, 35, 1957–1965. [Google Scholar] [CrossRef]
  24. Liu, K.; Ostadhassan, M.; Sun, L.; Zou, J.; Yuan, Y.; Gentzis, T.; Zhang, Y.; Carvajal-Ortiz, H.; Rezaee, R. A Comprehensive Pore Structure Study of the Bakken Shale with SANS, N2 Adsorption and Mercury Intrusion. Fuel 2019, 245, 274–285. [Google Scholar] [CrossRef]
  25. King, H.E.; Eberle, A.P.R.; Walters, C.C.; Kliewer, C.E.; Ertas, D.; Huynh, C. Pore Architecture and Connectivity in Gas Shale. Energy Fuels 2015, 29, 1375–1390. [Google Scholar] [CrossRef]
  26. Bahadur, J.; Radlinski, A.P.; Melnichenko, Y.B.; Mastalerz, M.; Schimmelmann, A. Small-Angle and Ultrasmall-Angle Neutron Scattering (SANS/USANS) Study of New Albany Shale: A Treatise on Microporosity. Energy Fuels 2015, 29, 567–576. [Google Scholar] [CrossRef] [Green Version]
  27. Neil, C.W.; Hjelm, R.P.; Hawley, M.E.; Watkins, E.B.; Cockreham, C.; Wu, D.; Mao, Y.; Fischer, T.B.; Stokes, M.R.; Xu, H. Small-Angle Neutron Scattering (SANS) Characterization of Clay- and Carbonate-Rich Shale at Elevated Pressures. Energy Fuels 2020, 34, 8178–8185. [Google Scholar] [CrossRef]
  28. Bahadur, J.; Melnichenko, Y.B.; Mastalerz, M.; Furmann, A.; Clarkson, C.R. Hierarchical Pore Morphology of Cretaceous Shale: A Small-Angle Neutron Scattering and Ultrasmall-Angle Neutron Scattering Study. Energy Fuels 2014, 28, 6336–6344. [Google Scholar] [CrossRef]
  29. Clarkson, C.R.; Solano, N.; Bustin, R.M.; Bustin, A.M.M.; Chalmers, G.R.L.; He, L.; Melnichenko, Y.B.; Radliński, A.P.; Blach, T.P. Pore Structure Characterization of North American Shale Gas Reservoirs Using USANS/SANS, Gas Adsorption, and Mercury Intrusion. Fuel 2013, 103, 606–616. [Google Scholar] [CrossRef]
  30. Ruppert, L.F.; Sakurovs, R.; Blach, T.P.; He, L.; Melnichenko, Y.B.; Mildner, D.F.R.; Alcantar-Lopez, L. A USANS/SANS Study of the Accessibility of Pores in the Barnett Shale to Methane and Water. Energy Fuels 2013, 27, 772–779. [Google Scholar] [CrossRef]
  31. Sun, M.; Yu, B.; Hu, Q.; Yang, R.; Zhang, Y.; Li, B.; Melnichenko, Y.B.; Cheng, G. Pore Structure Characterization of Organic-Rich Niutitang Shale from China: Small Angle Neutron Scattering (SANS) Study. Int. J. Coal Geol. 2018, 186, 115–125. [Google Scholar] [CrossRef]
  32. Radlinski, A.P.; Ioannidis, M.A.; Hinde, A.L.; Hainbuchner, M.; Baron, M.; Rauch, H.; Kline, S.R. Angstrom-to-Millimeter Characterization of Sedimentary Rock Microstructure. J. Colloid Interface Sci. 2004, 274, 607–612. [Google Scholar] [CrossRef] [PubMed]
  33. Ma, Y.; Pan, Z.; Zhong, N.; Connell, L.D.; Down, D.I.; Lin, W.; Zhang, Y. Experimental Study of Anisotropic Gas Permeability and Its Relationship with Fracture Structure of Longmaxi Shales, Sichuan Basin, China. Fuel 2016, 180, 106–115. [Google Scholar] [CrossRef]
  34. Chen, L.; Liu, K.; Jiang, S.; Huang, H.; Tan, J.; Zuo, L. Effect of Adsorbed Phase Density on the Correction of Methane Excess Adsorption to Absolute Adsorption in Shale. Chem. Eng. J. 2021, 420, 127678. [Google Scholar] [CrossRef]
  35. Zhou, S.; Xue, H.; Ning, Y.; Guo, W.; Zhang, Q. Experimental Study of Supercritical Methane Adsorption in Longmaxi Shale: Insights into the Density of Adsorbed Methane. Fuel 2018, 211, 140–148. [Google Scholar] [CrossRef]
  36. Sun, M.; Yu, B.; Hu, Q.; Zhang, Y.; Li, B.; Yang, R.; Melnichenko, Y.B.; Cheng, G. Pore Characteristics of Longmaxi Shale Gas Reservoir in the Northwest of Guizhou, China: Investigations Using Small-Angle Neutron Scattering (SANS), Helium Pycnometry, and Gas Sorption Isotherm. Int. J. Coal Geol. 2017, 171, 61–68. [Google Scholar] [CrossRef] [Green Version]
  37. Lee, S.; Fischer, T.B.; Stokes, M.R.; Klingler, R.J.; Ilavsky, J.; McCarty, D.K.; Wigand, M.O.; Derkowski, A.; Winans, R.E. Dehydration Effect on the Pore Size, Porosity, and Fractal Parameters of Shale Rocks: Ultrasmall-Angle X-Ray Scattering Study. Energy Fuels 2014, 28, 6772–6779. [Google Scholar] [CrossRef]
  38. Jin, L.; Mathur, R.; Rother, G.; Cole, D.; Bazilevskaya, E.; Williams, J.; Carone, A.; Brantley, S. Evolution of Porosity and Geochemistry in Marcellus Formation Black Shale during Weathering. Chem. Geol. 2013, 356, 50–63. [Google Scholar] [CrossRef]
  39. Yang, R.; He, S.; Yi, J.; Hu, Q. Nano-Scale Pore Structure and Fractal Dimension of Organic-Rich Wufeng-Longmaxi Shale from Jiaoshiba Area, Sichuan Basin: Investigations Using FE-SEM, Gas Adsorption and Helium Pycnometry. Mar. Pet. Geol. 2016, 70, 27–45. [Google Scholar] [CrossRef]
Figure 1. Sample acquisition method.
Energies 15 00913 g001
Figure 2. Micro-CT reconstruction images of shale: (a) shale pore; (b) shale porosity and organic matter.
Energies 15 00913 g002
Figure 3. Shale reconstruction image composed of continuous backscattered images: (a) three-dimensional reconstruction of shale; (b) pore distribution; (c) pore and organic matter distribution; (d) connected pore distribution.
Energies 15 00913 g003
Figure 4. Scanning electron microscope images of microscopic pore structure of shale.
Energies 15 00913 g004
Figure 5. (a) Pore quantity distribution with different pore sizes by FIB-SEM data; (b) pore volume distribution with different pore sizes by FIB-SEM data.
Energies 15 00913 g005
Figure 6. Focused ion beam scanning electron microscope image: (a) mixed zone of organic matter and clay mineral development; (b) border area of distribution of organic matter and quartz.
Energies 15 00913 g006
Figure 7. SANS absolute scattering cross-section (I(Q)) versus the scattering vector (Q): (a) original scattering cross-section; (b) back-deducted scattering cross-section.
Energies 15 00913 g007
Figure 8. Pore volume distribution vs. pore size, calculated using the PDSP model: (a) samples W1 and W2; (b) samples P1 and P2.
Energies 15 00913 g008
Table 1. Mineral composition and TOC of shale samples (%).
SampleTOCQuartzCalciteDolomitePlagioclasePyriteIlliteSmectiteChlorite
W13.2045.2010.2019.453.802.7016.101.451.10
W23.8032.402.3015.909.108.4025.304.202.40
P13.143.89.918.83.72.615.61.41.1
P23.731.22.215.38.88.124.44.02.3
Table 2. Parameters used in calculation of scattering length density (SLD).
MaterialDensity (g/cm3)Chemical FormulaSLD (×1010 cm−2)
Quartz2.65SiO24.18
Calcite2.71CaCO34.69
Dolomite2.86CaMg(CO3)25.44
Plagioclase2.61NaAlSiO33.97
Pyrite5.01FeS23.81
Illite2.70K(Al3Mg)(Si7Al)O20(OH)43.80
Montmorillonite2.35Na0.7(Al3.3,Mg0.7)Si8O20(OH)4H23.26
Chlorite3.00(Mg9Al3)(Al3Si5)O20(OH)163.75
Table 3. Pore structure parameters of each sample obtained by small-angle scattering.
SampleSample Thickness
(mm)
SLD
(×1010 cm−2)
PI Porosity (%)PDSM Porosity
(%)
Fractal DimensionMedian Pore Diameter
(nm)
W10.764.134.574.622.813.79
W20.724.184.634.762.773.77
P10.714.323.483.512.754.86
P20.774.163.403.422.717.54
Publisher’s Note: MDPI stays neutral with regard to jurisdictional claims in published maps and institutional affiliations.

