Article

Sedimentary Architecture Analysis of Deltaic Sand Bodies Using Sequence Stratigraphy and Seismic Sedimentology: A Case Study of Jurassic Deposits in Zhetybay Oilfield, Mangeshrak Basin, Kazakhstan

1
PetroChina Research Institute of Petroleum Exploration & Development, Beijing 100083, China
2
State Key Laboratory of Petroleum Resources and Prospecting, China University of Petroleum-Beijing, Beijing 102249, China
3
College of Geosciences, China University of Petroleum-Beijing, Beijing 102249, China
4
Pengzhou Gas Field Department, Sinopec Southwest Oil & Gas Company, Pengzhou 611930, China
*
Authors to whom correspondence should be addressed.
Energies 2022, 15(14), 5306; https://doi.org/10.3390/en15145306
Submission received: 18 June 2022 / Revised: 10 July 2022 / Accepted: 19 July 2022 / Published: 21 July 2022
(This article belongs to the Special Issue Shale Oil and Gas Accumulation Mechanism)

Abstract

:
Three-dimensional (3D) seismic data and well log data were used to investigate the sandstone architecture of the Middle Jurassic deltaic reservoirs of the Zhetybay Oilfield, Mangeshrak Basin, Kazakhstan. The base-level cycles of different scales were identified and divided using well log and 3D seismic data. Five types of sedimentary boundaries were identified in the mouth bar sandstones. The boundaries divide single mouth bars. Vertically, the spatial distribution of sand bodies can be divided into superposed, spliced, and isolation modes. Laterally, contact modes can be divided into superposition, lateral, and isolation modes. We found that the base-level cycle controls the evolution of the delta front sand body architecture. In the early decline or late rise of the base-level cycle, the superimposed or spliced modes dominate the sand body. By contrast, the lateral or isolation modes dominate the sand body in the late decline or early rise of the base-level cycle. This paper proposes an architecture model of the delta front sand bodies controlled by the base-level cycle. The spatial distribution and morphological variation of deltaic sand bodies could be linked to the base-level cycles.

1. Introduction

Reservoir architecture refers to the shape, scale, direction, and superposition relationship of different reservoir units [1]. Research on reservoir architecture has implications for the development of oilfields, improves the recovery rate of petroleum, and maximizes economic benefits [2,3,4]. Reservoir architecture formed in different sedimentary environments has been widely studied in hydrocarbon-bearing basins [5,6,7,8,9,10,11,12,13,14]. Deltaic sand bodies are one of the most important reservoir types [15,16,17]. Previous studies of delta front reservoirs focused mainly on outcrops [18,19] and modern analogs [20,21]. Characterizing the subsurface deltaic reservoir architecture is challenging owing to the complex sedimentary process and sandstone distribution intercut into this system [22,23].
Traditional reservoir architecture analysis is mostly reliant on outcrops, core, and logging data [24]. However, the spatial distribution of the delta front sand body is extremely complicated, making it challenging to precisely characterize the reservoir architecture using well and core data [25]. With the rapid development of seismic sedimentology, the combination of well and seismic data has become a novel method to characterize reservoir architecture. Seismic attributes and seismic profiles can provide a powerful basis for spatial characterization of interwell sand bodies, making up for the lack of lateral resolution of logging data [26,27]. Seismic attributes can provide intuitive images of the planar distribution characteristics of channel sand bodies, and seismic profiles can reflect the overlapping styles of different types of sand bodies, allowing for a more accurate and precise reservoir architecture characterization of the delta front [28,29].
The development of high-resolution sequence stratigraphy has revolutionized depositional architecture research and allows geologists to examine how the base-level cycle controls various depositional architecture and how the controlling mechanisms changed through geological time [30,31,32,33,34,35,36]. The evolution of deltaic depositional systems during different phases of base-level cycles has been well studied [32,37,38,39,40]. The size and morphology of deltaic deposits are controlled by the ratio of accommodation to sediment supply, which is accommodation/sediment (A/S). [41,42]. The spatial distribution and morphological variation of deltaic sand bodies have been studied in different base-level cycles of different A/S values [43,44,45]. However, previous studies on the control of the base-level cycles on deltaic reservoirs focused mostly on large-scale sequence stratigraphic units. These small-scale sequence stratigraphic units and their related deltaic architectural elements remain understudied, particularly the Jurassic reservoirs in the Zhetybay Oilfield.
The Jurassic deltaic reservoirs developed in the Zhetybay Oilfield Mangeshrak Basin, Kazakhstan [46]. In recent years, the reservoirs have entered the high water-cut stage. The study area has dense development wells, and the spacing of these wells is ~200 m. The geophysical and geological data from these dense wells provide a sound basis for summarizing the small-scale details of the stratigraphic architecture. In this study, the distribution and morphology of deltaic sand bodies in the study area were analyzed using high-resolution sequence stratigraphy. The results of this study can not only improve the recovery efficiency of the Zhetybay oilfield but also provide a reference for investigations of the reservoir architecture and refine production procedures in basins with similar geologic settings.

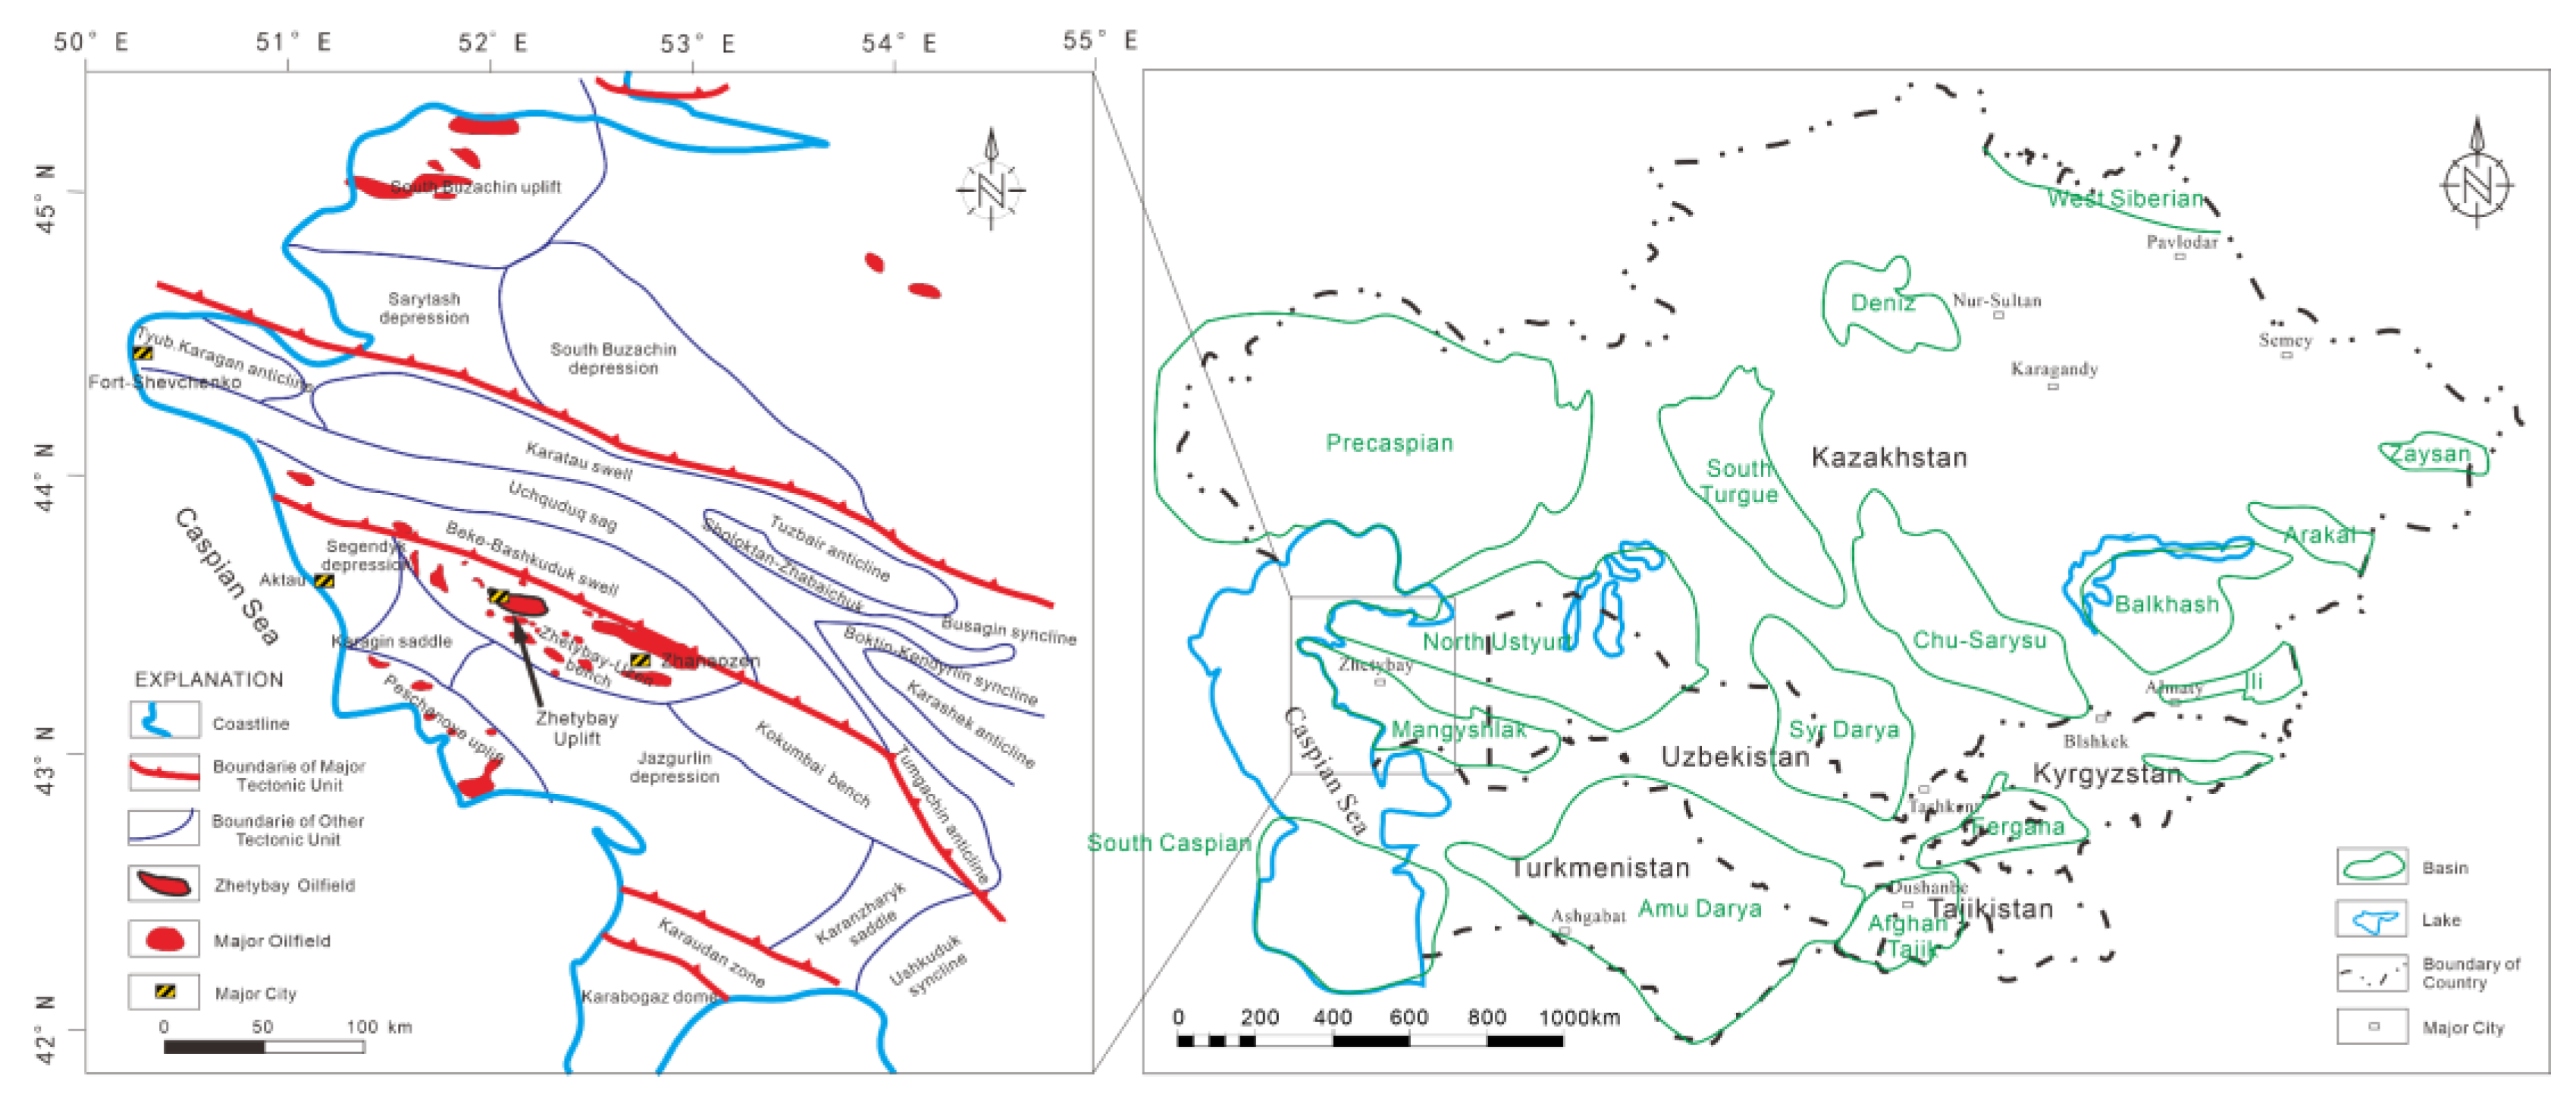
2. Regional Geological Setting

2.1. Tectonic Setting
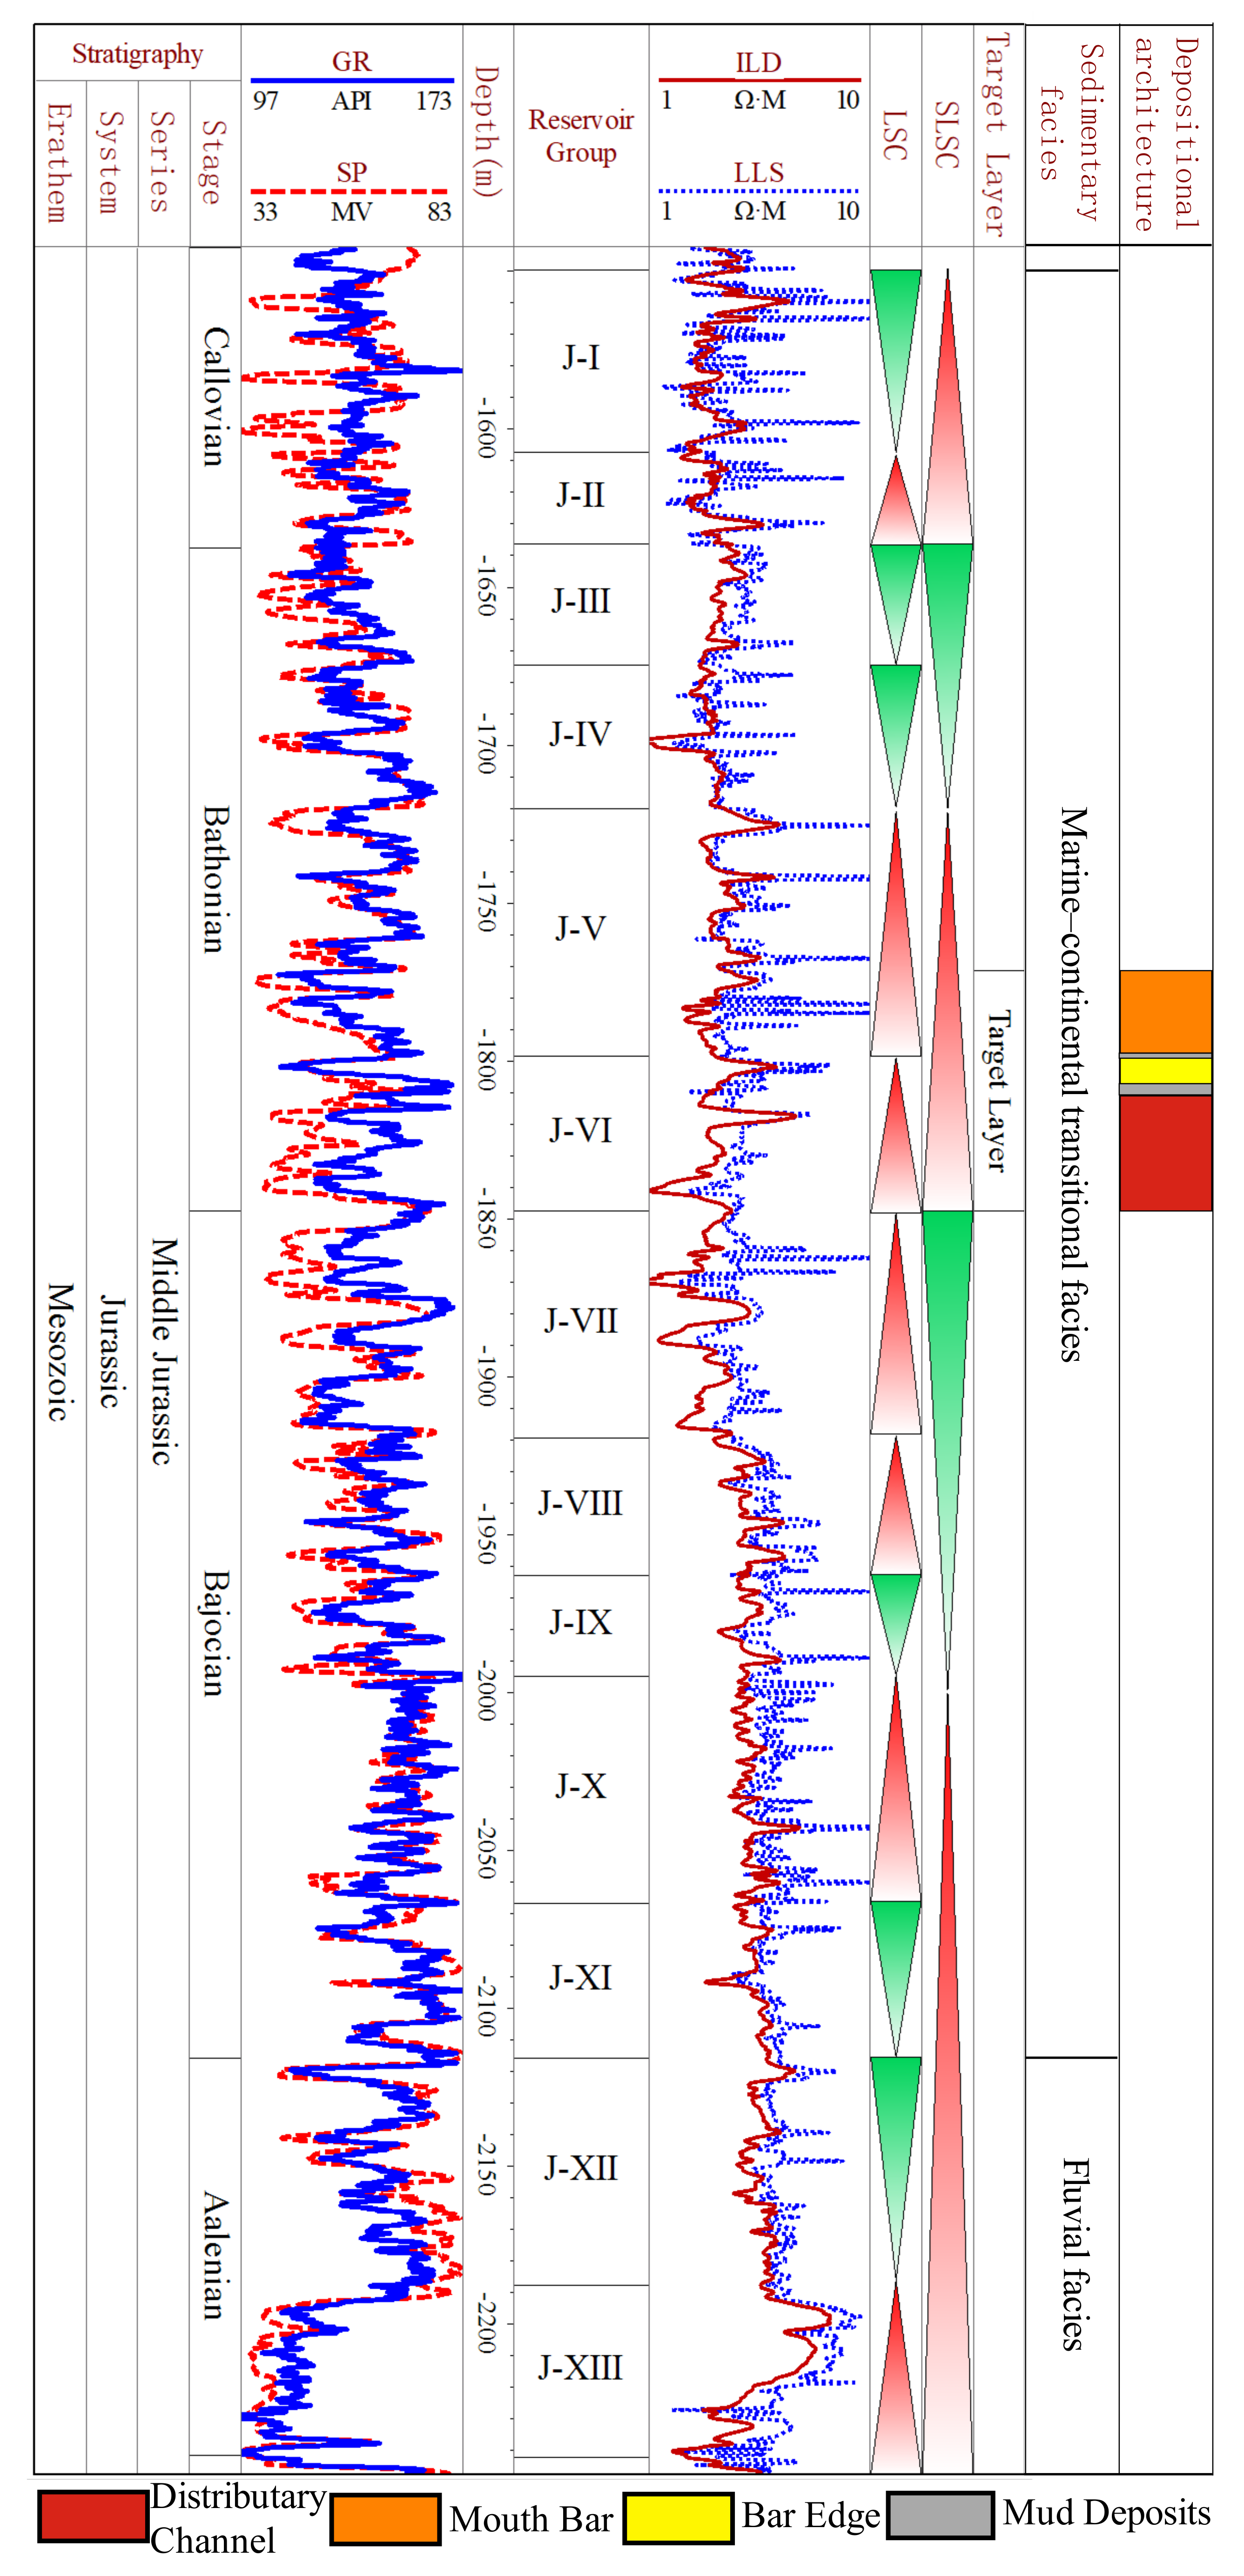
The Zhetybay Oilfield belongs to the Karakyan District of Mangghystau in Kazakhstan and is located 80 km southeast of Aktau City (Figure 1). The Zhetybay Oilfield is located in the secondary tectonic unit, Zhetybay-Uzen terrace. This terrace is located on the northern edge of the South Mangeshrak Depression [46,47,48] (Figure 1). The terrace extends 200 km from northwest to southeast and is approximately 40 km wide [49] (Figure 1). The Zhetybay Uplift is one of the local structures within the Zhetybay-Uzen terrace (Figure 1). It is a large and gentle long-axis anticlinal structure with a nearly southeast-northwest trend. Its length and width are approximately 22 and 6 km, respectively (Figure 2). The anticline dips southeast between 2.5 and 5° [50].

2.2. Stratigraphy

The Paleozoic–Mesozoic–Cenozoic strata of the Zhetybay Oilfield are composed of Carboniferous Permian, Jurassic, Cretaceous, Paleogene, Neogene, and Quaternary rocks, from bottom to top, respectively. Among them, the Middle-Upper Jurassic fluvial-delta sandstone reservoirs represent the principal producing formation of the oilfield [47]. The lithology was mainly argillaceous fine-grained sandstone and siltstone, alternately developing a dark-gray to gray dense argillaceous bed [48].
The reservoirs have medium porosities (16.5–19.1%) and medium permeabilities (50–224 mD). The Middle Jurassic deltaic sand bodies show strong heterogeneity in the horizontal and vertical directions. They are divided into 13 sets of oil-bearing systems (J-I–J-XIII) (Figure 3). The thickness of each oil-bearing system ranges from 27 to 160 m. Among them, reservoir J-I–J-XI is composed of mostly fine-grained and argillaceous sandstones deposited as marine–continental transitional facies, and reservoir J-XII–J-XIII is composed of mainly fluvial sandstones. The target layers include the lower parts of the J-VOil Layer and J-VI Oil Layer.

3. Data and Methods

The core description, well-log data, and 3D seismic data from the Zhetybay Oilfield were used in our analysis. In total, 2161 wells were drilled in the study area, and among them, 1660 wells with complete well log data and drilled into the target strata were selected to describe the sedimentary architecture. Well-log curves from 1660 wells, including the gamma-ray log curves (GR) and resistivity log curves (RT), were used in our analysis (Table 1). We also had access to a seismic survey covering the entire study area. According to spectrum analysis, the main frequency of the seismic data of the target layer in the study area was 55 Hz, the frequency width was 11 to 97 Hz, and the velocity used for depth conversions was 3250 m/s. The resolution of the seismic data in the study area was approximately 15 m. The datum-level cycles were identified and compared by using logging curve and seismic profile data. Sedimentary facies were initially identified from the cores. The sedimentary architecture unit boundaries were identified based on the sedimentary facies using the well logs and 3D seismic reflections. The lateral and vertical superposition patterns of the delta front sand bodies, as well as the scale and geometry of the sand-body distribution in the plane, were analyzed in different short-term base-level cycles.

4. Results

Based on the well-seismic combination data (Figure 4), the transition interface of rising or falling of different-order base-level cycles is determined. Based on the repetition of facies with the target interval, we identified four scales of cyclicity including a long-term base-level cycle (LSC1–LSC2), three medium-term base-level cycles (MSC1–MSC3), five short-term base-level cycles (SSC1–SSC5), and nine super-short-term base-level cycles (SSSC1–SSSC9). The middle-term base-level cycles indicate the transgressive and regressive sedimentary sequence formed by the superposition of strata with slight variations in water depth and genetic relationship [32,51,52]. The three MSCs were divided into one base-level ascending half cycle, two descending half-cycles, and a descending half-cycle of J-VI from the bottom to top (Figure 4 and Figure 5). The three middle-term base-level cycles were further divided into short-term and super-short-term base-level cycles. This paper describes the sedimentary architecture of these super-short-term base-level cycles.

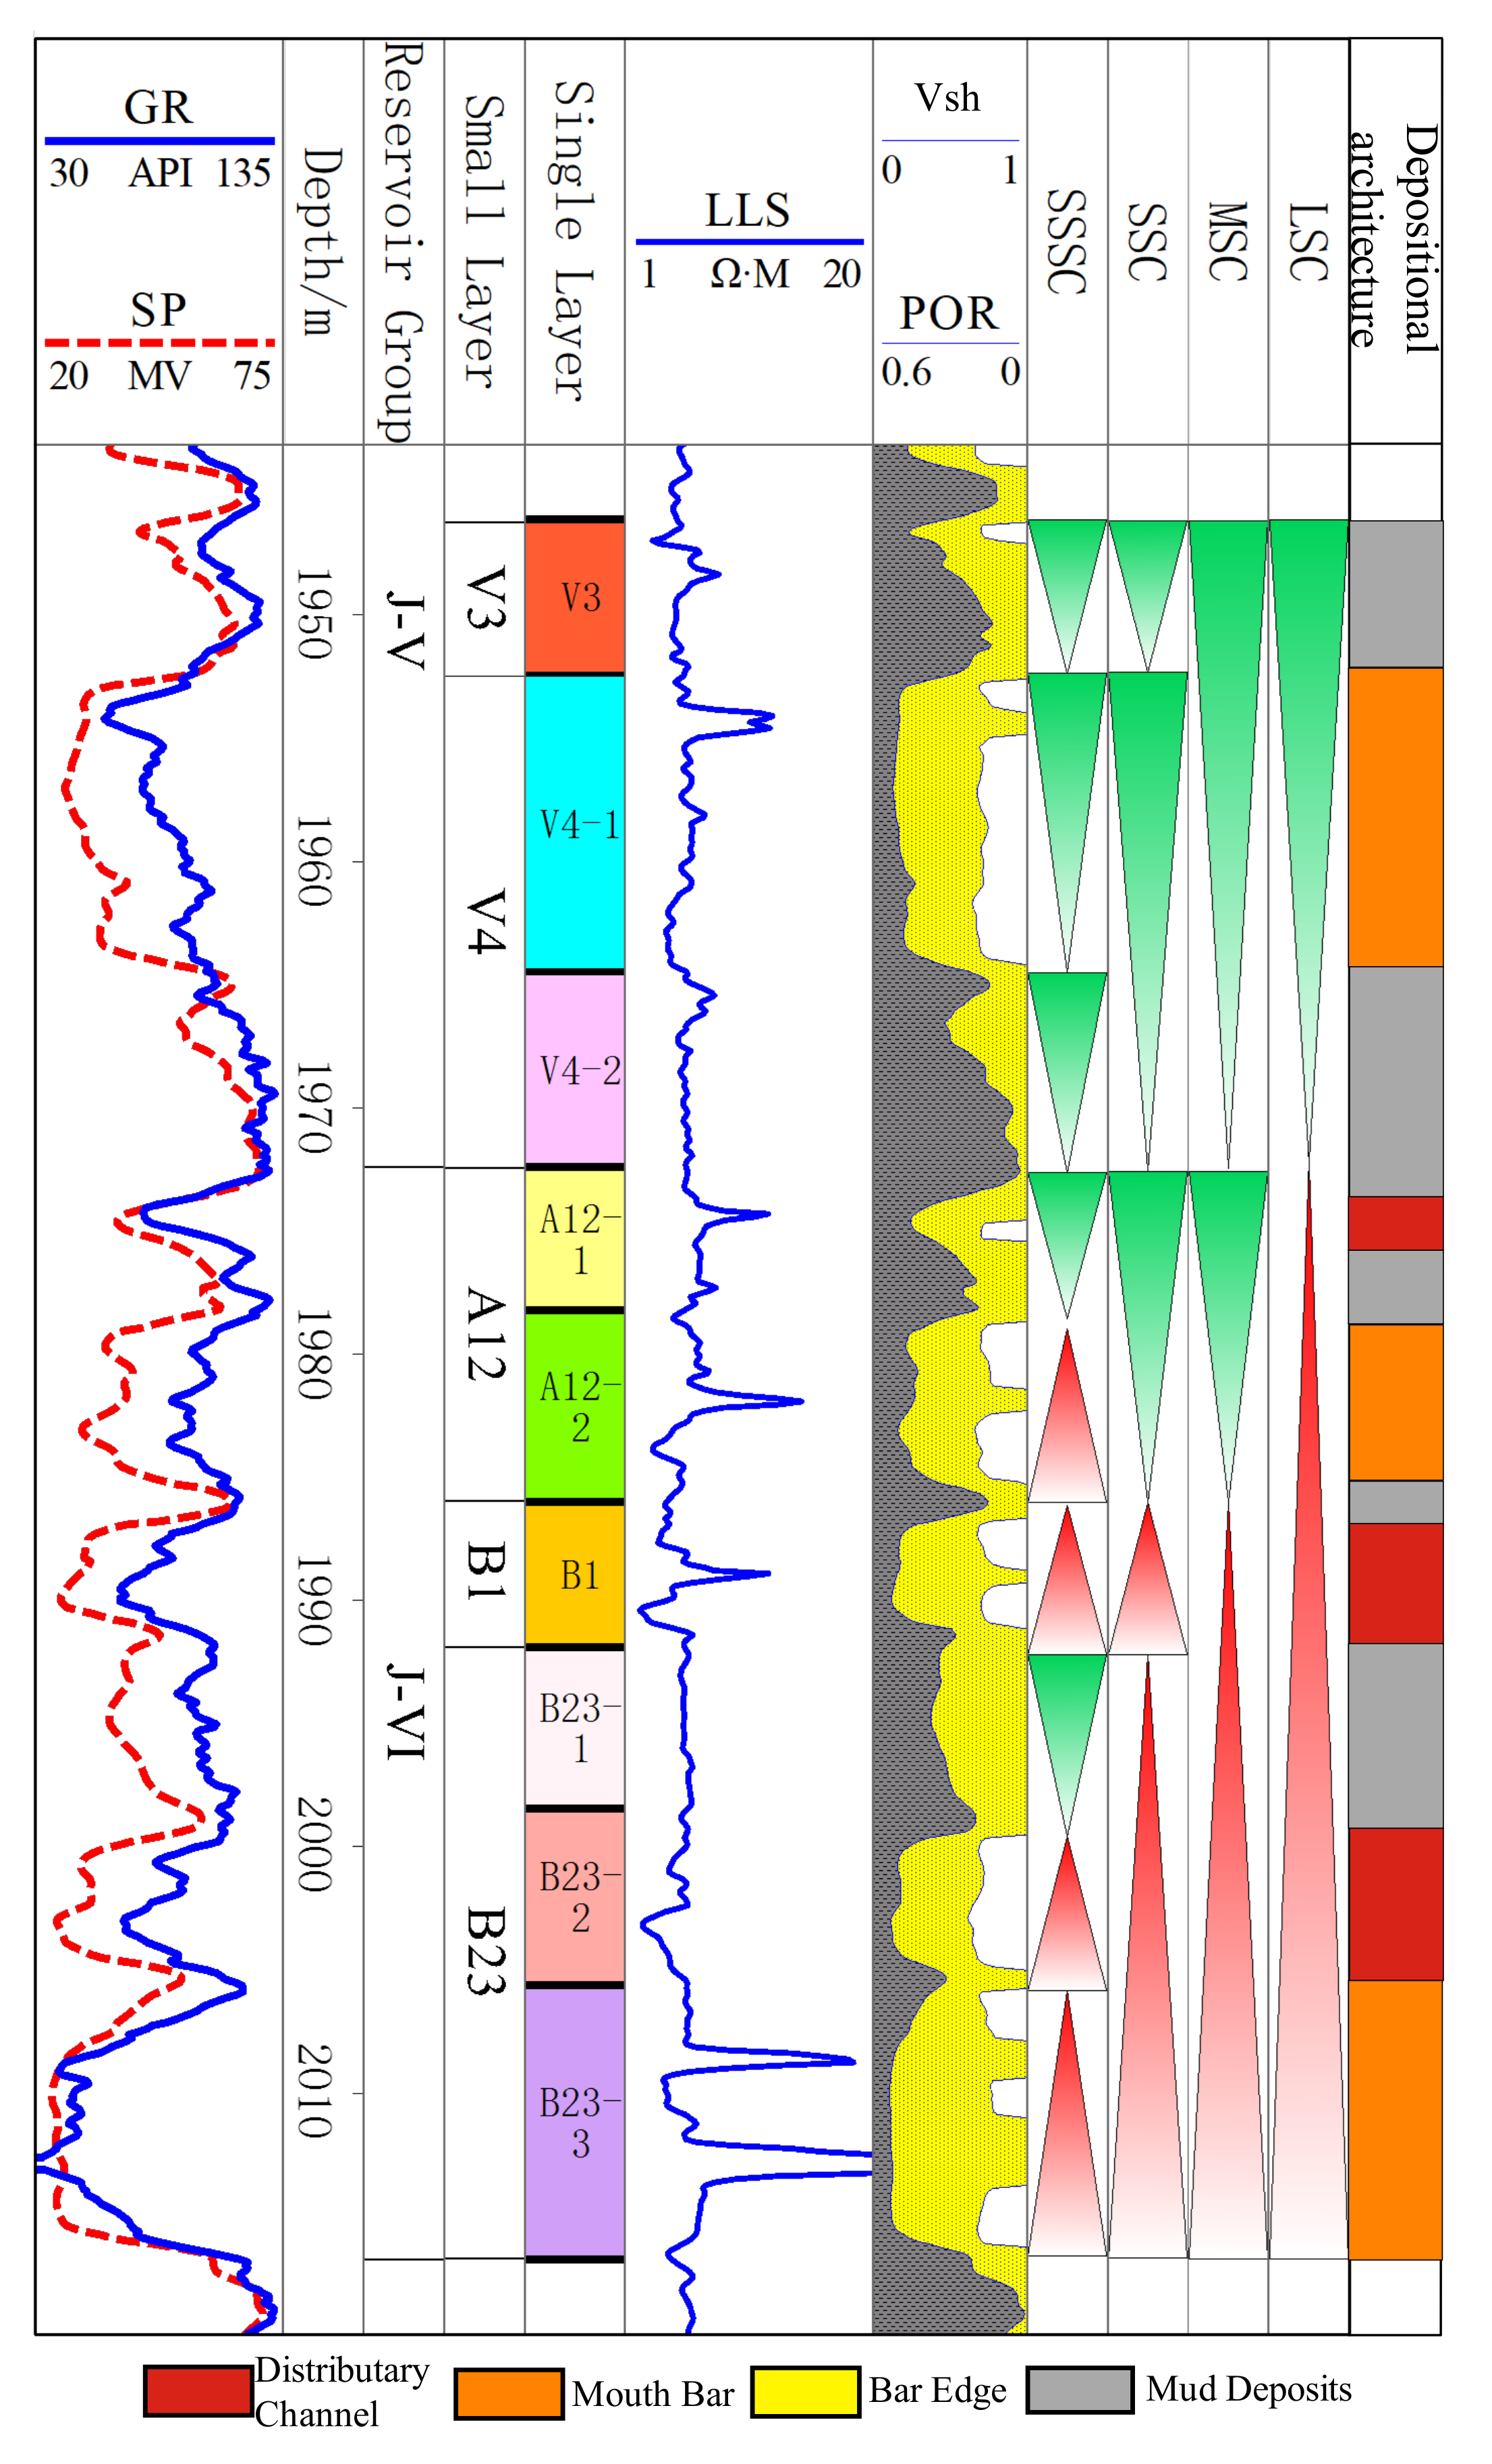
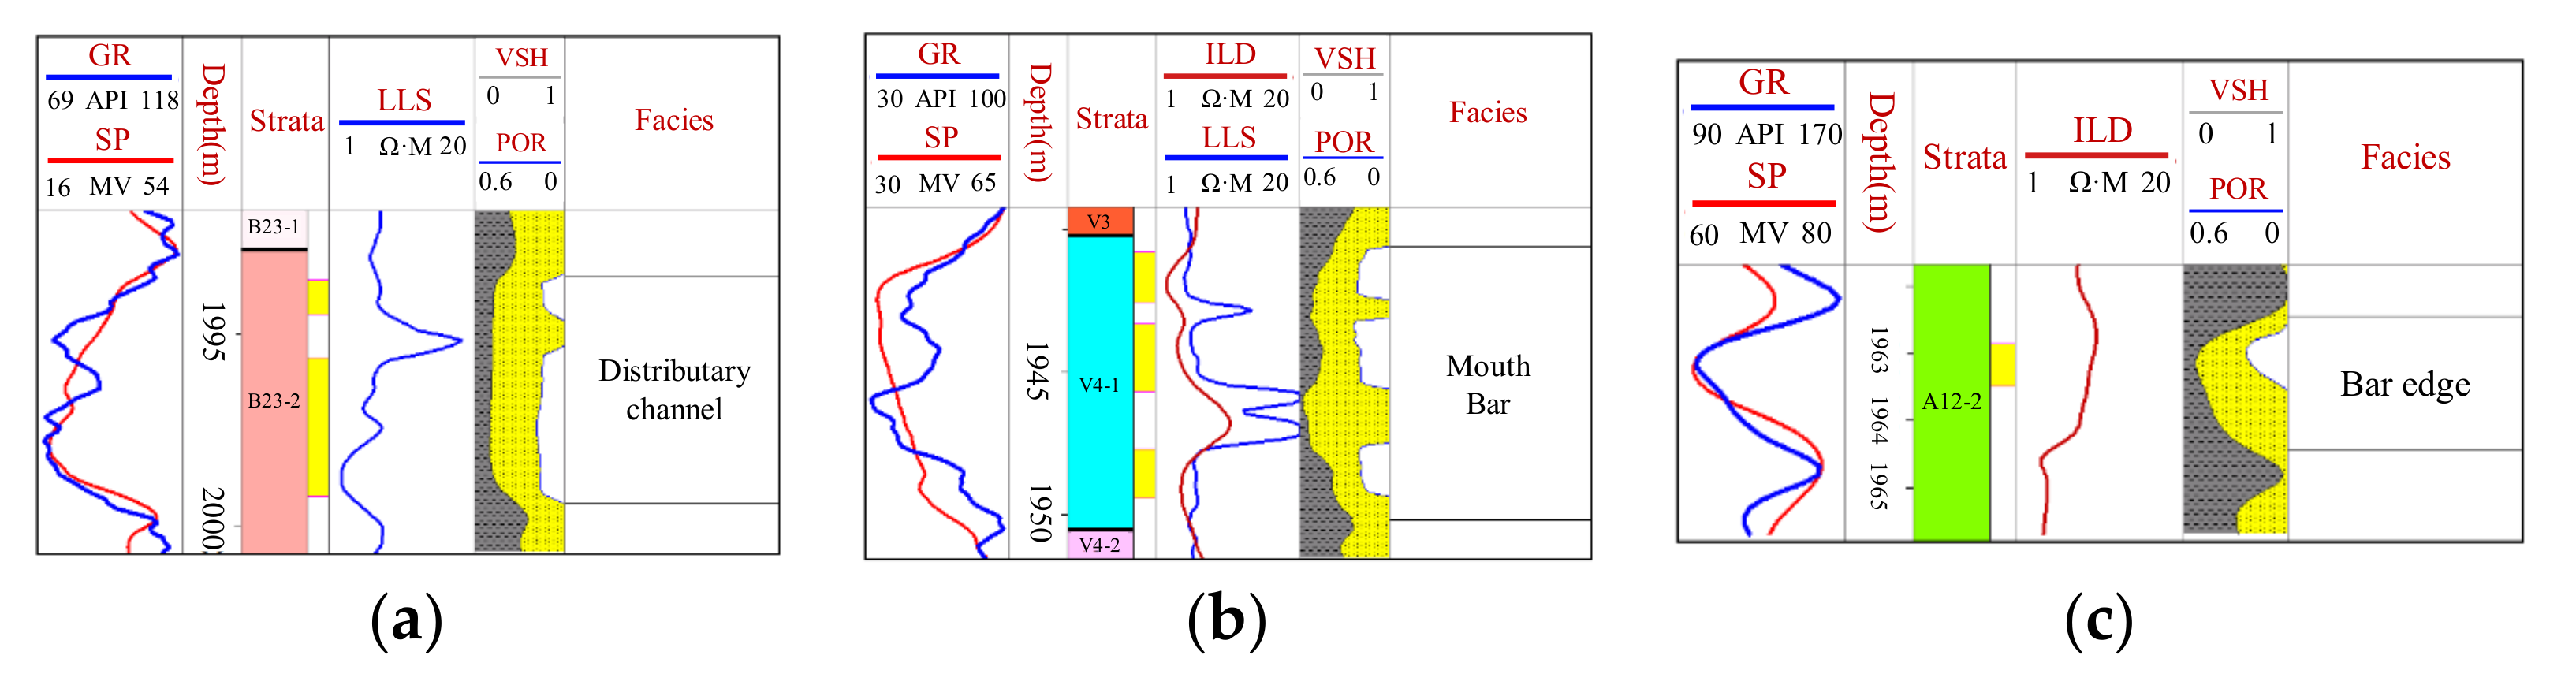
4.1. Depositional Facies of the Reservoir Sandstones

According to the typical sedimentary structures (Figure 6) in the cores and previous research, the target layer in this study was formed in a delta front environment [50]. The mudstone in the study area is mainly dark-gray to gray (Figure 6a) and rich in plant debris [50]. The main sand bodies found in the delta front include distributary channel, mouth bar, and bar edge facies. The characteristics of the three facies are summarized below.
(1)
Distributary channel
The thickness of beds of the distributary channel is generally 2–6 m. The lithology is mainly medium-grained sandstone, with a low shale content, high porosity and permeability, vertical development of positive rhythms, more homogeneous rhythms, and erosional surfaces at the bottom. The natural gamma curve presents a mid-to-high amplitude bell shape, compound bell shape, or toothed box shape (Figure 7a) [15,53]. The delta front distributary channel frequently diverges along the sedimentary source direction, and the terminal distributary channel develops in multiple stages. Distributary channel sand bodies are branched and banded on the plane. The terminal channel is small in scale and its thickness is generally 1–3 m.
(2)
Mouth Bar
The mouth bar is thick, generally 3–6 m. The lithology is mostly fine sandstone, and the overall grain size is slightly finer than that of the channel. The porosity and permeability are high, exhibiting the characteristics of a reverse rhythm or a relatively homogeneous compound rhythm (Figure 7b), with mudstone or silty mudstone at the bottom. The mouth bar sand bodies are distributed in a continuous patch on the plane. The natural gamma curve has a high-amplitude box or funnel shape.
(3)
Bar edge
The thickness of the sand body at the bar edge is low, generally less than 3 m. The lithology is mainly siltstone or argillaceous siltstone, with poor petrophysical properties. The sand body is located on the sides of the mouth bar and is easily modified by waves to form a thin bed widely distributed in front of the delta front sand. The natural gamma curve has a low-amplitude funnel shape or finger shape (Figure 7c).

4.2. Interface Identification of a Single Sand Body Scale Architecture Unit

The interface of the reservoir architecture refers to the interface of the stratigraphic unit that separates different layers of the sand body by the hierarchical interface. This study uses Miall’s hierarchical interface division plan for fluvial facies [1,54], which is useful for examining delta front deposits. The boundary of a single sand body is usually identified by the sand body superposition mode. The superposition modes between the single sand bodies are described by combining the lithology logging data through the well-tied profile. From this, the individual sand bodies within the composite sand bodies can be determined.

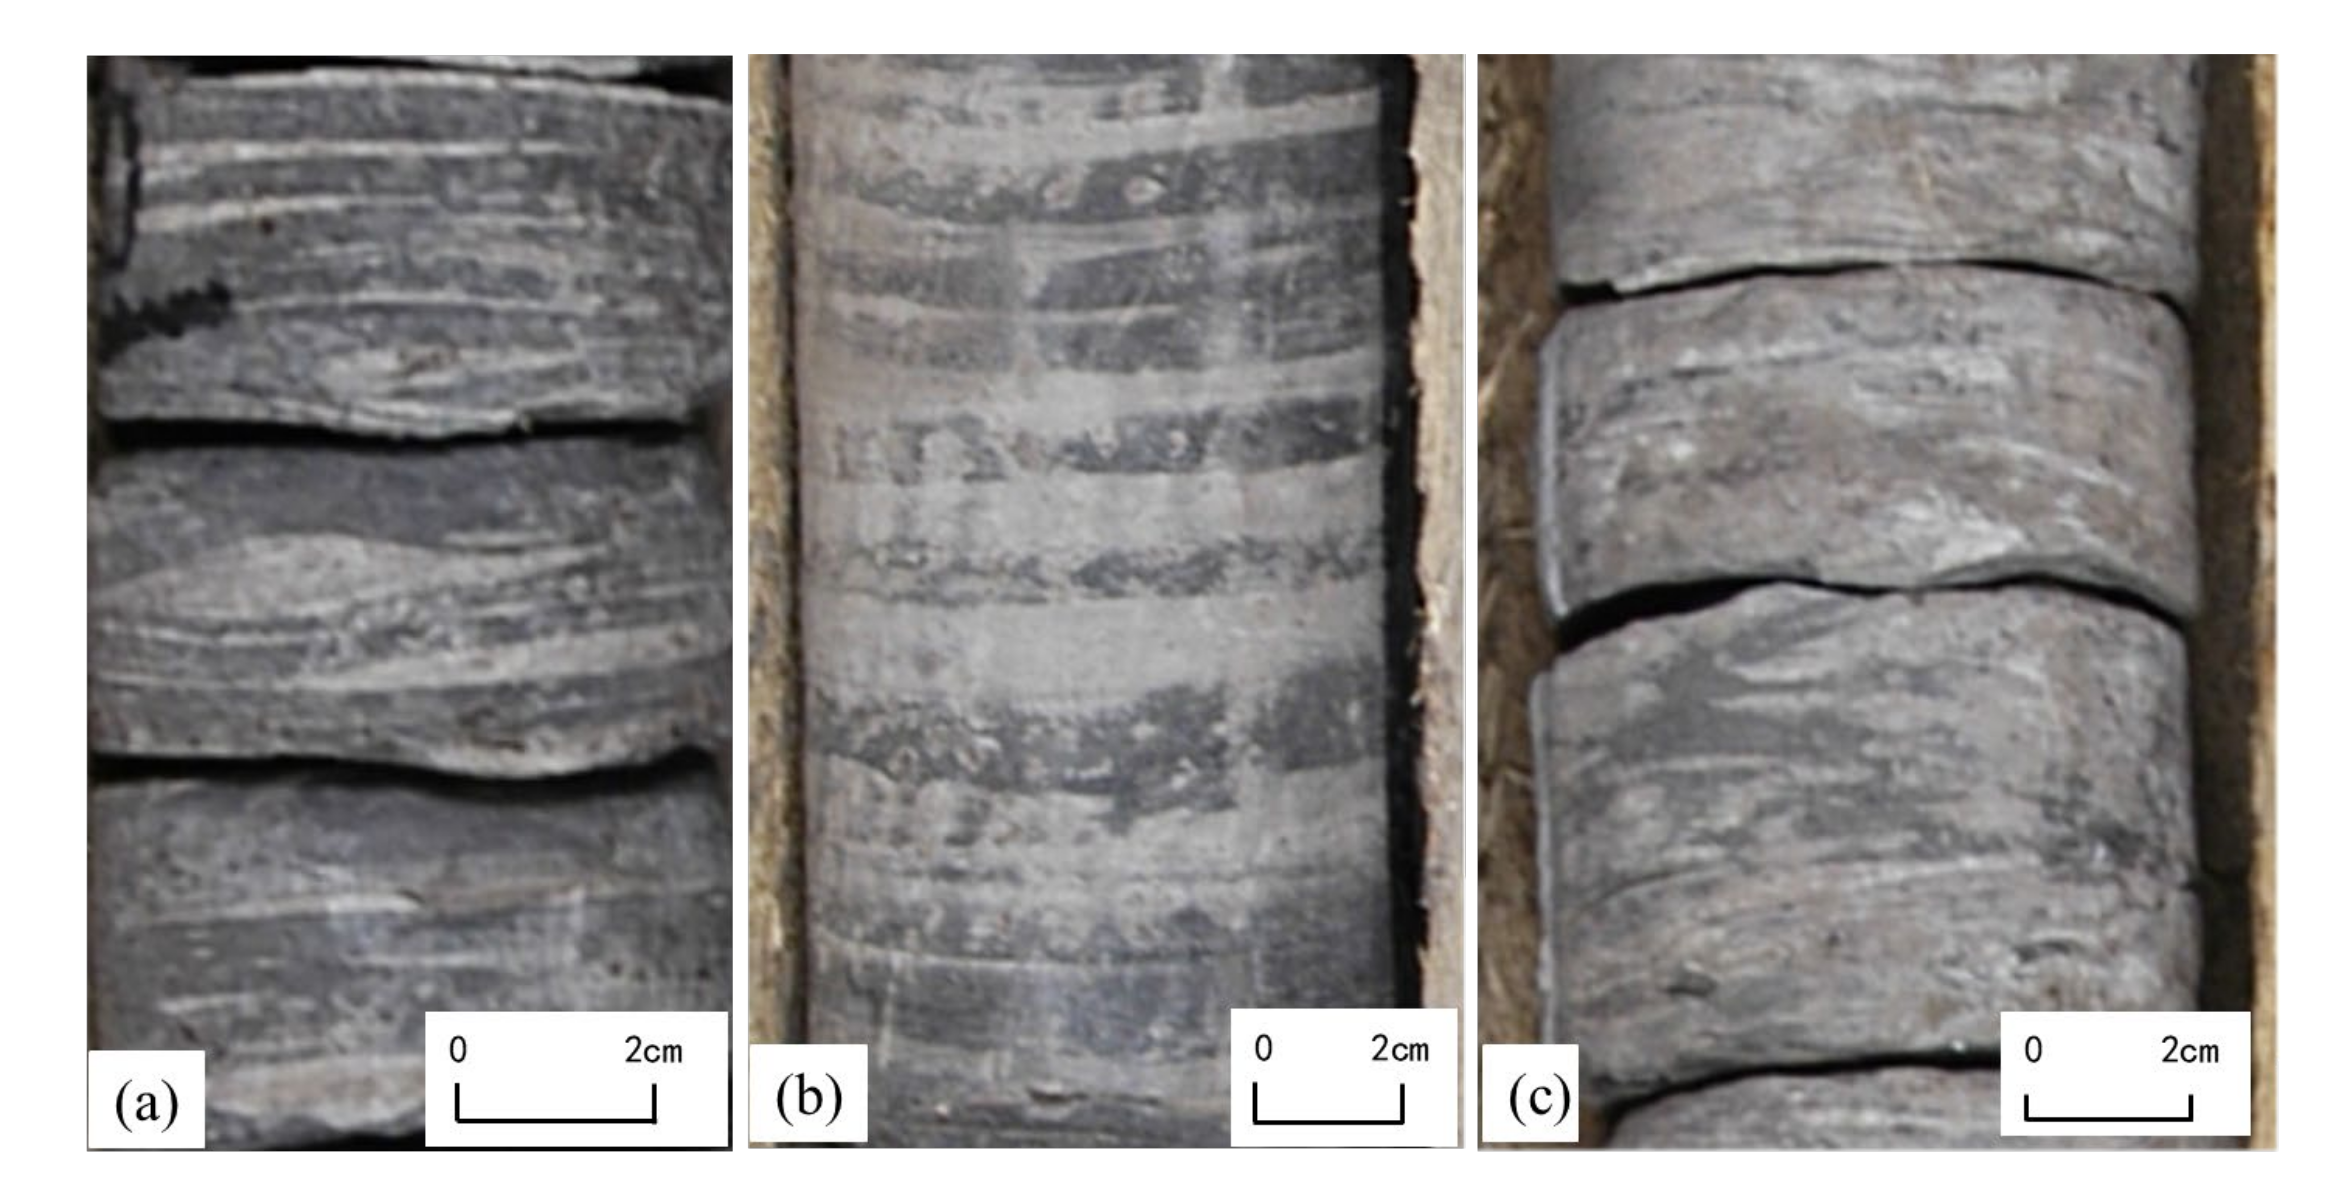
4.2.1. Identification Marks of Single Mouth Bars

Through the interpretation of the architecture of the along source and cut source profiles in the study area, it is concluded that there are several main boundary identification marks of the mouth bar in the study area (Figure 8):
(1)
Mudstone beds between the bars.
From the depositional pattern of the mouth bar on the delta front, the so-called interbar mudstone represents the low-lying mud deposited between two distributary channels and the mouth bar complex. The appearance of mudstone between the bars implies the existence of a boundary between the mouth bars, which is an accurate and reliable means for a single discriminatory mouth bar (Figure 8a).
(2)
Deposits at the edge of the bar.
The edge of the bar is composed of thin deposits at the lateral boundary of the mouth bar, which represents the outer limits of the mouth bar. Therefore, the occurrence of a bar edge can be used to distinguish the boundaries between bars. This distinguishing boundary is more reliable (Figure 8b).
(3)
“Thick–thin–thick” pattern of the sand body.
The mouth bar is commonly characterized by a thick central sand the sand body that gradually thins toward its edge. Therefore, the thickness of the sand bodies shows a changing trend of “thick–thin–thick”. This suggests that the two thick sand bodies belong to two separate mouth bars, which reflects the contact between two mouth bars, and can be used as a lateral delineator of different mouth bars. The sand thickness of the mouth bar can then be analyzed as a whole and used in combination with other signs (Figure 8c).
(4)
Sand bodies stacked laterally.
When two sand bodies are laterally superimposed, the log of a single well reflects the apparent vertical multistage superposition of sand bodies, suggesting that the two mouth-bar complexes formed in different periods. This mark can be used to judge the lateral boundary between bars (Figure 8d).

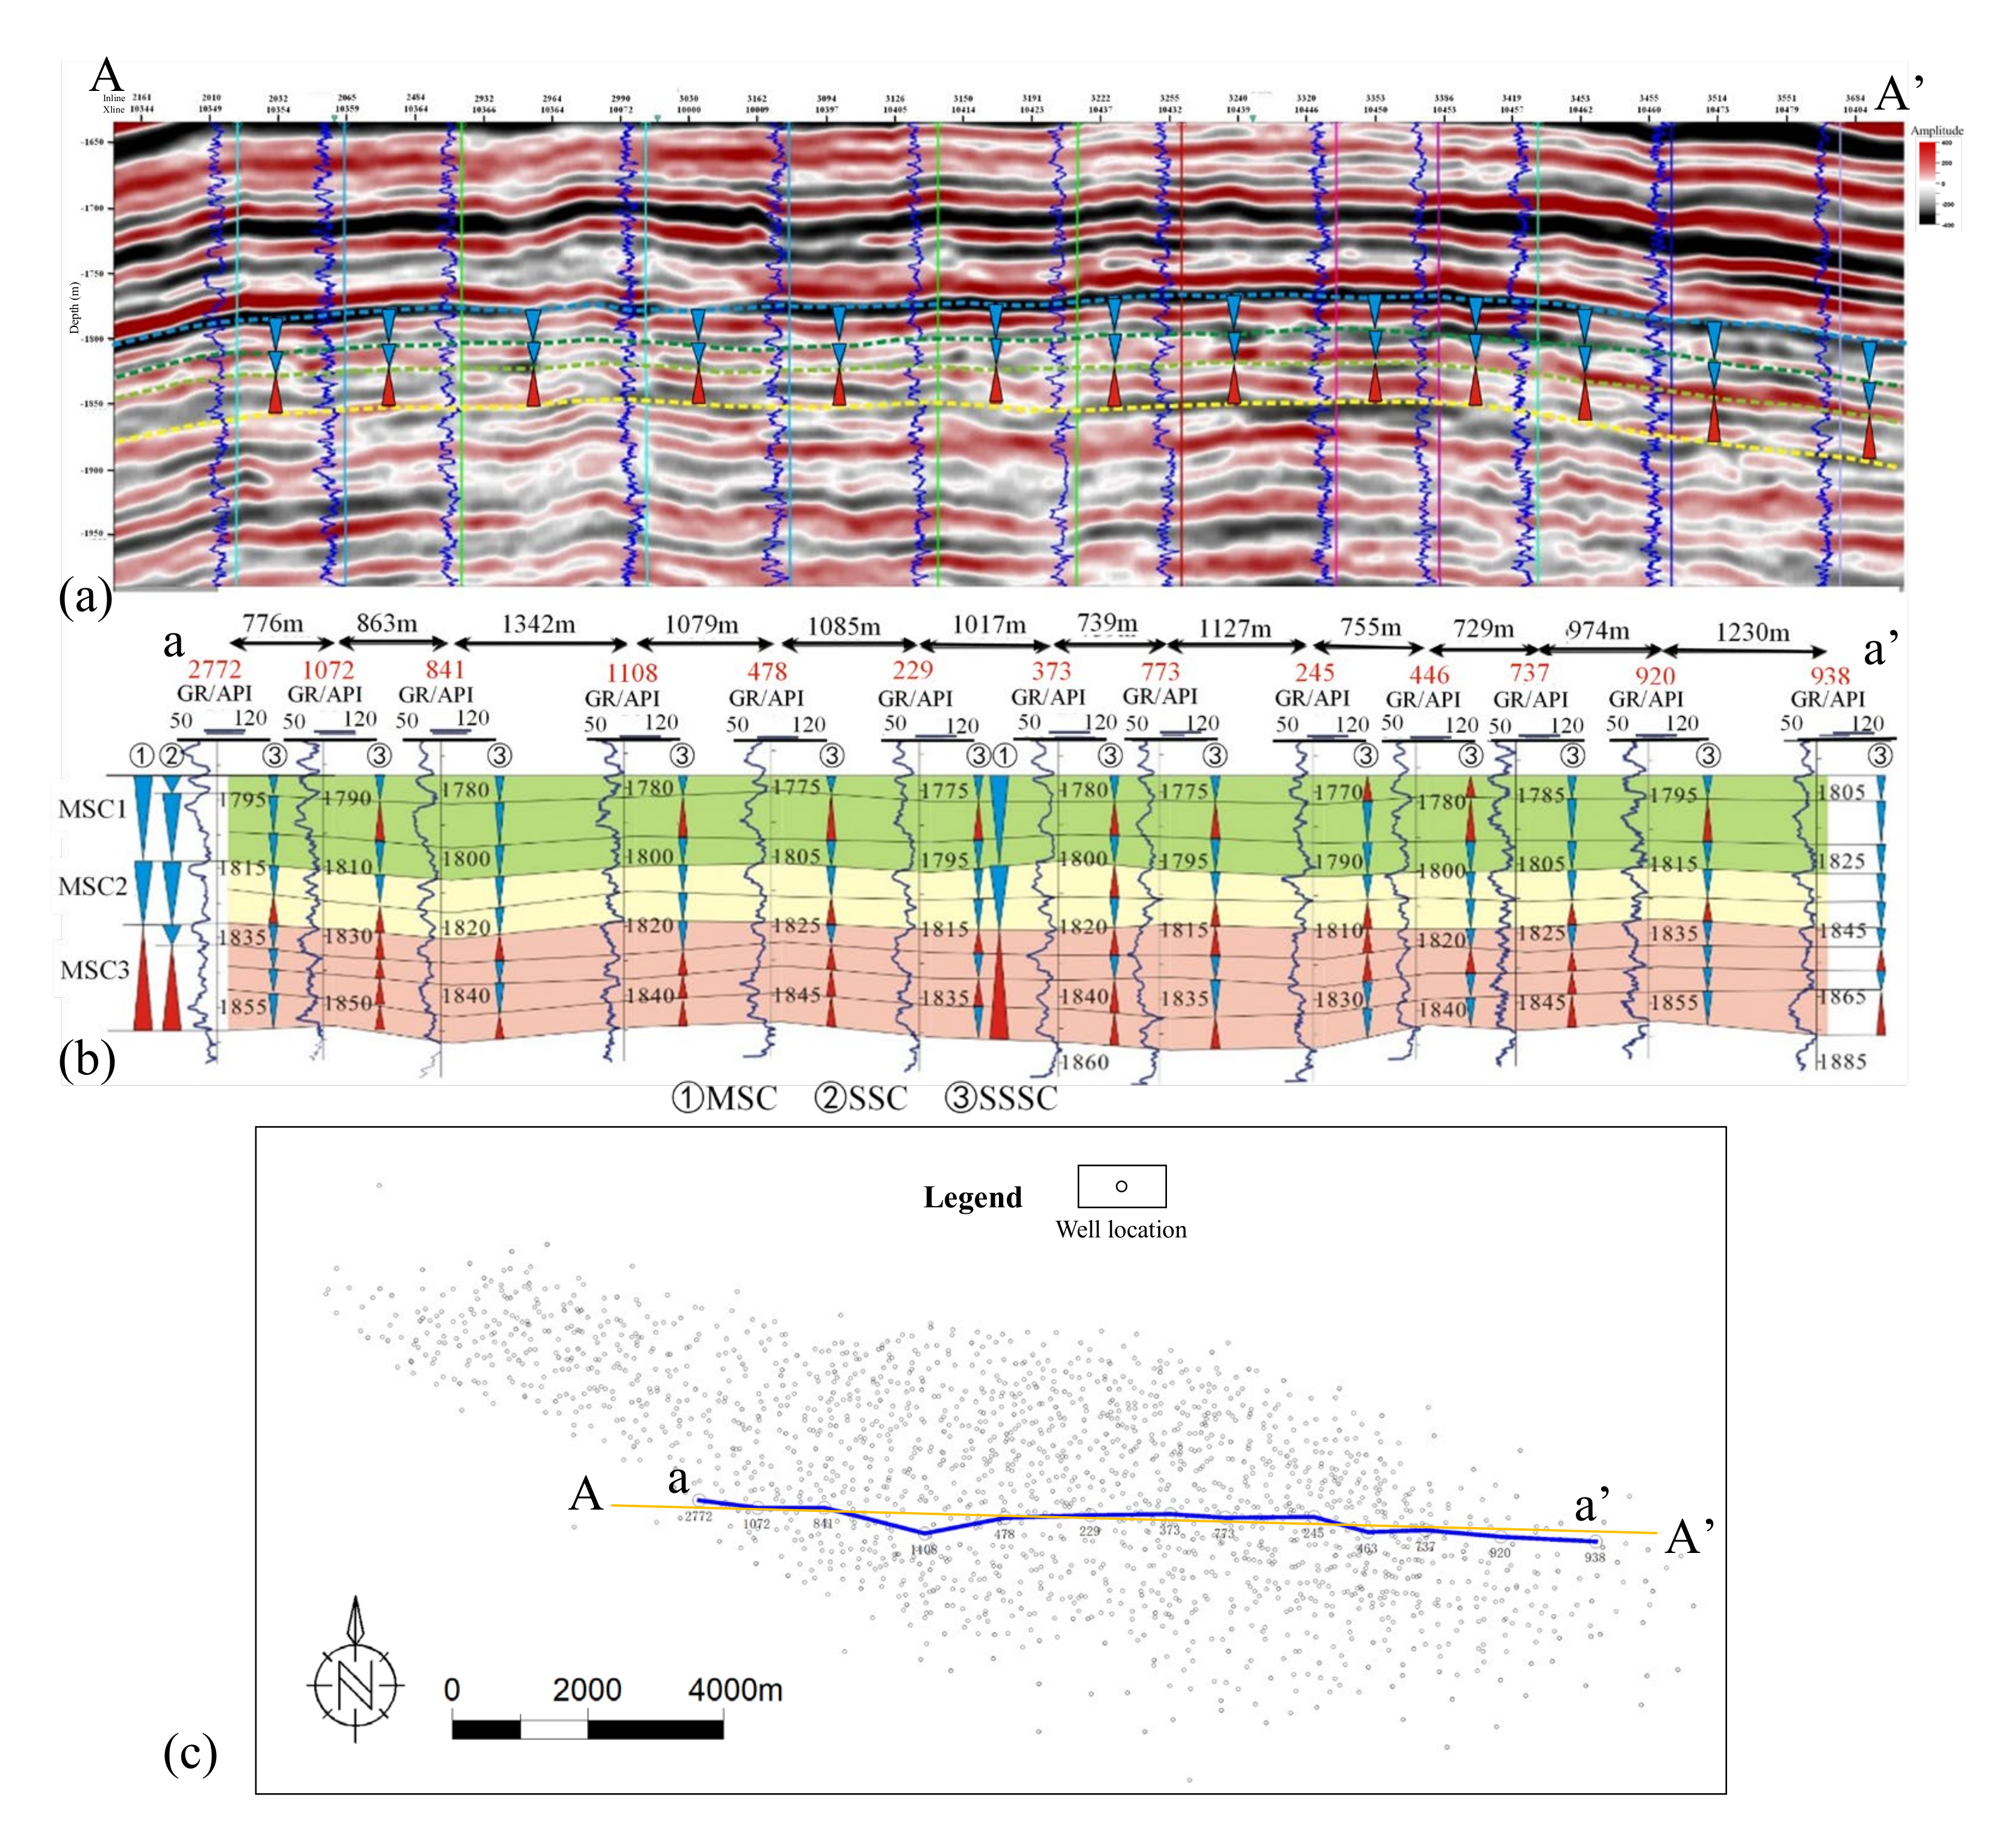
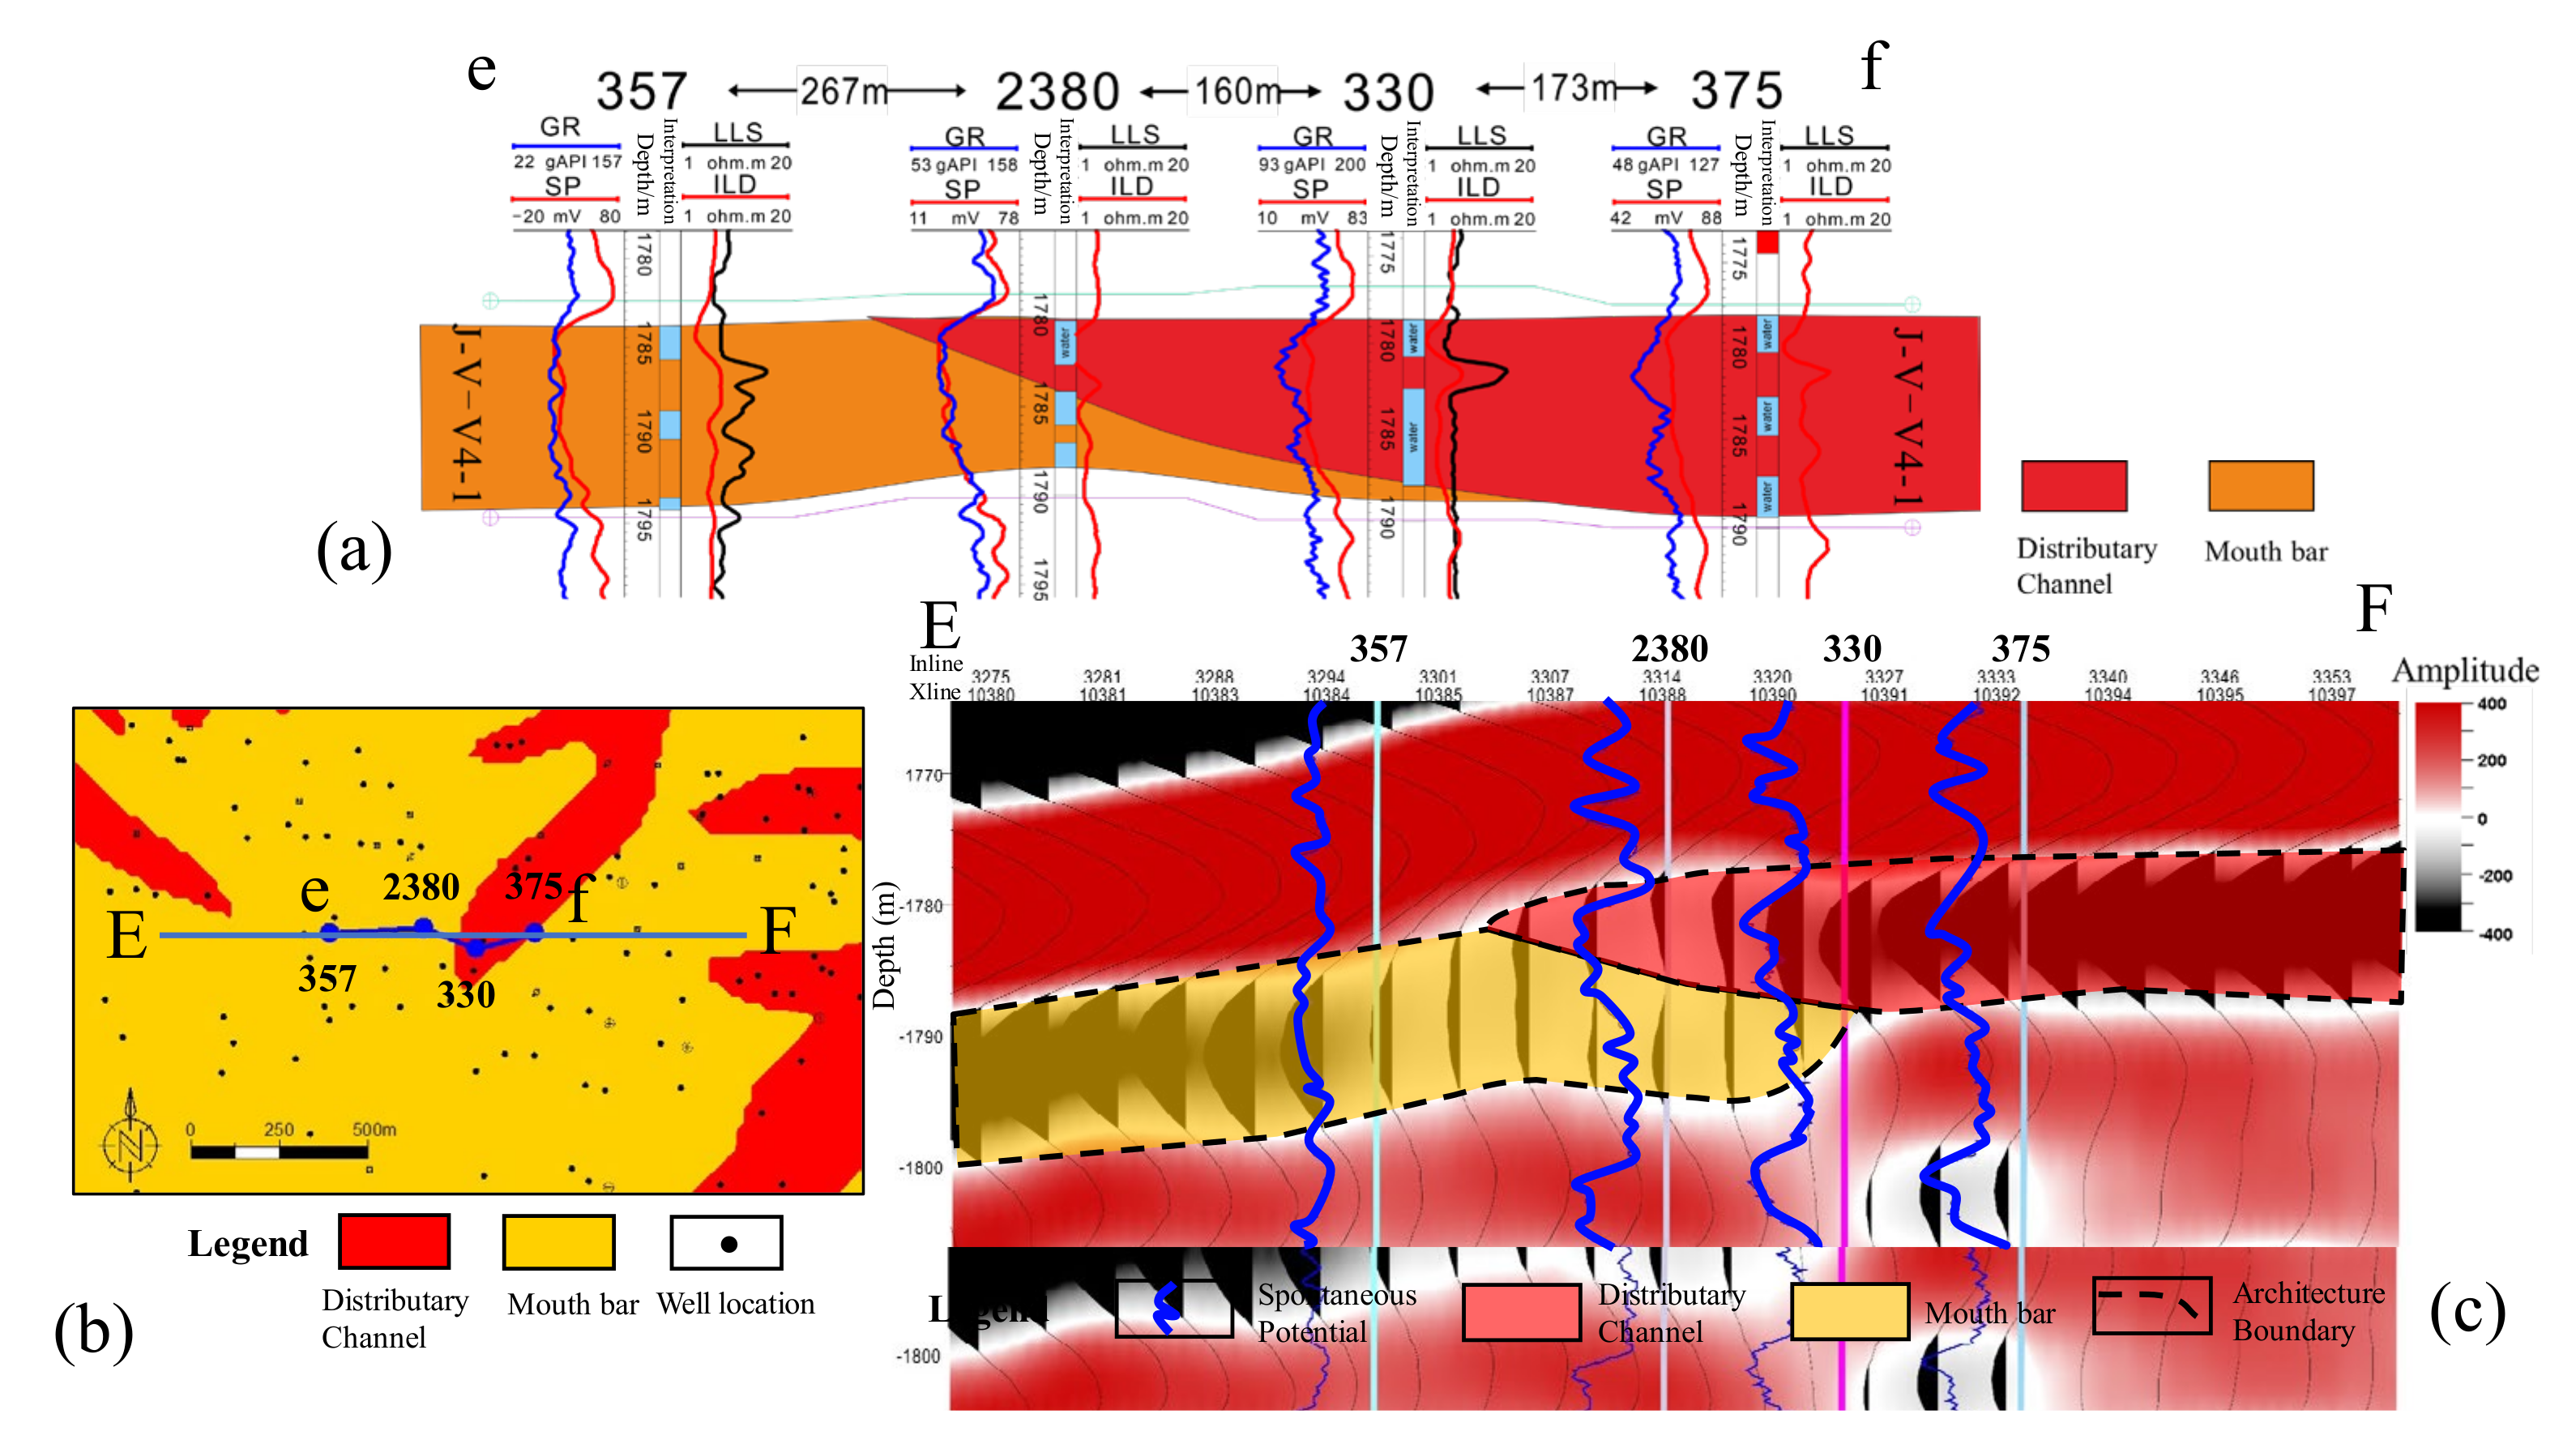
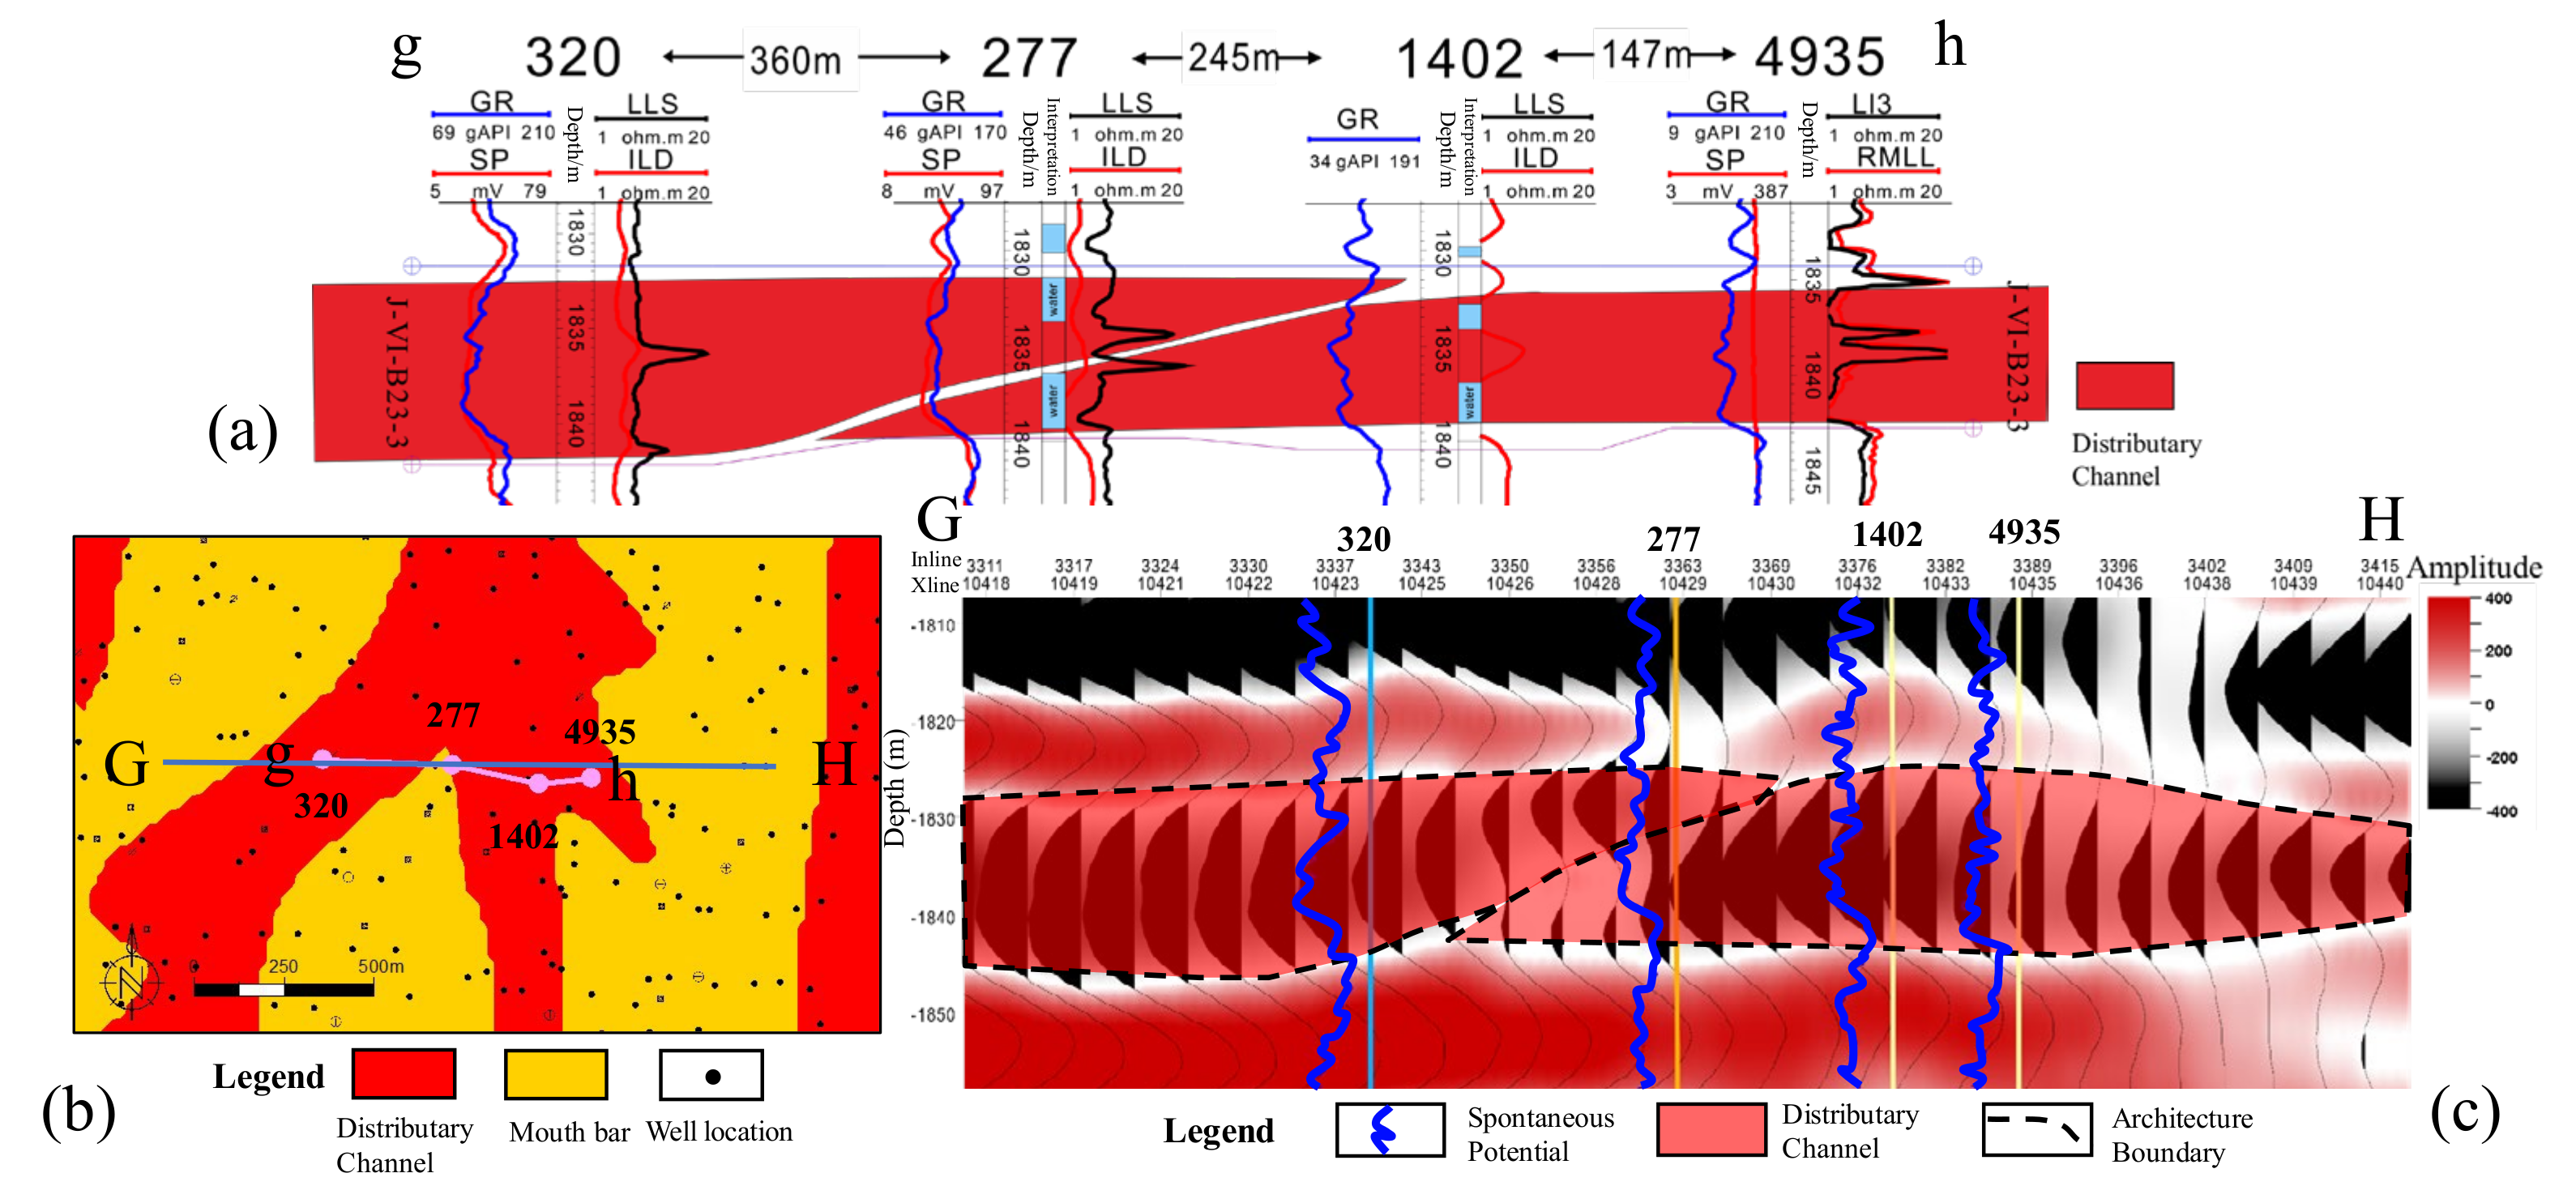
4.2.2. Single Mouth Bar Identification from the Seismic Profile

In order to improve the precision of architecture boundary division, the seismic RMS attribute model (Figure 9) was constructed to guide the architecture boundary division (Figure 10). Because of the gentle structure and high accuracy of the seismic data in the study area, 3D seismic works well to help distinguish mouth bars. Due to the small thickness of the sandstone and the characteristics of “mud wrapped sand” or sand-mud interbedded, at the boundary of individual architecture units, the seismic attributes exhibit weak amplitudes and medium-low frequencies, which can be used to identify architectural boundaries. Similarly, the well-tied seismic profile in the depth domain and seismic waveform variation help guide the interface division of the lateral superimposed single sand body architecture.
The combination pattern between mouth bars was divided into the bar–bar lateral overlap, bar edge between two mouth bars, mud between two bars, and other sand body superposition modes. According to the seismic response and interwell facies profile, the boundary of the individual bar can be identified so as to divide the interwell architecture boundary more accurately (Figure 11, Figure 12, Figure 13 and Figure 14). This combination facilitates more accurate and reliable architecture boundaries between the wells.

5. Discussions

5.1. Single Sand Body Architecture Unit’s Combination Style

The combination mode of the single sand bodies can be divided into vertical tangential superposition, vertical splicing, vertical isolation, lateral superposition, lateral joining, and laterally isolated types by integrating the single sand body type and the overlapping relationship between the sand bodies.

5.1.1. Vertical Combination Style of the Deltaic Sand Bodies

Different architecture units form three vertical stacking modes in the vertical direction: Vertical tangential superposition, vertical splicing, and vertical isolation. Of these, the vertical tangential superposition is divided into the channel–bar superposition and bar–bar superposition (Table 2):
(1)
Channel–bar superposition mode.
In this pattern, the mouth bar deposits are scoured by the distributary channels, mostly exhibiting a compound rhythm in the vertical direction. Calcareous interbeds often develop between the sand bodies. This pattern of the channel on the bar reflects the buoyancy-driven deltaic accretion process in the distributary channel under strong hydrodynamic conditions. The sand body of the distributary channel is cut and superimposed on the sand body of the mouth bar (Table 2a).
(2)
Bar–bar superposition mode.
The bar–bar superposition mode is the vertical superposition of multistage mouth bar sand bodies formed via continuous mouth bar deposition caused by river mouth sedimentary processes. The later mouth bar is cut and superimposed on the earlier mouth bar. A great deal of calcareous cementation occurs near the superposition interface, and calcareous intercalation is developed with strong heterogeneity (Table 2b).
(3)
Vertical splicing mode.
In this model, thin mudstone beds occur between the upper and lower sand bodies, reflecting the vertical splicing relationship between the main body of the first-stage mouth bar and the edge bar sand body controlled by different mouth bars in the second stage. In addition, it reflects the lateral superposition of two single mouth bars (Table 2c).
(4)
Vertical isolation mode.
In this mode, mudstone interbeds develop between the upper and lower sand bodies deposited by two mouth bars at different times. This reflects the progradation process of the delta front sand body in the sedimentary process under various hydrodynamic conditions (Table 2d).

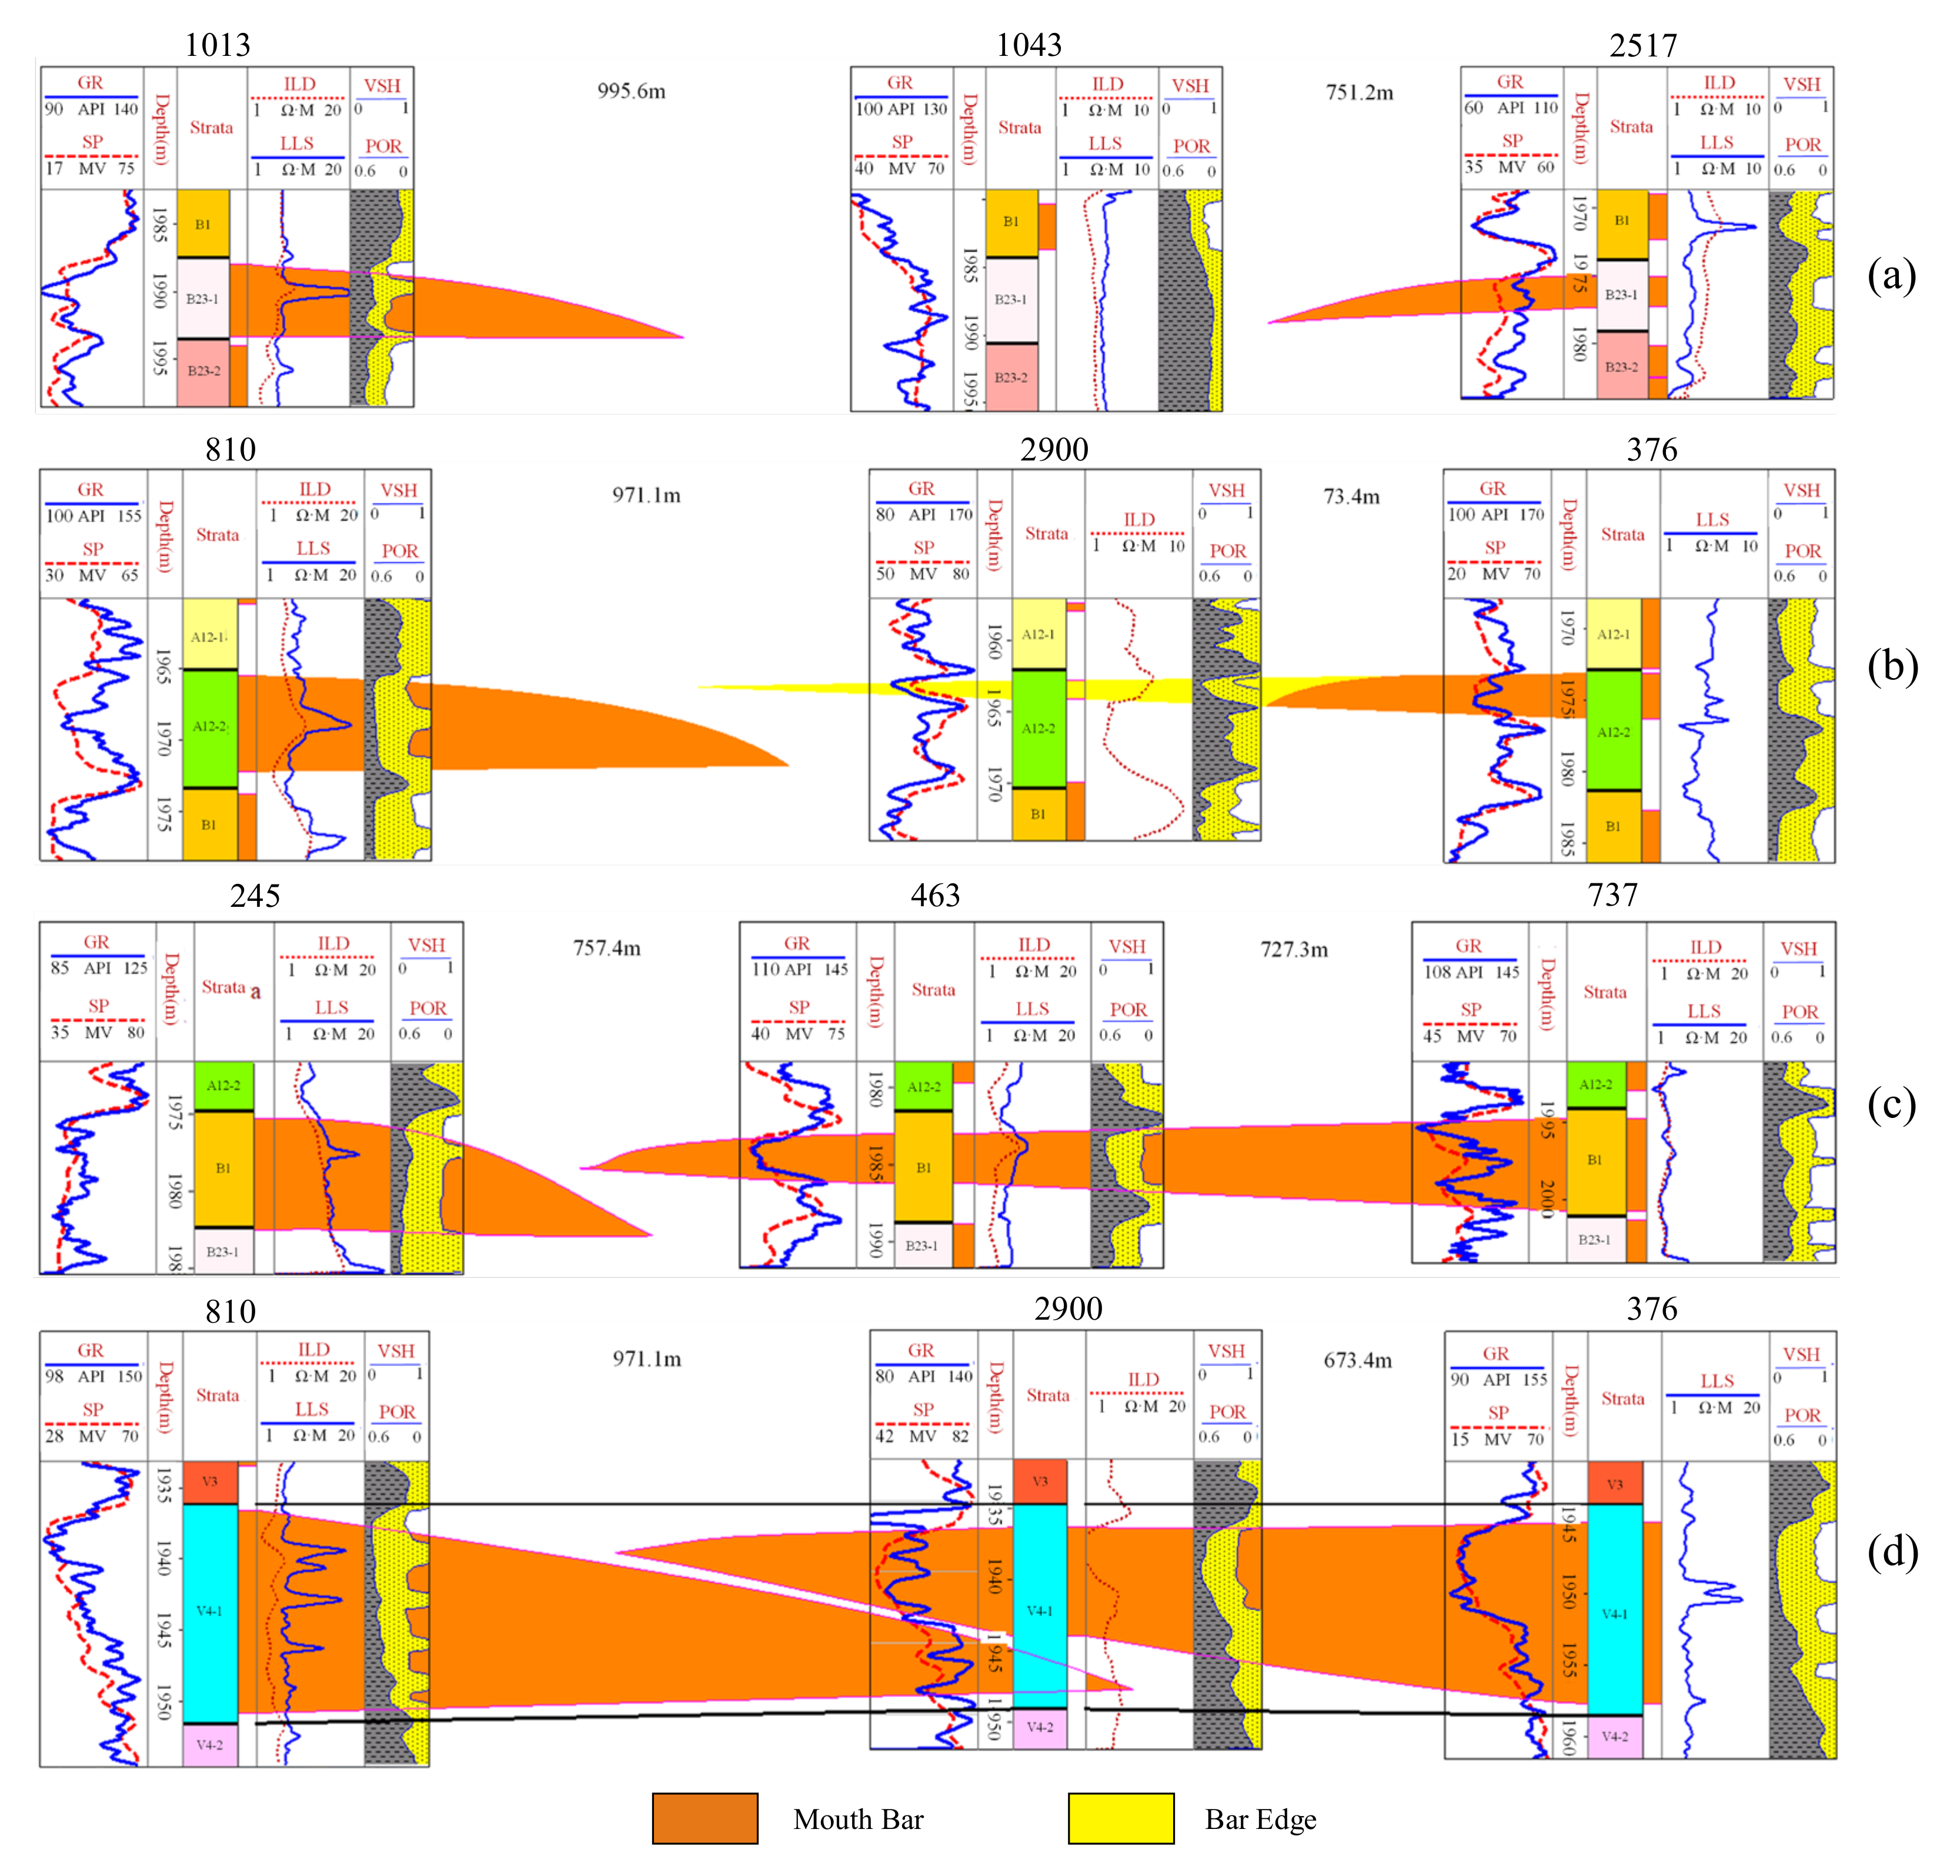
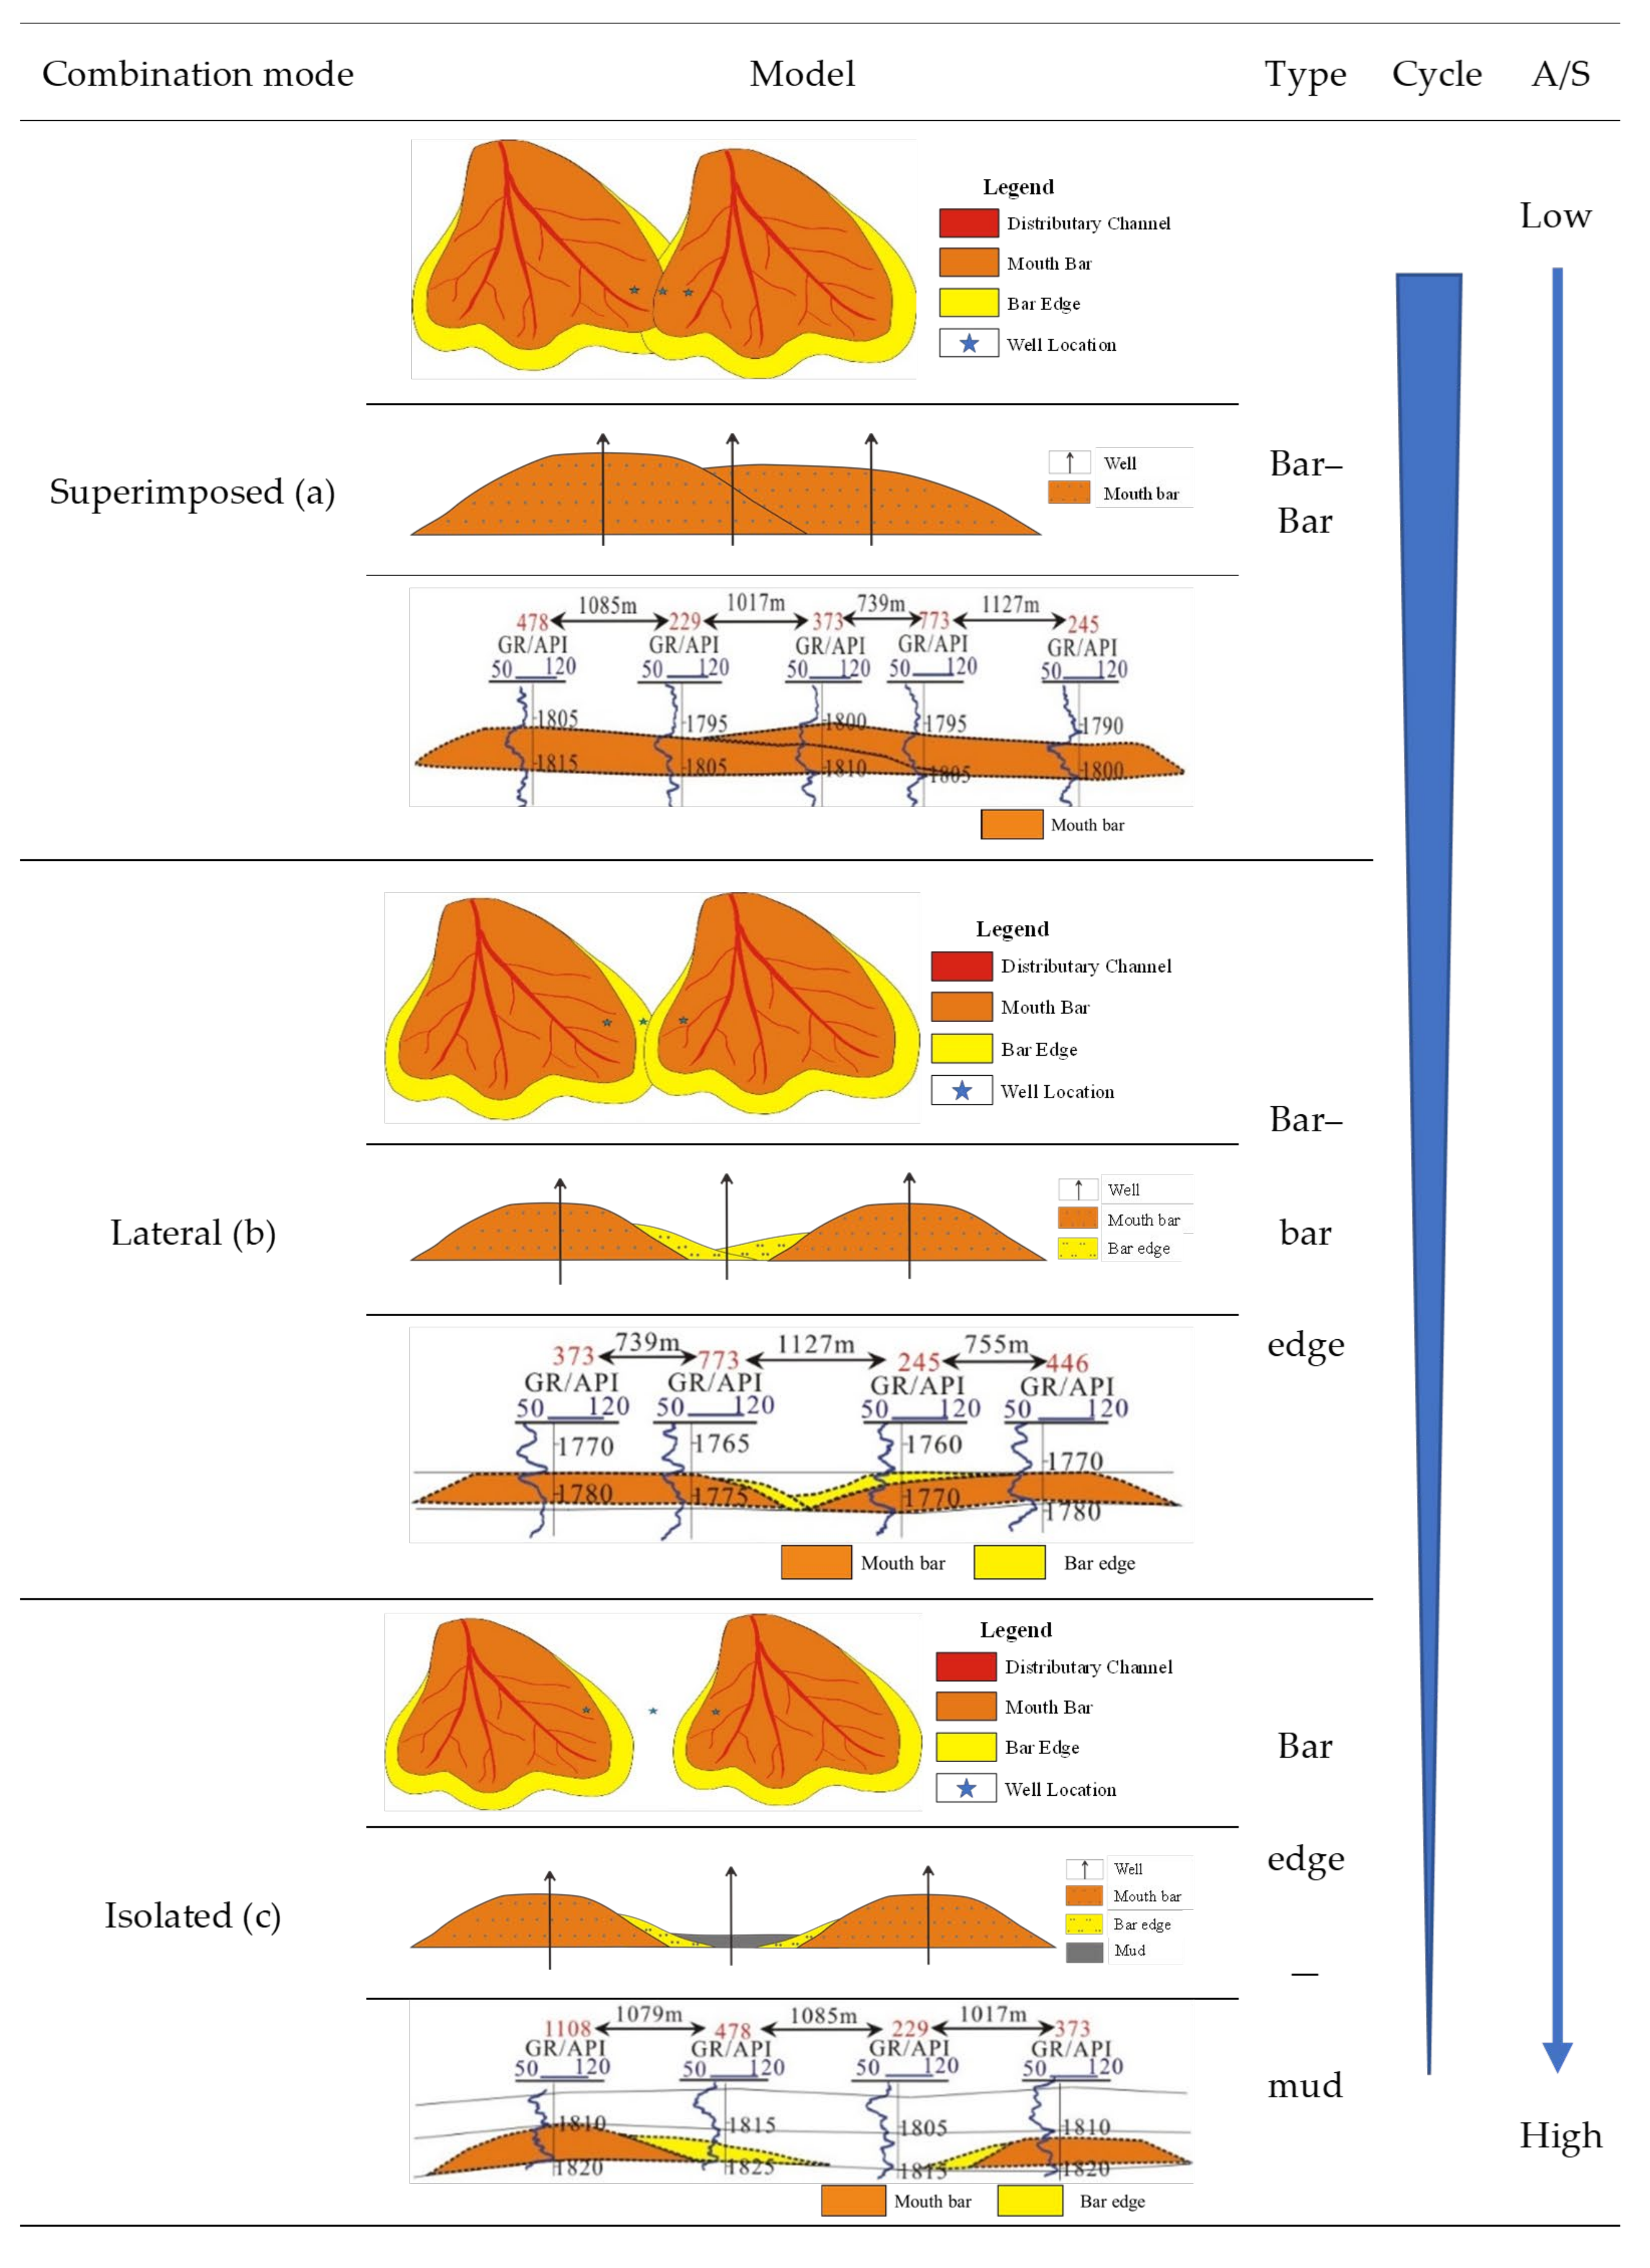
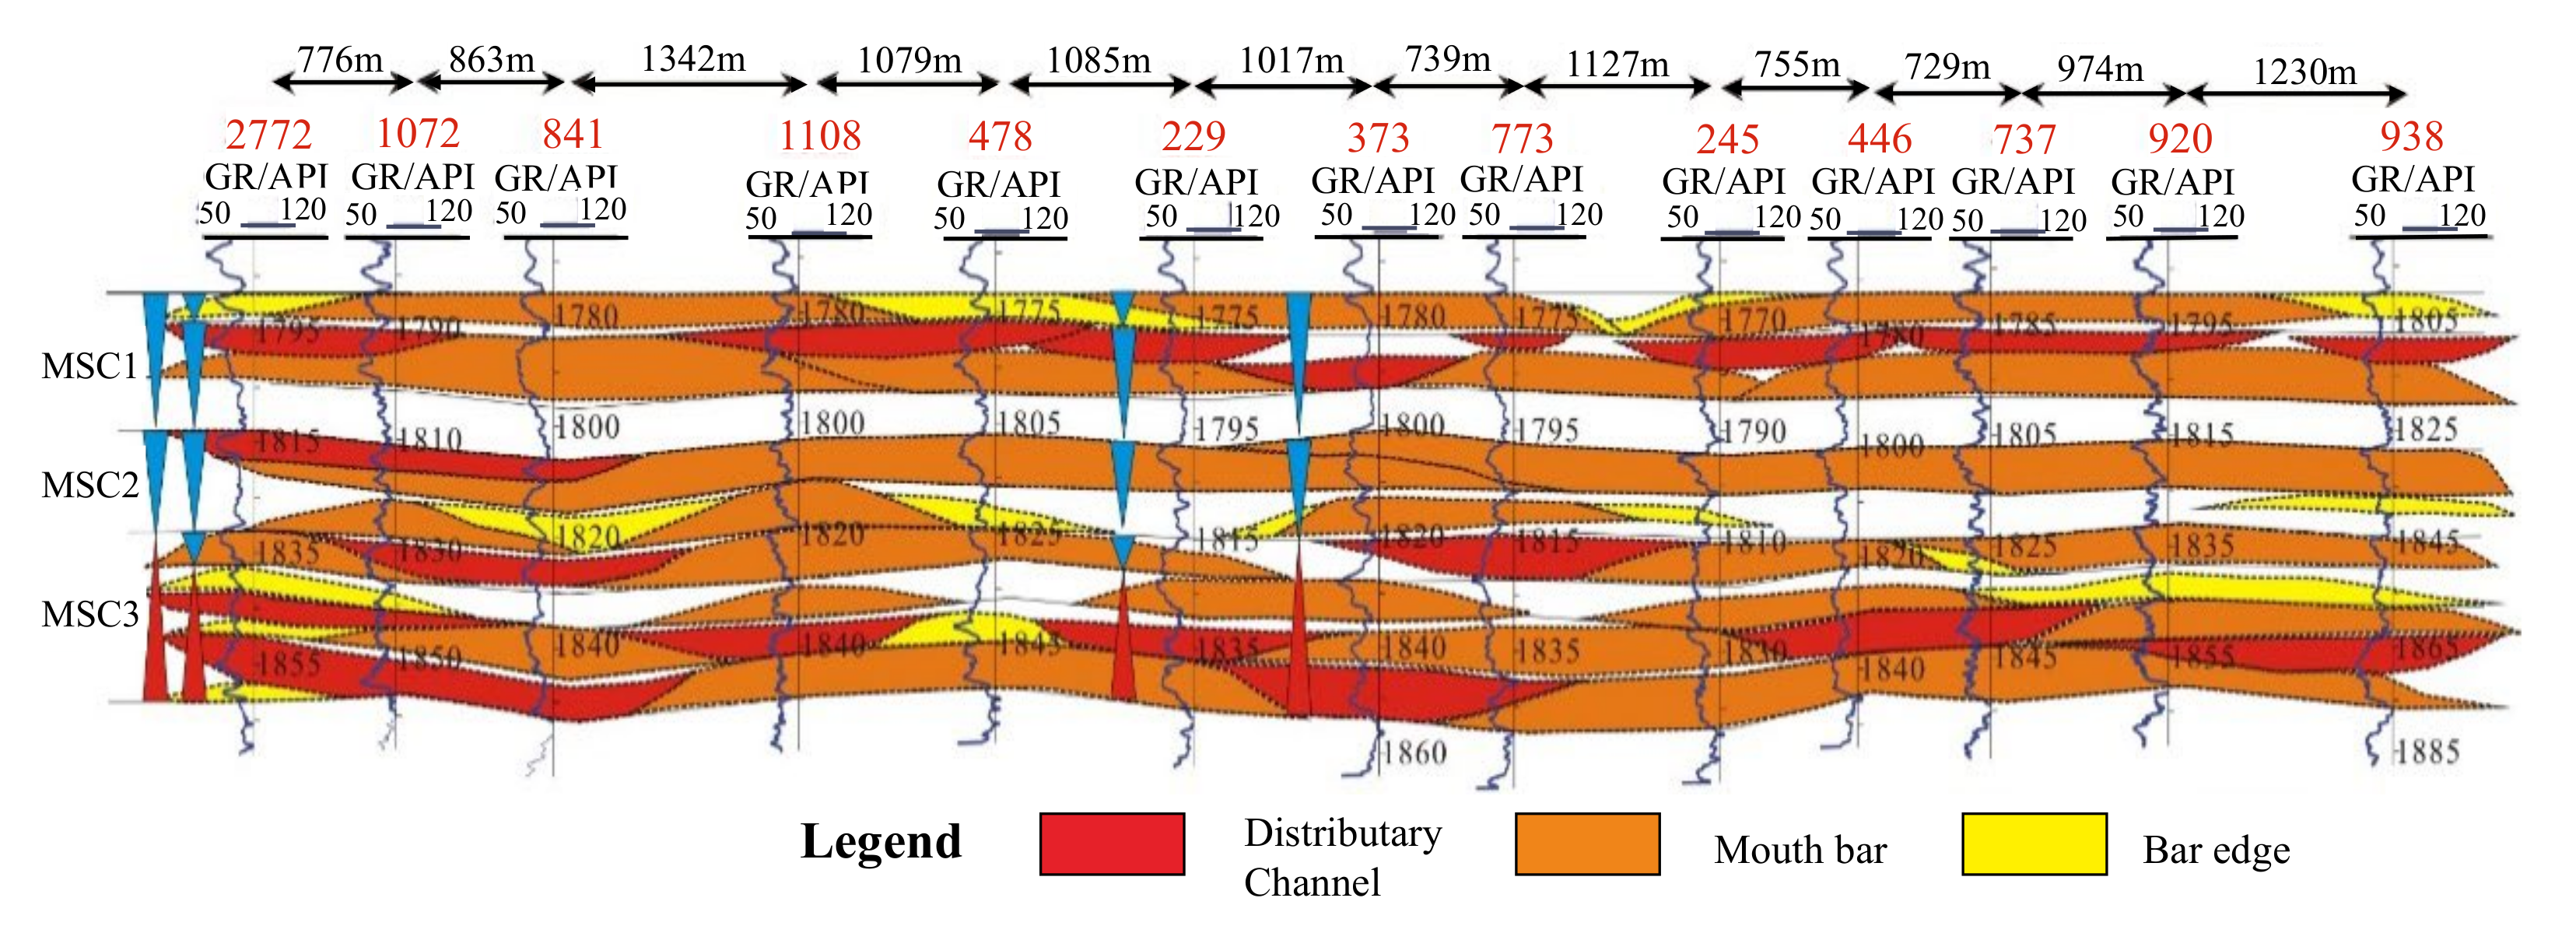
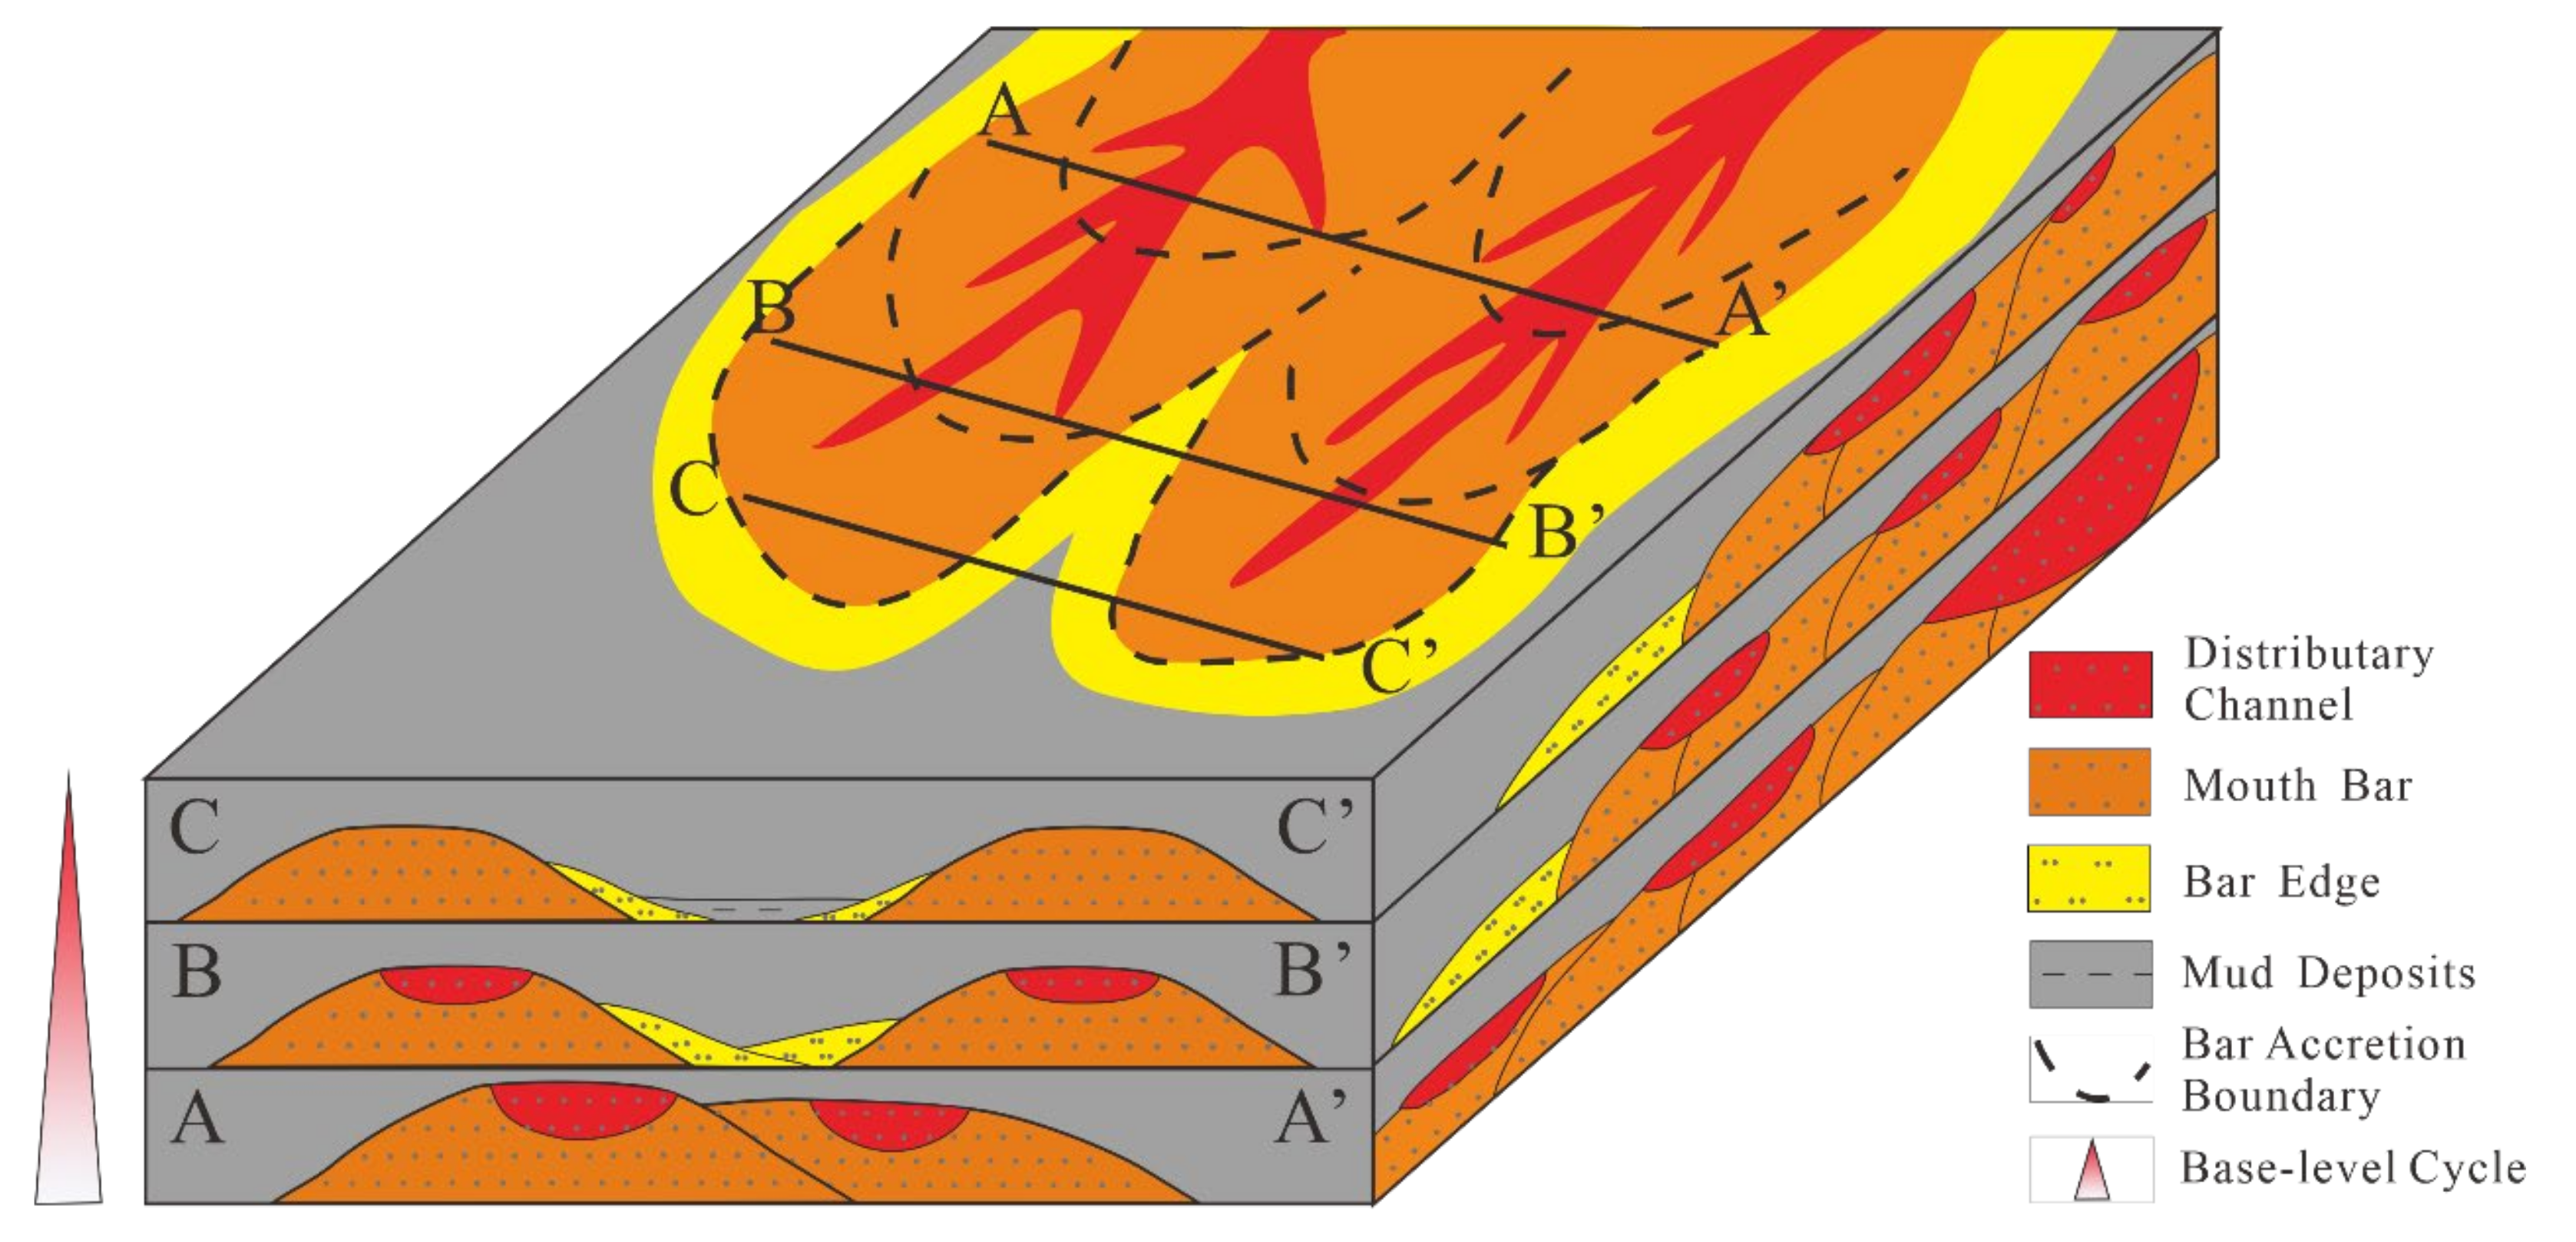
5.1.2. Lateral Combination Style of the Deltaic Sand Bodies

In the lateral direction, the multistage mouth bar exhibits three different lateral splicing patterns that can be divided into superimposed, lateral, and isolated types (Figure 15).
These patterns reflect the relationship between accommodation and the supply ratio during deposition:
(1)
Superimposed mode.
Multistage mouth bar lateral stacking can form a superimposed sand body. The late mouth bar is superimposed laterally on the sand body of the underlying mouth bar, and the two mouth bars are in contact. The sand bodies of the two mouth bars may be interconnected because of the good petrophysical properties of the mouth bar. The logs of the overlapping Wells show a curve return, and the upper and lower curves correspond to the adjacent Wells (Figure 15a).
(2)
Lateral mode.
The laterally connected sand body is usually the lateral migration superposition of the mouth bar and lateral edge. Geometrically, the sand body has less vertical contact, which is mainly reflected in the lateral local overlap. In the process of mouth bar deposition, a certain degree of mutual cutting exists between the two periods of the bar edge. Due to the poor physical properties of the bar edge, the sand body is not completely or partially connected. The splicing well shows the presence of the sand body at the bar edge, or the lateral sand bodies show thin–thick–thin characteristics (Figure 15b).
(3)
Isolation mode.
The isolated sand body refers to the distribution of a sand body in space, which is reflected in the lateral and vertical directions. Stable flood plain mudstones develop between the sand bodies, resulting in no contact between the boundaries of the two sand bodies, no cutting relationship, and no connectivity between the sand bodies. The splicing wells show the appearance of delta mud deposition (Figure 15c).

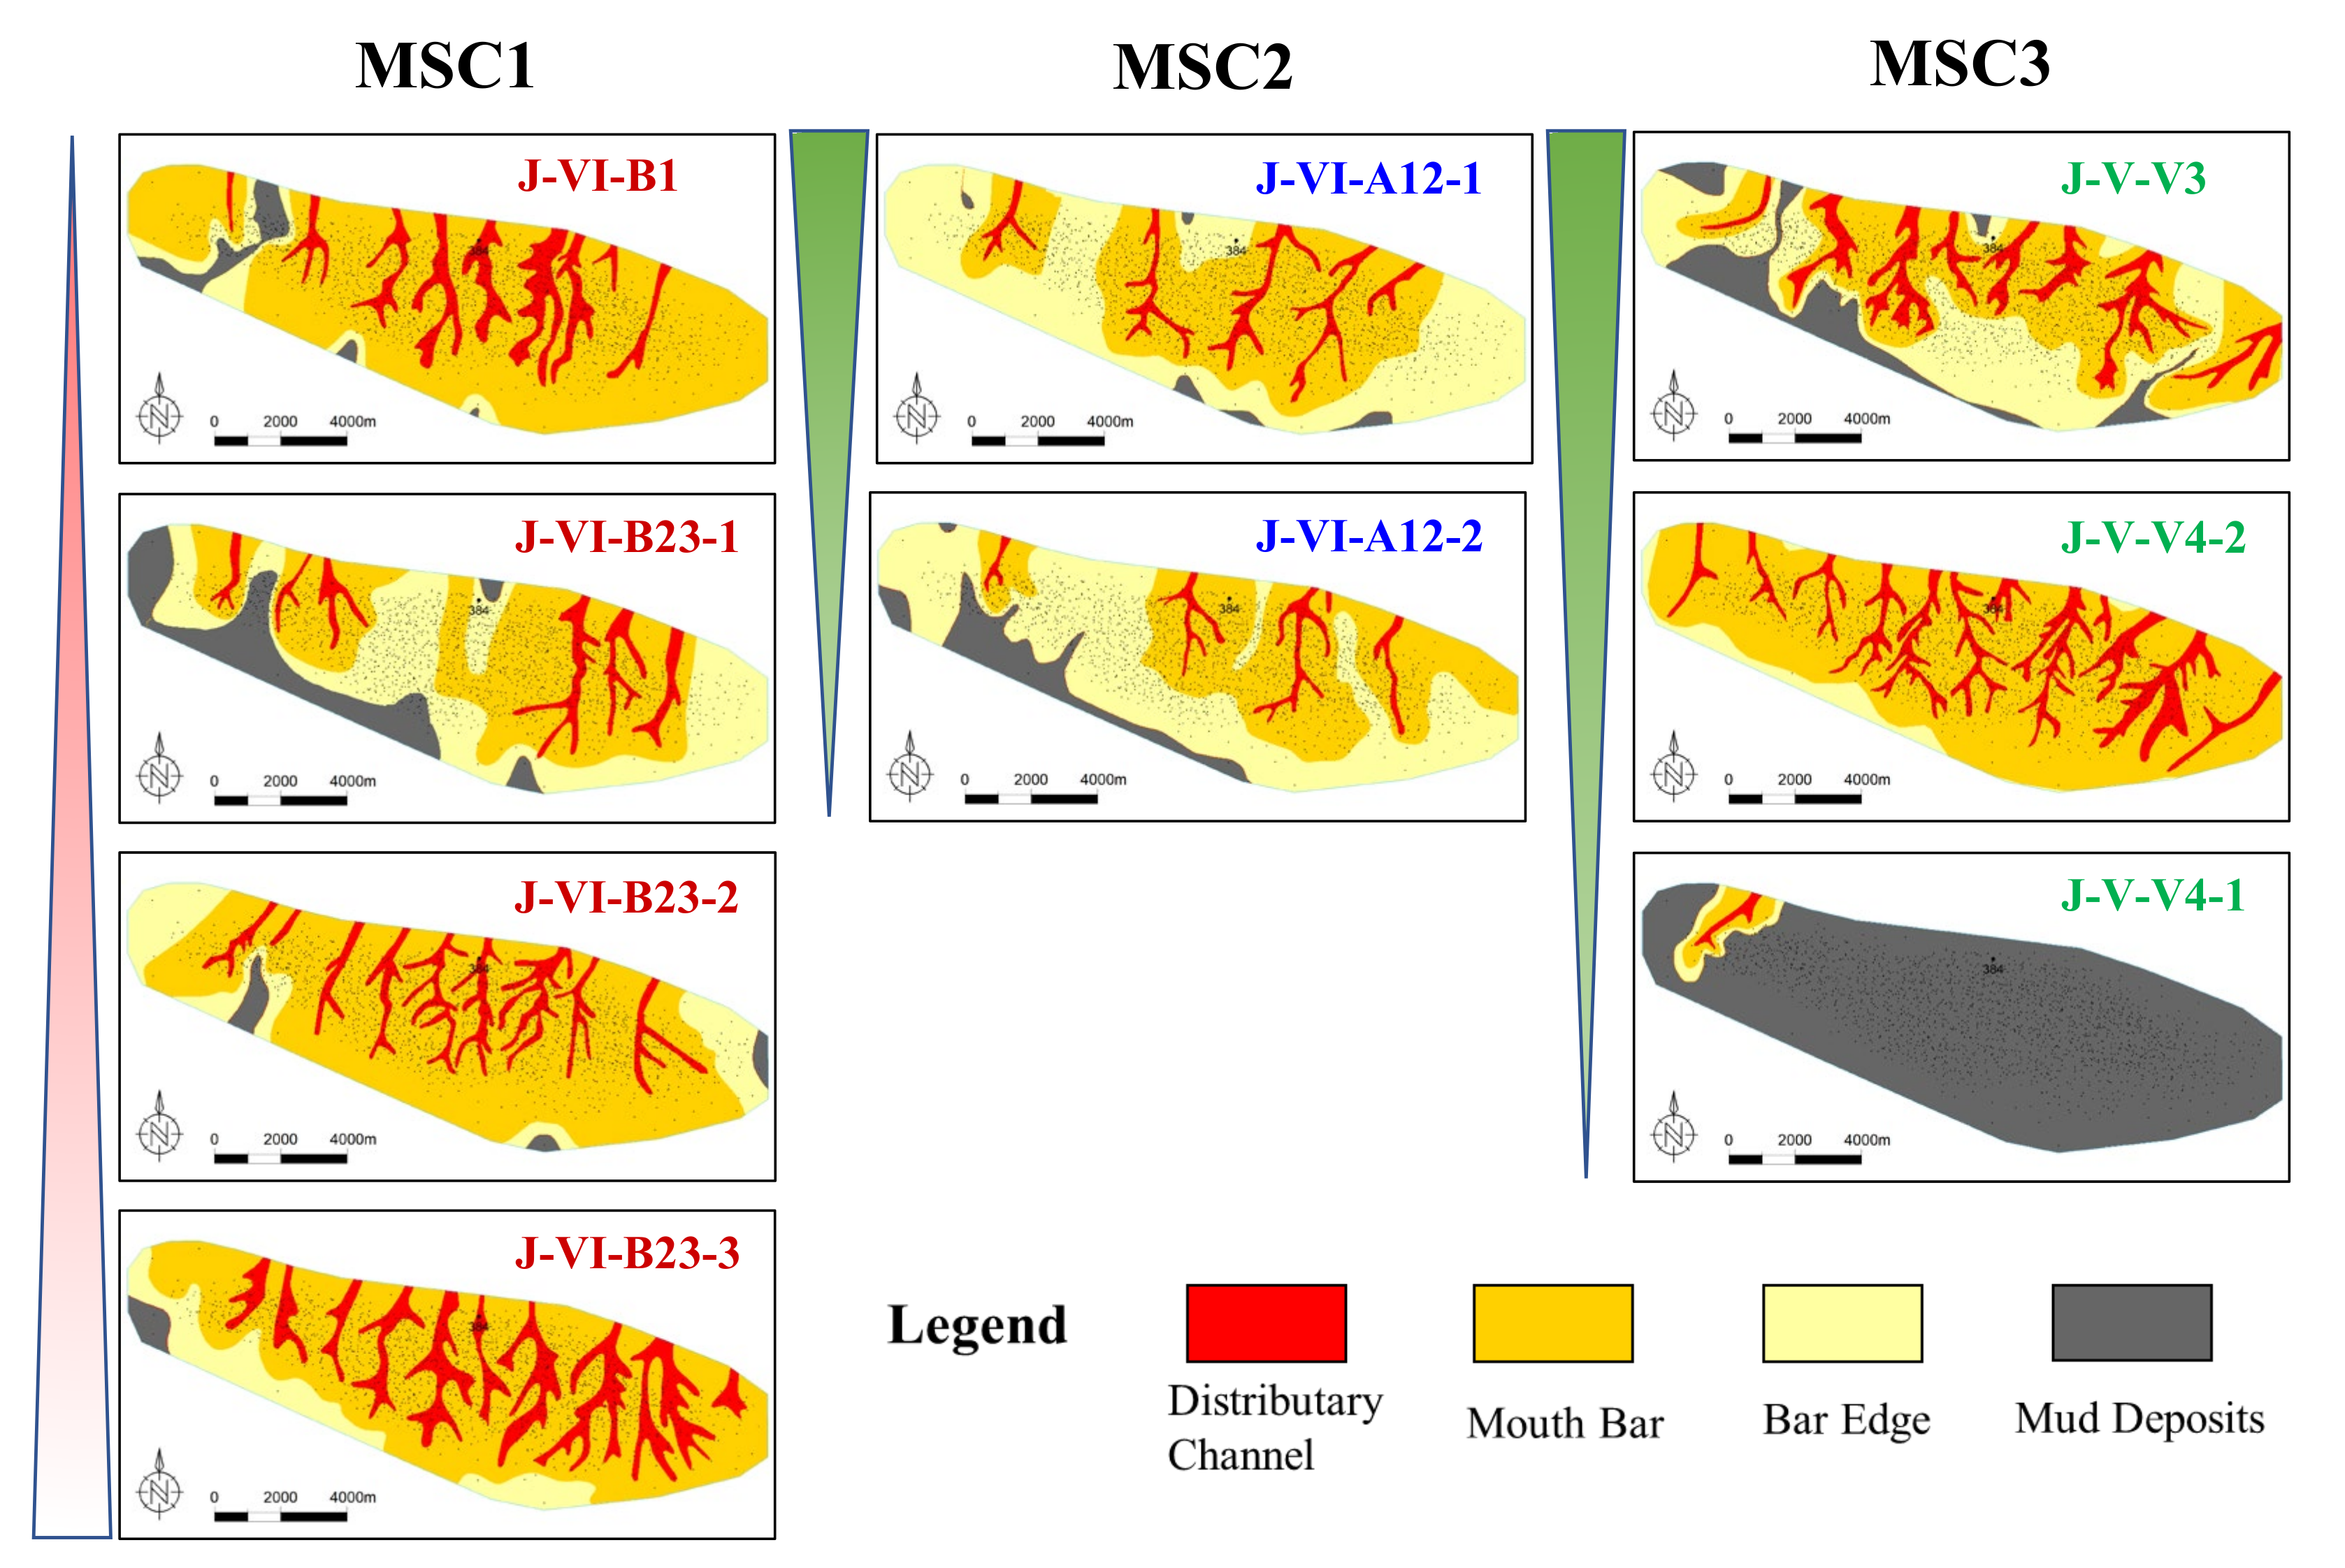
5.2. Sand Body Variation under Base-Level Cycle Control

During the base-level rise within the lower part of J-VI (MSC3), A/S is small at the beginning of the deposition. The mouth bars show a contiguous distribution pattern, and the sand bodies are mainly stacked vertically (Figure 16 and Figure 17). A/S then increases. The delta continues to regress and accumulate. The B23-1 base-level cycle has more deposits on the bar edge, and the sand bodies are mainly laterally stacked.
In the upper part of the MSC2, the base level changes from rising to falling, the A/S continues to increase, and accommodation gradually increases. As the distributary channel progrades into the basin, the thickness of the sand body and the main body area of the bar increase (Figure 16 and Figure 17). A sea-level rise was noted between J-V and J-VI, depositing a set of stable mudstone (J-V-V4-1 base-level cycle). The sea level then gradually dropped, and the base level continued to fall. A/S continued to increase, and accommodation gradually increased. The thickness of the sand body increased, and the delta prograded (Figure 16 and Figure 17).
In the middle and late period of base-level fall or during the early rise, the mouth bar sand body showed a stacking pattern, reflecting the small value of A/S, the frequent lateral migration and bifurcation of the distributary channel, and the formation of a continuous composite sand body belt with good sand body connectivity. The single distributary channel sand body is strip-distributed on the plane and overlapped with the mouth bar sand body.
During the late base-level rise, A/S was large. The rate of lateral migration ability of the sand body was low, and the connectivity between sand bodies was poor. The sand bodies were separated mainly by fine-grained sediments such as mudstone, and most of the mouth bar sand bodies were distributed independently (Figure 18).

6. Conclusions

In this study, 3D seismic data and well log data were used to investigate the deltaic sandstone architecture of the Middle Jurassic oil reservoirs in the Zhetybay Oilfield, Mangeshrak Basin, Kazakhstan. The major target intervals were divided into a long-term base-level cycle (LSC1–LSC2), three medium-term base-level cycles (MSC1–MSC3), five short-term base-level cycles (SSC1–SSC5), and nine super-short-term base-level cycles (SSSC1–SSSC9). The individual deltaic sand bodies in the study area were deposited mainly in distributary channels, mouth bars, and distal mouth bars. The identification of individual sand bodies was conducted with well logs and seismic profiles. The deltaic sand body combination styles were proposed through an analysis of the depositional architecture. In the vertical direction, the deltaic sand body amalgamation styles could be divided into the upper channel and lower bar, upper bar, and lower channel, multichannel superimposed combination, and bar and bar tangency. In the lateral direction, the multistage mouth bar sand bodies showed three lateral splicing patterns: Superimposed, lateral, and isolated types. The evolution of the sand-body superposition mode under the control of the base-level cycle was also analyzed. During the early fall or late rise of the base-level cycle, the sand body was dominated by stacking or slicing. In the late fall or early rise of the base-level cycle, the sand body was mainly side-connected, spliced, or isolated.

Author Contributions

Conceptualization and methodology, D.Z. and Y.L.; investigation, X.L. (Xuanran Li) and R.C.; data curation, L.F. and Z.X.; writing—original draft preparation, X.L. (Xixuan Liao); writing—review and editing, J.N. All authors have read and agreed to the published version of the manuscript.

Funding

This research was funded by the Science Foundation of China University of Petroleum, Beijing, grant number 2462020YXZZ022.

Institutional Review Board Statement

Not applicable.

Informed Consent Statement

Not applicable.

Data Availability Statement

Not applicable.

Conflicts of Interest

The authors declare no conflict of interest.

References

  1. Miall, A.D. Architectural-element analysis: A new method of facies analysis applied to fluvial deposits. Earth-Sci. Rev. 1985, 22, 261–308. [Google Scholar] [CrossRef]
  2. Ashraf, U.; Zhang, H.; Anees, A.; Ali, M.; Zhang, X.; Abbasi, S.S.; Mangi, H.N. Controls on reservoir heterogeneity of a shallow-marine reservoir in Sawan Gas Field, SE Pakistan: Implications for reservoir quality prediction using acoustic impedance inversion. Water 2020, 12, 2972. [Google Scholar] [CrossRef]
  3. Anees, A.; Zhang, H.; Ashraf, U.; Wang, R.; Liu, K.; Abbas, A.; Ullah, Z.; Zhang, X.; Duan, L.; Liu, F.; et al. Sedimentary facies controls for reservoir quality prediction of lower shihezi member-1 of the Hangjinqi area, Ordos Basin. Minerals 2022, 12, 126. [Google Scholar] [CrossRef]
  4. Dar, Q.U.; Pu, R.; Baiyegunhi, C.; Shabeer, G.; Ali, R.I.; Ashraf, U.; Sajid, Z.; Mehmood, M. The impact of diagenesis on the reservoir quality of the early Cretaceous Lower Goru sandstones in the Lower Indus Basin, Pakistan. J. Pet. Explor. Prod. Technol. 2022, 12, 1437–1452. [Google Scholar] [CrossRef]
  5. Li, S.; Song, X.; Jiang, Y.; Liu, L. Architecture and remaining oil distribution of the sandy braided river reservoir in the Gaoshangpu Oilfield. Pet. Explor. Dev. 2011, 38, 474–482. [Google Scholar]
  6. Lin, Y.; Wu, S.; Yue, D.; Yan, J.; Li, B.; Wang, L. Fine anatomizing reservoir architecture of fan-delta front: A case study on Dujiatai reservoir in Shu 2-6-6 block, Liaohe oilfield. Nat. Gas Geosci. 2013, 24, 335–344. [Google Scholar]
  7. Liu, Y.; Hou, J.; Wang, L.; Xue, J.; Liu, X.; Fu, X. Architecture analysis of braided river reservoir. J. China Univ. Pet. (Ed. Nat. Sci.) 2009, 1, 7–11. [Google Scholar]
  8. Qiu, Y. Developments in reservoir sedimentology of continental clastic rocks in China. Acta Sedimentol. Sin. 1992, 10, 16–24. [Google Scholar]
  9. Wu, L. The meticulous depiction of the high quality sand body of tidal channel based on sand body configuration—Take T2 group in Taiyuan formation of Kangning gas area in the eastern edge of ordos basin as an example. Petrochem. Ind. Technol. 2018, 25, 181–184. [Google Scholar]
  10. Wu, S.; Yue, D.; Liu, J.; Shu, Q. Hierarchical modeling of underground palaeochannel reservoir architecture. Sci. Chinapress 2008, 38, 111–121. [Google Scholar]
  11. Xu, A.; Mu, L. Distribution Pattern of OOP and Remaining Mobile Oil in Different Types of Sedimentary Reservoir of China. Pet. Explor. Dev. 1998, 25, 41–44. [Google Scholar]
  12. Yue, D.; Wu, S.; Tan, H. An anatomy of paleochannel reservoir architecture of meandering river reservoir—A case study of Guantao formation, the west 7th block of Gudong oilfield. Earth Sci. Front. 2008, 15, 101–109. [Google Scholar]
  13. Zhang, Z.; Zhang, Y. Study on Deepwater Turbidity Channel Reservoir Architecture in Lower Es1, Lianmeng Oilfield. Unconventonal Oil Gas 2017, 4, 17–24. [Google Scholar]
  14. Zhao, P.; Li, D.; Yang, X.; Zhao, X. Sedimentary architecture characteristics of the gravity flow channel sandbodies in the Niger Delta Front. Geol. Sci. Technol. Inf. 2014, 33, 28–37. [Google Scholar]
  15. Ashraf, U.; Zhang, H.; Anees, A.; Mangi, H.N.; Ali, M.; Zhang, X.; Imraz, M.; Abbasi, S.S.; Abbas, A.; Ullah, Z.; et al. A core logging, machine learning and geostatistical modeling interactive approach for subsurface imaging of lenticular geobodies in a clastic depositional system, SE Pakistan. Nat. Resour. Res. 2021, 30, 2807–2830. [Google Scholar] [CrossRef]
  16. Thanh, H.V.; Sugai, Y. Integrated modelling framework for enhancement history matching in fluvial channel sandstone reservoirs. Upstream Oil Gas Technol. 2021, 6, 100027. [Google Scholar] [CrossRef]
  17. Anees, A.; Zhang, H.; Ashraf, U.; Wang, R.; Liu, K.; Mangi, H.N.; Jiang, R.; Zhang, X.; Liu, Q.; Tan, S.; et al. Identification of Favorable Zones of Gas Accumulation Via Fault Distribution and Sedimentary Facies: Insights from Hangjinqi Area, Northern Ordos Basin. Front. Earth Sci. 2022, 9, 822670. [Google Scholar] [CrossRef]
  18. Bhattacharya, J.P.; Payenberg, T.H.D.; Lang, S.C.; Bourke, M. Dynamic river channels suggest a long-lived Noachian crater lake on Mars. Geophys. Res. Lett. 2005, 32, 153–174. [Google Scholar] [CrossRef] [Green Version]
  19. Wang, Z.; He, Z.; Zhang, C.; Li, S.; Xu, L. Analysis on Reservoir Hierarchy of Deltaic Front Outcrops—Taking Tanjiahe Outcrop in Eastern Ordos Basin for Example. J. Jianghan Pet. Inst. 2004, 26, 32–35. [Google Scholar]
  20. Duan, D.; Hou, J.; Liu, Y.; Wang, C.; Gao, J. Quantitative research of fluvial-dominated delta front sedimentary system: A case study of Poyang Lake Delta. Acta Sedimentol. Sin. 2014, 32, 270–277. [Google Scholar]
  21. Yu, X.; Wang, D.; Zheng, J.; Sun, Z. 3-D extension models of braided deltaic sandbody in terrestrial facies—An observation on deposition of modern deltas in Daihai Lake, Inner Mongolia. Acta Pet. Sin. 1994, 15, 26–37. [Google Scholar]
  22. Wu, W.; Li, Q.; Pei, J.; Ning, S.; Tong, L.; Liu, W.; Feng, Z. Seismic sedimentology, facies analyses, and high-quality reservoir predictions in fan deltas: A case study of the Triassic Baikouquan Formation on the western slope of the Mahu Sag in China’s Junggar Basin. Mar. Pet. Geol. 2020, 120, 104546. [Google Scholar] [CrossRef]
  23. Xu, Z.; Plink-Björklund, P.; Wu, S.; Liu, Z.; Feng, W.; Zhang, K.; Yang, Z.; Zhong, Y. Sinuous bar fingers of digitate shallow-water deltas: Insights into their formative processes and deposits from integrating morphological and sedimentological studies with mathematical modelling. Sedimentology 2021, 69, 724–749. [Google Scholar] [CrossRef]
  24. John, A.K.; Lake, L.W.; Torres-Verdin, C.; Srinivasan, S. Seismic facies identification and classification using simple statistics. SPE Reserv. Eval. Eng. 2008, 11, 984–990. [Google Scholar] [CrossRef] [Green Version]
  25. Cao, L.; Chang, S.; Yao, Y. Application of seismic sedimentology in predicating sedimentary microfacies and coalbed methane gas content. J. Nat. Gas Sci. Eng. 2019, 69, 102944. [Google Scholar] [CrossRef]
  26. Zhao, Z.X.; Dong, C.M.; Lin, C.Y.; Zhang, X.G.; Huang, X.; Li, B.J.; Guo, W.; Zhu, Z.Q. Sedimentary environment and facies of the Huagang Formation in the northern central Xihu Depression, East China Sea Basin, China. Aust. J. Earth Sci. 2020, 67, 379–392. [Google Scholar] [CrossRef]
  27. Abbas, A.; Zhu, H.; Zeng, Z.; Zhou, X. Sedimentary facies analysis using sequence stratigraphy and seismic sedimentology in the Paleogene Pinghu Formation, Xihu Depression, East China Sea Shelf Basin. Mar. Pet. Geol. 2018, 93, 287–297. [Google Scholar] [CrossRef]
  28. Lutome, M.; Lin, C.; Chunmei, D.; Zhang, X.; Harishidayat, D. Seismic sedimentology of lacustrine delta-fed turbidite systems: Implications for paleoenvironment reconstruction and reservoir prediction. Mar. Pet. Geol. 2020, 113, 104159. [Google Scholar] [CrossRef]
  29. Zeng, H.; Zhu, X.; Liu, Q.; Zhu, H.; Xu, C. An alternative, seismic-assisted method of fluvial architectural-element analysis in the subsurface: Neogene, Shaleitian area, Bohai Bay Basin, China. Mar. Pet. Geol. 2020, 118, 104435. [Google Scholar] [CrossRef]
  30. Aitken, J.F.; Howell, J.A. High resolution sequence stratigraphy: Innovations, applications and future prospects; Geological Society: London, UK, 1996; Volume 104, pp. 1–9. [Google Scholar]
  31. Zheng, R.; Peng, J.; Wu, C. Grade division of base-level cycles of terrigenous basin and its implications. Acta Sedimentol. Sin. 2001, 19, 249–255. [Google Scholar]
  32. Zheng, R.; Yin, S.; Peng, J. Sedimentary dynamic analysis of sequence structure and stacking pattern of base-level cycle. Acta Sedimentol. Sin. 2000, 18, 369–375. [Google Scholar]
  33. Zecchin, M.; Catuneanu, O. High-resolution sequence stratigraphy of clastic shelves III: Applications to reservoir geology. Mar. Pet. Geol. 2015, 62, 161–175. [Google Scholar] [CrossRef]
  34. Jiang, Z. Studies of depositional systems and sequence stratigraphy: The present and the future. Oil Gas Geol. 2010, 31, 535–541. [Google Scholar]
  35. Li, F.; Guo, R.; Yu, Y. Progress and prospect of the division of sequence stratigraphy. Geol. Sci. Technol. Inf. 2019, 38, 215–224. [Google Scholar]
  36. Wang, X.; Yu, S.; Li, S.; Zhang, N. Two parameter optimization methods of multi-point geostatistics. J. Pet. Sci. Eng. 2022, 208, 109724. [Google Scholar] [CrossRef]
  37. Zheng, R.; Peng, J. Analysis and isochronostratigraphic correlation of high-resolution sequence stratigraphy for Chang-6 Oil reservoir set in Zhidan delta, northern Ordos Basin. Acta Sedimentol. Sin. 2002, 20, 92–100. [Google Scholar]
  38. Ren, S.; Yao, G.; Mao, W. Genetic Types and superposition Patterns of Subaqueous Distributary Channel Thin Sandbodies in Delta Front: A case study from the IV-VI reservoir groups of H3 in Biqian 10 area of Gucheng oilfield. Acta Sedimentol. Sin. 2016, 34, 582–593. [Google Scholar]
  39. Yang, Y.; Wu, S.; Yue, D.; Lan, X.; Li, Y.; Shen, Y. Evolution of Mouth Bar Complex’s Architecture in a Long-term Base-Level Cycle: A Case from the Lower Es2 Member in Fault-Block Tuo 7, Shengtuo Oilfield. Acta Sedimentol. Sin. 2015, 33, 326–336. [Google Scholar]
  40. Wang, X.; Zhang, F.; Li, S.; Dou, L.; Liu, Y.; Ren, X.; Chen, D.; Zhao, W. The Architectural Surfaces Characteristics of Sandy Braided River Reservoirs, Case Study in Gudong Oil Field, China. Geofluids 2021, 2021, 8821711. [Google Scholar] [CrossRef]
  41. Wang, Y.; Peng, J.; Li, W.; Li, S.; Kang, Q.; Sun, S.; Ji, L.; Sun, J.; Ma, R. The Functional Relation between Base-level Cycle and A/S Ratio and Their Geologic Implications. Acta Sedimentol. Sin. 2005, 23, 483. [Google Scholar]
  42. Wang, X.; Liu, Y.; Hou, J.; Li, S.; Kang, Q.; Sun, S.; Ji, L.; Sun, J.; Ma, R. The relationship between synsedimentary fault activity and reservoir quality—A case study of the Ek1 formation in the Wang Guantun area, China. Interpretation 2020, 8, SM15–SM24. [Google Scholar] [CrossRef]
  43. Xu, H.; He, Y.; Tao, L.; Wang, X.; Dou, X. Spatial Structure of Sand Body and Remaining Oil Distribution Modek in Delta Front of Shallow Lake Basin. J. Chang. Univ. (Nat. Sci. Ed.) 2020, 32, 67–75. [Google Scholar]
  44. Yin, T.; Zhang, C.; Zhao, H.; Fan, Z.; Li, Z. Remaining oil distribution prediction based on high-resolution sequence stratigraphy. Pet. Explor. Dev. 2001, 28, 79–82. [Google Scholar]
  45. Wang, X.; Zhou, X.; Li, S.; Zhang, N.; Ji, L.; Lu, H. Mechanism Study of Hydrocarbon Differential Distribution Controlled by the Activity of Growing Faults in Faulted Basins: Case Study of Paleogene in the Wang Guantun Area, Bohai Bay Basin, China. Lithosphere 2022, 2021, 7115985. [Google Scholar] [CrossRef]
  46. Krayev, I. The Zhetybay Oil Field. Pet. Geol. 1961, 5, 591–592. [Google Scholar]
  47. Kiritchkova, A.I.; Nosova, N. The Lower Jurassic of the Eastern Caspian region and the Middle Caspian Basin: Lithology, facies, taphonomy. Stratigr. Geol. Correl. 2014, 22, 479–493. [Google Scholar] [CrossRef]
  48. Yuferov, Y.K.; Aronson, Y.; Rabinovich, A.A. Distribution of Oil and Gas Pools in the Zhetybay-Uzen Zone of Oil-Gas Accumulation. In Petroleum Geology: A Digest of Russian Literature on Petroleum Geology; American Association of Petroleum Geologists: Tulsa, OK, USA, 1973; Volume 11, pp. 197–201. [Google Scholar]
  49. Ta, S.; Liu, B.; Shi, Y.; Zhang, Z.; Du, S. Key Study on Tectonic Evolution and Petroleum System of Mangyshlak Basin, Kazakhstan. Geol. Rev. 2018, 64, 509–520. [Google Scholar]
  50. Sun, X.; Ma, B.; Chen, Q.; Wang, Y.; Han, J. Sedimentary Characteristics of Jurassic Reservoir in Redebai Oilfield, Kazakhstan. Xinjiang Pet. Geol. 2012, 33, 247–249. [Google Scholar]
  51. Deng, H.; Wang, H.; Li, X. Identification and correlation techniques of sequence stratigraphic base-levels and their application. Oil Gas Geol. 1996, 17, 177–184. [Google Scholar]
  52. Jiang, Z. Advances in sequence stratigraphy: A summary from International Workshop on Sequence Stratigraphy. Earth Sci. Front. 2012, 19, 1. [Google Scholar]
  53. Ashraf, U.; Zhu, P.; Yasin, Q.; Anees, A.; Imraz, M.; Mangi, H.N.; Shakeel, S. Classification of reservoir facies using well log and 3D seismic attributes for prospect evaluation and field development: A case study of Sawan gas field, Pakistan. J. Pet. Sci. Eng. 2019, 175, 338–351. [Google Scholar] [CrossRef]
  54. Miall, A.D. Architectural elements and bounding surfaces in fluvial deposits: Anatomy of the Kayenta Formation (Lower Jurassic), southwest Colorado. Sediment. Geol. 1988, 55, 233–262. [Google Scholar] [CrossRef]
Figure 1. Tectonic setting and location of the Zhetybay Oilfield (After RIPED, 2009).
Energies 15 05306 g001
Figure 2. Structural contour map of the Zhetybay Oilfield.
Energies 15 05306 g002
Figure 3. Stratigraphic division and the sedimentary cycle of the Jurassic strata in the Zhetybay Oilfield (well 284) (SLSC: Super-long-term base-level cycle; LSC: Long-term base-level cycle).
Energies 15 05306 g003
Figure 4. Combination of well-seismic and high-resolution sequence stratigraphic division. (① MSC: Middle-term base-level cycle, ② SSC: Short-term base-level cycle; ③ SSSC: Super-short-term base-level cycles). (a) Well-tied Seismic section of profile AA′; (b) anatomy architecture profile of profile aa′; (c) planar graph of the Zhetybay Oilfield.
Energies 15 05306 g004
Figure 5. High-resolution sequence stratigraphic division results (LSC: Long-term base-level cycle; MSC: Middle-term base-level cycle; SSC: Short-term base-level cycle; SSSC: Super-short-term base-level cycle).
Energies 15 05306 g005
Figure 6. Photographs of the cores show the color of the mudstone and sedimentary structures. (a) Lenticular bedding in the dark-gray mudstone, well 2900, 1901.45 m; (b) wavy bedding, well 2900, 1847.6 m; (c) cross-bedding, well 2900, 1920.4 m.
Energies 15 05306 g006
Figure 7. Log response characteristics of the architectural unit features. (a) Typical logging response of distributary channel (by well 816). (b) Typical logging response of mouth bar (by well 2576). (c) Typical logging response of bar edge (by well 2900).
Energies 15 05306 g007
Figure 8. Methods of identifying mouth bar boundaries ((a) mudstone beds between the bars; (b) deposits at the edge of the bar; (c) “thick–thin–thick” pattern of the sand body; (d) sand bodies stacked laterally).
Energies 15 05306 g008
Figure 9. RMS amplitude attribute slice of the J-VI-A12-1 single layer in the Zhetybay oilfield.
Energies 15 05306 g009
Figure 10. Anatomy architecture planar graph of the J-VI-A12-1 single layer.
Energies 15 05306 g010
Figure 11. Profile of the J-VI-A12-1 single-layer architecture (profile AB). (a) RMS amplitude attribute slice of the J-VI-A12-1 single layer in the Zhetybay oilfield; (b) anatomy architecture of profile ab; (c) anatomy architecture planar graph of the J-VI-A12-1 single layer; (d) well-tied seismic section of profile AB.
Energies 15 05306 g011
Figure 12. Profile of J-VI-A12-1 single layer architecture (profile CD). (a) Anatomy architecture profile of profile cd; (b) anatomy architecture planar graph of the J-VI-A12-1 single layer; (c) well-tied seismic section of profile CD.
Energies 15 05306 g012
Figure 13. Profile of the J-V-V4-1 single-layer architecture (profile EF). (a) Anatomy architecture profile of profile ef; (b) anatomy architecture planar graph of the J-V-V4-1 single layer; (c) well-tied seismic section of profile EF.
Energies 15 05306 g013
Figure 14. Profile of the J-VI-B23-3 single-layer architecture (profile GH). (a) Anatomy architecture profile of profile gh; (b) anatomy architecture planar graph of the J-VI-B23-3 single layer; (c) well-tied seismic section of profile GH.
Energies 15 05306 g014
Figure 15. Architecture unit lateral combination mode of delta front sand body controlled by the base-level cycle. (a) Superimposed mode; (b) Lateral mode; (c) Isolation mode.
Energies 15 05306 g015
Figure 16. Vertical distribution profile of the sand body is controlled by the medium cycle.
Energies 15 05306 g016
Figure 17. Evolution of the sand body assemblage model under the control of the base-level cycle.
Energies 15 05306 g017
Figure 18. Influence of the base-level cycle of the delta front sand bodies on the depositional architecture model.
Energies 15 05306 g018
Table 1. The dataset of the study area.
DataNumberNote
Well logs1660Gamma-ray, Resistivity, spontaneous potential
Cores76.2 (m)Facies analysis
3D seismic profiles5Architecture unit interpretation
Table 2. Vertical superimposition model of the architecture units. (a) Vertical tangential superposition mode, channel beyond lower mouth bar; (b) Vertical tangential superposition mode, multiphase bar superimposed; (c) Vertical splicing mode, bar–edge bar superimposed; (d) Vertical isolation mode.
Combination model(a) Vertical tangential superposition (channel beyond lower mouth bar, compound rhythm thick sand layer, no mudstone interlayer between the sand bodies)(b) Vertical tangential superposition (multiphase bar superimposed, no mudstone between sand bodies, calcareous interlayers, strong heterogeneity)(c) Vertical splicing (bar–edge bar superimposed, thin mudstone between sand bodies, bar edge with poor petrophysical property)(d) Vertical isolation (stable thick layers of mudstone between sand bodies)
Sand body assemblage type Energies 15 05306 i001 Energies 15 05306 i002 Energies 15 05306 i003 Energies 15 05306 i004
Superimposition model Energies 15 05306 i005 Energies 15 05306 i006 Energies 15 05306 i007 Energies 15 05306 i008
Publisher’s Note: MDPI stays neutral with regard to jurisdictional claims in published maps and institutional affiliations.

