
A Method for the Evaluation of Power-Generating Sets Based on the Assessment of Power Quality Parameters

Abstract
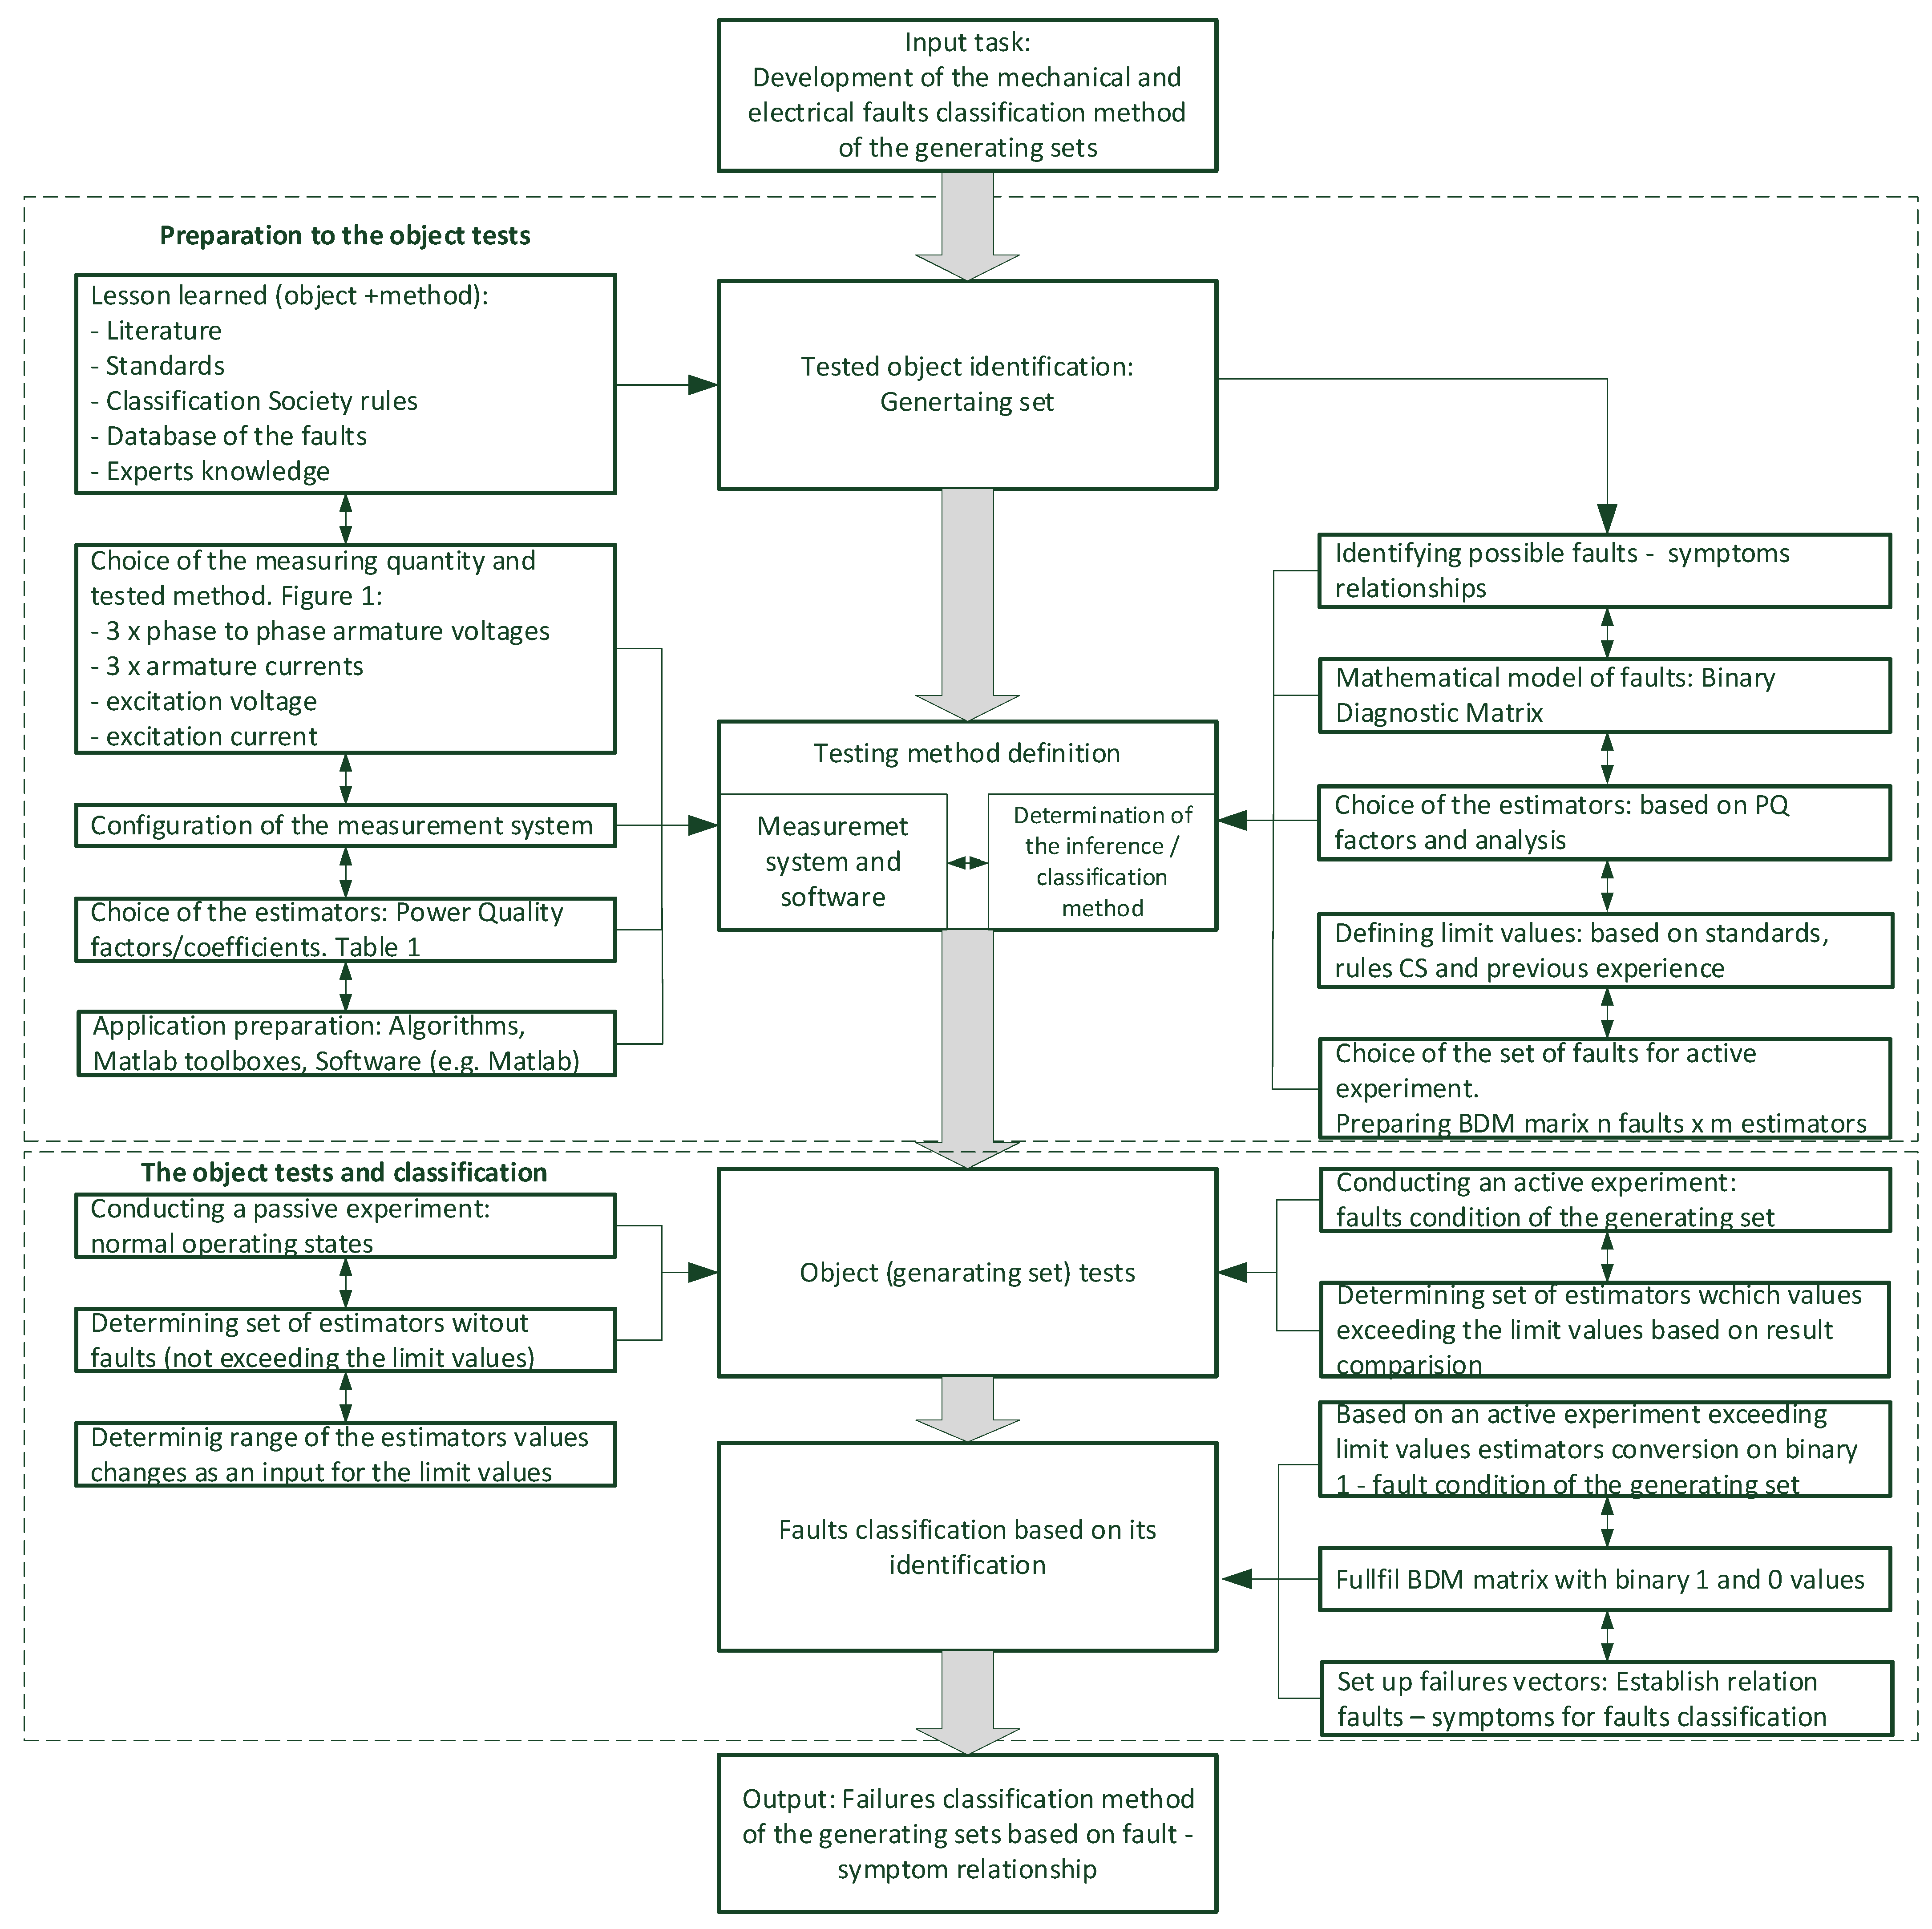
:1. Introduction
- A description of the new method of classification for faults in generating sets, based on the use of the existing power quality coefficients;
- An assumption in this method that the description of the input–output relationship takes the form of a black box and using the binary diagnostics matrix (BDM) to investigate the fault–symptom relationship between inputs (deliberately caused faults) and outputs (faults symptoms = susceptible to faults in PQ coefficients);
- A presentation of the set of symptoms obtained as a result of the active experiment and the new method, enabling the detection of specific failures in the tested generating set, and as a result the classification of these failures;
- A presentation of the possibilities for the further development of the method and the classification of electrical machines failures based on the analysis of the electricity produced and consumed by them.
2. Methodology
- The identification of the generating sets used for this research;
- The analysis of phenomena occurring in power-generating sets that affect the quality of the electricity generated by the synchronous ship generators (taking into account expert knowledge);
- The elaboration of data registration and processing methods, as well as the selection of the measurement quantities used for the registration and analysis;
- The development of electricity quality coefficients independently for each electrical diagnostic parameter;
- The completion of a passive experiment to determine the current technical condition of the generating sets and to determine their suitability for generating electricity of the required quality;
- The identification of the most common forms of failure in generating sets, as well as the planning and completion of an active experiment to determine the fault–symptom correlation;
- A critical analysis of the research results and determination of the limit state symptoms.
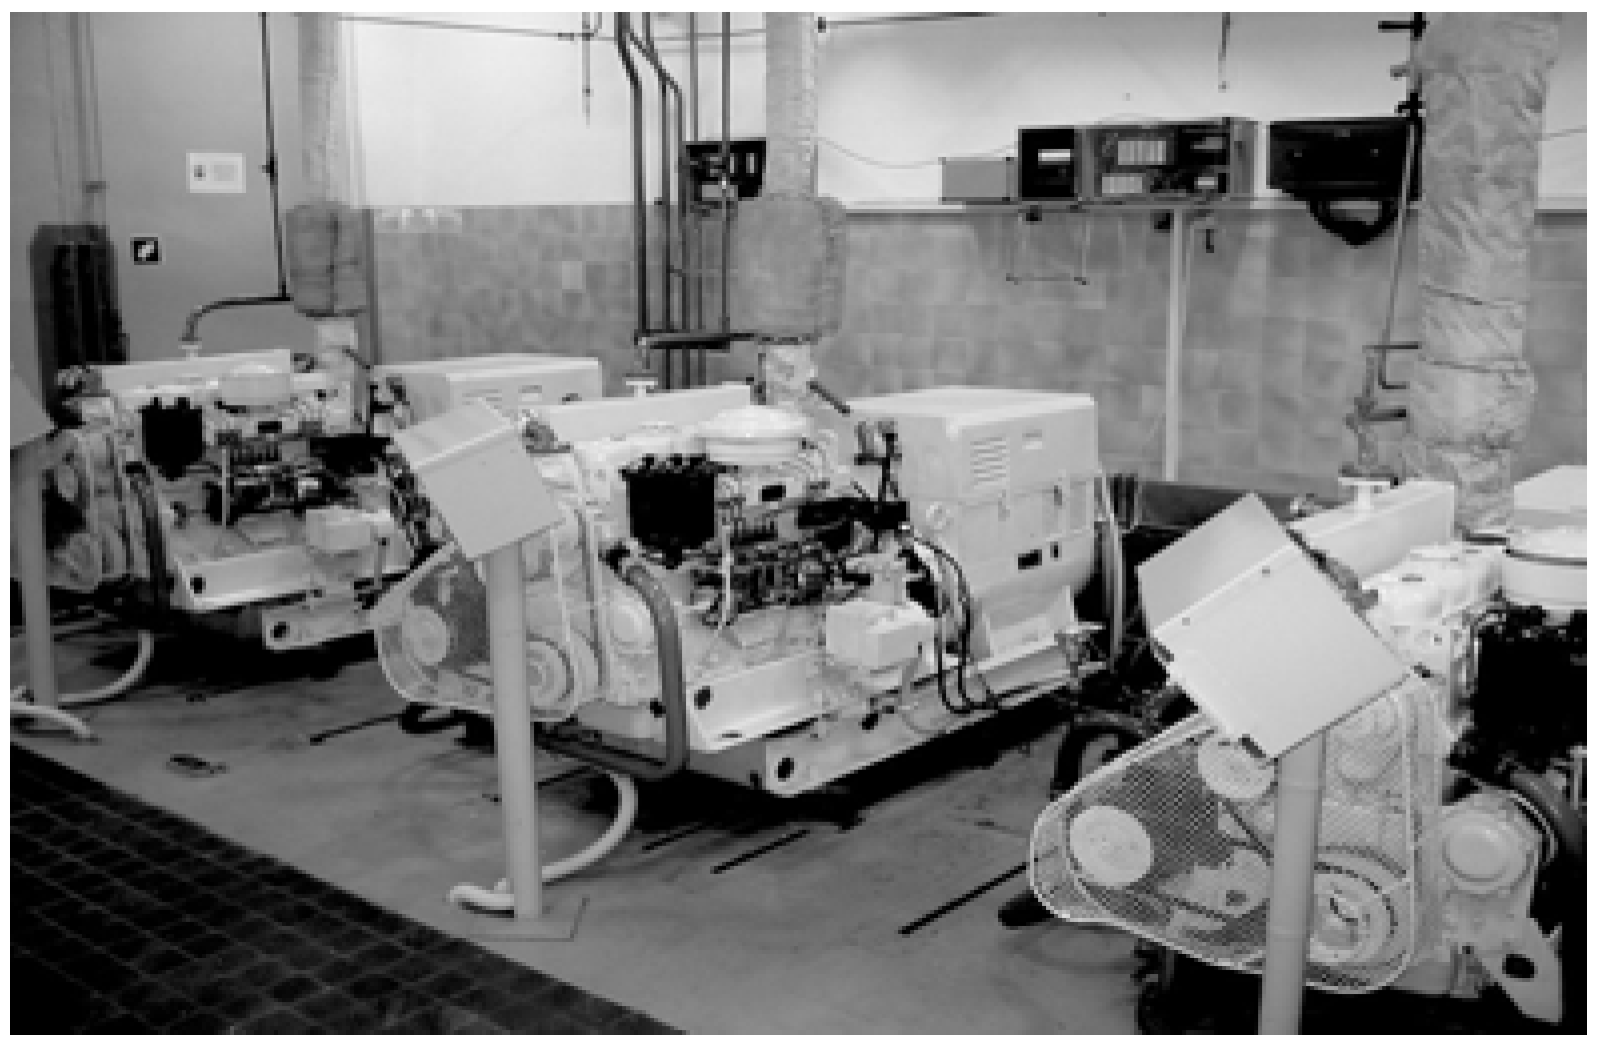
2.1. Description of the Generating Sets Used for the Research
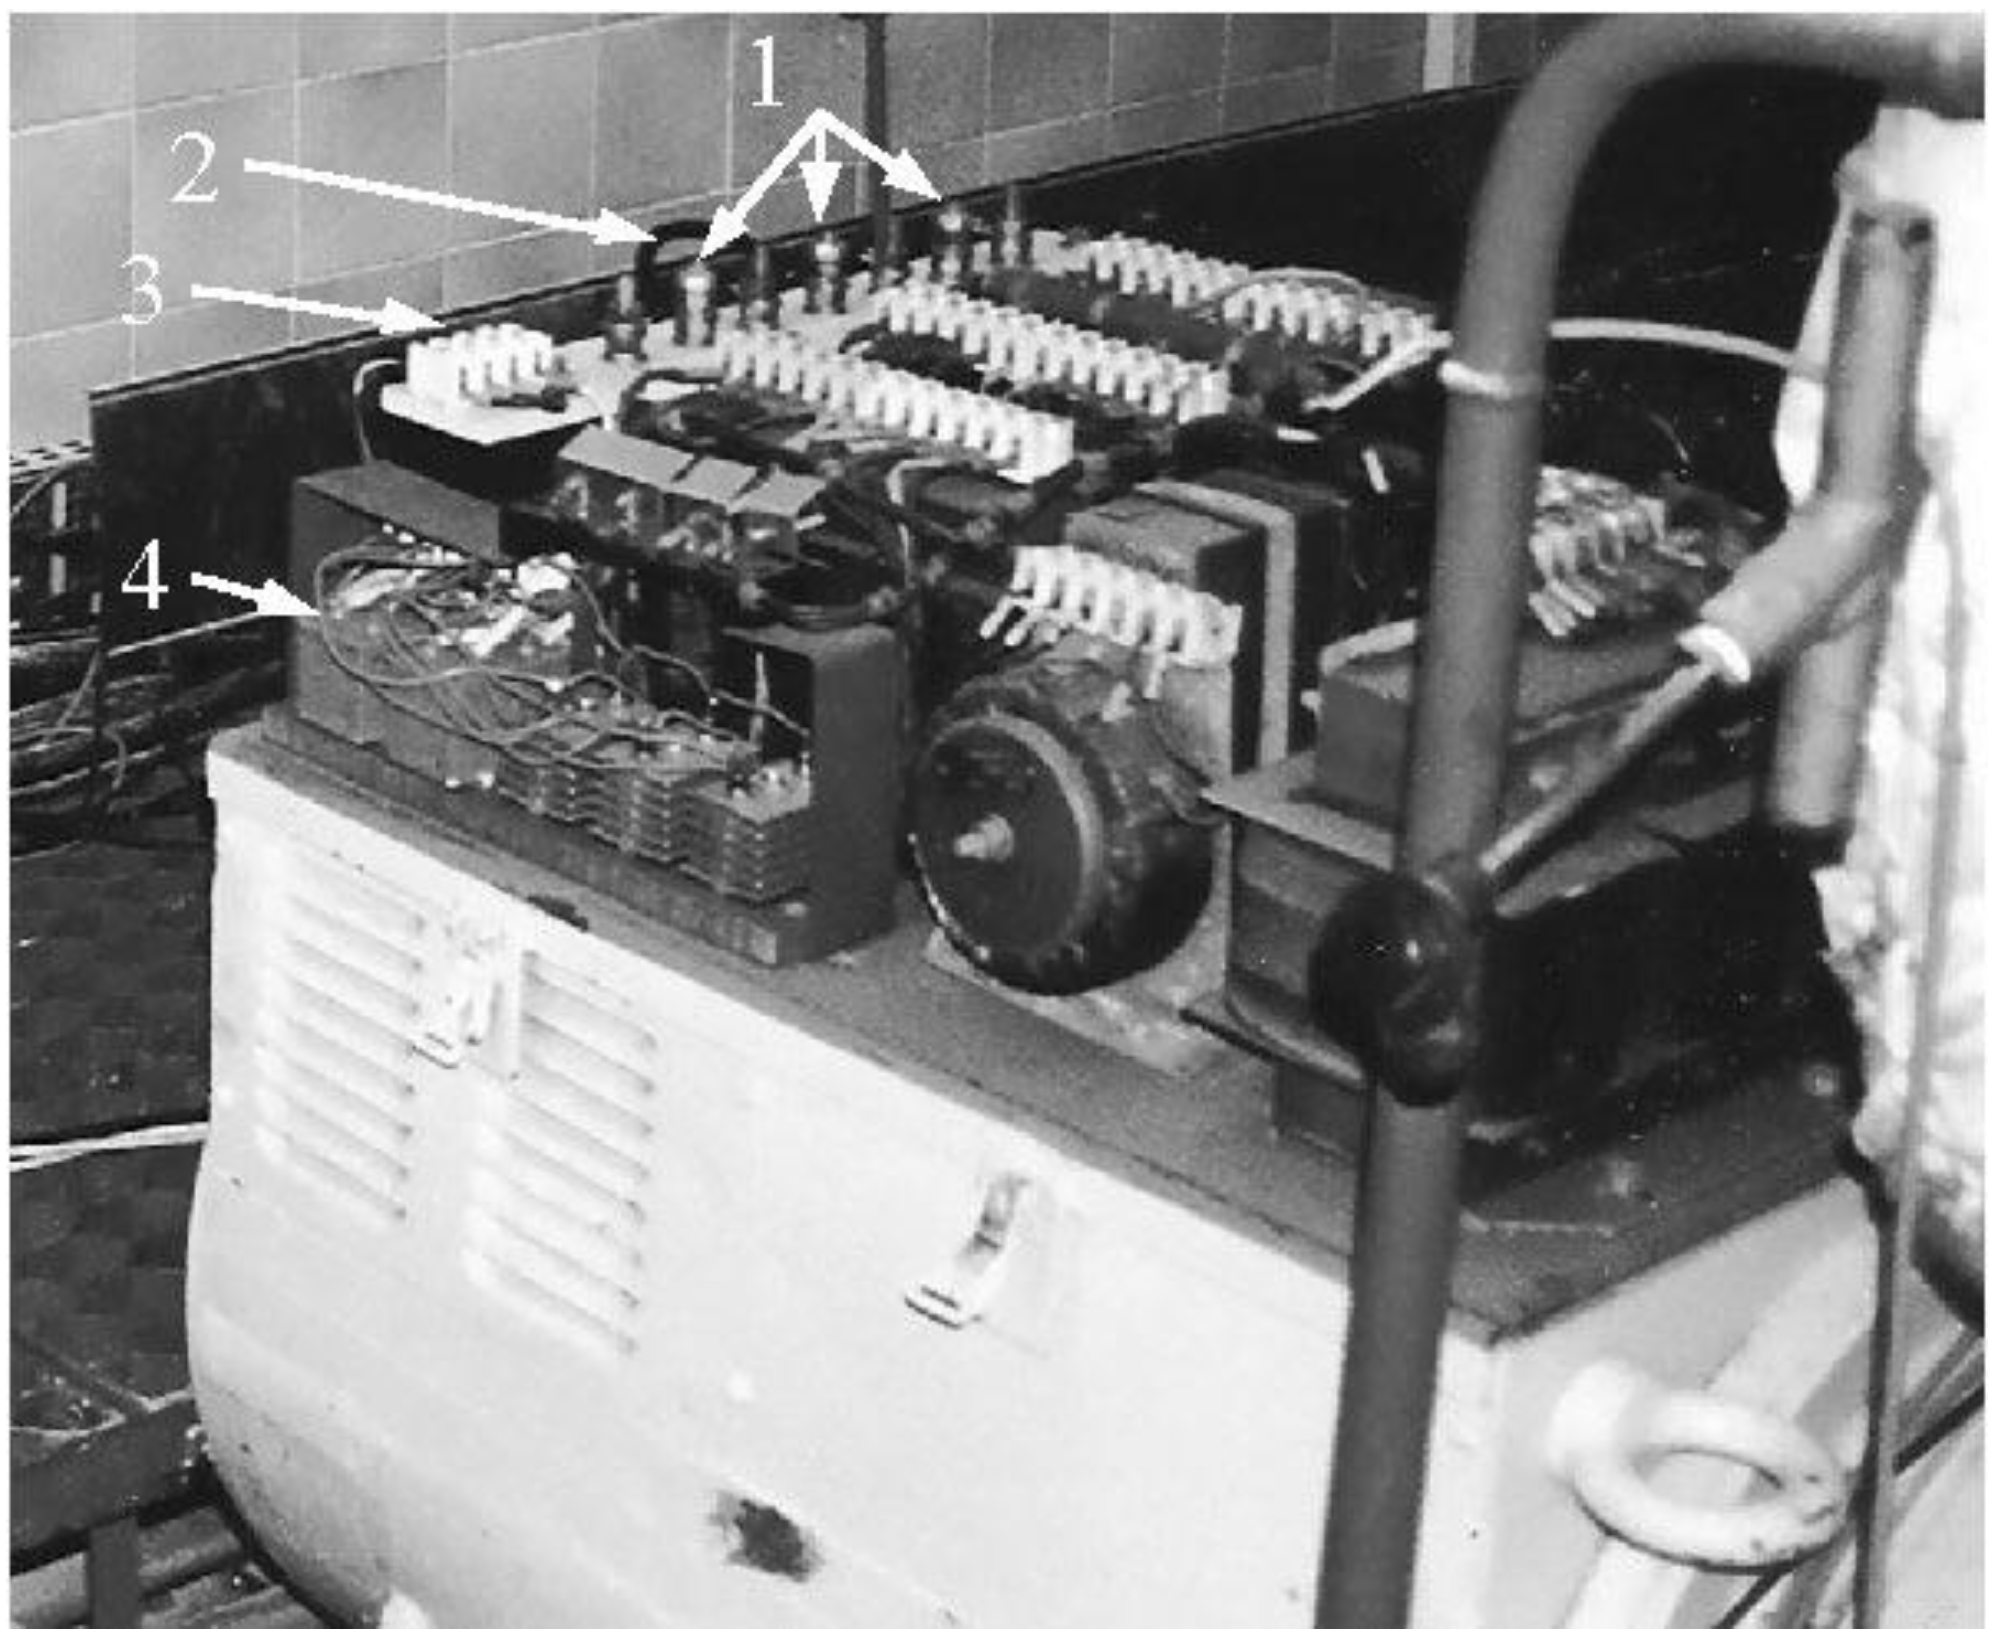
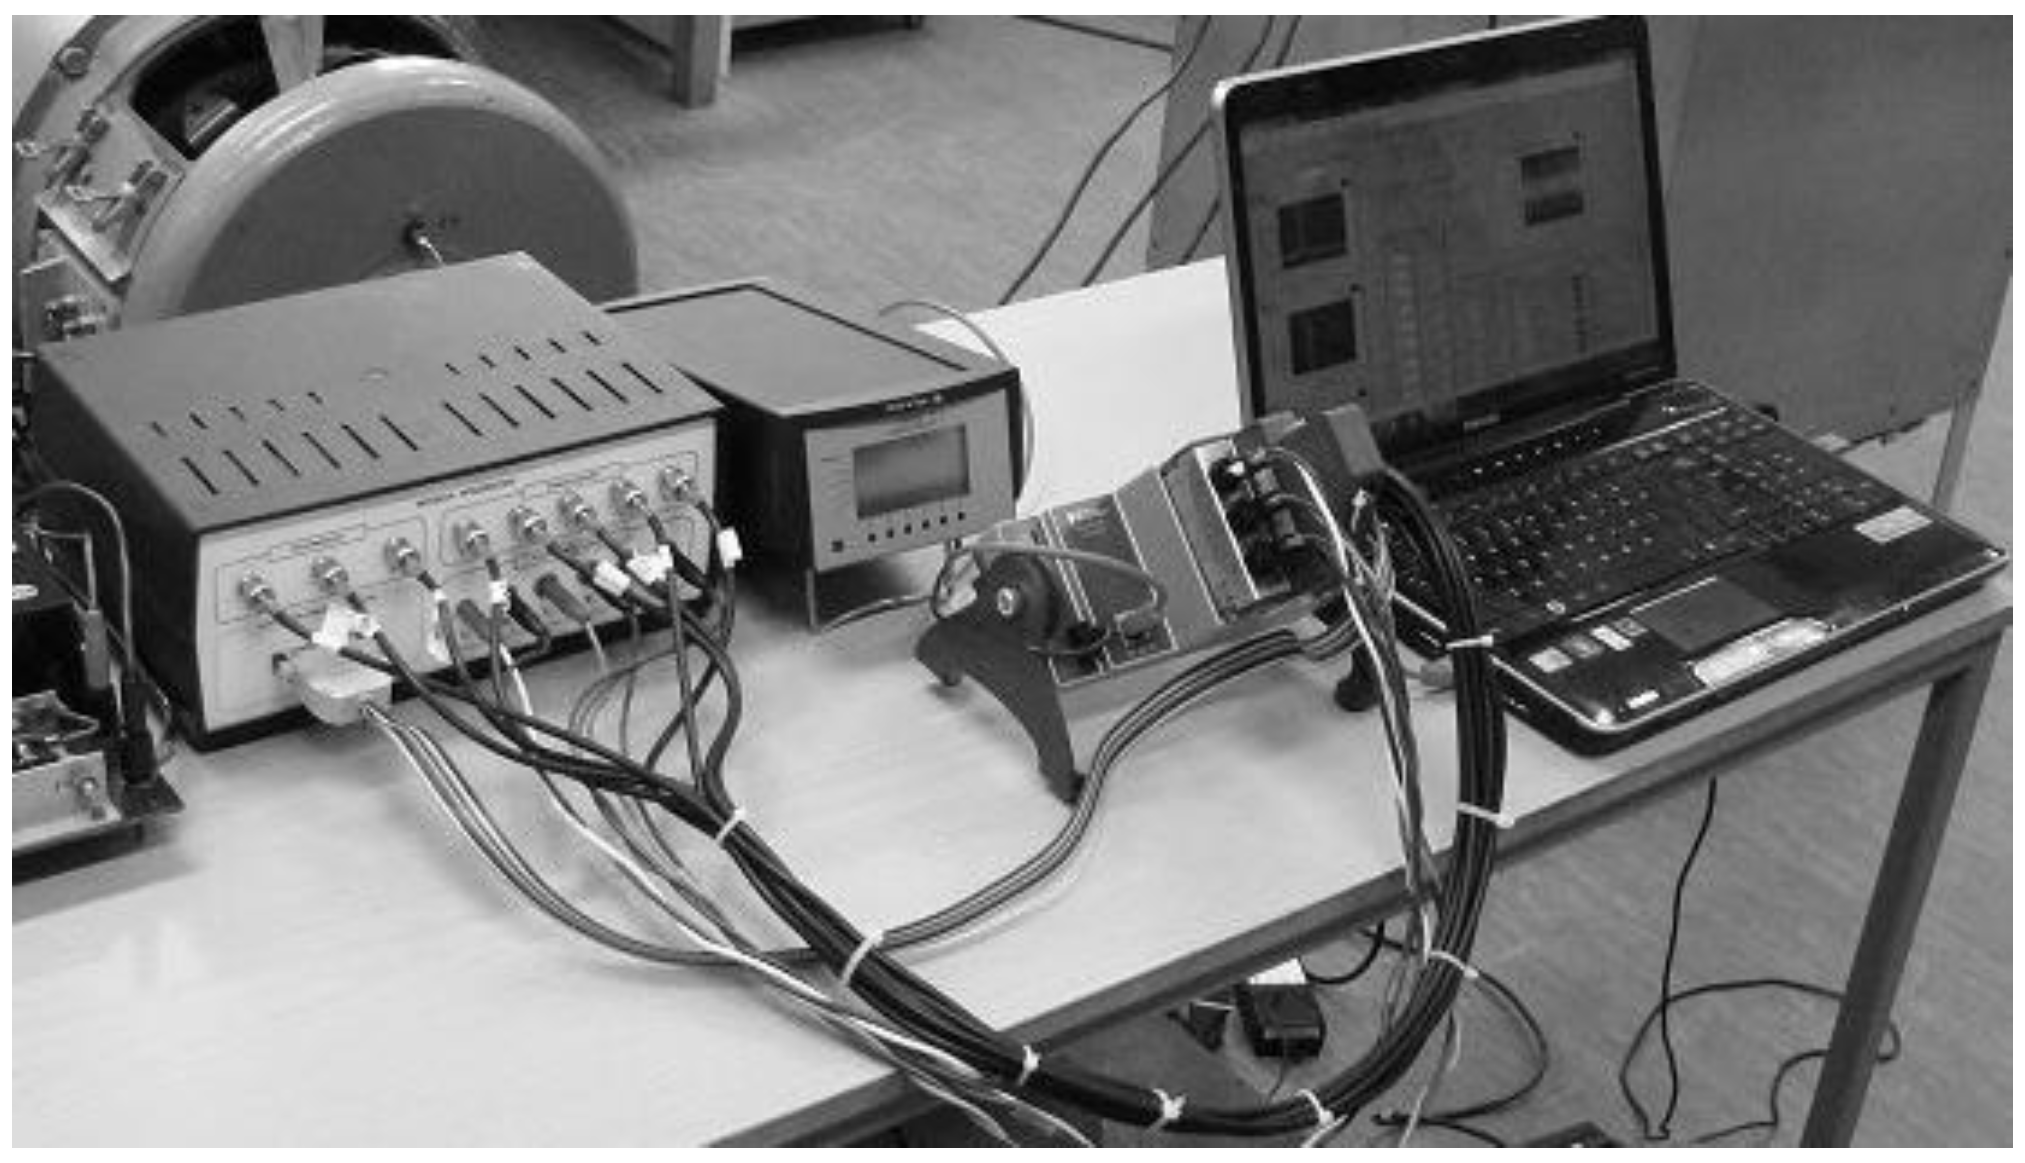
2.2. The Method Used for Registering and Processing Data
- Phase-to-phase (armature) voltages at the synchronous generator terminals: Figure 3, point 1 shows the screws to which the wires used for measuring the armature voltage were screwed;
- Armature current (wire current): Figure 3, point 2 shows one of the wires on which the armature current was measured with the current clamps;
- Excitation voltages: Figure 3, point 3 shows the terminal block to which the excitation voltage measurement leads were connected;
- Excitation current: Figure 3, point 4 shows the wire on which the excitation current was measured with the current clamp;
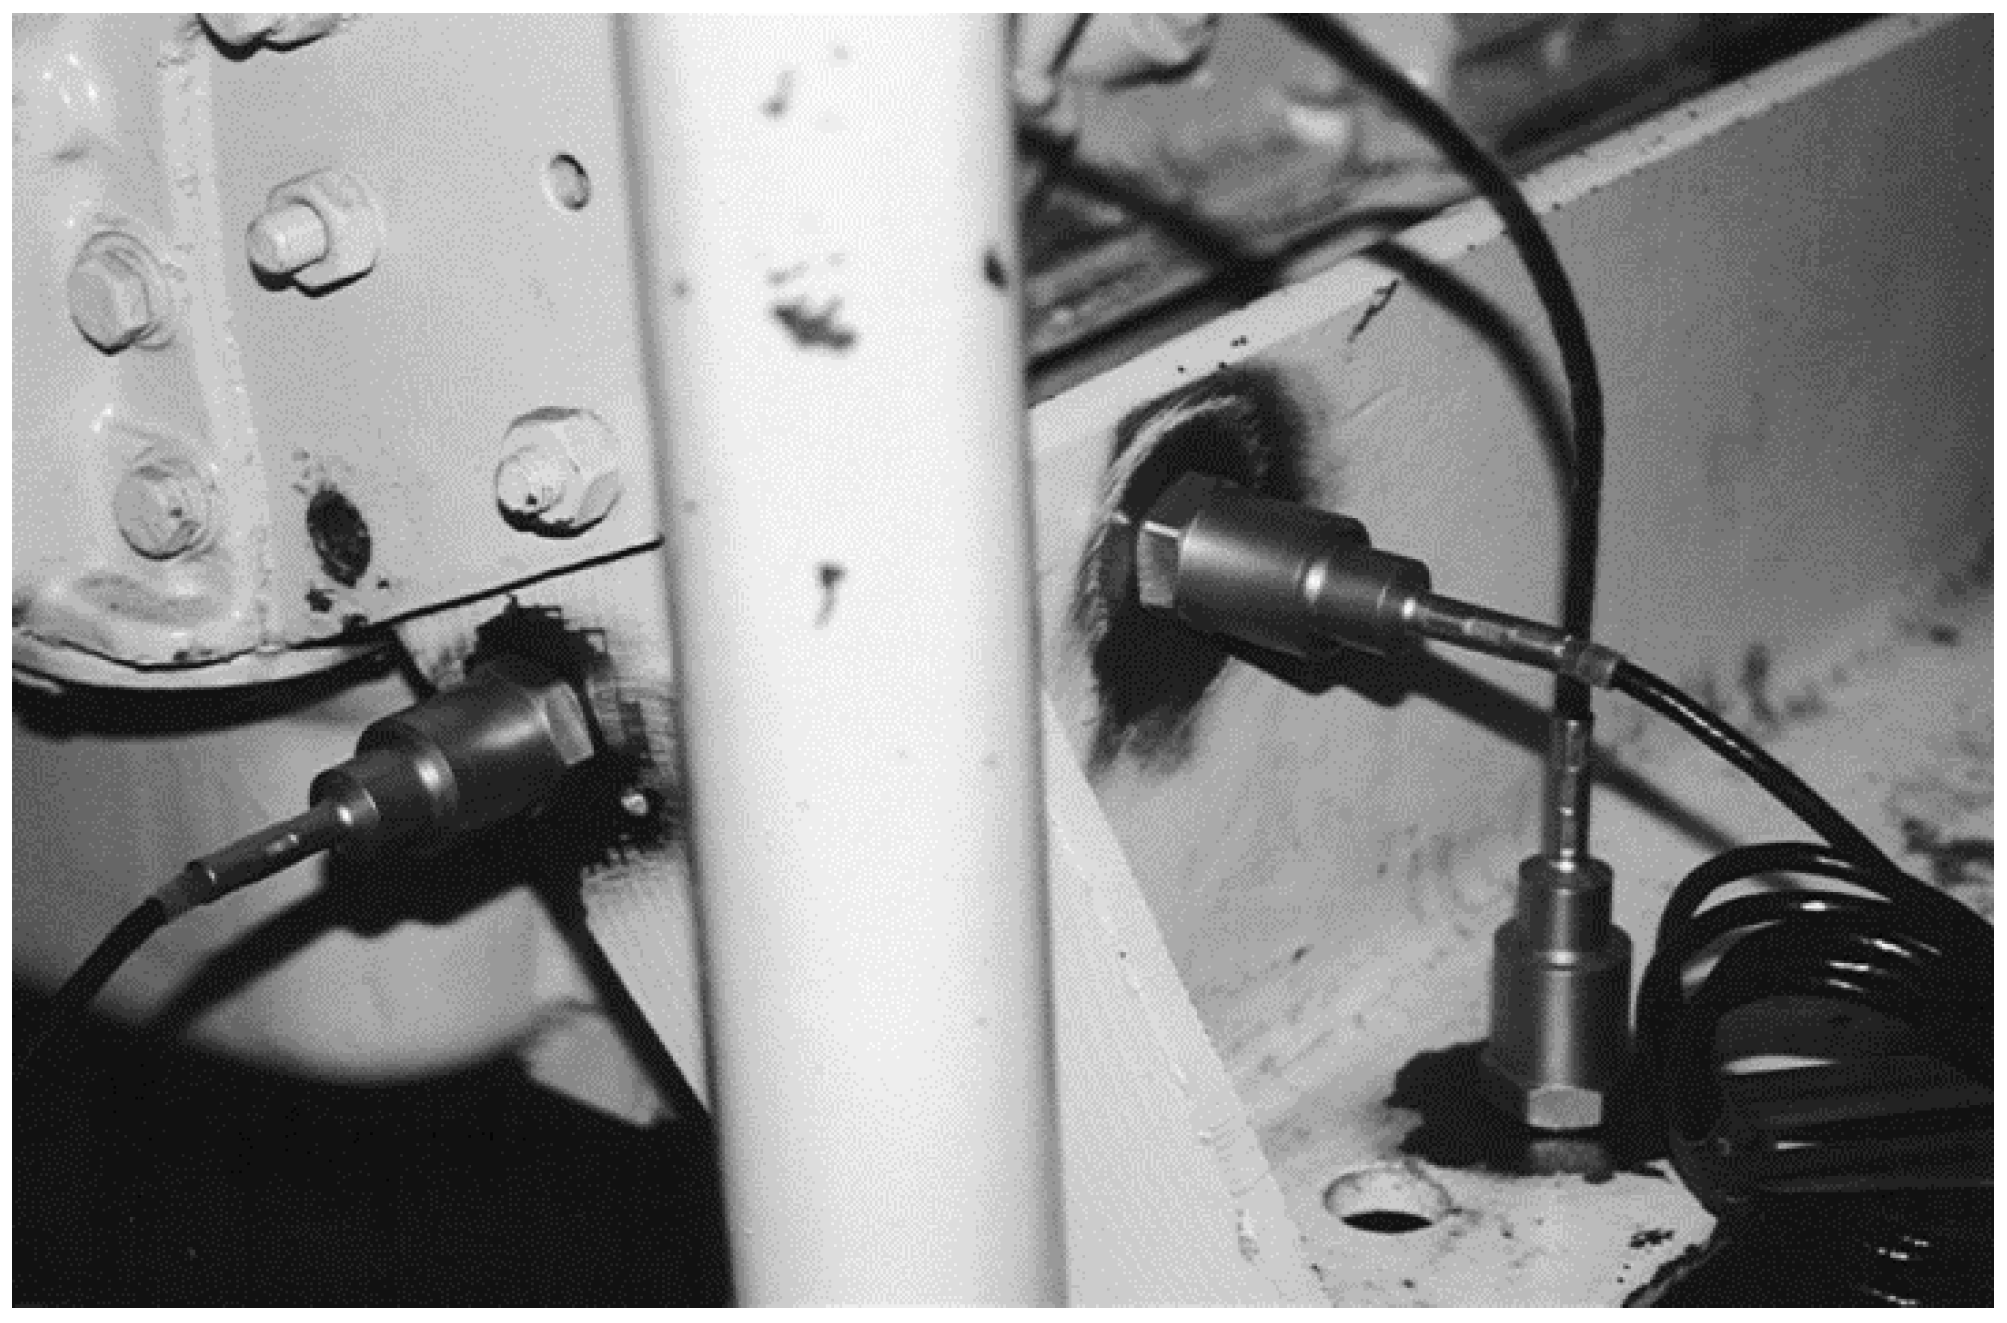
- Mechanical vibrations (velocity and displacement) of a ship’s generating set, Figure 4.
- The presentation of signal time series;
- Input signal filtering;
- The determination of the signal envelope (using a Hilbert transform);
- A spectral (Fourier) FFT-based signal analysis;
- Calculations of electricity quality factors;
- Downloading signal vectors from one or more files;
- Archiving input data and performing analyses.
3. Description of the Research Methods
- The air supply system;
- The construction of sets and elements that determine the course of pressure in the cylinder (fuel supply system, combustion chamber);
- The system and number of cylinders, as well as their firing order;
- The moment of inertia of rotating masses (engine, flywheel, and generator).
- The variable speed drive;
- The quality of the fuel supply;
- The condition of the crank system (rings, cylinders);
- The weather conditions (pressure, temperature at which the engine works);
- Other phenomena.
- The size and type of load;
- The method of switching the receivers operating in the ship’s power system on and off;
- The governor speed controller;
- The proper fuel supply;
- The voltage regulation system.
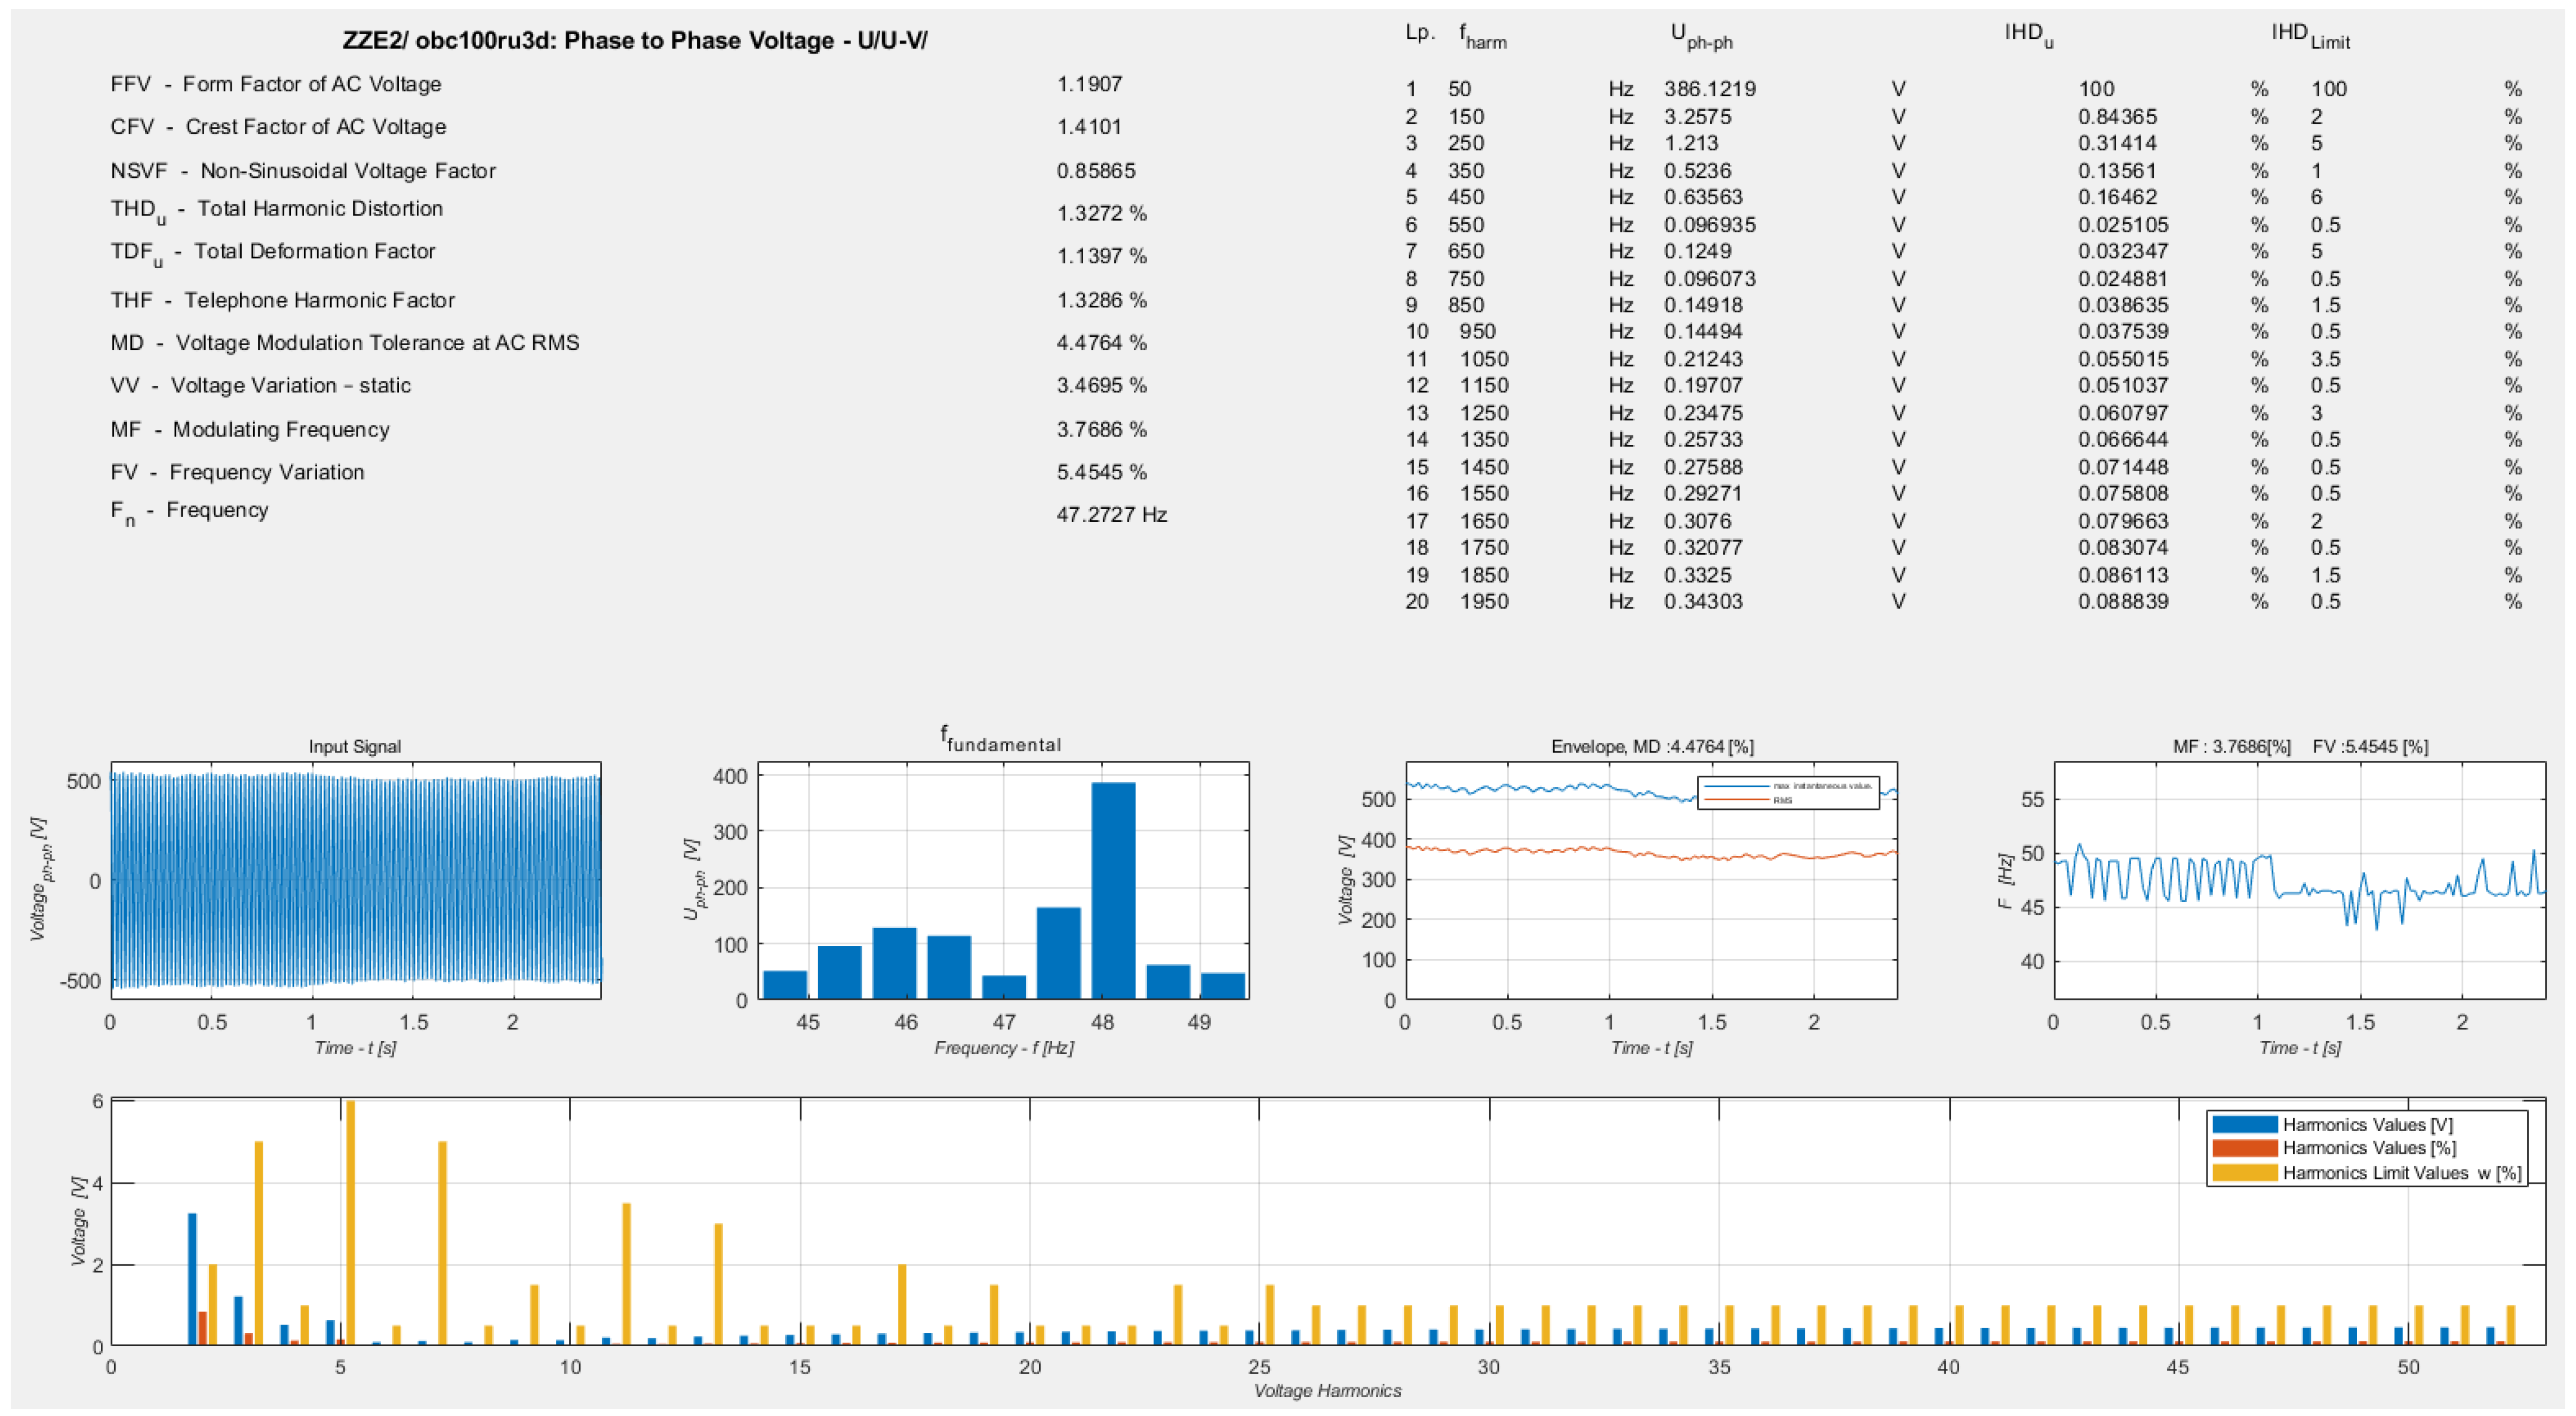
3.1. Development of a Set of Power Quality Factors
- Deviations in voltage and current;
- Fluctuations in voltage and current;
- Changes in frequency;
- The proportion of higher harmonics in the voltage and current waveforms;
- The symmetry of the multiphase systems.
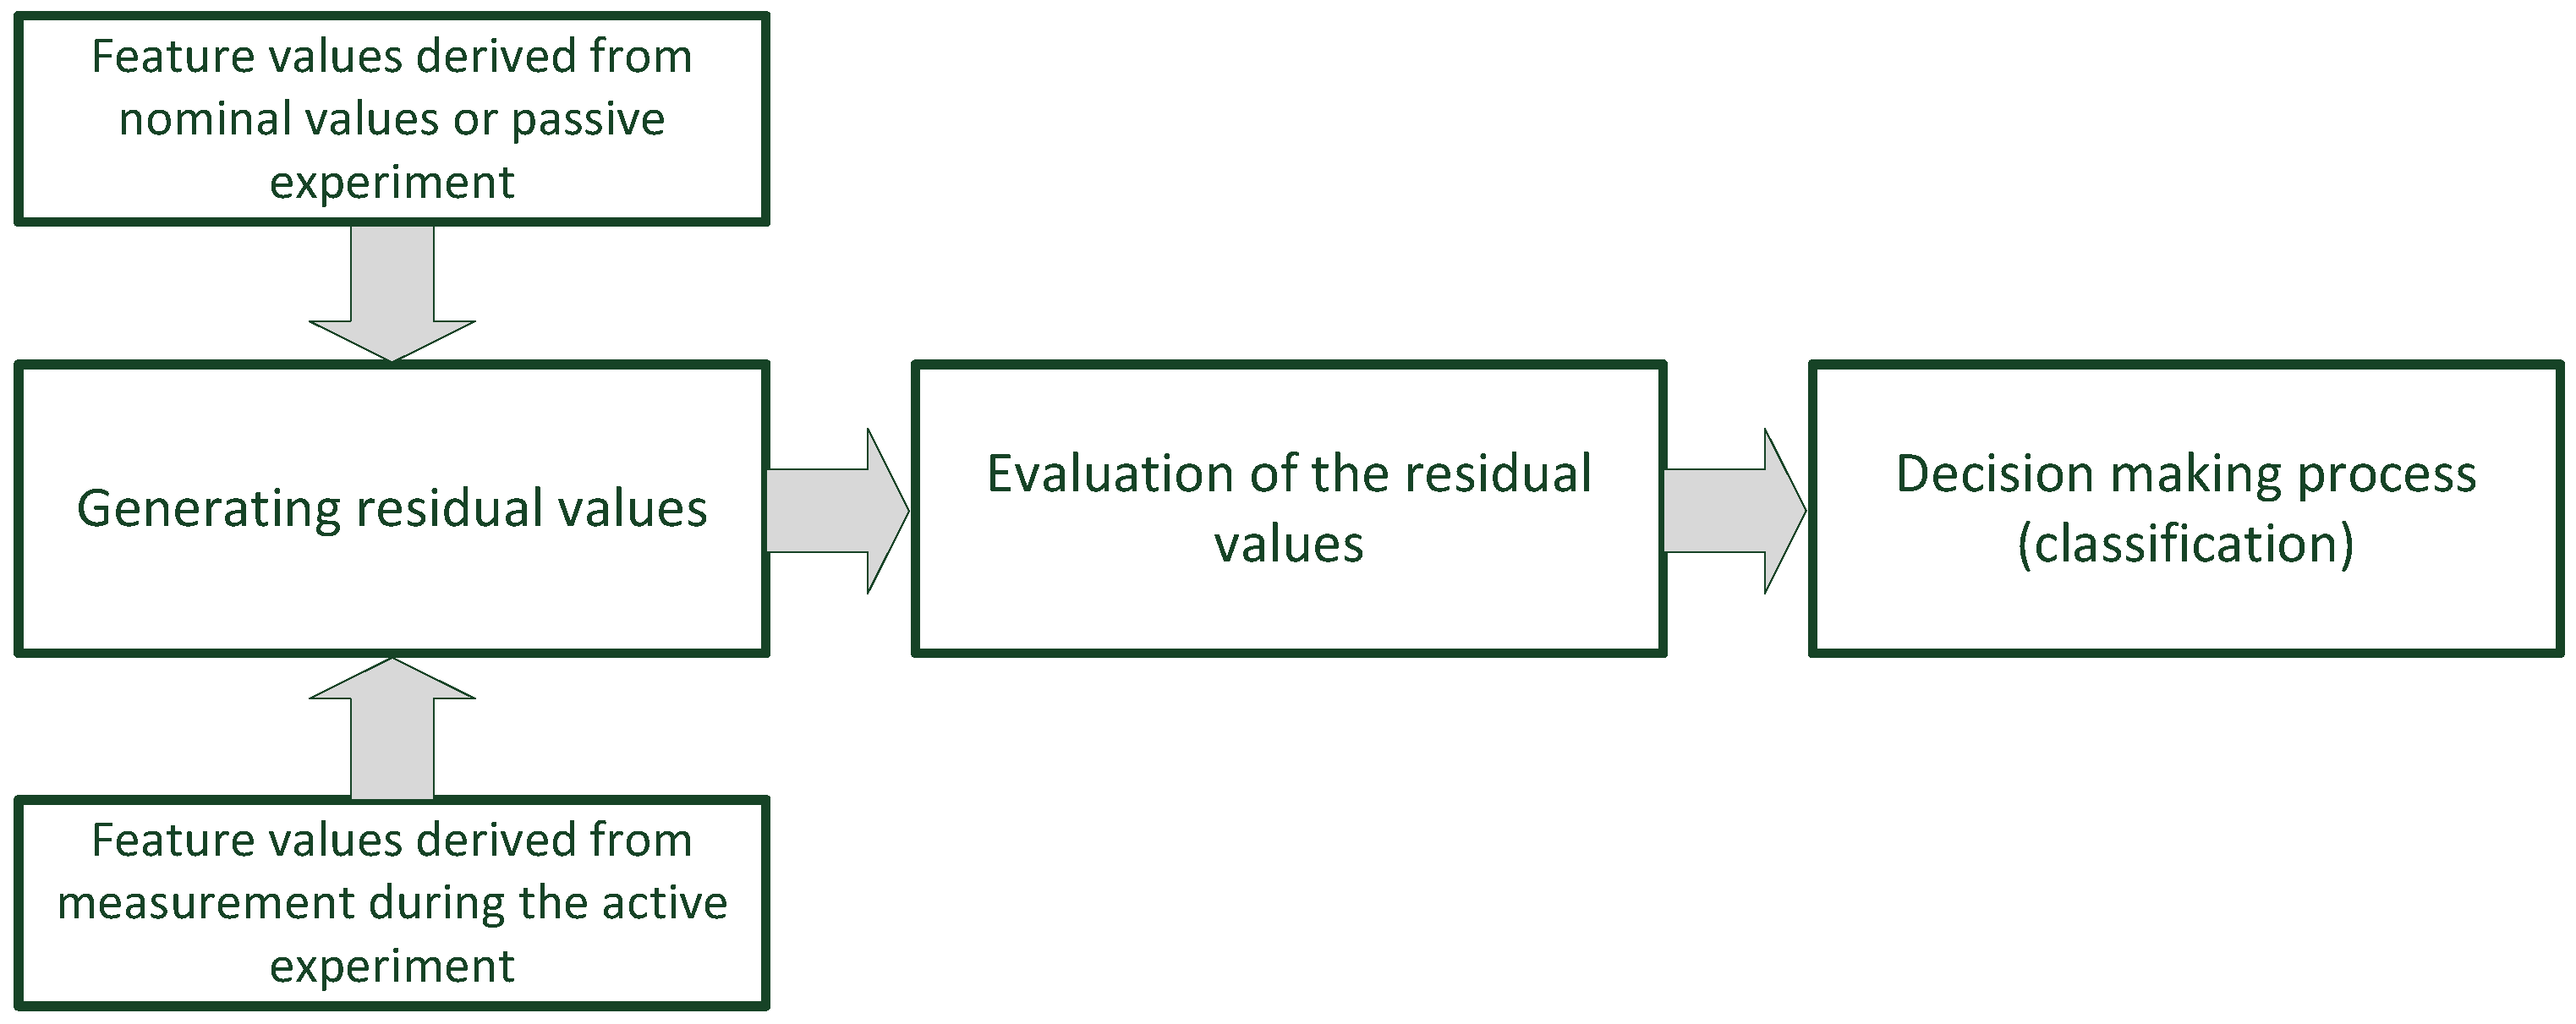
3.2. Theoretical Model of Fault Assessment
4. Research Results and Discussion
4.1. The Passive Experiment
4.2. The Active Experiment
- Short circuit of the rectifier element (diode) in the voltage regulator of the synchronous generator: fault no. 1, F1—the fault involved short-circuiting one rectifying diode in a real automatic voltage regulator of a synchronous generator;
- Break in the rectifier element (diode) in the voltage regulator of the synchronous generator: fault no. 2, F2—the fault involved opening the circuit of one rectifying diode in a real automatic voltage regulator of a synchronous generator;
- Fault in the governor speed controller (GSC) by changing the gradient of the regulator’s static characteristic (slower response to effect of changes in load on the rotational speed controller in the SW-400 piston internal combustion engine): fault no. 3, F3—the fault involved deregulating the regulating elements in the actual automatic regulator of the rotational speed of the internal combustion engine driving the synchronous generator;
- Fault to the governor speed controller (GSC) by breaking the spring of the rotational speed controller of the SW-400 piston internal combustion engine: fault no. 4, F4—the fault involved cutting the spring in the actual automatic speed regulator of the internal combustion engine driving the synchronic generator;
- Loosening one of the generating set’s anchor points to the foundation: fault no. 5, F5—the fault involved physically unscrewing one of the four bolts securing the frame of the actual generator set to the foundation;
- Disruption (cut-off) in the fuel supply to an injector in cylinder no. 1 of the SW-400 piston diesel engine: fault no. 6, F6—the fault involved physically cutting off the fuel supply (by closing the valve previously installed on the fuel line) to the injector of the combustion engine driving the synchronous generator;
- Disruption (cut-off) in the fuel supply to two injectors in piston numbers 1 and 6 of the SW-400 piston diesel engine: fault no. 7, F7—the fault involved physically cutting off the fuel supply (by closing the valves previously installed on the fuel lines) to the injectors on cylinders 1 and 6 of the actual internal combustion engine driving the synchronic generator.
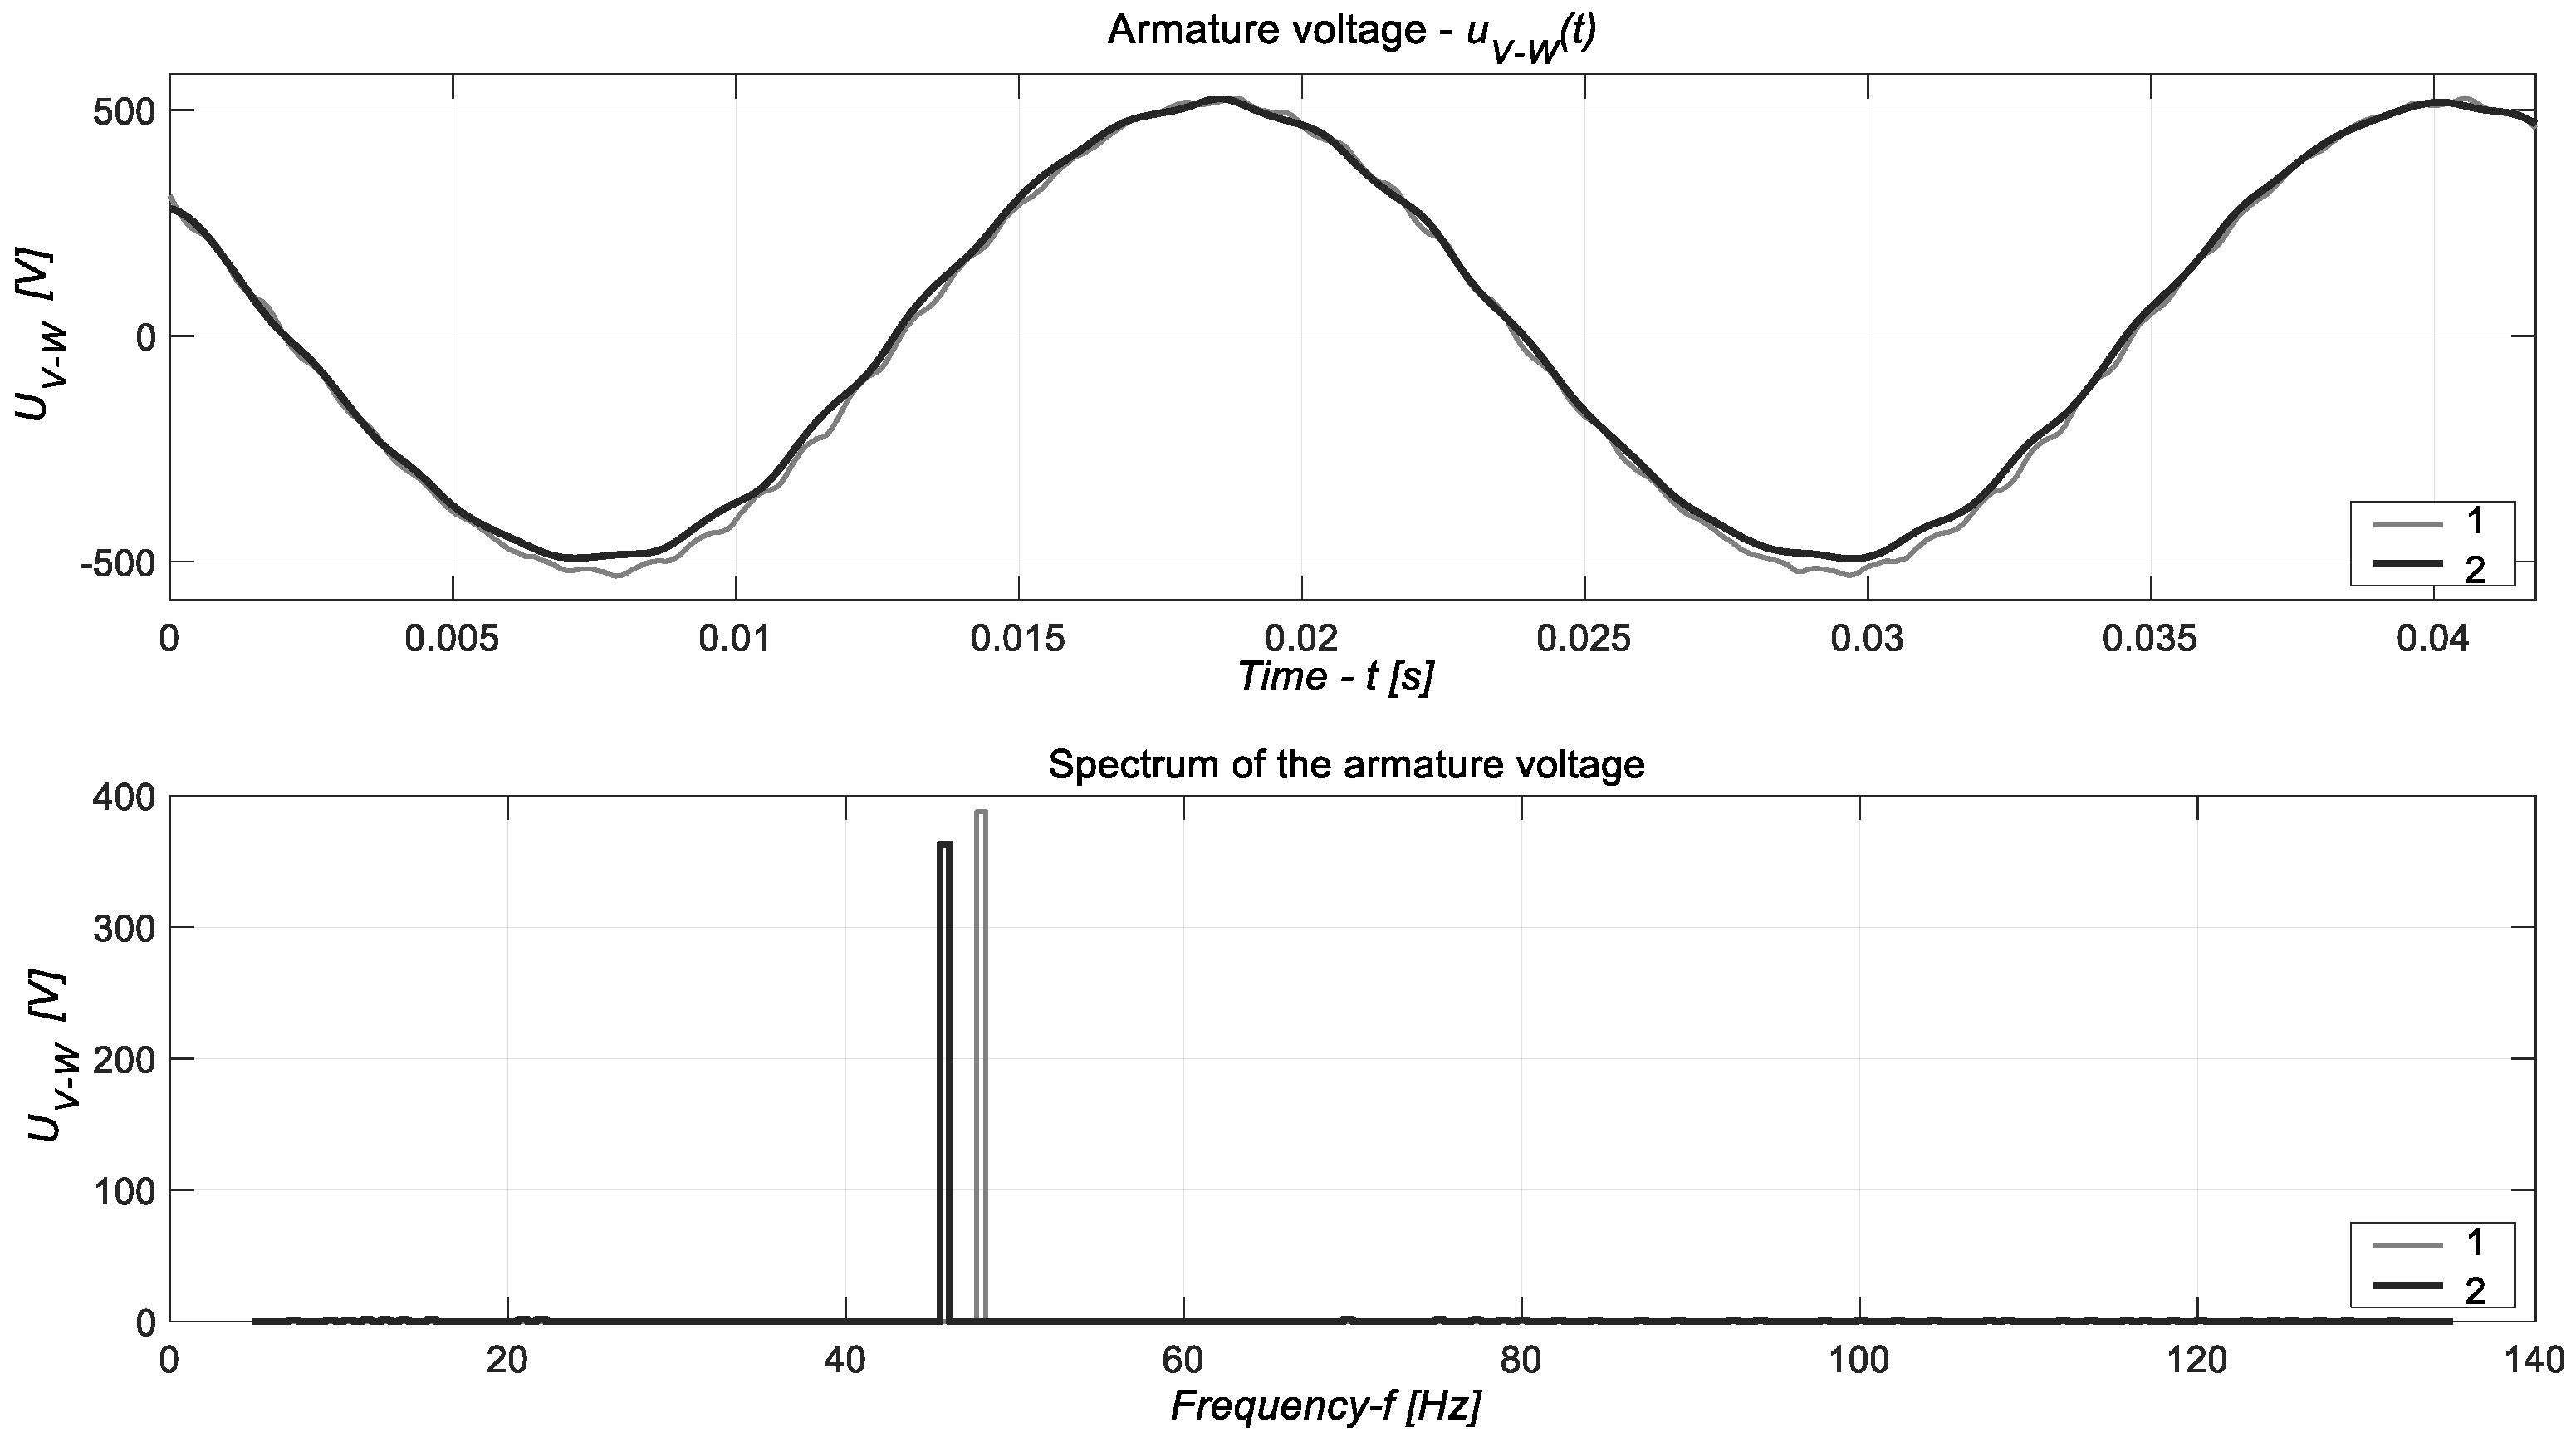
4.2.1. The Active Experiment: Fault of the Diesel Engine Governor Speed Controller—F3
- An armature voltage (phase-to-phase voltage at the synchronous generator terminals): UU-V(t), UV-W(t), UW-U(t);
- An armature current: I1(t), I2(t), I3(t);
- An excitation voltage: Ve(t);
- An excitation current: Ie(t).
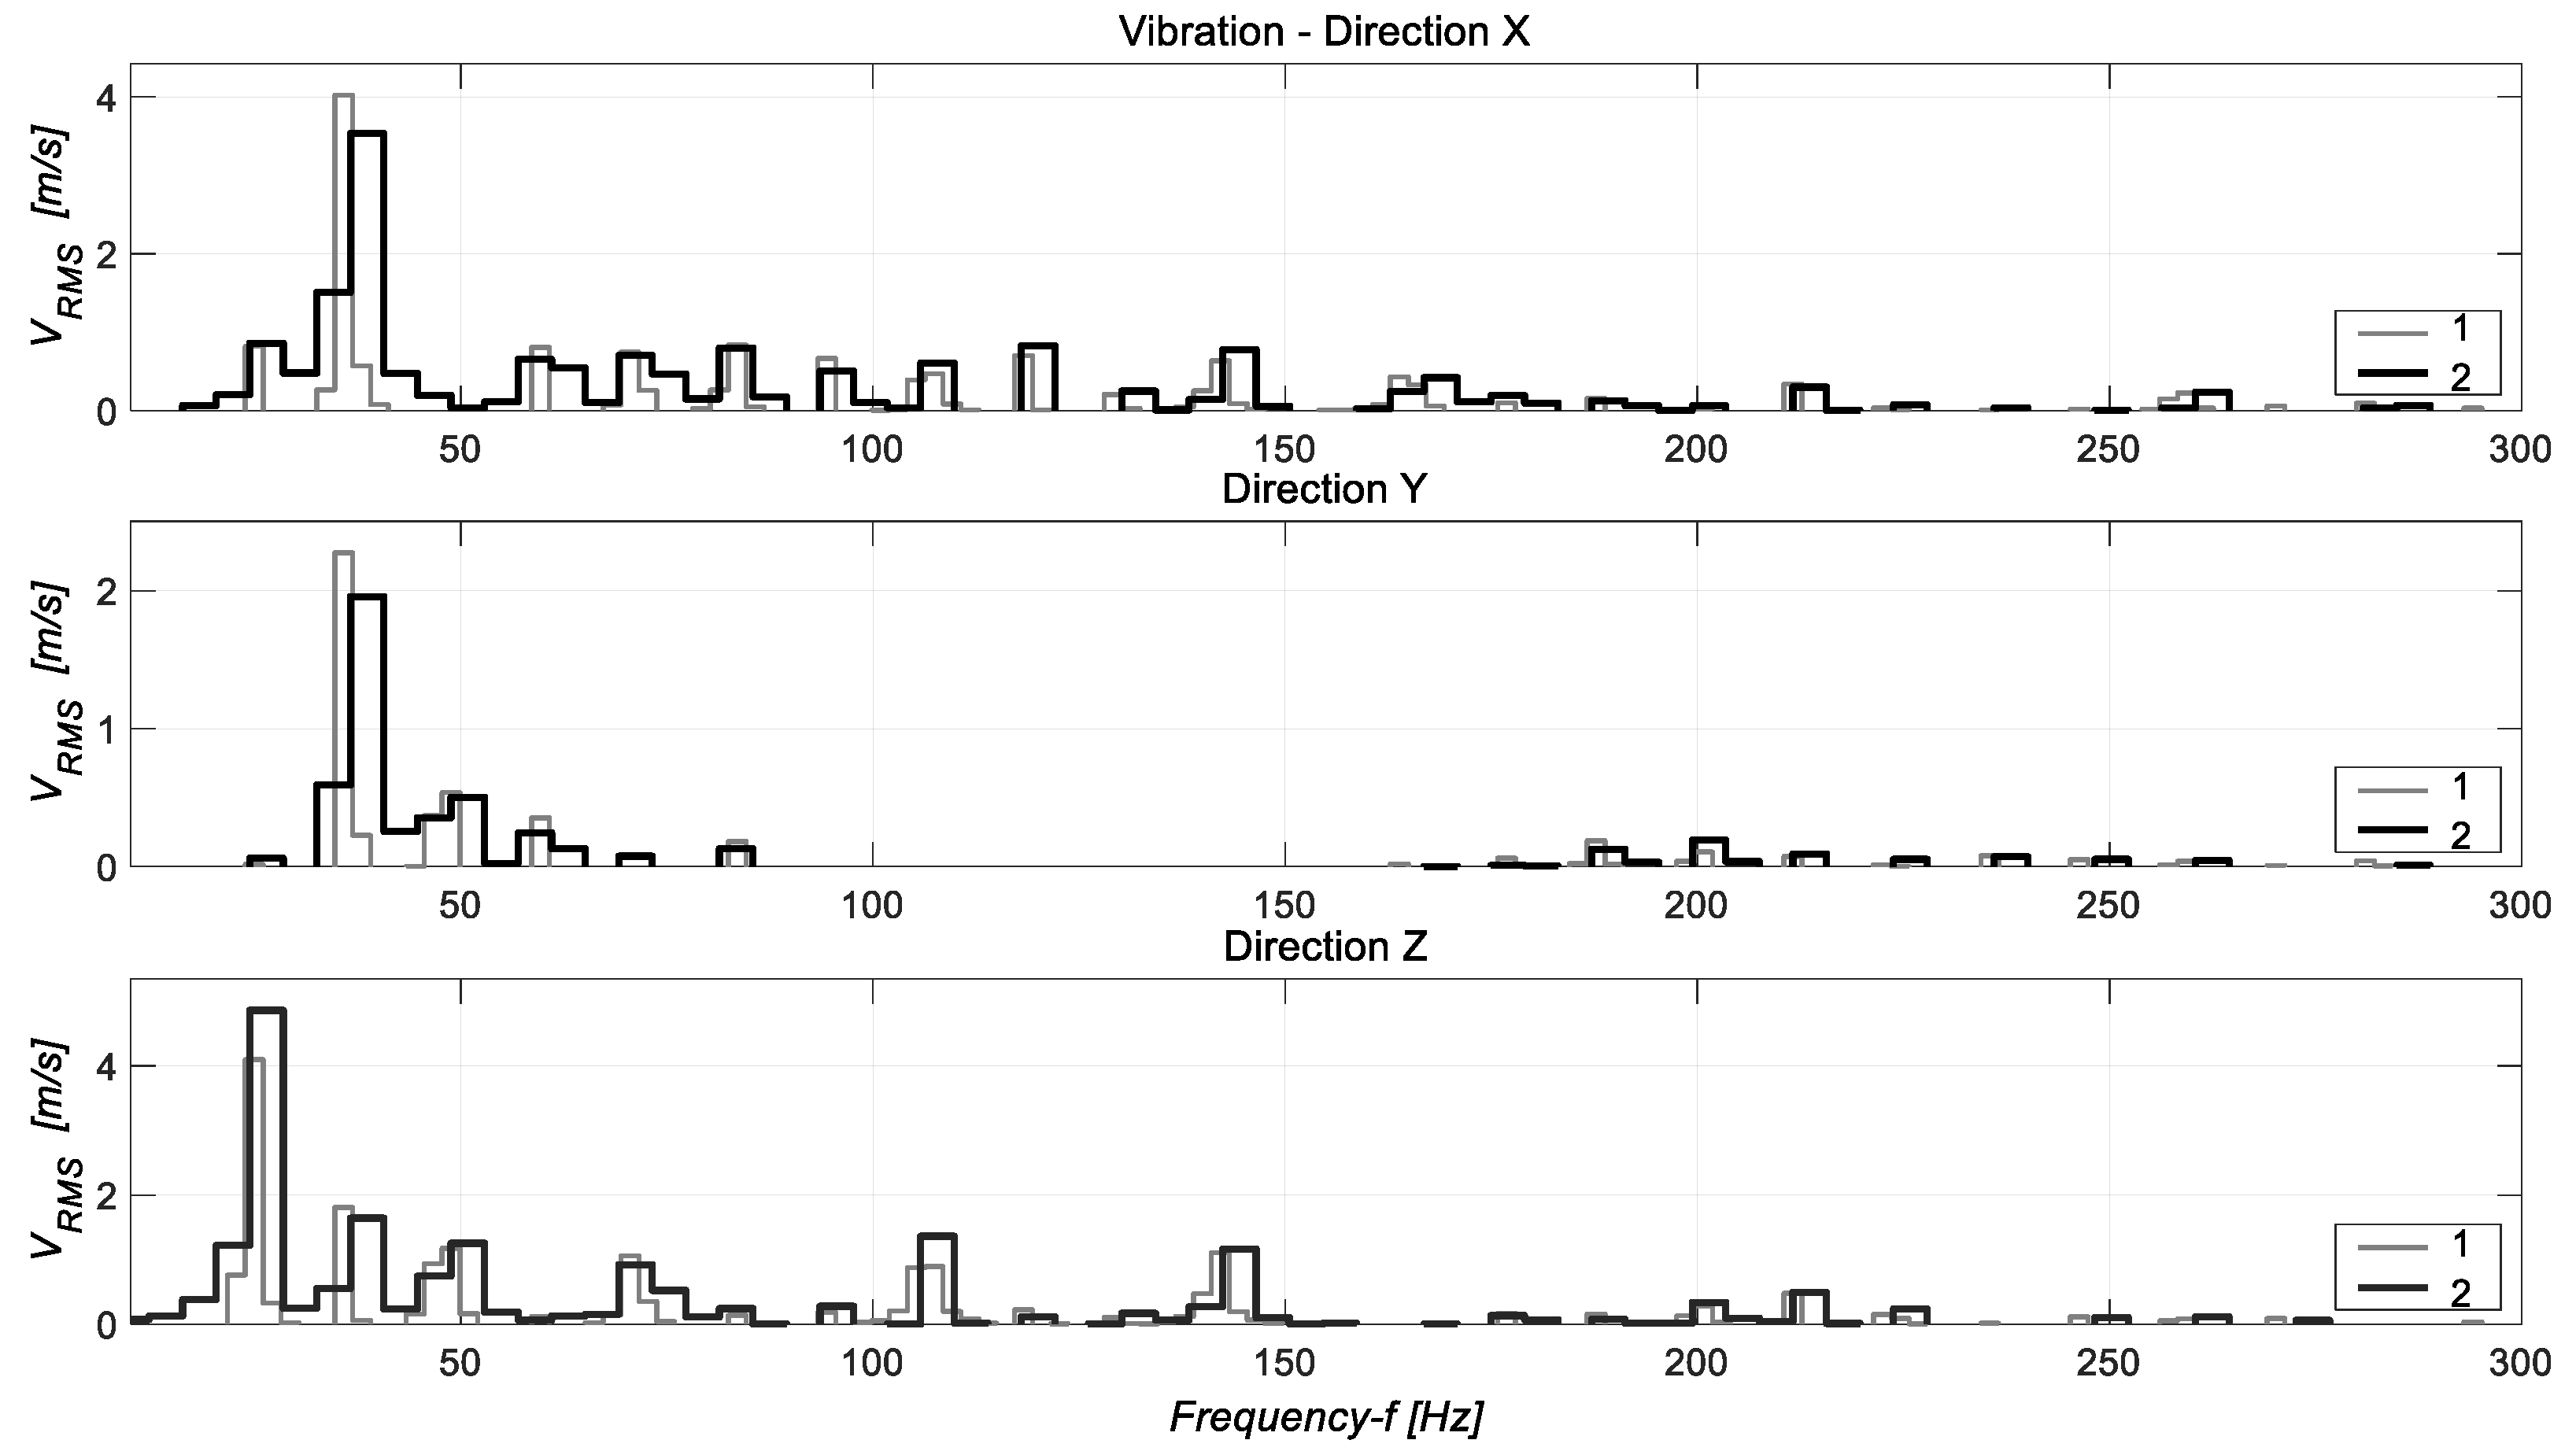
4.2.2. The Active Experiment: Loosening One of the Generator Set’s Mounting Points to the Foundation—F5
- (a).
- The phase-to-phase voltage at the synchronous generator terminals;
- (b).
- The excitation voltage;
- (c).
- The mechanical vibrations of the generating set at one point of the foundation.
4.3. The Binary Diagnostic Matrix and Discussion of the Results
5. Conclusions
Funding
Institutional Review Board Statement
Informed Consent Statement
Data Availability Statement
Conflicts of Interest
Glossary
| AC | Alternating-current power supply system |
| BDM | Binary diagnostics matrix |
| CFV | Crest factor of AC voltage—the ratio of its peak value to the RMS value, an important parameter for monitoring the occurrence of pulses or short-term voltage spikes. Crest factor = 1.414, but based on my research I put the limit value at more than 1.43 in Table 1 |
| EMC | Electromagnetic compatibility disturbances |
| EVT | Nominal excitation voltage tolerance |
| EVT | Nominal excitation current tolerance |
| DC | Direct-current power supply system |
| FFV | Form factor of AC voltage—the ratio of the root mean square (RMS) value to the average value, an important parameter for monitoring the quality of the waveform. Form factor = 1.11, but based on my research I put the limit value at more than 1.3 in Table 1 |
| FV | Frequency variation—the maximum allowable value frequency deviation (the change over time) from the rated frequency (nominal) during normal operation, excluding transient and modulation signals. |
| IoT | Internet of Things |
| Industry 4.0 | Technology refers to the fourth industrial revolution, which is the cyber–physical transformation of manufacturing |
| IT | The IT-mode AC power supply system I indicates that the power supply side has no working ground or is grounded at high impedance. The letter T indicates that the load side electrical equipment is grounded (commonly used on ships). |
| MF | Modulating frequency—change in the value of the instantaneous frequency of the carrier wave |
| NSVF | Non-sinusoidal voltage factor: the RMS of the fundamental harmonics to the RMS of the whole voltage signal. The NSVF is equal to 1 in the absence of harmonics in the voltage waveform. Based on my research I put the limit value at less than 0.8 in Table 1 |
| PQ | Power quality coefficients |
| RMS | Root mean square value |
| RV | Ripple voltage (peak-to-peak value) |
| S-SFV | Steady-state frequency variation—the maximum value expected of the frequency deviation at which the system frequency is designed to be stabilized after the occurrence of load changes |
| TFV | Time of frequency variation—the duration of the frequency variation |
References
- Kumar, D.; Zare, F. A Comprehensive Review of Maritime Microgrids: System Architectures, Energy Efficiency, Power Quality, and Regulations. IEEE Access 2019, 7, 67249–67277. [Google Scholar] [CrossRef]
- Verma, R.; Gawre, S.K.; Patidar, N.P. An Extensive Study on Optimization and Control Techniques for Power Quality Improvement. In Proceedings of the 2021 IEEE 2nd International Conference on Electrical Power and Energy Systems (ICEPES), Bhopal, India, 10–11 December 2021; pp. 1–6. [Google Scholar] [CrossRef]
- Eisenmann, A.; Streubel, T.; Rudion, K. Power Quality Mitigation via Smart Demand-Side Management Based on a Genetic Algorithm. Energies 2022, 15, 1492. [Google Scholar] [CrossRef]
- Ahsan, M.K.; Pan, T.H.; Li, Z.M. A Three Decades of Marvellous Significant Review of Power Quality Events Regarding Detection & Classification. J. Power Energy Eng. 2018, 6, 1–37. [Google Scholar] [CrossRef] [Green Version]
- Remigio-Carmona, P.; González-de-la-Rosa, J.-J.; Florencias-Oliveros, O.; SierraFernández, J.-M.; Fernández-Morales, J.; Espinosa-Gavira, M.-J.; Agüera-Pérez, A.; Palomares-Salas, J.-C. Current Status and Future Trends of Power Quality Analysis. Energies 2022, 15, 2328. [Google Scholar] [CrossRef]
- Gonzalez-Abreu, A.-D.; Osornio-Rios, R.-A.; Jaen-Cuellar, A.-Y.; Delgado-Prieto, M.; Antonino-Daviu, J.-A.; Karlis, A. Advances in Power Quality Analysis Techniques for Electrical Machines and Drives: A Review. Energies 2022, 15, 1909. [Google Scholar] [CrossRef]
- González de-la-Rosa, J.-J.; Pérez-Donsión, M. Special Issue “Analysis for Power Quality Monitoring”. Energies 2020, 13, 514. [Google Scholar] [CrossRef] [Green Version]
- PQube 3 Power Analyzer. Available online: https://powerside.com/products/monitoring/pqube-3-power-analyzers/ (accessed on 19 June 2022).
- Ang, J.H.; Goh, C.; Saldivar, A.A.F.; Li, Y. Energy-Efficient Through-Life Smart Design, Manufacturing and Operation of Ships in an Industry 4.0 Environment. Energies 2017, 10, 610. [Google Scholar] [CrossRef]
- Stanić, V.; Hadjina, M.; Fafandjel, N.; Matulja, T. Toward shipbuilding 4.0—an industry 4.0 changing the face of the shipbuilding industry. Brodogradnja 2018, 69, 111–128. [Google Scholar] [CrossRef]
- Sahoo, B.; Routray, S.K.; Rout, P.K.; Alhaider, M.M. Power quality and stability assessment of hybrid microgrid and electric vehicle through a novel transformation technique. Sustain. Energy Technol. Assess. 2022, 51, 101927. [Google Scholar] [CrossRef]
- Tarasiuk, T.; Jayasinghe, S.G.; Gorniak, M.; Pilat, A.; Shagar, V.; Liu, W.; Guerrero, J.M. Review of Power Quality Issues in Maritime Microgrids. IEEE Access 2021, 9, 81798–81817. [Google Scholar] [CrossRef]
- Cavallo, A.; Canciello, G.; Russo, A. Integrated supervised adaptive control for the more Electric Aircraft. Automatica 2020, 117, 108956. [Google Scholar] [CrossRef] [Green Version]
- Sumsurooah, S.; He, Y.; Torchio, M.; Kouramas, K.; Guida, B.; Cuomo, F.; Atkin, J.; Bozhko, S.; Renzetti, A.; Russo, A.; et al. ENIGMA—A Centralised Supervisory Controller for Enhanced Onboard Electrical Energy Management with Model in the Loop Demonstration. Energies 2021, 14, 5518. [Google Scholar] [CrossRef]
- Edrisian, A.; Goudarzi, A.; Ebadian, M.; Swanson, A.G.; Mahdiyan, D. Assessing the Effective Parameters on Operation Improvement of SCIG based Wind Farms Connected to Network. Int. J. Renew. Energy Res. 2016, 6, 585–592. [Google Scholar] [CrossRef]
- Shen, Y.; Abubakar, M.; Liu, H.; Hussain, F. Power Quality Disturbance Monitoring and Classification Based on Improved PCA and Convolution Neural Network for Wind-Grid Distribution Systems. Energies 2019, 12, 1280. [Google Scholar] [CrossRef] [Green Version]
- Zeeshan, H.M.A.; Nisar, F.; Hassan, A. A Review of Distributed Control Techniques for Power Quality Improvement in Micro-grids. IOP Conf. Ser. Mater. Sci. Eng. 2017, 199, 012025. [Google Scholar] [CrossRef] [Green Version]
- Jayasinghe, S.G.; Meegahapola, L.; Fernando, N.; Jin, Z.; Guerrero, J.M. Review of Ship Microgrids: System Architectures, Storage Technologies and Power Quality Aspects. Inventions 2017, 2, 4. [Google Scholar] [CrossRef] [Green Version]
- Quinteros, F.; Carrión, D.; Jaramillo, M. Optimal Power Systems Restoration Based on Energy Quality and Stability Criteria. Energies 2022, 15, 2062. [Google Scholar] [CrossRef]
- IEC 61000-4-7:2002+AMD1:2008 CSV; General Guide on Harmonics and Interharmonics Measurements for Power Supply Systems and Equipment Connected Thereto. International Electrotechnical Commission: Geneva, Switzerland, 2008.
- Gehrke, C.S.; Lima, A.M.N.; Oliveira, A.C. Controlling harmonics in electrical power systems for satisfying total and individual harmonic distortion constraints. In Proceedings of the 2014 IEEE Applied Power Electronics Conference and and Exposition—APEC 2014, Fort Worth, TX, USA, 16–20 March 2014; pp. 3342–3348. [Google Scholar] [CrossRef]
- Lloyds Register of Shipping. Rules and Regulations for the Classification of Naval Ships—Electrical Engineering; LRS: London, UK, 2001; Volume 2, Part 10, Chapter 1. [Google Scholar]
- Det Norske Veritas. Part 4. Systems and components. Chapter 8. Electrical installations. In Rules for Classification of Ships; DNV: Oslo, Norway, 2021. [Google Scholar]
- Polish Register of Shipping. Part VIII. Electrical equipment and automation. In Rules for the Classification and Construction of Naval Ships; PRS: Gdansk, Poland, 2008. [Google Scholar]
- Polish Register of Shipping. Part VIII. Electrical installations and control systems. In Rules for the Classification and Construction of Sea-Going Ships; PRS: Gdansk, Poland, 2021. [Google Scholar]
- American Bureau of Shipping. ABS Guidance Notes on Control of Harmonics in Electrical Power Systems; American Bureau of Shipping: Huston, TX, USA, 2006. [Google Scholar]
- IEC 61000-4-30:2015+AMD1:2021 CSV; Electromagnetic Compatibility (EMC)—Part 4-30: Testing and Measurement Techniques—Power Quality Measurement Methods. International Electrotechnical Commission: Geneva, Switzerland, 2021.
- IEC 60092-101:2018; Electrical Installations in Ships—Part 101: Definitions and General Requirements. International Electrotechnical Commission: Geneva, Switzerland, 2018.
- Maritime and Coastguard Agency. Potential Hazards of Excessive Harmonic Distortion of Current and Voltage of Onboard Electrical Systems; Marine Guidance Note MGN 449 (M); Maritime and Coastguard Agency: Southampton, UK, 2012.
- NATO STANAG 1008:2004; Characteristics of Shipboard Electrical Power Systems in Warships of the North Atlantic Treaty Navies. 9th ed. North Atlantic Treaty Organization: Washington, DC, USA, 2004.
- IEC/IEEE 60255-118-1:2018; IEEE/IEC International Standard—Measuring Relays and Protection Equipment—Part 118-1: Synchrophasor for Power Systems—Measurements. International Electrotechnical Commission: Geneva, Switzerland, 19 December 2018; pp. 1–78. [CrossRef]
- Mindykowski, J.; Tarasiuk, T.; Gnaciński, P. Review of Legal Aspects of Electrical Power Quality in Ship Systems in the Wake of the Novelisation and Implementation of IACS Rules and Requirement. Energies 2021, 14, 3151. [Google Scholar] [CrossRef]
- Stefanos, D. Power quality analysis for greener shipping by implementing an on-board electric power quality monitoring system. J. Mar. Eng. Technol. 2022, 21, 125–135. [Google Scholar] [CrossRef]
- Gaffney, M. Shipboard power quality problems: What it is, what causes it, effects of it, and technologies to correct it. In Proceedings of the Green Boats and Ports for Blue Waters IV, Portland, OR, USA, 29–30 August 2018. [Google Scholar]
- Michalec, Ł.; Jasiński, M.; Sikorski, T.; Leonowicz, Z.; Jasiński, Ł.; Suresh, V. Impact of Harmonic Currents of Nonlinear Loads on Power Quality of a Low Voltage Network—Review and Case Study. Energies 2021, 14, 3665. [Google Scholar] [CrossRef]
- Ligęza, A.; Kościelny, J.M. A New Approach to Multiple Fault Diagnosis: A Combination of Diagnostic Matrices, Graphs, Algebraic and Rule-Based Models. The Case of Two-Layer Models. Int. J. Appl. Math. Comput. Sci. 2008, 18, 465–476. [Google Scholar] [CrossRef]
- Bartyś, M. Diagnosing Multiple Faults with the Dynamic Binary Matrix. IFAC-Pap. 2015, 48, 1297–1302. [Google Scholar] [CrossRef]
- Gertler, J. Fault Detection and Diagnosis in Engineering Systems; Marcel Dekker: New York, NY, USA, 1998. [Google Scholar]
- Korbicz, J.; Kościelny, J.M.; Kowalczuk, Z.; Cholewa, W. Fault Diagnosis. Models, Artificial Intelligence, Applications; Springer: Berlin/Heidelberg, Germany, 2004. [Google Scholar] [CrossRef] [Green Version]
- Wang, M.; Wang, T.; Zhang, X.; Ma, S.; Wang, T.; Guo, J. Study on the variation of the steady-state frequency of power systems under the rapid growth of renewable energies. In Proceedings of the 8th Renewable Power Generation Conference (RPG 2019), Shanghai, China, 24–25 October 2019; pp. 1–5. [Google Scholar] [CrossRef]
- A1—Appendix 1: Load-Frequency Control and Performance. In UCTE Operation Handbook (OH); UCTE: Brussels, Belgium, 2004; pp. 1–27.
- Listewnik, K.; Polanowski, S.; Dereszewski, M.; Zukowski, J. Preliminary evaluation of effective vibration analysis for the fault diagnosis of natural gas engine-driven compressor. J. KONES Powertrain Transp. 2011, 18, 243–250. [Google Scholar]
- Listewnik, K.; Grzeczka, G.; Kłaczyński, M. Cioch, an on-line diagnostics application for evaluation of machine vibration based on standard ISO 10816-1. J. Vibroeng. 2015, 17, 4248–4258. [Google Scholar]


| Lp. | Title of Publication | Year, Author(s) and Journal | Aim(s) | PQ Measurement System | Need for Enhanced PQMS | PQ Factors/ Disturbances | Method of Analysis | Object of Investigation | Mitigation Technique | Remarks |
|---|---|---|---|---|---|---|---|---|---|---|
| 1. | A Method of Evaluation for Power-Generating Sets Based on the Assessment of Power Quality Parameters | Under review. Listewnik K.J., Energies, 43 references | Presentation of a novel method of failure classification based on PQ coefficients. | PQ research monitoring system. | Embedded PQ Sensor Node (IoT)—in the course of implementation. | 30 different factors as PQ estimators of failures. | Different, time and frequency domain, FFT, Hilbert. | Power-generating set—in general electrical machines and devices. | YES by detecting, classifying, and removing failures in monitored objects. | A novel Fault–symptom, PQ-based method. |
| 2. | A Comprehensive Review of Maritime Microgrids: System Architectures, Energy Efficiency, Power Quality, and Regulations [1] | 2019, Kumar D. et al. IEEE Access, 94 references | Review of the existing power quality standards highlighting the need for new requirements. | Mainly 1—the main switch board. | YES | Non-characteristic harmonics in the network. The engine scheduling approach can create pulsed loads. Below 2 kHz: Resonances, voltage and frequency variation, unbalanced, voltage and current harmonic distortion and commutation notches. | Difference | maritime power systems—microgrids. | YES Harmonics—active filters. | There are very few papers addressing the power quality issues and their impacts on maritime power systems. |
| 3. | Special Issue “Analysis for Power Quality Monitoring” [7] | 2020, De la Rosa J.-J.G. et al. Energies, 11 references | Recent advances. Objectives of PQ monitoring: compliance verification, performance analysis/benchmarking, site characterization, troubleshooting, advanced application and studies, and active PQ management. | Different, e.g., Embedded PQ Sensor Node. | Smart grid (IoT), Permanently monitor the power conditions within the grid. | Need for new parameters that reflect the current situation in the smart grid. | Different, e.g., High-Order Statistics, feature extraction in PQ contexts. | Power system grid. | NO | There is still a need for new parameters that reflect the current situation in the smart grid (SG). |
| 4. | Power Quality Disturbance Monitoring and Classification Based on Improved PCA and Convolution Neural Network for Wind-Grid Distribution Systems [16] | 2019, Shen Y. et al. Energies, 71 references | A novel algorithm based on improved principal component analysis (IPCA) and one-dimensional convolutional neural network (1-D-CNN) for detection and classification of PQDs. | Modified IEEE 13-bus Simulated in MATLAB. | Lack of information. | Root Mean Square, Skewness, Range, Kurtosis, Crest Factor, Form Factor and mean, energy, standard deviation, Shannon entropy, and log-energy entropy. | Improved Principal Component Analysis (IPCA) and One-Dimensional Convolutional Neural Network (1-D-CNN) for detection and classification of PQDs. | power quality disturbances (PQDs). | NO | - |
| 5. | A Review of Distributed Control Techniques for Power Quality Improvement in Micro-grids [17] | 2017, Zeeshan H.M.A. et al. IOP Conf. Series: Materials Science and Engineering, 22 references | Major aspects for the development in this field are to avoid large power breakdowns in micro-grid. | Information and communication technologies (ICT) at supervisory layer provide monitoring. Lack of details. | Cyber–Physical Systems (CPS) involve a combination of cyber and physical resources to provide sensing, processing, and computational platforms. | Imbalance of voltage profile, frequency mismatch, current distortions, and inaccurate management of active and reactive power. | Advanced Control Techniques: Harmonic mitigation, Voltage compensation, Power imbalance compensation, Droop control technique. | Microgrids | YES The decentralized subsystems for harmonic compensation and active–reactive power-sharing. | - |
| 6. | Review of Ship Microgrids System Architectures, Storage Technologies and Power Quality Aspects [18] | 2017, Jayasinghe S.G. et al. Inventions, 70 references | Investigate recent developments in these areas and provide readers with a critical review on power quality issues, energy storage technologies, and strategies that could be used to improve the power quality in ship microgrids. | Lack of information. | Lack of information. | Voltage variations, frequency variations, and waveform distortions, which are commonly referred to as harmonic distortions. | Experts analysis based on publication review. | Ship microgrids. | Energy storage is considered as a technology for mitigating voltage and/or frequency deviations. Passive filtering used for reducing harmonic distortions. | It is important to select the appropriate energy storage technology considering the type of power quality issue(s) being addressed. |
| 7. | Three Decades of Marvelous: A Significant Review of Power Quality Events Regarding Detection and Classification [4] | 2018, Mian Khuram Ahsan M.K. et al. Journal of Power and Energy Engineering, 234 references | Study of power quality events, such as automatic classification and signal processing via creative techniques and the noises’ effect on the detection and classification of power quality disturbances. | Lack of information. | Lack of information. | Frequency: slight deviation, sever deviation. Voltage: average voltage. Flicker, Sag: short, long, long-time disturbances. Under-Voltage: short, long. Swell: temporary short, temporary long. Over-Voltage Harmonics and Miscellaneous Signals. | Detection: Hilbert–Huang Transform, S-Transform, Wavelet Transform, and Fourier Transform. Classification: techniques of artificial intelligence, neural network, neuro-fuzzy system, Support Vector Machine, Genetic Algorithm, Fuzzy Expert System, Miscellaneous. | Electrical power system. | NO | Detection and classification PQ disturbances are two of the key aspects of the electrical power system. |
| 8. | Advances in Power Quality Analysis Techniques for Electrical Machines and Drives—A Review [6] | 2022, Osornio-Rios R.A. et al. Energies, 160 references | Study about the relationship existing between the motors and drives that induce electric disturbances into the grid, affecting its power quality, and also how these power disturbances present in the electrical network adversely affect, in turn, the motors and drives. | Lack of information. | Real-time monitoring for energy saving. | Transients, Short-duration voltage variation, Long-duration voltage variation, Power imbalance, Waveform distortion, Voltage fluctuations, Power frequency variation. | Fast Fourier transform (FFT), the short-time Fourier transform (STFT), discrete Fourier transform (DFT), discrete wavelet transform (DWT), Hilbert–Huang transform, S-transform. | Electrical machines and drives | Different active or passive wave-shaping techniques are used to mitigate the harmonic content effects. | The monitoring systems of the power grid have areas for improvement. PQ monitoring is often avoided as a measure for enhancing energy efficiency. |
| 9. | Optimal Power Systems Restoration Based on Energy Quality and Stability Criteria [19] | 2022, Quinteros F. et al. Energies, 42 references | Study considers contingencies for which the disconnection of transmission lines and generation units is carried out randomly. | Different solutions: sensors to monitor the electrical parameters on both sides of a switching device, monitor the variables in real time. | Lack of information. | Variables such as voltage, angular deviation, and power. | Optimal AC power flows (OPF-AC), optimal DC power flows (OPF-DC). | Electric power systems (EPS). | Optimal route is generated to restore the elements that went out of operation. | - |
| 10. | Current Status and Future Trends of Power Quality Analysis [5] | 2022, De la Rosa J.-J.G. et al. 153 references | Overview on PQ trends in several fields related to instrumental techniques that are being used in the smart grid to visualize the quality of the energy, establishing a solid literature base from which to start future research. | Commercial instrumentation, instrumentation designed by researcher. | Increasing trend towards monitoring research and instrumentation for PQ. Lack of details. | Sag, swell, flicker, harmonic, interruption, transient, notch, sag + harmonic, sag + transient, sag + flicker, sag + notch, sag + spike, sag + interruption, swell + harmonic, swell + transient, swell + flicker, swell + notch, swell + spike, swell + interruption, flicker + harmonic, spike + interruption, spike + harmonic, spike + transient, notch + interruption, notch + harmonic, notch + transient, harmonic + interruption, harmonic + transient, more than 2 events. | Discrete Fourier Transform (DFT)/Fast Fourier Transform (FFT), Wavelet Transform (WT), S-Transform (ST), Short-Time Fourier Transform (STFT), Kalman Filter (KF), Hilbert–Huang Transform (HHT), Singular Spectrum Analysis (SSA), Higher-Order Statistics (HOS), Artificial Intelligence (AI), Total Harmonic Distortion (THD), Root Mean Square (RMS). | Photovoltaic (PV) and wind renewable systems. | Depends on disturbance type, e.g., for Harmonics: Filters, low-voltage line reactors, constant voltage transformers, motor generators, high-speed flywheel, standby UPS, online UPS, UPS and engine generator, unified power quality conditioner UPQC, D-STATCOM, spinning reserve, adjustable speed drive. | Current networks contain numerous coupled load effects; thus, new disturbances are not simple; they are usually complex events, the sum of several types of disturbances. Likewise, depending on the type of installation, the objective of the PQ analysis changes, either by detecting certain events or simply focusing on seeing the state of the network. |
| 11. | Power Quality Mitigation via Smart Demand-Side Management Based on a Genetic Algorithm [3] | 2022, Eisenmann A. et al. Energies, 58 references | Investigation the possibility and potential of an active mitigation technique to handle the PQ degradation caused by nonlinear loads in future industrial electrical grids, without the need for conventional measures such as passive or active filtering | Demand-side management (Smart DSM) | Implementing DSM in the Industry 4.0 application | THD of the voltage. The total demand distortion (TDD) of the load current or specific harmonics | NSGA-II algorithm | Industrial electrical grids | The mitigation method is based on genetic-algorithm-guided optimization for smart operational planning of the grid elements | - |
| Possible Symptoms | Type of Electrical Parameter | Estimators E | Units | Limit Values L | Description |
|---|---|---|---|---|---|
| S1 | An armature voltage | VT | [V] | 400 V ± 10% | Steady-State Voltage Tolerance |
| S2 | VV | [%] | 10 | Voltage Variation—Static | |
| S3 | MD | [%] | 2 | Voltage Modulation Tolerance at AC RMS | |
| S4 | TRV | [%] | 15 | Transient Recovery Voltage | |
| S5 | LVUR | [%] | 7 | Line Voltage Unbalance Rate | |
| S6 | TTRV | [s] | 2 | Time of Transient Recovery Voltage | |
| S7 | FFV | - | >1.3 | Form Factor of AC Voltage | |
| S8 | CFV | - | >1.43 | Crest Factor of AC Voltage | |
| S9 | NSVF | - | <0.98 | Non-Sinusoidal Voltage Factor | |
| S10 | THDu | [%] | 5 | Total Harmonic Distortion | |
| S11 | TDFu | [%] | 5 | Total Deformation Factor | |
| S12 | THF | [%] | 5 | Telephone Harmonic Factor | |
| S13 | IHDu | [%] | 3 | Individual Harmonic Distortion [21] | |
| S14 | S-SFV | [%] | 5 | Steady-State Frequency Variation | |
| S15 | MF | [%] | 2 | Modulating Frequency | |
| S16 | FV | [%] | 10 | Frequency Variation | |
| S17 | TFV | [s] | 2 | Time of Frequency Variation | |
| S18 | An armature current | IT | [A] | In ± 10% | Nominal Current Tolerance |
| S19 | FFI | - | >1.3 | Form Factor of AC Current | |
| S20 | CFI | - | >1.43 | Crest Factor of AC Current | |
| S21 | hDi | [%] | 1 | Non-Sinusoidal Current Factor | |
| S22 | THDi | [%] | 5 | Total Harmonic Distortion | |
| S23 | TDFi | [%] | 5 | Total Deformation Factor | |
| S24 | IHDi | [%] | 3 (≤2.3 A) | Individual Harmonic Distortion | |
| S25 | An excitation voltage | EVT | [V] | Ufn ± 10% | Nominal Excitation Voltage Tolerance |
| S26 | RV | [V] | ≤100 | Ripple Voltage (peak-to-peak value) | |
| S27 | IHDue | [%] | 3 | Individual Harmonic Distortion | |
| S28 | An excitation current | EIT | [A] | Ifn ± 10% | Nominal Excitation Current Tolerance |
| S29 | RC | [A] | 1.2 | Ripple Current (peak-to-peak value) | |
| S30 | IHDie | [%] | 3 | Individual Harmonic Distortion |
| Symptoms | Factors | Units | Measurement Values | Limit Values | Binary Value | Fault No. 3 |
|---|---|---|---|---|---|---|
| S1 | VT | [V] | 356.8 | >360 and <440 | 1 | F3 |
| S2 | VV | [%] | 10.8 | 10 | 1 | |
| S3 | MD | [%] | 2.06 | 2 | 1 | |
| S9 | NSVF | - | 0.93 | <0.98 | 1 | |
| S14 | S-SFV | [%] | 5.7 | 5 | 1 | |
| S15 | MF | [%] | 5.26 | 2 | 1 |
| Possible Symptoms | FAILURES | ||||||
|---|---|---|---|---|---|---|---|
| F1 | F2 | F3 | F4 | F5 | F6 | F7 | |
| S1 | 1 | 0 | 1 | 1 | 0 | 1 | 1 |
| S2 | 1 | 0 | 1 | 1 | 0 | 1 | 1 |
| S3 | 1 | 0 | 1 | 0 | 0 | 0 | 1 |
| S4 | 1 | 0 | 0 | 0 | 0 | 0 | 0 |
| S5 | 0 | 0 | 0 | 0 | 0 | 0 | 0 |
| S6 | 1 | 0 | 0 | 0 | 0 | 0 | 0 |
| S7 | 1 | 0 | 0 | 0 | 0 | 0 | 1 |
| S8 | 1 | 0 | 0 | 0 | 0 | 0 | 0 |
| S9 | 1 | 0 | 0 | 0 | 0 | 0 | 1 |
| S10 | 0 | 0 | 0 | 0 | 0 | 0 | 1 |
| S11 | 0 | 0 | 0 | 0 | 0 | 0 | 0 |
| S12 | 0 | 0 | 0 | 0 | 0 | 0 | 0 |
| S13 | 0 | 0 | 0 | 1 | 0 | 0 | 0 |
| S14 | 0 | 0 | 0 | 0 | 0 | 0 | 0 |
| S15 | 1 | 1 | 1 | 1 | 0 | 0 | 1 |
| S16 | 0 | 0 | 1 | 1 | 0 | 0 | 1 |
| S17 | 0 | 0 | 0 | 0 | 0 | 0 | 0 |
| S18 | 1 | 0 | 0 | 0 | 0 | 0 | 0 |
| S19 | 1 | 0 | 0 | 1 | 0 | 0 | 0 |
| S20 | 1 | 0 | 0 | 0 | 0 | 0 | 0 |
| S21 | 1 | 0 | 1 | 0 | 0 | 0 | 0 |
| S22 | 0 | 0 | 0 | 0 | 0 | 0 | 0 |
| S23 | 0 | 0 | 0 | 0 | 0 | 0 | 0 |
| S24 | 0 | 0 | 0 | 0 | 0 | 0 | 1 |
| S25 | 1 | 1 | 0 | 0 | 0 | 0 | 0 |
| S26 | 1 | 1 | 0 | 0 | 0 | 0 | 0 |
| S27 | 1 | 1 | 0 | 0 | 0 | 0 | 0 |
| S28 | 1 | 0 | 0 | 0 | 0 | 0 | 0 |
| S29 | 1 | 1 | 0 | 0 | 0 | 0 | 0 |
| S30 | 1 | 1 | 0 | 0 | 0 | 0 | 0 |
Publisher’s Note: MDPI stays neutral with regard to jurisdictional claims in published maps and institutional affiliations. |
© 2022 by the author. Licensee MDPI, Basel, Switzerland. This article is an open access article distributed under the terms and conditions of the Creative Commons Attribution (CC BY) license (https://creativecommons.org/licenses/by/4.0/).
Share and Cite
Listewnik, K.J. A Method for the Evaluation of Power-Generating Sets Based on the Assessment of Power Quality Parameters. Energies 2022, 15, 5305. https://doi.org/10.3390/en15145305
Listewnik KJ. A Method for the Evaluation of Power-Generating Sets Based on the Assessment of Power Quality Parameters. Energies. 2022; 15(14):5305. https://doi.org/10.3390/en15145305
Chicago/Turabian StyleListewnik, Karol Jakub. 2022. "A Method for the Evaluation of Power-Generating Sets Based on the Assessment of Power Quality Parameters" Energies 15, no. 14: 5305. https://doi.org/10.3390/en15145305