Article

Influence of Nanoemulsion Droplet Size of Removing Water Blocking Damage in Tight Gas Reservoir

1
Unconventional Petroleum Research Institute, China University of Petroleum, Beijing 102249, China
2
State Key Laboratory of Petroleum Resource and Prospecting, China University of Petroleum, Beijing 102249, China
3
School of Petroleum Engineering, Yangtze University, Jingzhou 434000, China
*
Author to whom correspondence should be addressed.
Energies 2022, 15(14), 5283; https://doi.org/10.3390/en15145283
Submission received: 3 June 2022 / Revised: 18 July 2022 / Accepted: 19 July 2022 / Published: 21 July 2022
(This article belongs to the Special Issue Shale Oil and Gas Accumulation Mechanism)

Abstract

:
During the production process, water phase incursion into the reservoir causes water blocking damage and seriously affects the production of tight gas reservoirs. Recently, nanoemulsions have been used as highly effective water blocking removing agents in the field, but their mechanism is still unclear. In this research, a series of nanoemulsions with different droplet sizes were synthesized, and their water blocking removing performance was intensively investigated. To begin, the relationship between the droplet size and the chemical composition of the nanoemulsion was determined by dynamic light scattering. Second, the influence of the nanoemulsion droplet size on the surface tension and the contact angle experiments was studied. Finally, NMR and permeability recovery experiments were used to study the relationship between the droplet size and the water locking removing effect of the nanoemulsions. Simultaneously, the surfactant release process was investigated using the static adsorption curves of the nanoemulsions. The experimental results show that the droplet size of nanoemulsion has an exponential relationship with the oil phase content. The surface tension decreases with the increase in droplet size, but the wetting reversal effect decreases with the increase in droplet size. The nanoemulsion with an oil phase content of 5 wt.% has the best water locking removing effect, and the permeability recovery value of the core reaches 59.54%. The adsorption control of the nanoemulsion on the surfactant is the key to its water blocking removing ability. This comprehensive study shows that the nanoemulsion with an oil phase content of 5 wt.% has optimum adsorption control capability. Thus, it can be used as a promising candidate for removing water blocking in tight gas reservoirs.

1. Introduction

According to the “World and China Energy Outlook” (2021 Edition), China’s natural gas demand will maintain rapid growth, which is expected to reach 6000 × 108~6200 × 108 m3 in 2035 and the task of increasing domestic production of natural gas is urgent [1]. There are abundant tight sandstone gas reservoirs in China, accounting for about 27.5% of the total natural gas resources, mainly distributed in the Sichuan, Tarim and Ordos basins [2,3,4,5]. By the end of 2018, a total of 812 gas fields had been developed, and more than 80% of the gas fields had clear formation water bodies, such as edge water and bottom water in varying degrees [6,7,
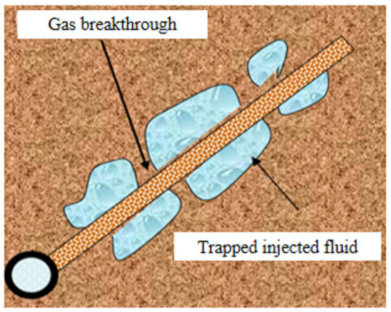
8]. As development time increases, gas wells gradually start to produce water, which is the main issue affecting production stability and recovery in the development of gas fields. In tight reservoirs, matrix permeability might be reduced by more than 70% to 90% due to water blocking damage induced by liquid phase traps as shown in Figure 1. On the one hand, this will lead to a sharp decline in gas well production, and even off production. on the other hand, water in the formation can block the reservoirs, and a large amount of natural gas reserves cannot be effectively recovered [9]. Therefore, water blocking damage has emerged as one of the most significant issues limiting the efficient development of tight sandstone gas reserves [10].
Many methods for removing water blocking damage have been developed, including raising the production pressure difference, introducing dry gas, preheating the formation, injecting miscible solvent and so on. The drawbacks of the procedures described above include a limited effective duration and a high cost of repeated operations [11,12,13,14]. Injecting chemical agents is another way to remove water blocking damage. It is necessary to formulate or synthesize water blocking removal agents depending on factors, such as surface tension, wettability, and capillary radius [15]. By changing the capillary force, the liquid recovery in gas flooding could be enhanced, and the water saturation of pores will be reduced, which achieves the goal of reducing water block damage [16,17].
The water blocking removing agents are chemicals with low surface tension and wettability alteration ability. Hu et al. [18] studied the wettability alteration ability of several different surfactants through capillary experiments. The surface tension was lowered to 25.49 mN/m after adding 0.5% XN-OP-2 treatment, and the contact angle reached 74.3°. It converted the glass surface to weak water wetting. Jiang et al. [19] synthesized a dicationic fluorocarbon surfactant, which can increase the contact angle of strong water-wet surfaces to 100°. Spontaneous imbibition experiments indicate that the surfactant can make the rock surface hydrophobic and oleophobic. Sharifzadeh et al. [20] investigated polymer surfactants containing fluorine groups, which made the rock surface hydrophobic, and the contact angle increased by 120°. Li et al. [21] synthesized a water blocking removing agent by emulsion polymerization of acrylic acid and perfluorooctyl ethyl acrylate. The contact angle of the rock surface can be changed to 126°, and the free energy of the rock surface dropped from 73 mN/m to 8.2 mN/m at a concentration of 1.5%. Hoseinpour et al. [22] proposed a new fluorocarbon-based wettability modifier, which can change the wettability of sandstone rock surface from liquid wettability to preferential gas wettability. After the chemical treatment of the sandstone slice, the contact angles of water and n-decane in the air–liquid-rock system were altered from 0° to 151° and 101°, respectively. Spontaneous imbibition of water and n-decane into the core sample was significantly reduced. The ultimate amounts of liquid imbibition were decreased to 0.03 and 0.16 PV. It demonstrated the sandstone slice was alternated to preferentially gas-wetting. However, fluorocarbon surfactants are difficult to be widely used in the field due to problems, such as environmental protection and high price [23,24,25,26].
In recent years, nanoemulsions prepared from non-fluorocarbon wetting modifiers by the low energy emulsification method have attracted more and more attention [27,28]. Nanoemulsions can reduce the surface tension of the solution and alter the wettability of the solid surface. At the same time, it has a nano-scale droplet size, which can migrate for a long distance in the pores sized less than 1 um. Liang [29] evaluated the water blocking removing effects of DME with a droplet size of 10 nm, and studied the mechanism combined with spontaneous imbibition and nuclear magnetic resonance (NMR) experiments. It is concluded that the mechanism of removing water blocking is mainly through changing the rock core from water-wetting to gas-wetting. It can also reduce the capillary force by reducing the surface tension. Wang [11] used CND AD1# with droplet sizes of 100 nm as the water blocking removal agent and explored the water blocking removal effect in rock cores with different permeability. However, the existing studies simply focus on the performance evaluation of the water blocking removal effect with nanoemulsions. There is a lack of mechanistic and structure studies on the water blocking removal of nanoemulsions. Moreover, the relationship between the structure and water removing abilities of the nanoemulsion lock is unclear.
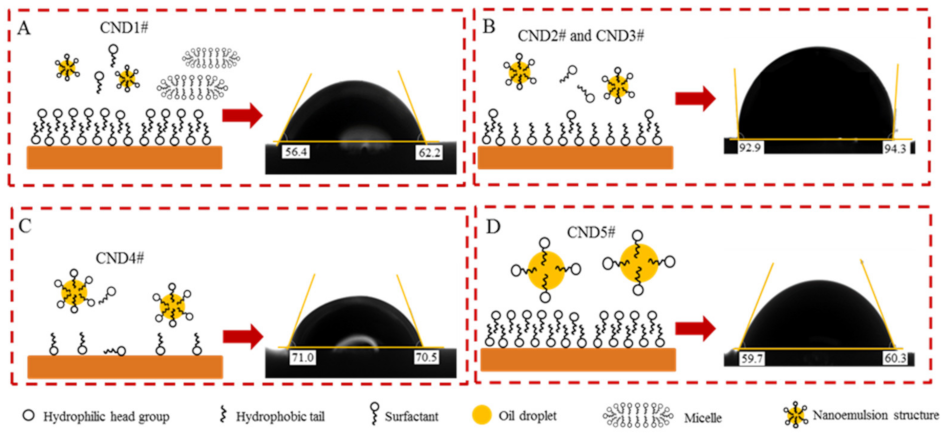
This manuscript firstly synthesizes a series of nanoemulsions with different droplet sizes by a low-energy emulsification method. Then, through the surface tension test, wettability test, adsorption curve measurement and NMR experiments, the surface activity, wetting modification, adsorption characteristics and removal water blocking damage ability of nanoemulsions with different droplet sizes were comprehensively evaluated. Furthermore, the optimized nanoemulsions formula was recommended, and the microscopic mechanism of nanoemulsions removing water blocking damage in tight gas reservoirs was revealed. Based on these studies, nanoemulsions can be used as a promising additive to remove water blocking damage and improve the production in tight gas reservoirs.

2. Experiments

A series of nanoemulsion samples will be prepared at first. Then, the main research idea and methods will be carried out according to Figure 2. The detailed processes are solidified in Section 2.1, Section 2.2, Section 2.3, Section 2.4 and Section 2.5.

2.1. Experimental Materials

Surfactant ALPE (alkylphenol polyoxyethylene ether, industrial product, purity 80%) was purchased from Beijing Kemax Oilfield Chemical Co., Ltd. Glycerol, sodium chloride (99%, A.R. grade), potassium chloride (99%, A.R. grade), sodium sulfate (99%, A.R. grade), calcium chloride (99%, A.R. grade) and sodium bicarbonate (99%, A.R. grade) were purchased from Sinopharm Group. D-Limonene was purchased from Aladdin Company. All chemicals were of analytical grade without further purification.
The experimental cores were taken from the Changqing Oilfield, and the gas layer depth was 3762.79 m. The specific parameters are shown in Table 1. The mineral composition obtained by XRD mineral analysis is shown in Table 2, and the lithology is sandstone. The natural cores were washed with a Soxhlet extractor for further experiments. The types and contents of ions in formation water are shown in Table 3.

2.2. Nanoemulsion Formulation

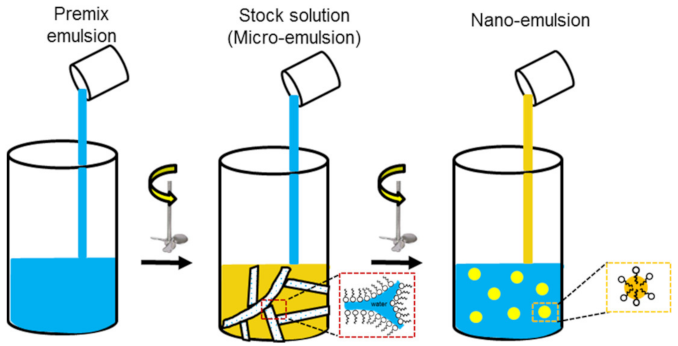
Low energy emulsification is an economical and efficient approach to preparing nanoemulsions. In this paper, the microemulsion dilution method is used according to the literature [30]. 
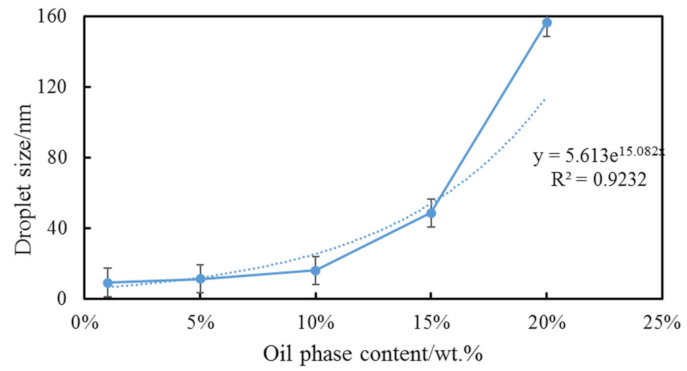
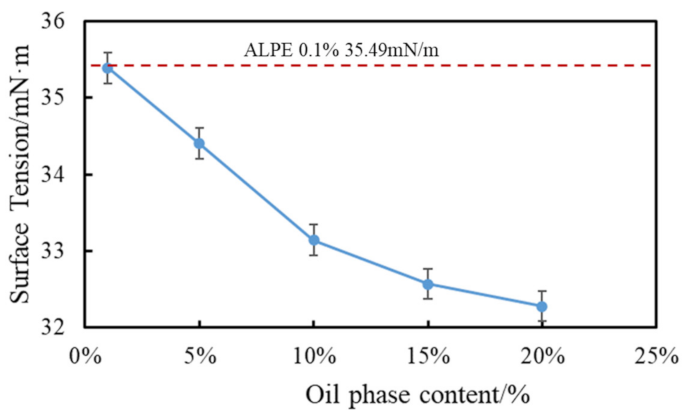
Figure 3 illustrates the experimental approach. The first step is pre-emulsification. Water, glycerol, surfactant (ALPE) and oil phase (D-limonene) are mixed uniformly under stirring conditions to obtain a microemulsion, namely a stock solution. The second step is next to dilute the stock solution with water under stirring conditions to obtain nanoemulsions with stable droplet size. The droplet size of nanoemulsion is later found to be related to the oil phase content in the stock solution.
To investigate the influence of nanoemulsions with varying droplet sizes on their ability to remove water blocking damage, five different kinds of stock solutions with varying oil phase content were synthesized. The five stock solutions were numbered 1#–5#. Five stock solutions were diluted to obtain five nanoemulsions of varying droplet sizes. The five nanoemulsions were numbered CND1#–CND5#, as shown in Table 4. The concentration of nanoemulsion refers to the mass fraction of the stock solution. For example, 0.1 wt.% CND1# is 1# with 99.9 wt.% water.

2.3. Physical Properties Evaluation of Nanoemulsion

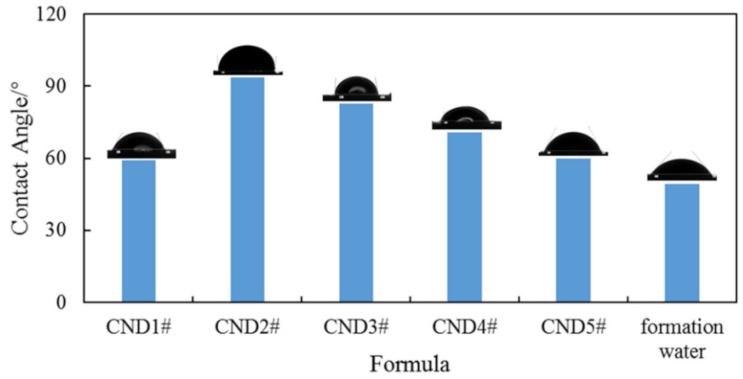
2.3.1. Contact Angle Test

The cores were cut into 1 cm slices and then soaked in nanofluid or brine for 6 h. The surface of the rock was dried. The rock slices were placed on the contact angle tester JYB-P (Chengde King and Instrument Manufacturing Co., Ltd., Hebei, China), and a 10 μL formation water drop was injected into the rock surface by a microtubule. The contact angle at the interface was measured with analysis software. The core before and after nanoemulsion soaking were measured, respectively. The experimental temperature is room temperature and the experimental pressure is 0.1 MPa. The schematic diagram of the experimental device is shown in Figure 4.

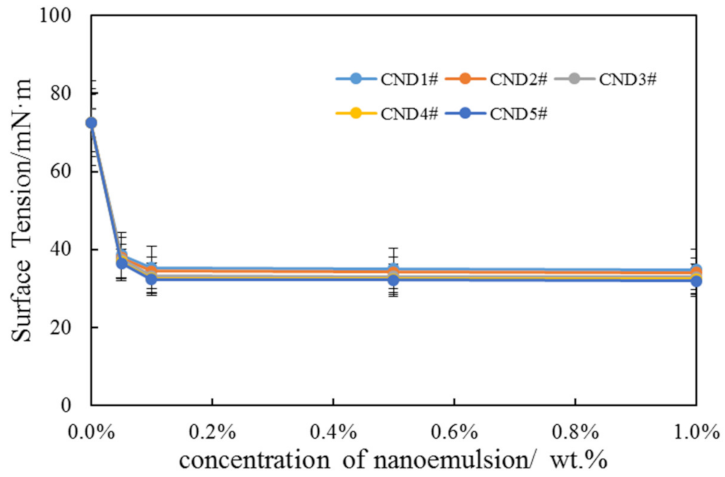
2.3.2. Interfacial Tension Test

The instrument used in the experiment is the BZY-2 surface tensiometer (Shanghai Hengping Instrument Factory, Shanghai, China). Firstly, distilled water and alcohol were used to calibrate the interface tension meter. Then, different concentrations of nanoemulsions were prepared, and the surface tension between the solution and air was tested by the du Nouy Ring method. Each concentration was tested five times, and then the arithmetic mean value was taken. The experimental temperature was room temperature and the experimental pressure was 0.1 MPa.

2.3.3. Droplet Size Test

The Zetasizer Nanolaser nanoparticle size analyzer was used to measure its droplet size. The concentration of nanoemulsion was 0.1%. The experimental temperature was room temperature and the experimental pressure was 0.1 MPa. The peak particle size was used in the manuscript.

2.4. Static Adsorption Characteristics of Nanoemulsion on Rock Surface

2.4.1. Measurement of Light Absorption Peak and Preparation Standard Curve

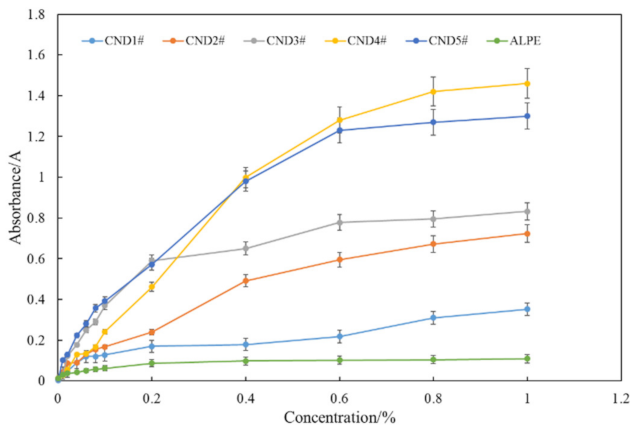
The light absorption intensity curves of five nanoemulsions (0.1 wt.%) were measured by spectrophotometer in the wavelength range 190–340 nm. The curve peaks were selected as the test wavelength. By measuring the absorbance of various concentrations of the nanoemulsions at the test wavelength, the curve of the light absorption intensity of the nanoemulsions versus the concentration was drawn, as shown in Figure 5. With the increase in the nano-solution concentration, the absorbed light intensity gradually increased and tended to be stable after a certain concentration. This standard curve pattern has also been observed in a similar system [17].

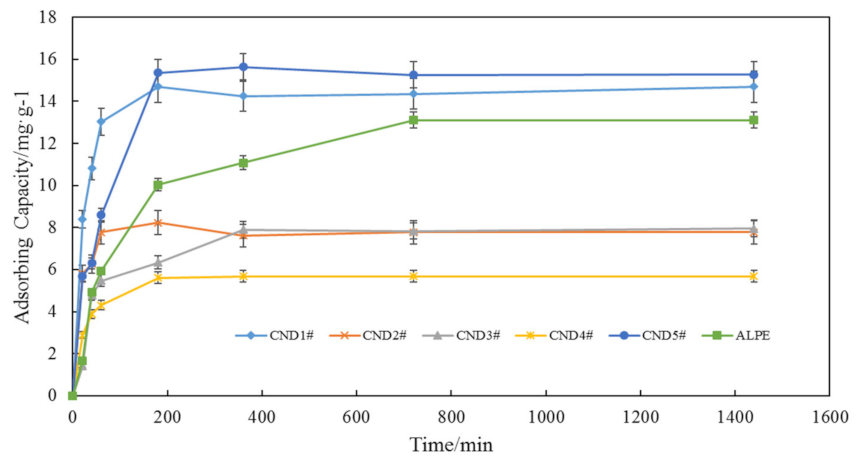
2.4.2. Chemical Adsorbing Test of Nanoemulsions

We added 10 mL of 0.1 wt.% nanoemulsions or 0.025% ALPE solution to 1.5 g of 70/100 mesh rock powder, and let it stand at room temperature for a period of time. The experimental time was set to 20 min, 40 min, 1 h, 3 h, 6 h and 24 h, respectively. Then, the mixture solutions were centrifuged for 15 min at 4000 RPM, and the supernatant fluids were taken for spectrophotometric measurements. From the change of absorbance over time, the loss of nanoemulsions absorbed by rock surfaces can be quantified.

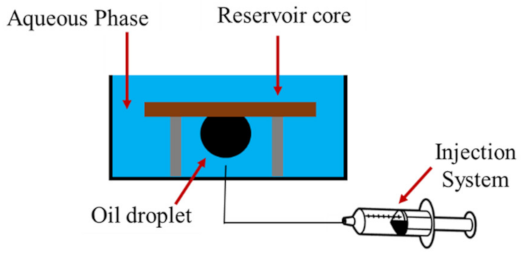
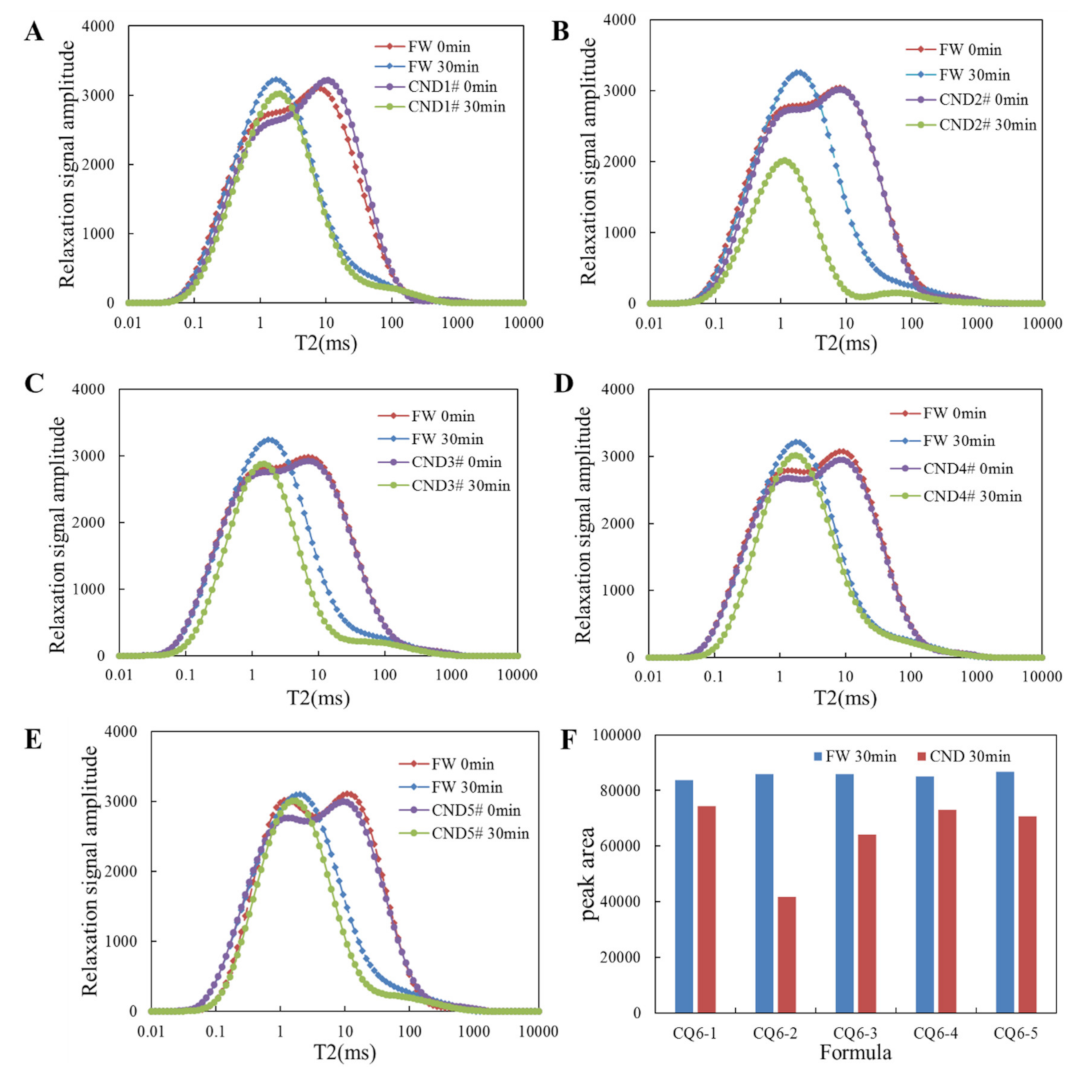
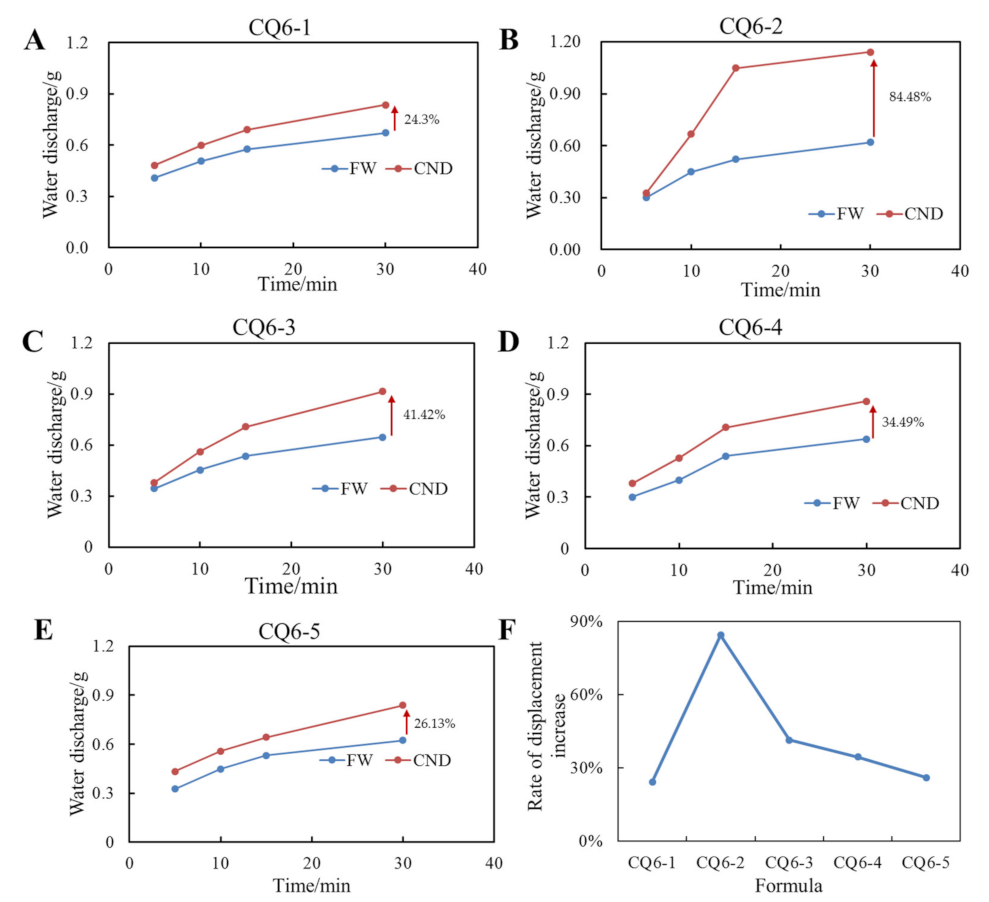
2.5. Evaluation of Water Blocking Removal Effect

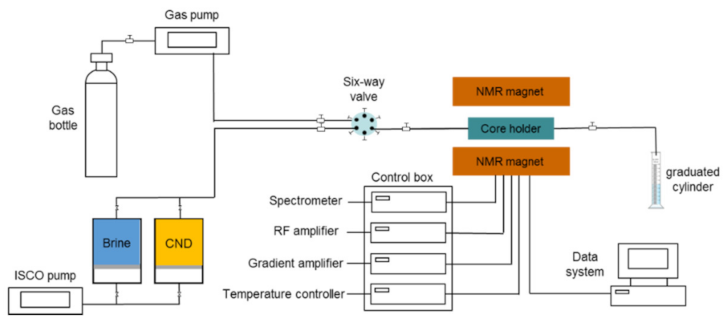
The hydrogen nucleus 1 H in a water molecule has a permanent magnetic moment and hence, produces a remarkable NMR signal. NMR is used to evaluate the distribution of water in pores of different sizes by measuring the relaxation time of hydrogen signals. This paper uses a three-dimensional NMR analyzer named MacroMR12-150 H from Suzhou Newmai Electronic Technology, Suzhou, China. Nuclear magnetic resonance T2 spectrum technology was used to quantitatively analyze the water blocking removal mechanism. The schematic diagram of the experimental device was shown in Figure 6. The specific experimental steps were as follows:
Step 1: Put the core in a vacuum environment for 4 h, and then saturate it with formation water for 24 h at 20 Mpa.
Step 2: Load the core into the NMR device and inject nitrogen with constant pressure. The displacement pressure was 0.1 MPa and the temperature was 80 °C. The NMR T2 was measured every 5 min, and the water displacement at the outlet was recorded; the total displacement time was 30 min. After 30 min of displacement, the core’s permeability was tested with nitrogen. The core permeability K1 is obtained.
Step 3: Switch the valve and reversely inject the nanoemulsion 3–4 PV. Then the valve was closed and the rock core aged with nanoemulsions for 6 h.
Step 4: Switch the valve and inject 15–20 PV of formation water in the forward direction. Nitrogen was then used to displace the water in the core. The displacement pressure was 0.1 MPa, the temperature was 80 °C, the nuclear magnetic T2 was measured every 5 min, and the drainage volume at the outlet was recorded; the total water displacement time was also 30 min. After 30 min of displacement, the core’s permeability was tested with nitrogen. The core permeability K2 was obtained.
Step 5: the recovery rate of permeability is calculated according to Formula (1).
V = K 0 K a K a
where V is the permeability recovery rate, %; Ka (in this case it means K1 or K2) is the permeability of gas flooding after the formation of water, mD; K0 is the gas permeability of the dry core, mD.

3. Results and Discussion

3.1. Basic Physical Properties of Nanoemulsions

The droplet size of a nanoemulsion is closely related to its properties. A nanoemulsion usually has a droplet size of 10–200 nm. The droplet size varies with its chemical composition, especially the content of the oil phase [31]. Therefore, in order to obtain a series of nanoemulsions with different sizes, the droplet size measurement needs to be carried out first.
Figure 7 shows the relationship between the droplet sizes of the nanoemulsions and the mass fraction of the oil phase. It can be seen from the figure that with the increase in the oil phase content, the size of the nanoemulsion shows an exponential growth trend. When the oil phase content is 1%, the droplet size of the nanoemulsion is 9.05 nm. When the oil phase content increases to 10%, the droplet size increases to 15.92 nm.
However, when the oil phase content reaches 20%, the droplet size rapidly increases to 156.6 nm. Overall, the droplet size of the nanoemulsions increases exponentially with the increase in the oil phase content. By fitting, the expression of nanoemulsion droplet size D and oil phase content X can be obtained as D = 5.613e15.082x.
As the oil phase content increases, an increased number of surfactants need to emulsify the oil phase. However, the addition of surfactant is constant. To keep the nanoemulsions system stable, the droplet size must increase to reduce the specific surface area. Theoretical calculation shows, that when the oil phase content increases from 1% to 10%, the oil droplet size should be increased by 2.15 times (9.05 nm vs. 15.92 nm) under the same dosage of surfactant. Measured data show the particle size increased by only 1.5 times when the oil phase content changed from 1% to 10%. It indicates that the increase in oil content does increase the droplet size. There may be some micelles in the solution when the oil is 1%. Under such a condition, the surfactant is excessive, and previous studies also prove this [32].

3.2. Surface Activity

In the process of tight sandstone gas reservoirs, when the water blocking removing agent contacts the reservoir rock, the nanoemulsions in the solution slowly release part of the surfactants. These surfactants adsorb to the rock surface and maintain the fluid at a relatively low surface tension. According to the capillary force Formula (2), after the nanoemulsion enters the formation, the interfacial tension is reduced, resulting in a decrease in capillary force, which helps to relieve the water lock damage.
P cap = 2 σ cos θ r
where Pcap—capillary pressure (Pa), σ—surface tension between liquid and gas (mN/m), θ—contact angle between liquid and rock (°), r—pore radius (mm).
The surface tension between air and formation water measured in the laboratory was 72.43 mN/m. The concentration of the five nanoemulsions was increased from 0.1% to 1%, and the surface tension was basically unchanged, as shown in Figure 8. At the concentration of 0.1%, the surface tensions of the five nanoemulsions were less than 35 mN/m, which significantly reduced the surface tension between the air and formation water. When the nanoemulsions concentration exceeds 0.1%, the surface tension tends to be stable. The relationship between surface tension and oil phase content is shown in Figure 9. By comparison, the surface tensions of these five nanoemulsions decreased with increasing oil phase content. The surface tension of CND1# was 35.39 mN/m, and that of CND5# was 32.28 mN/m, with a decrease of 8.88%. This is mainly because surface tension is related to the arrangement of the surfactant molecules at the gas–liquid interface. With the increase in the oil phase content, parts of the oil go into the gas–liquid interface, and the interface is more closely arranged, resulting in a decrease in the surface tension [26].

3.3. Static Contact Angle Analysis

According to the capillary force equation, increasing the contact angle between the liquid and the core is another way to effectively reduce the capillary force. Figure 10 illustrates the change of the contact angle after soaking the core with different liquids. The contact angle of the rock core in the initial state is 48.65°, showing a characteristic of water wetting. After soaking in the formation water for 6 h, the wetting contact angle changed from 48.65° to 49.4°, which was still water-wet. However, after soaking in the five nanoemulsions, the contact angles increase. The contact angles of nanoemulsions CND1# to CND5# after soaking are 59.3°, 93.6°, 82.75°, 70.75°, and 60°, respectively. By contrast, the contact angles of CND2# and CND3# are very closest to neutral wetting, and the other three nanoemulsions turn the core into weak water wetting.
Tight reservoir pores and throats are at the micron or nanoscale. Reservoir fluid imbibes into the matrix under the action of capillary force and forms a water lock effect at the pore throat, which blocks gas seepage channels and sharply reduces gas well production [29]. As a water blocking removing agent, nanoemulsion can not only reduce the surface tension but also modify the reservoir to oil or gas wetting. It can synergetically reduce capillary force and thus relieve water lock damage, which is very important to restore gas well production at tight reservoirs.

3.4. Static Adsorption Analysis on Rock Surface

The wettability alternation effect is closely related to the adsorption of surfactant on the rock surface. After the surfactant is adsorbed on the rock surface, the hydrophobic groups are outward, and the effect of wettability alteration is achieved. In multilayered adsorption, the wettability alternation effect becomes complicated.
It can be seen from Figure 11 that the adsorption amount of the nanoemulsion decreased initially and then increased with the increase in the oil phase content. In order to further illustrate the adsorption characteristics of nanoemulsions, the adsorption amount of 0.025% ALPE on rock surface was used as a comparison. The adsorption amounts of CND1# and CND5# are higher than that of surfactant ALPE, the adsorption amounts of CND2# and CND3# are basically similar, and the lowest adsorption amount is CND4#, which is only 5.68 mg/g. According to the S–F isotherm [33], the residual concentration of the surfactant is different, leading to the adsorption form of the surfactant on the rock surface being different [34].
For nanoemulsions, with the increase in the oil phase content, the amount of surfactant involved in emulsification increases, and the free surfactant content in the solution decreases. It is equivalent to a decrease in the residual concentration in the solution. Therefore, from CND1# to CND4#, the adsorption capacities are basically reduced, as shown in Figure 10. As for CND5#, the stability of nanoemulsions may be poor, and the nanoemulsion breaks and releases more surfactants. Figure 12 shows the possible adsorption mechanism with different nanoemulsions.
For CND1# with an oil phase content of 1%, due to excess surfactant, nanoemulsions and micelles may coexist in the solution. The surface tension of CND1# measured in the above experiments is basically the same as the surface tension of the ALPE system, which can support this phenomenon. Therefore, as shown in Figure 12A, the surfactant will be adsorbed on the rock surface in large quantities, and the excessive or multilayer adsorption will weaken the effect of the wetting alternation. Meanwhile, due to the oil phase and co-surfactant, the adsorption capacity is perhaps higher than that of the surfactant ALPE.
Figure 12B depicts the adsorption of CND2# and CND3#. The droplet size of the nanoemulsion grows as the oil phase content increases, but the amount of free surfactant in the nanoemulsion decreases. The monolayer adsorption on the rock surface is proposed, and the hydrophobic group faces outward. At this time, the wetting alternation of rock core is the best. The contact angles of these two systems are 93.6° and 82.75°, respectively, and the adsorption amounts are 7.77 mg/g and 7.94 mg/g, respectively. The adsorption amount of CND2# was only 47.11% of CND1#. Similar adsorption amounts have also been reported in the literature [29,35].
The adsorption amount of surfactant on the rock surface is related to the concentration of the solution. With the increase in the surfactant concentration in the solution, the adsorption of surfactant on rock surface is from the adsorption of surfactant molecules to the adsorption of the semi-gel bundle, and then to the adsorption of micelles. The adsorption amount of the surfactant also increases with the increase in concentration. For the nanoemulsion, there is a dynamic adsorption equilibrium between the surfactant on the droplet surface of the nanoemulsion and the surfactant in the solution. Therefore, the particle size of the nanoemulsion will affect the concentration of surfactant in the solution, thus showing different adsorption processes. The oil phase content of the CND4# system further increases, which reduces the content of free surfactants and reduces the adsorption amount on the rock surface, such as in Figure 12C. The insufficient adsorption of surfactants on the rock surface led to a poor wetting alternation effect. It can be seen from the contact angle that only weak water wetting was observed.
As for CND5#, due to the relatively insufficient surfactant content on the surface of nanoemulsion droplets, the particle sizes of the nanoemulsion are large, and the stability of droplets is poor, as shown in Figure 12D. During the adsorption process, parts of surfactants are adsorbed on the rock surface, and the surfactants on the droplet surface of the nanoemulsion are further reduced. The structural stability of the nanoemulsion may be destroyed, and the Ostwald ripening rate is accelerated, thus the adsorption capacity increases rapidly.
According to the above experimental results, nanoemulsions can reduce the surface tension between air and water, realize the wettability alteration of the rock surface, relieves the water block damage, and promotes the backflow [36]. On this basis, the nanoemulsion is expected to penetrate the reservoir matrix near the fracture, so as to improve the water recovery. Compared with traditional surfactants, surfactants forming nanoemulsions can self-assemble into a relatively stable structure. The core can bind the surfactant and release it slowly into the rock surface, which can achieve long-distance effects.

3.5. Analysis of Water Block Removing Effect

3.5.1. Permeability Recovery Experiments

The experimental results of the permeability recovery test for five cores are shown in Table 5 The gas-measured permeability of the five dry cores is in the same order of magnitude, allowing parallel experiments to be performed. According to the core permeability data measured in different fluids, the recovery rate of permeability is calculated according to Formula (1).
It can be seen from Table 5 that the permeability recovery rates of the five cores after saturated brine are all around 14%. This is because the formation water is trapped in the pore under the action of capillary force. It cannot be moved by natural gas, and the core pore is blocked. Thus, the permeability of the rock cores rapidly decreases. The results show that most water does not discharge into the core. After the core was injected with the nanoemulsion modification, the gas permeability of the core was significantly improved.
The permeability recovery rate of the cores modified by nanoemulsion was above 40%. Especially, the CND2# system can reach 59.54%, which effectively reduces the water blockage damage. Compared with the experimental results before nanoemulsion soaking, the nanoemulsions change the wettability of the core to neutral wettability, and at the same time reduced the surface tension. Both of which can reduce the binding of the liquid to the rock pores, the seepage resistance is reduced, and the permeability is restored.

3.5.2. NMR Experiments before and after Gas Flooding

The detection object of NMR technology is hydrogen nuclei (1H) in pore fluid, and its signal data reflect the distribution and accumulation of fluid in rock, as well as the interface effect between the fluid and its surrounding rock surface [37,38,39]. When the pores contain a single liquid, the transverse relaxation time T2 value is proportional to the pore size, and the signal amplitude is proportional to the liquid content in the pores. When analyzing the NMR T2 spectrum, the T2 value is usually used to reflect the size of the pores in the core. The relaxation time determines the pore diameter. The longer the relaxation time, the greater the pore diameter; the shorter the relaxation time, the smaller the pore diameter. The peak area enclosed by the signal amplitude and relaxation time corresponds to the amount of liquid contained within the pores. The larger the peak area is, the larger the liquid volume in the pores is, and conversely, the smaller the liquid volume in the pores [40,41,42,43].
In terms of the pore size in cores, this paper defines pores with a relaxation time less than 1 ms as micropores and those with a relaxation time greater than 1 ms as macropores [29]. The curves A-E in Figure 13 depict the change in the hydrogen signal in the core during the process of gas flooding before and after the nanoemulsions treatment of the cores CQ 6-1 to CQ 6-5, respectively. Figure 13 shows the change curve of the T2 spectrum of the nuclear magnetic signal of the core during the gas flooding process. FW 0 min represents the signal amount of the core when the formation water is saturated, and FW 30 min represents the 1H signal amount of the core after gas flooding for 30 min. CND 0 min represents the 1H signal amount when the nanoemulsion modified core is saturated with formation water, and CND 30 min represents the 1H signal amount after the nanoemulsion modified core has been driven for 30 min by gas. The following conclusions may be drawn:
1. It can be seen from CND 0 min and FW 0 min that the overall saturated water content of the core after nano-modification has decreased, which is mainly caused by the change in rock wettability. It can be seen from Figure 13 that during the gas flooding process of the core, the pore signal with relaxation time greater than 1 ms changes faster, while the pore signal with a relaxation time less than 1 ms changes slowly.
As shown in the capillary pressure calculation Formula (1), the small pore size of the micropores leads to high capillary pressure, and water is difficult to be discharged. The capillary pressure of macropores is relatively small. Moreover, after gas displacement, the NMR signal intensity of large pores decreased, and the signal intensity of small pores increased (Figure 13A). This is because the capillary force of the macropores is small, and parts of the water are displaced. At the same time, because the core is water-wet, the water film on the pore surface still exists, and the film thickness is small. Since the core is water-wet, water film still exists on the pore surface after the water in the macropore is displaced. The decrease of water content in the pore leads to the change of the NMR signal of the pore from the initial long relaxation signal to the short relaxation signal. Therefore, the core after displacement shows an overall increase trend of the signal strength of the small pore.
2. Without nanoemulsion treatment, the core is mainly the change of the pore signal with a relaxation time greater than 1 ms, while the pore signal with less than 1 ms has almost no change. For the cores modified by nanoemulsion, not only the variation of pore signal at 1 ms is larger than before modification, but also the pore signal with relaxation time in the range of 0.1–1 ms is greatly reduced. After nanoemulsion modification, the wettability of the rock changed from strong water-wetting to neutral wettability, so the capillary force decreased, the seepage resistance decreased, and the water binding in the pores was more easily displaced.
3. Figure 13F summarizes the change of peak area after modification of different nanoemulsions. The peak area of CND2# has the most obvious change, and the effect of removing the water lock is the best, which also corresponds to the above-mentioned contact angle test and adsorption experimental results. Therefore, it can be concluded that surfactant adsorption is essential in wetting alternation, and wetting alternation is one of the key factors to remove the water lock.
In addition to NMR, the most intuitive experiment to observe the effect of water blocking is water discharge during gas flooding. Figure 14A–E is the gas displacement curve of the core after five nanoemulsions. The increase in the water discharge reflects their abilities at removing water blockage. In Figure 14, FW represents the relationship between the displacement and the gas flooding time after the core is saturated with formation water. While CND represents water displacement of the cores after the nanoemulsions modification. It can be seen that the increased water displacement of the five nanofluids is 24.3%, 84.48%, 41.42%, 34.49% and 26.13%, respectively. Among them, the displacement of CND2# increased significantly. According to the capillary pressure formula, the wettability change of CND2# is the closest to neutral wetting, so its capillary force is the smallest, and the effect of removing water blocking damage is also the best. This is consistent with the pattern obtained from the T2 spectrum of the NMR.

4. Conclusions

In this paper, a series of nanoemulsions with different particle sizes were synthesized, and their surface properties, wettability, and adsorption properties were evaluated. At the same time, the microscopic mechanism of nanoemulsion for water blocking removal and production improving was revealed. The main conclusions are as follows:
  • By controlling the oil phase content, nanoemulsions with a particle size distribution of 9 nm–160 nm were prepared. The droplet size is a specific surface control mechanism, that is, the ratio of surfactant content to oil phase content.
  • Particle size significantly affects the surface activity and wetting modification ability of nanoemulsions. With the increase in oil phase content, the surface tension gradually decreased, and the contact angle has a maximum value. The CND2# system with an oil phase content of 5% has the best wetting modification effect, and the contact angle of the water-wetting core after modification reaches 93.6°.
  • Nanoemulsion is a supramolecular assembly of water, surfactants and oil core, which can regulate the adsorption of surfactants on a rock surface. The adsorption control of the nanoemulsion on the surfactant is the key to its water blocking removing ability. CND2# system with 5% oil phase content has the appropriate adsorption amount, which is 47% lower than the surfactant ALPE.
  • Combined with NMR experiments, it is concluded that the nanoemulsions can decrease the pore water content with a relaxation time of less than 1 ms, which are the relatively smaller pores in the tight gas reservoirs. The permeability recovery rate of the CND2# system can reach 59.54% in a tight rock core.
  • Combining with the surface tension, contact angle, adsorption, NMR and gas permeability experiments, a method for evaluating the effect of water blocking removing agents was established, which provided guidance for the development of water blocking removing agents.

Author Contributions

Conceptualization, F.Z.; methodology, Y.L. and E.Y.; validation, J.W., H.X. and L.Z.; formal analysis, J.W.; investigation, B.L.; resources, F.Z.; data curation, Y.L.; writing—original draft preparation, H.X.; writing—review and editing, E.Y. and H.X.; visualization, H.X.; supervision, F.Z. and E.Y. All authors have read and agreed to the published version of the manuscript.

Funding

This research was financially supported by National Natural Science Foundation of China (Grant No. 52004306 and 52174045), the Strategic Cooperation Technology Projects of CNPC and CUPB (Grant No. ZLZX2020-01 and ZLZX2020-02) and the National Science and Technology Major Projects of China (Grant No. 2016ZX05030005 and 2016ZX05051003).

Data Availability Statement

The data will be available on request.

Conflicts of Interest

The authors declare no conflict of interest.

Nomenclature

TCCMTotal amount of clay minerals
CNDNomenclature of nanoemulsion
ALPETrade name of surfactant
NMRNuclear magnetic resonance
FWFormation water

References

  1. Gao, D. Some research advances in well engineering technology for unconwentional hydrocarbon. Nat. Gas Ind. 2022, 9, 41–50. [Google Scholar]
  2. Li, G.X. Measure and practice for improving the recovery factor of ultradeep tight sandstone gas reservoirs: A case study of Kelasu Gas Field, Tarim Basin. Nat. Gas Ind. 2022, 42, 93–101. [Google Scholar]
  3. Wang, H.G.; Zhou, B. Progress and prospect of tight sandstone gas well drilling and completion technologies. Nat. Gas Ind. 2022, 42, 159–169. [Google Scholar]
  4. Jia, A.L.; Wei, Y.S.; Guo, Z.; Wang, G.T.; Meng, D.W.; Huang, S.Q. Development status and prospect of tight sandstone gas in China. Nat. Gas Ind. 2022, 42, 83–92. [Google Scholar]
  5. Song, Y. Distribution characteristics and exploration direction of natural gas resources in China. Nat. Gas Ind. 2003, 1, 1–4+12. [Google Scholar]
  6. Wang, X.; Liu, Y.; Hou, J.; Li, S.; Kang, Q.; Sun, S.; Ji, L.; Sun, J.; Ma, R. The relationship between synsedimentary fault activity and reservoir quality—A case study of the Ek1 formation in the Wang Guantun area, China. Interpretation 2020, 8, SM15–SM24. [Google Scholar] [CrossRef]
  7. Wang, X.; Zhou, X.; Li, S.; Zhang, N.; Ji, L.; Lu, H. Mechanism Study of Hydrocarbon Differential Distribution Controlled by the Activity of Growing Faults in Faulted Basins: Case Study of Paleogene in the Wang Guantun Area, Bohai Bay Basin, China. Lithospher 2022, 2021, 7115985. [Google Scholar] [CrossRef]
  8. Wang, X.; Zhang, F.; Li, S.; Dou, L.; Liu, Y.; Ren, X.; Chen, D.; Zhao, W. The Architectural Surfaces Characteristics of Sandy Braided River Reservoirs, Case Study in Gudong Oil Field, China. Geofluids 2021, 2021, 8821711. [Google Scholar] [CrossRef]
  9. Cao, G.; Jiang, X.; Li, N.; Jia, M.; Zhang, Y.; Wang, H. Domestic and foreign research status and development direction of drainage gas recovery technologies in water-producing gasfields. Oil Drill. Prod. Technol. 2019, 41, 614–623. [Google Scholar]
  10. Tang, H.; Zhu, B.; Wang, X.; Zhang, L.; Zhao, F.; Wang, J. Mechanism and control factors of water blocking in tight sandstone gas reservoir. Sci. Sin. Technol. 2018, 48, 537–547. [Google Scholar] [CrossRef]
  11. Wang, J.; Zhou, F.; Zhang, L.; Xue, Y.; Yao, E.; Li, Y.; Fan, F. Study on reason analysis and removal solution on water locking damage in tight sandstone reservoirs. J. Dispers. Sci. Technol. 2020, 41, 1849–1858. [Google Scholar] [CrossRef]
  12. Liu, X.F.; Kang, Y.L.; You, L.J.; Wu, P. Experimental study on amphiphobic surface treating to prevent reservoir from aqueous phase trapping damage. Nat. Gas Geosci. 2009, 20, 292–296. [Google Scholar]
  13. Shen, Y.; Ge, H.; Su, S.; Liu, D.; Yang, Z.; Liu, J. Imbibition characteristic of shale gas formation and water-block removal capability. Sci. Sin. Phys. Mech. Astron. 2017, 47, 114609. [Google Scholar] [CrossRef]
  14. Su, Y.L.; Zhuang, X.Y.; Li, L.; Li, X.Y.; Li, D.S.; Zheng, J.Y. Experiment on long core pressure loss and permeability damage evalution in tight sandstone gas reservoir. Spec. Oil Gas Reserv. 2021, 28, 98–102. [Google Scholar]
  15. Fajun, Z.; Zhexi, T.; Yufei, Z.; Xinyu, Z.; Yi, A. Water locking damage evaluation and unlocking of condensate gas reservoir in Jilin Oilfield. J. Petrochem. Univ. 2018, 31, 53. [Google Scholar]
  16. Yongli, Y. Study of water locking damage mechanism and water unlocking of low permeability reservoir. J. Southwest Pet. Univ. (Sci. Technol. Ed.) 2013, 35, 137. [Google Scholar]
  17. Gahrooei, H.R.E.; Ghazanfari, M.H. Toward a hydrocarbon-based chemical for wettability alteration of reservoir rocks to gas wetting condition: Implications to gas condensate reservoirs. J. Mol. Liq. 2017, 248, 100–111. [Google Scholar] [CrossRef]
  18. Hu, Z.K. Analysis on Reservoir Damage Factors and Treatment Measures of Denglouku Formation in Fulong Spring. Ph.D. Thesis, Southwest Petroleum University, Chengdu, China, 2014. [Google Scholar]
  19. Jiang, G.C.; Zhang, X.M.; Wang, L.; He, Y.B.; Liu, F.; Yang, L.L. Double Cation Fluorocarbon Surfactant and Its Preparation Method, Application as Double Hydrophobic Wetting Reversal Agent and Drilling Fluid and Its Application. China Patent CN106634894A, 6 February 2018. [Google Scholar]
  20. Sharifzadeh, S.; Hassanajili, S.; Rahimpour, M.R. Wettability alteration of gas condensate reservoir rocks to gas wetness by sol–gel process using fluoroalkylsilane. J. Appl. Polym. Sci. 2013, 128, 4077–4085. [Google Scholar] [CrossRef]
  21. Li, Y.; Wang, Y.; Wang, Q.; Tang, L.; Yuan, L.; Wang, G.; Zhang, R. Optimization the synthesis parameters of gas-wetting alteration agent and evaluation its performance. Colloids Surf. A Physicochem. Eng. Asp. 2018, 558, 438–445. [Google Scholar] [CrossRef]
  22. Hoseinpour, S.A.; Madhi, M.; Norouzi, H.; Soulgani, B.S.; Mohammadi, A.H. Condensate blockage alleviation around gas-condensate producing wells using wettability alteration. J. Nat. Gas Sci. Eng. 2019, 62, 214–223. [Google Scholar] [CrossRef]
  23. Kewen, L.; Abbas, F. Experimental study of wettability alteration to preferential gas-wetting in porous media and its effects. SPE Reserv. Eval. Eng. 2000, 3, 139–149. [Google Scholar]
  24. Tang, G.-Q.; Firoozabadi, A. Wettability alteration to intermediate gas-wetting in porous media at elevated temperatures. Transp. Porous Media 2003, 52, 185–211. [Google Scholar] [CrossRef]
  25. Zhang, S.; Jiang, G.-C.; Wang, L.; Qing, W.; Guo, H.-T.; Tang, X.-G.; Bai, D.-G. Wettability alteration to intermediate gas-wetting in low-permeability gas-condensate reservoirs. J. Pet. Explor. Prod. Technol. 2014, 4, 301–308. [Google Scholar] [CrossRef] [Green Version]
  26. Li, Q.L.; Liu, M.; Ma, D.; Wang, B. Surface Wetting Modification of the Organic Fluorine Silance on Glass. China Surf. Eng. 2014, 27, 95–100. [Google Scholar]
  27. Wang, J.; Zhou, F.-J. Cause analysis and solutions of water blocking damage in cracked/non-cracked tight sandstone gas reservoirs. Pet. Sci. 2021, 18, 219–233. [Google Scholar] [CrossRef]
  28. Liang, T.B.; Liang, X.Y.; Wang, H.D.; Ma, S.Y.; Zhu, X.W.; Lv, L.L. Screening criterion and Mechanism of Surfactants on Reducing Water Blockage in Tight Gas Reservoirs. Sci. Technol. Eng. 2020, 20, 6. [Google Scholar]
  29. Kumar, N.; Verma, A.; Mandal, A. Formation, characteristics and oil industry applications of nanoemulsions: A review. J. Pet. Sci. Eng. 2021, 206, 109042. [Google Scholar] [CrossRef]
  30. Saxena, N.; Kumar, A.; Mandal, A. Adsorption analysis of natural anionic surfactant for enhanced oil recovery: The role of mineralogy, salinity, alkalinity and nanoparticles. J. Pet. Sci. Eng. 2019, 173, 1264–1283. [Google Scholar] [CrossRef]
  31. Tong, K. Formation and Application of Microemulsions and Nanoemulsions. Ph.D. Thesis, Shandong University, Jinan, China, 2016. [Google Scholar]
  32. Somasundaran, P.; Zhang, L. Adsorption of surfactants on minerals for wettability control in improved oil recovery processes. J. Pet. Sci. Eng. 2006, 52, 198–212. [Google Scholar] [CrossRef]
  33. Somasundaran, P.; Fuerstenau, D.W. Mechanism of alkyl sulfonate adsorption at alumina–water interface. J. Phys. Chem. 2021, 70, 90. [Google Scholar] [CrossRef]
  34. Liang, T.; Li, Q.; Liang, X.; Yao, E.; Wang, Y.; Li, Y.; Chen, M.; Zhou, F.; Lu, J. Evaluation of liquid nanofluid as fracturing fluid additive on enhanced oil recovery from low-permeability reservoirs. J. Pet. Sci. Eng. 2018, 168, 390–399. [Google Scholar] [CrossRef]
  35. Liang, T.; Zhou, F.; Lu, J. Evaluation of wettability alteration and IFT reduction on mitigating water blocking for low-permeability oil-wet rocks after hydraulic fracturing. Fuel 2017, 209, 650–660. [Google Scholar] [CrossRef]
  36. Feng, C.; Ying, K.; Jiang, G.; Yang, J.; Zhang, Y.; Li, Y. Effect of organosilicon-acrylic emulsion treatment on wettability of porous media. Transp. Porous Media 2012, 92, 619–631. [Google Scholar] [CrossRef]
  37. Wang, Y.L.; Jin, J.F.; Dong, H.Y.; Jiang, L. Synthesis and performance evaluation of wettability reversal agent for removing water lock effect. J. Xi’an Shiyou Univ. (Nat. Sci. Ed.) 2015, 30, 85–90+11. [Google Scholar]
  38. Mousavi, M.A.; Hassanajili, S.; Rahimpour, M.R. Synthesis of fluorinated nano-silica and its application in wettability alteration near-wellbore region in gas condensate reservoirs. Appl. Surf. Sci. 2013, 273, 205–214. [Google Scholar] [CrossRef]
  39. Eastoe, J.; Robinson, B.H.; Steytler, D.C. Influence of pressure and temperature on microemulsion stability. J. Chem. Soc. Faraday Trans. 1990, 86, 511–517. [Google Scholar] [CrossRef]
  40. Kumar, N.; Pal, N.; Mandal, A. Nanoemulsion flooding for enhanced oil recovery: Theoretical concepts, numerical simulation and history match. J. Pet. Sci. Eng. 2021, 202, 108579. [Google Scholar] [CrossRef]
  41. Freedman, R.; Heaton, N. Fluid characterization using nuclear magnetic resonance logging. Petrophys.-SPWLA J. Form. Eval. Reserv. Descr. 2004, 45, SPWLA-2004-v45n3a2. [Google Scholar]
  42. Di, Q.F.; Zhang, J.N.; Hua, S.; Chen, H.J.; Gu, C.Y. Visualization experiments on polymer-weak gel profile control and displacement by NMR technique. Pet. Explor. Dev. 2017, 44, 294–298. [Google Scholar] [CrossRef]
  43. Wei, C.; Cheng, S.; Wang, Y.; Shi, W.; Li, J.; Zhang, J.; Yu, H. Practical pressure-transient analysis solutions for a well intercepted by finite conductivity vertical fracture in naturally fractured reservoirs. J. Pet. Sci. Eng. 2021, 204, 108768. [Google Scholar] [CrossRef]
Figure 1. Schematic diagram of gas trapping caused by the gas breakthrough in liquid phase during gas production [11].
Energies 15 05283 g001
Figure 2. The flowchart of research methodologies.
Energies 15 05283 g002
Figure 3. Schematic diagram of the process of preparing nanoemulsions by microemulsion dilution method.
Energies 15 05283 g003
Figure 4. Schematic diagram of contact angle experimental device.
Energies 15 05283 g004
Figure 5. Standard curve of concentration versus absorbed light intensity.
Energies 15 05283 g005
Figure 6. Schematic diagram of the NMR experimental setup.
Energies 15 05283 g006
Figure 7. Nanoemulsions with different droplet size.
Energies 15 05283 g007
Figure 8. Surface tension curve with concentration of nanoemulsions.
Energies 15 05283 g008
Figure 9. Relationship between surface tension and oil phase content when the nanoemulsions concentration is 0.1%.
Energies 15 05283 g009
Figure 10. Contact angles of rock cores after soaked in nanoemulsions.
Energies 15 05283 g010
Figure 11. Adsorption amount of nanoemulsions with different oil phase content on rock surface.
Energies 15 05283 g011
Figure 12. Schematic diagram of nanoemulsions adsorption process (A) is the schematic diagram of the adsorption process of CND1#; (B) is the schematic diagram of the adsorption process of CND2# and CND3#; (C) is the schematic diagram of the adsorption process of CND4#; (D) is the schematic diagram of the adsorption process of CND5#.
Energies 15 05283 g012
Figure 13. Curves of NMR T2 spectra and water content in cores after gas flooding with or without nanoemulsions (A) is the NMR T2 spectra curve of CQ6-1, (B) is the NMR T2 spectra curve of CQ6-2, (C) is the NMR T2 spectra curve of CQ6-3, (D) is the NMR T2 spectra curve of CQ6-4, (E) is the NMR T2 spectra curve of CQ6-5, (F) is the peak area change diagram.
Energies 15 05283 g013
Figure 14. The increasing value of water displacement for different nanoemulsions (A) is the water displacement curve of CQ6-1, (B) is the water displacement curve of CQ6-2, (C) is the water displacement curve of CQ6-3, (D) is the water displacement curve of CQ6-4, (E) is the water displacement curve of CQ6-5, (F) is the water displacement change diagram.
Energies 15 05283 g014
Table 1. Basic physical property data of different sandstone cores.
Core NumberLength/cmDiameter/cmPermeability/mD
CQ6-15.0022.5250.4798
CQ6-24.9882.5250.4941
CQ6-35.0032.5250.5387
CQ6-45.0182.5250.5137
CQ6-54.962.5250.5514
Table 2. Core XRD Mineral Composition.
Types of MineralsQuartz/wt%Potassium Feldspar/wt%Plagioclase/wt%Dolomite/wt%TCCM/wt%
content/%48.07.310.98.28.6
Table 3. Formation water salinity.
Ion TypeNa+K+Ca2+ClSO42−HCO3Total Salinity
Content (mg/L)1086.8639.6587.54877.351.331715.173807.9
Table 4. The chemical composition of five stock solution and their nanoemulsions obtained after dilution.
No.*Oil Phase ContentGlycerolALPEWater ConcentrationNanoemulsions No.*
1#1 wt.%5 wt.%25 wt.%69 wt.%CND1#
2#5 wt.%5 wt.%25 wt.%65 wt.%CND2#
3#10 wt.%5 wt.%25 wt.%60 wt.%CND3#
4#15 wt.%5 wt.%25 wt.%55 wt.%CND4#
5#20 wt.%5 wt.%25 wt.%50 wt.%CND5#
No.*: Number of stock solution; Nanoemulsions No.*: Number of nanoemulsion.
Table 5. Permeability recovery values of cores treated by different nanoemulsions.
Core NumberCQ 6-1CQ 6-2CQ 6-3CQ 6-4CQ 6-5
Dry core permeability (mD)0.47980.49410.53870.51370.5514
Permeability after formation water (mD)0.06650.07110.07420.07560.0816
Permeability after nanoemulsions (mD)0.20210.29420.27240.23440.2445
Recovery rate after formation water 13.86%14.39%13.77%14.72%14.80%
Recovery rate after nanoemulsions42.12%59.54%50.57%45.63%44.34%
Fluids0.1% CND1#0.1% CND2#0.1% CND3#0.1% CND4#0.1% CND5#
Publisher’s Note: MDPI stays neutral with regard to jurisdictional claims in published maps and institutional affiliations.

