
Distribution Strategy Optimization of Standalone Hybrid WT/PV System Based on Different Solar and Wind Resources for Rural Applications

Abstract
:1. Introduction
2. Theory and Methodology
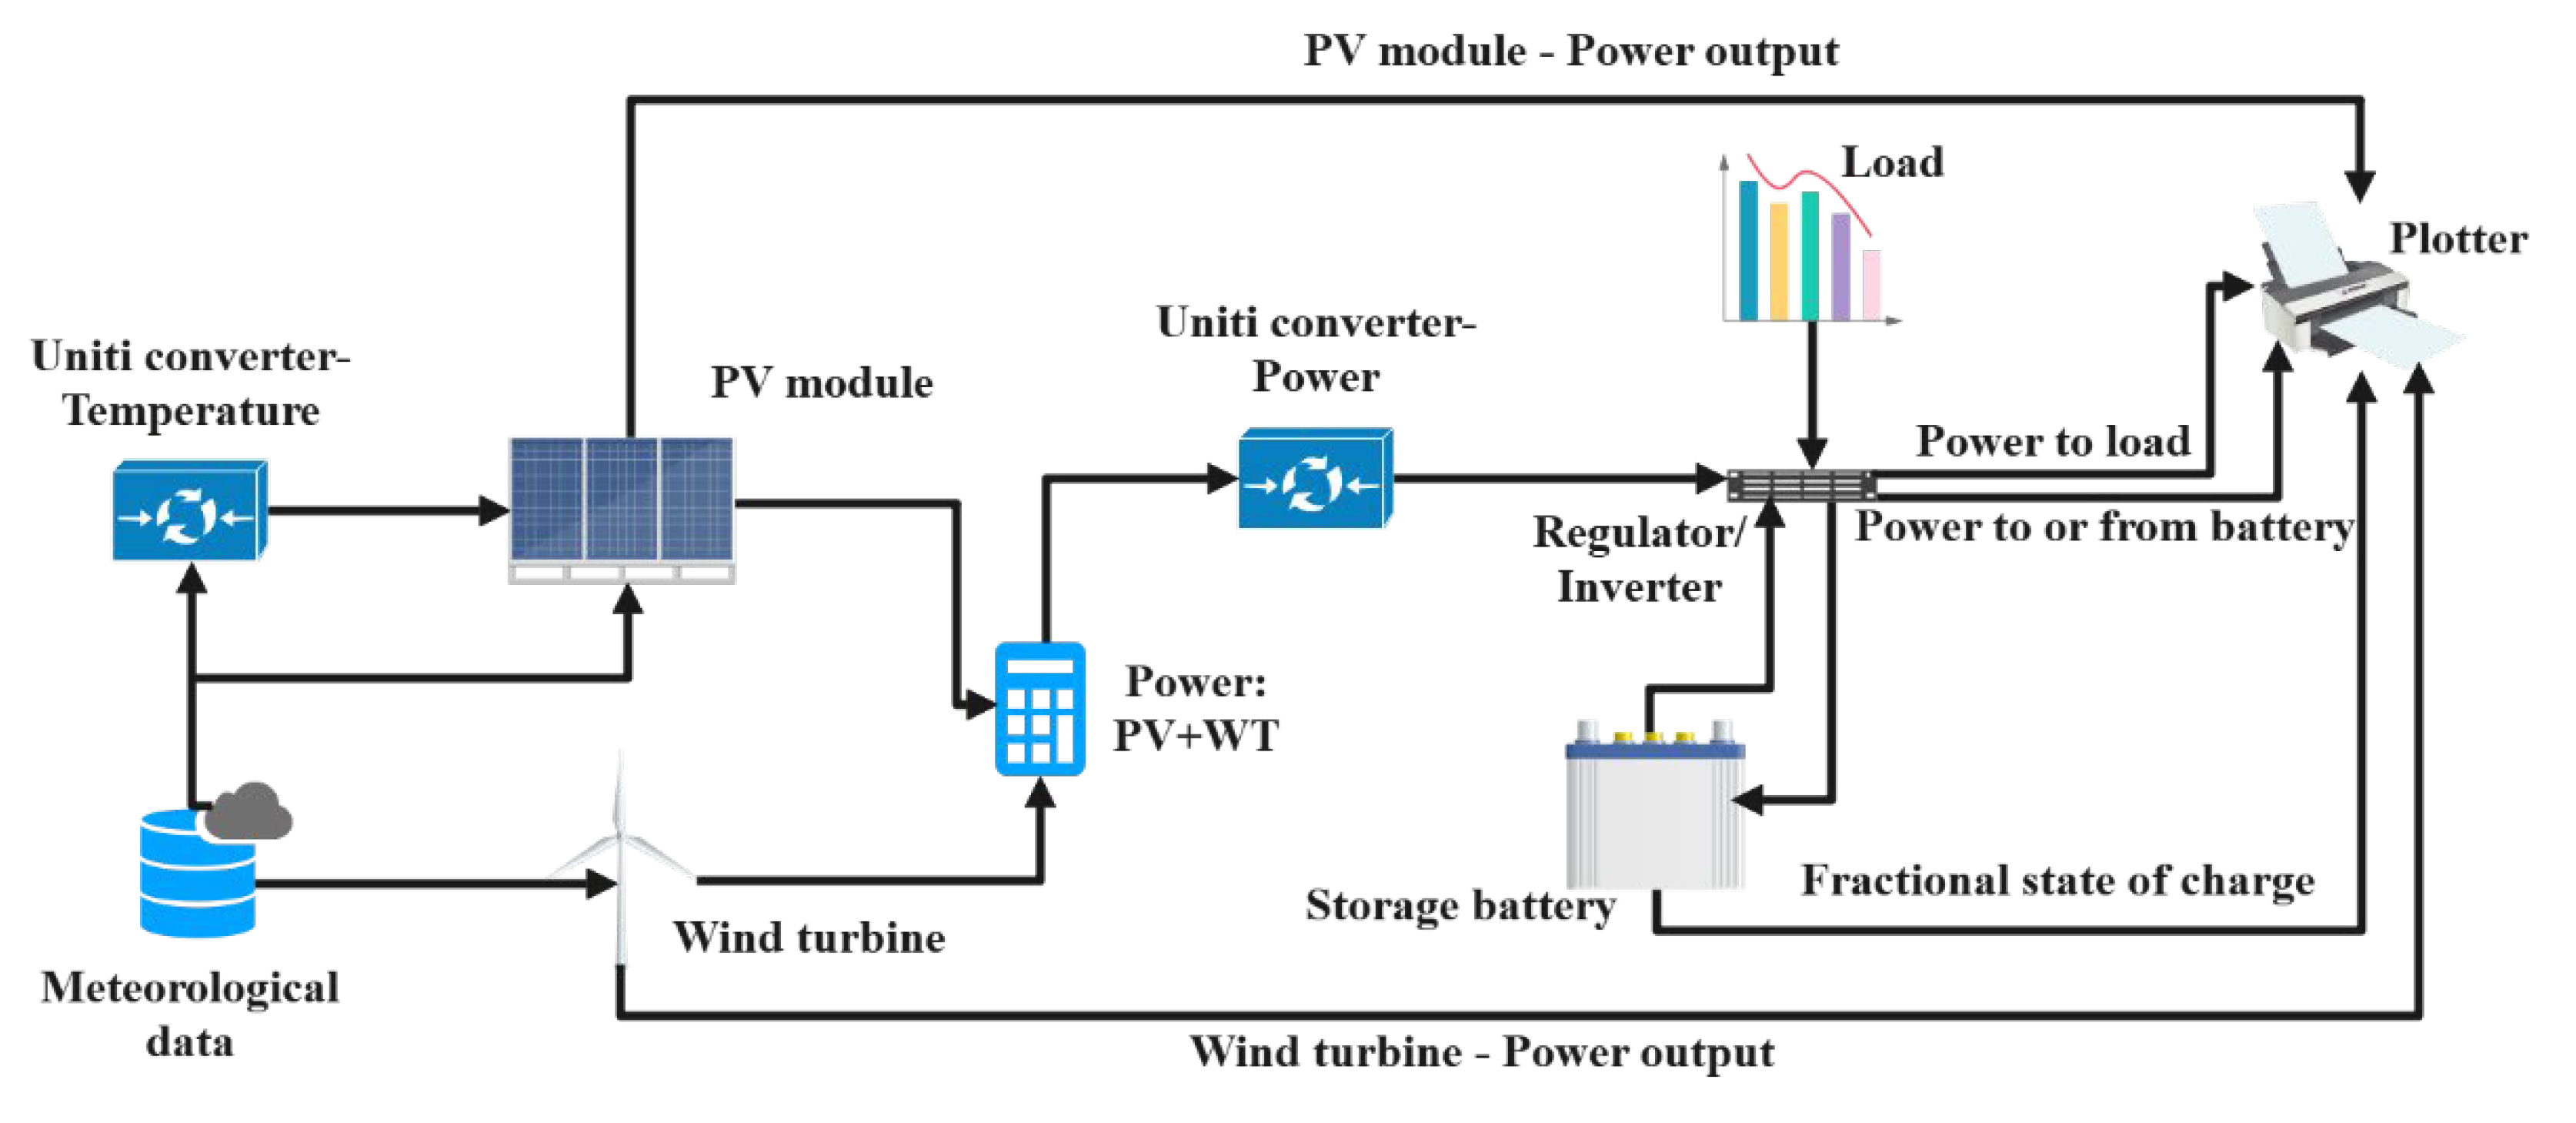
2.1. System Description
- (1)
- PV module. TRNSYS Type 94 models the electrical performance of a photovoltaic array. In this type, the current–voltage characteristics of a single module are predicted by an empirical equivalent circuit model.
- (2)
- Wind turbine. TRNSYS Type 90 models a wind turbine. It makes use of some readily available manufacturer data as well as analytical solutions. In this type, the energy extracted by a wind turbine results from the change in momentum of the air moving through the rotor.
- (3)
- Storage battery. TRNSYS Type 47 operates in conjunction with solar cell array and power conditioning components. In this type, the battery state of charge varies over time and can be obtained given the rate of charge or discharge.
- (4)
- Regulator and inverter. TRNSYS Type 48 models both the regulator and inverter. In this type, the regulator distributes the power from the PV and WT to and from the battery, and the inverter converts the DC power to AC and sends it to the load.
2.2. System Components
2.2.1. PV Module
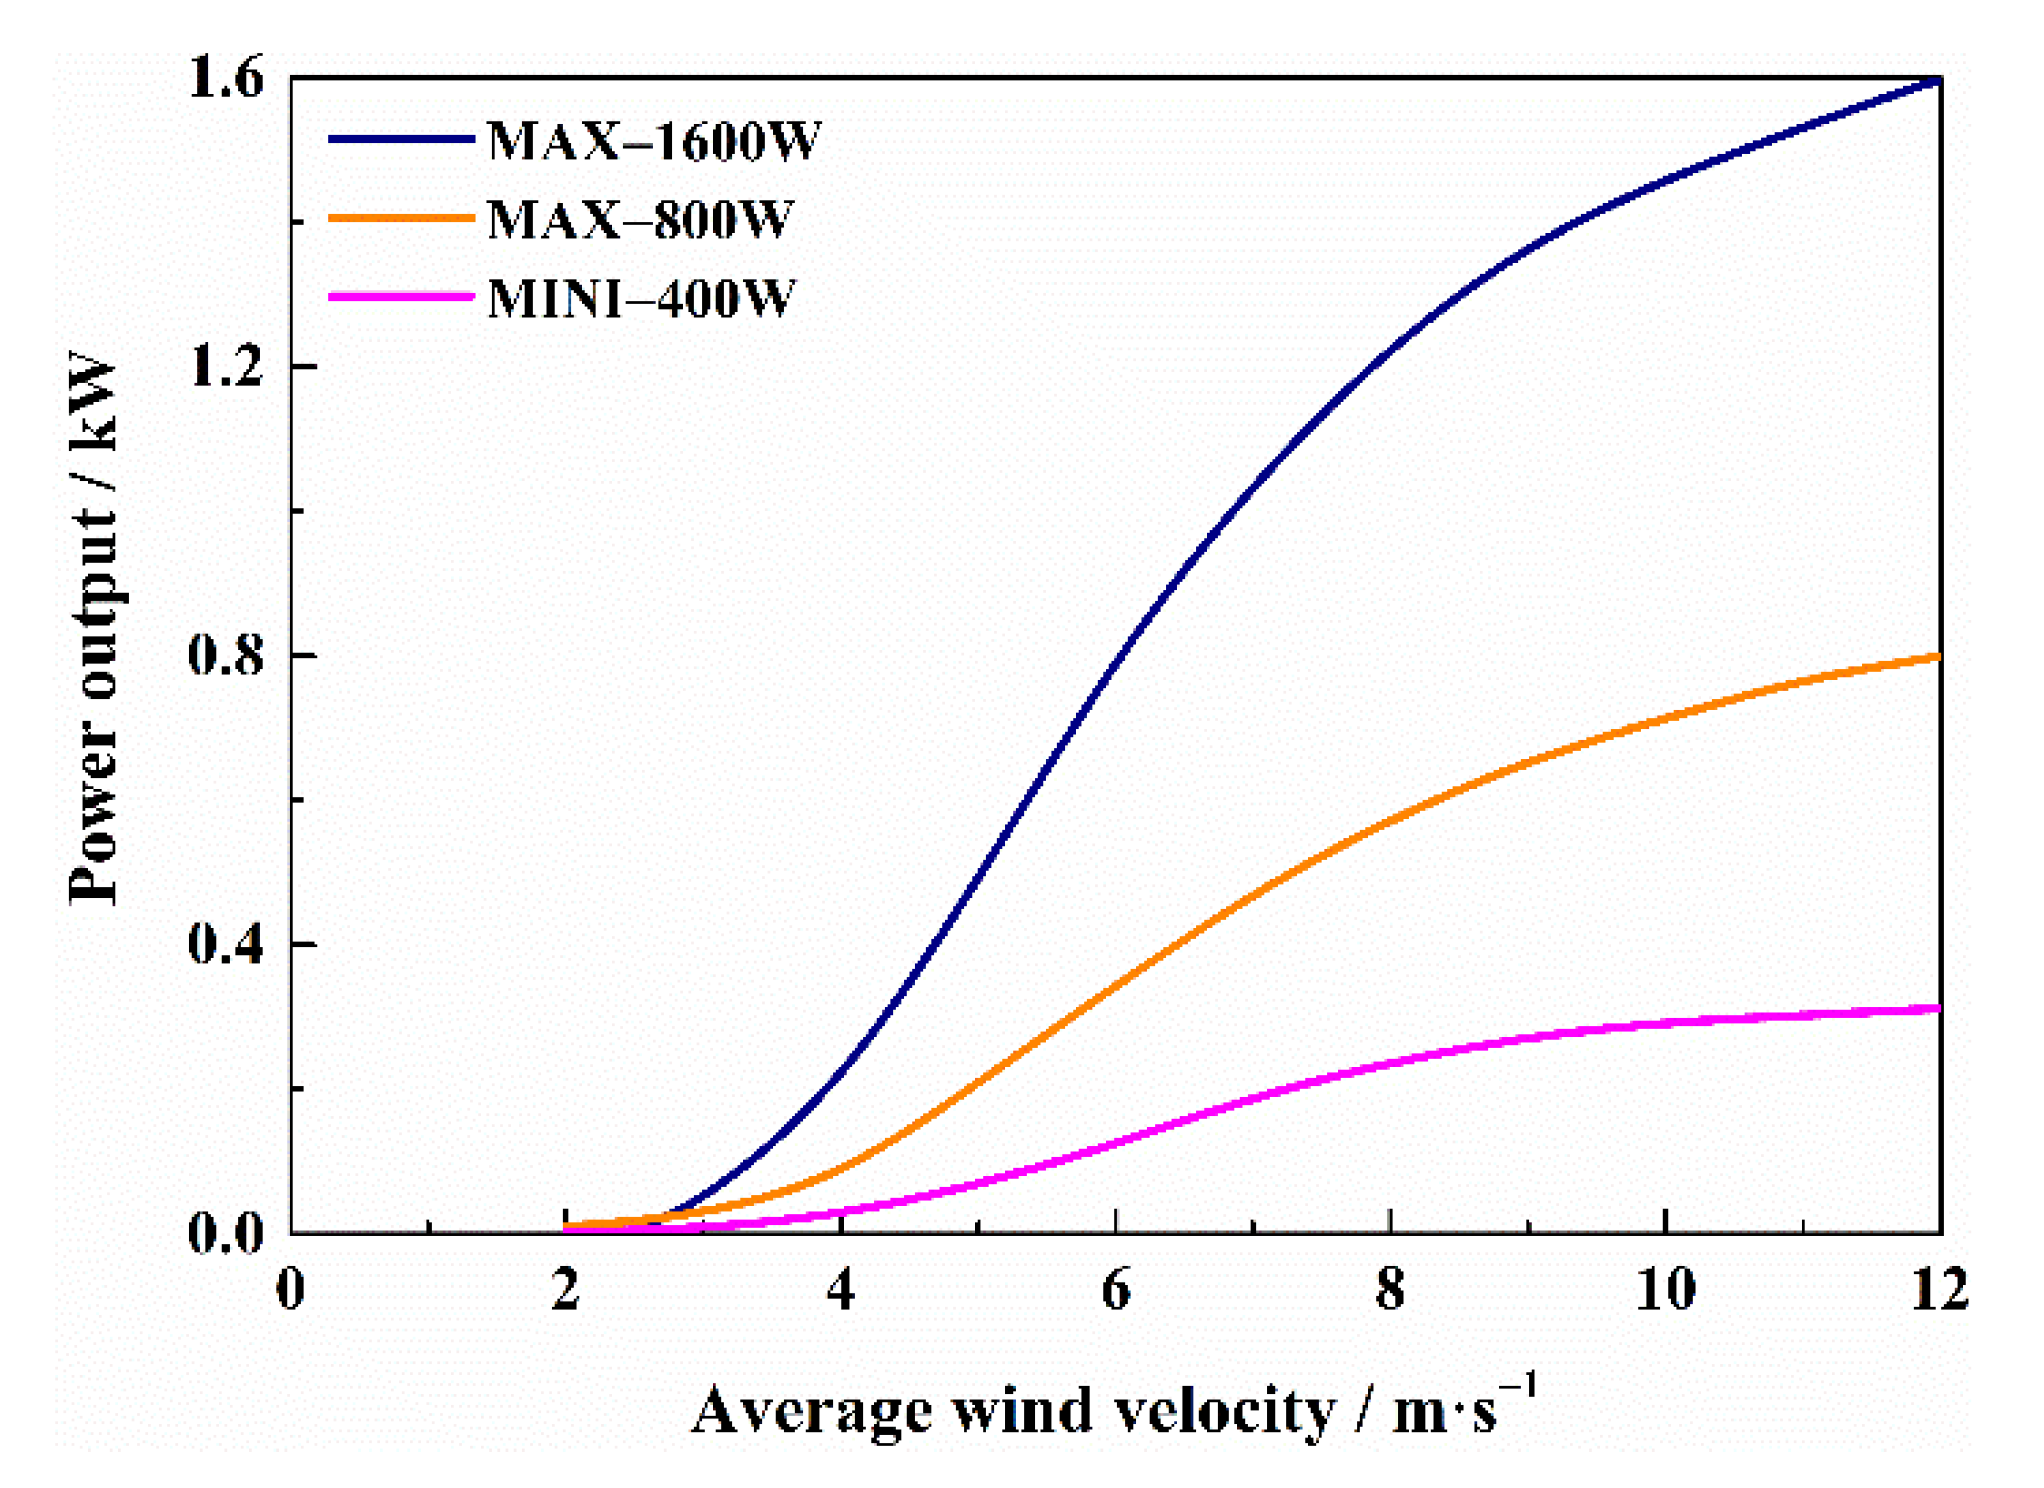
2.2.2. Wind Turbine
2.2.3. Storage Battery
2.2.4. Regulator and Inverter
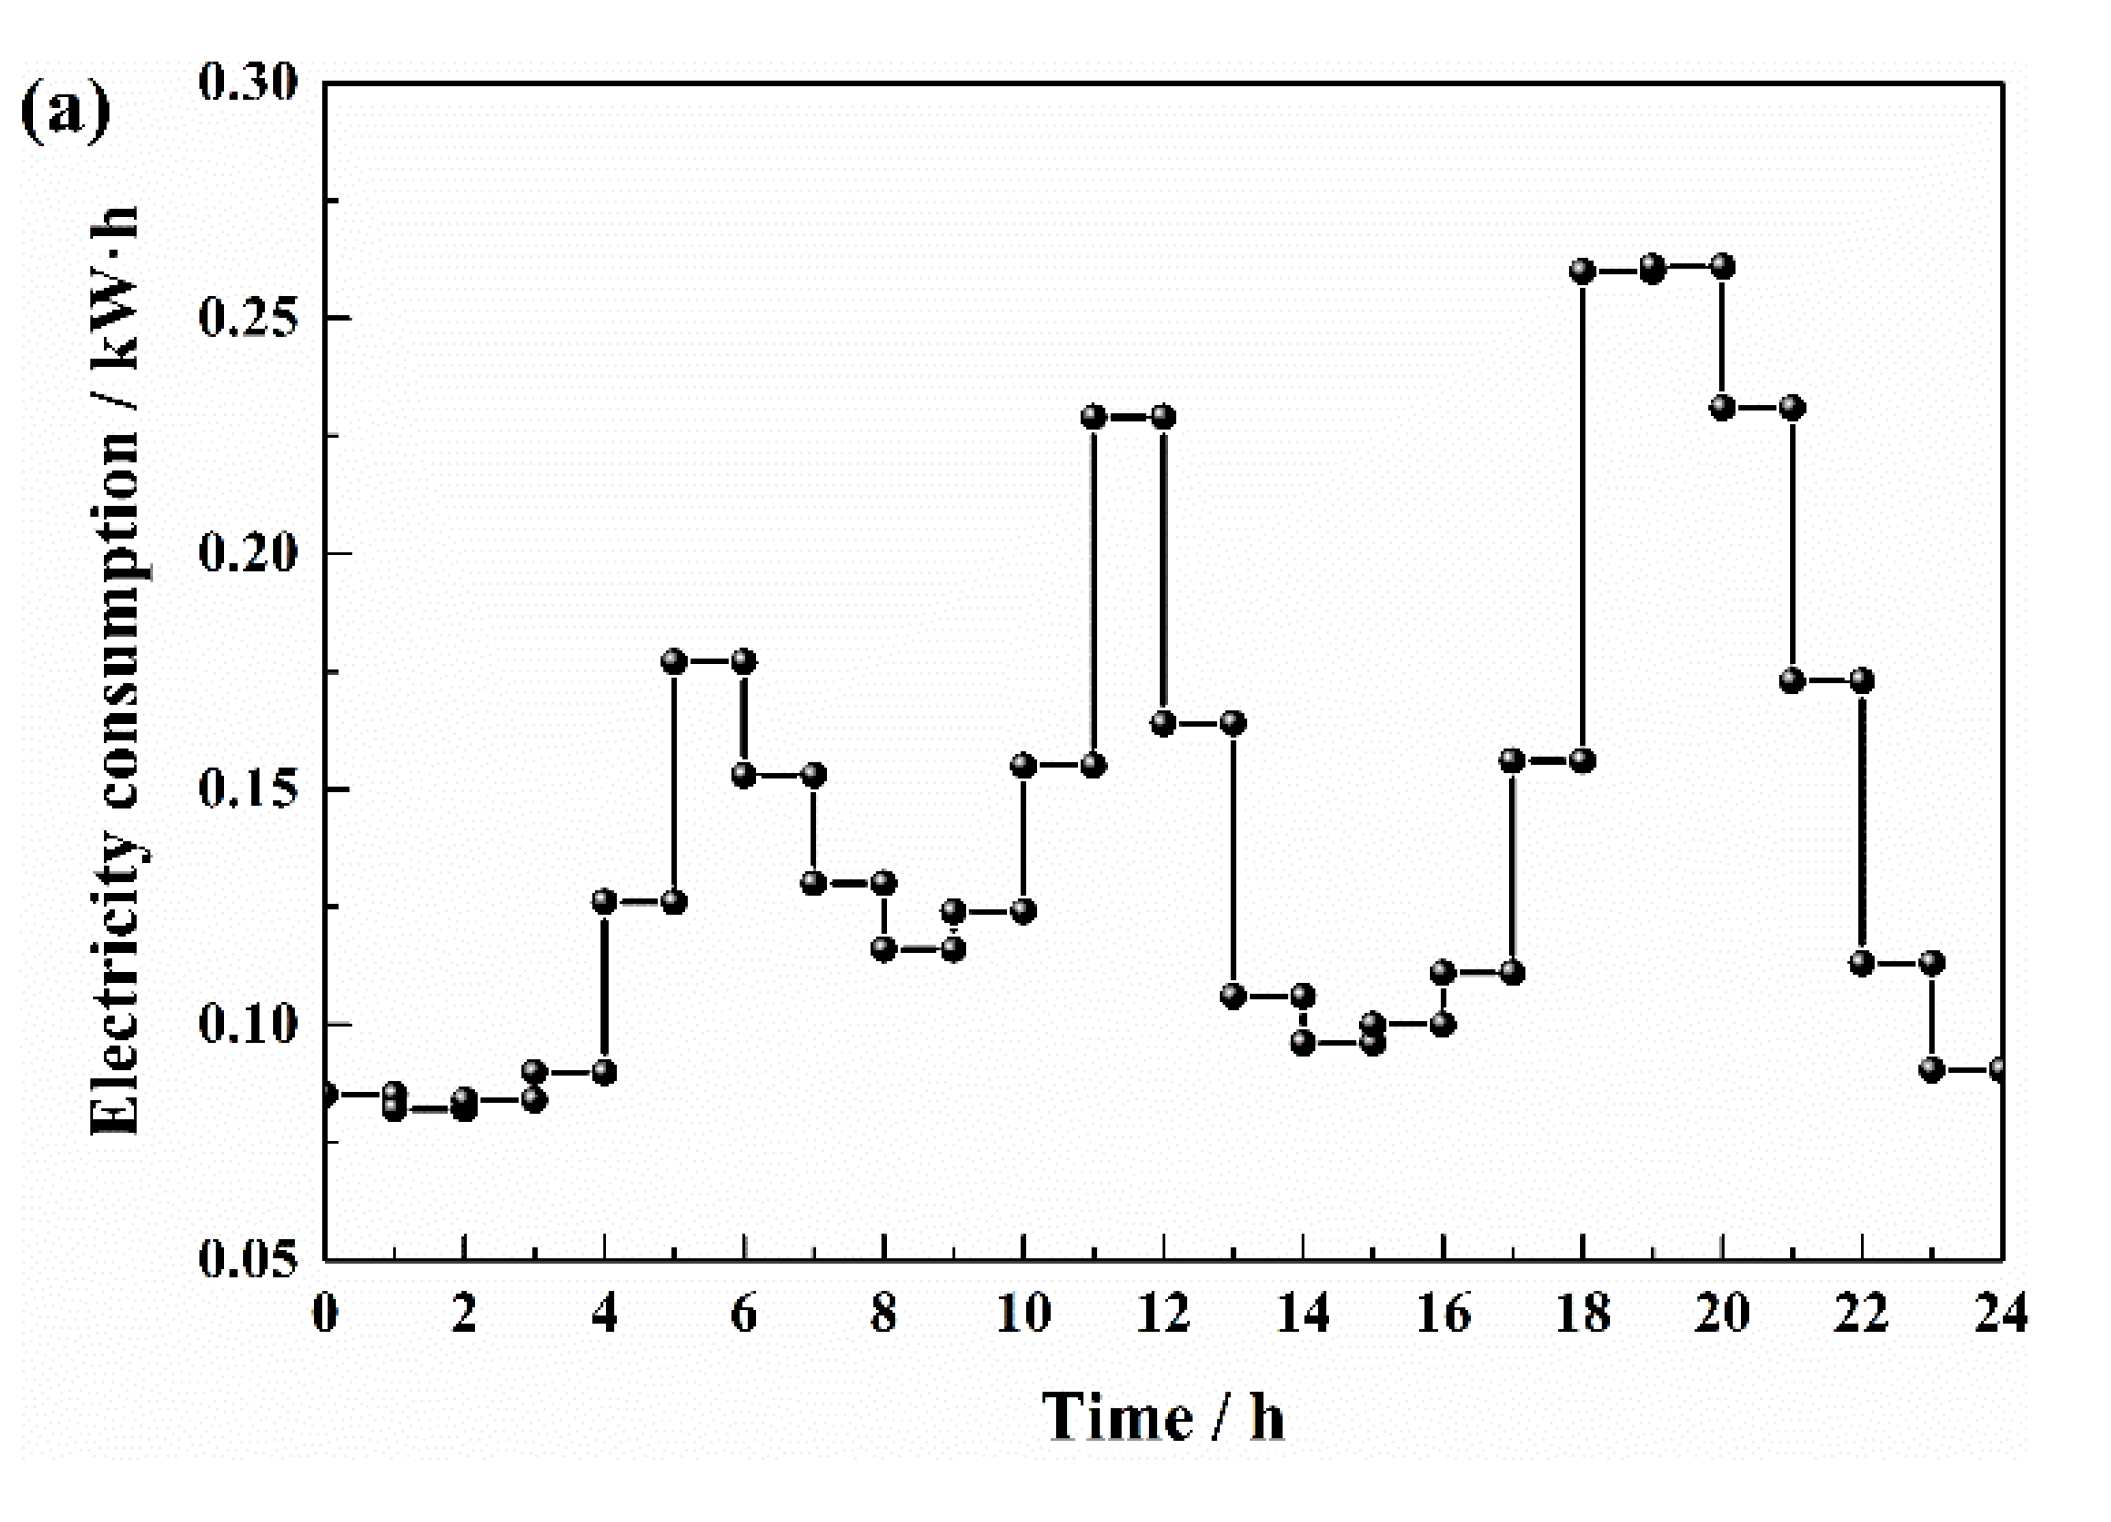
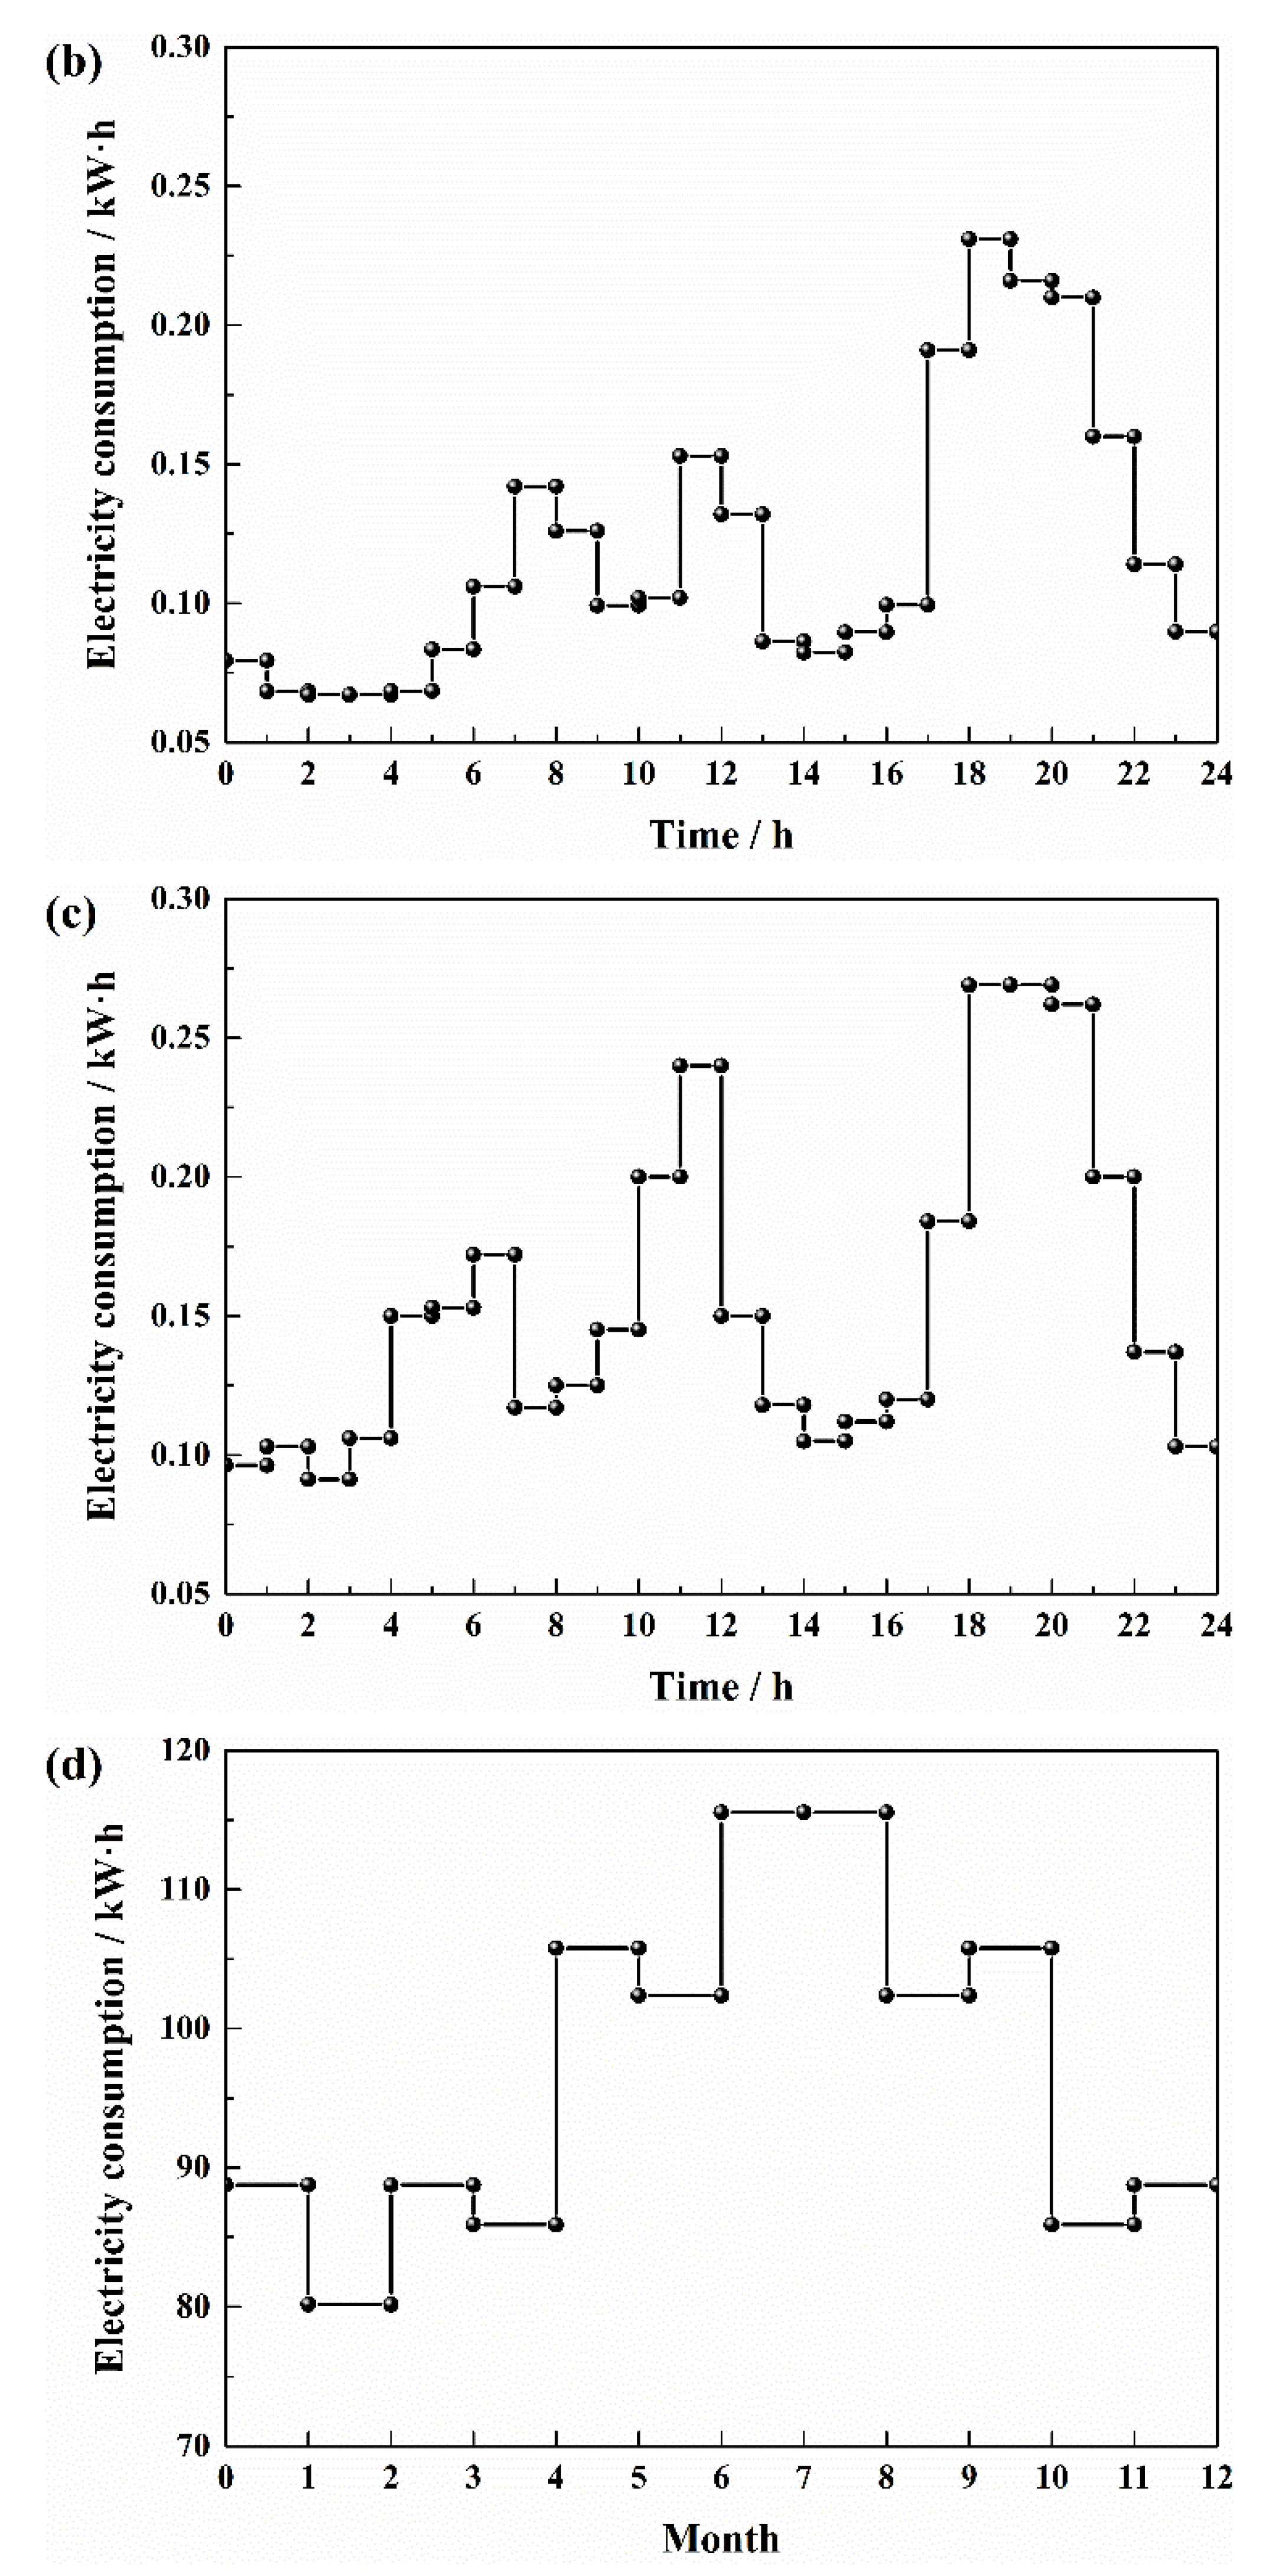
2.3. Load Characteristics
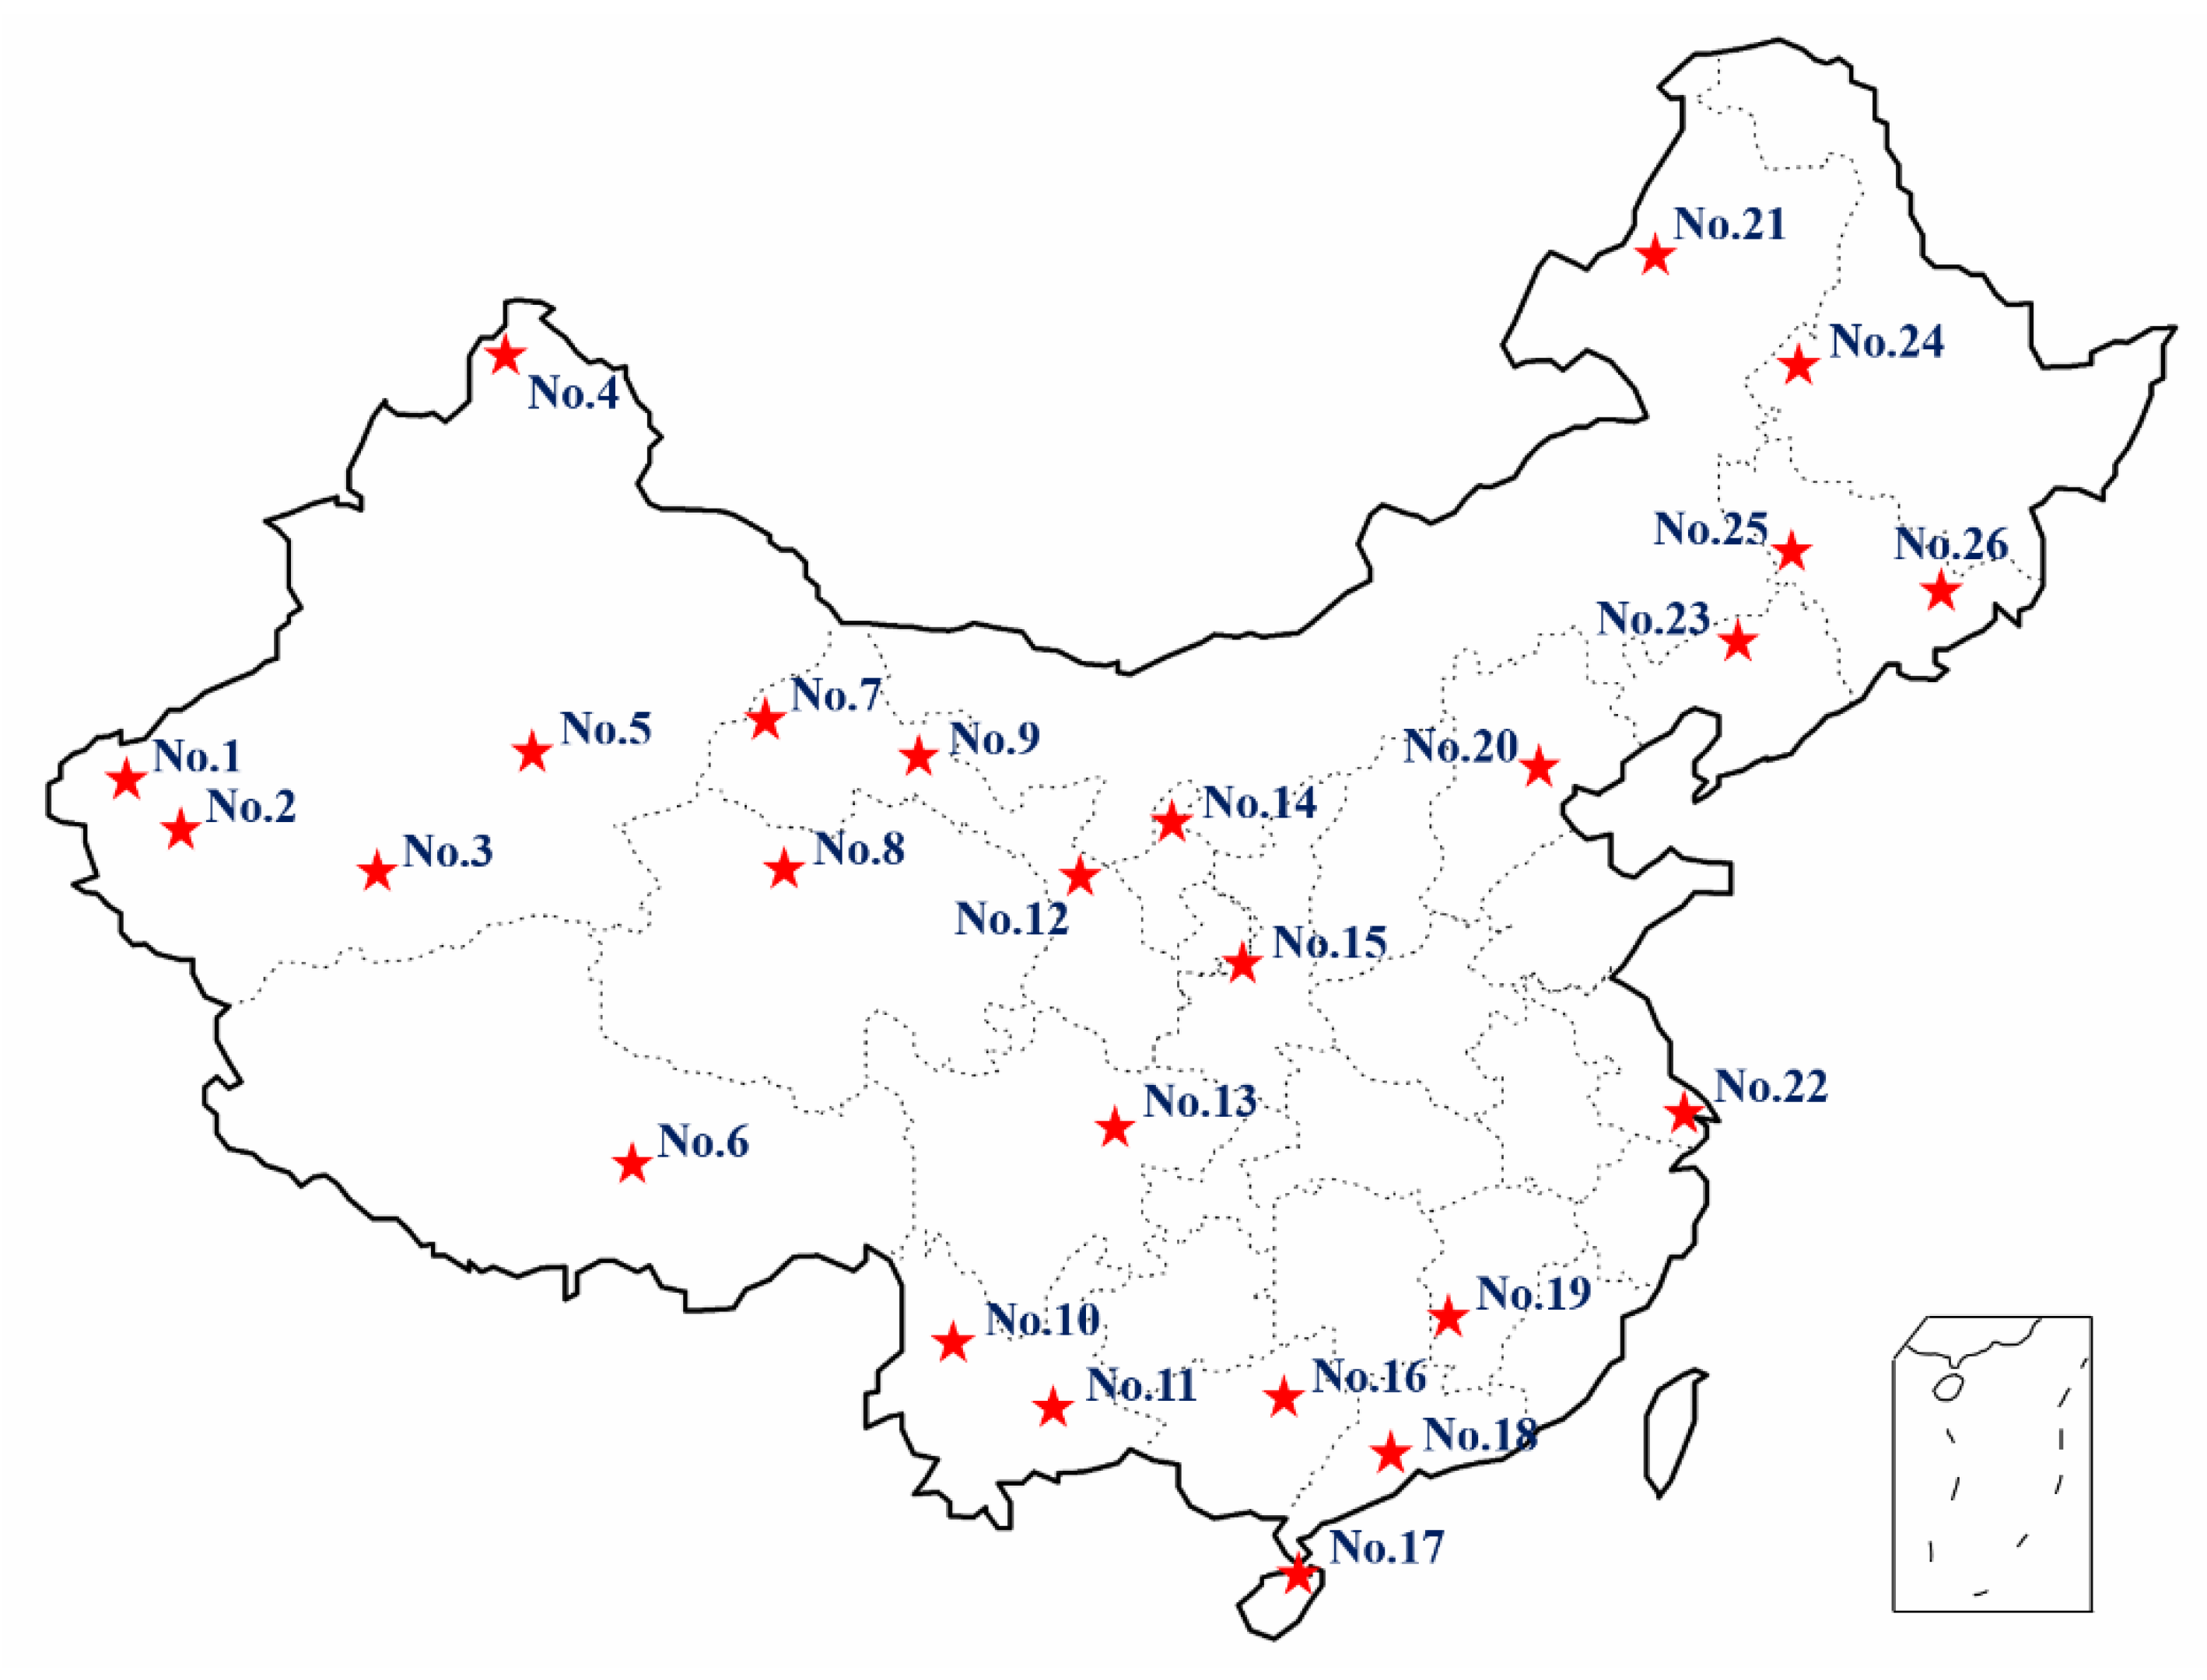
2.4. Meteorological Data
2.5. Distribution Strategy
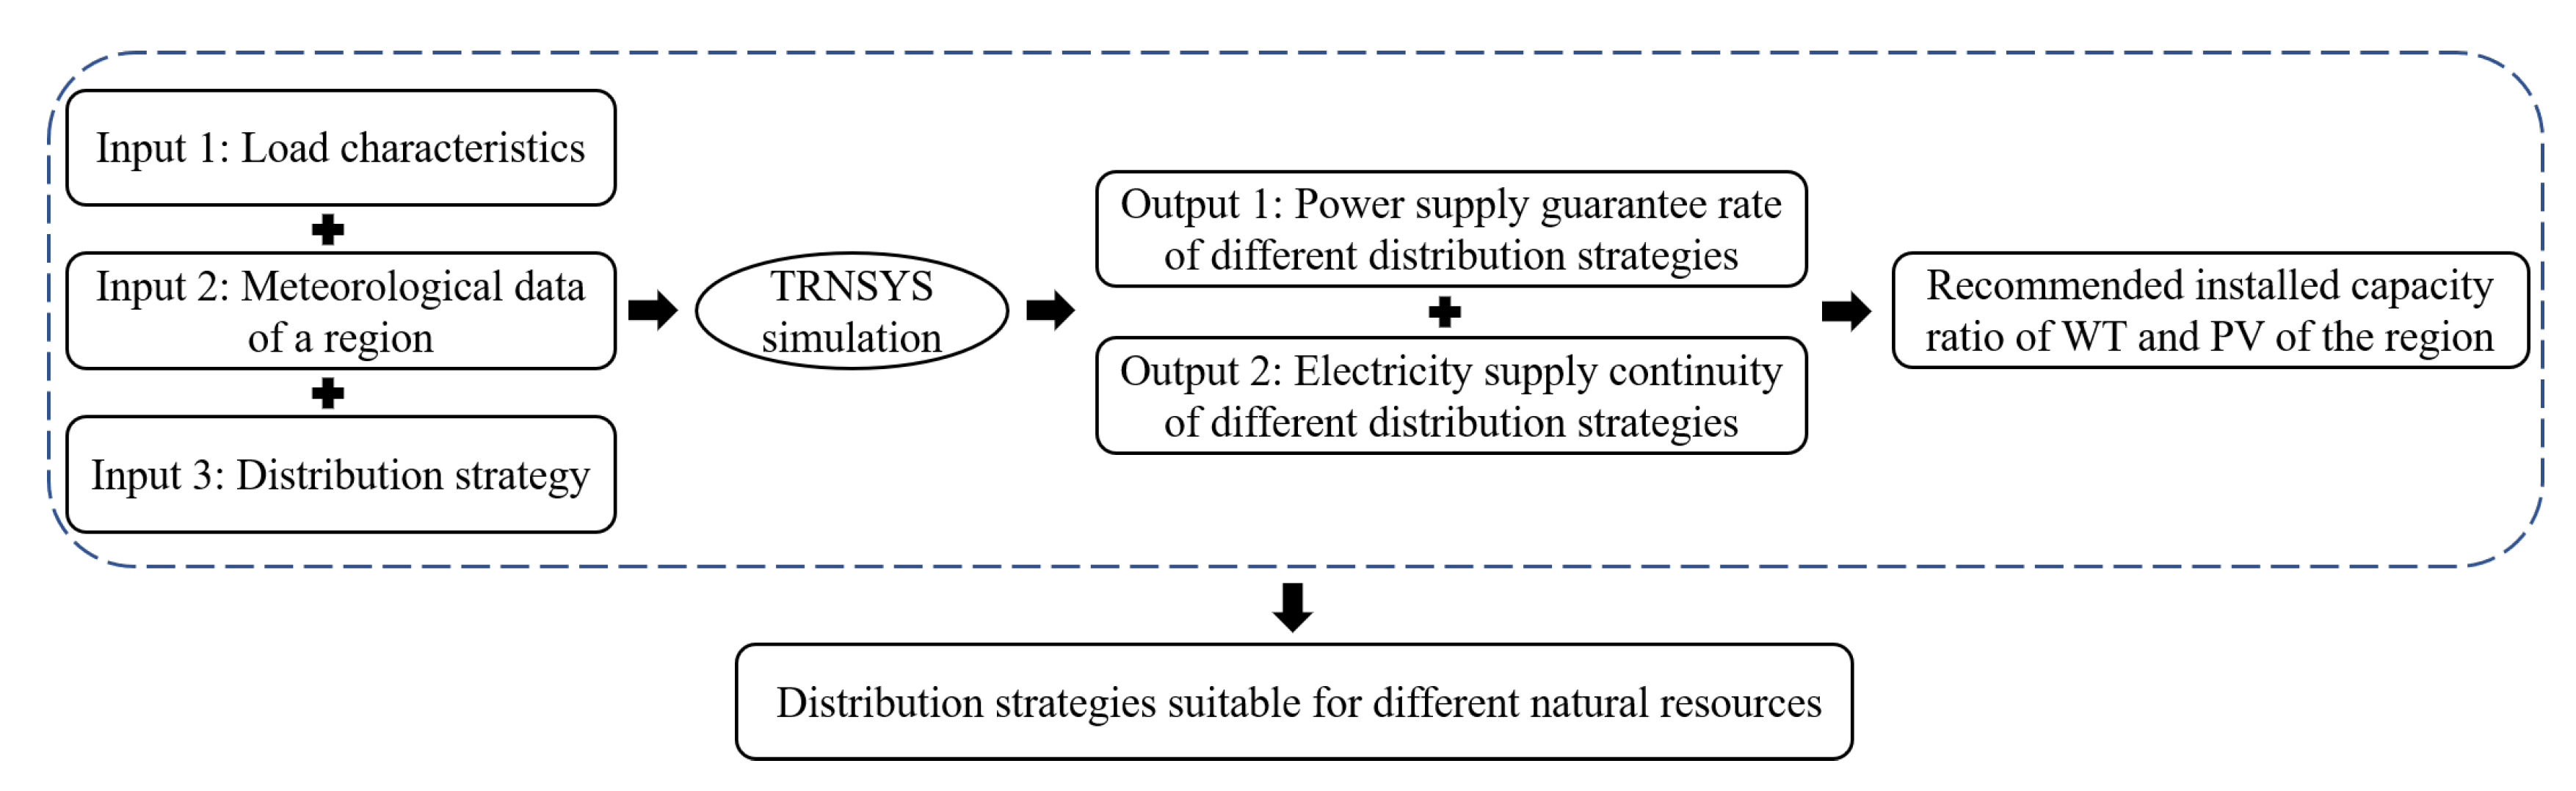
2.6. Procedure of Methodology
3. Results and Discussion
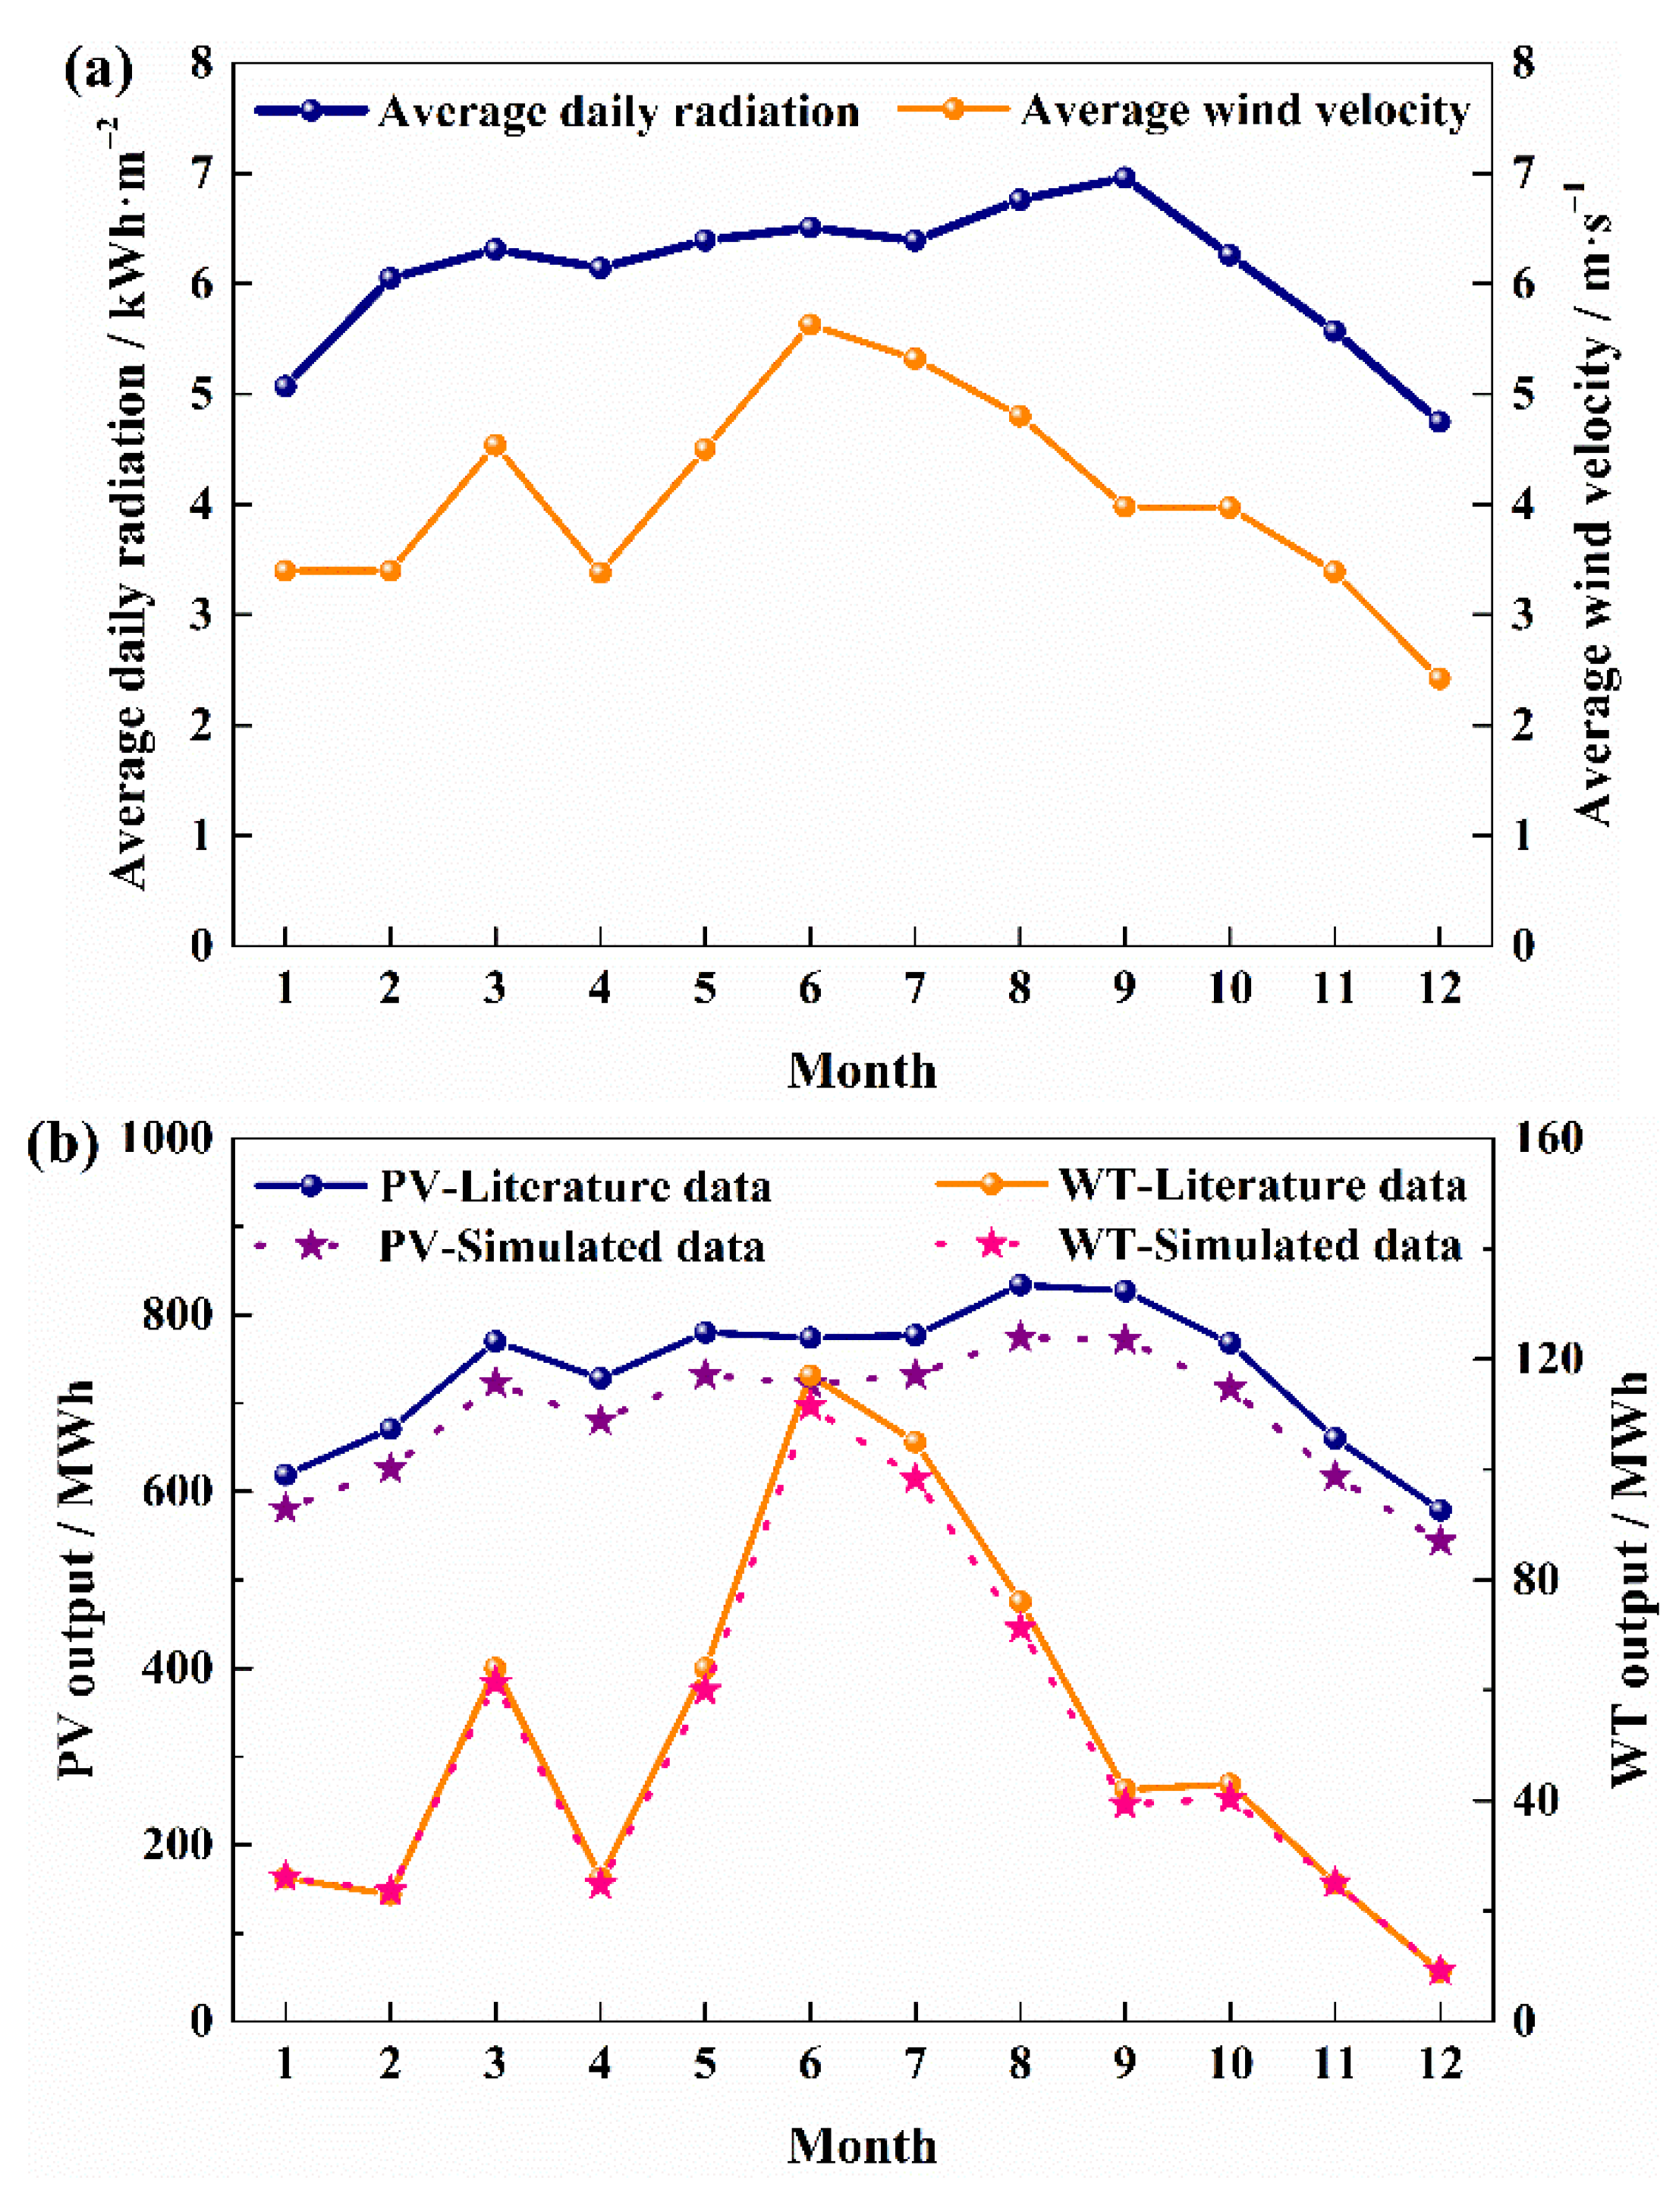
3.1. Model Verification
3.2. Case Analysis
3.2.1. Case One
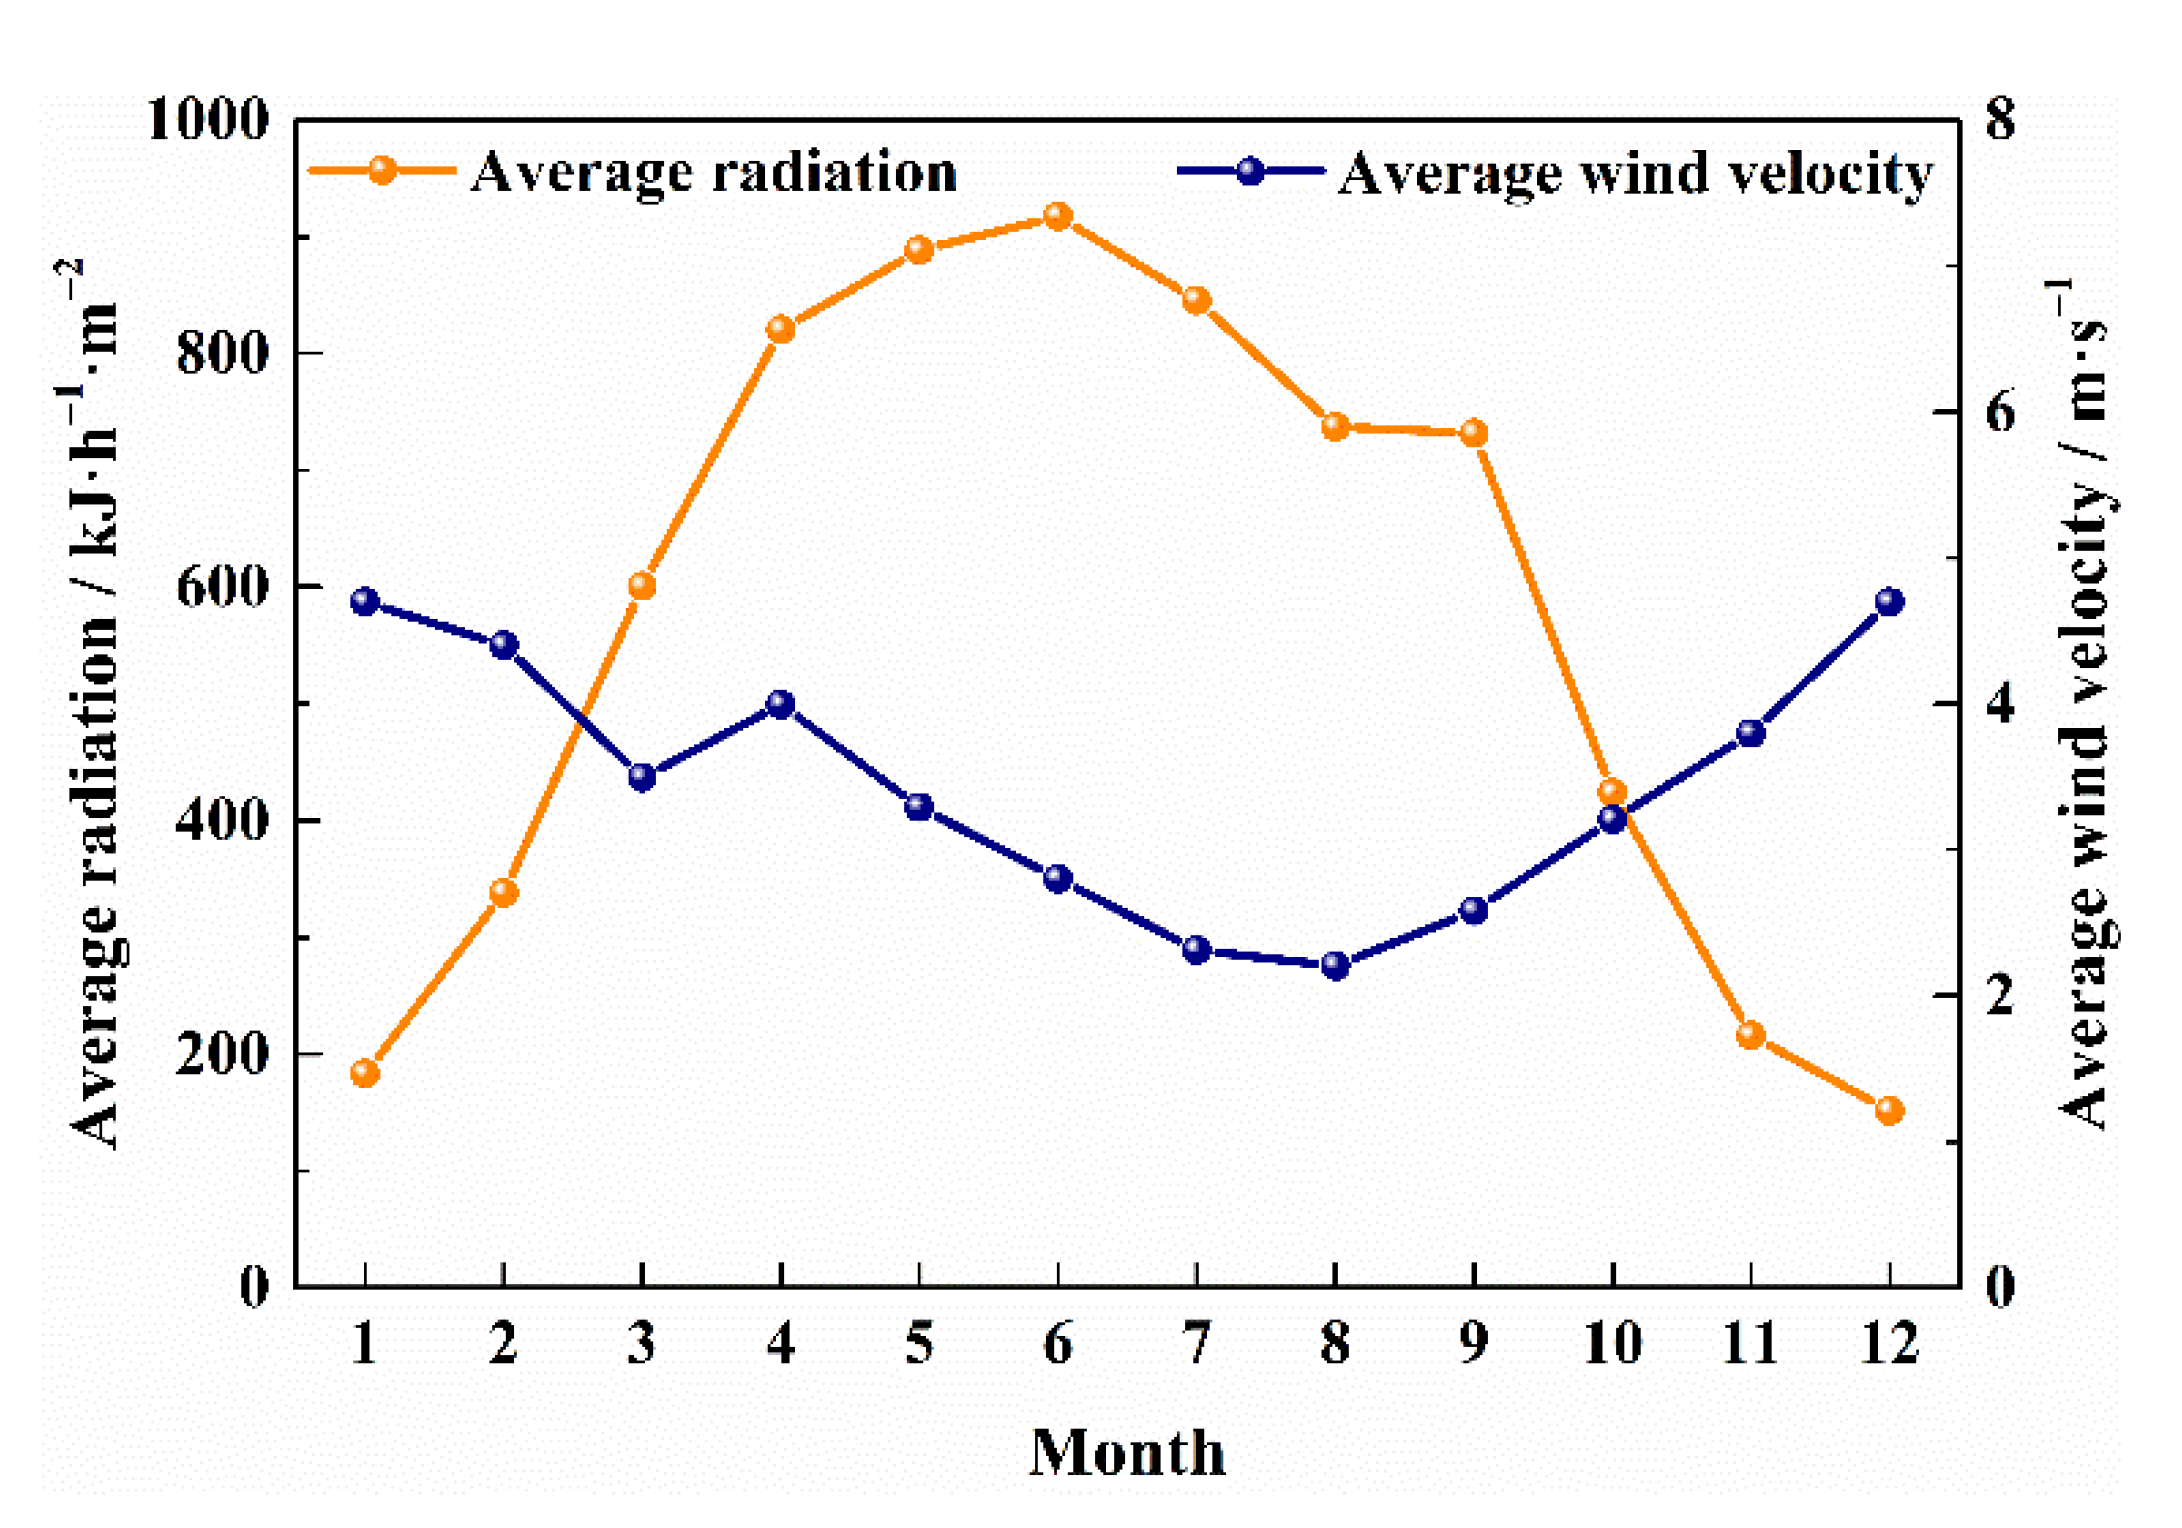
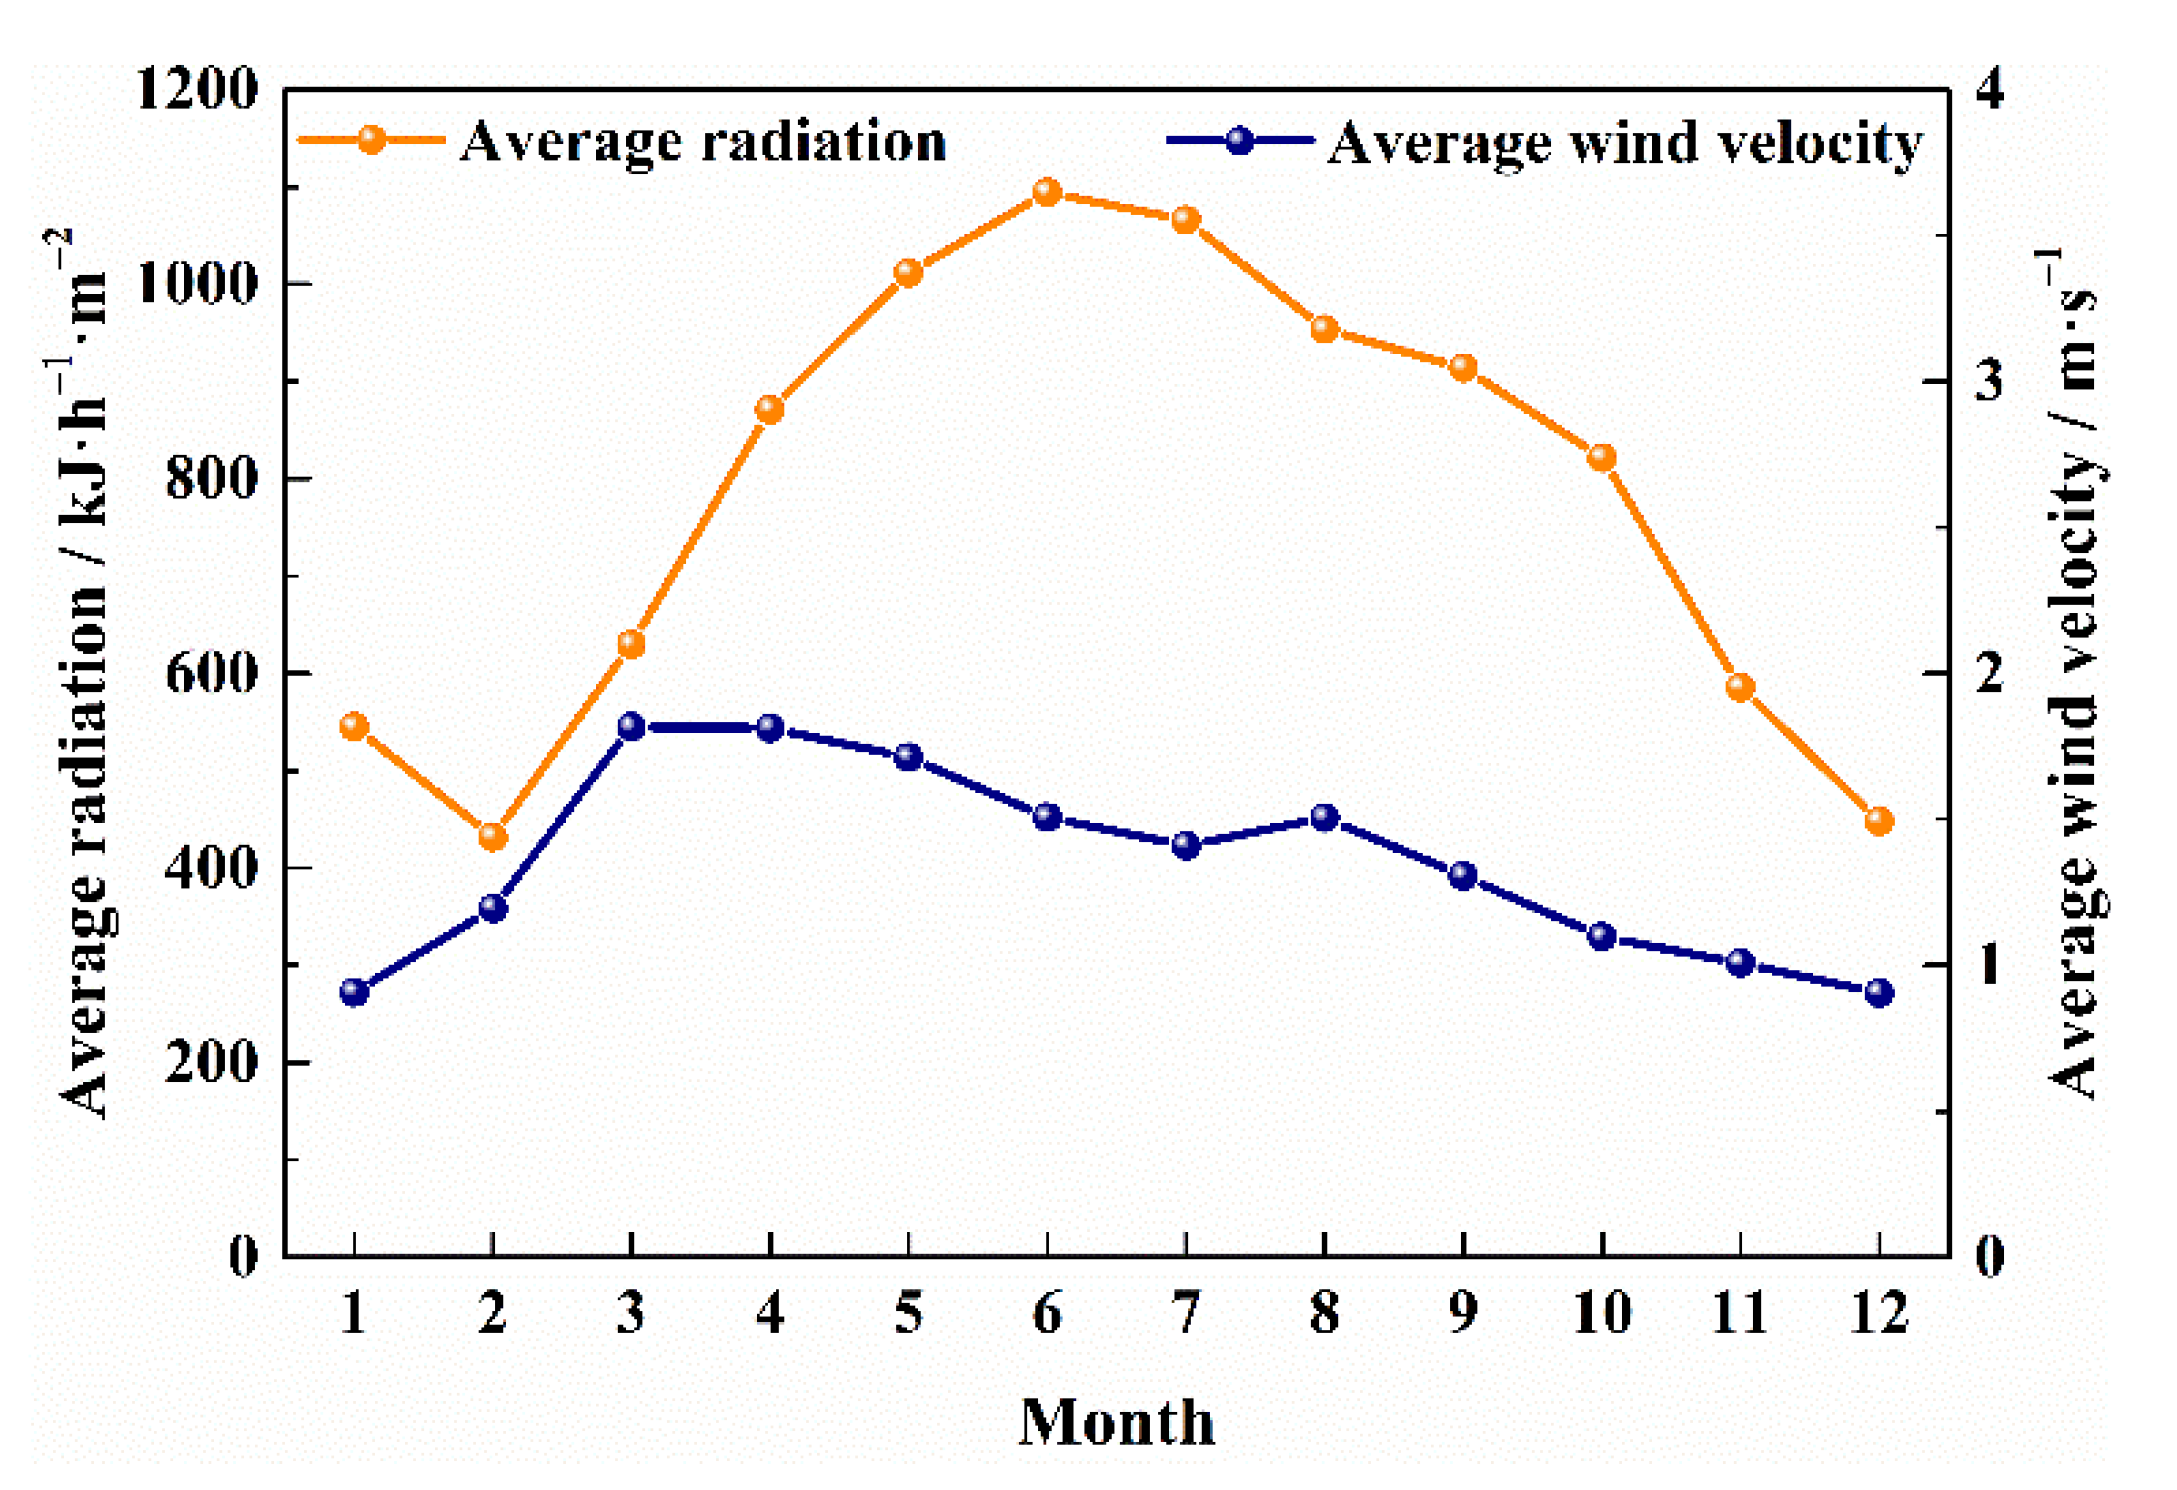
Wind and Solar Resources
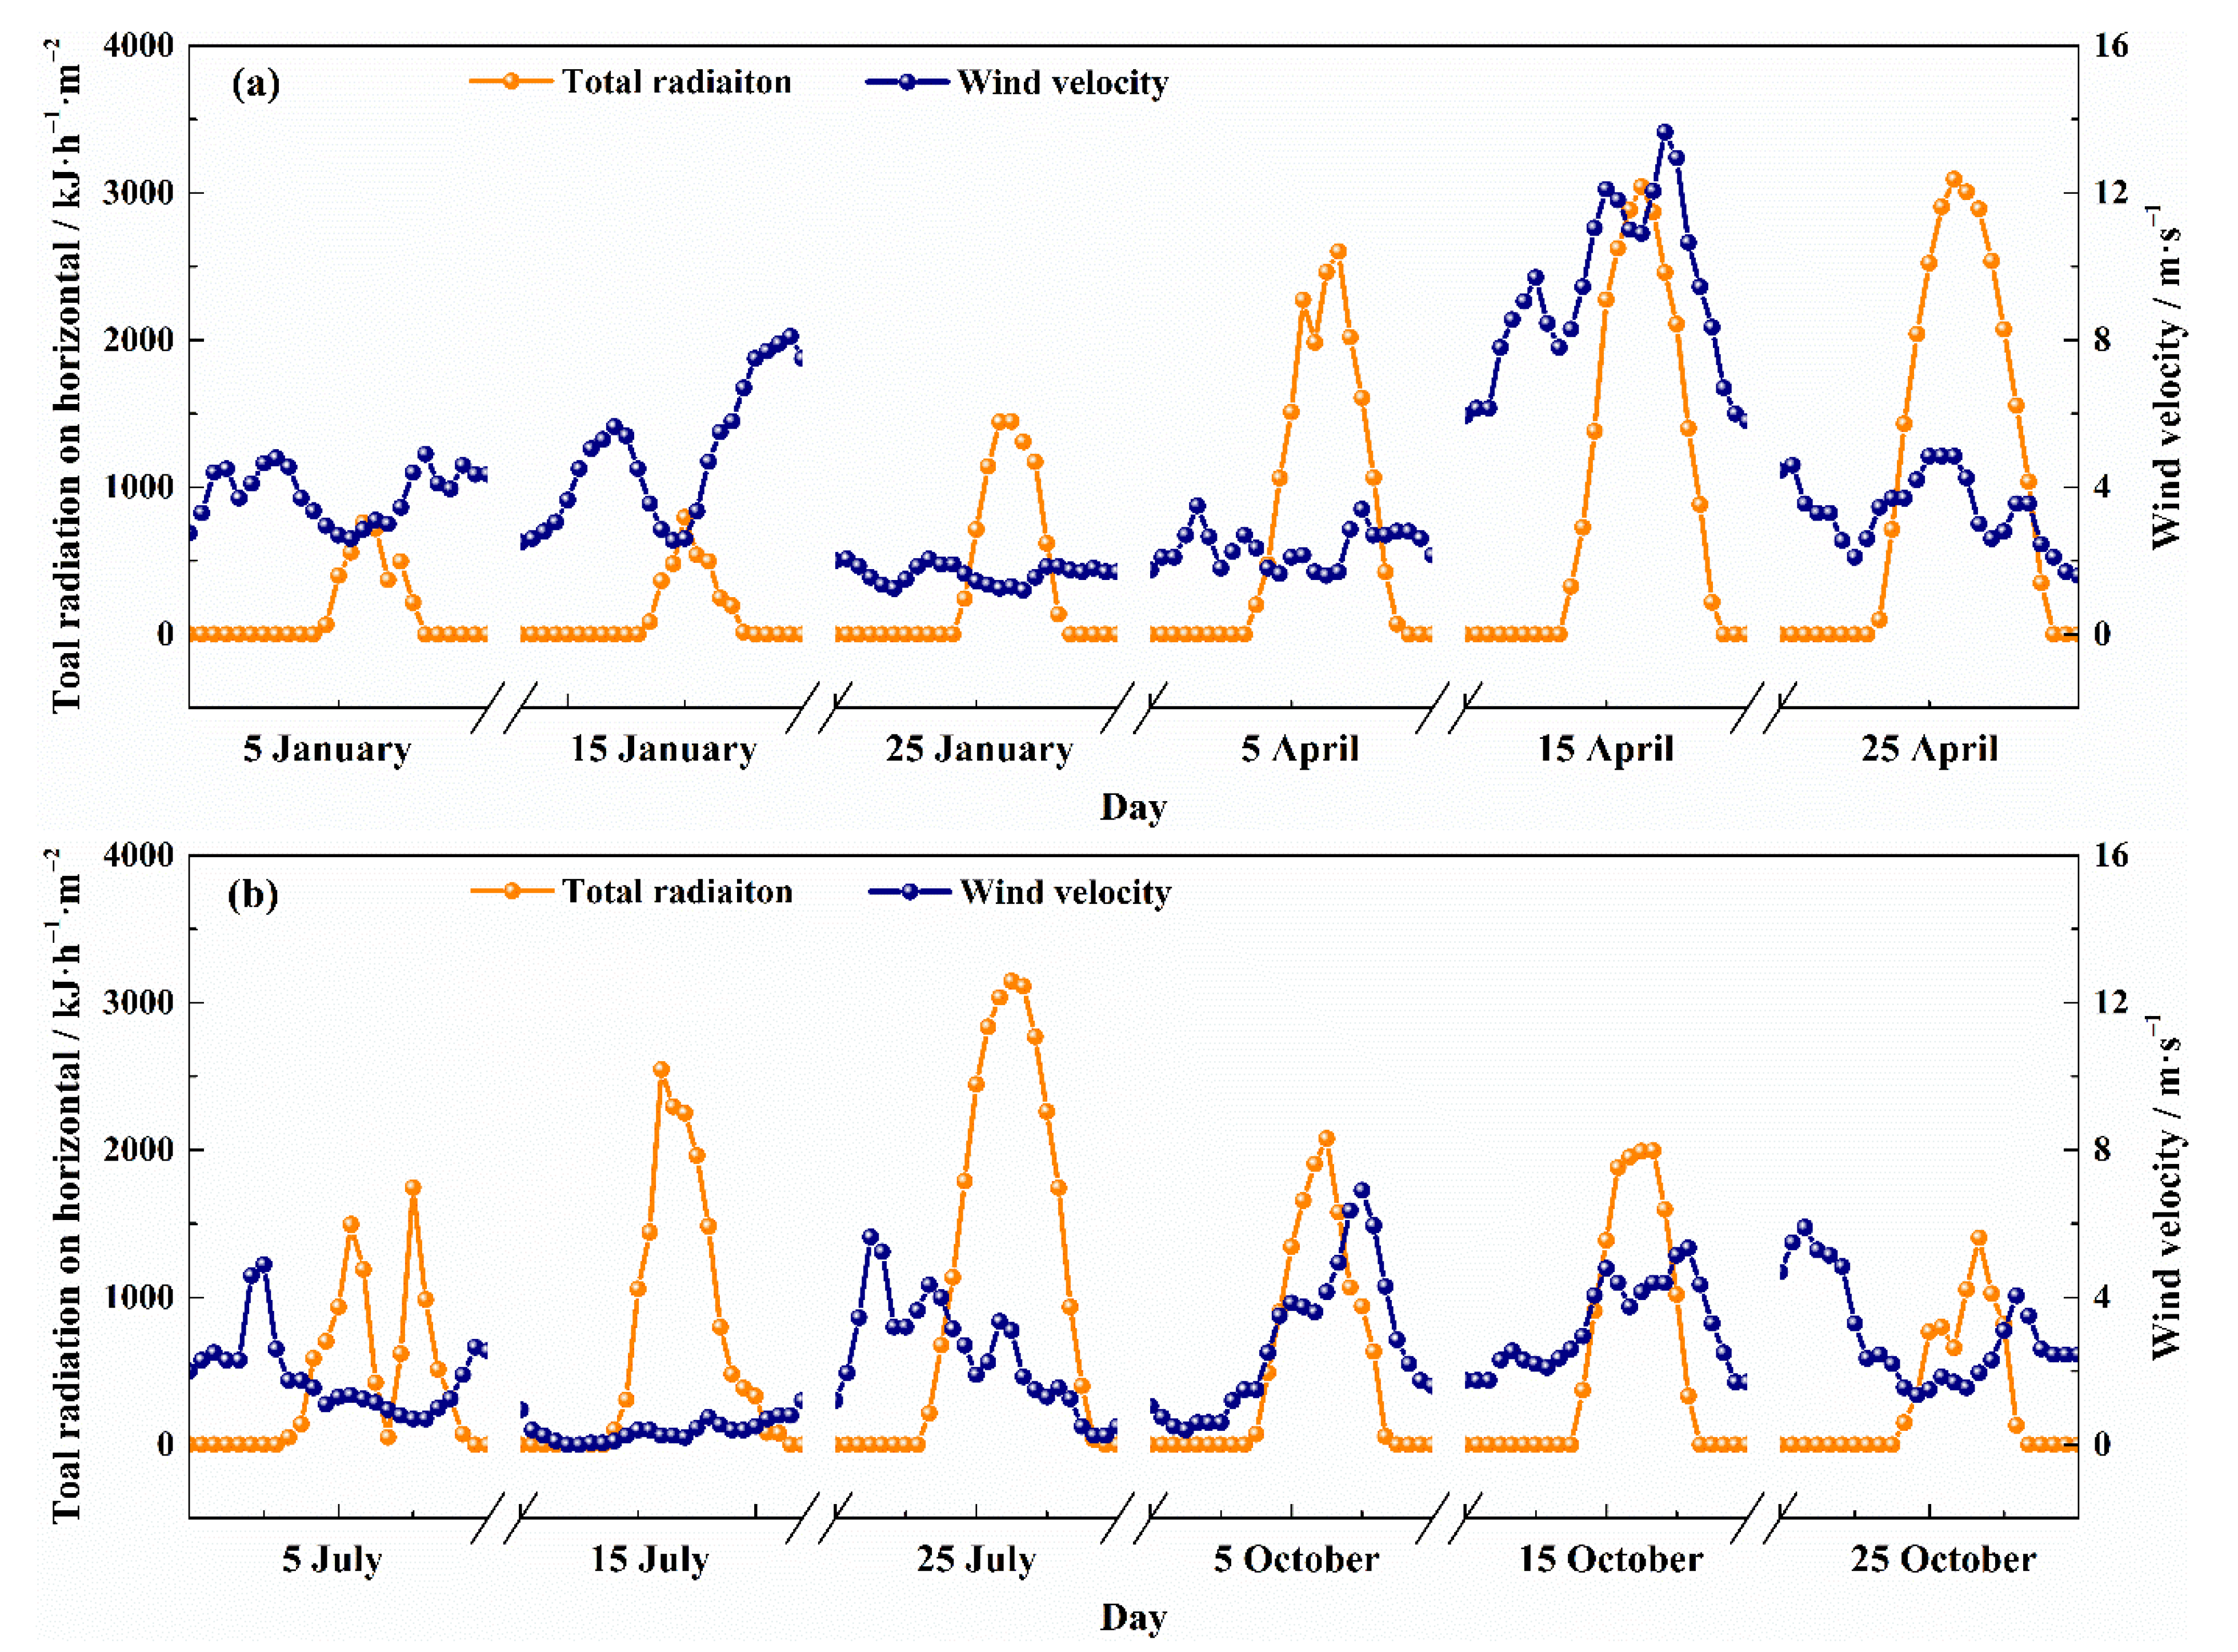
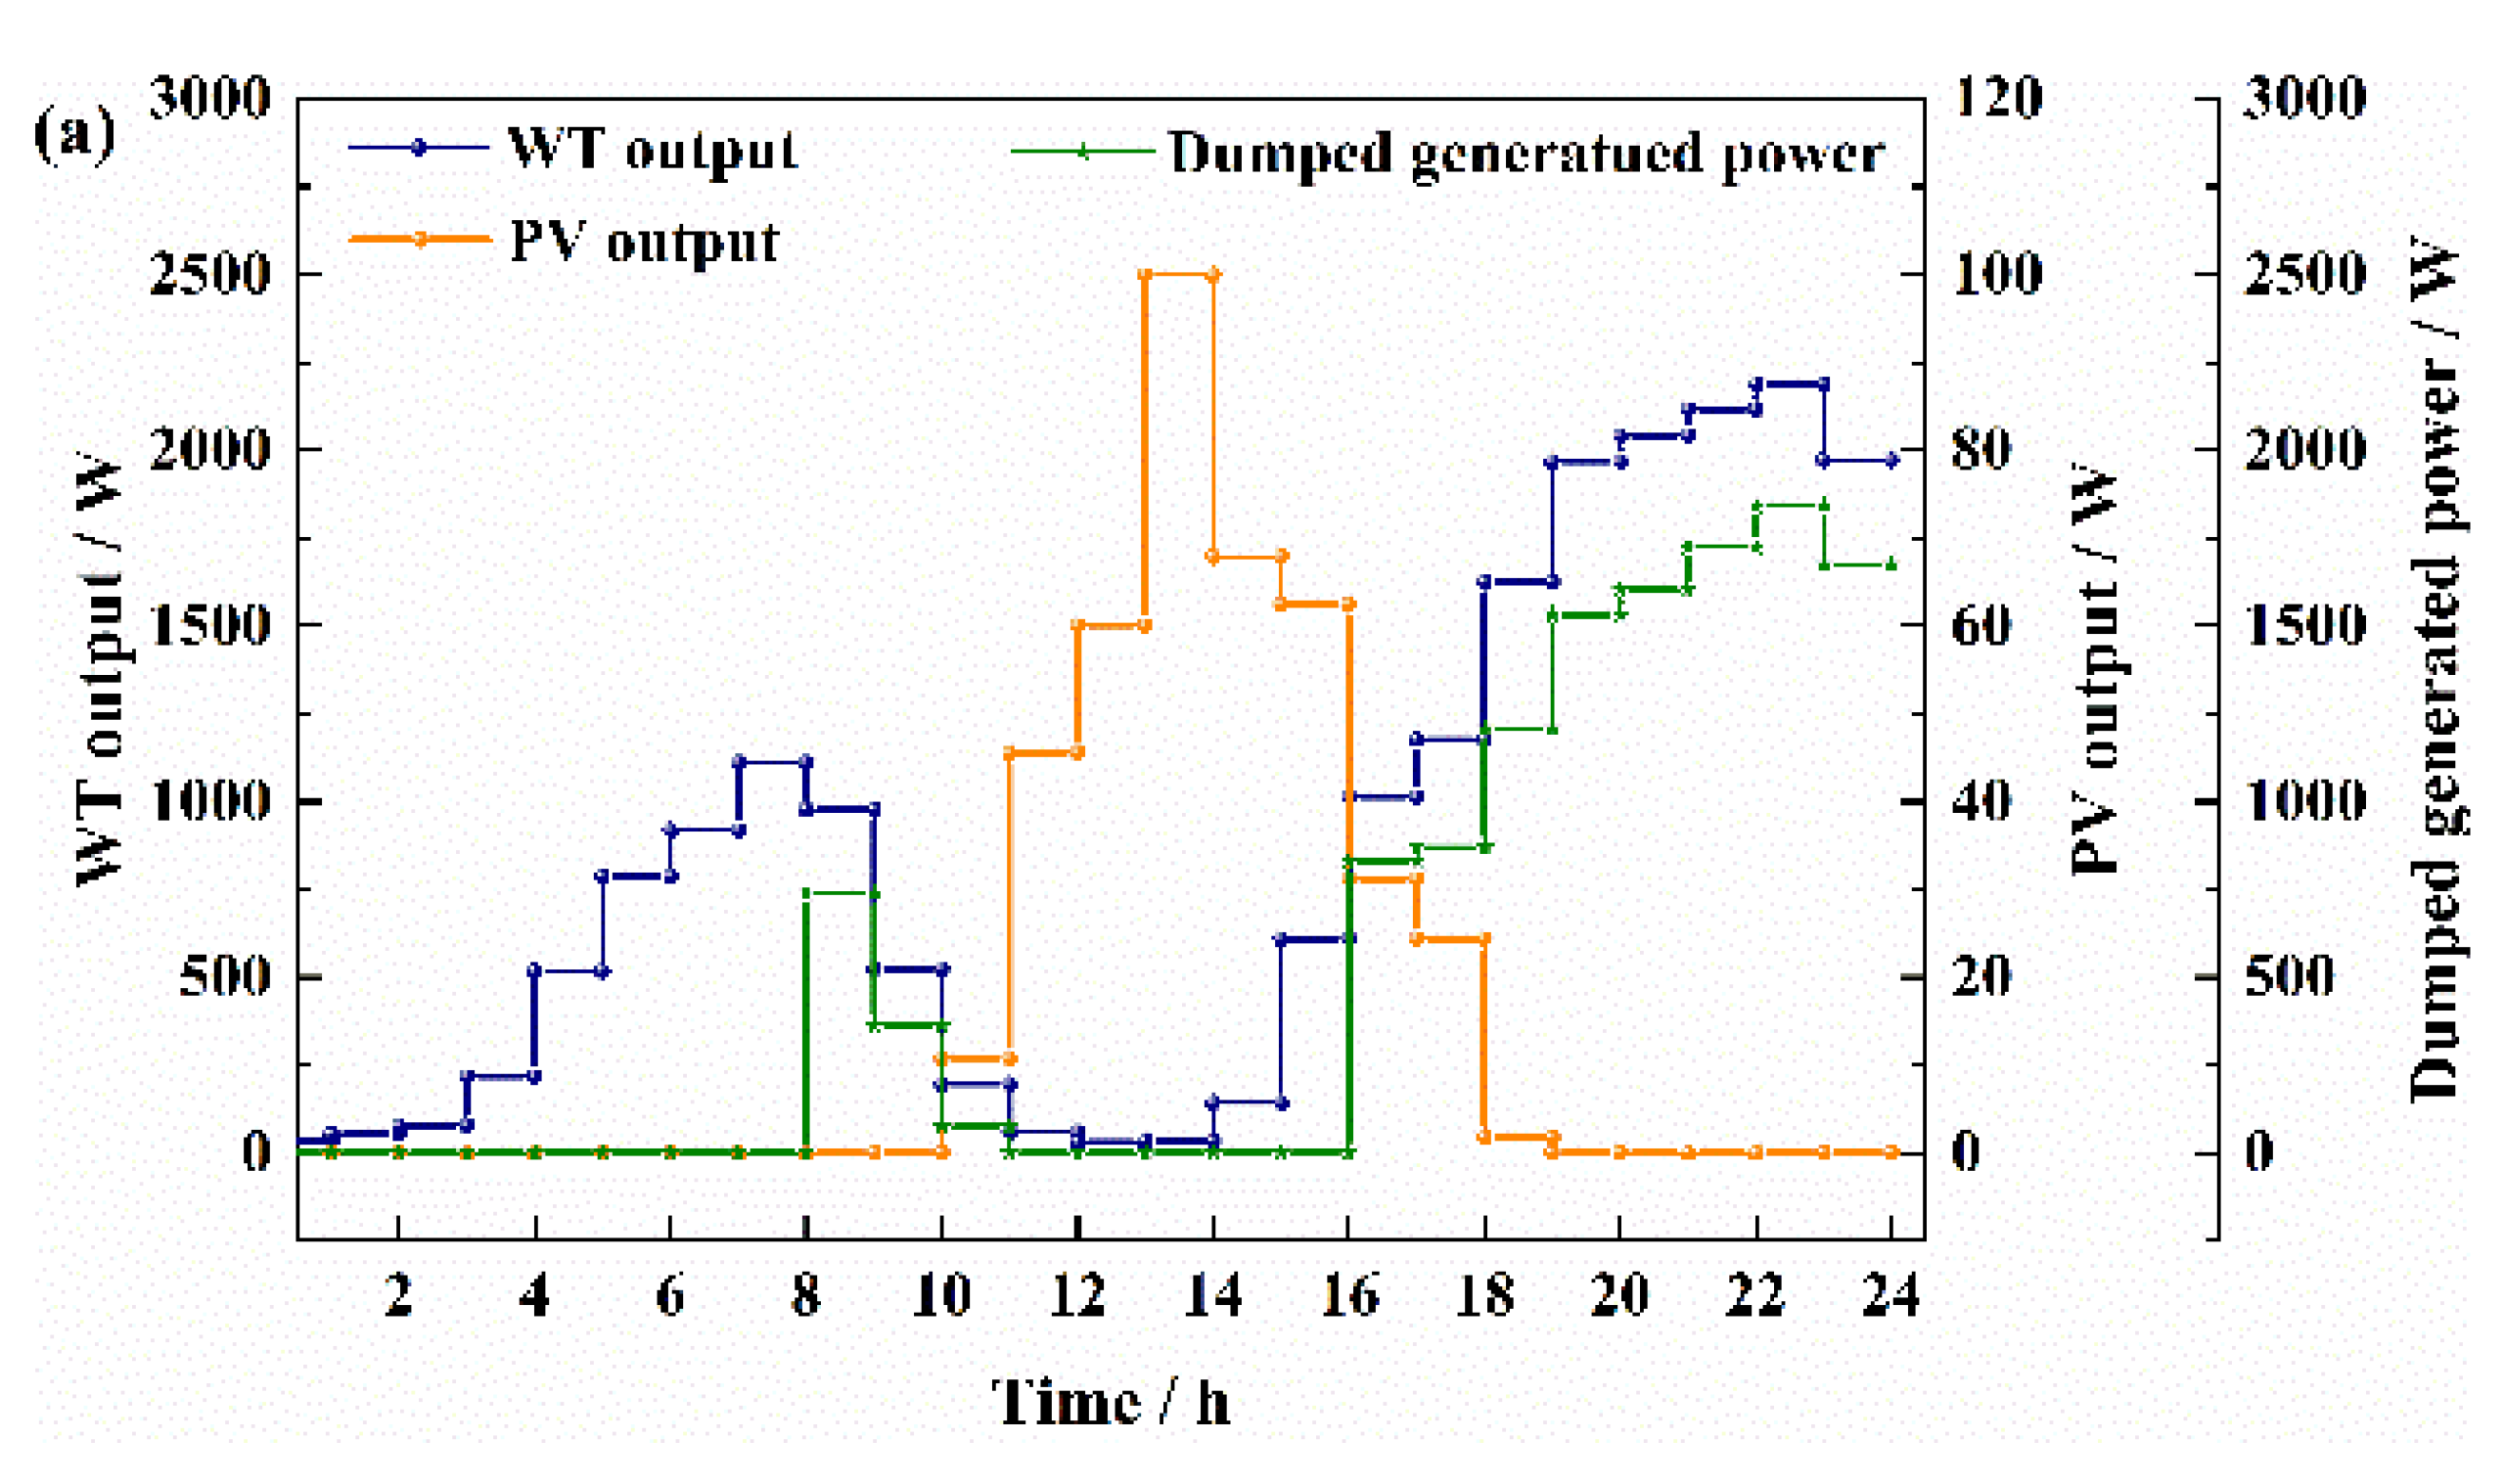
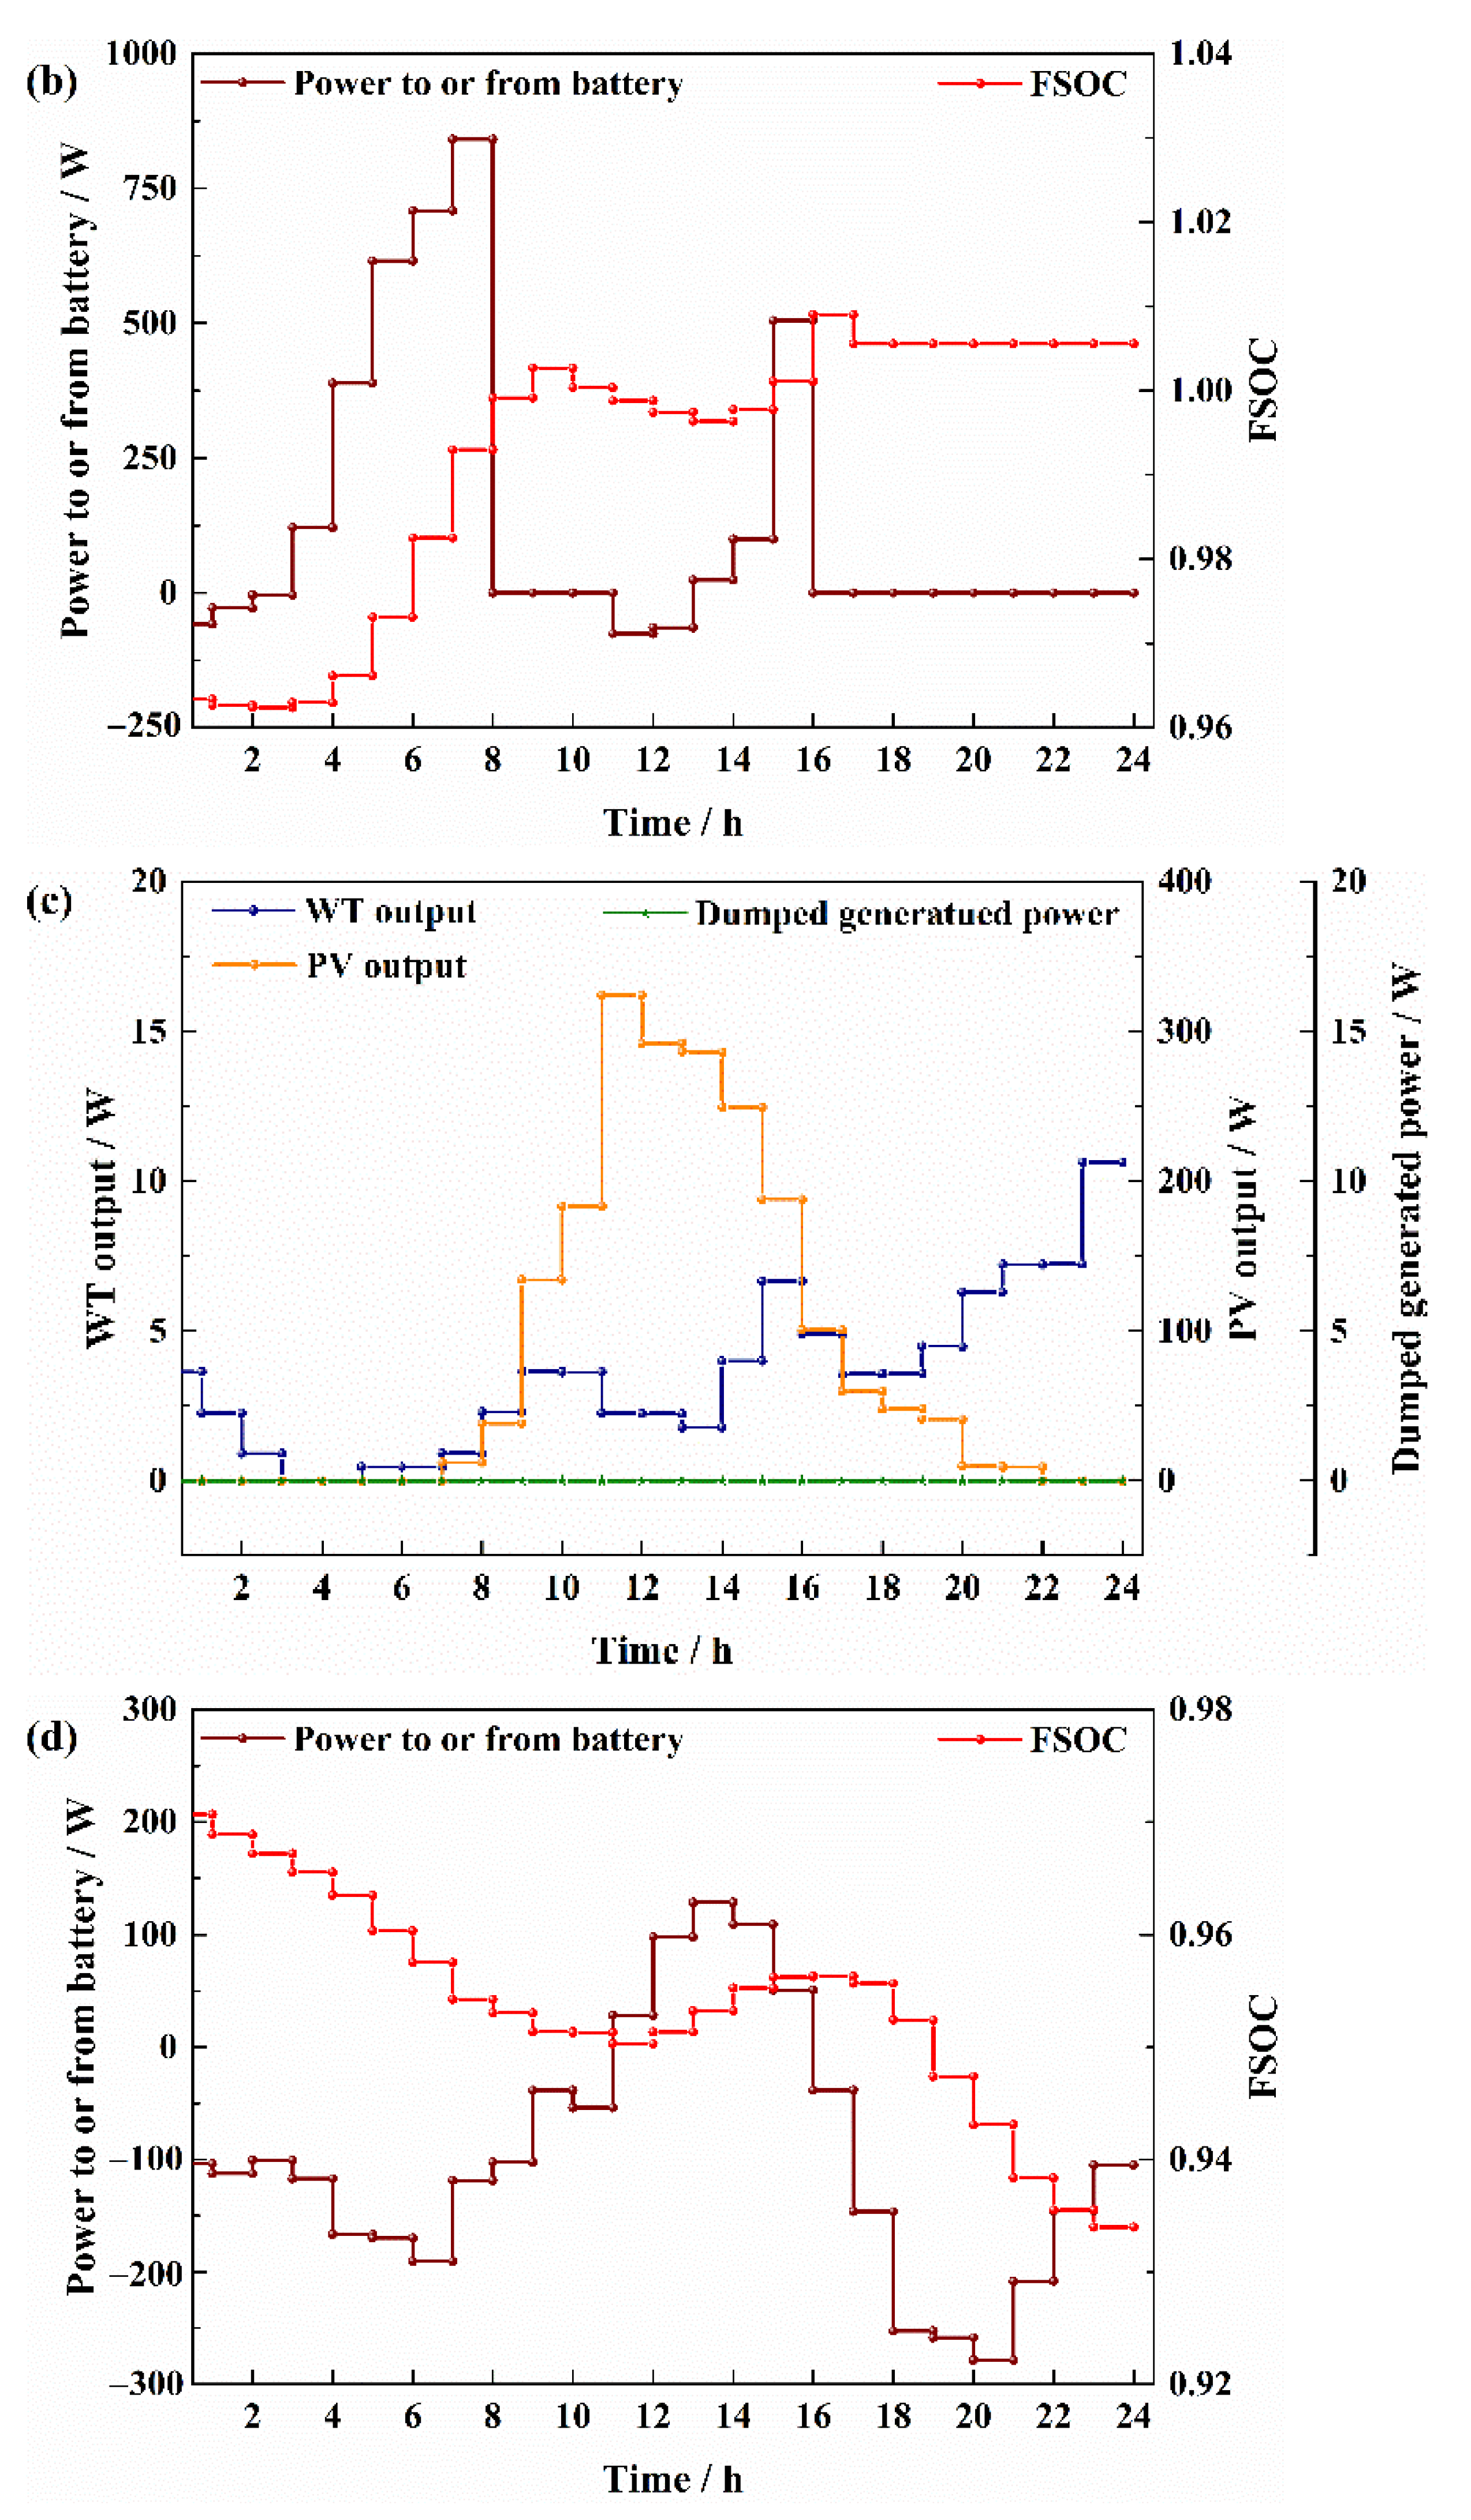
Hourly Characteristics in Typical Days
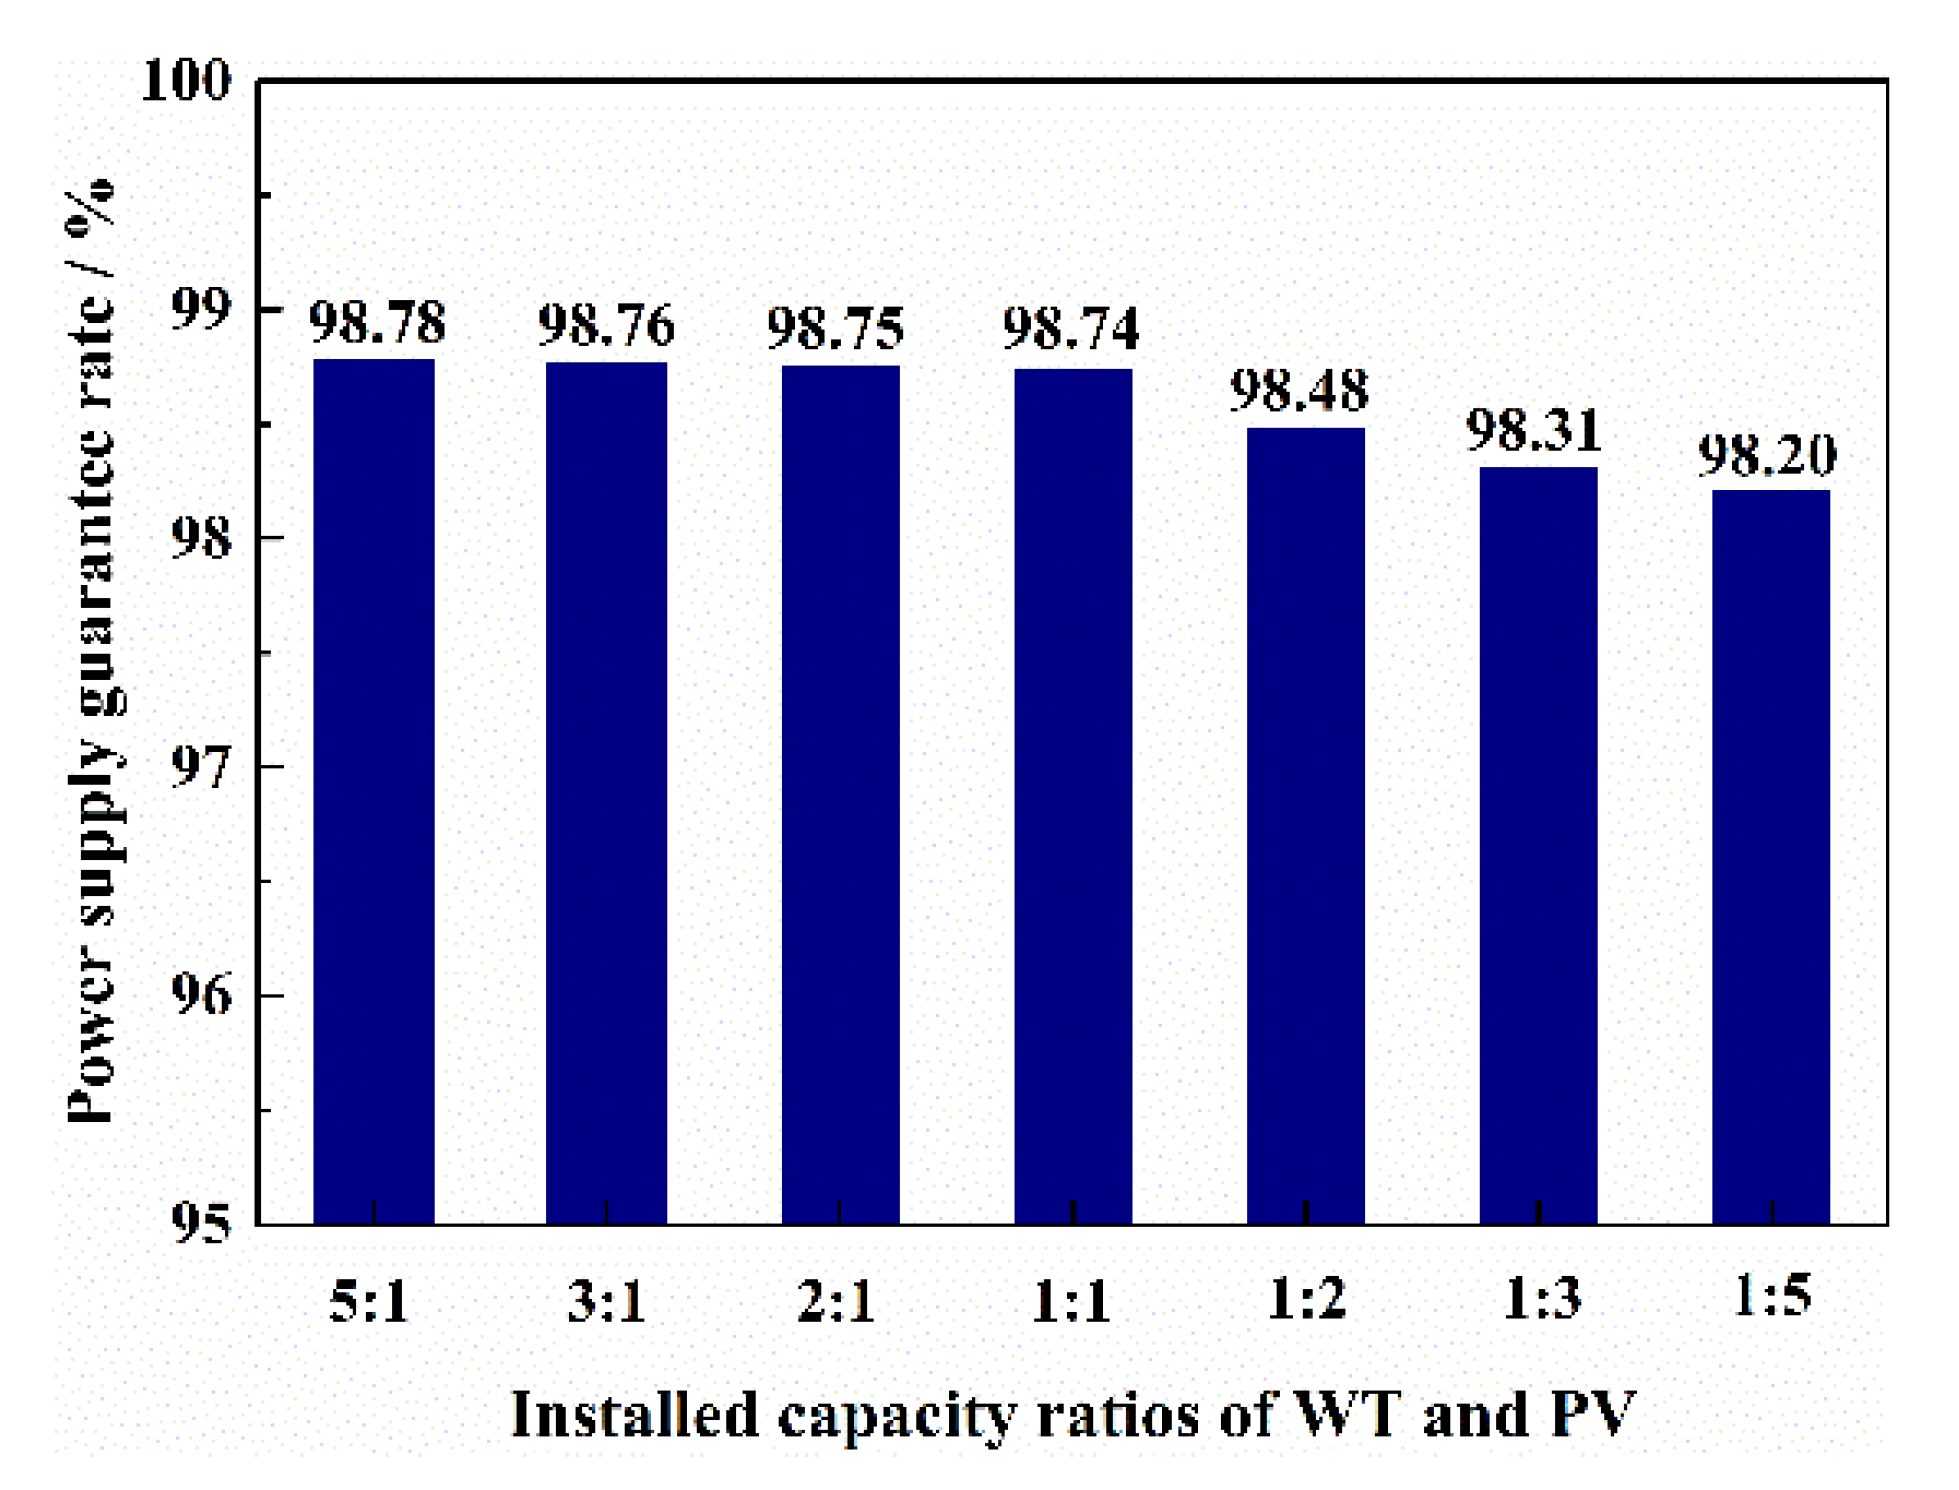
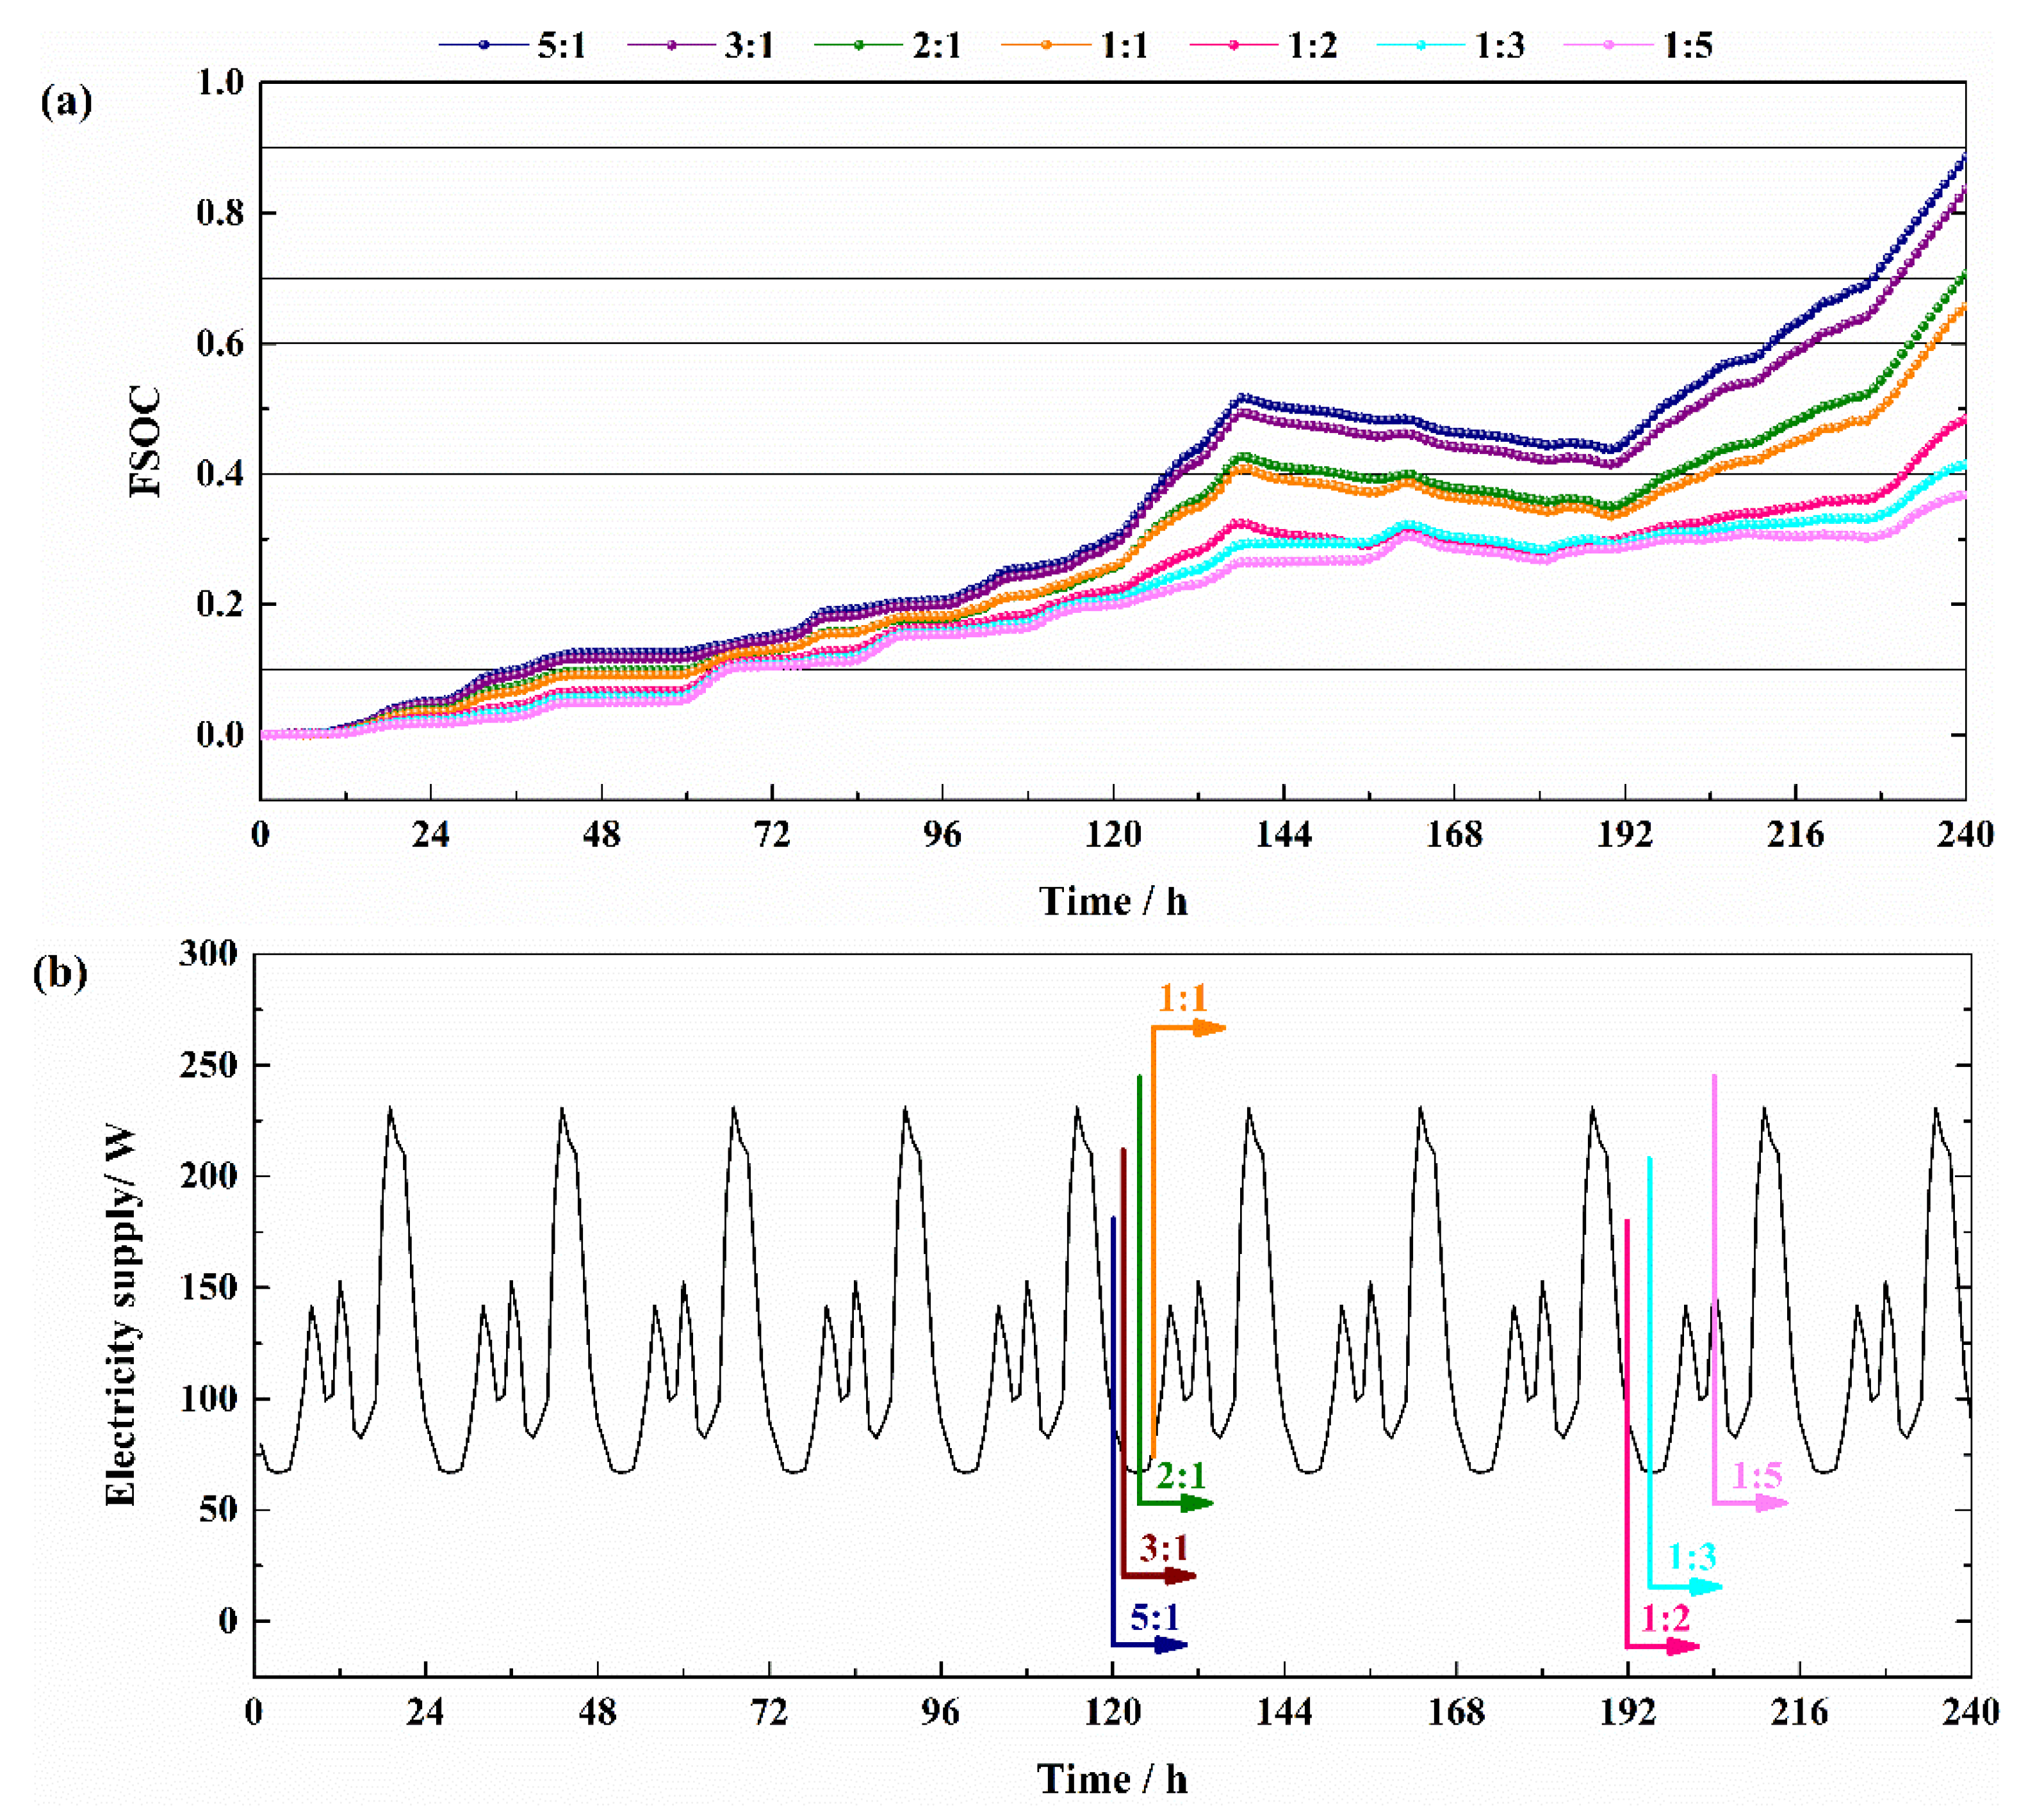
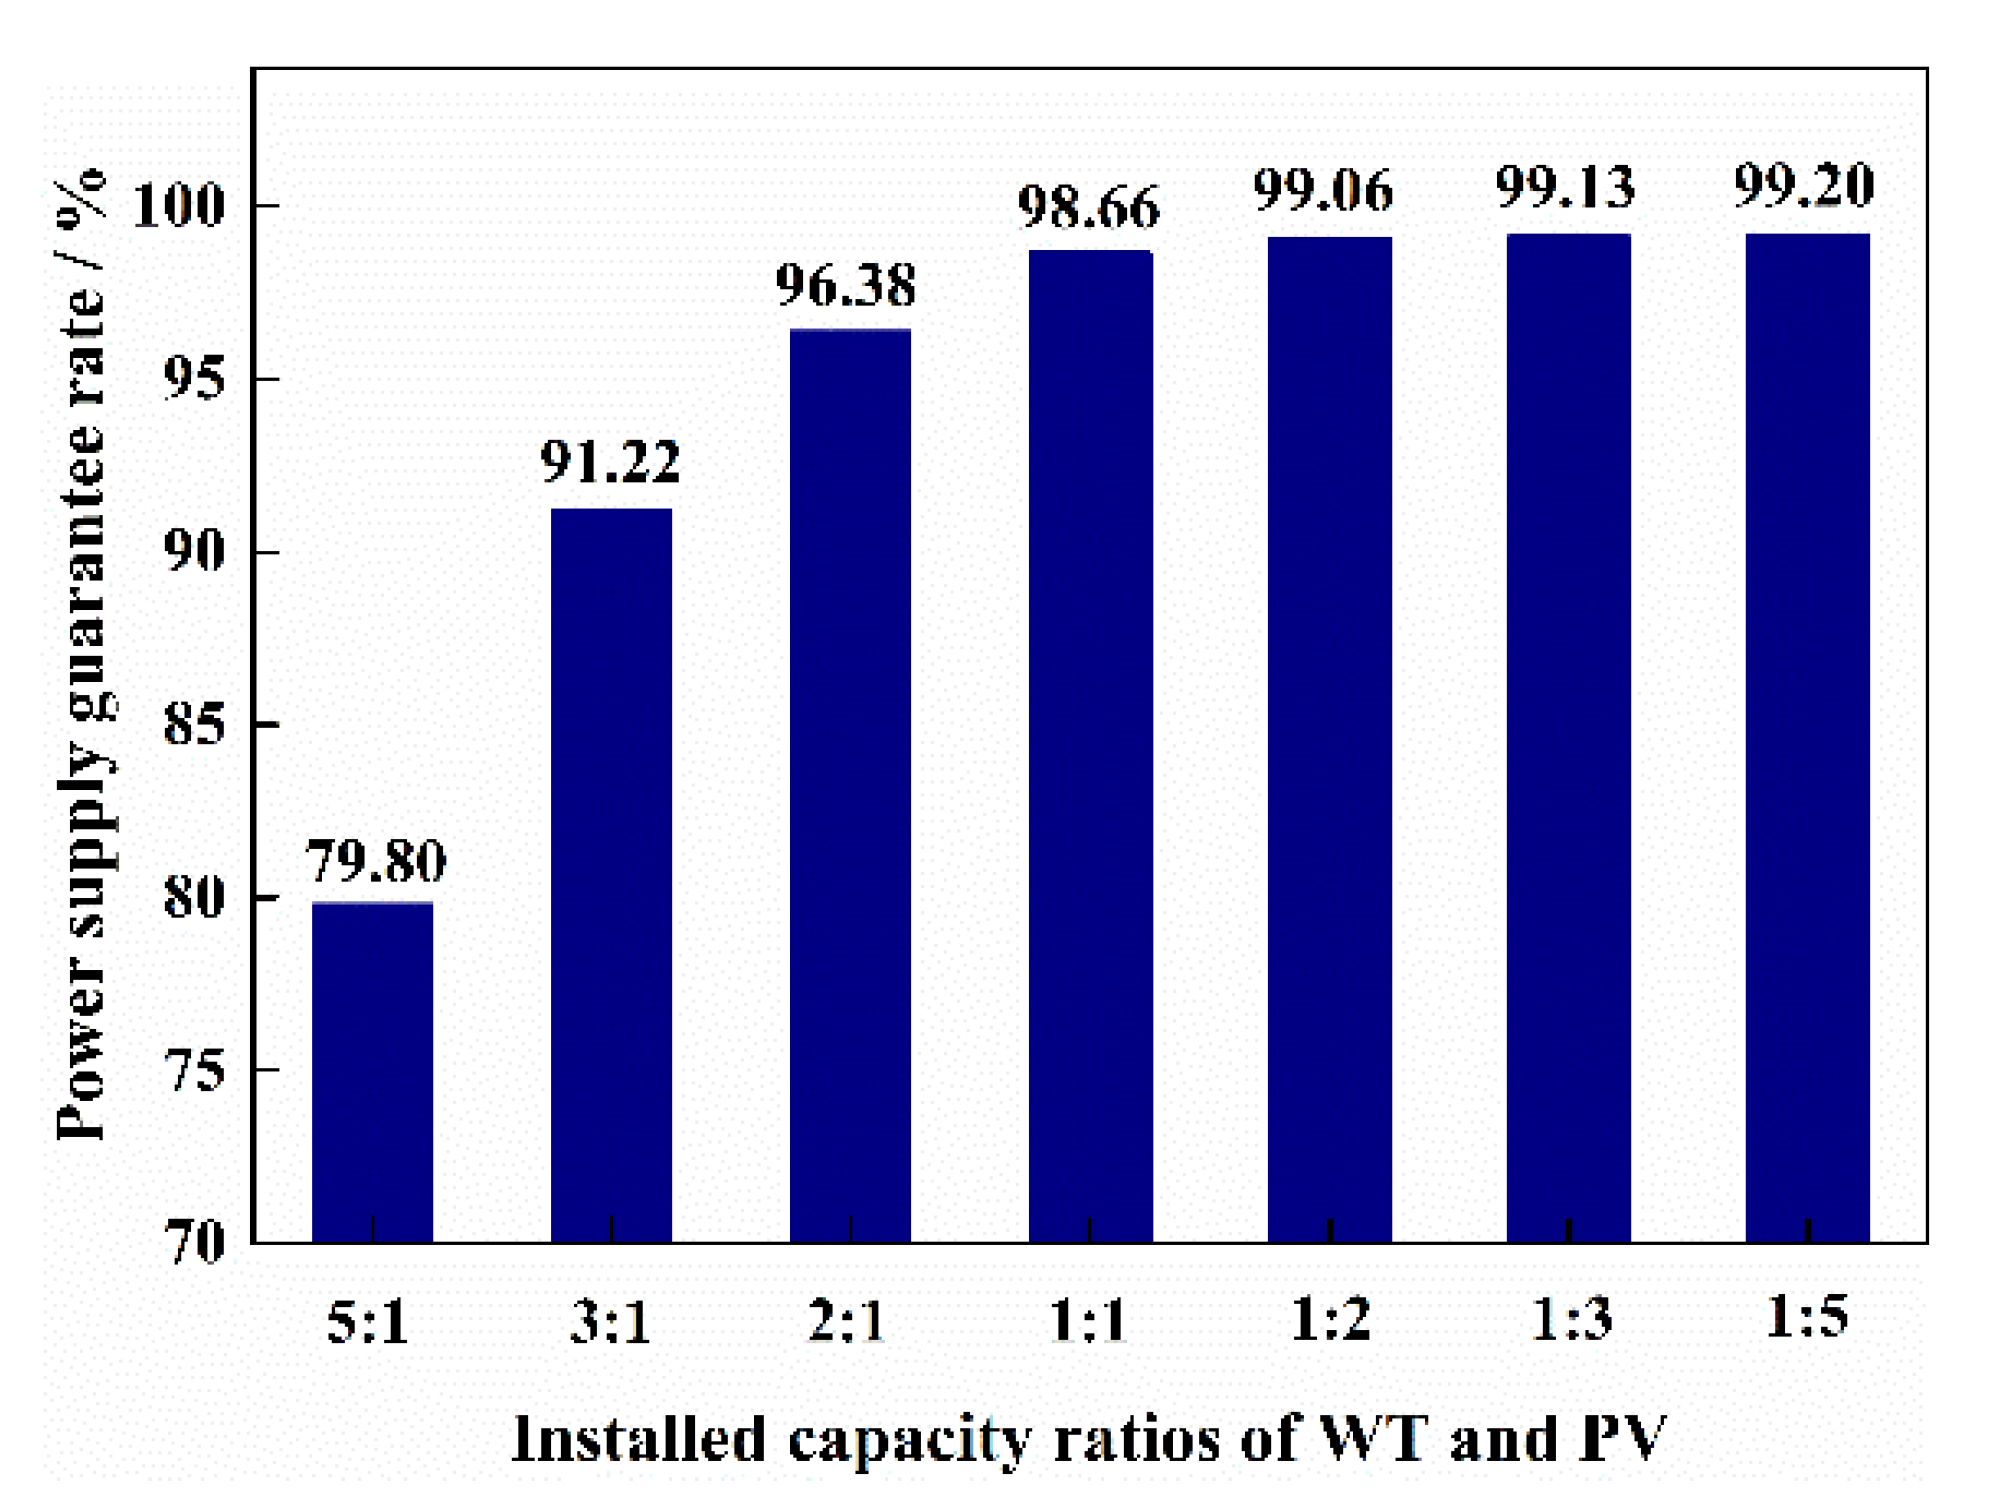
Effect of Different Distribution Strategies
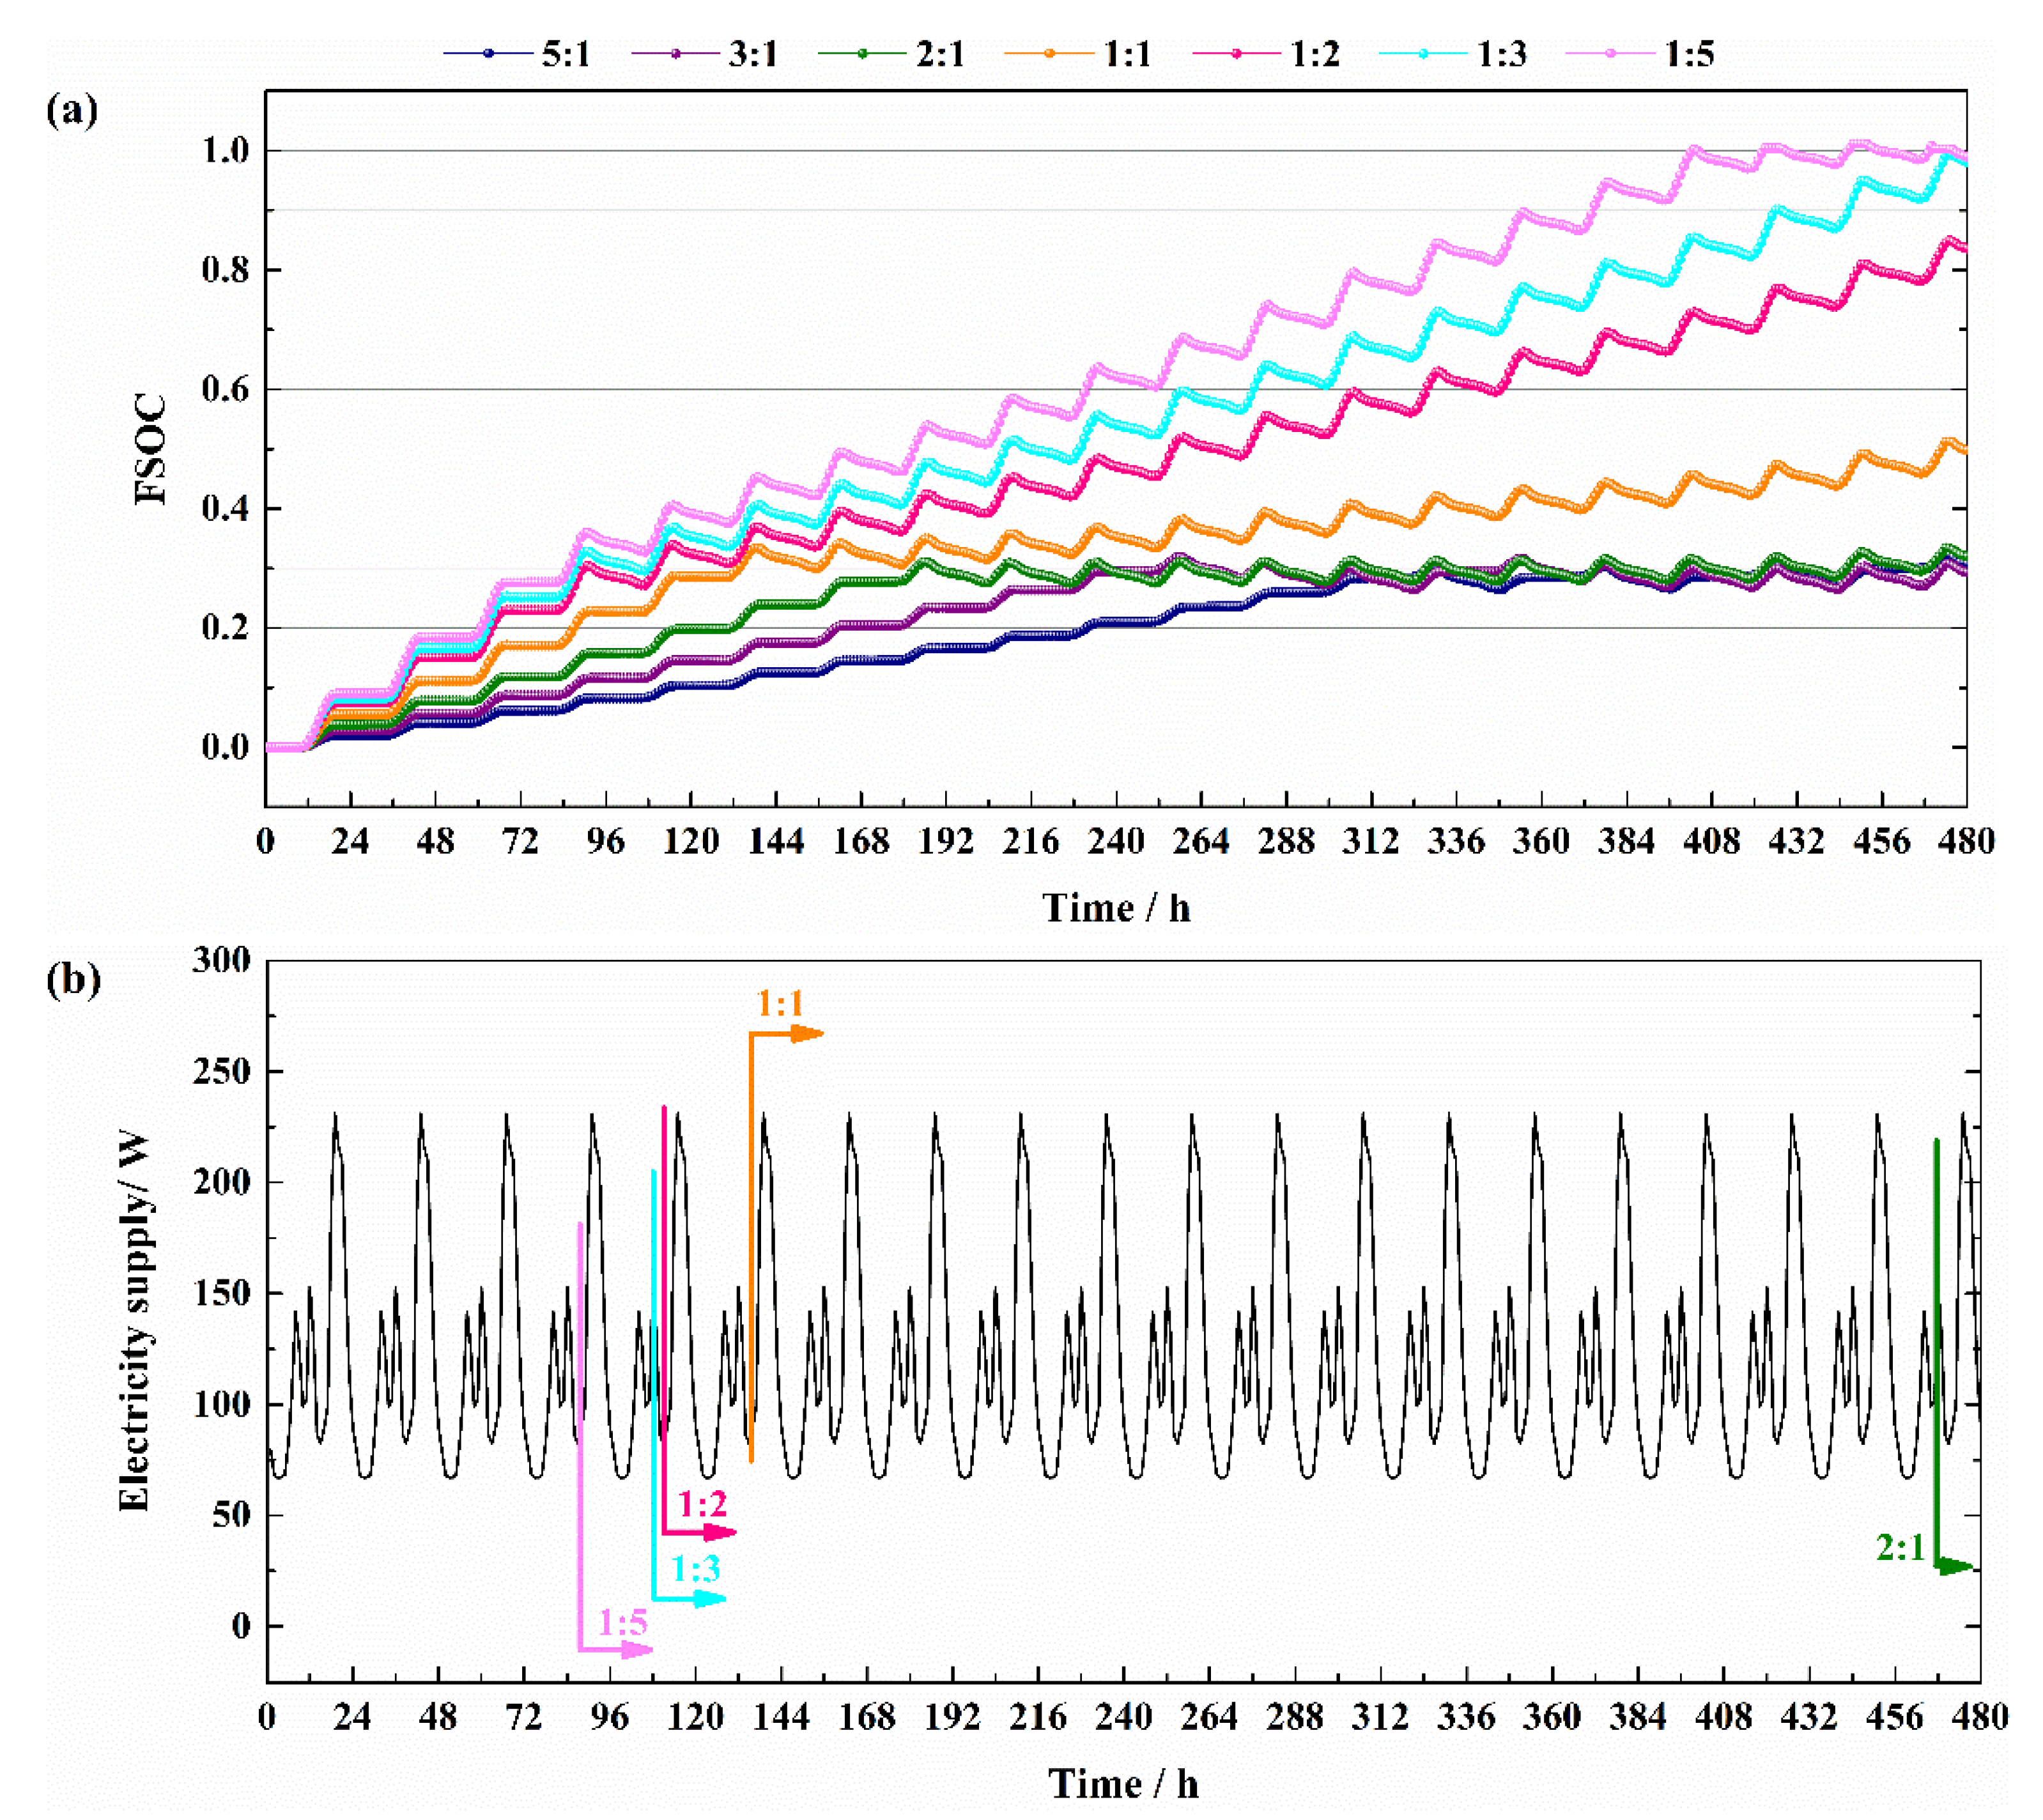
3.2.2. Case Two
3.3. Summary
4. Conclusions
- (1)
- When the annual average wind velocity is in the range of 3.0~3.5 m/s, the recommended installed capacity ratios of the WT and PV are 5:1 for when the total solar irradiation is less than 5040 MJ/(m2·a), 5:1~3:1 for when the total solar irradiation is in the range of 5040~6300 MJ/(m2·a), 5:1~2:1 for when the total solar irradiation is in the range of 6300~6660 MJ/(m2·a), and 5:1~1:1 for when the total solar irradiation is greater than 6300 MJ/(m2·a).
- (2)
- When the annual average wind velocity is in the range of 2.5~3.0 m/s, the recommended installed capacity ratios of the WT and PV are 3:1~2:1 for when the total solar irradiation is less than 5040 MJ/(m2·a), 1:1 for when the total solar irradiation is in the range of 5040~6300 MJ/(m2·a), 1:1~1:2 for when the total solar irradiation is in the range of 6300~6660 MJ/(m2·a), and 1:2 for when the total solar irradiation is greater than 6300 MJ/(m2·a).
- (3)
- When the annual average wind velocity is in the range of 2.0~2.5 m/s, the recommended installed capacity ratios of the WT and PV are 3:1~2:1 for when the total solar irradiation is less than 5040 MJ/(m2·a), 1:1 for when the total solar irradiation is in the range of 5040~6300 MJ/(m2·a), 1:2 for when the total solar irradiation is in the range of 6300~6660 MJ/(m2·a), and 1:3 for when the total solar irradiation is greater than 6300 MJ/(m2·a).
- (4)
- When the annual average wind velocity is less than 2.0 m/s, the recommended installed capacity ratios of the WT and PV are 1:2~1:3 for when the total solar irradiation is in the range of 5040~6300 MJ/(m2·a), 1:3 for when the total solar irradiation is in the range of 6300~6660 MJ/(m2·a), and 1:5 for when the total solar irradiation is greater than 6300 MJ/(m2·a).
- (5)
- If the total solar irradiation is less than 5040 MJ/(m2·a) and the annual average wind velocity is less than 2.0 m/s, it is not recommended to use the standalone hybrid system because it cannot meet the power demand.
Author Contributions
Funding
Institutional Review Board Statement
Informed Consent Statement
Conflicts of Interest
Abbreviations
| WT | Wind turbine |
| PV | Photovoltaic panel |
| TRNSYS | Transient system simulator |
| DC | Direct current |
| AC | Alternating current |
| NOCT | Nominal operating cell temperature |
| FSOC | Fractional state of charge |
| SER | Solar energy resources |
| WER | Wind energy resources |
References
- Weschenfelder, F.; Leite, G.D.P.; da Costa, A.C.A.; Vilela, O.D.; Ribeiro, C.M.; Ochoa, A.A.V.; Araujo, A.M. A review on the complementarity between grid-connected solar and wind power systems. J. Clean Prod. 2020, 257, 10. [Google Scholar] [CrossRef]
- Lehtola, T.; Zahedi, A. Solar energy and wind power supply supported by storage technology: A review. Sustain. Energy Technol. Assess. 2019, 35, 25–31. [Google Scholar] [CrossRef]
- Fant, C.; Adam Schlosser, C.; Strzepek, K. The impact of climate change on wind and solar resources in southern Africa. Appl. Energy 2016, 161, 556–564. [Google Scholar] [CrossRef] [Green Version]
- Sun, W.; Harrison, G.P. Wind-solar complementarity and effective use of distribution network capacity. Appl. Energy 2019, 247, 89–101. [Google Scholar] [CrossRef] [Green Version]
- Carvalho, D.B.; Guardia, E.C.; Marangon Lima, J.W. Technical-economic analysis of the insertion of PV power into a wind-solar hybrid system. Sol. Energy 2019, 191, 530–539. [Google Scholar] [CrossRef]
- Buonomano, A.; Calise, F.; d’Accadia, M.D.; Vicidomini, M. A hybrid renewable system based on wind and solar energy coupled with an electrical storage: Dynamic simulation and economic assessment. Energy 2018, 155, 174–189. [Google Scholar] [CrossRef]
- Alturki, F.; Al-Shamma’a, A.; Farh, H.M.H.; Alsharabi, K. Optimal sizing of autonomous hybrid energy system using supply-demand-based optimization algorithm. Int. J. Energy Res. 2020, 45, 605–625. [Google Scholar] [CrossRef]
- Al-Ghussain, L.; Ahmed, H.; Haneef, F. Optimization of hybrid PV-wind system: Case study Al-Tafilah cement factory, Jordan. Sustain. Energy Technol. Assess. 2018, 30, 24–36. [Google Scholar] [CrossRef]
- Li, C.; Ge, X.; Zheng, Y.; Xu, C.; Ren, Y.; Song, C.; Yang, C. Techno-economic feasibility study of autonomous hybrid wind/PV/battery power system for a household in Urumqi, China. Energy 2013, 55, 263–272. [Google Scholar] [CrossRef]
- Yang, H.; Zhou, W.; Lu, L.; Fang, Z. Optimal sizing method for stand-alone hybrid solar–wind system with LPSP technology by using genetic algorithm. Sol. Energy 2008, 82, 354–367. [Google Scholar] [CrossRef]
- Yang, H.X.; Zhou, W.; Lou, C.Z. Optimal design and techno-economic analysis of a hybrid solar-wind power generation system. Appl. Energy 2009, 86, 163–169. [Google Scholar] [CrossRef]
- Ekren, O.; Ekren, B.Y.; Ozerdem, B. Break-even analysis and size optimization of a PV/wind hybrid energy conversion system with battery storage—A case study. Applied Energy 2009, 86, 1043–1054. [Google Scholar] [CrossRef] [Green Version]
- Dihrab, S.S.; Sopian, K. Electricity generation of hybrid PV/wind systems in Iraq. Renew. Energy 2010, 35, 1303–1307. [Google Scholar] [CrossRef]
- Shivam, K.; Tzou, J.-C.; Wu, S.-C. Multi-Objective Sizing Optimization of a Grid-Connected Solar–Wind Hybrid System Using Climate Classification: A Case Study of Four Locations in Southern Taiwan. Energies 2020, 13, 2505. [Google Scholar] [CrossRef]
- Al-Karaghouli, A.; Kazmerski, L.L. Optimization and life-cycle cost of health clinic PV system for a rural area in southern Iraq using HOMER software. Sol. Energy 2010, 84, 710–714. [Google Scholar] [CrossRef]
- Khan, M.J.; Iqbal, M.T. Pre-feasibility study of stand-alone hybrid energy systems for applications in Newfoundland. Renew. Energy 2005, 30, 835–854. [Google Scholar] [CrossRef]
- Zandi, M.; Bahrami, M.; Eslami, S.; Gavagsaz-Ghoachani, R.; Payman, A.; Phattanasak, M.; Nahid-Mobarakeh, B.; Pierfederici, S. Evaluation and comparison of economic policies to increase distributed generation capacity in the Iranian household consumption sector using photovoltaic systems and RETScreen software. Renew. Energy 2017, 107, 215–222. [Google Scholar] [CrossRef]
- Owolabi, A.B.; Nsafon, B.E.K.; Roh, J.W.; Suh, D.; Huh, J.-S. Validating the techno-economic and environmental sustainability of solar PV technology in Nigeria using RETScreen Experts to assess its viability. Sustain. Energy Technol. Assess. 2019, 36, 100542. [Google Scholar] [CrossRef]
- Bakić, V.; Pezo, M.; Stevanović, Ž.; Živković, M.; Grubor, B. Dynamical simulation of PV/Wind hybrid energy conversion system. Energy 2012, 45, 324–328. [Google Scholar] [CrossRef]
- Panayiotou, G.; Kalogirou, S.; Tassou, S. Design and simulation of a PV and a PV–Wind standalone energy system to power a household application. Renew. Energy 2012, 37, 355–363. [Google Scholar] [CrossRef]
- Zappa, W.; van den Broek, M. Analysing the potential of integrating wind and solar power in Europe using spatial optimisation under various scenarios. Renew. Sustain. Energy Rev. 2018, 94, 1192–1216. [Google Scholar] [CrossRef]
- Nguyen, H.T.; Safder, U.; Nguyen, X.Q.N.; Yoo, C. Multi-objective decision-making and optimal sizing of a hybrid renewable energy system to meet the dynamic energy demands of a wastewater treatment plant. Energy 2020, 191, 18. [Google Scholar] [CrossRef]
- Sinha, S.; Chandel, S.S. Review of software tools for hybrid renewable energy systems. Renew. Sustain. Energy Rev. 2014, 32, 192–205. [Google Scholar] [CrossRef]
- Mazzeo, D.; Baglivo, C.; Matera, N.; Congedo, P.M.; Oliveti, G. A novel energy-economic-environmental multi-criteria decision-making in the optimization of a hybrid renewable system. Sust. Cities Soc. 2020, 52, 101780. [Google Scholar] [CrossRef]
- Meng, S.; Sun, R.; Guo, F. Does the use of renewable energy increase carbon productivity?—An empirical analysis based on data from 30 provinces in China. J. Clean Prod. 2022, 365, 132647. [Google Scholar] [CrossRef]
- Zhou, N.; Price, L.; Yande, D.; Creyts, J.; Khanna, N.; Fridley, D.; Lu, H.; Feng, W.; Liu, X.; Hasanbeigi, A.; et al. A roadmap for China to peak carbon dioxide emissions and achieve a 20% share of non-fossil fuels in primary energy by 2030. Appl. Energy 2019, 239, 793–819. [Google Scholar] [CrossRef]
- Energy Research Institute of National Development and Reform Commission. China 2050 High Renewable Energy Penetration Scenario and Roadmap Study; Energy Research Institute of National Development and Reform Commission: Beijing, China, 2015. [Google Scholar]
- Liu, L.; Wang, Z.; Wang, Y.; Wang, J.; Chang, R.; He, G.; Tang, W.; Gao, Z.; Li, J.; Liu, C.; et al. Optimizing wind/solar combinations at finer scales to mitigate renewable energy variability in China. Renew. Sustain. Energy Rev. 2020, 132, 110151. [Google Scholar] [CrossRef]
- He, C.; Liu, J.; Xu, F.; Zhang, T.; Chen, S.; Sun, Z.; Zheng, W.; Wang, R.; He, L.; Feng, H.; et al. Improving solar radiation estimation in China based on regional optimal combination of meteorological factors with machine learning methods. Energy Convers. Manag. 2020, 220, 113111. [Google Scholar] [CrossRef]
- Ren, G.; Wan, J.; Liu, J.; Yu, D. Characterization of wind resource in China from a new perspective. Energy 2019, 167, 994–1010. [Google Scholar] [CrossRef]
- Feng, Y.; Que, L.; Feng, J. Spatiotemporal characteristics of wind energy resources from 1960 to 2016 over China. Atmos. Ocean. Sci. Lett. 2020, 13, 136–145. [Google Scholar] [CrossRef] [Green Version]
- He, G.; Kammen, D.M. Where, when and how much solar is available? A provincial-scale solar resource assessment for China. Renew. Energy 2016, 85, 74–82. [Google Scholar] [CrossRef] [Green Version]
- Fry, B. Simulation of Grid-Tied Building Integrated Photovoltaic Systems. Master’s Thesis, Solar Energy Laboratory, University of Wisconsin, Madison, WI, USA, 1999. [Google Scholar]
- White, F. Fluid Mechanics, 3rd ed.; Mc Graw Hill: New York, NY, USA, 1994. [Google Scholar]
- Putnam, P.C.; Gerald, W.K. Putnam’s Power from the Wind, 2nd ed.; Van Nostrand Reinhold Company: New York, NY, USA, 1982. [Google Scholar]
- Guangzhou Infinite Windpower Generator Manufacture Co., Ltd. Available online: http://23395.china-nengyuan.com/ (accessed on 1 July 2022).
- Kebede, A.A.; Coosemans, T.; Messagie, M.; Jemal, T.; Behabtu, H.A.; Van Mierlo, J.; Berecibar, M. Techno-economic analysis of lithium-ion and lead-acid batteries in stationary energy storage application. J. Energy Storage 2021, 40, 102748. [Google Scholar] [CrossRef]
- Chen, H.; Cong, T.N.; Yang, W.; Tan, C.; Li, Y.; Ding, Y. Progress in electrical energy storage system: A critical review. Prog. Nat. Sci. 2009, 19, 291–312. [Google Scholar] [CrossRef]
- Cabello, G.M.; Navas, S.J.; Vázquez, I.M.; Iranzo, A.; Pino, F.J. Renewable medium-small projects in Spain: Past and present of microgrid development. Renew. Sustain. Energy Rev. 2022, 165, 112622. [Google Scholar] [CrossRef]
- Das, B.K.; Hoque, N.; Mandal, S.; Pal, T.K.; Raihan, M.A. A techno-economic feasibility of a stand-alone hybrid power generation for remote area application in Bangladesh. Energy 2017, 134, 775–788. [Google Scholar] [CrossRef]
- Yuan, P.; Duanmu, L.; Wang, Z.; Li, X.; Shu, H. Analysis of law of domestic electricity consumption for rural residences at some town in Chifeng under various temporal scales. J. Dalian Univ. Technol. 2020, 60, 165–173. [Google Scholar]
- Qiu, H.G.; Yan, J.B.; Li, D.W.; Han, W. Residential energy consumption in rural China: Current situation and determinants for future trend—An empirical study based on filed survey data of 4 provinces. China Soft Sci. 2015, 11, 28–38. [Google Scholar]


| Parameters | Value |
|---|---|
| Module short-circuit current at reference condition | 9.61 A |
| Module open-circuit voltage at reference condition | 38.90 V |
| Reference temperature | 298.00 K |
| Reference insolation | 1000.00 W·m−2 |
| Module voltage at max. power point and reference condition | 31.10 V |
| Module current at max. power point and reference condition | 9.01 A |
| Temperature coefficient of Isc at reference condition | 0.04%/K |
| Temperature coefficient of Voc at reference condition | −0.31%/K |
| Number of cells wired in series | 60 |
| Module temperature at NOCT | 319.00 K |
| Ambient temperature at NOCT | 293.00 K |
| Insolation at NOCT | 800.00 W·m−2 |
| Module area | 1.46 m2 |
| Module transmittance–absorptance product | 0.95 |
| Semiconductor bandgap | 1.12 |
| Type | Parameters | Value |
|---|---|---|
| MAX-1600W | Rated power | 1.60 kW |
| Cut-in wind speed | 2.50 m·s−1 | |
| Rated wind speed | 12.00 m·s−1 | |
| Diameter of blade | 2.20 m | |
| Hub height | 8.00 m | |
| MAX-800W | Rated power | 0.80 kW |
| Cut-in wind speed | 2.00 m·s−1 | |
| Rated wind speed | 12.00 m·s−1 | |
| Diameter of blade | 1.80 m | |
| Hub height | 8.00 m | |
| MINI-400W | Rated power | 0.40 kW |
| Cut-in wind speed | 2.00 m·s−1 | |
| Rated wind speed | 12.00 m·s−1 | |
| Diameter of blade | 1.16 m | |
| Hub height | 8.00 m |
| Parameters | Value |
|---|---|
| Cell energy capacity | 200.00 Ah |
| Charging efficiency | 0.90 |
| Max. current per cell charging | 37.70 A |
| Max. current per cell discharging | −37.70 A |
| Rated voltage | 2.00 V |
| Max. charge voltage per cell | 2.35 V |
| Calculate discharge cutoff voltage | 1.60 A |
| Parameters | Value |
|---|---|
| Regulator efficiency | 0.90 |
| Inverter efficiency, DC to AC | 0.90 |
| Inverter efficiency, AC to DC | 0.90 |
| High limit on FSOC | 1.00 |
| Low limit on FSOC | 0.00 |
| Charge to discharge limit on FSOC | 0.30 |
| Input voltage of inverter | 24.00 V |
| Power output limit | 1.00 kW |
| No. | Name | Geographic Position | Elevation | SER | WER |
|---|---|---|---|---|---|
| 1 | Kashi | 37.83° N, 76.65° E | 1289.0 | Ⅱ | Ⅲ |
| 2 | Shache | 38.42° N, 77.24° E | 1231.0 | Ⅱ | Ⅳ |
| 3 | Andir | 37.07° N, 82.68° E | 1261.0 | Ⅰ | Ⅳ |
| 4 | Kaba-He | 48.39° N, 86.34° E | 1627.0 | Ⅰ | Ⅰ |
| 5 | Tikanlik | 39.02° N, 88.17° E | 889.0 | Ⅱ | Ⅲ |
| 6 | Lhasa | 29.68° N, 91.02° E | 3658.0 | Ⅰ | Ⅲ |
| 7 | Dunhuang | 40.14° N, 94.66° E | 1139.0 | Ⅱ | Ⅱ |
| 8 | Golmud | 36.42° N, 94.90° E | 2808.0 | Ⅰ | Ⅱ |
| 9 | Jiuquan | 39.44° N, 98.31° E | 1480.0 | Ⅱ | Ⅱ |
| 10 | Dali | 25.60° N, 100.23° E | 1990.5 | Ⅲ | Ⅲ |
| 11 | Kunming | 25.05° N, 102.72° E | 1891.4 | Ⅲ | Ⅳ |
| 12 | Lanzhou | 36.07° N, 103.82° E | 1525.0 | Ⅲ | Ⅰ |
| 13 | Chengdu | 30.67° N, 104.07° E | 505.9 | Ⅳ | Ⅳ |
| 14 | Yinchuan | 38.47° N, 106.28° E | 1111.5 | Ⅱ | Ⅰ |
| 15 | Xian | 34.27° N, 108.93° E | 396.9 | Ⅲ | Ⅲ |
| 16 | Guilin | 25.27° N, 110.30° E | 150.0 | Ⅳ | Ⅲ |
| 17 | Haikou | 20.03° N, 110.32° E | 14.1 | Ⅲ | Ⅱ |
| 18 | Guangzhou | 23.13° N, 113.27° E | 6.6 | Ⅲ | Ⅱ |
| 19 | Ganzhou | 25.83° N, 114.93° E | 109.0 | Ⅳ | Ⅳ |
| 20 | Beijing | 39.90° N, 116.40° E | 31.2 | Ⅳ | Ⅱ |
| 21 | Hailar | 49.22° N, 119.77° E | 617.0 | Ⅱ | Ⅰ |
| 22 | Shanghai | 31.23° N, 121.47° E | 4.5 | Ⅳ | Ⅰ |
| 23 | Shenyang | 41.80° N, 123.43° E | 41.6 | Ⅲ | Ⅰ |
| 24 | Qiqihar | 47.35° N, 123.95° E | 149.0 | Ⅲ | Ⅱ |
| 25 | Siping | 43.10° N, 124.22° E | 164.2 | Ⅳ | Ⅰ |
| 26 | Yanji | 42.93° N, 129.52° E | 176.8 | Ⅲ | Ⅲ |
| Installed Capacity Ratio of WT and PV | 5:1 | 3:1 | 2:1 | 1:1 | 1:2 | 1:3 | 1:5 |
|---|---|---|---|---|---|---|---|
| Number of PV modules in series | 1 | 1 | 1 | 1 | 1 | 1 | 1 |
| Number of PV modules in parallel | 2 | 3 | 4 | 6 | 8 | 9 | 10 |
| Number of wind turbines—1.60 kW | 1 | 1 | 1 | 1 | 0 | 0 | 0 |
| Number of wind turbines—0.80 kW | 1 | 1 | 0 | 0 | 1 | 1 | 0 |
| Number of wind turbines—0.40 kW | 1 | 0 | 1 | 0 | 1 | 0 | 2 |
| Type | Specification | Value |
|---|---|---|
| PV module | Module open-circuit voltage at reference condition | 21.70 V |
| Module short-circuit current at reference condition | 5.34 A | |
| Module voltage at max. power point and reference condition | 17.40 V | |
| Module current at max. power point and reference condition | 5.02 A | |
| Module area | 0.66 m2 | |
| Temperature coefficient of Isc at reference condition | 0.002 A·K−1 | |
| Temperature coefficient of Voc at reference condition | −0.082 V·K−1 | |
| Module temperature at NOCT | 320.00 K | |
| WT | Rated power | 10.00 kW |
| Rated wind speed | 13.00 m·s−1 | |
| Diameter of blade | 7.00 m |
| SER WER | Ⅳ <5040 MJ/(m2·a) | Ⅲ 5040~6300 MJ/(m2·a) | Ⅱ 6300~6660 MJ/(m2·a) | Ⅰ >6660 MJ/(m2·a) |
|---|---|---|---|---|
| Ⅰ 3.0~3.5 m/s | 5:1 | 5:1/3:1 | 5:1/3:1/2:1 | 5:1/3:1/2:1/1:1 |
| Ⅱ 2.5~3.0 m/s | 3:1/2:1 | 1:1 | 1:1/1:2 | 1:2 |
| Ⅲ 2.0~2.5 m/s | 3:1/2:1 | 1:1 | 1:2 | 1:3 |
| Ⅳ <2.0 m/s | 1:2/1:3 | 1:3 | 1:5 |
Publisher’s Note: MDPI stays neutral with regard to jurisdictional claims in published maps and institutional affiliations. |
© 2022 by the authors. Licensee MDPI, Basel, Switzerland. This article is an open access article distributed under the terms and conditions of the Creative Commons Attribution (CC BY) license (https://creativecommons.org/licenses/by/4.0/).
Share and Cite
Yang, Y.; Wei, Q.; Liu, S.; Zhao, L. Distribution Strategy Optimization of Standalone Hybrid WT/PV System Based on Different Solar and Wind Resources for Rural Applications. Energies 2022, 15, 5307. https://doi.org/10.3390/en15145307
Yang Y, Wei Q, Liu S, Zhao L. Distribution Strategy Optimization of Standalone Hybrid WT/PV System Based on Different Solar and Wind Resources for Rural Applications. Energies. 2022; 15(14):5307. https://doi.org/10.3390/en15145307
Chicago/Turabian StyleYang, Yan, Qingyu Wei, Shanke Liu, and Liang Zhao. 2022. "Distribution Strategy Optimization of Standalone Hybrid WT/PV System Based on Different Solar and Wind Resources for Rural Applications" Energies 15, no. 14: 5307. https://doi.org/10.3390/en15145307