Article

Dynamic Response of Lining Structure in a Long Tunnel with Different Adverse Geological Structure Zone Subjected to Non-Uniform Seismic Load

1
State Key Laboratory of Geomechanics and Geotechnical Engineering, Institute of Rock and Soil Mechanics, Chinese Academy of Sciences, Wuhan 430071, China
2
China Railway Eryuan Engineering Group Co., Ltd., Chengdu 610031, China
3
China State Construction International Investments (Hubei) Limited, Wuhan 430000, China
4
China State Construction International Holdings Limited, Hong Kong 999077, China
5
School of Engineering Science, University of Chinese Academy of Sciences, Beijing 100049, China
6
School of Civil Engineering, Chang’an University, Xi’an 710061, China
7
Key Laboratory of Roads and Railway Engineering Safety Control of Ministry of Education, Shijiazhuang Tiedao University, Shijiazhuang 050043, China
*
Authors to whom correspondence should be addressed.
Energies 2022, 15(13), 4599; https://doi.org/10.3390/en15134599
Submission received: 23 May 2022 / Revised: 15 June 2022 / Accepted: 20 June 2022 / Published: 23 June 2022
(This article belongs to the Topic Support Theory and Technology of Geotechnical Engineering)

Abstract

:
The damage of a long tunnel is found in parts with an adverse geological structure zone under an earthquake. The phenomenon is normally the consequence of a non-uniform seismic load. Thus, to reveal the mechanism of the phenomenon, the dynamic response of the lining structure in a long tunnel passing through an adverse geological structure zone subjected to a non-uniform seismic load is mainly studied in this paper. Firstly, based on the random ground motion synthesis theory, the non-uniform ground motion acceleration–time history curves that reflect local site effects, such as traveling wave effects and attenuation effects, are generated. Secondly, the behavior of the tunnel with a different adverse geological structure zone (including different inclinations, thicknesses, and lithologies) under non-uniform seismic input is studied. Then, the impact of the different adverse geological structure zone on the internal force and safety factor of the tunnel lining is analyzed. Finally, the failure characteristics of the lining structure in the tunnel crossing through the adverse geological structure zone subjected to a non-uniform seismic load are revealed. The results show that the seismic dynamic responses significantly increase under non-uniform seismic input compared with the results under uniform seismic input, and the dynamic responses distribution along the tunnel axial is distinctly different under non-uniform seismic input. The inclination and thickness of the adverse geological structure zone have a significant influence on the internal force and safety factor of the tunnel lining, while the lithology mainly acts around the adverse geological structure zone. When the inclination angle of the adverse geological structure zone is 45°, a large number of compression-bending cracks appear in the entrance and exit sections of the tunnel, and the tunnel is in the most dangerous state.

1. Introduction

Since the beginning of the 21st century, with the increase in infrastructure construction projects around the world, the number of tunnel projects has gradually increased. Sometimes, tunnel engineering inevitably requires passing through adverse geological structure zones [1], especially the railway routes in the high-speed train projects. However, the part of the tunnel passing through an adverse geological structure zone is prone to structural crack and collapse under earthquakes, such as the 1995 Hanshin earthquake in Japan [2], the 1999 Taiwan Jiji earthquake in China [3,4], and the 2008 Wenchuan earthquake in China [5,6,7], which caused varied degrees of damage to the tunnels. Therefore, it is of great significance to study the dynamic response of tunnels crossing the adverse geological structure zone under an earthquake.
At present, many scholars have carried out systematic research on tunnels crossing an adverse geological structure zone and obtained lots of achievements. For influencing factors, Ardeshiri et al. [8] and Zhu [9] studied the influence of different dip angles of the adverse geological structure zone on the stability of underground caverns and tunnels and confirmed the controlling effect of dip angles of an adverse geological structure zone on underground buildings. Considering factors such as fault dip angle, fault thickness, and fault shear strength, Wang et al. [10] established a three-dimensional dynamic finite element model to evaluate the effect of faults on the seismic response of underground caverns. The results show that when the angle is about 40°, the cavern is in the most dangerous state. Wang et al. [11] counted the damage to tunnels caused by earthquakes around the world in the past 20 years and discussed the damage mechanism, influencing factors, and dynamic response of tunnels from the aspects of earthquake damage investigation, physical models, numerical analysis, and field monitoring. In terms of seismic wave input, based on seismic wave propagation theory, Li and Song [12], Qiu et al. [13], and Sun et al. [14] achieved different inclinations input of seismic waves and compared the dynamic response of the structures. The research results show that the incidence angle of seismic waves has a great influence on the dynamic response of building structures.
For large-scale tunnel projects, the length of the tunnels is greater than the seismic wavelength, and the traveling wave effect, coherence effect, and attenuation effect of the seismic wave makes the seismic damage distribution along the tunnel axial direction vary significantly. Thus, it is necessary to consider non-uniform seismic input. Huang et al. [15] studied the three-dimensional input method of SV waves and SH waves with arbitrary incidence angles based on the equivalent nodal force method combined with viscoelastic artificial boundaries. The numerical results show that the non-uniform seismic responses of long tunnels are strongly affected by an S-wave incidence angle. Sun et al. [16] analyzed the seismic response and damage characteristics of asymmetric loess-covered shallow tunnels under the oblique incidence of seismic SV waves by the finite element method. The research reveals that the plastic zone increases and develops toward the slope surface when the slope angle increases. In terms of physical model experiments, Yu et al. [17,18,19] took the sub-sea tunnel section of the Hong Kong–Zhuhai–Macao Bridge as an example and analyzed the structural deformation of a long tunnel under a non-uniform earthquake through a multi-point shaking table test. Han et al. [20] and Chen et al. [21] also studied the influence of non-uniform seismic input on underground shallow buried pipelines and underground integrated pipe galleries through a three-dimensional shaking table test. The above shaking table tests indicate that non-uniform ground input has an important effect on the dynamic response and safety performance of building structures. Using numerical simulation, Chen et al. [22], Yu et al. [23], and Li et al. [24] successively analyzed the seismic dynamic response of an underground pipe gallery, shield tunnel, and long immersed tunnel under non-uniform input. The results show that non-uniform ground motion cannot be ignored in tunnel safety. Fabozzi et al. [25] established a three-dimensional finite element model using PLAXIS 3D software to analyze the transverse and longitudinal deformation of the tunnel under a non-uniform seismic load. Based on the 3D time-domain boundary element method, Tarinejad et al. [26] and Isari et al. [27] compared the dynamic response and deformation displacement of dam foundations under uniform and non-uniform seismic input. In addition, the effects of the time delay and the spectral coherence function on the site’s non-uniform ground motion acceleration are analyzed. Zhou et al. [28] analyzed the spectral correlation between the surrounding rock dynamic response and input ground motion and revealed the time-space effect of the long tunnel dynamic response under non-uniform seismic input.
It can be seen that the focus of the current research on the seismic damage of a long tunnel crossing through the adverse geological structure zone is the dynamic response of the tunnel under uniform seismic input, which does not obviously match the seismic dynamic response of the actual engineering. The current research on non-uniform excitation mainly focuses on the dynamic response and deformation of inhomogeneous tunnels; it rarely considers the influence of the adverse geological structure zone on the dynamic response of the tunnel structure. Furthermore, the failure characteristics of the lining structure in a long tunnel crossing through an adverse zone under non-uniform ground motion remain far from being understood, hence the need for the present work. The rest of this manuscript is organized as follows: Firstly, the non-uniform ground motion acceleration–time history curves are produced. Secondly, the influence of different adverse geological structure zones on the internal force of the lining structure under non-uniform ground motion is studied. Then, the impact of a different adverse geological structure zone on the safety factor of tunnel lining is studied. Finally, the failure characteristics of the lining structure in the long tunnel crossing through an adverse geological structure zone subjected to non-uniform seismic load are revealed. In addition, the conclusions are drawn.

2. Numerical Model and Non-Uniform Ground Motion

As China’s Western Development Strategy continues to advance, the tunnel engineering inevitably requires passing through adverse geological structure zones, such as the Sichuan–Tibet railway. These tunnels are several kilometers in length. Due to the complex seismic environment in western China, the dynamic response of these tunnels needs to consider non-uniformity of seismic load when subjected to earthquake. However, focus of the current research on the seismic damage of long tunnel is the dynamic response of the tunnel under uniform seismic input or the dynamic response and deformation of inhomogeneous tunnels. It does not match the seismic dynamic response of the actual engineering. Thus, the main purpose of the manuscript is to study the dynamic response of lining structure of a long tunnel passing through adverse geological structure zone subjected to non-uniform seismic load and then reveal the preliminary failure characteristics of lining structure.

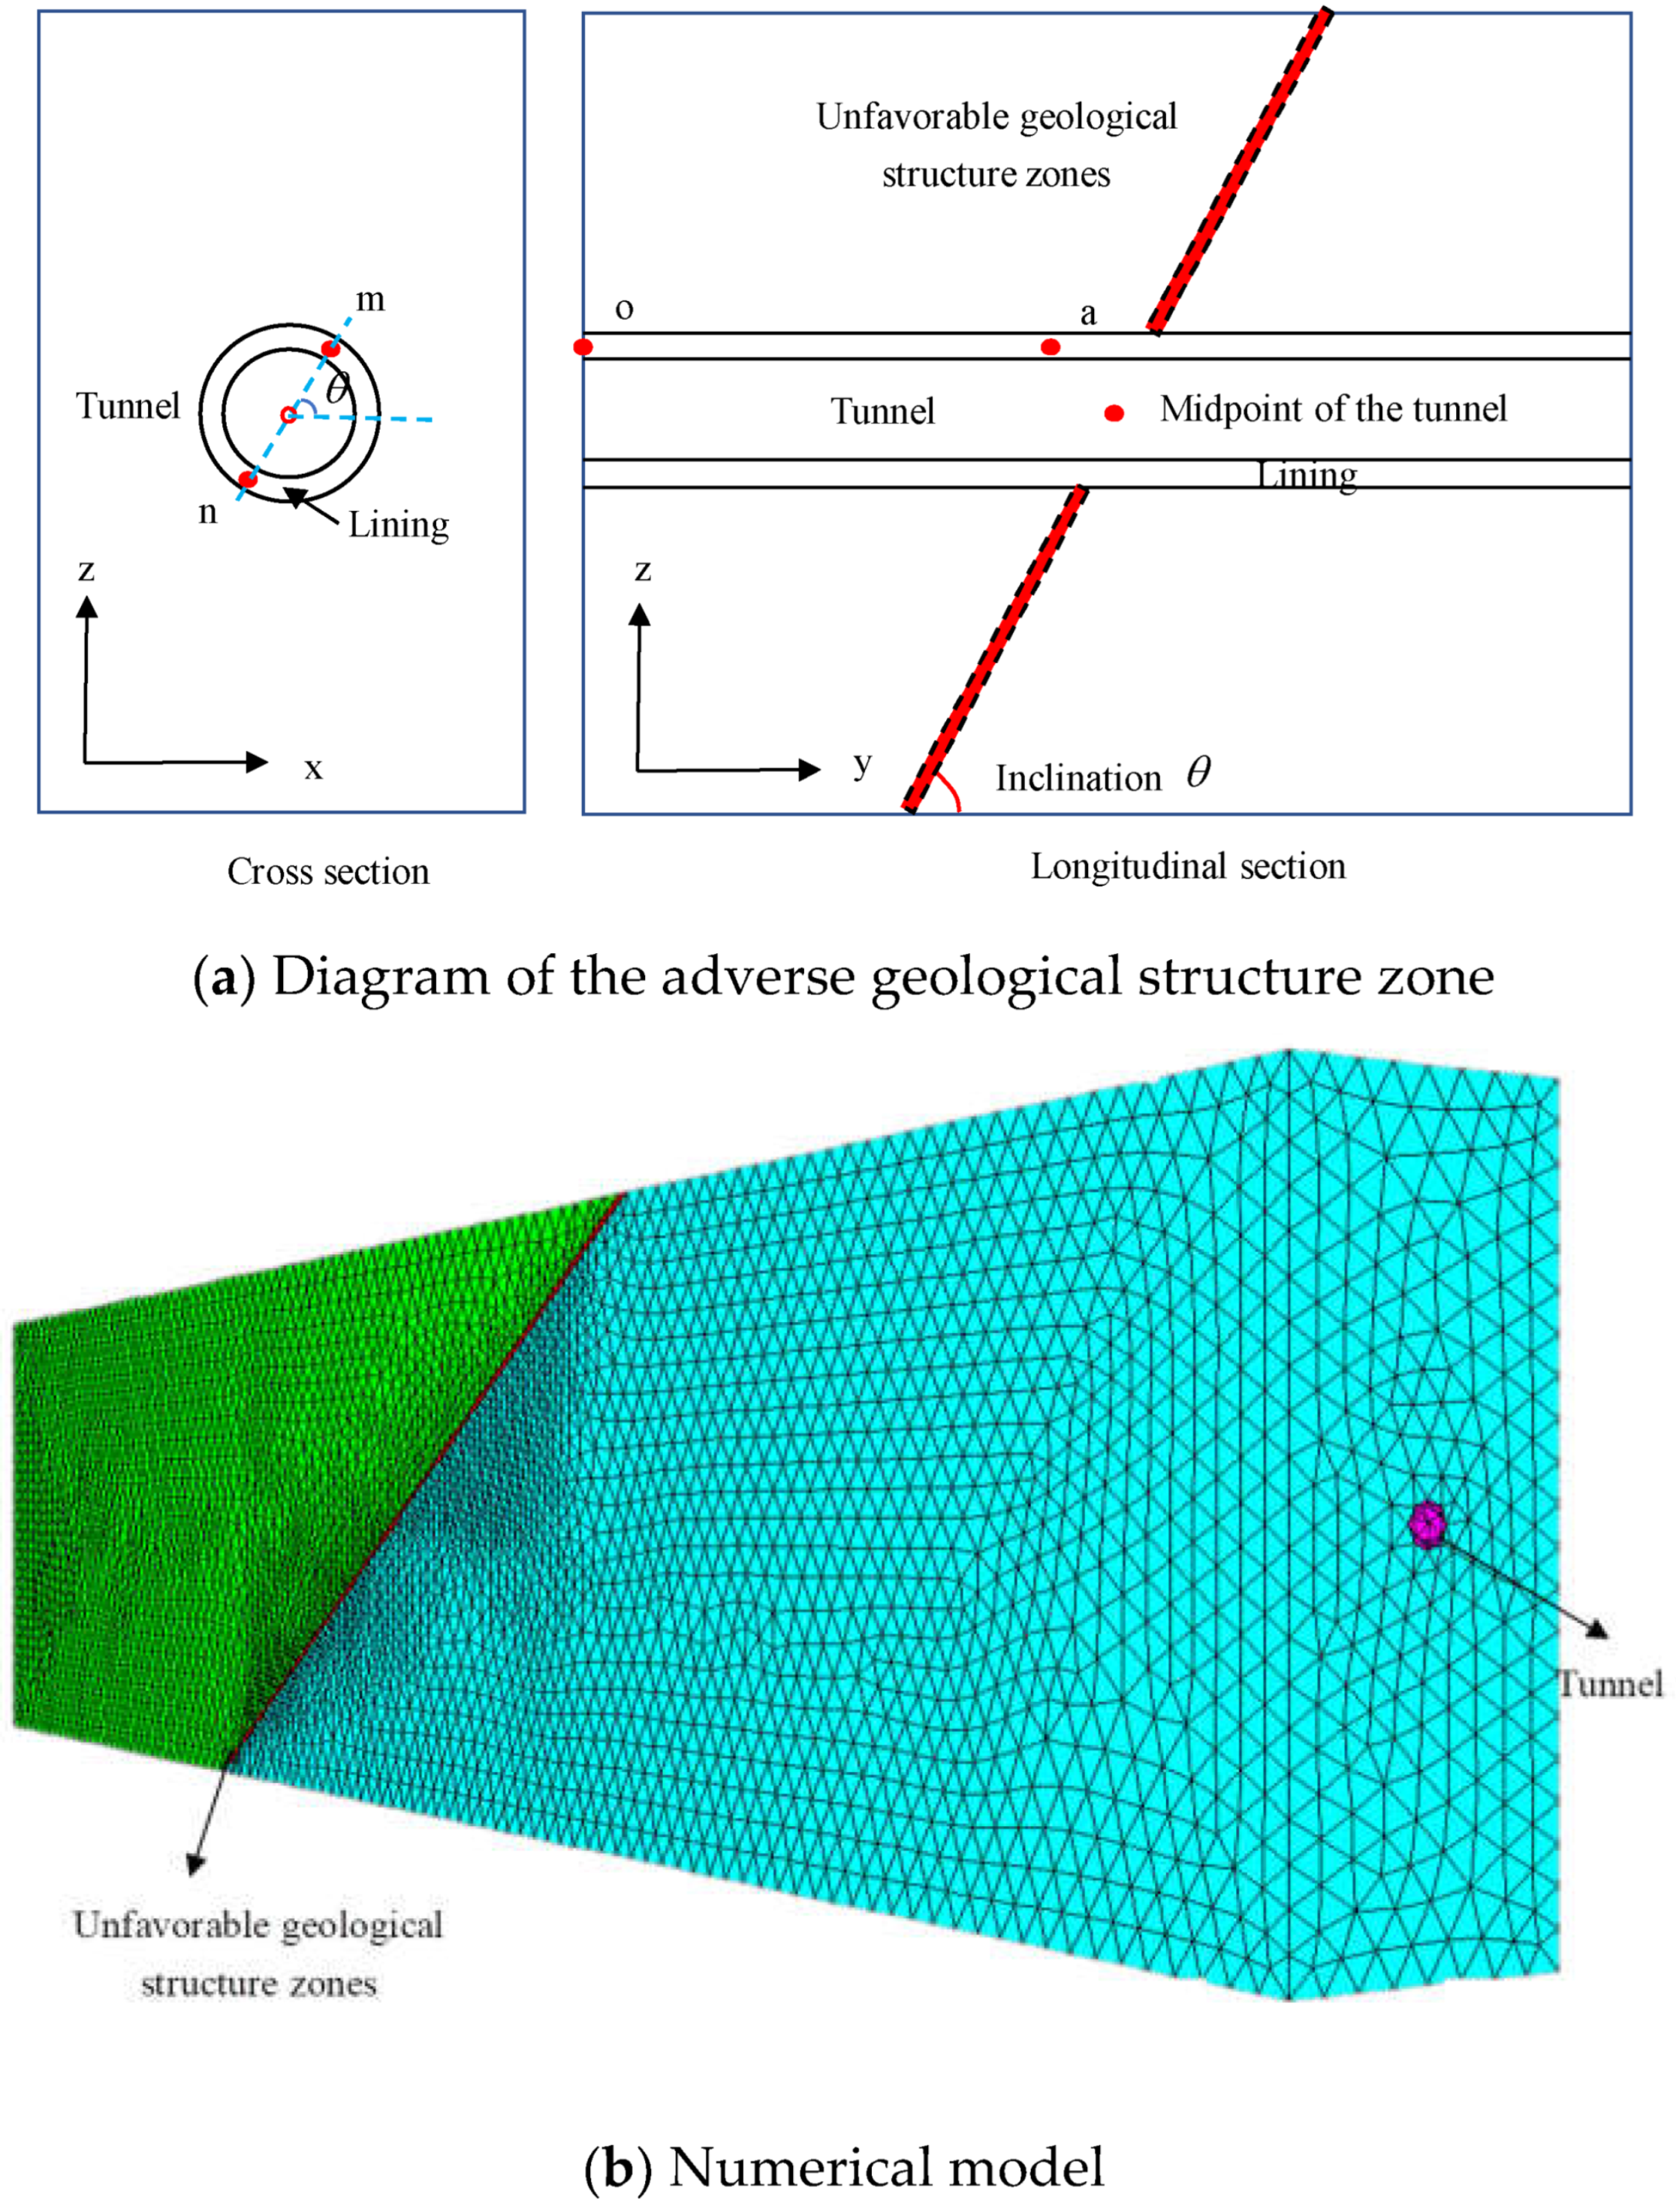
2.1. Numerical Model

The idealized numerical model of the tunnel is shown in Figure 1, with the length being 1000 m, the depth being 100 m, the diameter being 8.4 m, and the lining thickness being 1 m. The adverse geological structure zone goes through the central location of the tunnel, and the longitudinal section and cross section of the tunnel are shown in Figure 1. The vertical direction of the model is the z direction, and the tunnel axial direction is the y direction. The direction perpendicular to the axis is the x direction. The surrounding rock adopts the Mohr–Coulomb model, and the lining structure is simulated by solid elements. A contact surface is set between the surrounding rock and the lining [29]. In order to absorb the scattered waves generated by the seismic wave at the truncated boundary, a free-field boundary is set around the model, and a viscous boundary is set at the bottom. Damping adopts Rayleigh damping (critical damping ratio is 0.05). The physical and mechanical parameters of the material are shown in Table 1.

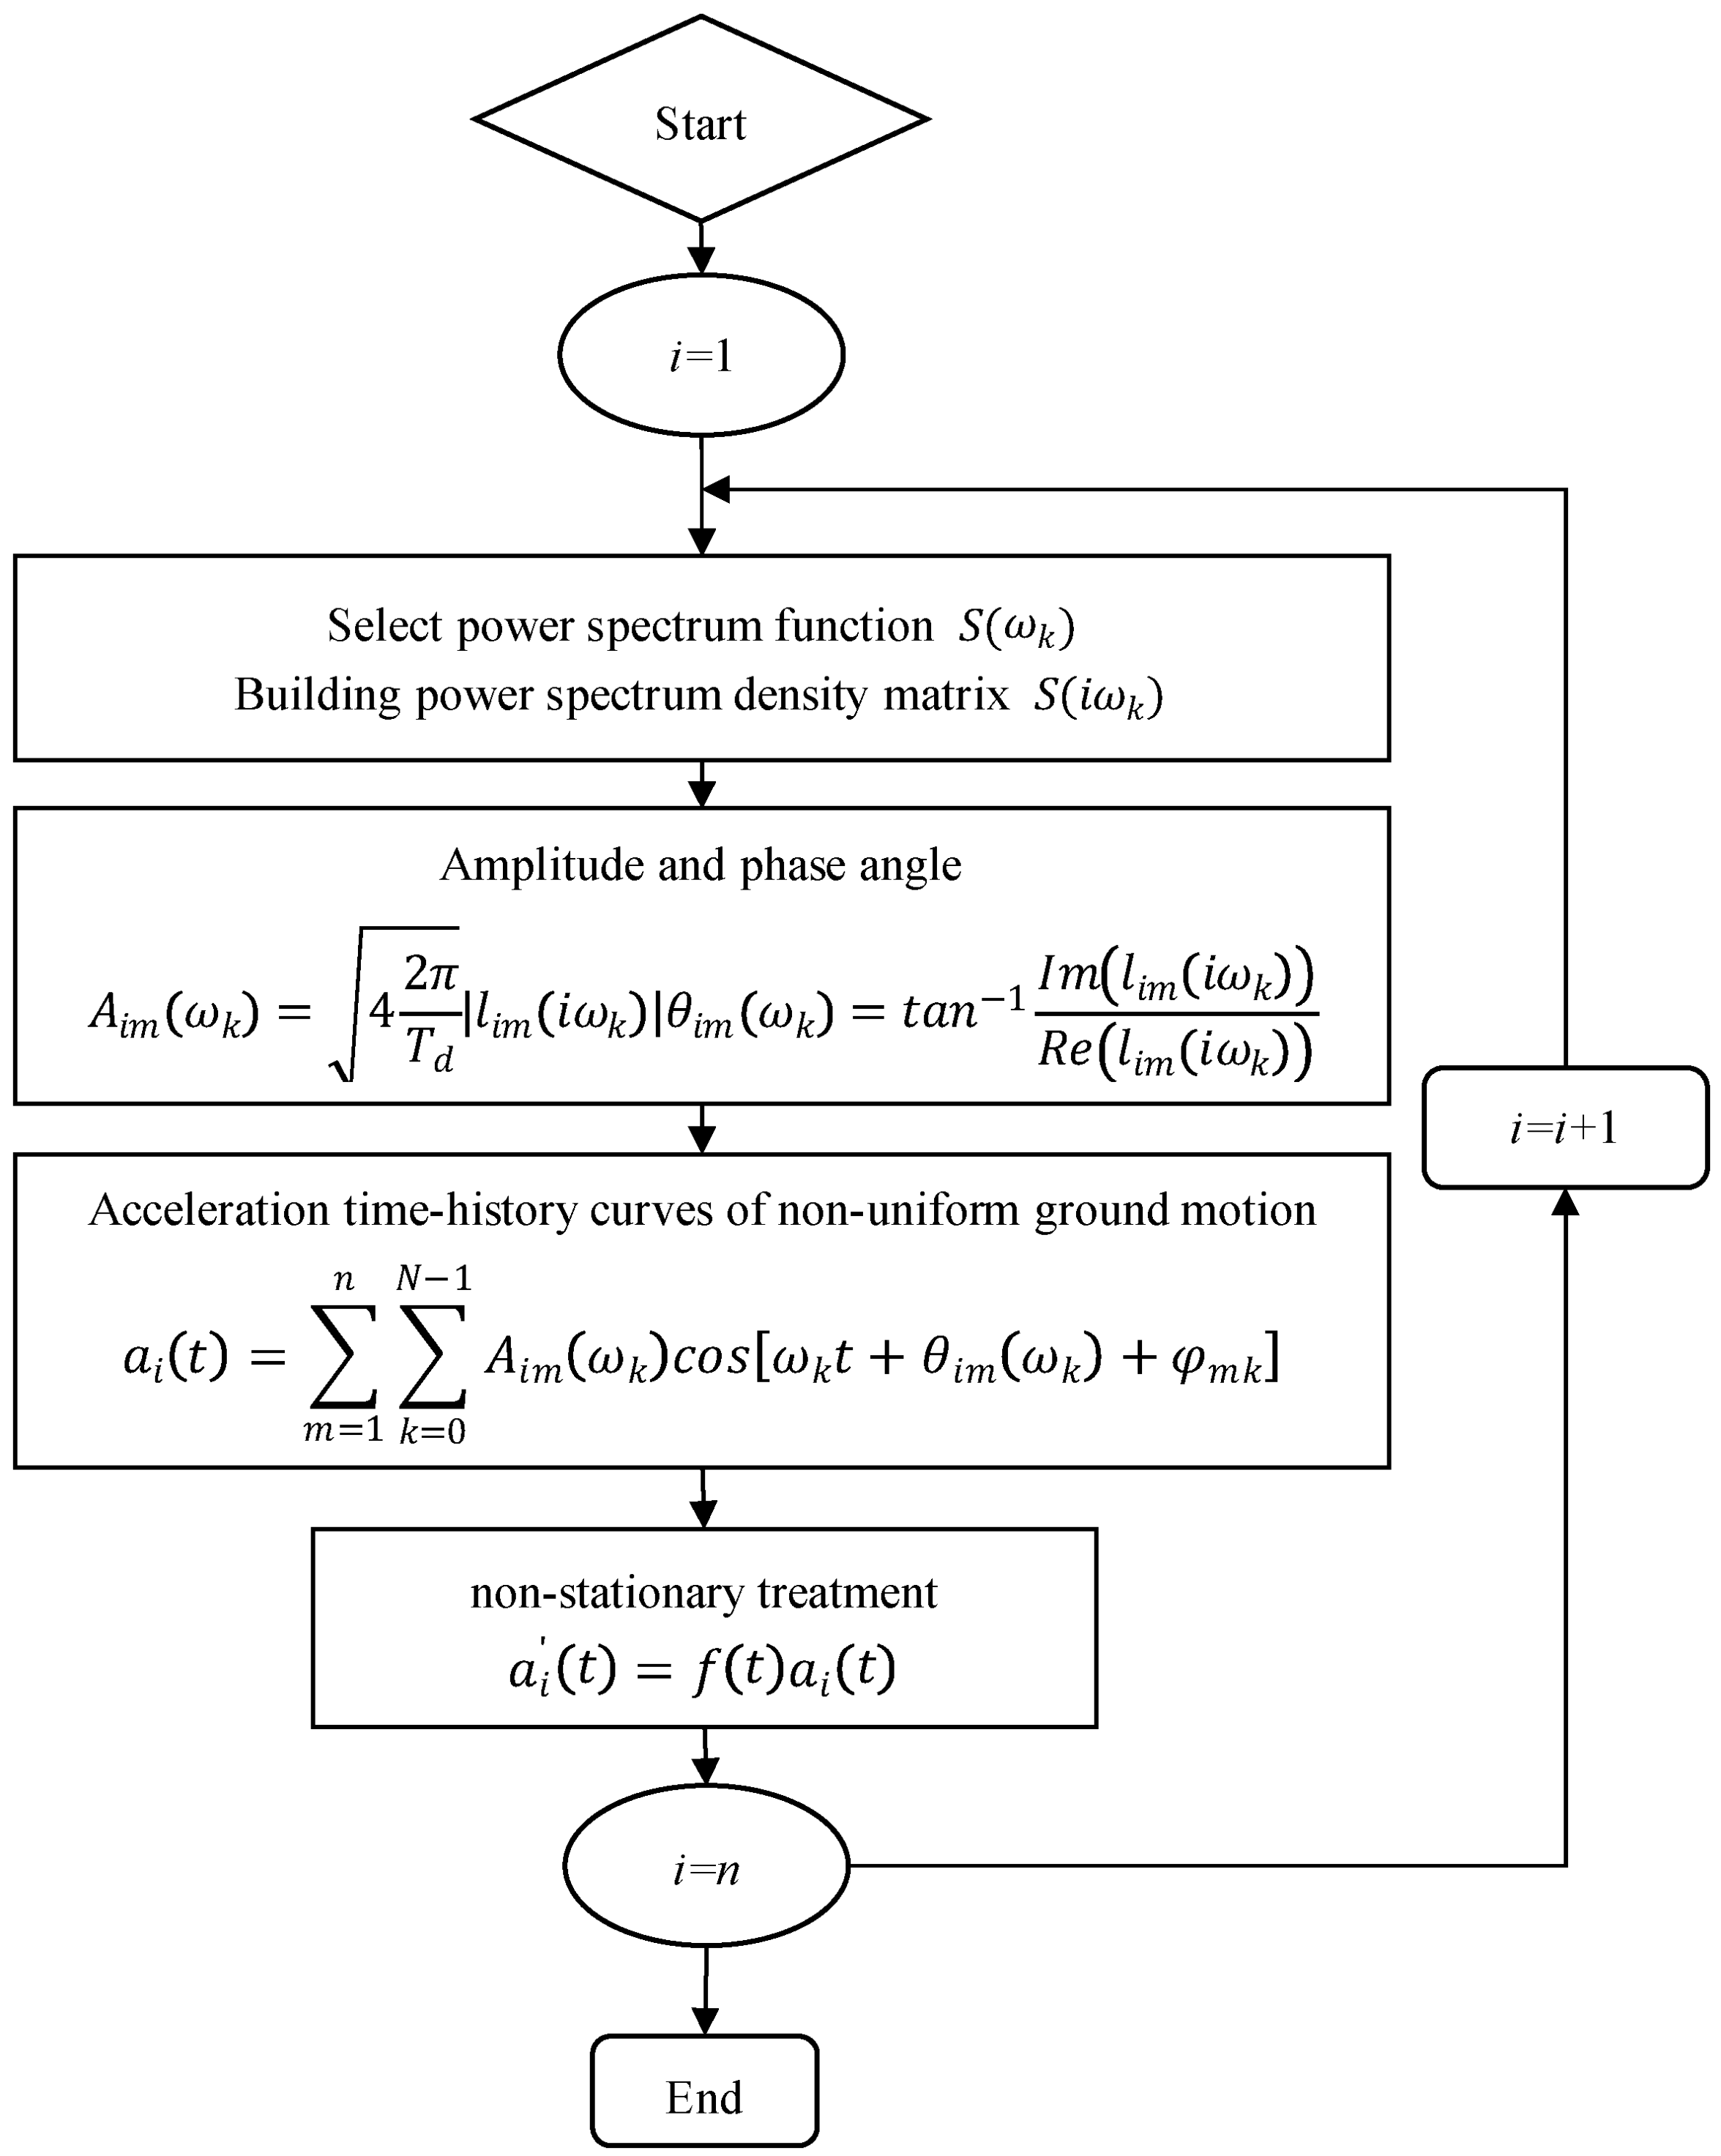
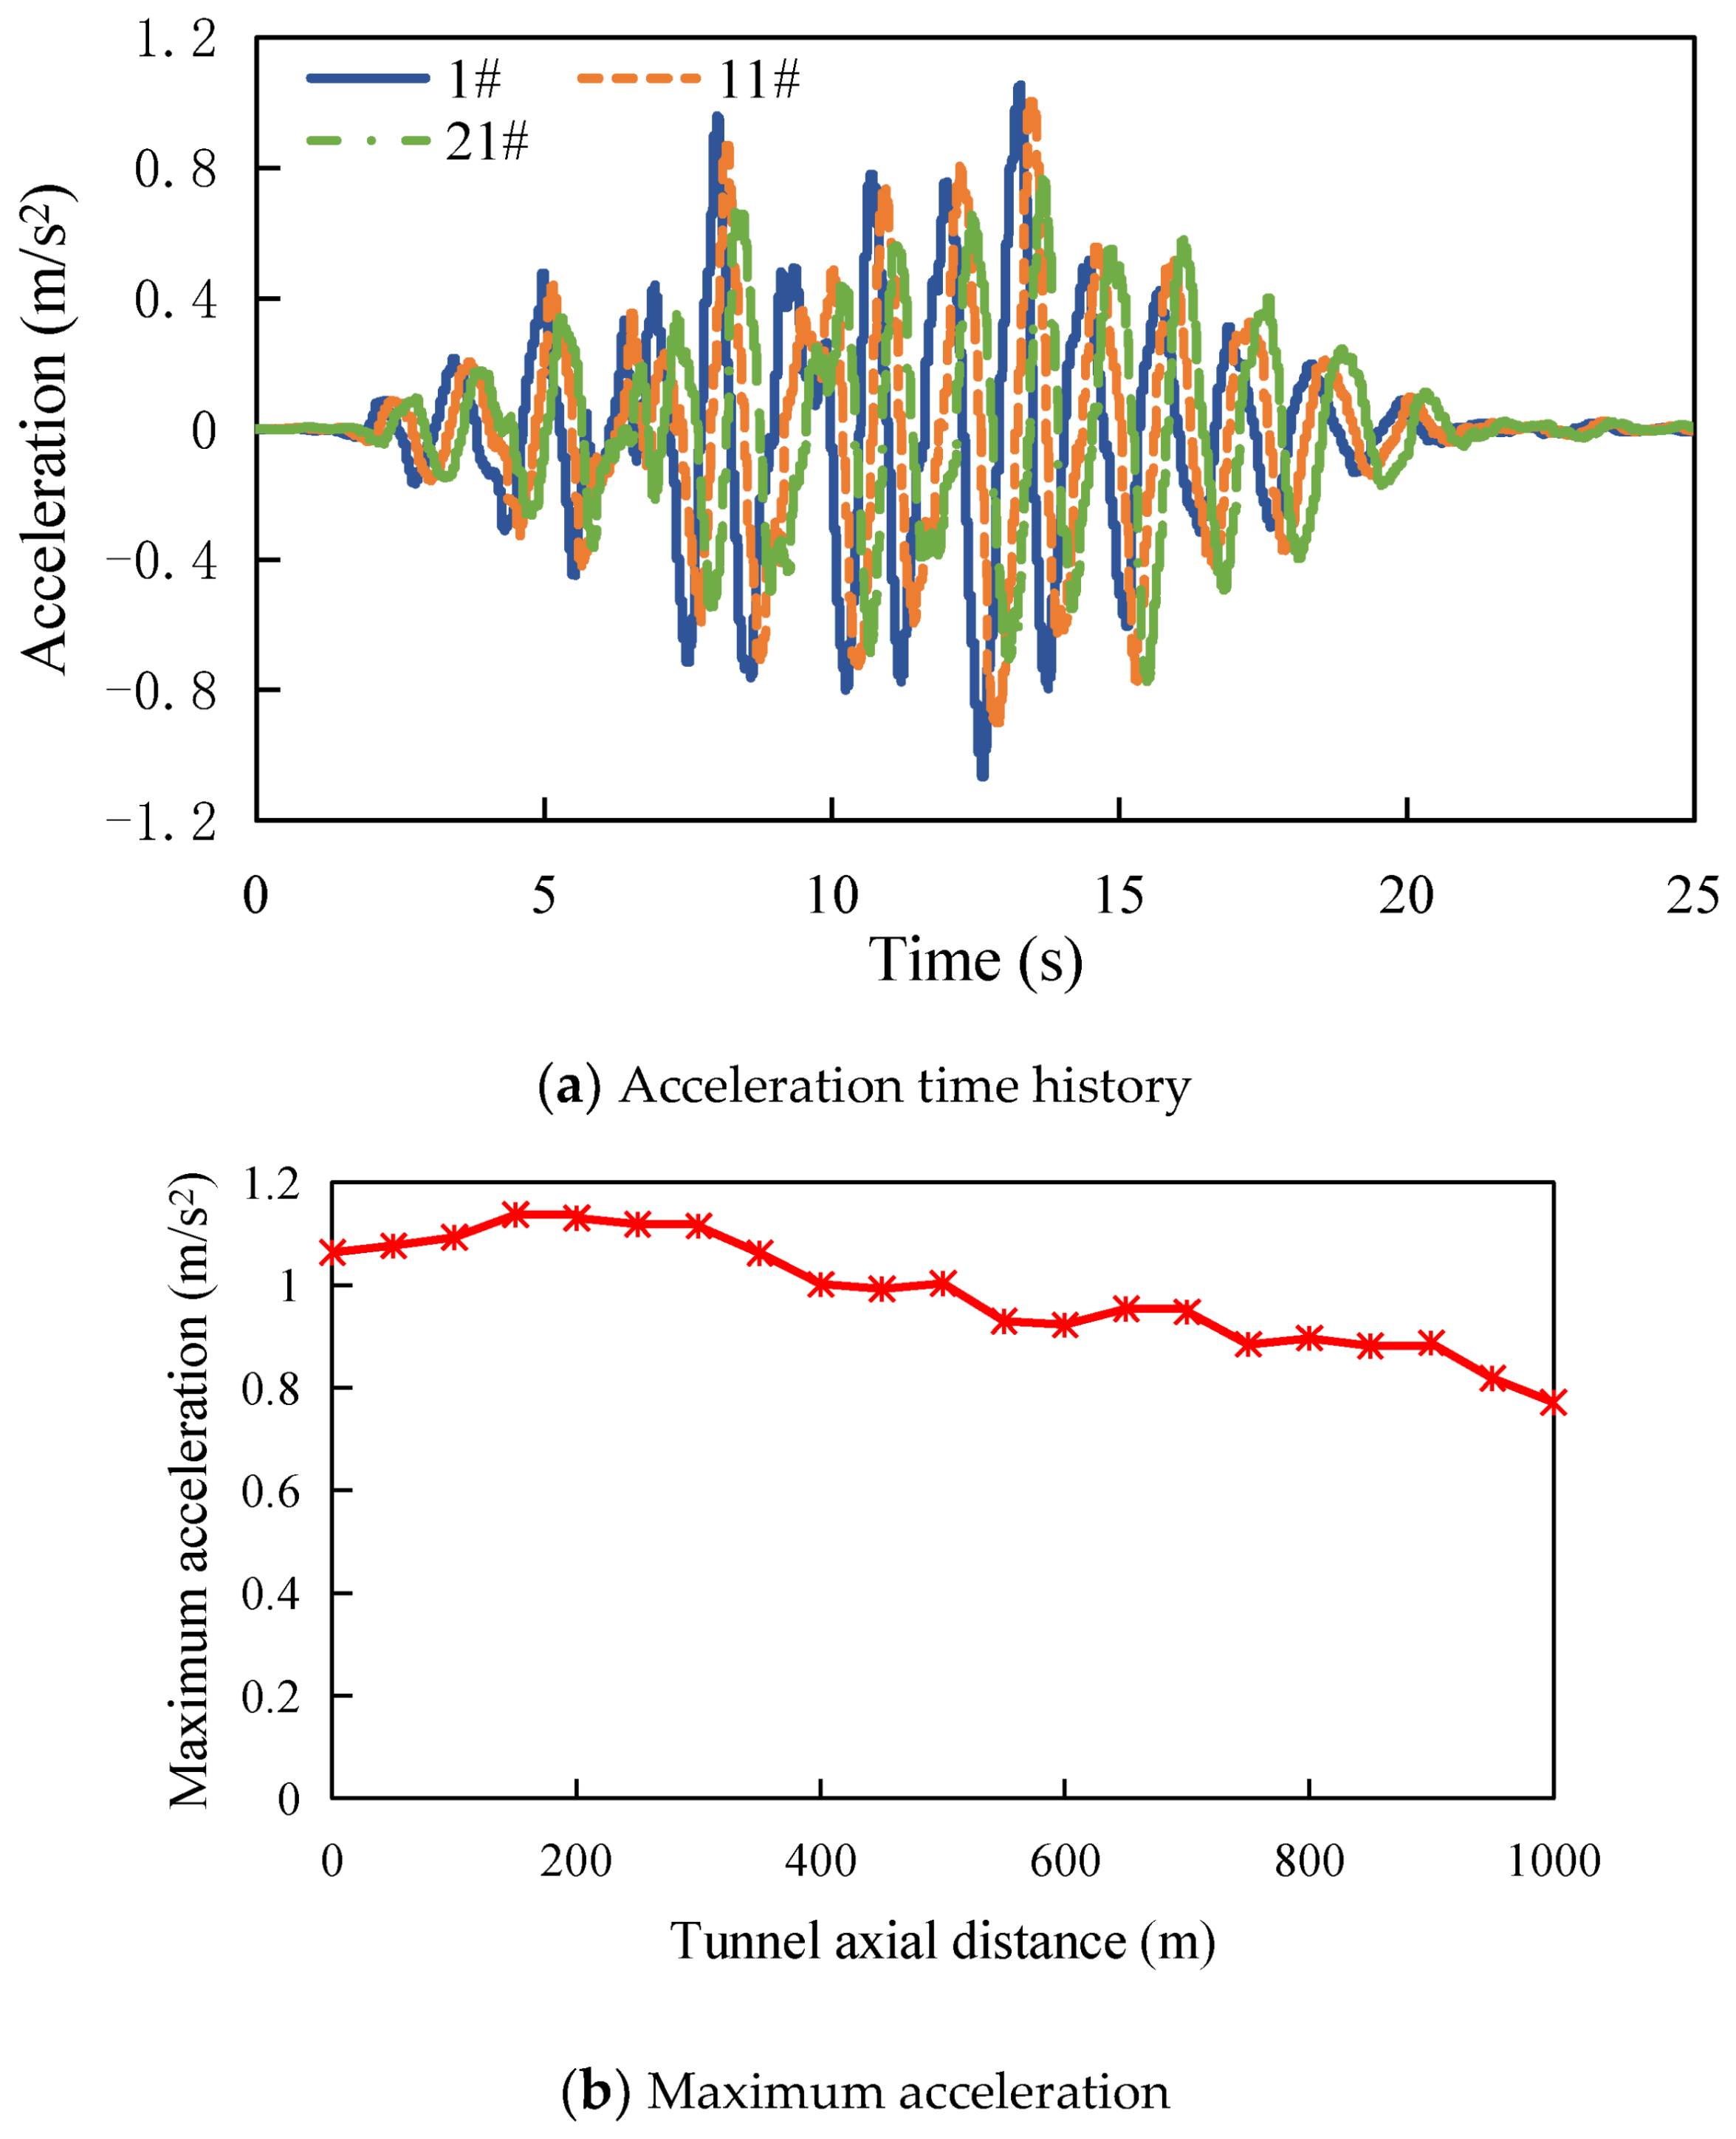
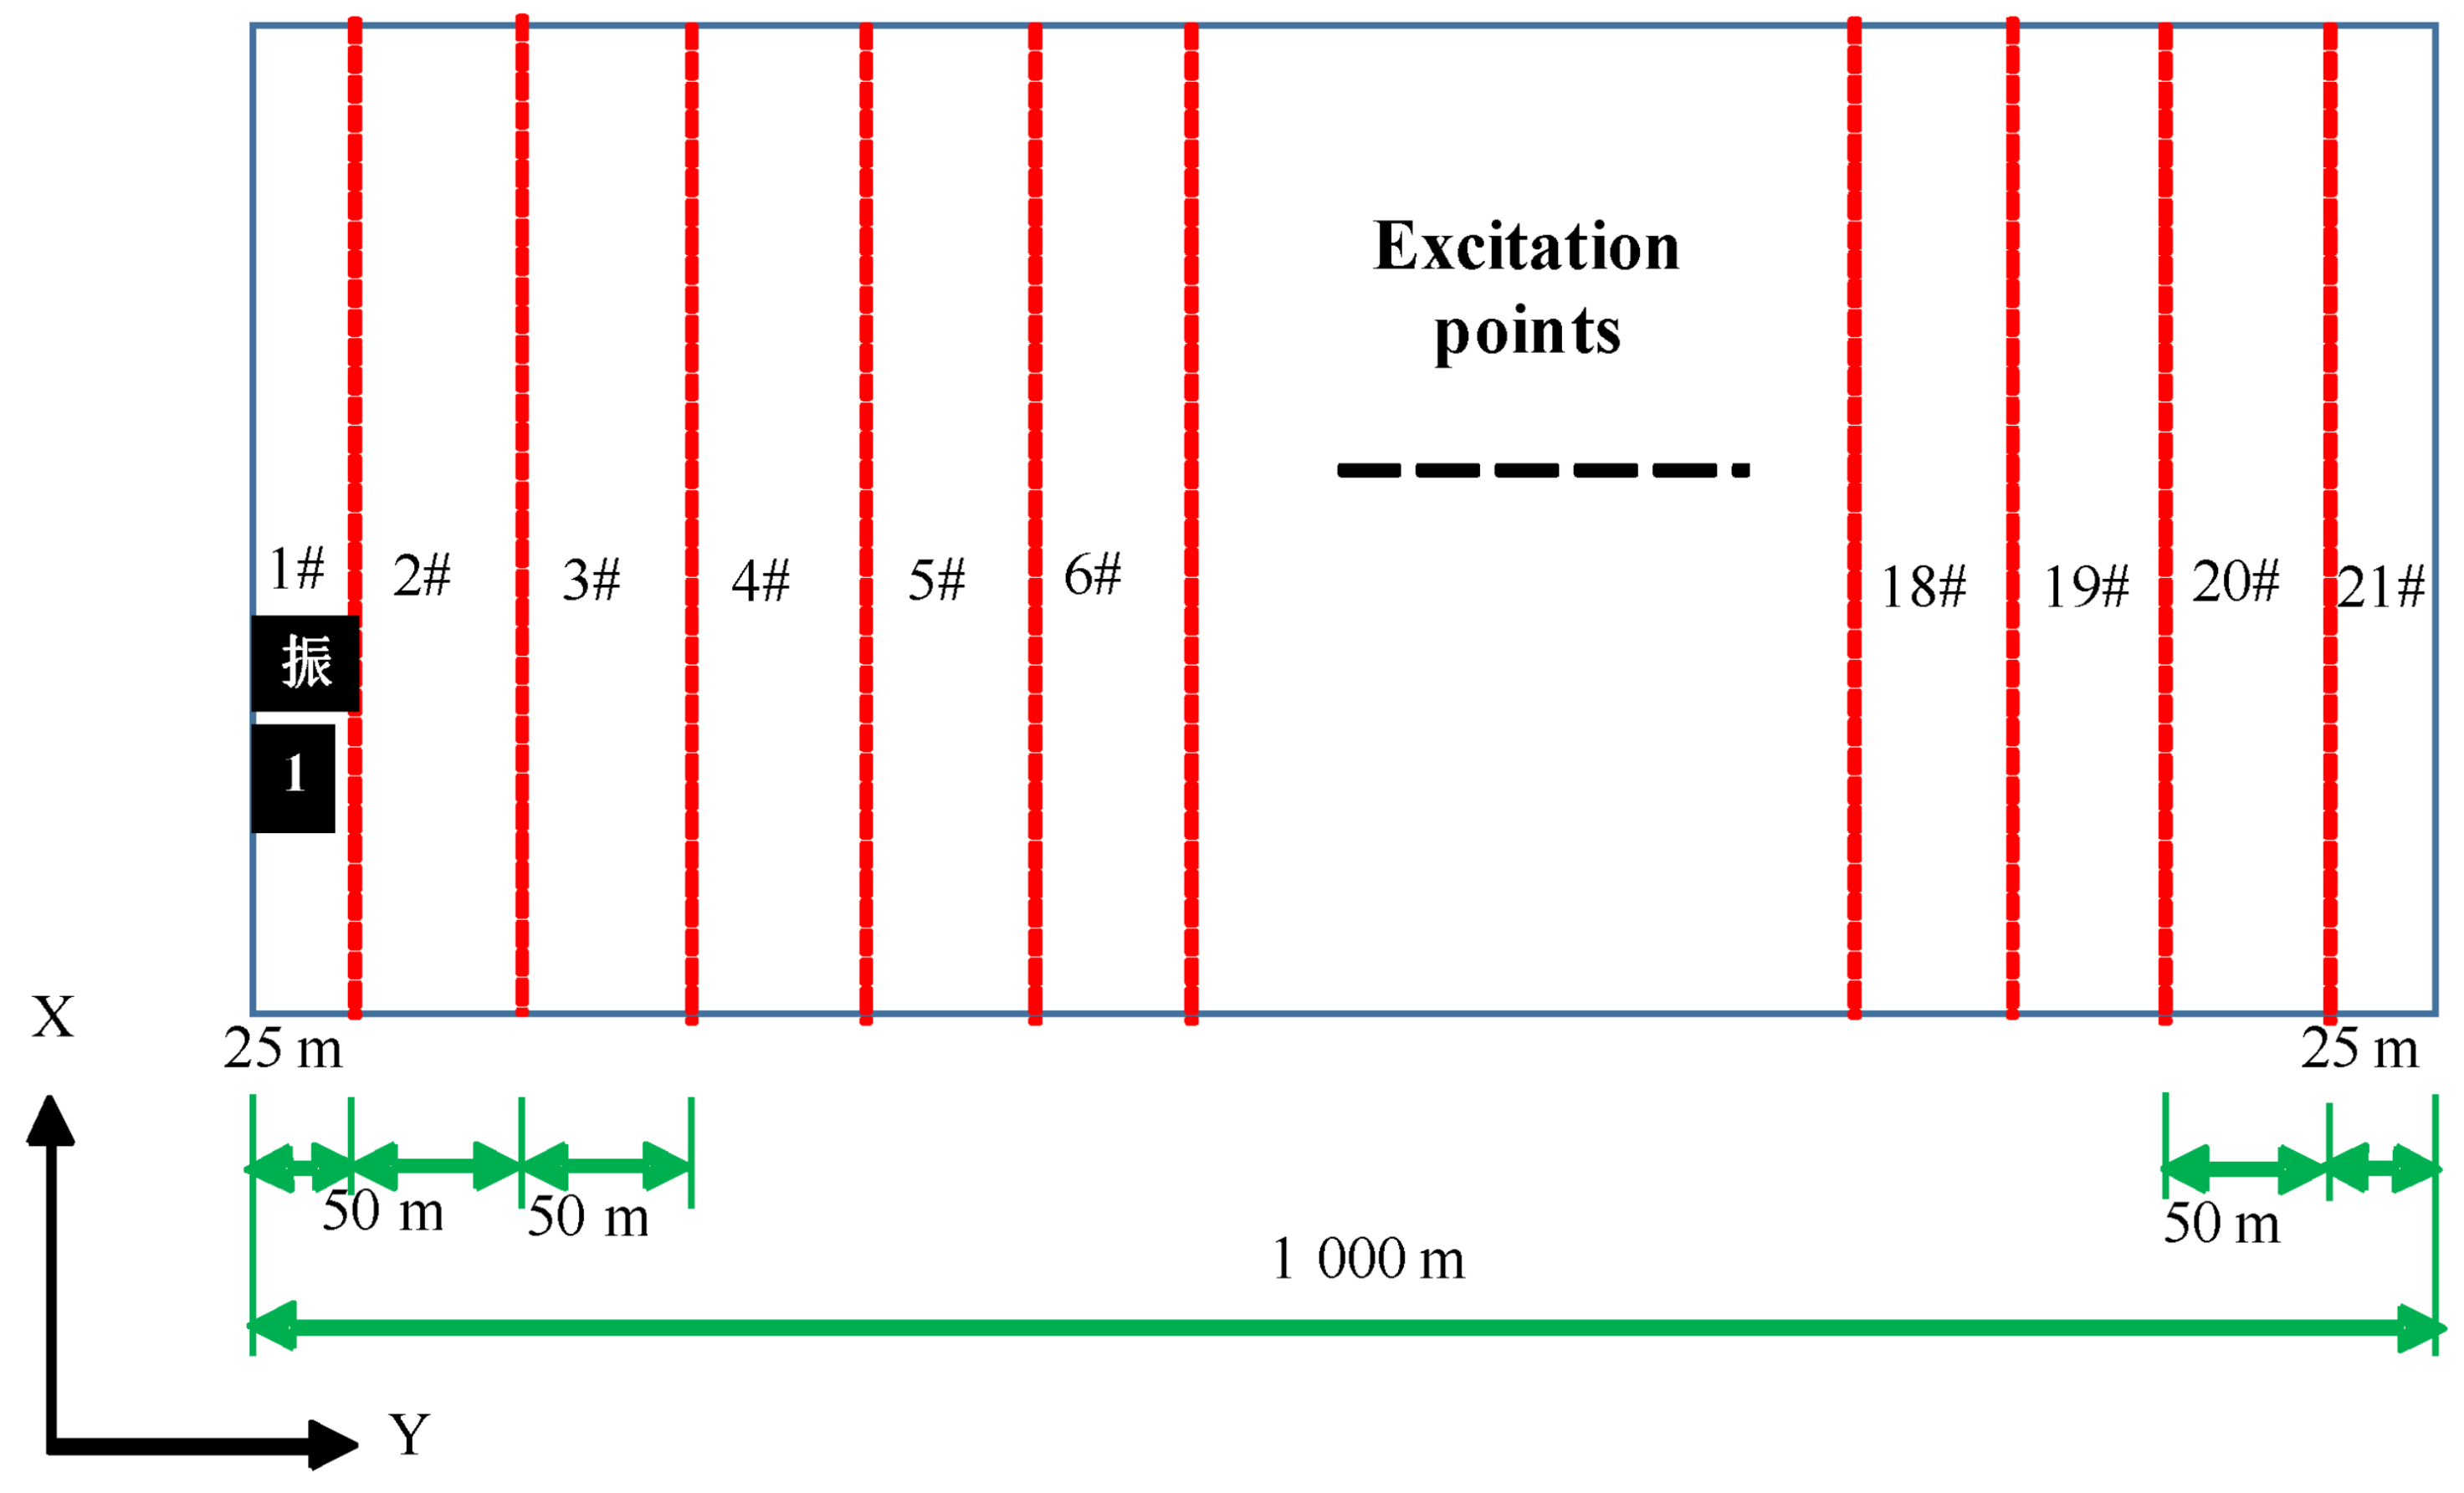
2.2. Non-Uniform Acceleration–Time History Curves

The synthesis method for the generation of non-uniform seismic waves can describe the spectral characteristics of seismic waves and synthesize the multi-point ground motion time history in the time domain, which well considers the spatial inconsistency of ground motion. Thus, the method is adopted in the manuscript. Based on the method, the acceleration at excitation point i-th can be calculated
a i t = m = 1 n k = 0 N 1 A i m ω k cos ω k t + θ i m ω k + φ m k
ω k = k 2 π T d
where A i m ω k and θ i m ω k stand for the amplitude and phase angle, respectively. m is excitation point. ω k is the k-th circular frequency. φ m k is the random phase angle. T d represents the duration. In addition, the flow chart of synthesis method for non-uniform ground motion acceleration is shown in Figure 2. The function of f t in Figure 2 means intensity envelope function, and its function is to deal with the non-stationarity of the ground motion process. It can be written as
f t = t t 1 2   ,   t t 1 1   ,   t 1   t t 2 e c t t 2   ,   t > t 2
where t 1 and t 2 are the time at which the peak of the seismic wave arrives and ends. c is the attenuation coefficient that controls the amplitude of the peak attenuation. The value of these parameters is referred to in the literature [6].
The self-power spectrum S ω in Figure 2 adopts the Kanai Tajimi spectrum, and the expression is
S ω = ω 6 ω 6 + ω c 6 1 + 4 ξ g 2 ω 2 ω g 2 1 ω 2 ω g 2 2 + 4 ξ g 2 ω 2 ω g 2 S 0
where ω c , ω g , ξ g and S 0 are all spectral-related parameters. The value of these parameters is also referred to in the literature [6].
In order to simplify the calculation, it is assumed that the ground motion acceleration time-history input at the bottom of the model within a range of 50 m is consistent. Therefore, based on displacement benchmark checking, there are 21 acceleration–time history curves generated. Figure 3a is the acceleration–time history curves of the excitation points 1#, 11#, and 21#. It can be seen from the figure that the waveform of the acceleration time history of each excitation point is similar. The time history shows a delay effect, and the peak acceleration is gradually reduced, as shown in Figure 3b. Therefore, the generated acceleration–time history curves can show the wave-passage effect and attenuation effect. Because the axial direction of the tunnel is the y direction, the ground motion is the y direction, and the input method adopts vertical input, as shown in Figure 4.

2.3. Analysis Plan

In order to study the influence of the adverse geological structure zone on dynamic response of lining structure in the long tunnel under non-uniform seismic input, different adverse geological structure zones are designed, including different inclinations, thicknesses, and lithologies, as shown in Table 2. Four thicknesses of the adverse zone are set, and they are 0 m, 0.5 m, 5 m, and 20 m, respectively. In addition, three inclinations are designed, including 30°, 45°, and 90°. There are four lithologies of the adverse geological structure zone and they are type III, medium IV, poor IV, and V rock.The parameters of the adverse zone with different lithologies are shown in Table 3. It needs to be noted that there is no adverse geological structure zone when the lithology of the adverse zone is type III rock, because the lithology of the adverse zone is the same as that of the surrounding rock.

3. Internal Force of Lining Structure

3.1. Internal Force Calculation of Lining Structure

In the numerical model, the lining adopts solid elements; thus, transformations are required for calculating the bending moment and shear force of the lining. Assuming that the lining is divided into two layers of elements, the coordinates of the centroids of the two layers of elements in any cross section are ( x 1 , z 1 ) and ( x 2 , z 2 ), respectively. Then, the angle between the lining section and the horizontal plane of the centroids of the two layers of elements is
α = arctan z 2 z 1 x 2 x 1
In addition, the normal stress σ n and tangential stress τ of the centroids at the layers of elements are
σ n = σ x cos 2 α + σ z sin 2 α + σ x z sin 2 α
τ n = 1 2 σ z σ x sin 2 α + σ x z cos 2 α
where σ x , σ z , and σ x z are the normal and shear stresses in the x and z directions at the centroid of the element, respectively. Assuming that the normal stress and shear stress between the two layers of elements are distributed linearly, the normal stress and shear stress on both sides of the section are
σ 1 = 1.5 σ n 1 + σ n 2
σ 2 = 0.5 σ n 1 + σ n 2
τ 1 = 1.5 τ n 1 + τ n 2
τ 2 = 0.5 τ n 1 + τ n 2
According to the compression-bending combination calculation formula of material mechanics, the bending moment and shear force on the lining section can be given as
M = b h 2 σ 1 σ 2 12
Q = b h τ 1 + τ 2 2
where b and h are the width and thickness of the lining in the section.

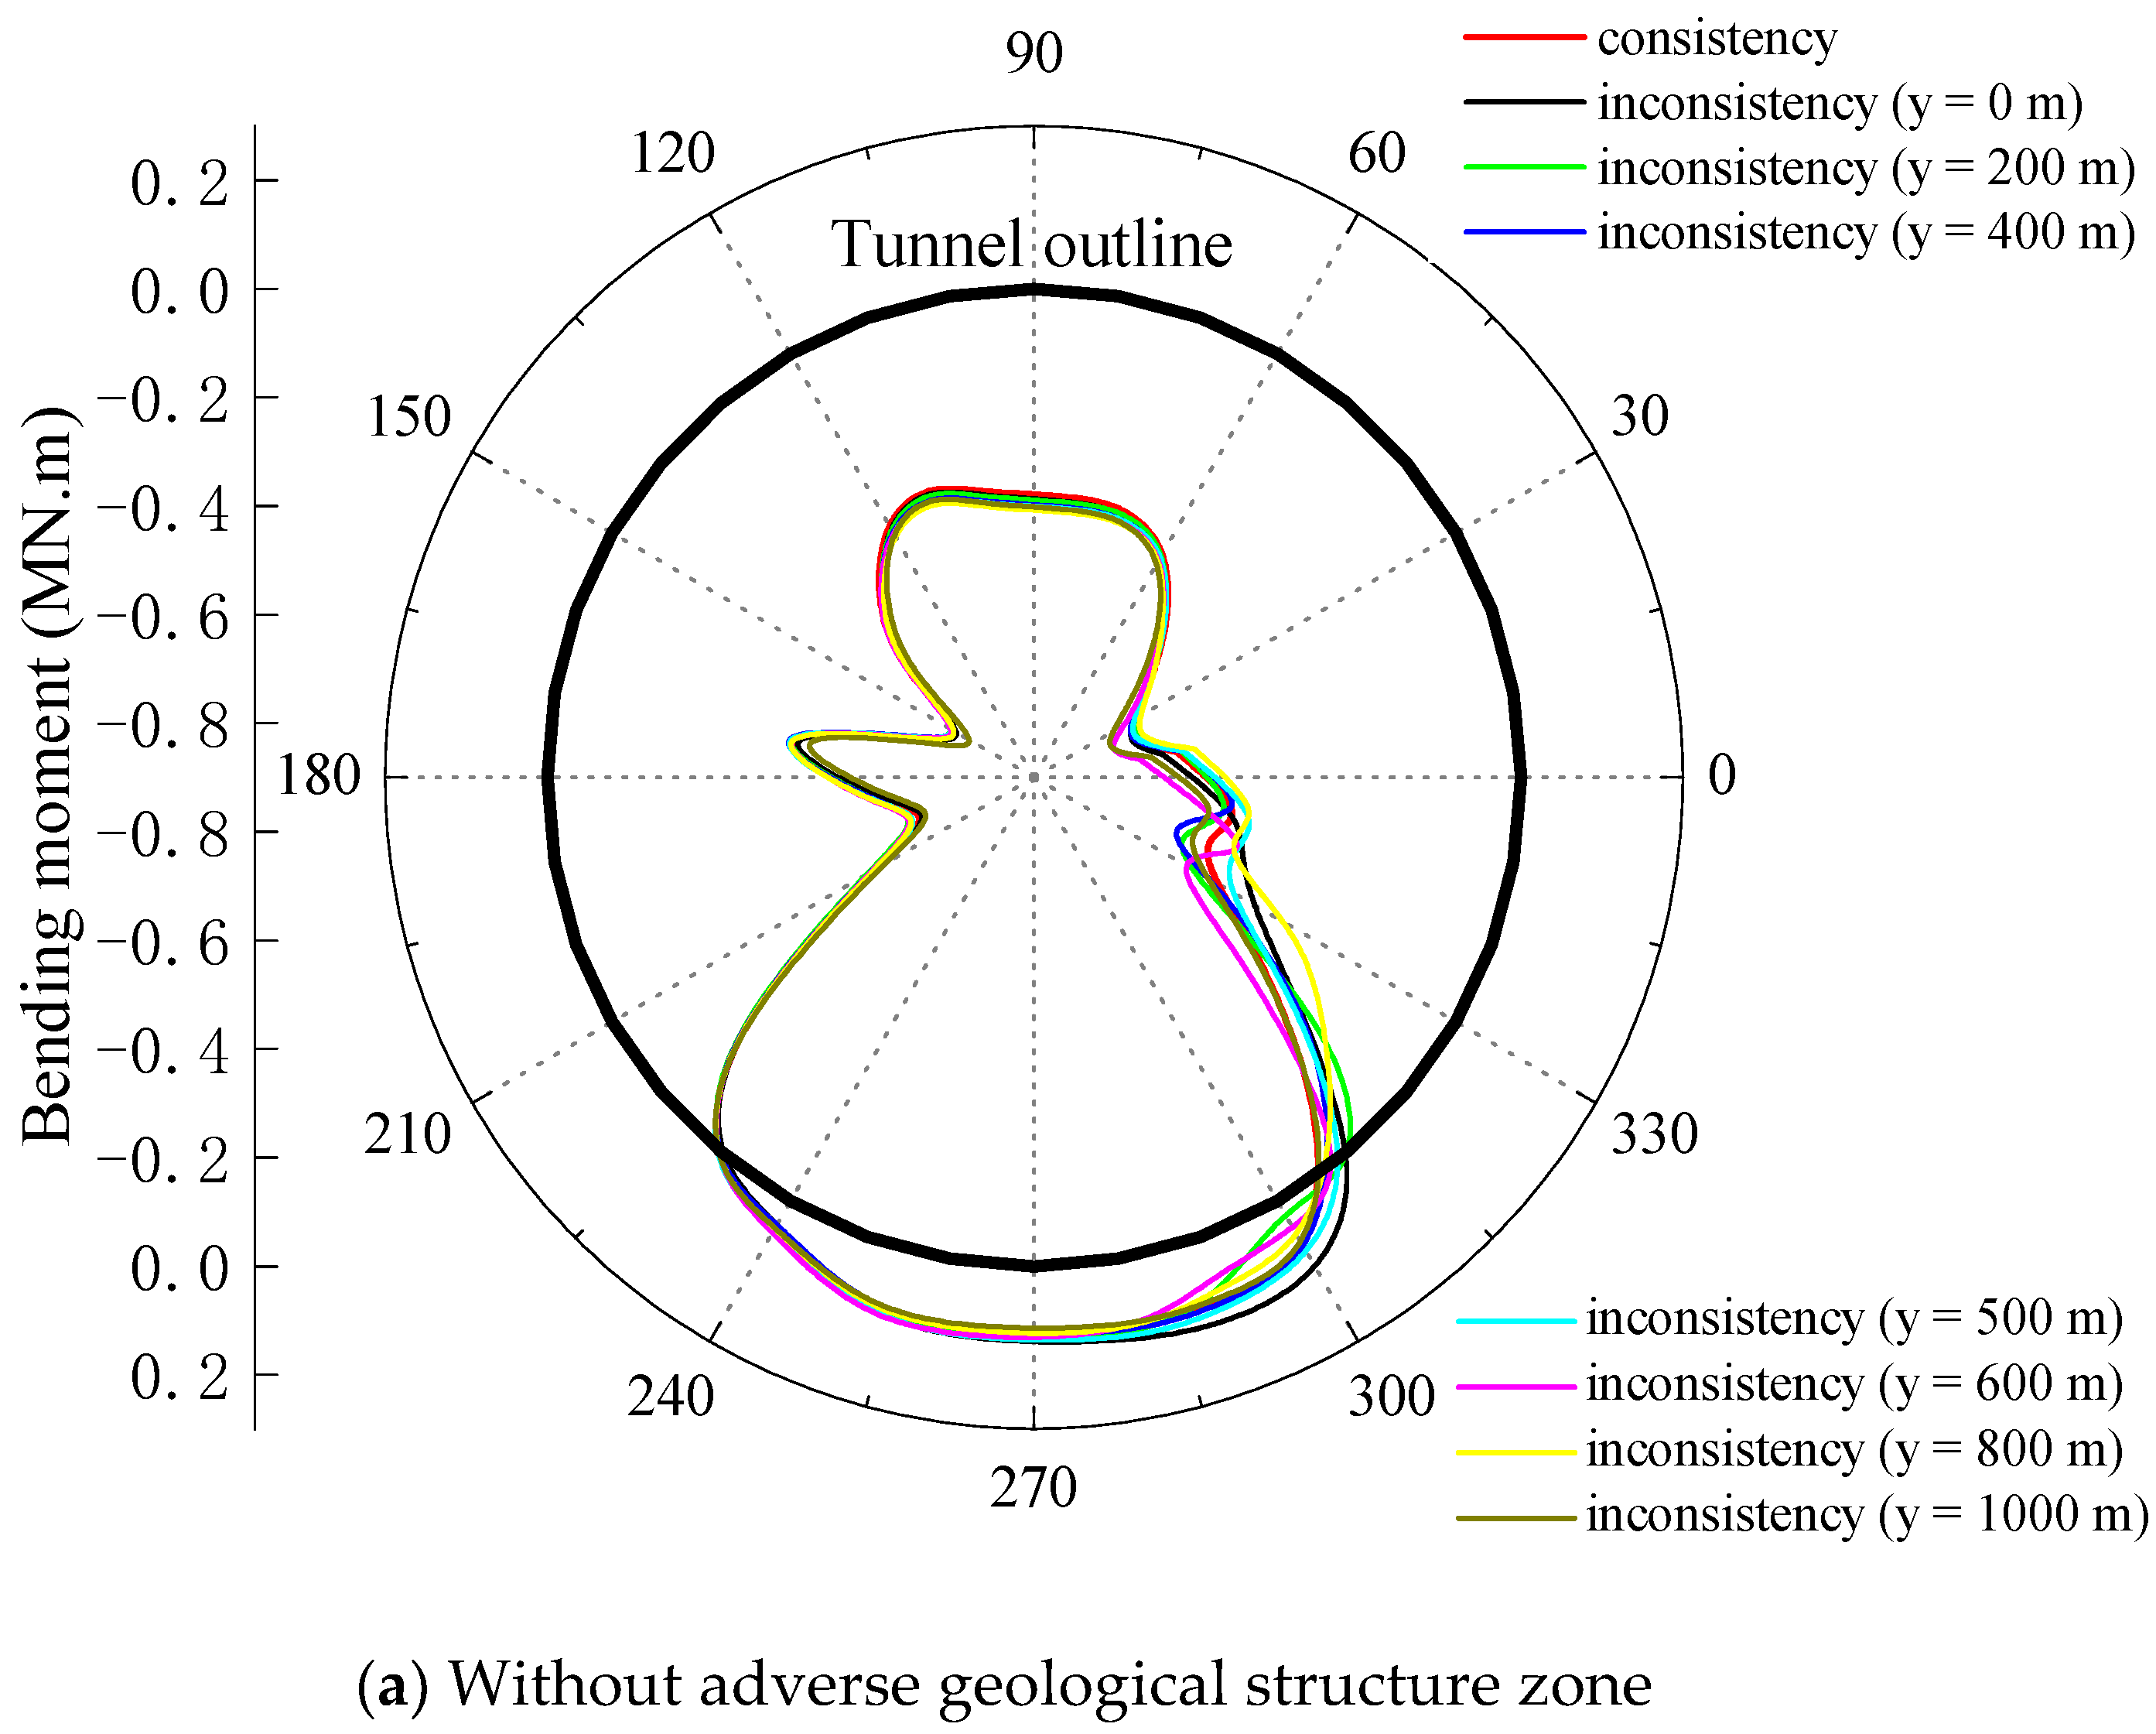
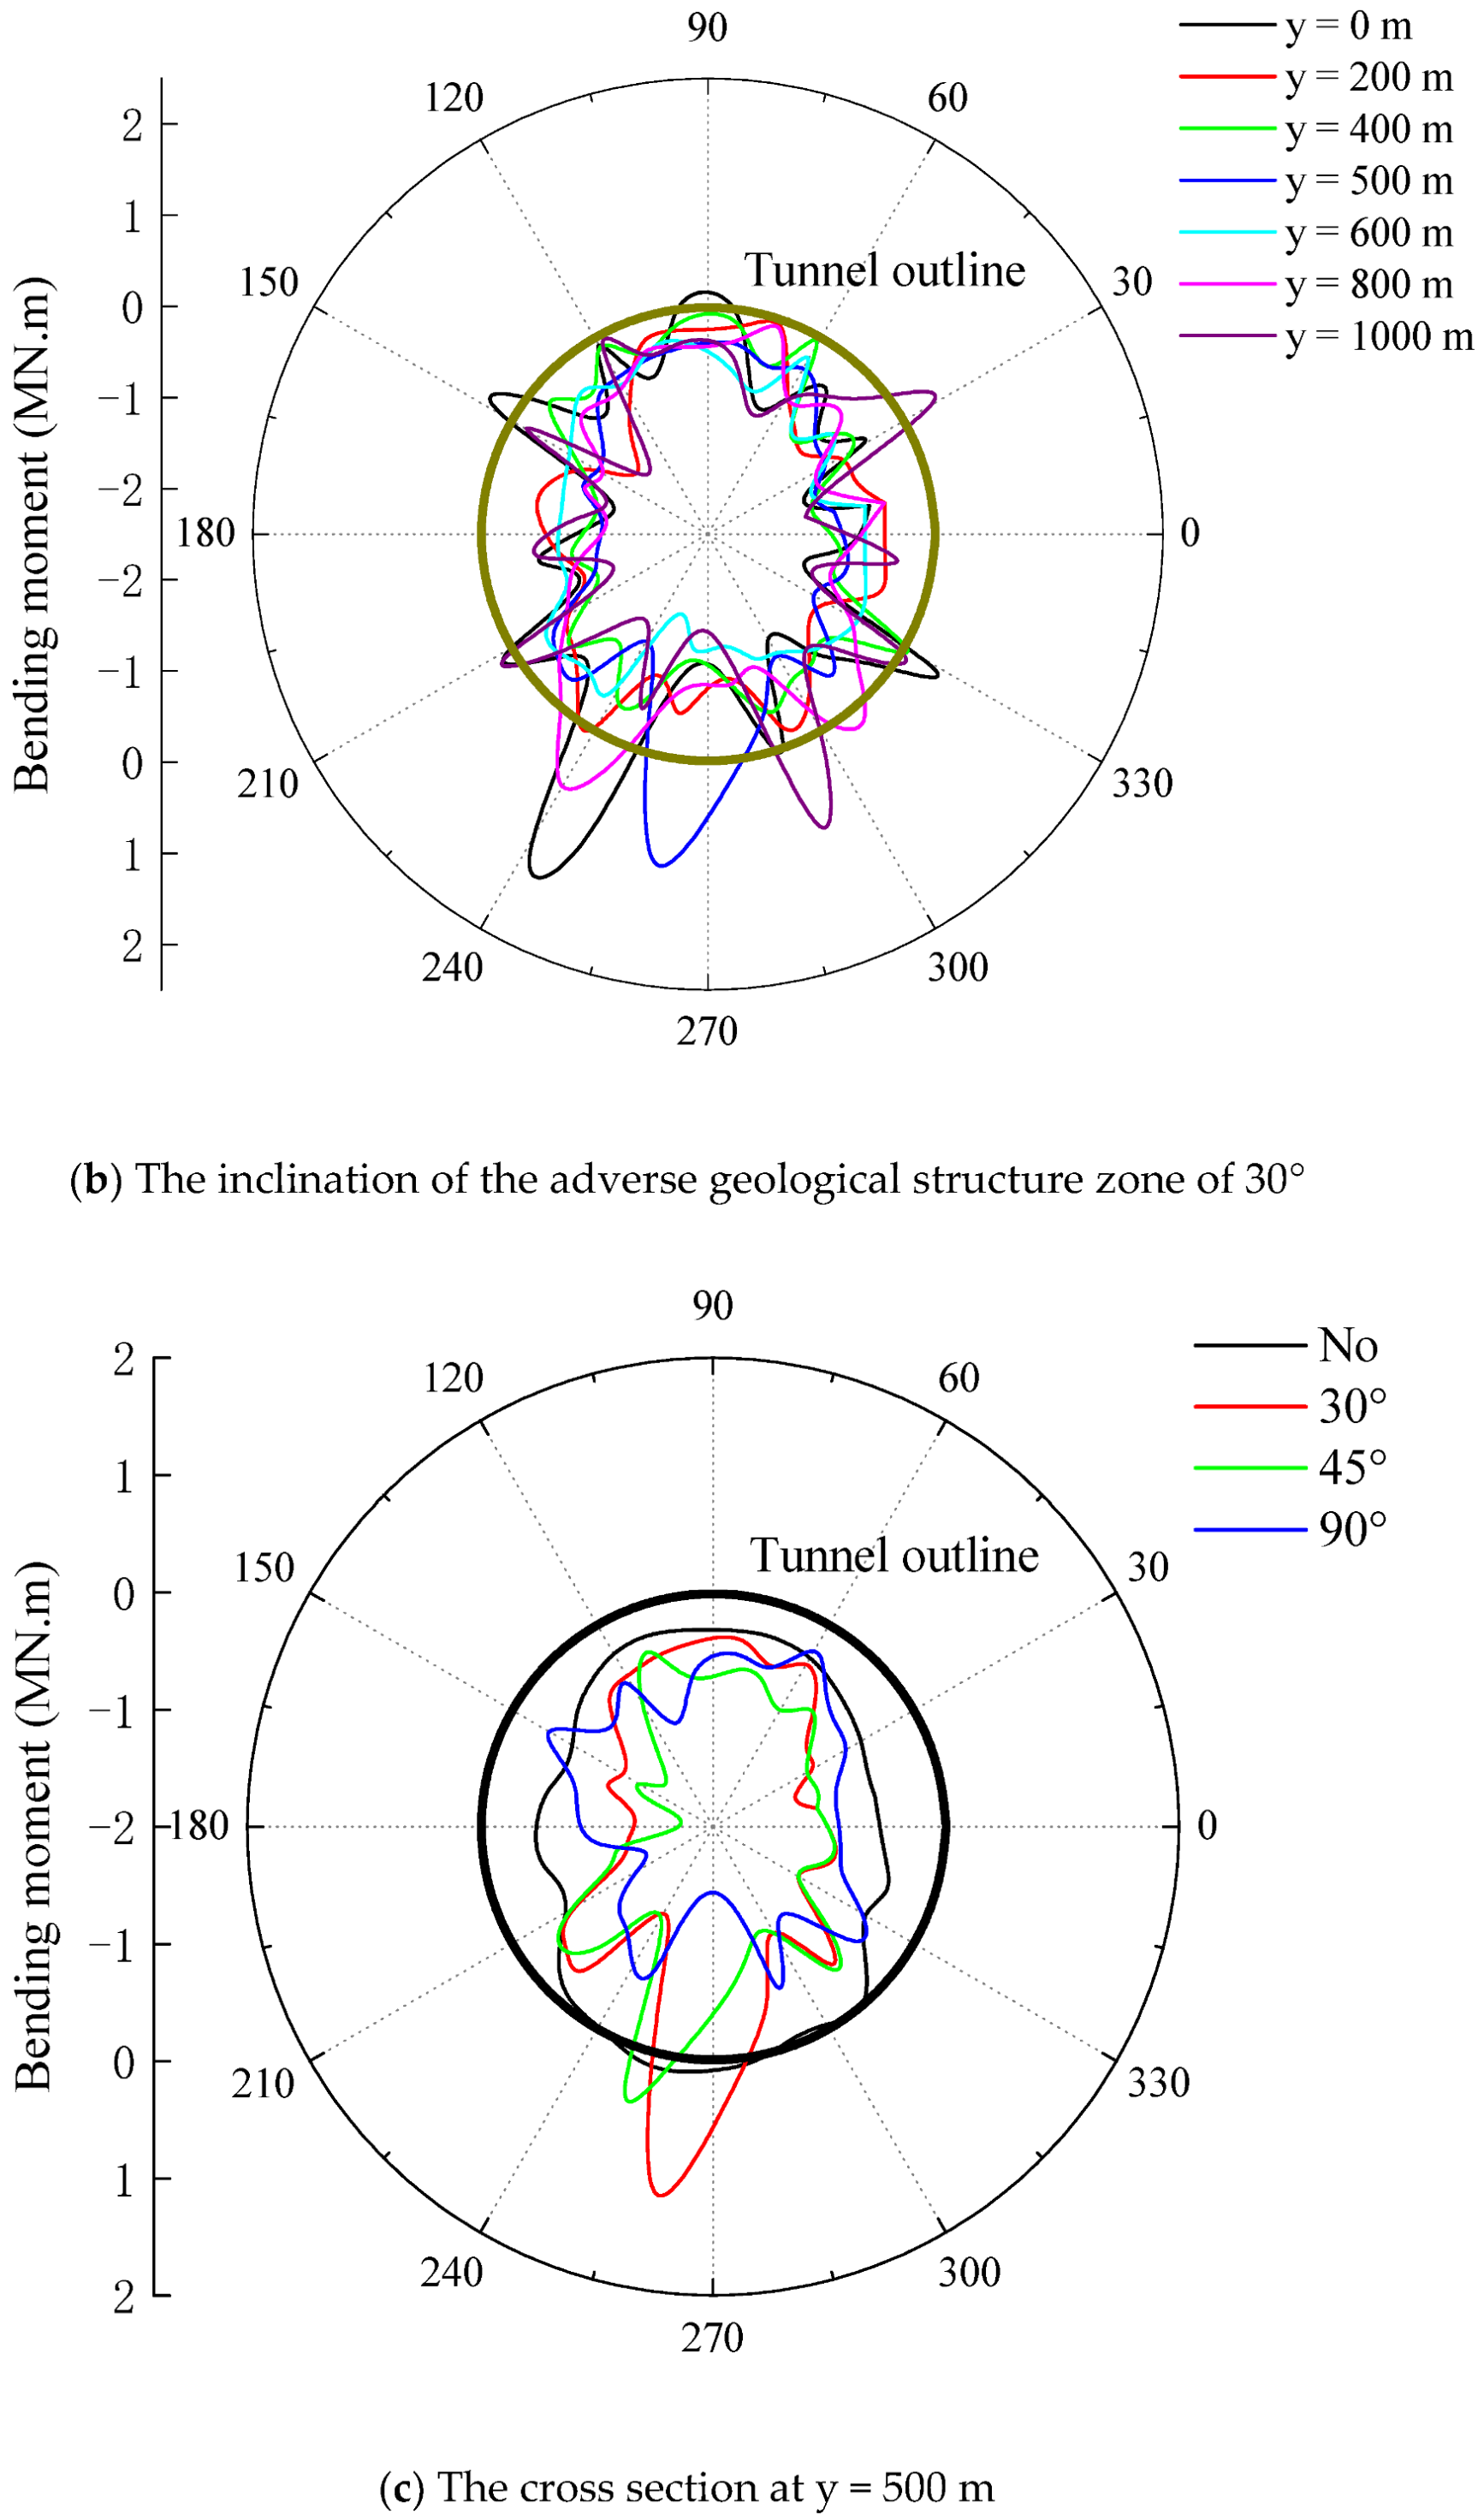
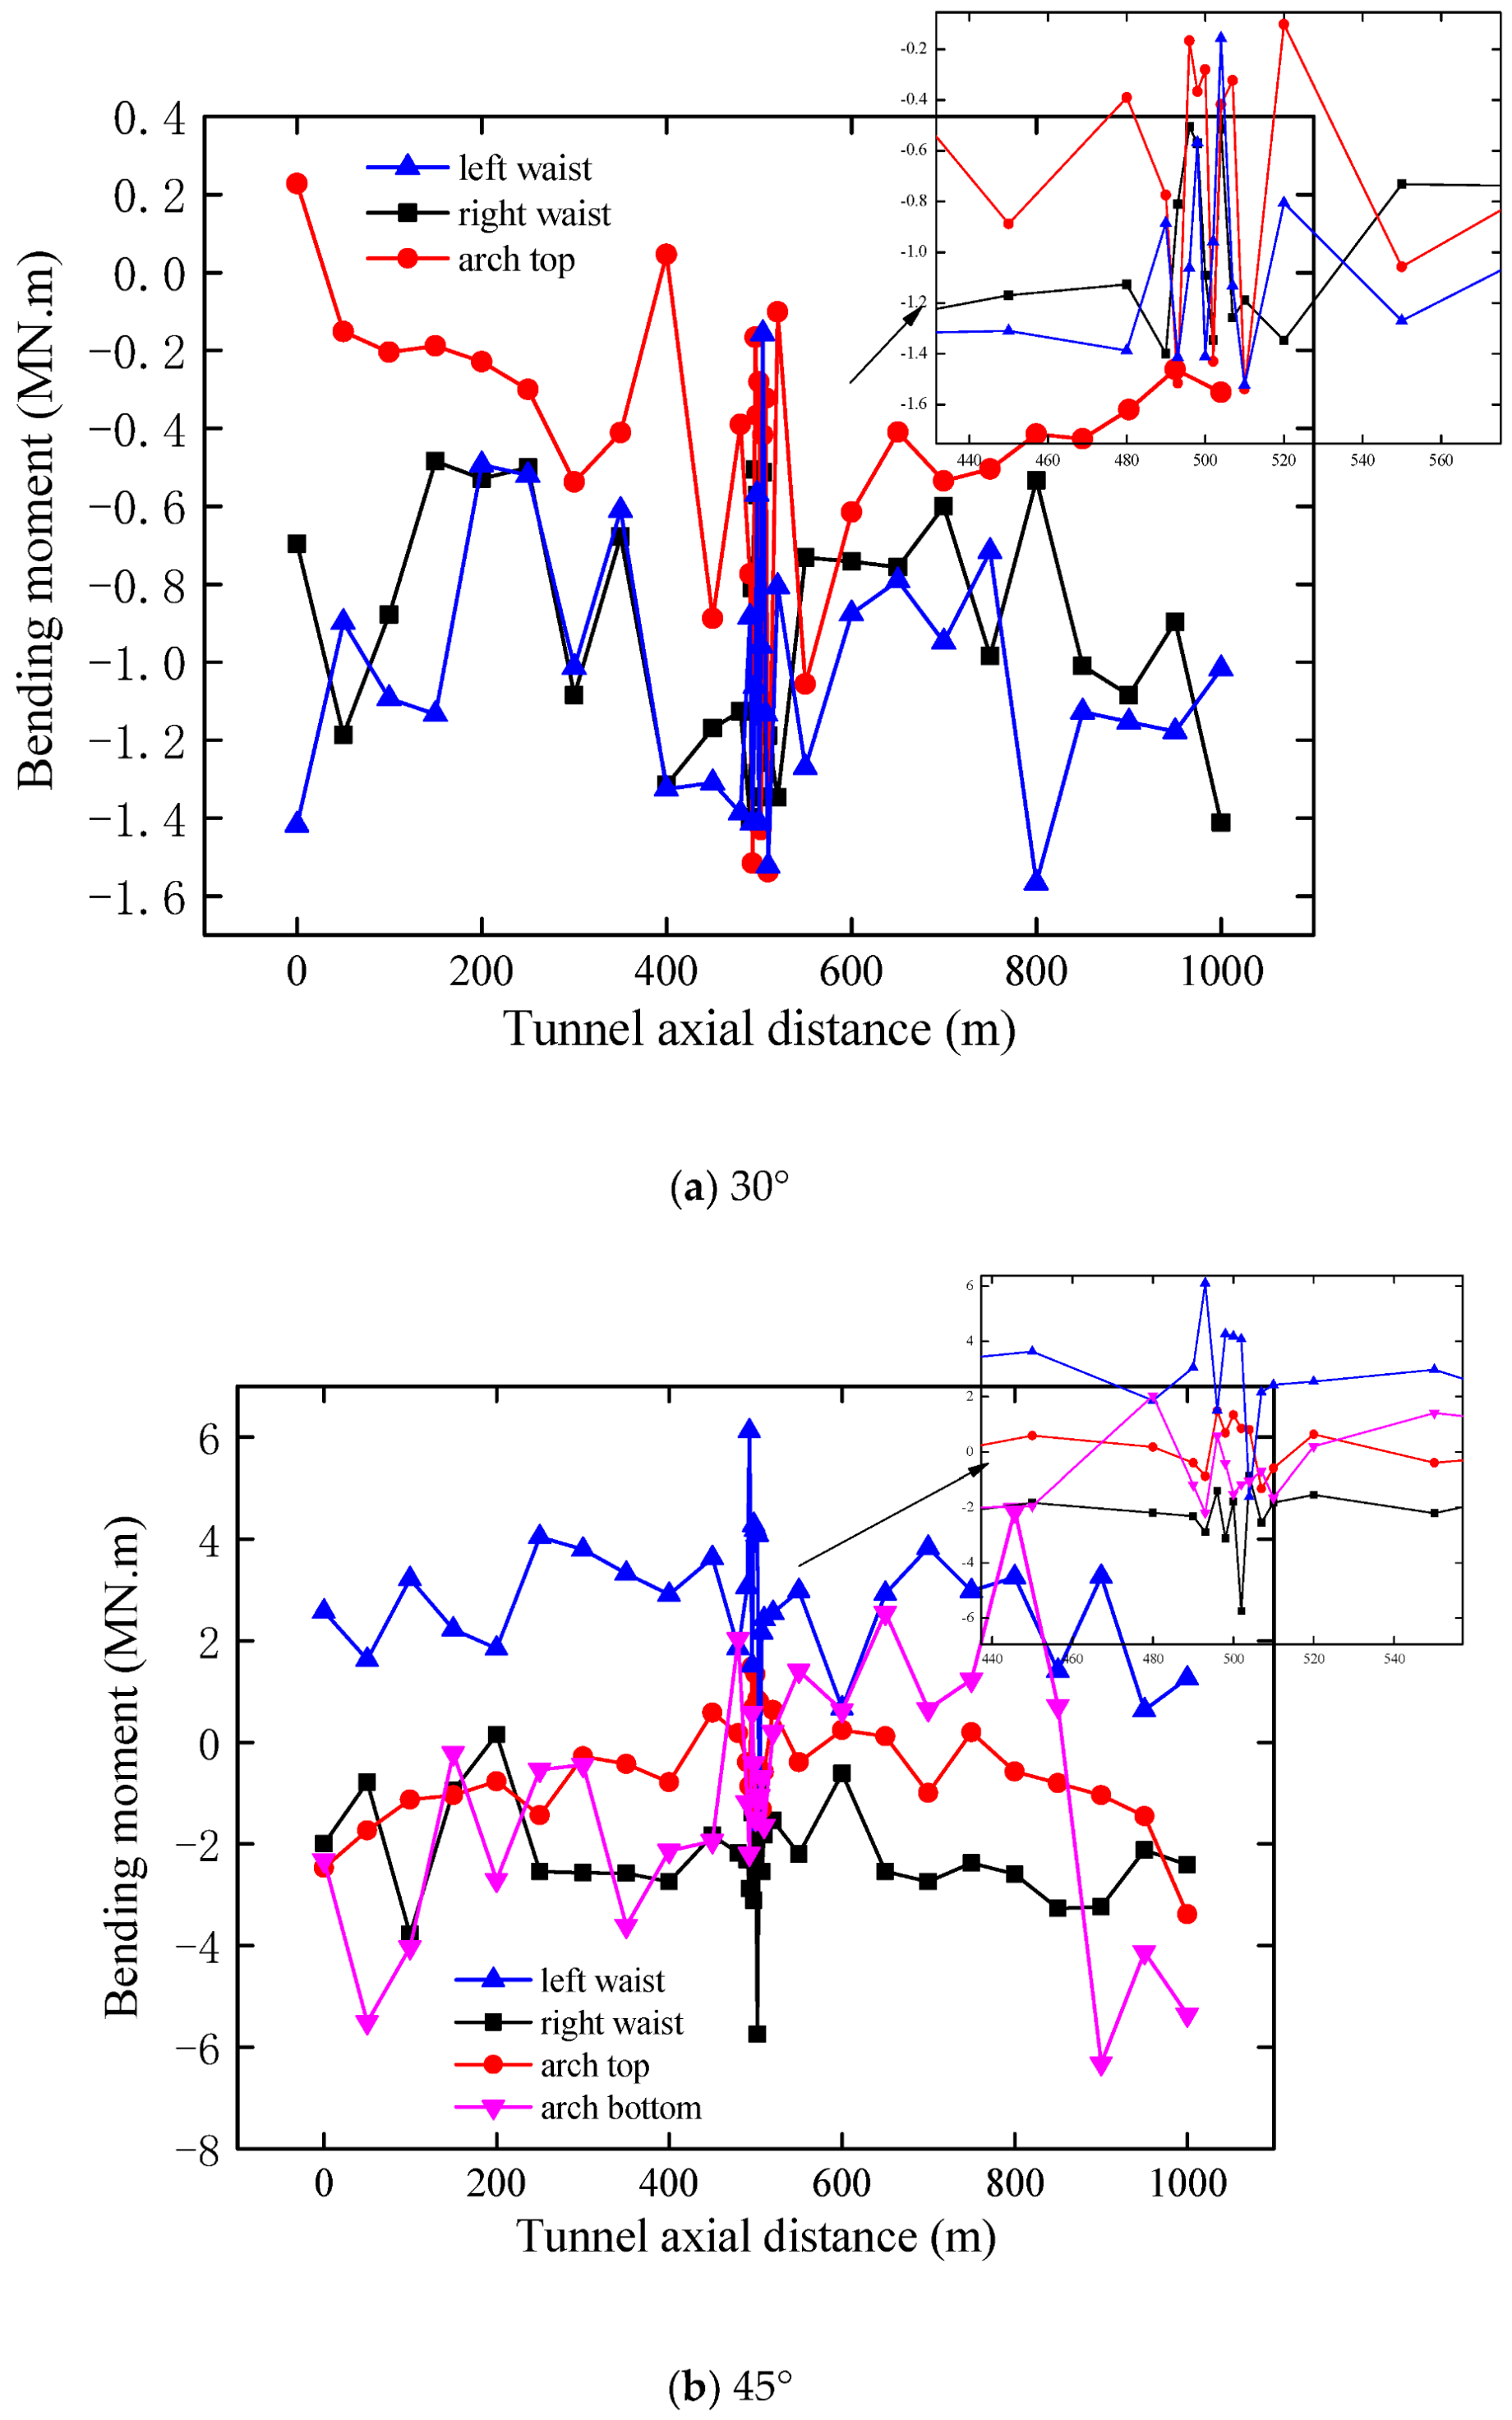
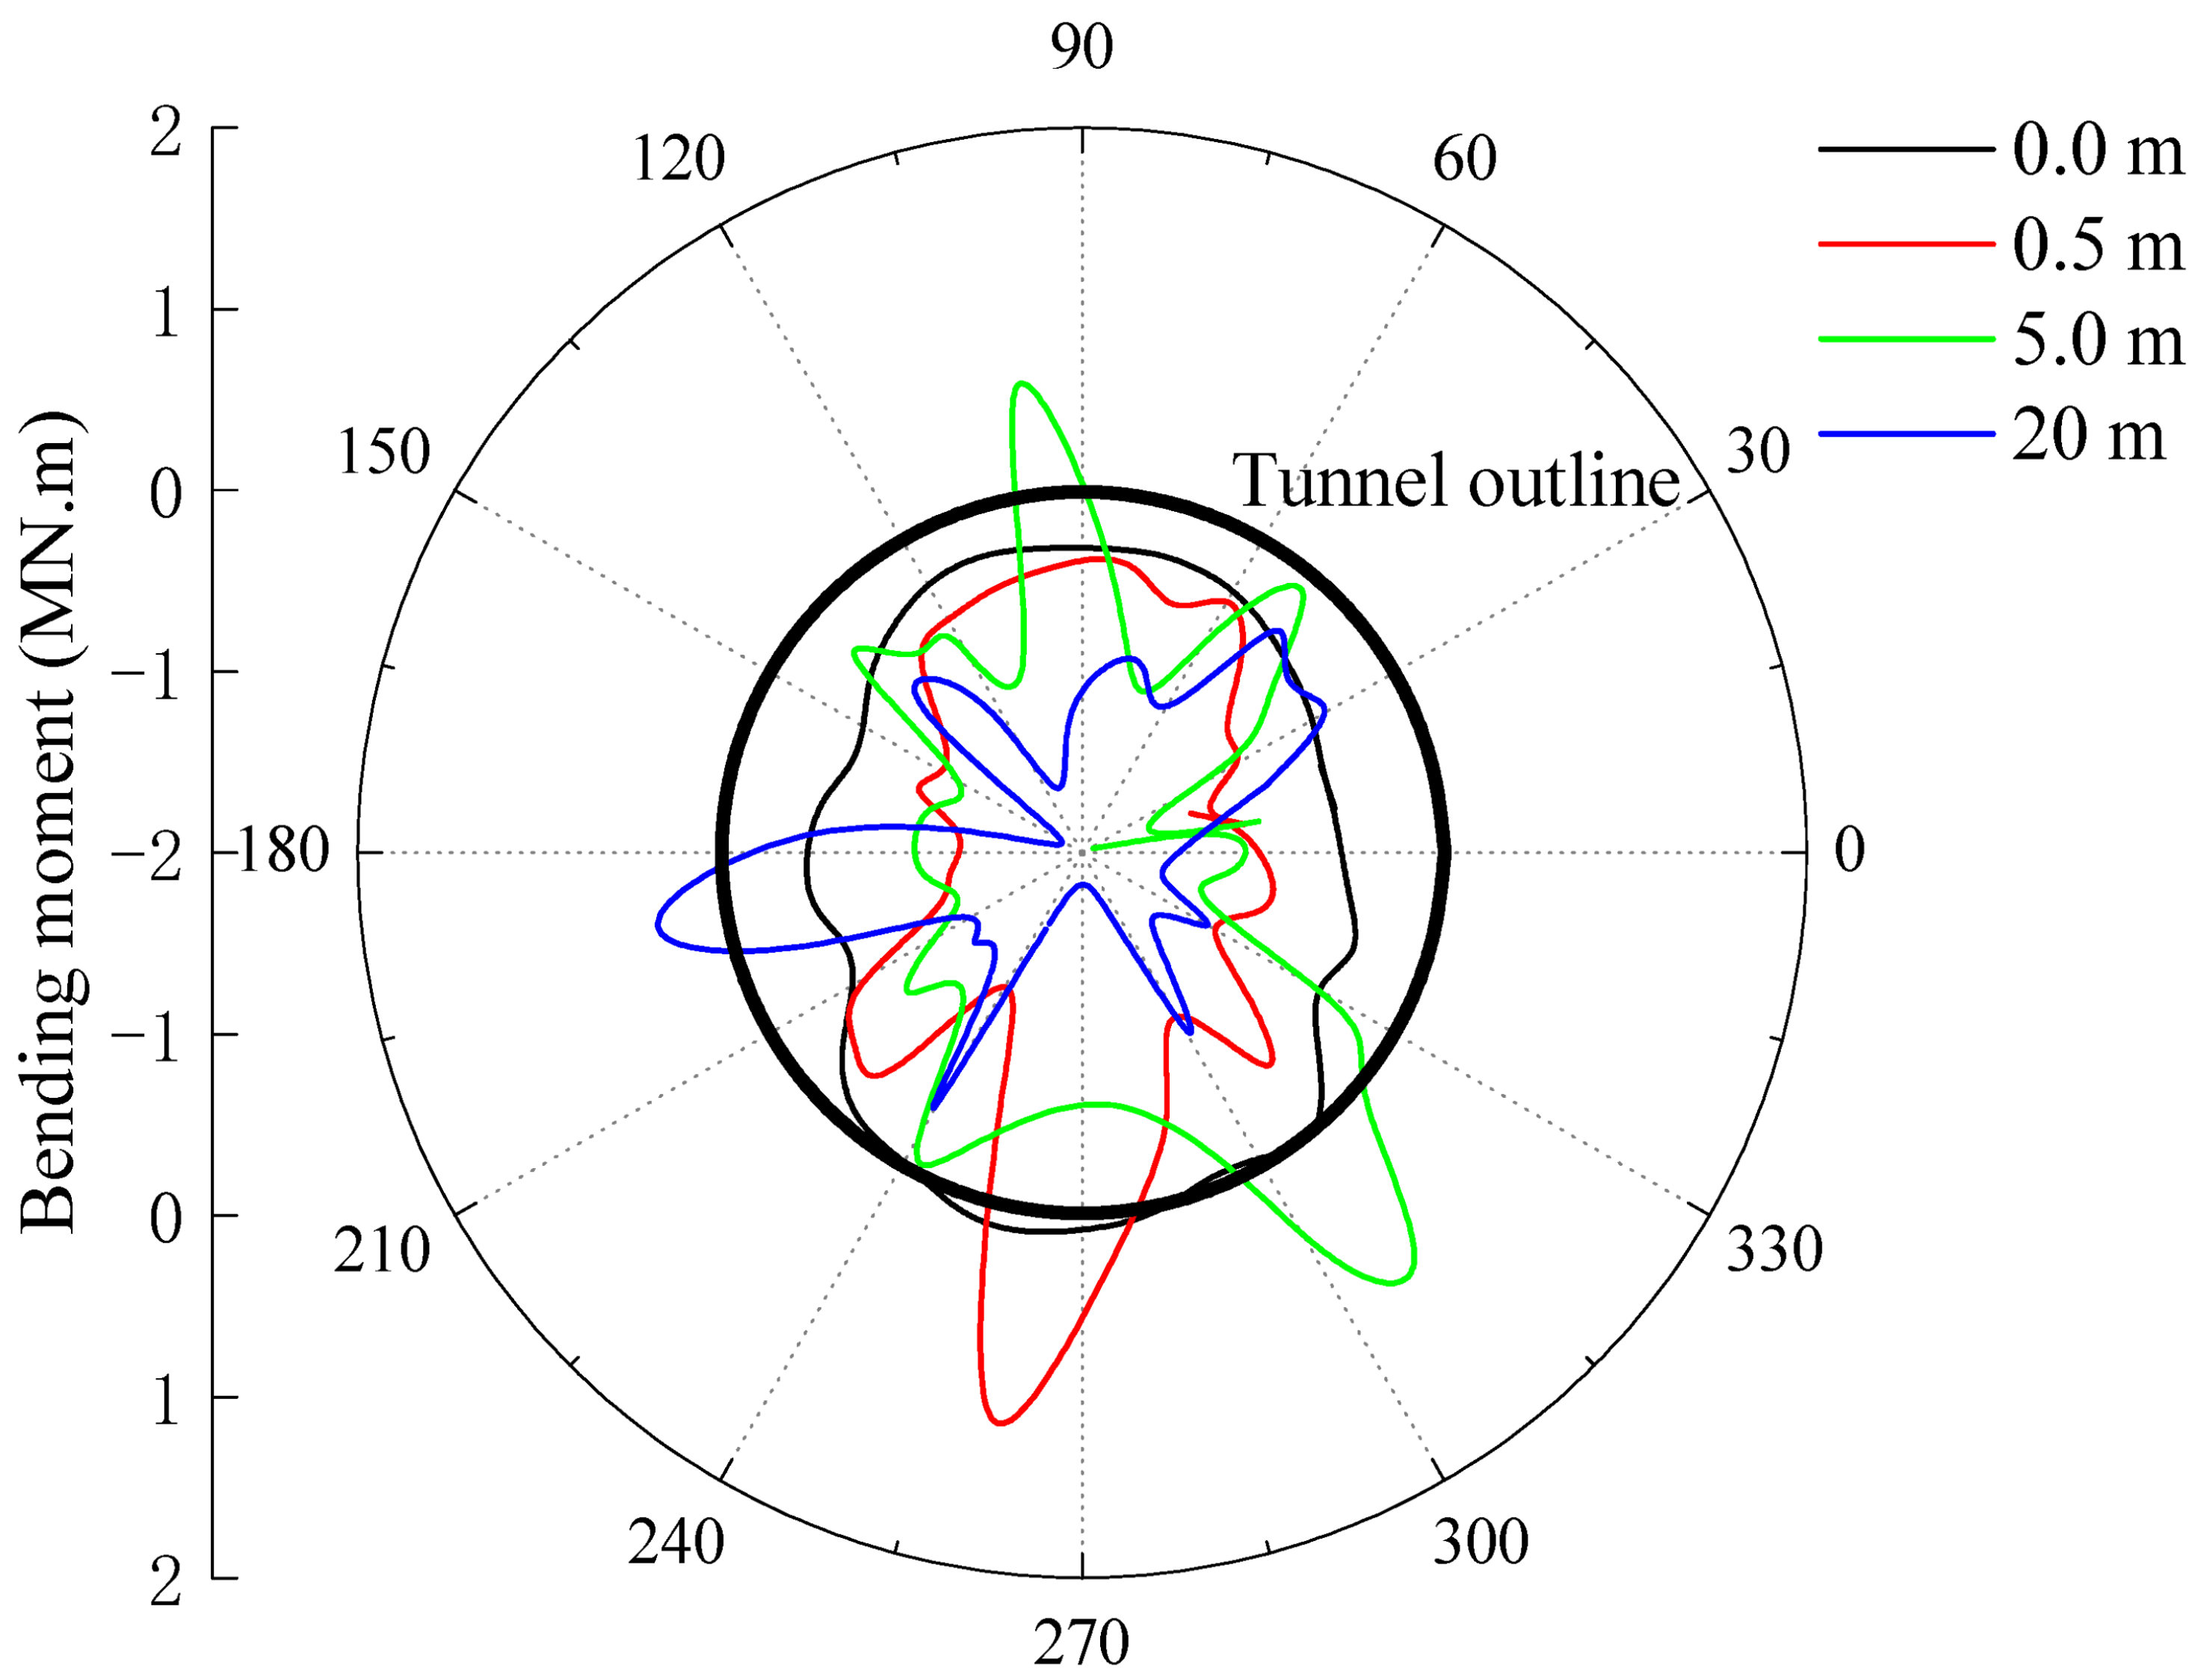
3.2. Distribution of Bending Moment of Lining

3.2.1. Influence of Inclination

Figure 5 shows the change of the peak bending moment of each cross section along the tunnel axis with different inclinations of the adverse zone. The tunnel contour line indicates that the bending moment is 0. The bending moment is positive with the inner liner in tension. According to the comparative analysis in Figure 5a, if no adverse geological structure zone exists, the bending moment distribution of the lining in the non-uniform seismic input is basically similar to that of the lining in the uniform seismic input. The inner side of the lining at the position above the bottom is under compression, while the lining at the bottom position is under tension. However, there is a certain gap between the two cases in terms of values, and it is mainly concentrated in the lower right part of the tunnel-lining structure. Thus, the lining-bending moment in the uniform condition is only a special case in the non-uniform condition. However, if an adverse geological structure zone exists, the distribution of the bending moment along the axial section of the tunnel is relatively complicated, as shown in Figure 5b. On the whole, the lining at the bottom of the tunnel is in a tension state while that is in a compression state except for the bottom position. By comparing the peak bending moment of the lining at the section position of y = 500 m with different inclinations, as shown in Figure 5c, it can be found that the distribution of the bending moment is also inconsistent in all directions of the tunnel. Generally, if an adverse geological structure zone exists, the bending moment of the lining in the adverse zone is bigger than that without the adverse zone. Notably, when the inclination angle of the adverse zone is 90°, the inner side of the lining is in a compression state. Overall, the lining is subjected to the maximum bending moment when the inclination is 45°.
Figure 6 shows the variation of the peak bending moment of the lining monitoring points (including the left and right waist, top and bottom) along the tunnel axis with different inclinations of the adverse zone. As can be seen from Figure 6a, when the inclination angle of the adverse geological structure zone is 30°, the bending moment of the monitoring point at the top of the tunnel is smaller than that of the other monitoring points. However, around the adverse geological structure zone, the bending moment of the monitoring point is similar to the other points; furthermore, the bending moments of all monitoring points fluctuate more intensely at this location. Overall, although the trends of the peak bending moments of the two monitoring points on the left and right waist are the same, they do not change at the same pace, which is different from the uniform excitation. When the inclination angle of the adverse geological structure zone is 45°, as shown in Figure 6b, the change of the peak bending moment along the axial direction at the lining monitoring points of each part of the tunnel is not quite the same as the situation at the inclination angle of 30°. The bending moments at the left and right waist monitoring points have the same trend along the tunnel axial direction, but the force direction is completely opposite. The bending moment at the bottom monitoring point is the most variable among these monitoring points. From the tunnel entrance to the adverse geological structure zone, the peak bending moment at the bottom monitoring point is negative. Due to the adverse geological structure zone, the peak bending moment becomes positive at the back section of the adverse geological structure zone, and it becomes negative only near the exit section. Although the peak bending moment and the degree of variation of the top monitoring point are generally smaller than those of other monitoring points, the bending moment of this point is comparable to those of other monitoring points around the adverse geological structure zone and the cave entrance section. In addition, the bending moment of all monitoring points fluctuates more intensely around the adverse zone. When the angle of the adverse geological structure zone is 90°, the change of the bending moment peak along the tunnel axial direction at each lining monitoring point is basically similar to that of 30°. It can be seen from Figure 6c that the variation of the bending moment with the adverse zone is significantly larger than that without the adverse zone, and it shows a strong inconsistency. From the entrance of the tunnel to the adverse geological structure zone, when the inclination angle is 30° or 45°, the peak moments at the right waist monitoring point are basically comparable. However, there is a large difference in the peak bending moments from the adverse geological structure zone to the tunnel exit section. Exceptionally, when the inclination angle is 90°, the overall trend of the peak bending moment at the right waist monitoring point along the tunnel axial direction is approximately opposite to that at the inclination angle of 30°, as shown in Figure 6d.

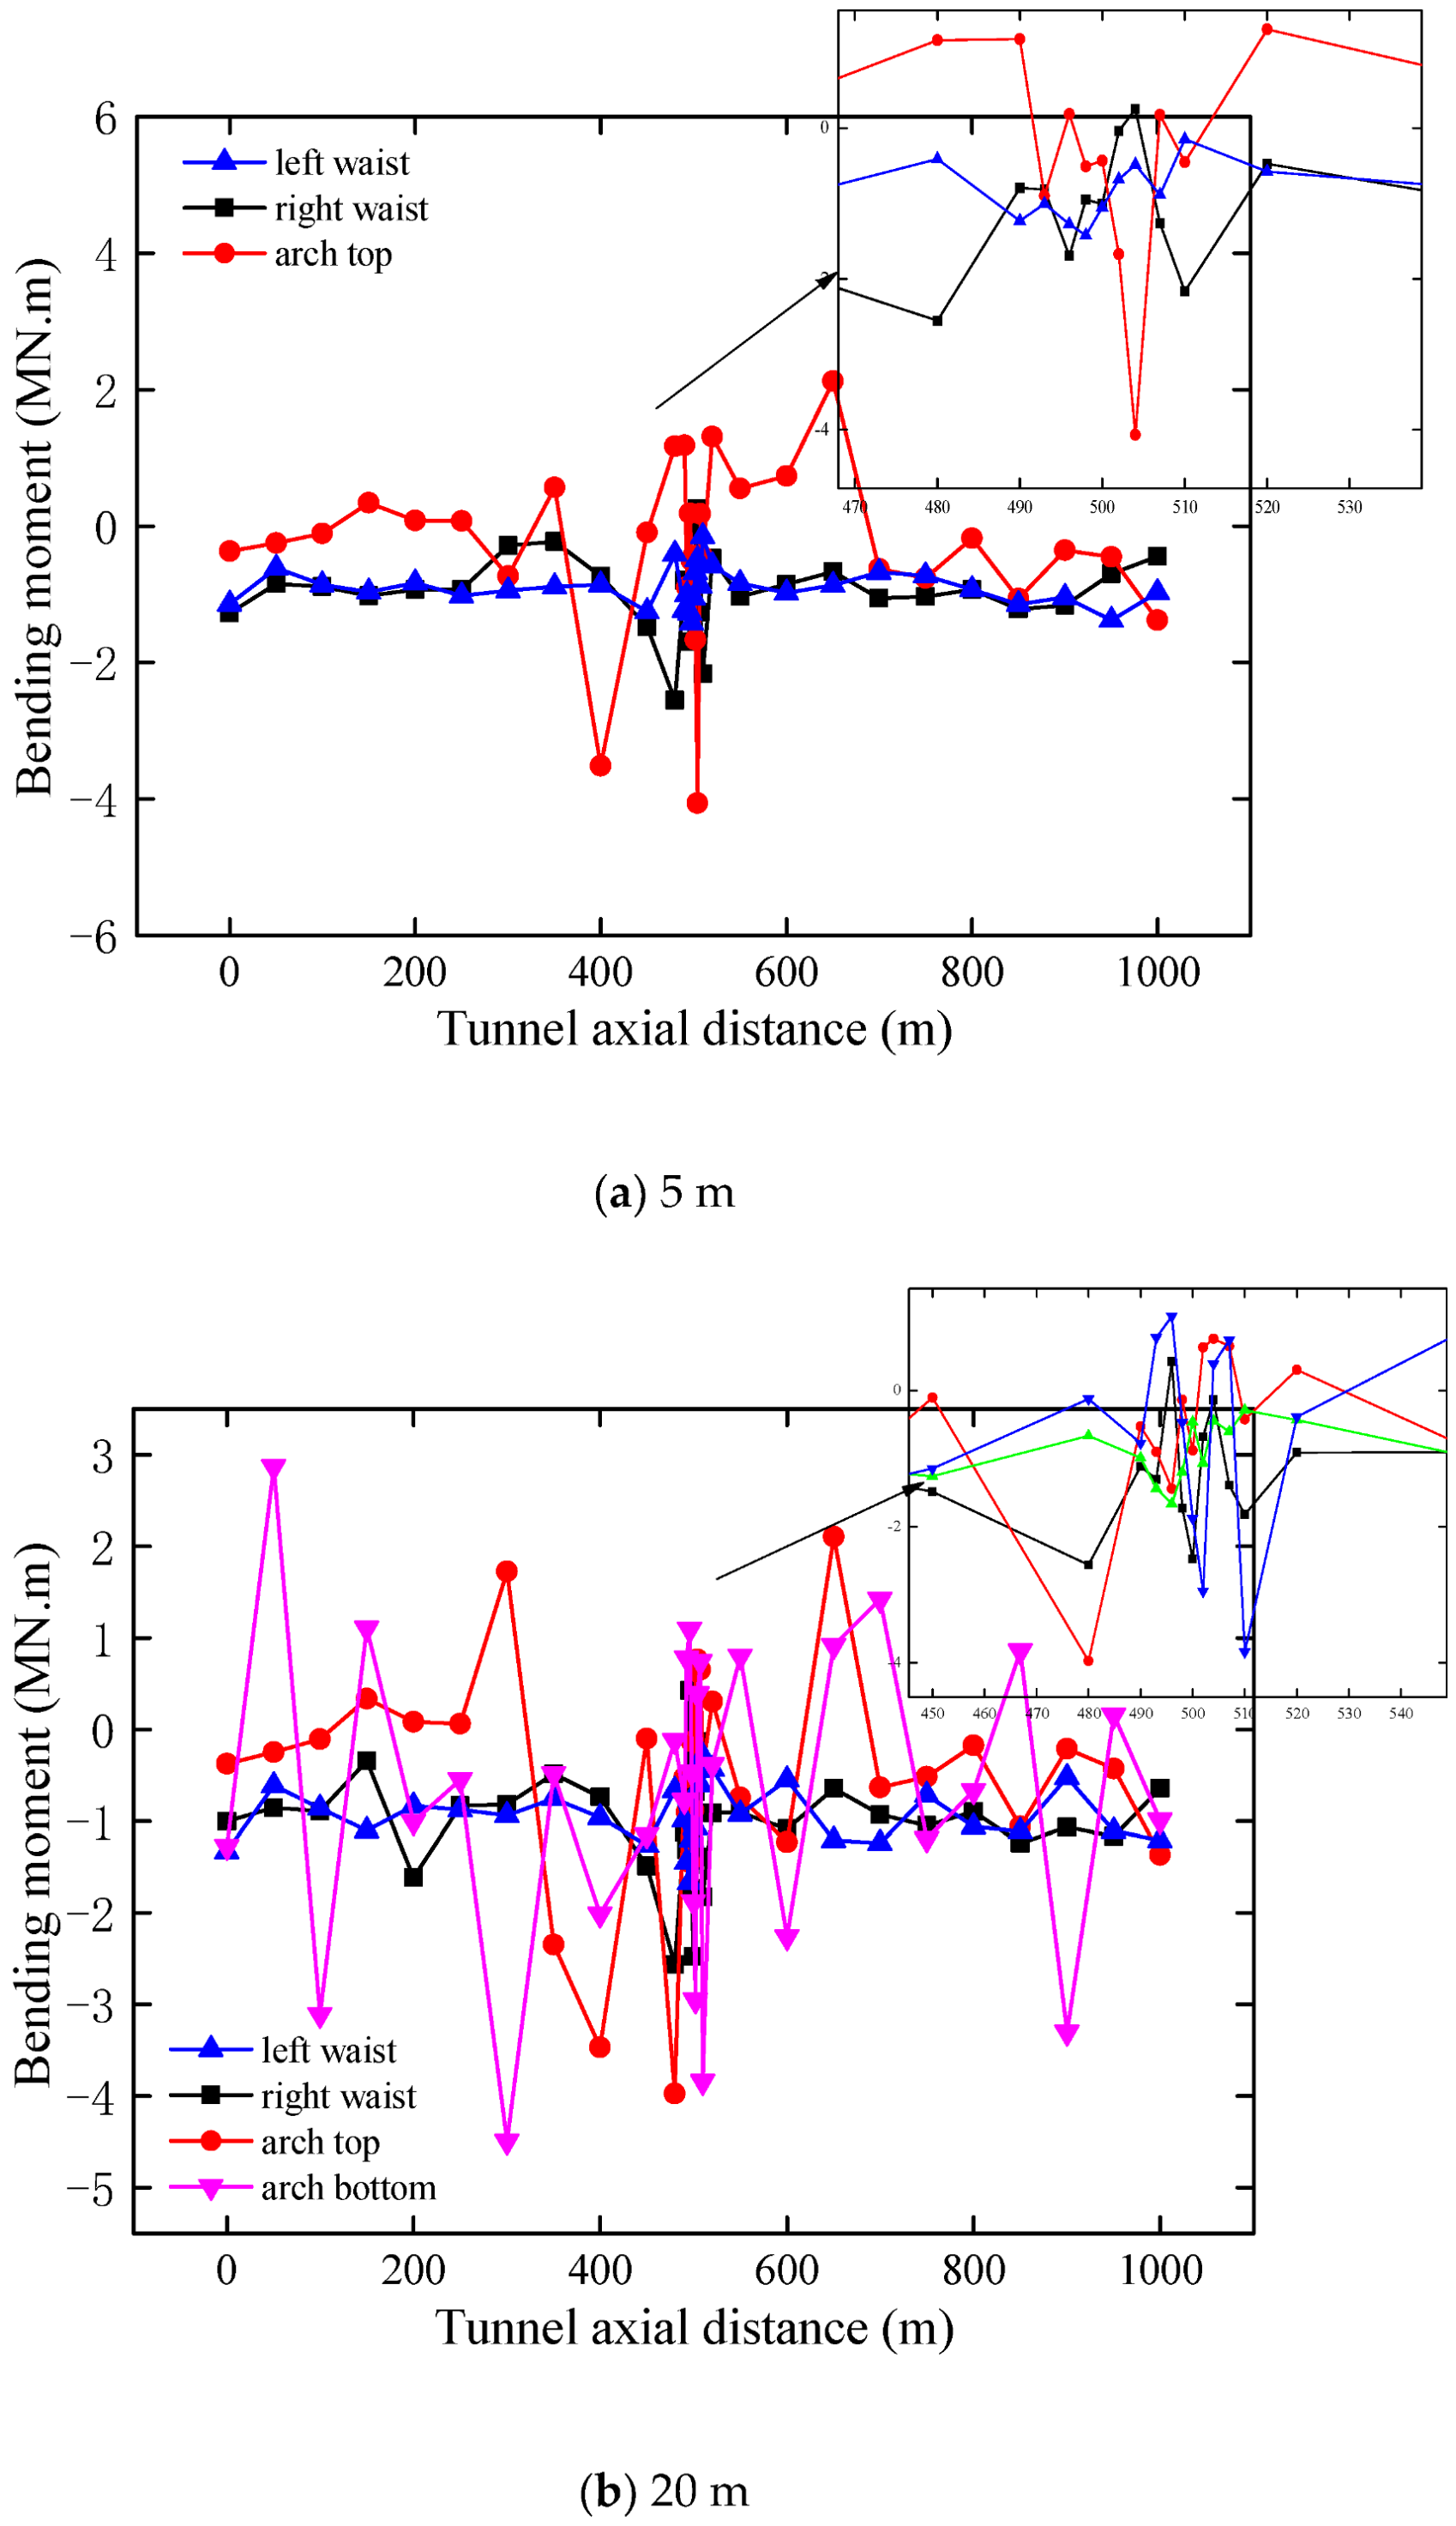
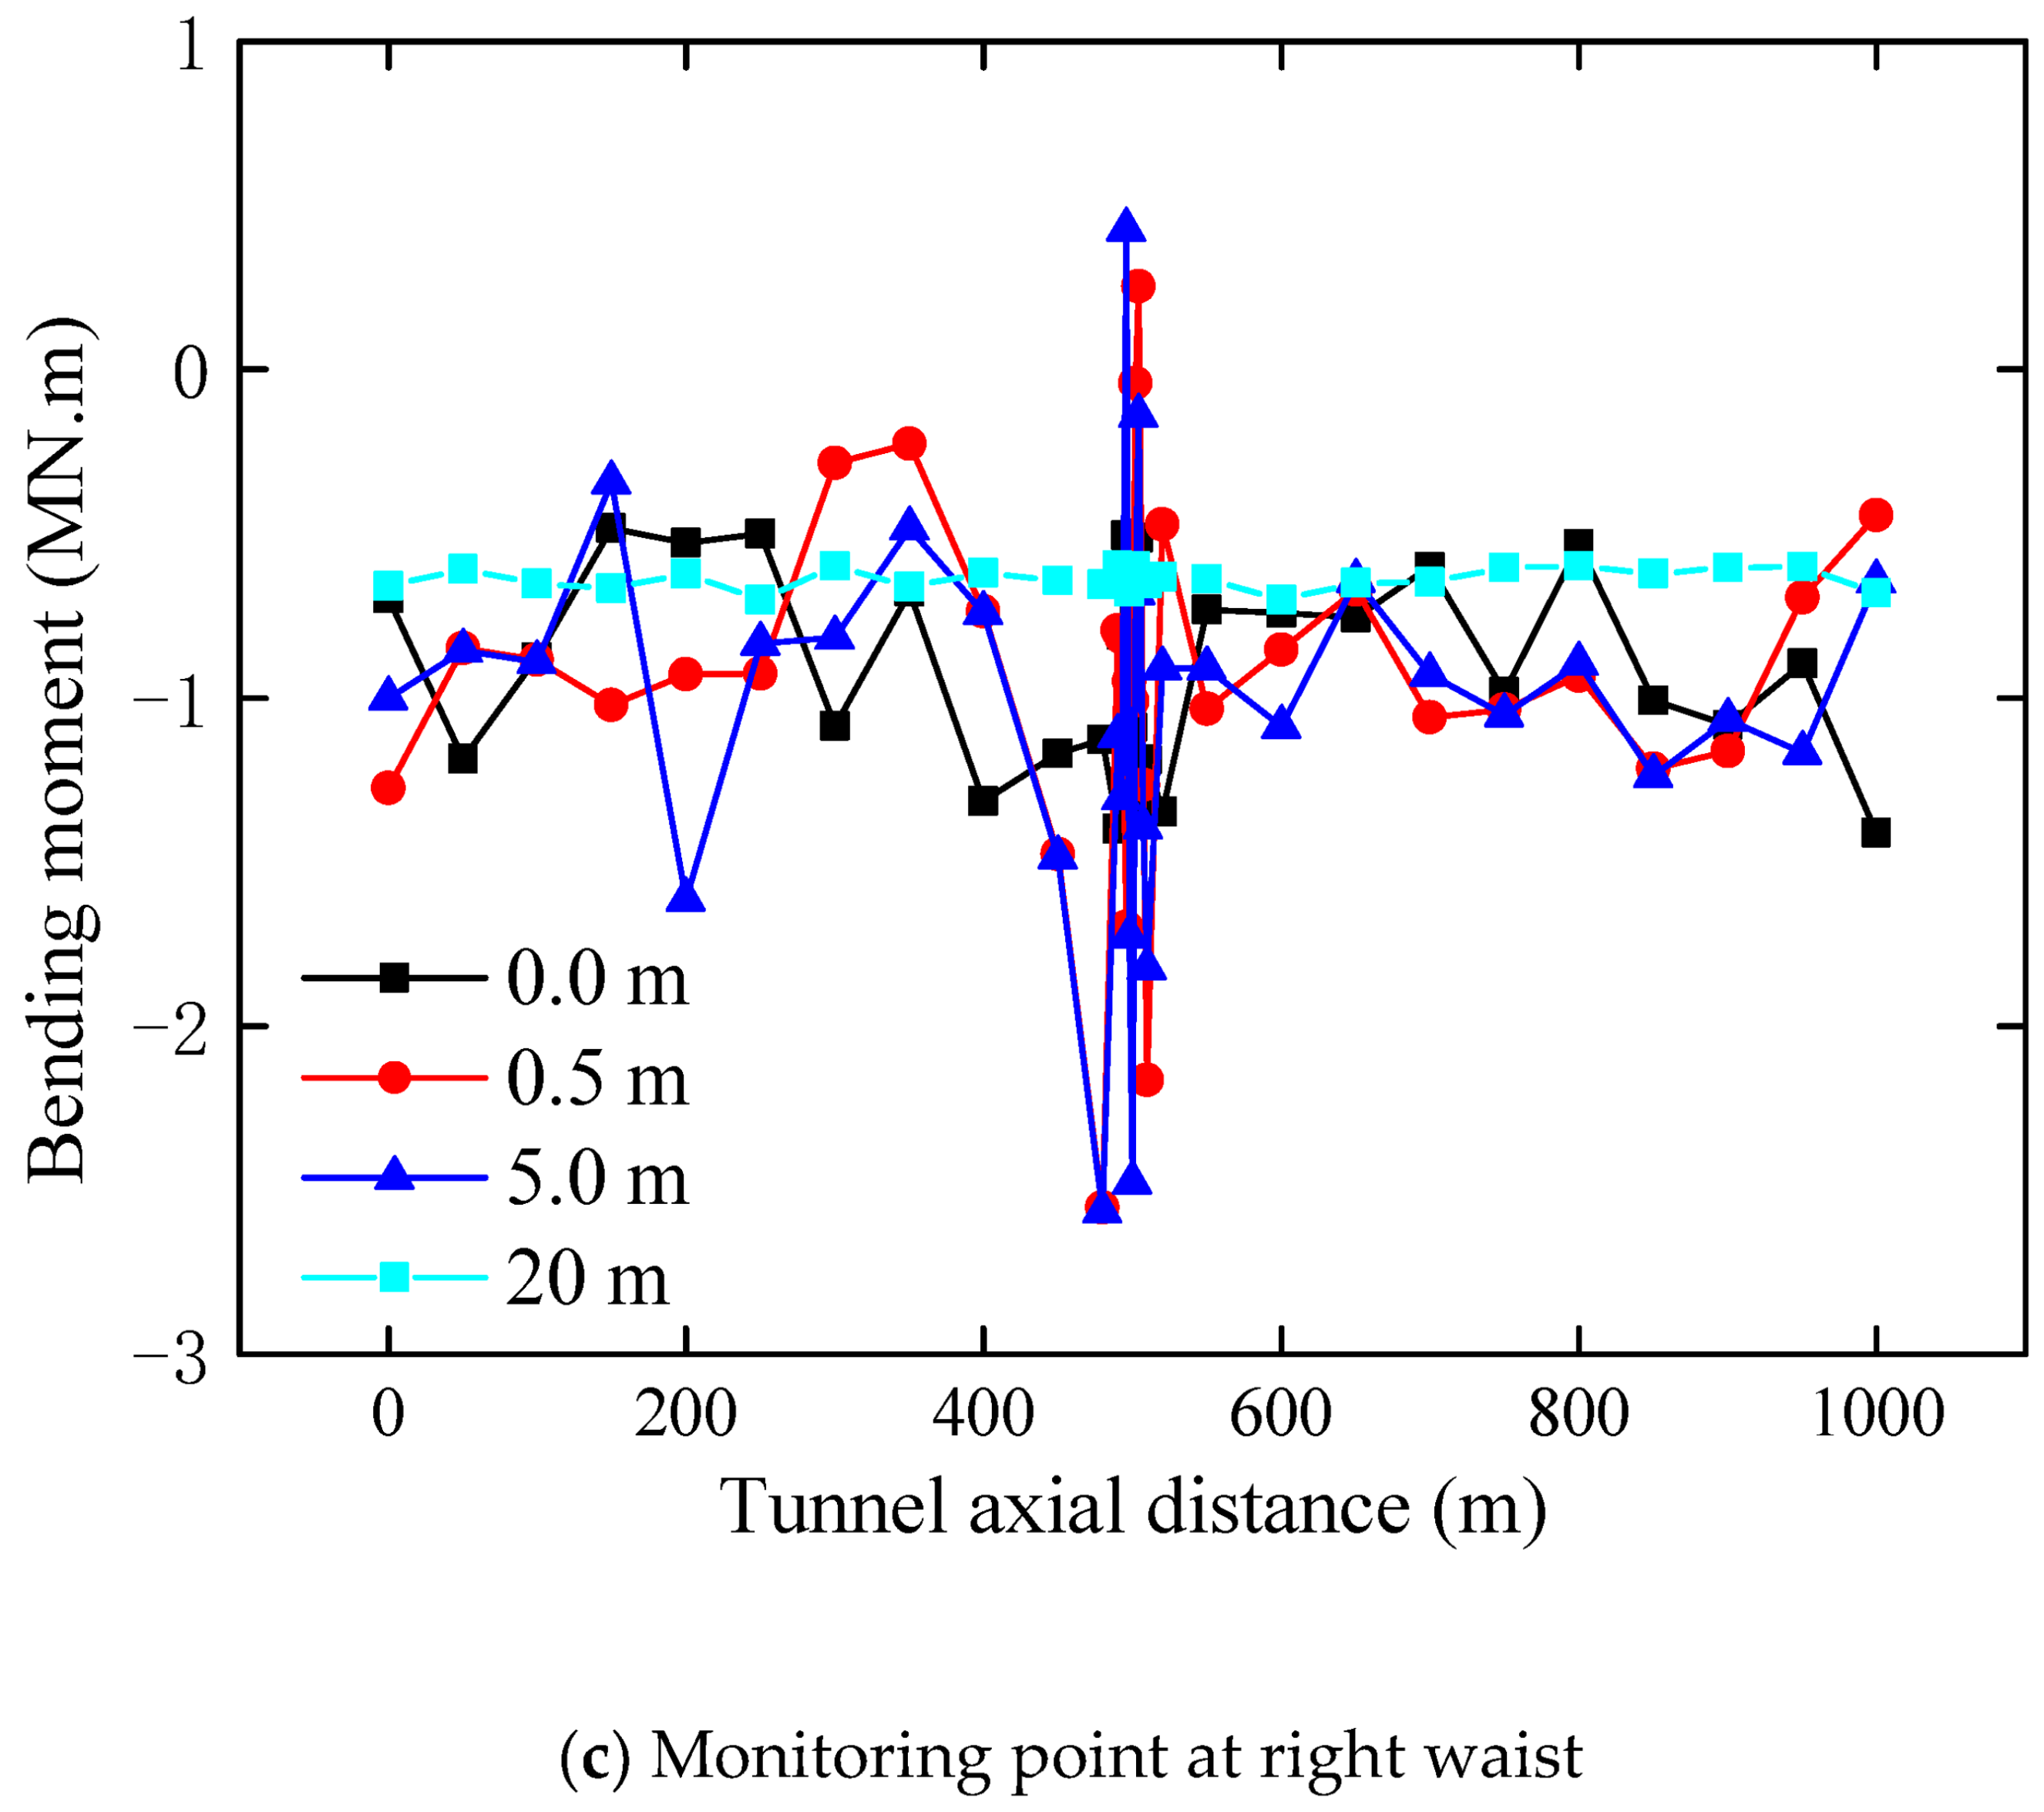
3.2.2. Influence of Thickness

Figure 7 shows the change of the peak bending moment of the lining at the location of the y = 500 m section with different thicknesses of the adverse zone. It can be found that the distribution of the bending moment is also not consistent in all directions of the tunnel cross section. The distribution of the lining moment at 0.5 m thickness is similar to that without the adverse zone. If the thickness of the adverse zone is 5 m, the lining at the top and bottom right of the tunnel is under tension, while the lining at other locations is under compression. If the thickness of the adverse zone is 20 m, except that the lining at the left waist of the tunnel is under tension, all other parts are under compression. Generally, the lining moment is greater with the adverse geological structure zone than that without the adverse zone, and when the thickness of the adverse zone is 20 m, the lining suffers the greatest moment.
Figure 8 shows the variation of the peak bending moment of the lining monitoring points (also including the left and right waist, top and bottom) along the tunnel axis with different thicknesses of the adverse zone. As can be seen from Figure 8a, if the thickness of the adverse zone is 5 m, the bending moment of the monitoring point at the top of the lining is smaller than that of the other monitoring points. However, around the adverse zone, the peak moment and the degree of variation of the bending moment at this point are larger than those at the other monitoring points. Meanwhile, the bending moment of all monitoring points fluctuates significantly around the adverse zone. Although the difference between the bending moment peaks at the left and right waist monitoring points is small, the pace of their changes is not the same. If the thickness of the adverse zone is 20 m, the trend of the peak bending moment of the lining monitoring points in each part of the tunnel is not consistent with that of 5 m thickness. The bending moment curves at the left and right waist monitoring points are opposite. Overall, the bending moment at the bottom monitoring point changes most violently, with positive and negative bending moments changing continuously along the tunnel axial direction. In addition, the bending moment at all monitoring points fluctuates particularly strongly around the adverse zone, especially at the bottom and top two monitoring points, where the variation value is about 5 MN m . From the comparative analysis in Figure 8c, it can be seen that the bending moment of the lining is stable at about 0.65 MN m without the adverse geological structure zone. However, when an adverse geological structure zone exists, the variation degree of the tunnel-lining bending moment along the tunnel axis is significantly larger than that without the adverse zone. The bending moment shows strong inconsistency, and the maximum bending moment even reaches 2.6 MN m . From the tunnel entrance to the adverse zone, the greater the thickness of the adverse zone, the more severe the change of the peak bending moment along the tunnel axis is. However, the difference is tiny from the adverse zone to the tunnel exit section, and the lining bending moment is generally stable in the range of 0.65~1.25 MN m . It states that the adverse geological structure zone can play a damping role in the subsequent tunnel to a certain extent.

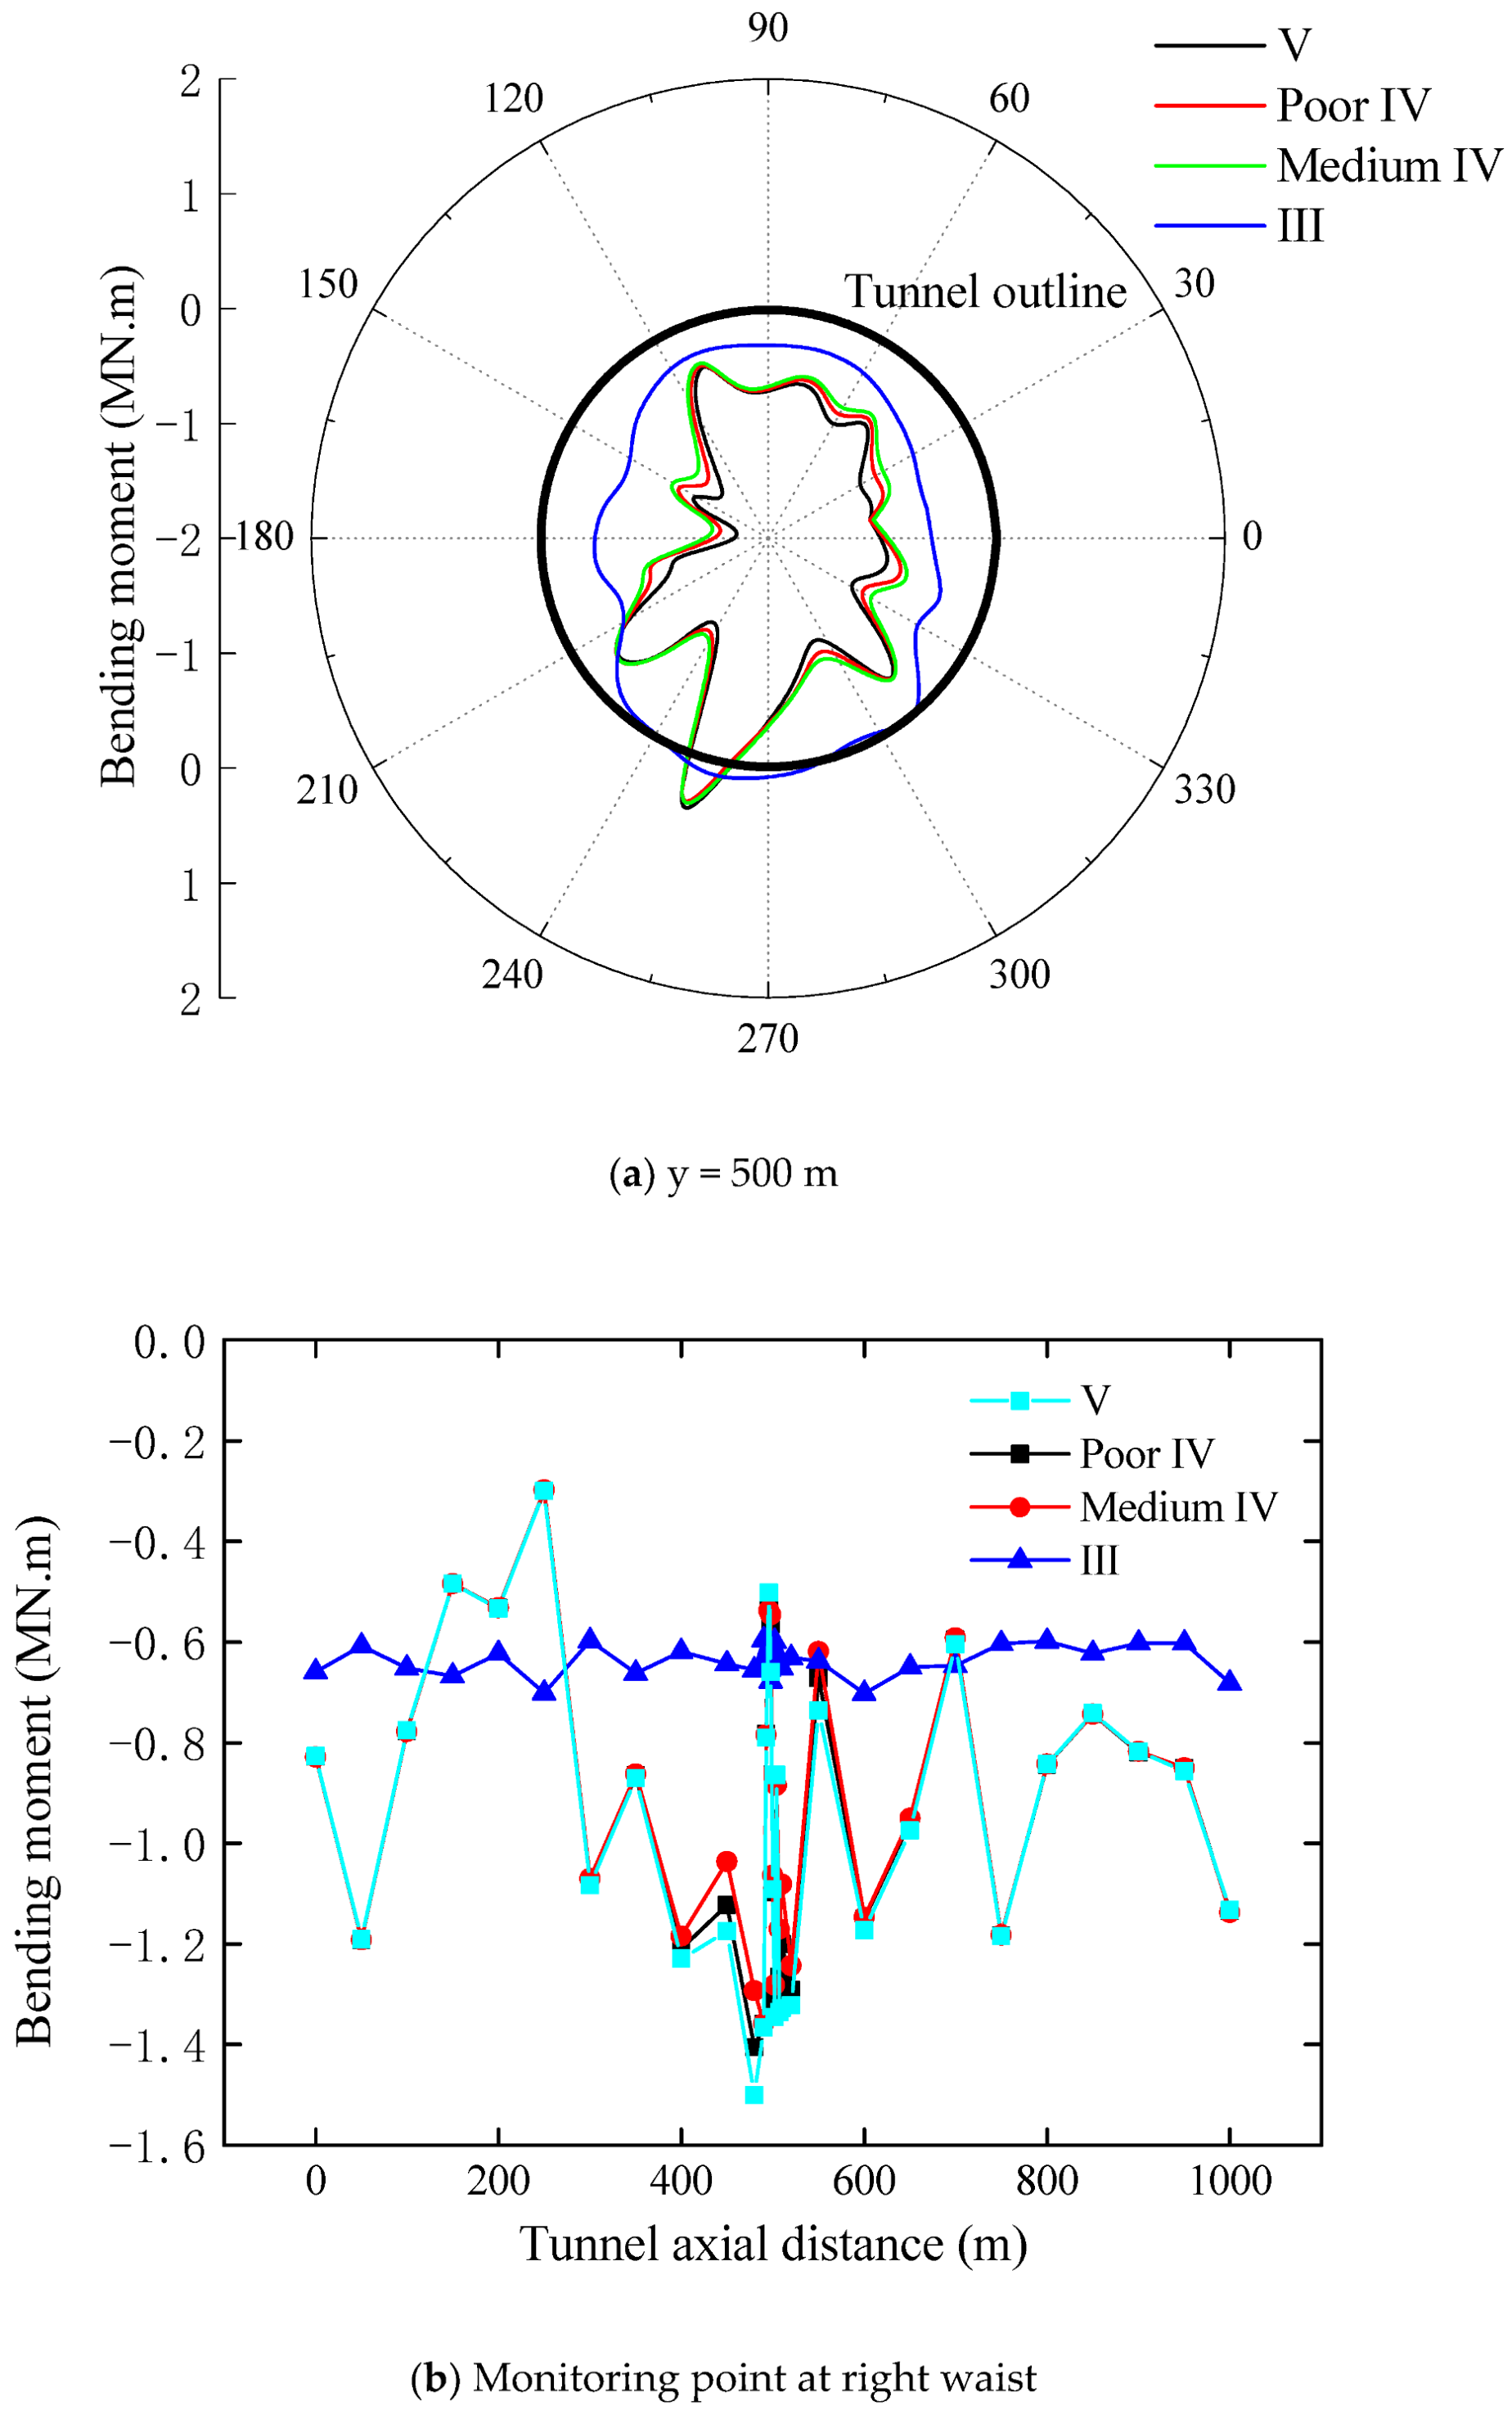
3.2.3. Influence of Lithology

Figure 9 shows the distribution of the peak bending moment of the lining at the location of the y = 500 m section with different lithologies of the adverse zone. As can be seen from Figure 9a, the distribution of the lining moments with different lithological adverse zones is the same in all directions in the tunnel. Like the case without the adverse zone, the lower left side of the tunnel lining is under tension when there is an adverse geological structure zone, while the other side is under compression. Generally, the lining bending moment is larger in the case of the adverse geological structure zone than that without an adverse zone, and the worse the lithology of the adverse zone, the larger the lining bending moment is. Comparing the change of the peak bending moment along the tunnel axial direction at the right waist monitoring point with different lithologies of the adverse zone, as shown in Figure 9b, it can be found that the change degree of the lining bending moment with the adverse geological structure zone is significantly bigger than that without the adverse zone, and it presents a strong inconsistency. Except around the location of the adverse zone, the trend of the peak lining moment along the tunnel axial direction is the same for different lithologies in adverse zones. Notably, around the adverse zone, the worse the lithology of the broken zone, the greater the bending moment of the lining is, but there is little difference in size, at about 0.2 MN m . It means that the lithology of the adverse zone has less influence on the tunnel-lining bending moment.

3.3. Distribution of Shear Force of Lining

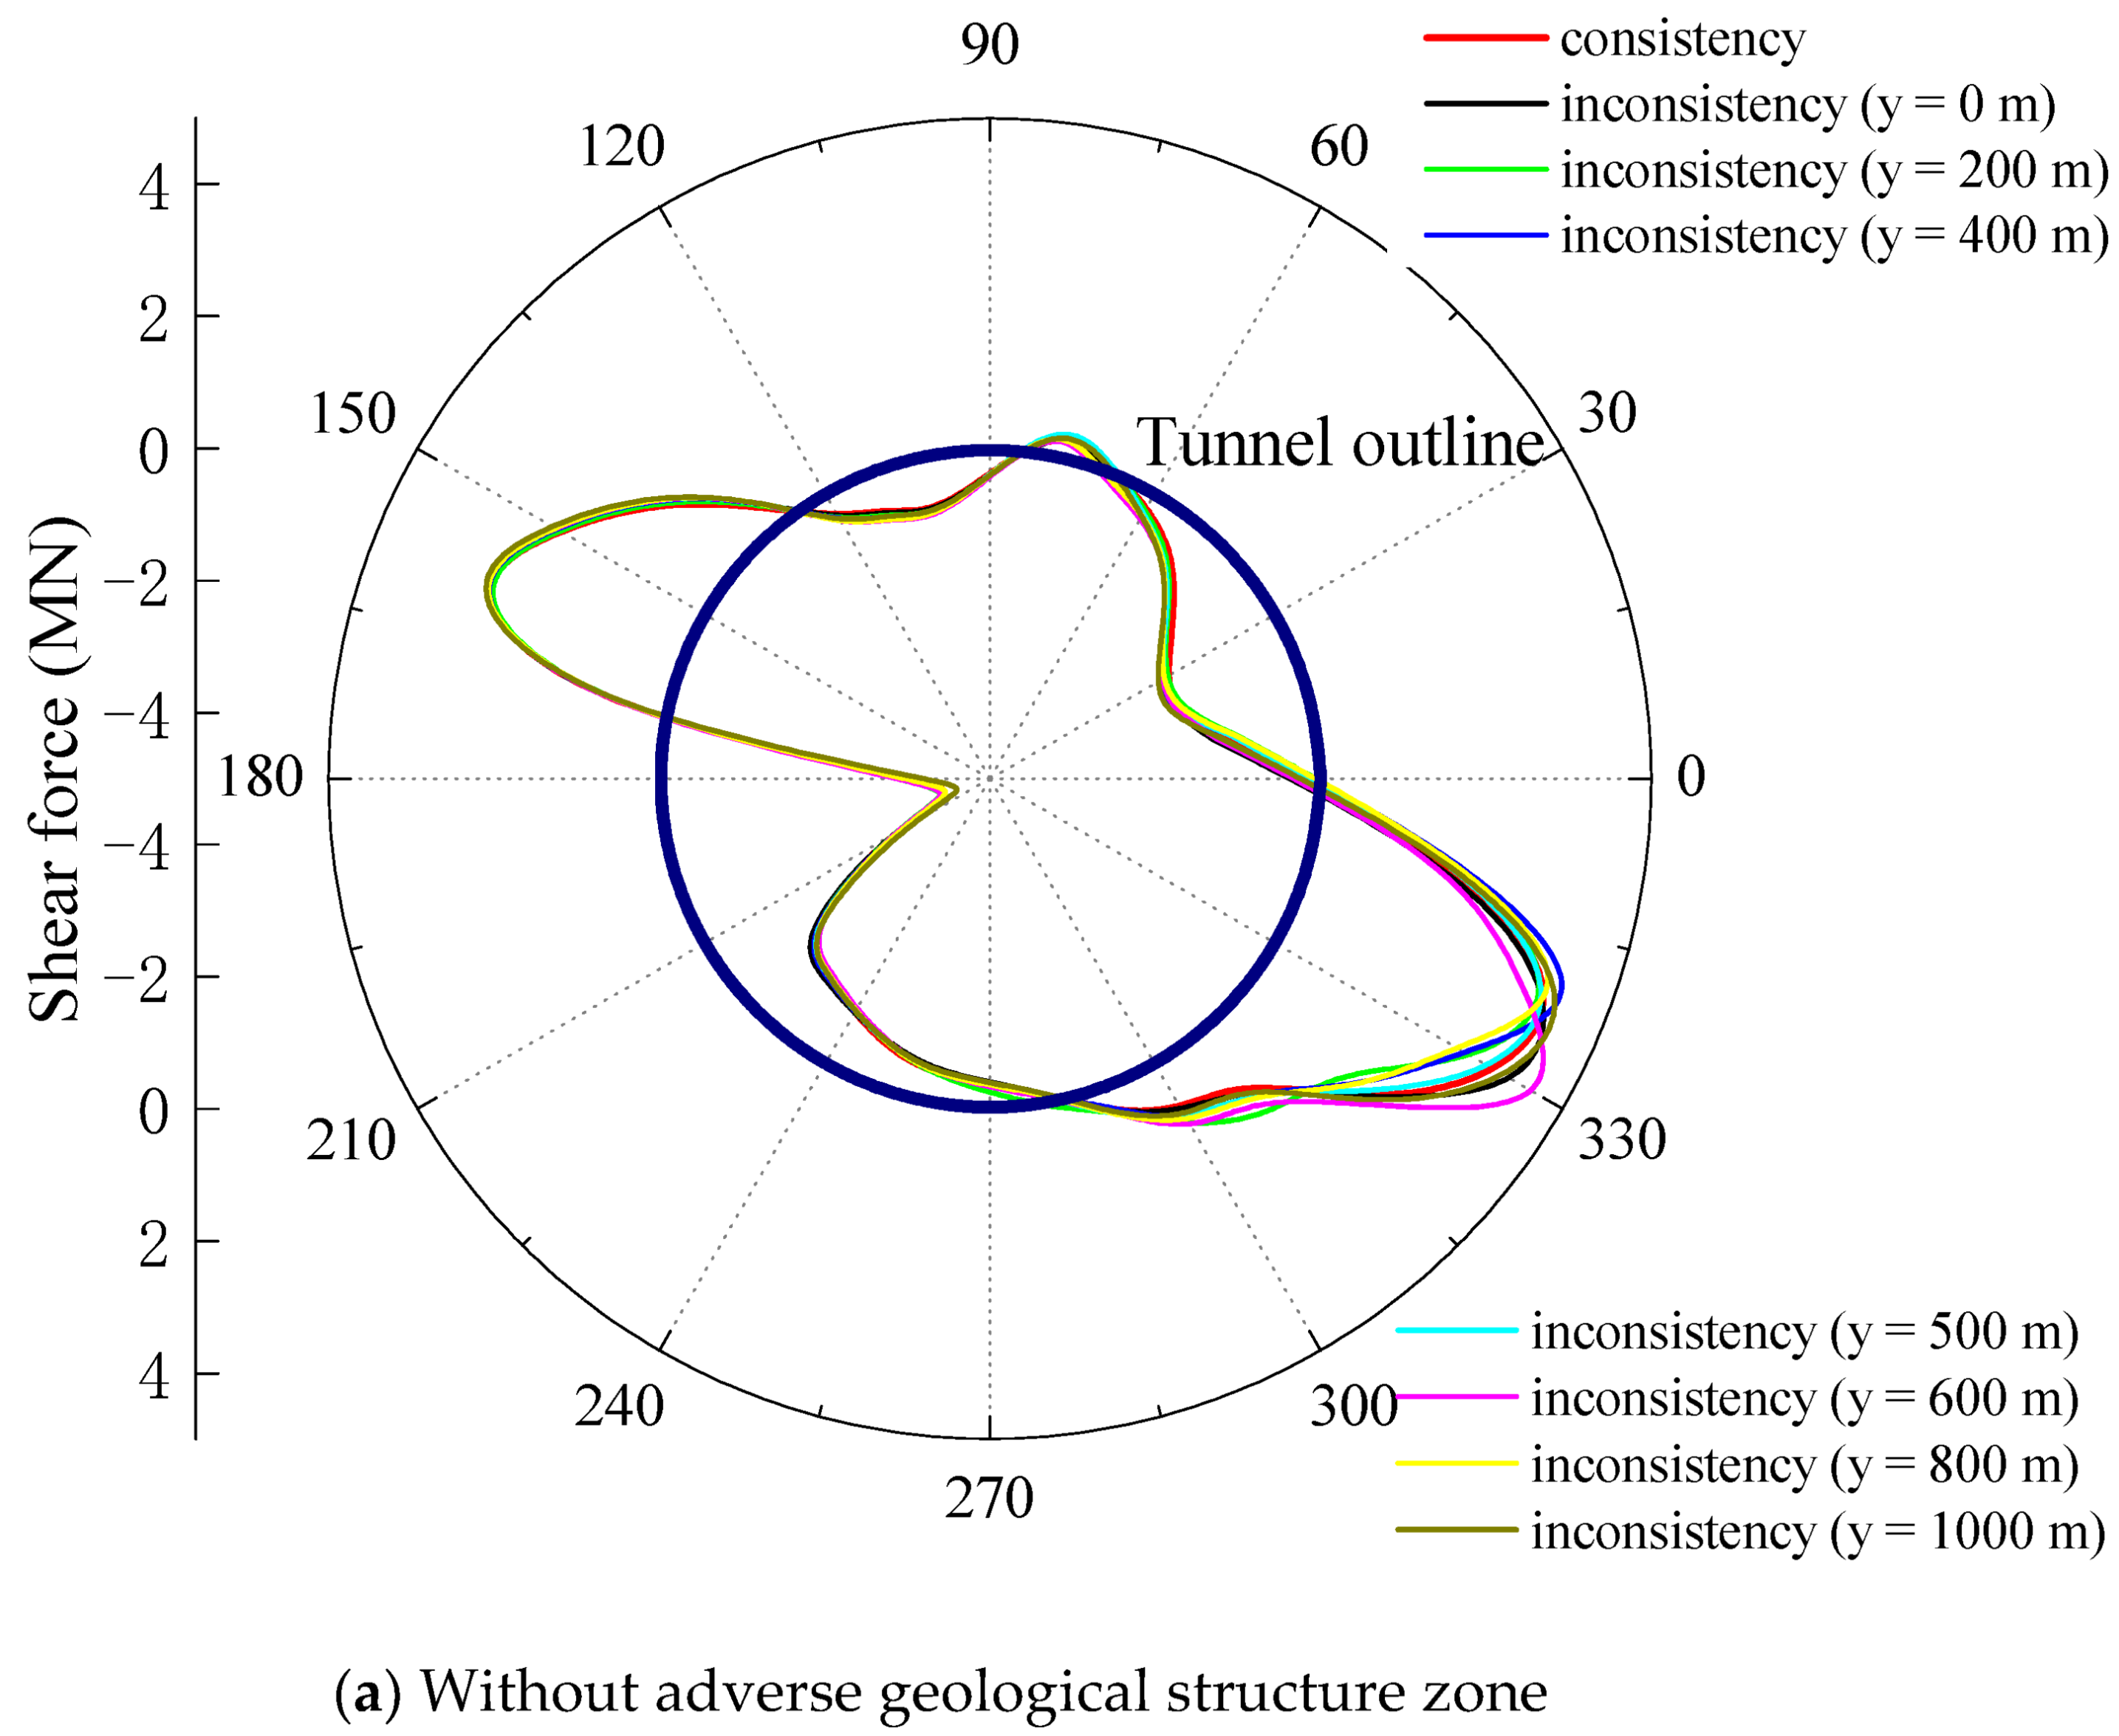
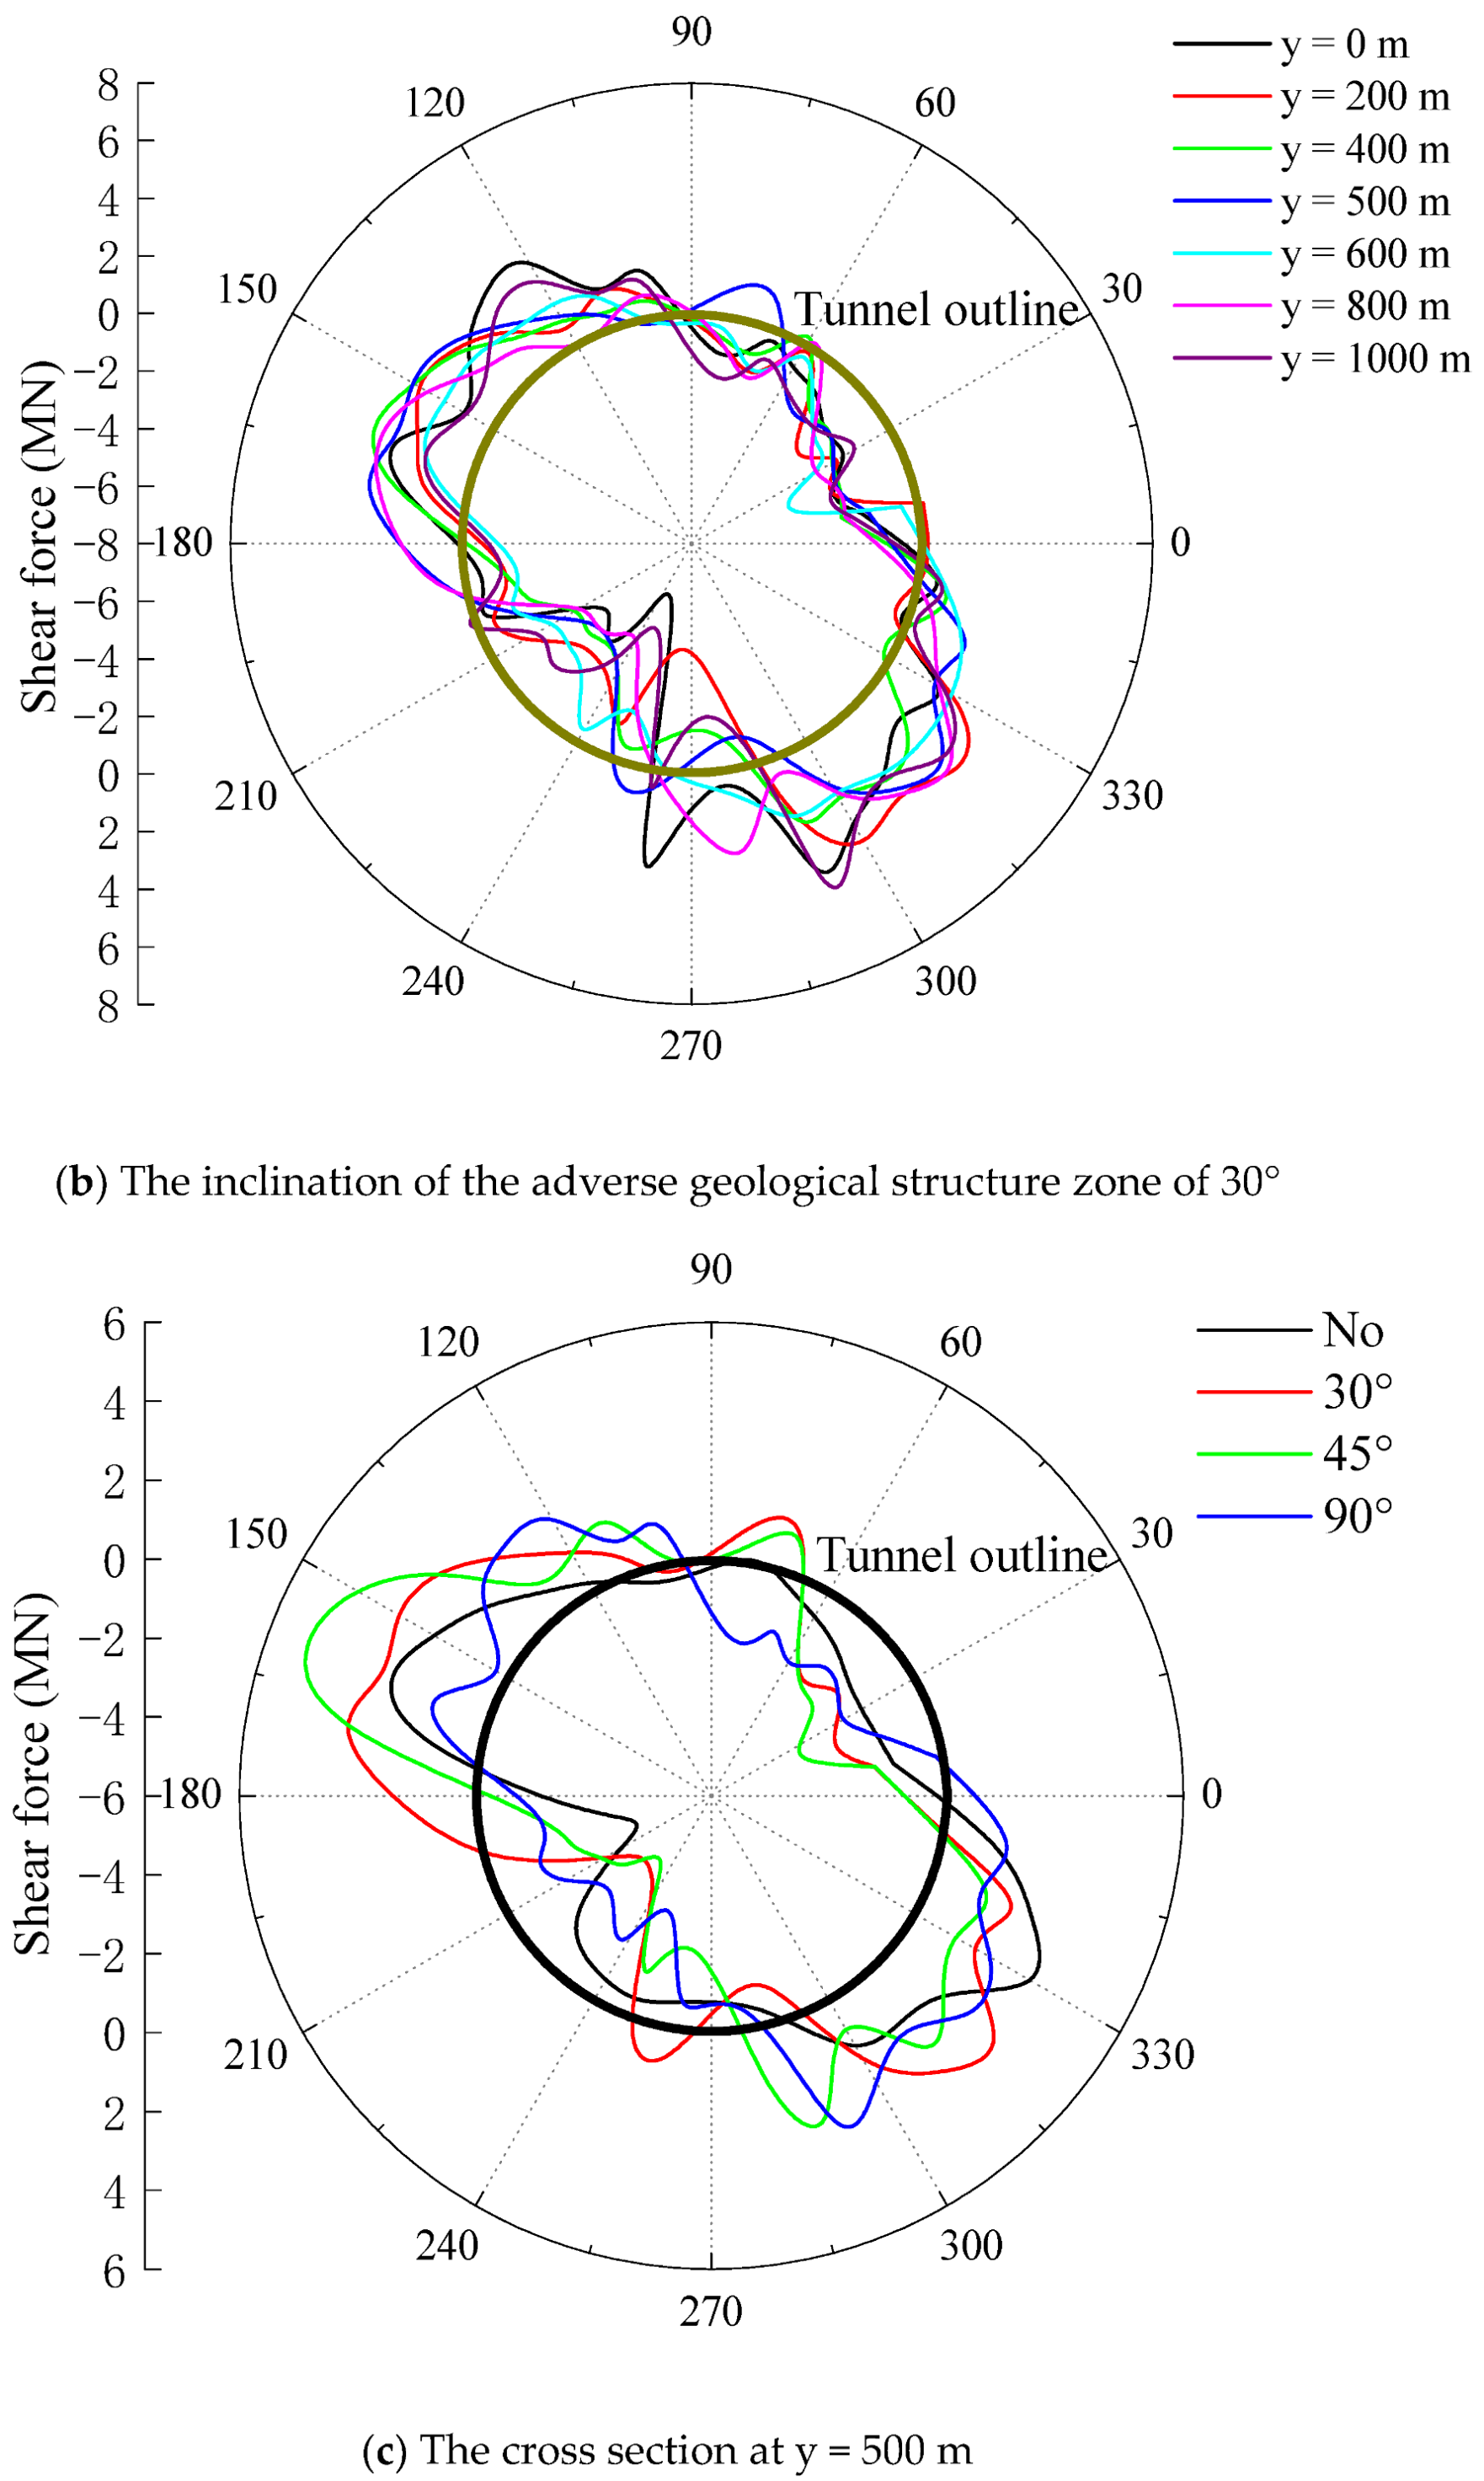
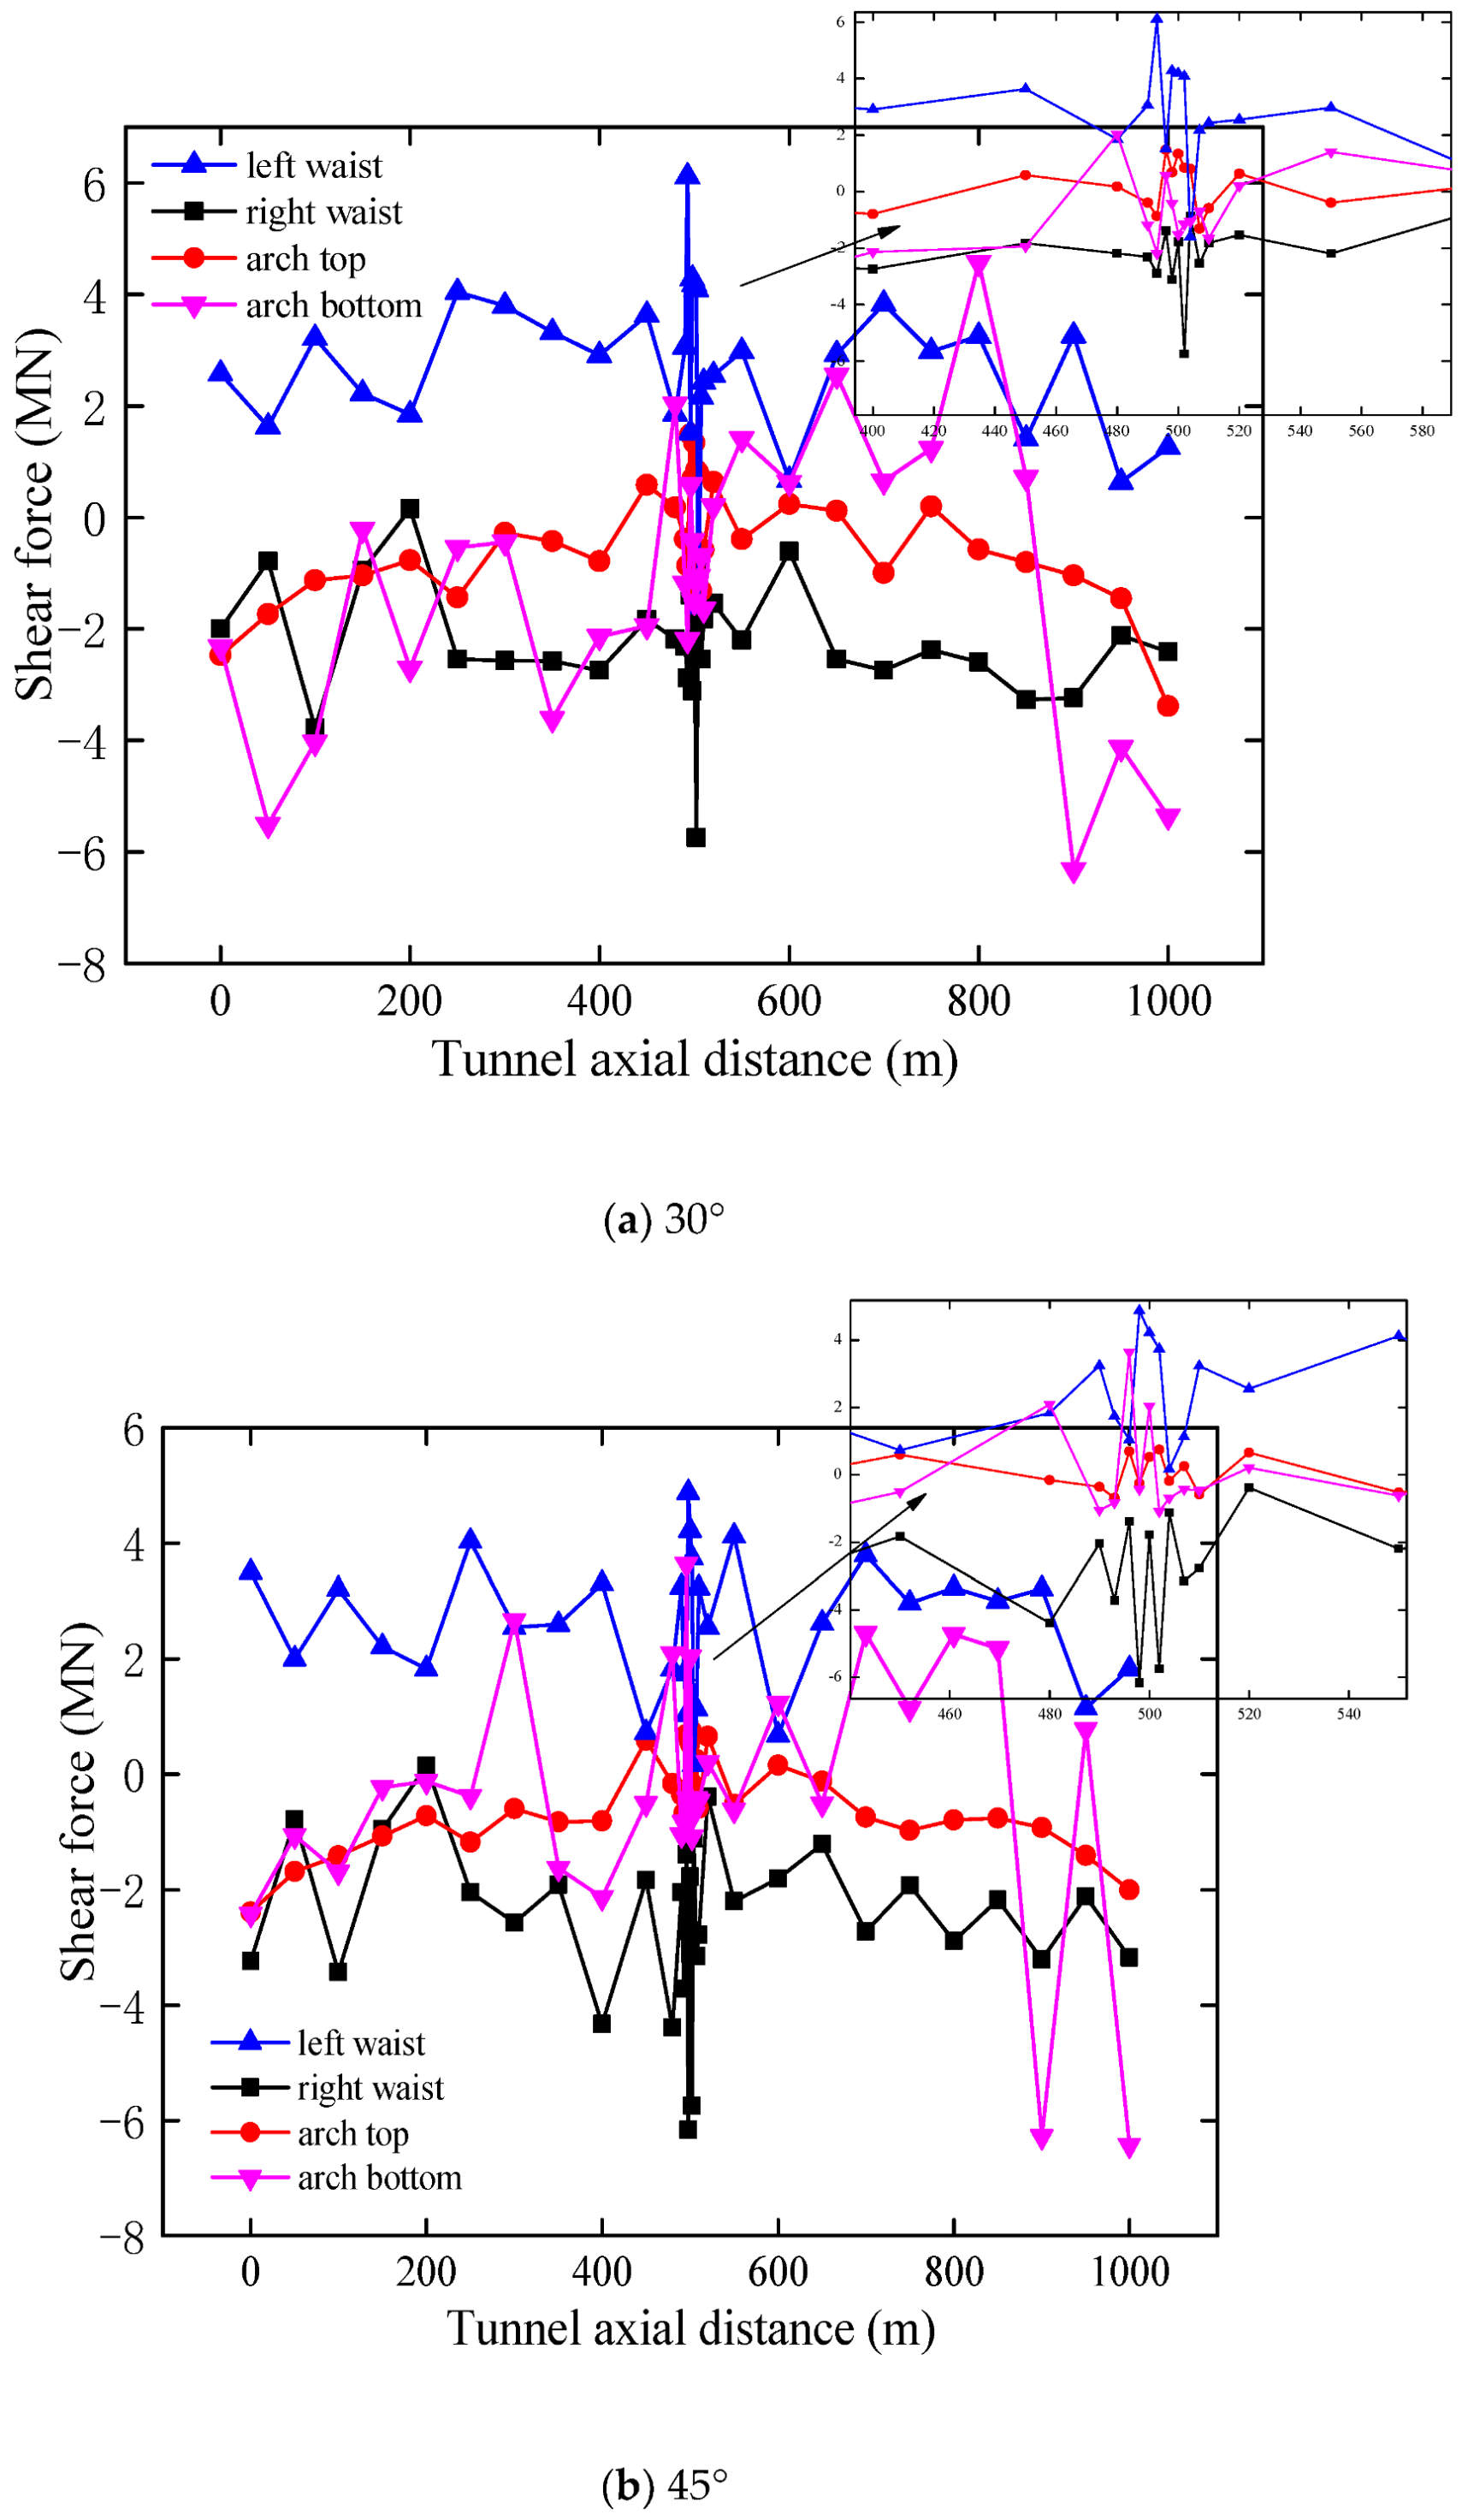
3.3.1. Influence of Inclination

Figure 10 shows the distribution of the peak shear force along the axial section of the tunnel with different inclinations of the adverse zone. The tunnel outline in the figure means that the shear force is 0. It can be found that the distribution of the peak shear force of the lining in the case of non-uniform seismic input is similar to that in the case of uniform seismic input. The maximum positive shear occurs at near 160° and 340°, and the maximum negative shear occurs at near 30° and 210°. However, there are some differences in values between these two cases, mainly concentrated in the lower right part of the tunnel. Overall, the shear curve of the lining under the uniform seismic input is also a special case of the non-uniform seismic input, as shown in Figure 10a. Similarly, the shear distribution along the tunnel axial direction with an adverse zone is relatively complex, as shown in Figure 10b, but the shear distribution in each cross section is similar. The maximum positive shear occurs at near 120°~170° and 290°~320°, and the maximum negative shear occurs at near 10°~40° and 210°~250°. By comparing the peak shear force curve of the lining at the cross section y = 500 m with different inclinations of the adverse zone, as shown in Figure 10c, it is observed that the distribution of the lining shear force is also the same in all directions of the tunnel. Overall, the lining shear force is greater with the adverse geological structure zone than that without the adverse zone; furthermore, the positive shear force of the lining is the largest when the adverse geological structure zone inclination angle is 45°.
Figure 11 shows the variation of the peak shear force of the lining monitoring points along the tunnel axis with different inclinations of the adverse zone. As can be seen from the figure, when the inclination angle of the adverse zone is 30°, the peak shear force and the change degree of the monitoring points along the axial top of the tunnel are smaller than that of other monitoring points. Although the difference between the peak shear force of the left and right waist monitoring points is not obvious, their change paces are completely opposite. The peak shear force of the right waist is negative, while the peak shear force of the left waist is positive. The shear force at the bottom monitoring point changes the most drastically, from the tunnel entrance to the adverse zone, the peak shear force at the bottom monitoring point is negative. Because of the adverse geological structure zone, from the adverse zone to the tunnel exit section, the peak shear force at this monitoring point becomes positive, and it becomes negative only near the exit section. In addition, the shear force at all monitoring points fluctuates strongly in the area around the adverse zone, especially at the left and right waist monitoring points, as shown in Figure 11a. When the inclination angle of the adverse zone is 45°, the change of the peak shear force is similar to that at the inclination angle of 30°. Except for the bottom monitoring point, the peak shear force along the tunnel axial variation at other monitoring points is less than that with the inclination angle being 30° in the section without the adverse geological structure zone, but greater than that at the 30° inclination angle in the section crossing through the adverse geological structure zone, as shown in Figure 11b. When the inclination angle of the adverse zone is 90°, the trend of the peak shear force variation along the tunnel axial direction at the lining monitoring points in each part of the tunnel is different from that at the inclination angle of 30°, as shown in Figure 11c. Firstly, compared with other monitoring points, although the degree of shear force variation at the top monitoring point is the smallest, the magnitude of the variation is greater. Secondly, the trend and degree of variation of the shear force with tunnel axial direction at the bottom monitoring point are completely different from other cases. Finally, the shear force at all monitoring points fluctuates more strongly around the adverse zone, and the most violent points are located in the left waist and bottom of the tunnel. Comparing the shear force peak along the tunnel axial direction at the right waist monitoring points under different inclination angles of the adverse zone, it can be found that the degree of variation of the lining shear force of the tunnel passing through the adverse geological structure zone is significantly greater than that without the adverse zone, and it presents a strong inconsistency. From the tunnel entrance to the cross section at y = 200 m, the peak shear force at the right waist monitoring point with different inclinations of the adverse zone is basically comparable, and after 200 m, the difference is increased. In the section without the adverse zone, the magnitude and the variation of the peak shear force at the right waist monitoring point for the 90° inclination are larger than other cases, while around the adverse zone, the magnitude and the variation of the peak shear force at the right waist monitoring point for the 45° inclination are the largest, as shown in Figure 11d.

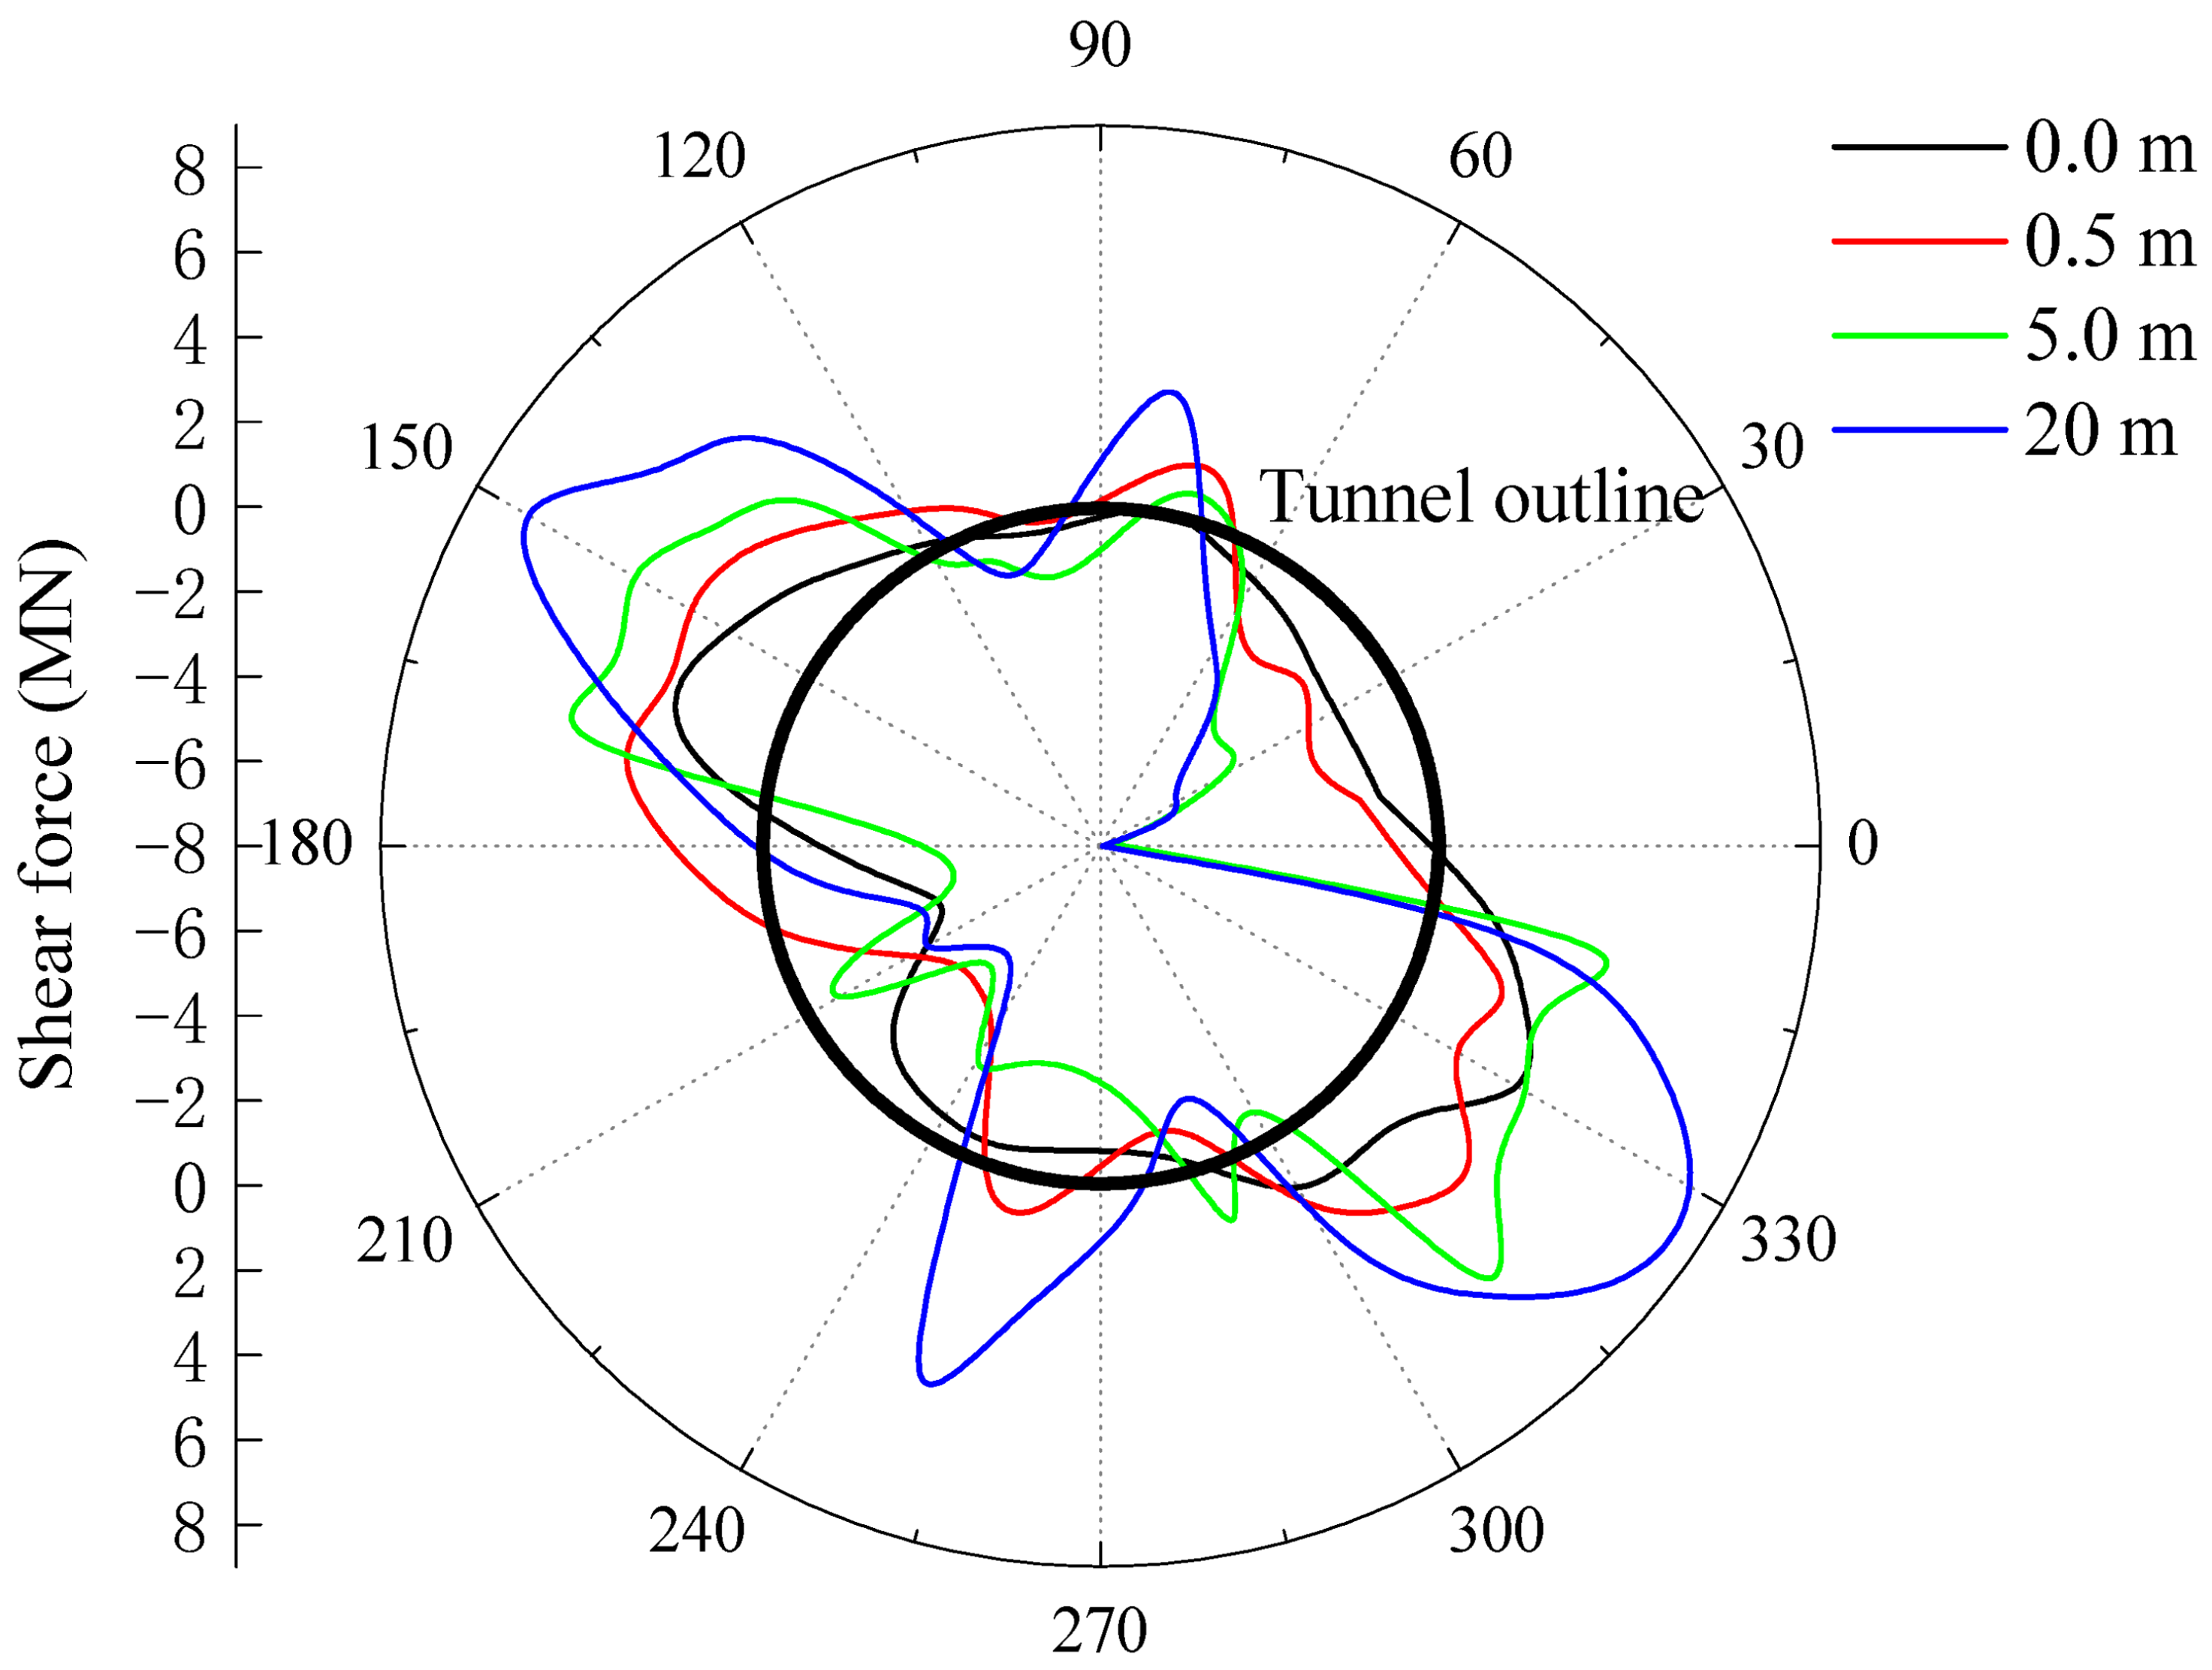
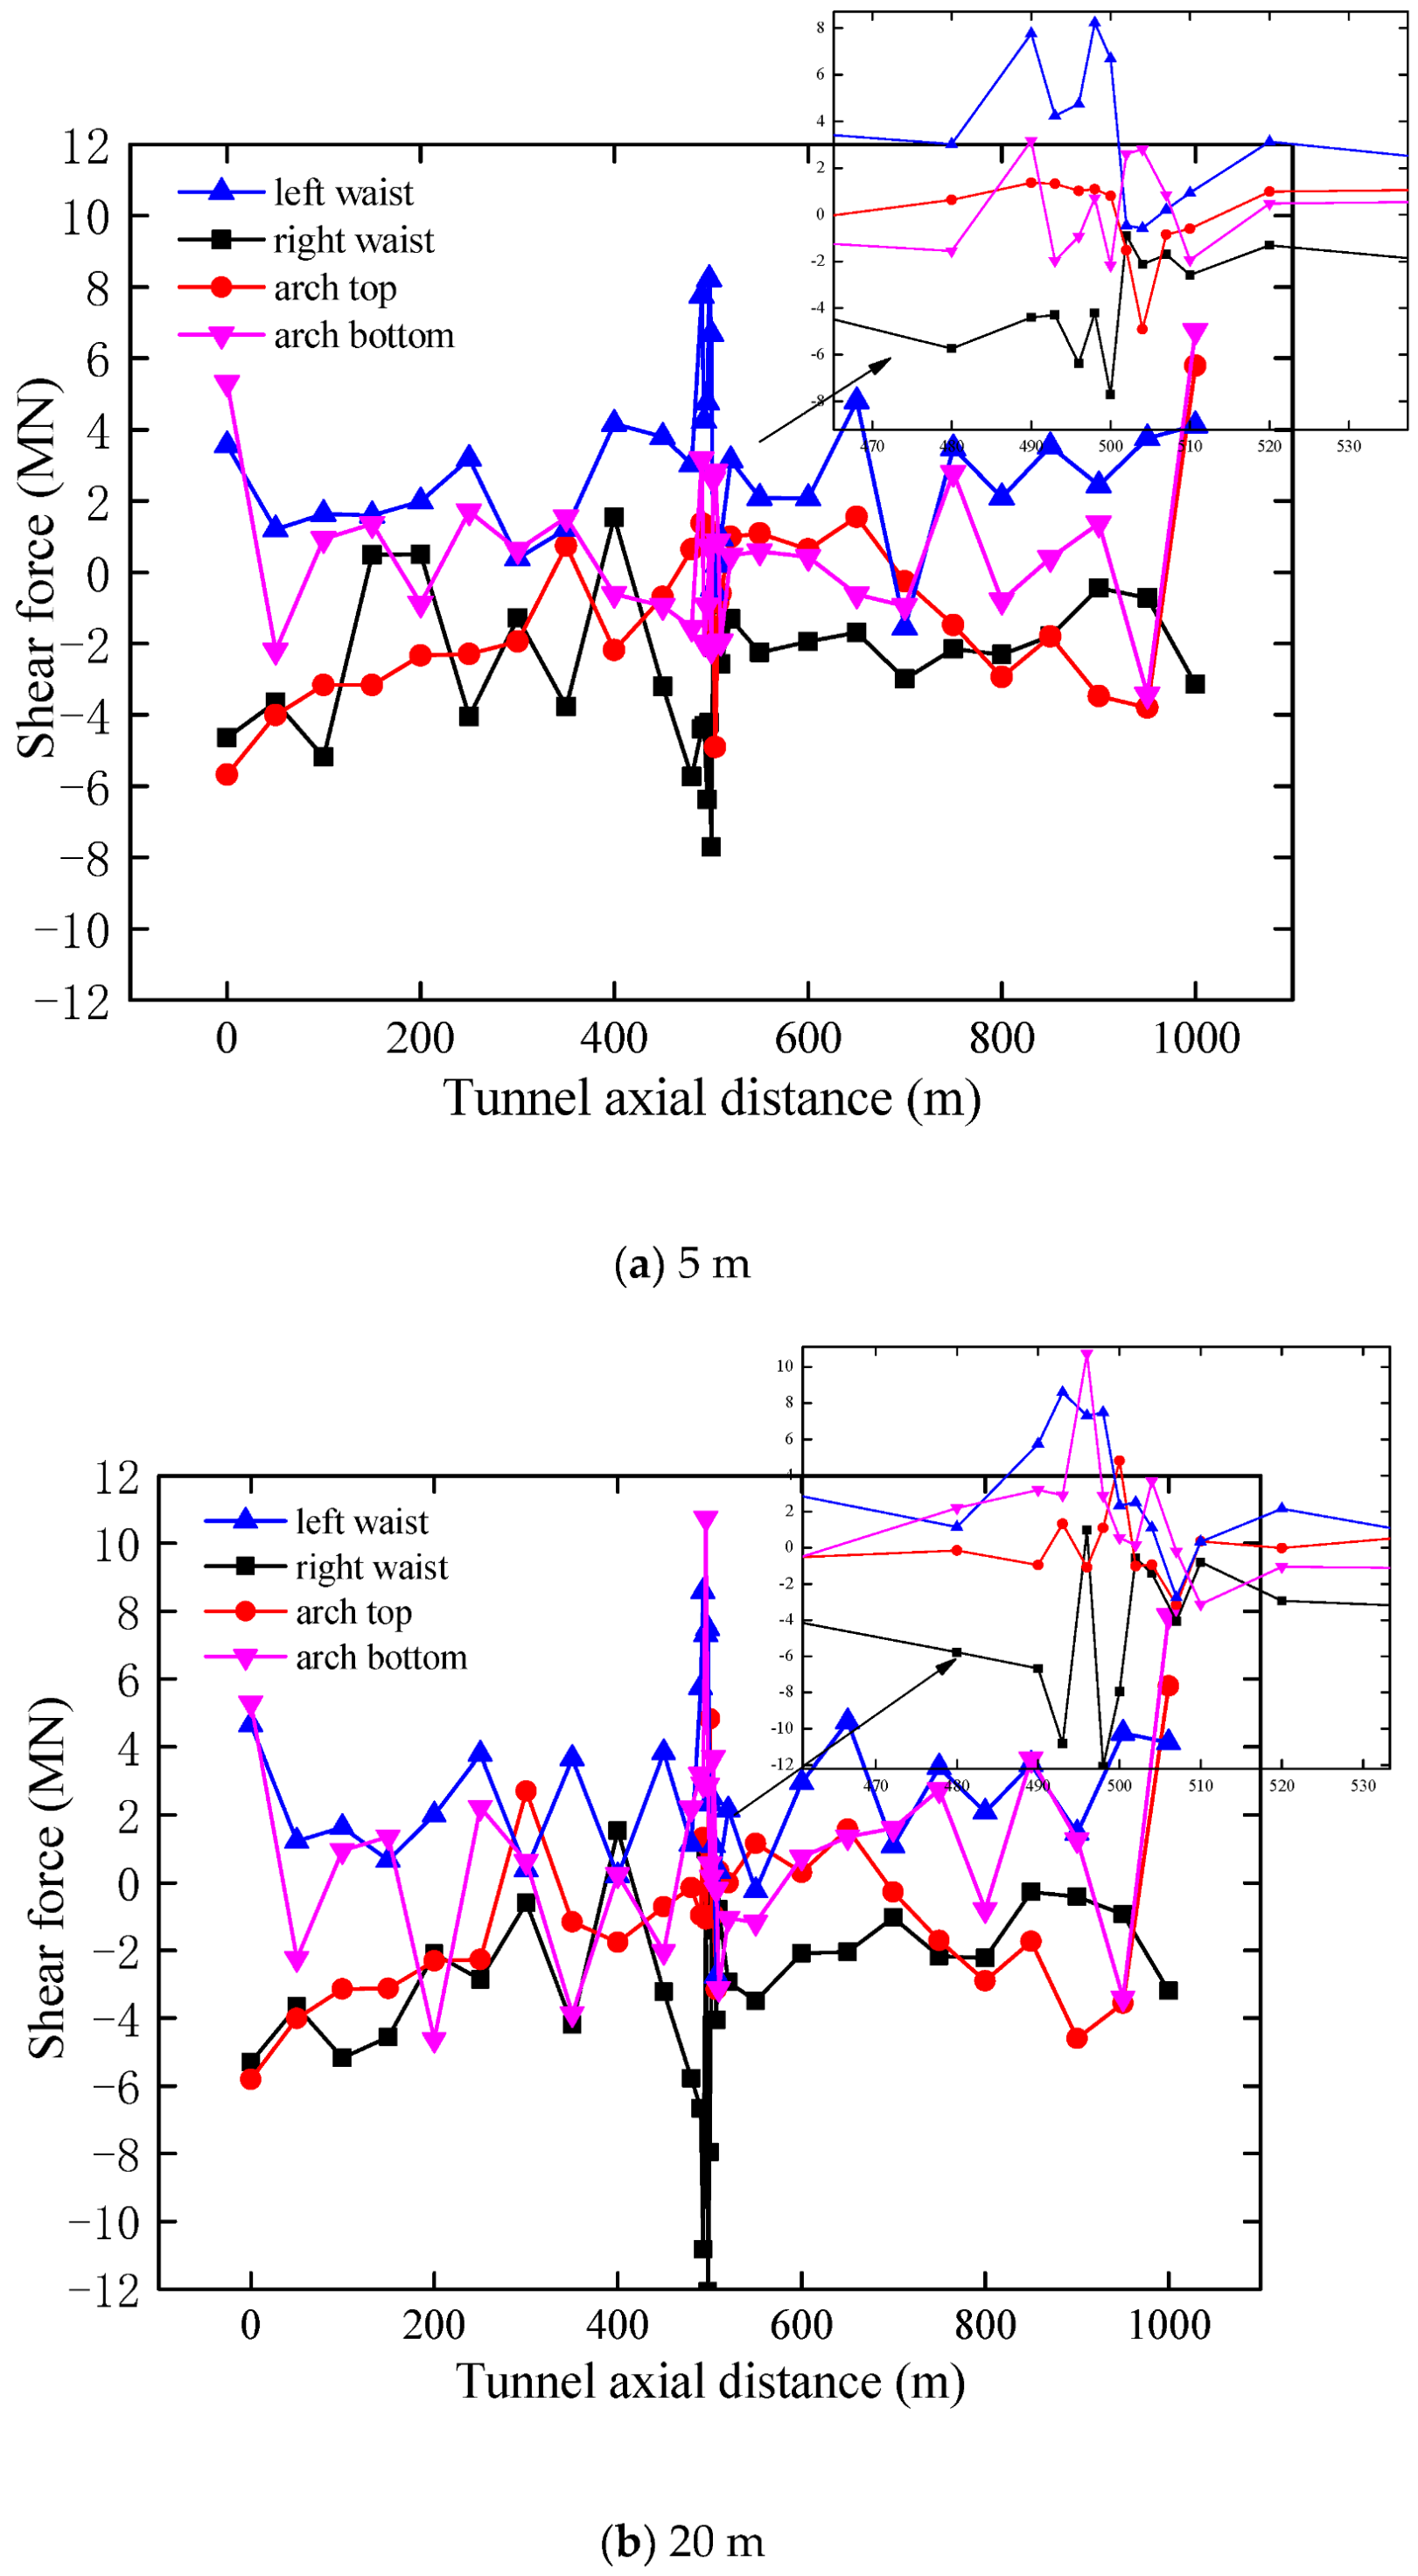
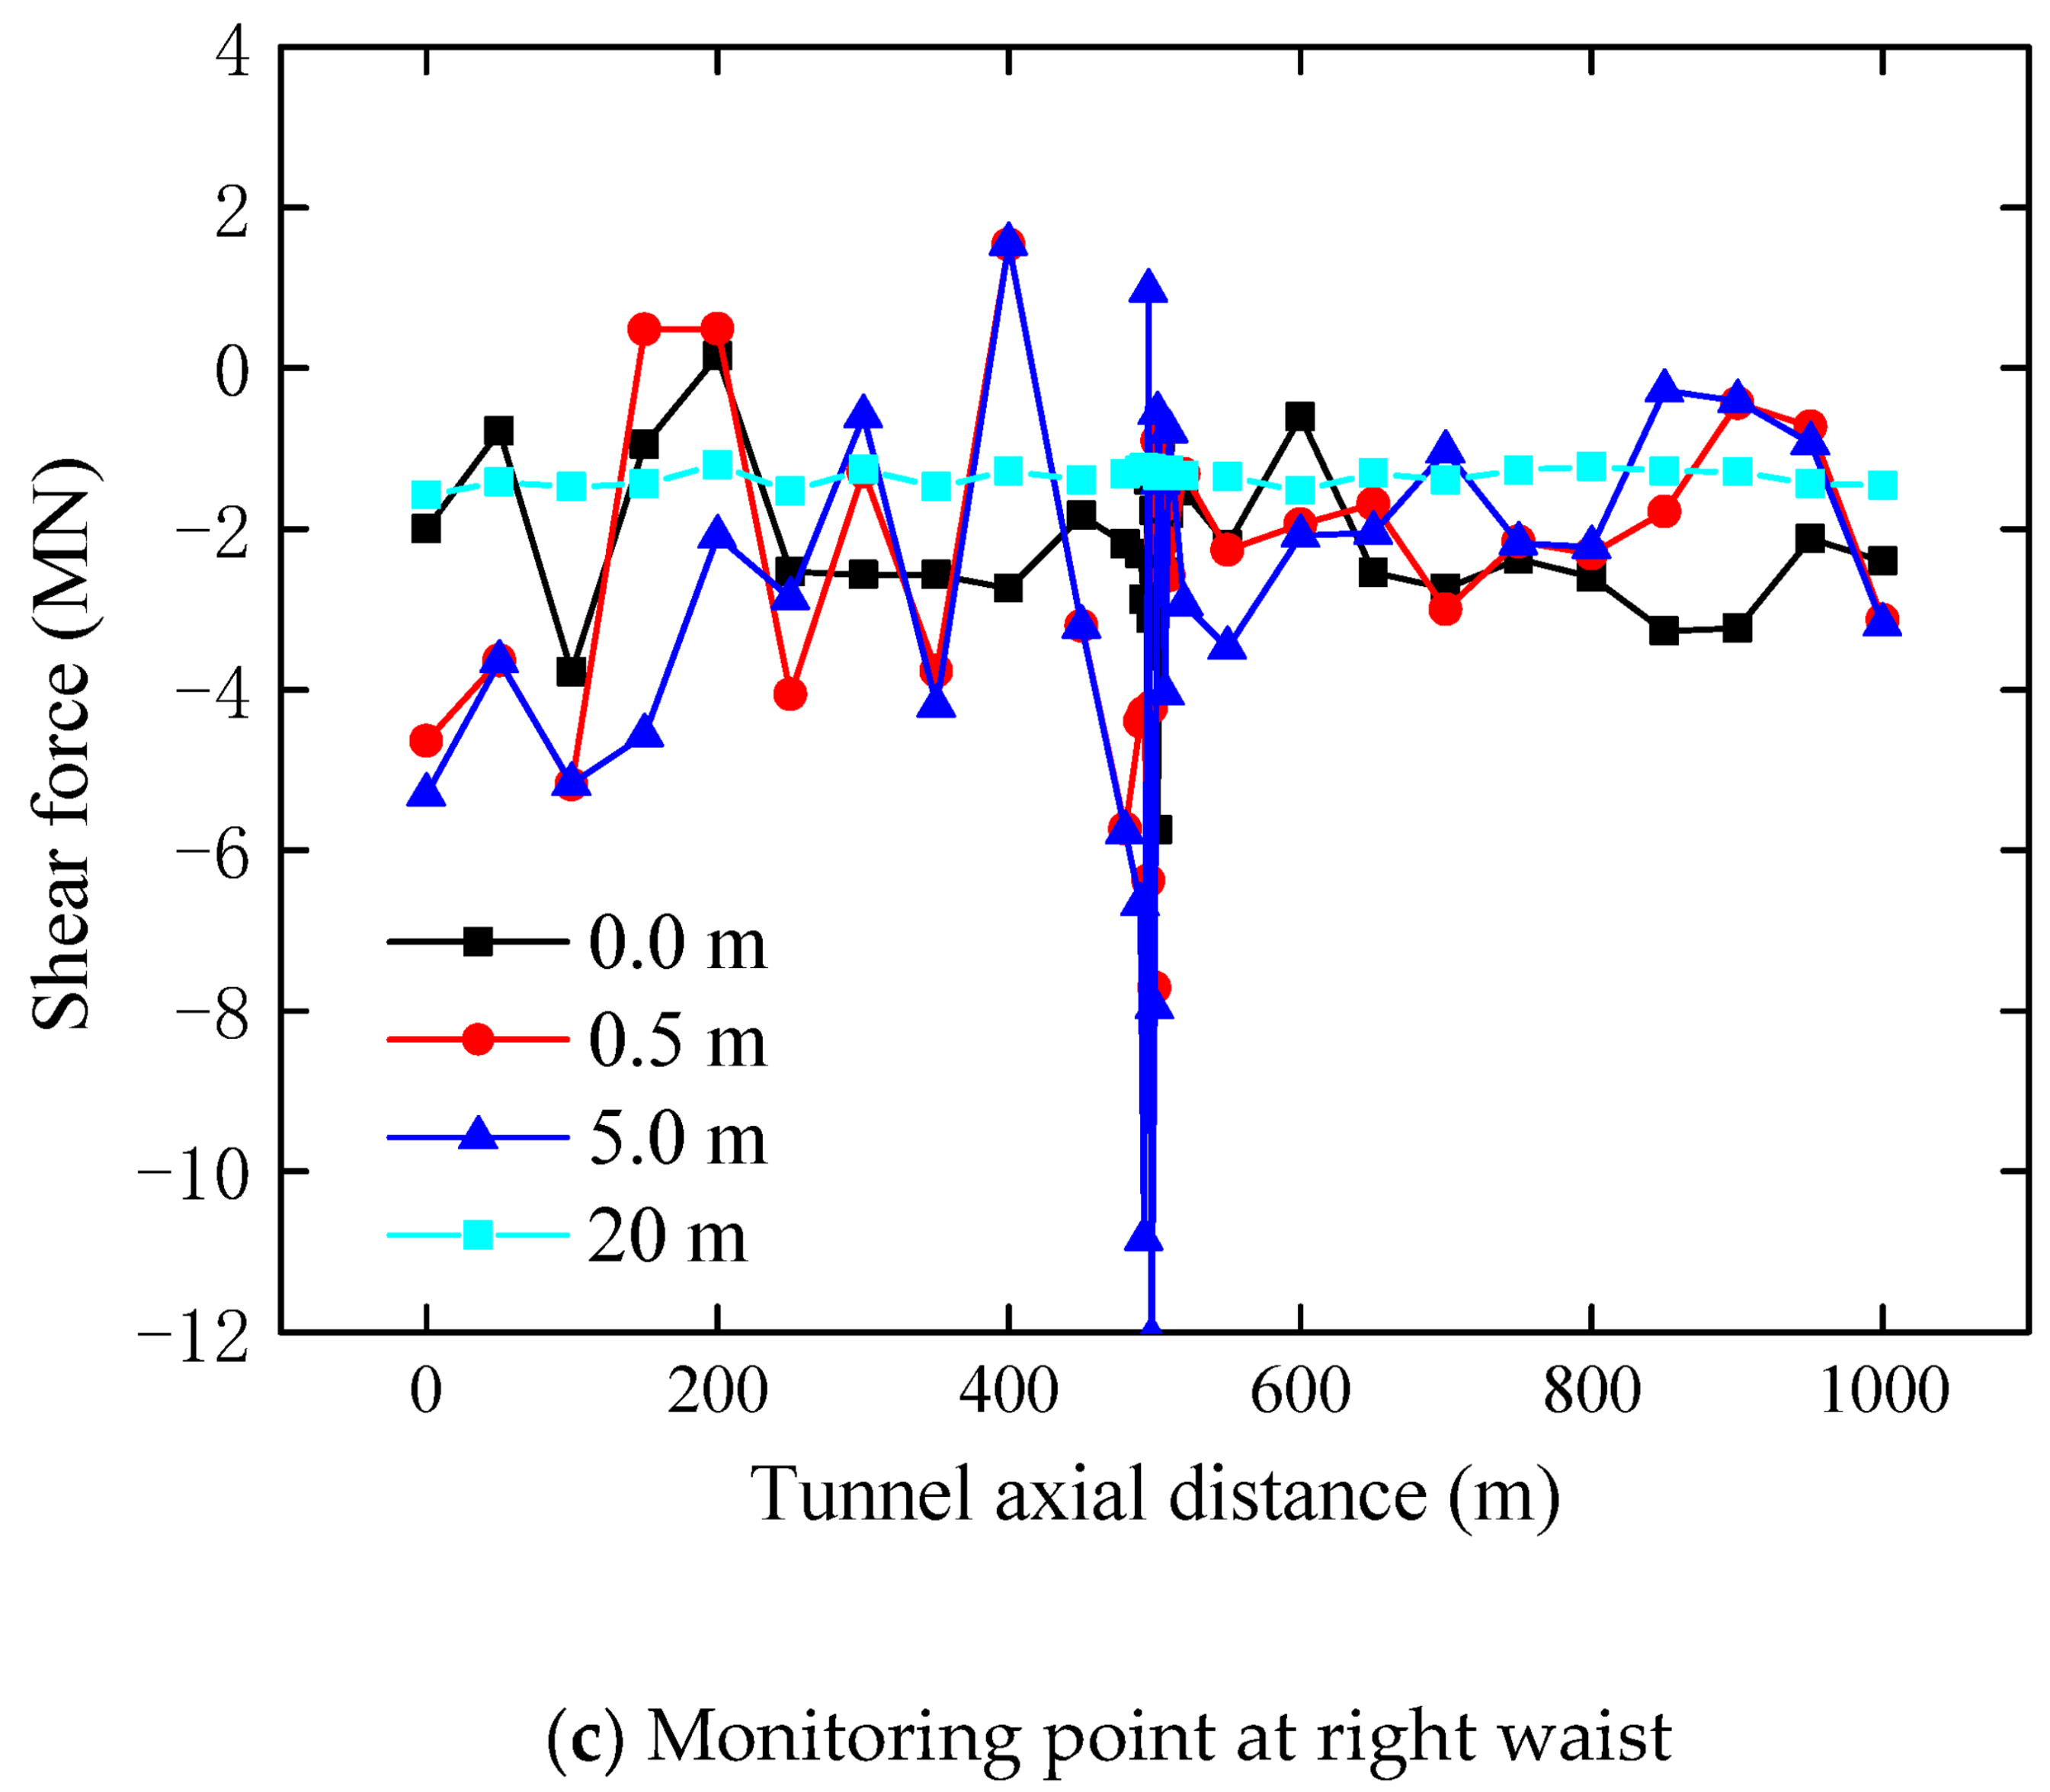
3.3.2. Influence of Thickness

Figure 12 shows the variation of the peak shear force of the lining at the location of the y = 500 m section with different thicknesses of the adverse zone. It can be found that the distribution of the shear force is also the same in all directions of the tunnel cross section. On the whole, the lining shear force with the adverse geological structure zone is bigger than that without the adverse zone. Further, the greater the thickness of the adverse zone, the greater the lining shear force is, especially if the thickness of the adverse zone is 20 m, the maximum value of the positive and negative lining shear force is at least 2 MN. larger than that of other cases.
Figure 13 shows the variation of the peak shear force of the lining monitoring points along the tunnel axis with different thicknesses of the adverse zone. As can be seen from the figure, if the thickness of the adverse zone is 5 m, the trend of the peak shear force at the top monitoring point along the tunnel axial direction is symmetrical along the midpoint of the tunnel. Although the shear peaks at the left and right waist monitoring points are similar in numerical value, the pace of their changes is approximately opposite, i.e., the shear peak at the right waist being negative while that at the left waist is positive. The peak shear at the bottom monitoring point varies more strongly at the entrance and exit sections of the tunnel, while the other sections are relatively stable. Similarly, the peak shear force at all monitoring points fluctuates more strongly around the adverse zone, especially at the left and right waist monitoring points, as shown in Figure 13a. If the thickness of the adverse zone is 20 m, the trend of the peak shear force at each monitoring point is similar to that of the thickness of 5 m. However, the variation of the peak shear force at all monitoring points in the part of the tunnel crossing through the adverse zone is significantly greater than that at 5 m thickness, as shown in Figure 13b. Comparing the variation of the peak shear force along the tunnel axial direction at the right waist monitoring points with different thicknesses of the adverse zone, it can be found that the variation of the tunnel-lining shear force is significantly larger than that without the adverse zone, and it shows a strong inconsistency. The peak shear force at the right waist monitoring point from the tunnel entrance to the adverse zone is the same with the thickness of 5 m and 20 m, and both are greater than the thickness of 0.5 m. From the section around the adverse zone to the tunnel exit, the peak shear force at the right waist monitoring point with thicknesses of 5 m and 20 m is also the same, but the trend is almost opposite to that at a thickness of 0.5 m. In the section around the adverse zone, the magnitude and the variation of the peak shear force of the right waist monitoring point at the adverse zone thickness of 20 m are the largest, as shown in Figure 13c.

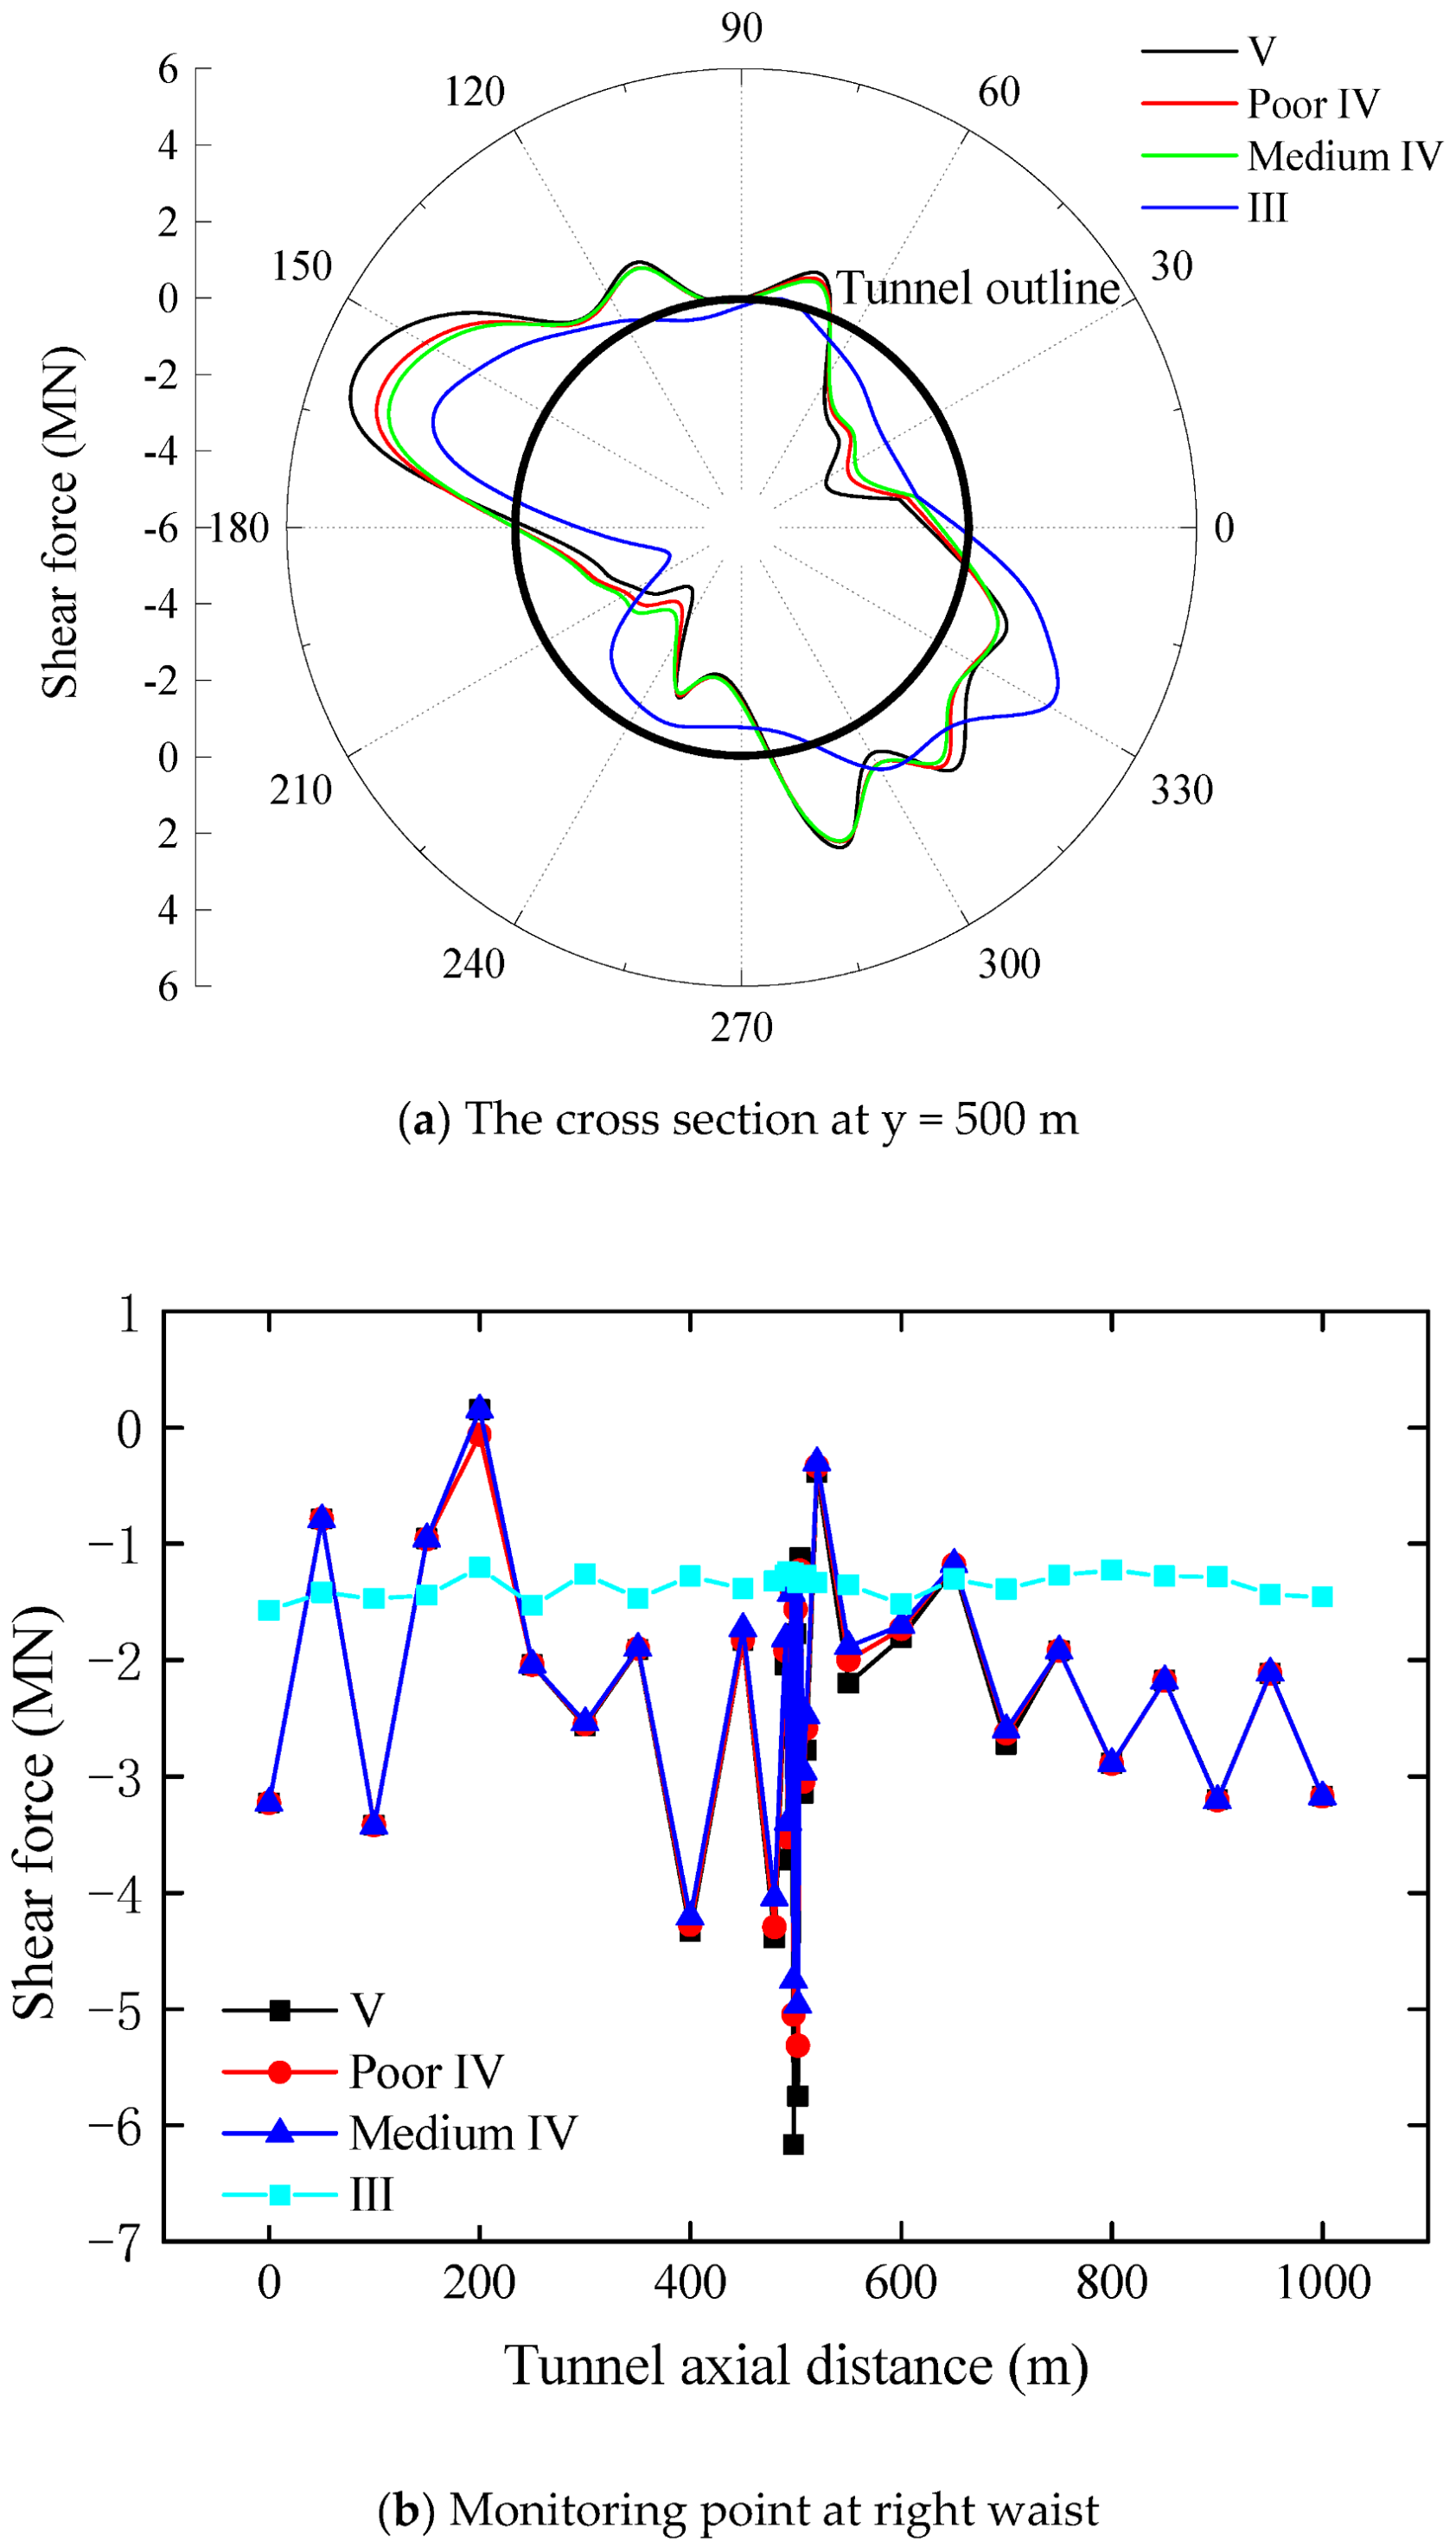
3.3.3. Influence of Lithology

The distribution of the peak shear force of the lining at the position of the y = 500 m section under the different lithologies adverse zone is shown in Figure 14a. It can be found that the distribution of the shear force with different lithologies in the adverse zone is the same in all directions of the tunnel. The lining shear force with the adverse geological structure zone is bigger than that without the adverse zone. Further, the worse the lithology of the adverse zone, the higher the lining shear force is. Comparing the variation of the peak shear force at the right waist monitoring point under different lithologies, as shown in Figure 14b, it can be found that the variation of the lining shear with the adverse geological structure zone is significantly larger than that without the adverse zone, and it presents a strong inconsistency. Except near the location of the adverse geological structure zone, the shear force along the tunnel axial direction is the same for different lithologies in adverse zones. Around the location of the adverse zone, the worse the lithology of the adverse zone, the larger the lining bending moment is.

4. Safety Factor of Lining Structure

4.1. Calculation of Safety Factor

Based on the Code for Design of Highway Tunnels (JTG 3370.1-2018), the safety factor of concrete and masonry rectangular section axial and eccentric compression members is
K φ β R a b h N
where φ is the longitudinal bending coefficient, which can be taken as 1 for the tunnel lining. R a is the ultimate compressive strength of concrete, and β is the eccentric influence coefficient of the axial force, which can be obtained according to the following formula
β = 1 + 0.648 e h 12.569 e h 2 + 15.444 e h 3
e is the axial force eccentricity.
According to the crack resistance requirements, the tensile safety factor of concrete rectangular section eccentric compression members is
K 1.75 R l b h 6 e h 1 N
R l is the ultimate tensile strength of concrete.

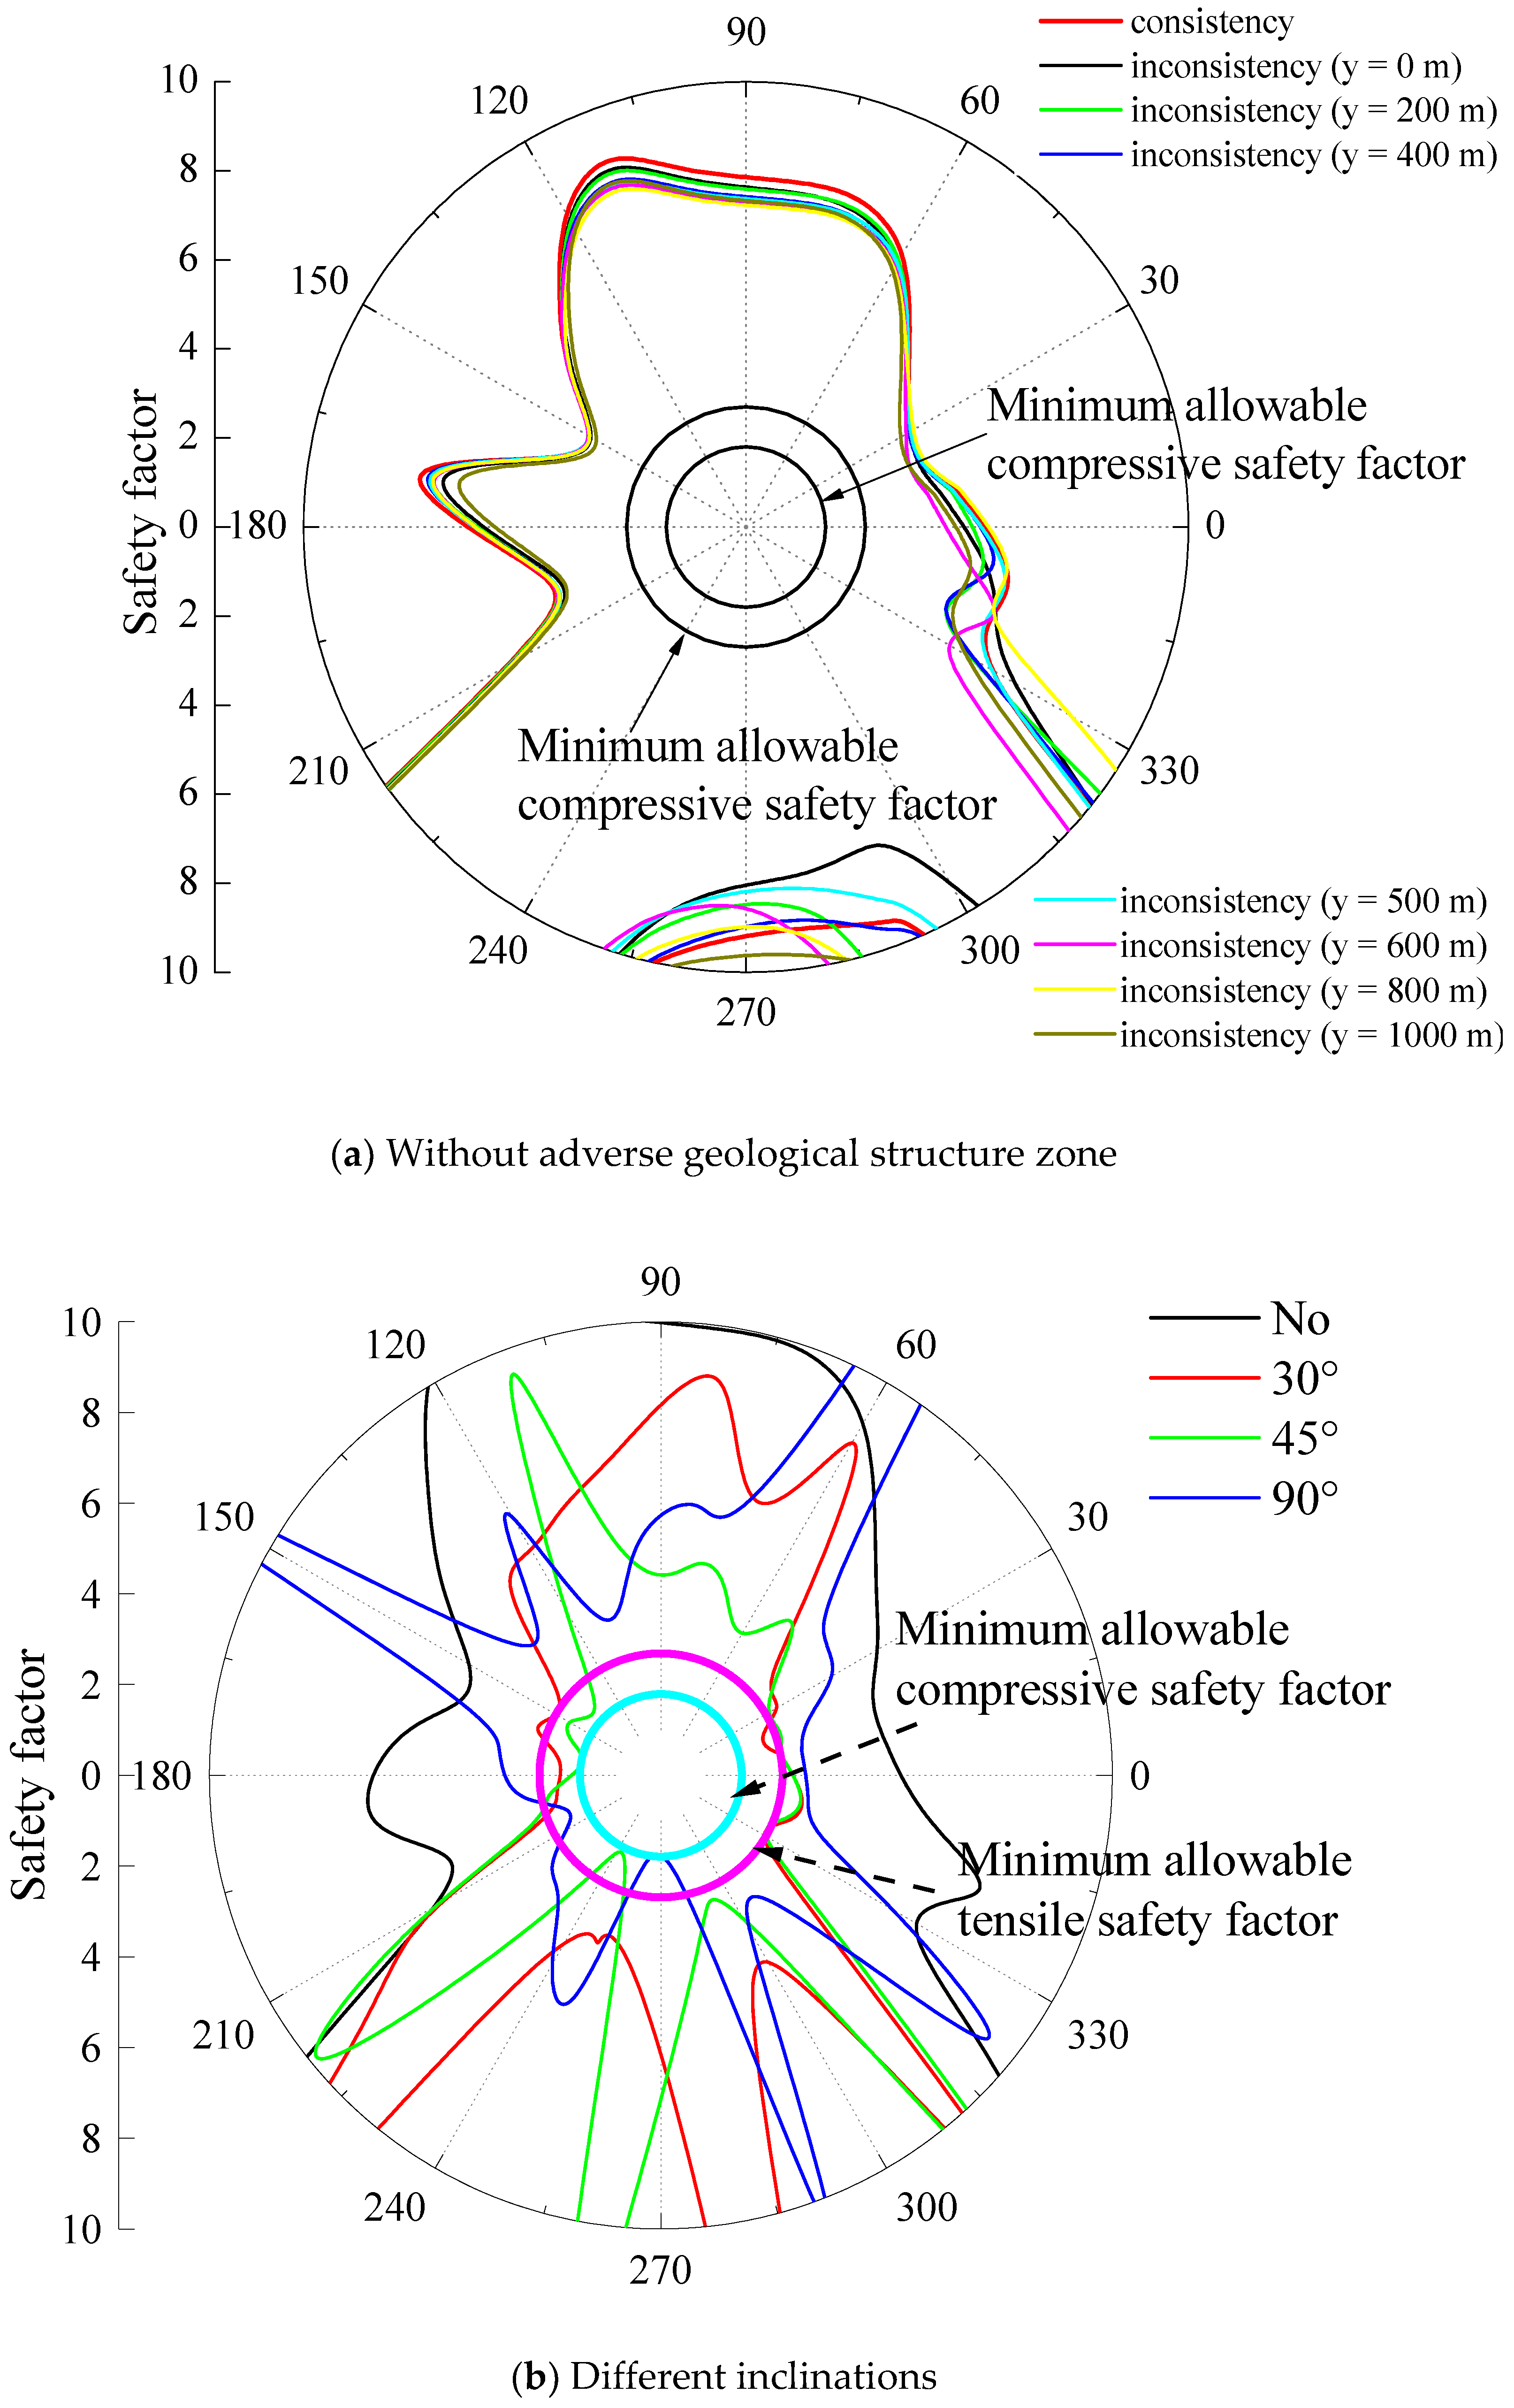
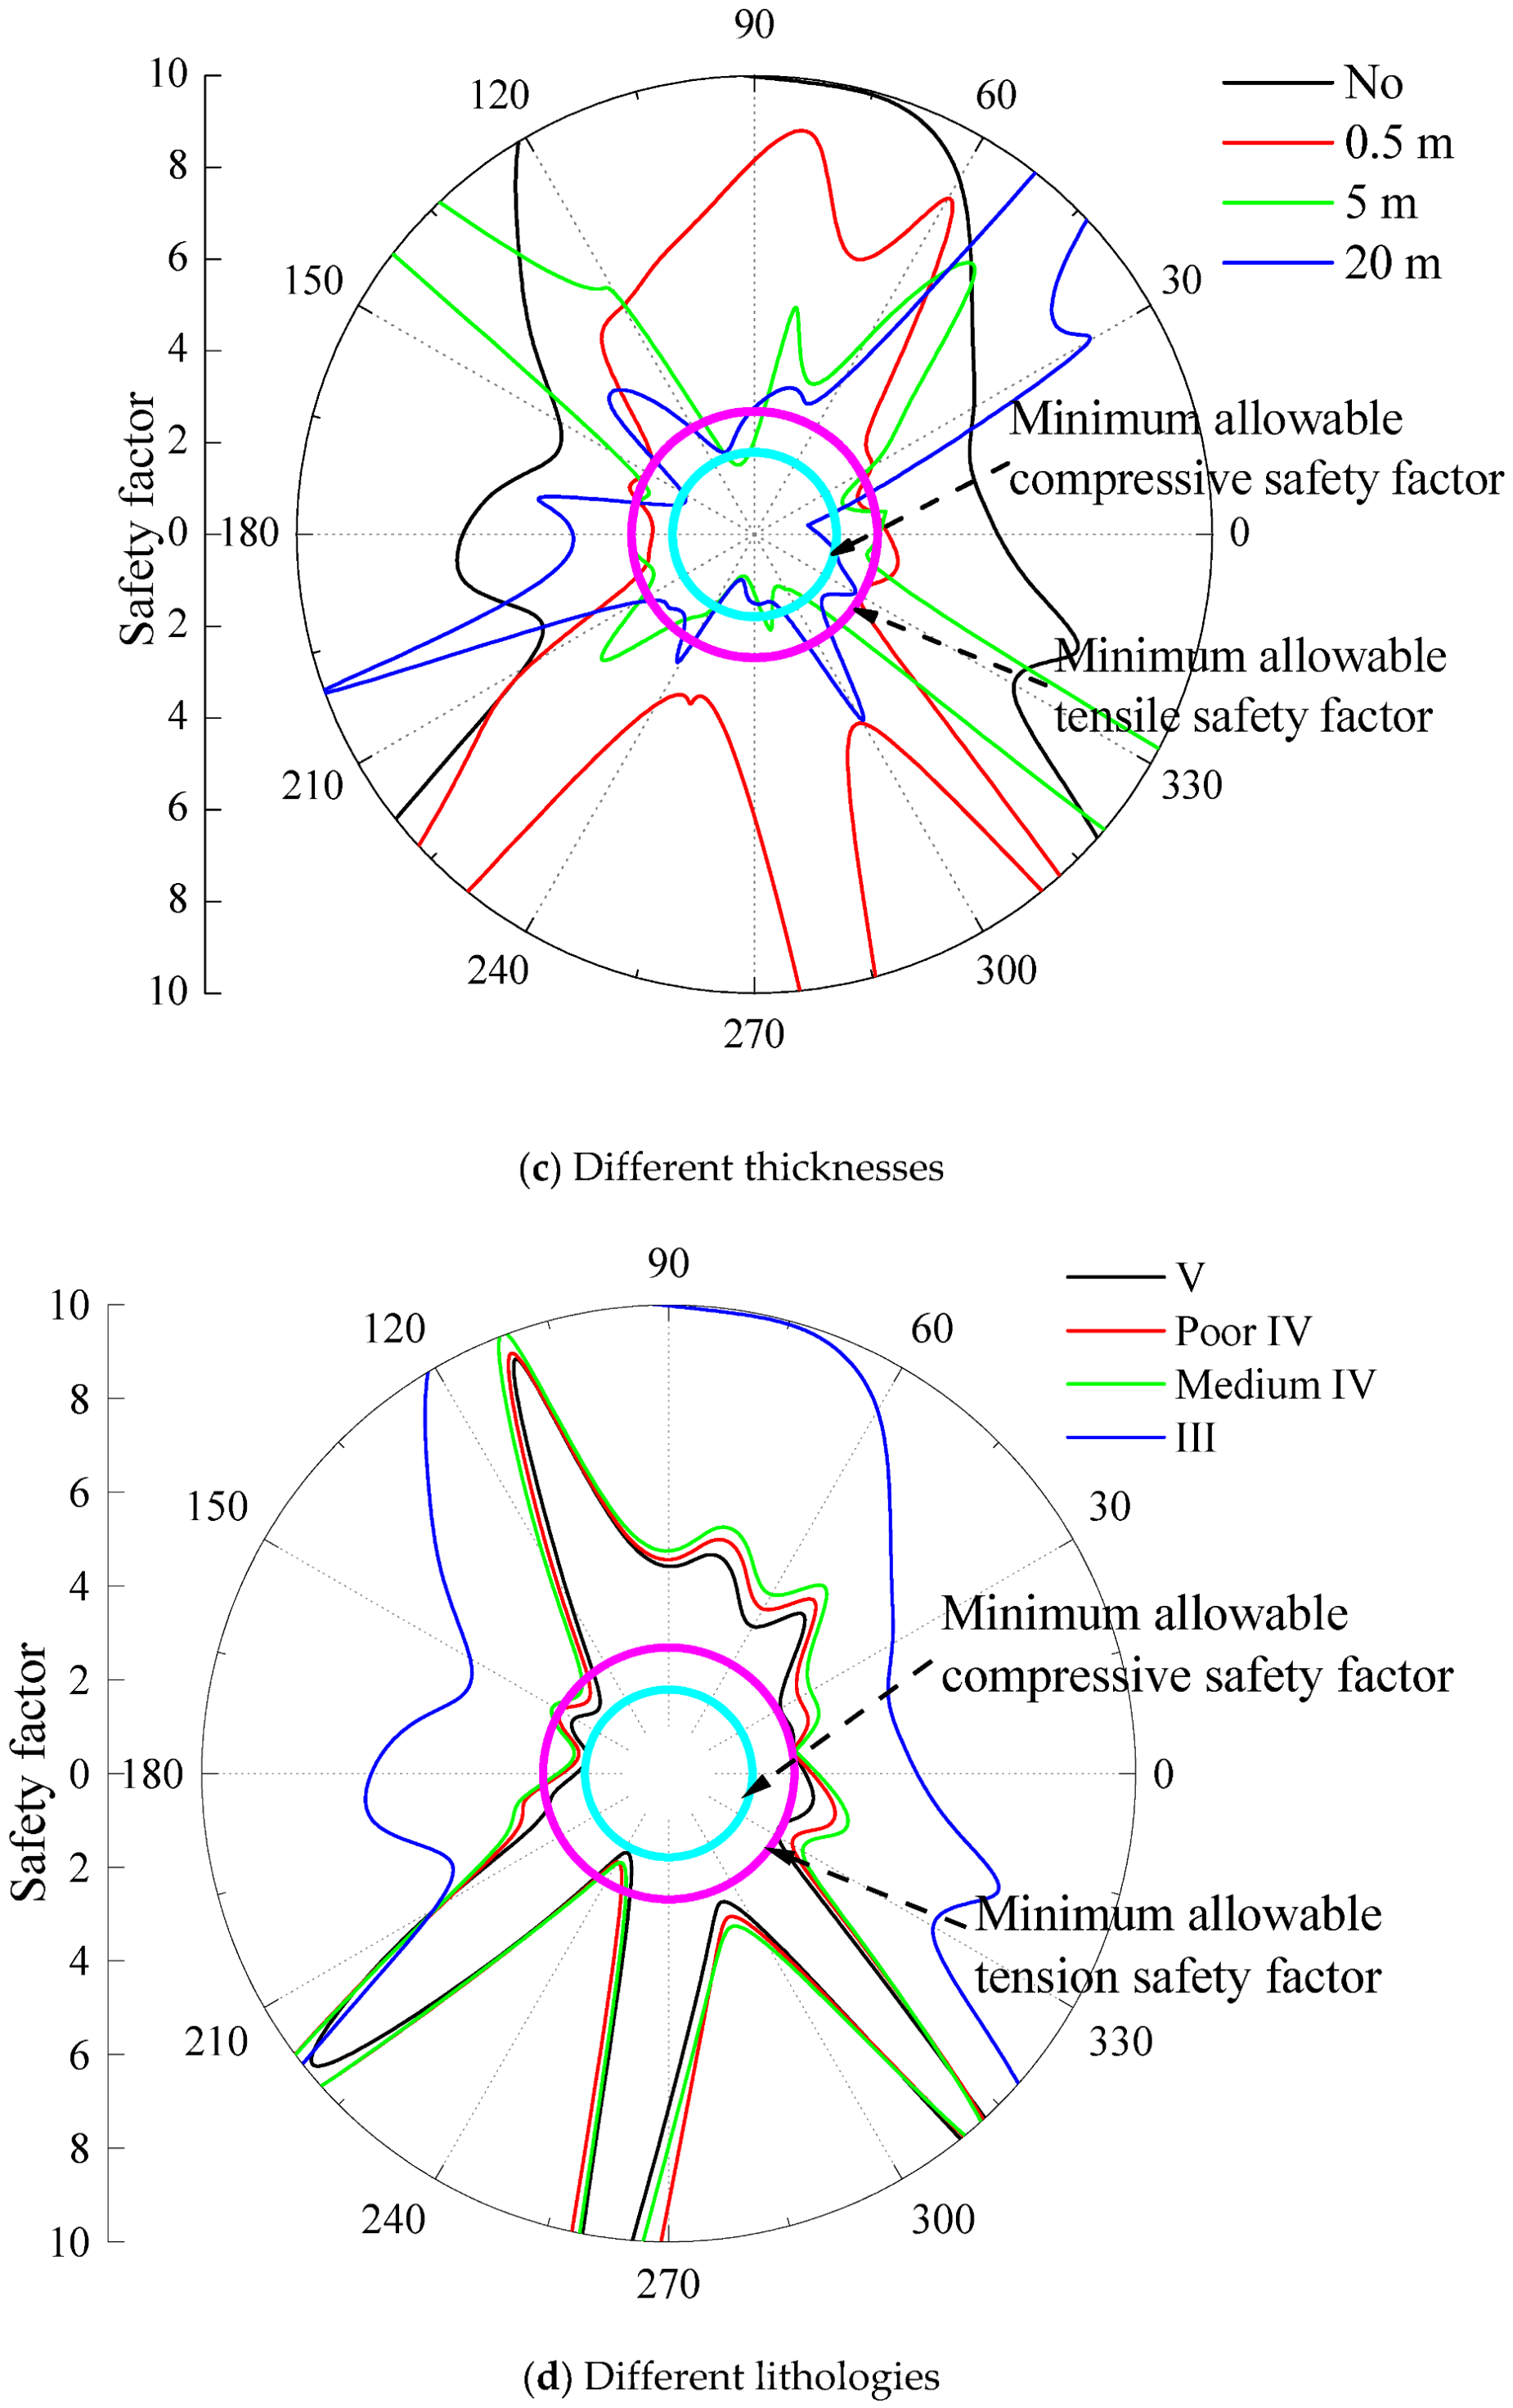
4.2. Distribution of Lining Safety Factor

Figure 15 shows the distribution diagram of the minimum safety factor of the lining along the tunnel axial cross section under different inclinations, thicknesses, and lithologies of the adverse zone. It can be seen that the minimum allowable compressive safety factor is 1.8, and the minimum allowable tensile safety factor is 2.7. It can be seen from Figure 15a that if no adverse geological structure zone in the tunnel exists, the distribution of the safety factor under non-uniform seismic input is similar to that under uniform seismic input. However, there are some differences between the two cases in terms of numerical values, which are mainly concentrated in the lower right section. The distribution of the safety factor with uniform seismic input is only a special case of non-uniform seismic input.
From the comparative analysis of Figure 15b, the distribution of the lining safety factor under different inclined adverse zones is also inconsistent. As a whole, the safety factor of the lining which crosses the adverse zone is lower than that without the adverse geological structure zone. In addition, when the inclination angle of the adverse zone is 45°, the safety factor of the lining is the smallest. Similarly, the distribution of the minimum safety factor of the lining under different thicknesses and lithologies is analyzed, as shown in Figure 15c,d. It can be found that the distribution of the safety factor under the adverse zone with different thicknesses is also inconsistent. However, the distribution of the safety factor under the adverse zone with different lithologies is the same. Overall, the safety factor of the lining with the adverse geological structure zone is less than that without the adverse zone, and the position of the minimum safety factor is the same. In addition, for the position where the lining may be damaged, the thicker the adverse zone, the smaller the safety factor of the lining is. Moreover, the worse the lithology of the adverse zone, the more easily the lining is damaged.

4.3. Distribution of Lining Safety Factor

In order to judge the position of the lining with tensile failure and compression failure, taking the adverse zone with different inclinations as an example, Figure 16 is drawn to present the failure diagram of the lining with different sections along the tunnel axial direction. It can be clearly seen that the damage locations of the lining under the adverse zone with different inclinations are different. Overall, there are more potential locations for the failure of the opening and outlet lining, while relatively few other locations. If the inclination angle of the adverse zone is 30°, the positions of the tension-bending failure and compression-bending failure of the lining at the entrance and exit of the tunnel are the same, while there are more positions of tension-bending failure in the middle section. If the inclination angle of the adverse zone is 45°, the linings at the entrance and exit of the tunnel are more prone to compression-bending failure than tension-bending failure. Similarly, more tension-bending failure occurs in the middle of the tunnel. If the inclination angle of the adverse zone is 90°, although the lining at the entrance and exit has less bending failure than the other cases, more cracks appear in the middle section of the tunnel than the other cases.
Based on the distribution map of the minimum safety factor of the lining, a schematic diagram of the longitudinal cracks in the axial lining of the tunnel crossing different inclinations of the adverse zone is drawn as well, so that the location of the lining cracks can be observed clearly. As shown in Figure 17, several special positions along the tunnel axis are selected for the convenience of calculation. For example, when the lining is damaged at cross section y = 200 m, as the front and rear analysis positions of this section are only cross section y = 0 m and y = 400 m, respectively, it is assumed that crack lengths start at cross section y = 100 m, while they end at cross section y = 300 m. It can be found that if the inclination of the adverse zone is 30°or 45°, the cracks are concentrated at the entrance and exit of the tunnel, while if the inclination of the adverse zone is 90°, the cracks are concentrated at the position of the tunnel body. This is because if the inclination of the adverse zone is 30° or 45°, although the adverse belt passes through the midpoint of the tunnel, its influence should be around the adverse geological structure zone. While the inclination of the adverse belt is 90°, the structural zone is just perpendicular to the tunnel. Therefore, the affected area is concentrated in the tunnel body not far from the adverse geological structure zone.

5. Conclusions

Based on the random ground motion synthesis method, the dynamic response of the tunnel lining crossing through different inclinations, thicknesses, and lithologies of an adverse geological structure zone are analyzed, and the crack distribution of the tunnel lining under non-uniform seismic input is studied. The main conclusions are obtained as follows:
(1)
The variation degree of the tunnel-lining internal force along the tunnel axial direction in the adverse geological structure zone is significantly greater and shows a stronger inconsistency than those in other parts of the tunnel.
(2)
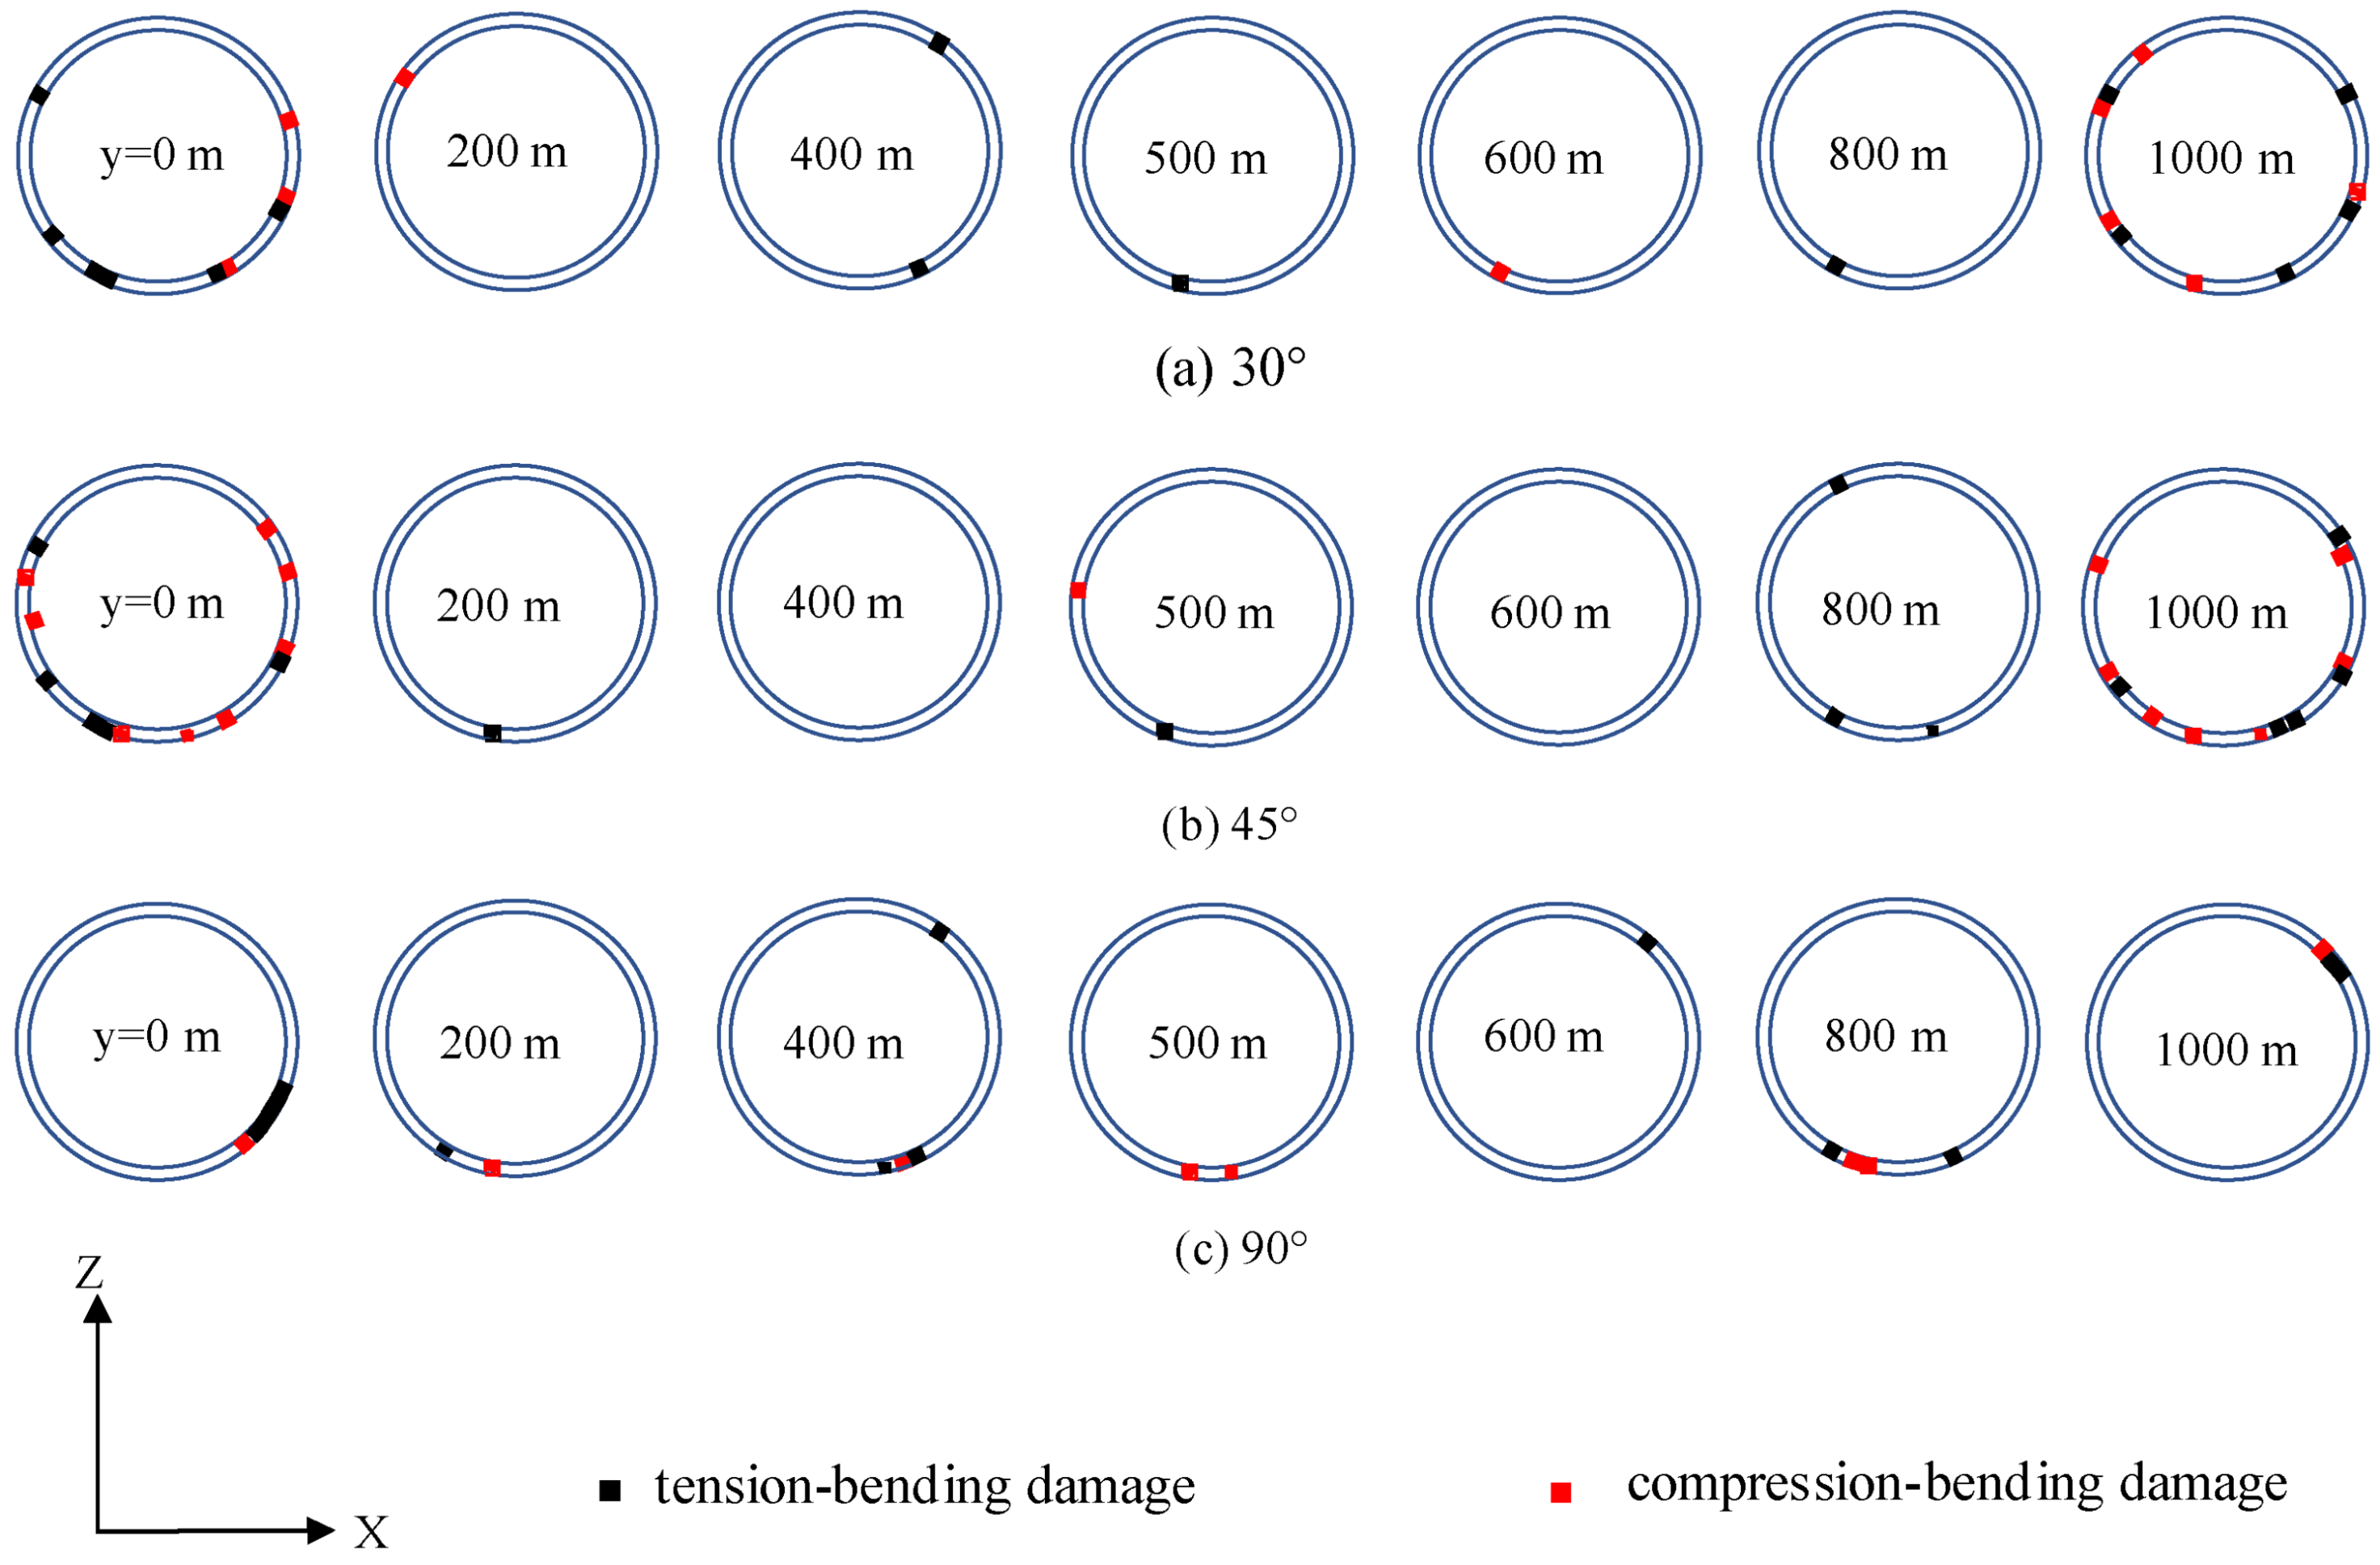
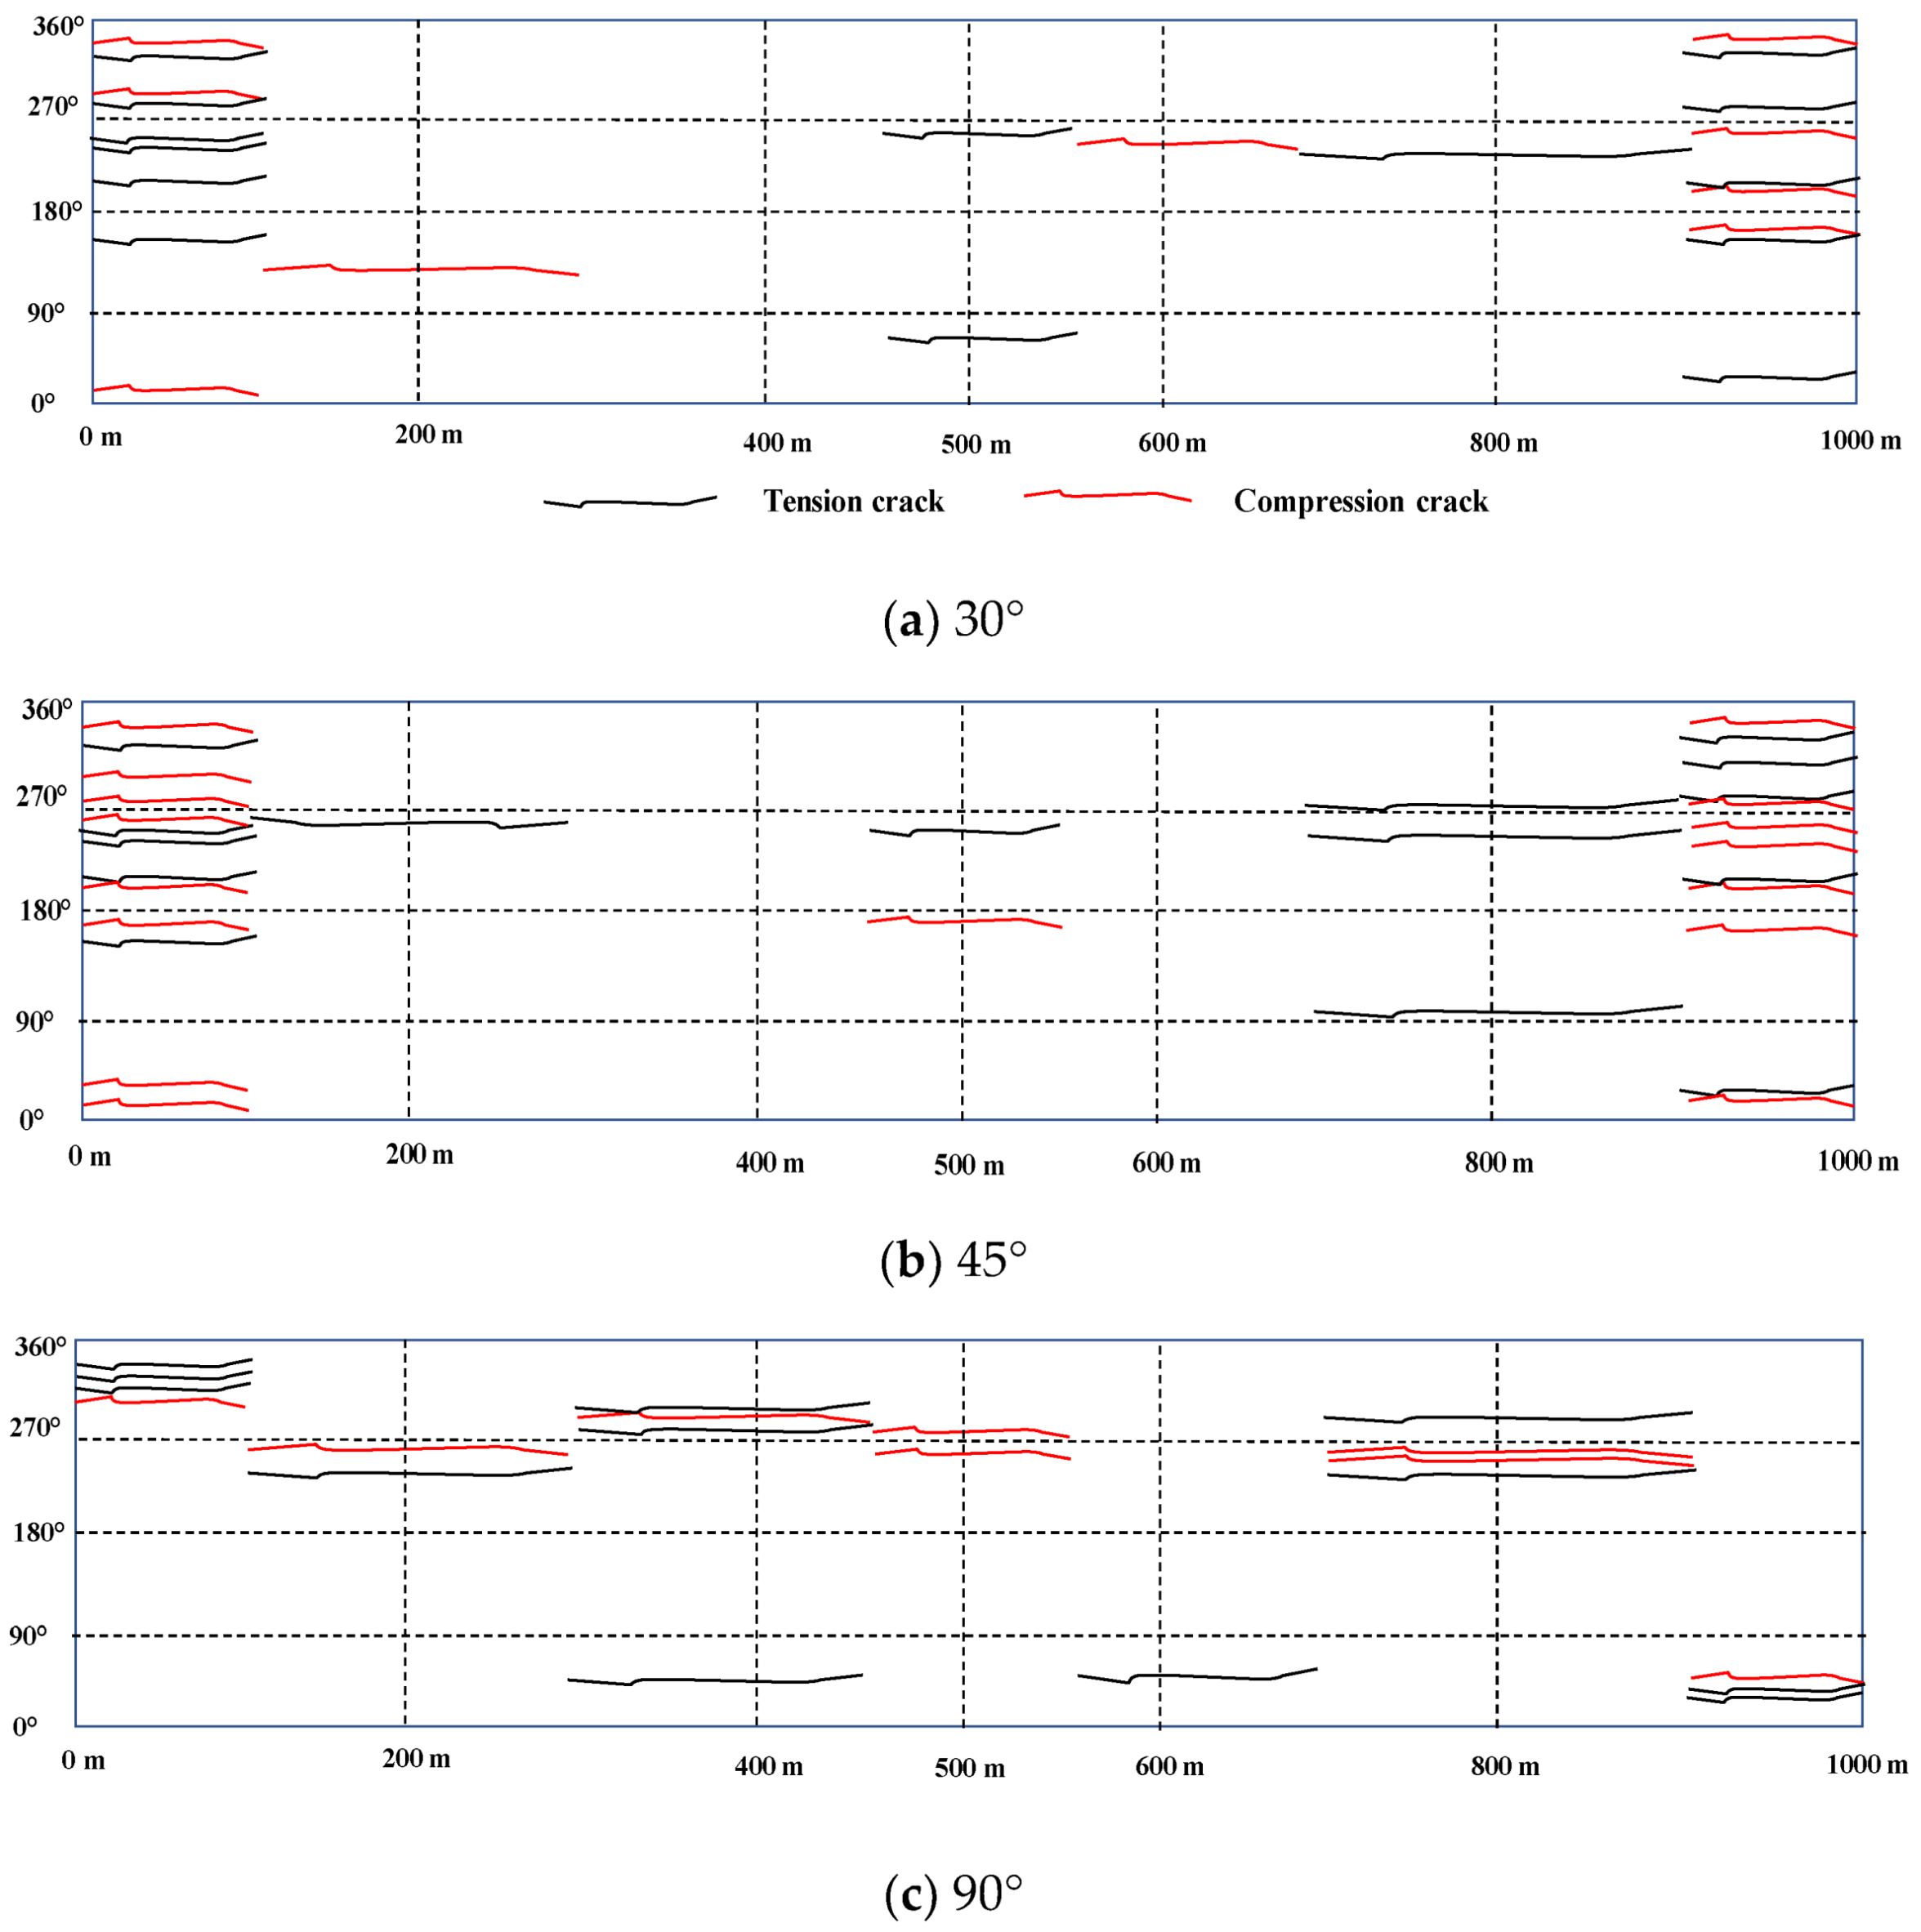
The inclinations of the adverse geological structure zone play an important role in the dynamic response of the lining. When the inclination angle is 45°, the bending moment and shear force of the lining structure are the largest. Meanwhile, the tunnel lining has the most cracks with large areas of compression-bending cracks at the entrance and exit parts of the tunnel.
(3)
The internal force of the lining crossing through different thicknesses of the adverse geological structure zone shows a regional effect. The lining internal force shows strong inconsistency from the tunnel entrance to the section of the adverse geological structure zone, while the lining internal force is relatively stable from the adverse geological structure to the exit section.
(4)
The influence of the lithology of the adverse geological structural zone on the dynamic response of the tunnel lining is smaller than that of the inclination and thickness.

Author Contributions

Conceptualization, Y.Z.; methodology, Q.S.; validation, X.F. and S.C.; formal analysis, H.D., D.S. and W.Y.; writing—original draft preparation, Y.Z. and H.D.; supervision, Y.Z., H.W. and W.Y.; funding acquisition, X.F. and Q.S. All authors have read and agreed to the published version of the manuscript.

Funding

This research was funded by the Key Laboratory of Roads and Railway Safety Control (Shijiazhuang Tiedao University), the Ministry of Education (STDTKF202103), the National Natural Science Foundation of China (No. U21A20159; No. 52179117), and the Youth Innovation Promotion Association CAS (No.2021325).

Data Availability Statement

The data are available from the corresponding author upon request.

Acknowledgments

The work described in this paper was supported by the Key Laboratory of Roads and Railway Safety Control (Shijiazhuang Tiedao University), the Ministry of Education (STDTKF202103), the National Natural Science Foundation of China (No. U21A20159; No. 52179117), and the Youth Innovation Promotion Association CAS (No.2021325), for which the authors are very thankful.

Conflicts of Interest

The authors declare no conflict of interest.

References

  1. Aygar, E.B.; Gokceoglu, C. A special support design for a large-span tunnel crossing an active fault (T9 Tunnel, Ankara–Sivas high-speed railway project, Turkey). Environ. Earth Sci. 2021, 80, 37–53. [Google Scholar] [CrossRef]
  2. Iwatate, T.; Kobayashi, Y.; Kusu, H.; Rin, K. Investigation and shaking table tests of subway structures of the hyogoken-nanbu earthquake. In Proceedings of the 12th World Conference on Earthquake Engineering, Auckland, New Zealand, 30 January–4 February 2000; pp. 1043–1051. [Google Scholar]
  3. Tsai, J.S.; Chung, L.L.; Liu, K.G.Y. Damage and recovery from the 1999 Chichi earthquake in Taiwan. In Progress of Geo-Disaster Mitigation Technology in Asia; Springer: Berlin/Heidelberg, Germany, 2013; pp. 171–186. [Google Scholar]
  4. Wang, W.L.; Wang, T.T.; Su, J.J.; Lin, C.H.; Seng, C.R.; Huang, T.H. Assessment of damage in mountain tunnels due to the Taiwan Chi-Chi earthquake. Tunn. Undergr. Space Technol. 2001, 16, 133–150. [Google Scholar] [CrossRef]
  5. Cui, G.Y.; Wang, M.N.; Yu, L.; Lin, G.J. Study on the characteristics and mechanism of seismic damage for tunnel structures on fault rupture zone in wenchuan seismic disastrous area. China Civ. Eng. J. 2013, 46, 122–127. [Google Scholar]
  6. Li, H.B.; Zhu, L.; Lv, T.; Yang, J.H.; Xia, X.; Liu, Y.Q. Seismic response analysis of an underground cavern groups in rock subjected to spatially non-uniform seisnic ground motion. Chin. J. Rock Mech. Eng. 2008, 27, 1757–1766. [Google Scholar]
  7. Yu, H.T.; Chen, J.T.; Bobet, A.; Yuan, Y. Damage observation and assessment of the longxi tunnel during the Wenchuan earthquake. Tunn. Undergr. Space Technol. 2016, 54, 102–116. [Google Scholar] [CrossRef]
  8. Ardeshiri Lajimi, S.; Yazdani, M.; Assadi Langroudi, A. Control of fault lay-out on seismic design of large underground caverns. Tunn. Undergr. Space Technol. 2015, 50, 305–316. [Google Scholar] [CrossRef]
  9. Zhu, J.P. Study on dynamic response of different surrounding rock levels on both sides of tunnel fault unfavorable geological structure zone. Int. J. Civ. Mach. Manuf. 2019, 4, 39–42. [Google Scholar]
  10. Wang, X.W.; Xiong, Q.R.; Zhou, H.; Chen, J.T.; Xiao, M. Three-dimensional (3D) dynamic finite element modeling of the effects of a geological fault on the seismic response of underground caverns. Tunn. Undergr. Space Technol. 2020, 96, 103210. [Google Scholar] [CrossRef]
  11. Wang, T.T.; Kwok, O.L.A.; Jeng, F.S. Seismic response of tunnels revealed in two decades following the 1999 Chi-Chi earthquake (mw 7.6) in Taiwan: A review. Eng. Geol. 2021, 287, 106090. [Google Scholar] [CrossRef]
  12. Li, P.; Song, E.X. Three-dimensional numerical analysis for the longitudinal seismic response of tunnels under an asynchronous wave input. Comput. Geotech. 2015, 63, 229–243. [Google Scholar] [CrossRef]
  13. Qiu, D.P.; Chen, J.Y.; Xu, Q. Dynamic responses and damage forms analysis of underground large scale frame structures under oblique sv seismic waves. Soil Dyn. Earthq. Eng. 2019, 117, 216–220. [Google Scholar] [CrossRef]
  14. Sun, B.B.; Deng, M.J.; Zhang, S.R.; Cui, W.; Wang, C.; Yu, L.C.; Cao, K.L. Inelastic dynamic analysis and damage assessment of a hydraulic arched tunnel under near-fault sv waves with arbitrary incoming angles. Tunn. Undergr. Space Technol. 2020, 104, 103523. [Google Scholar] [CrossRef]
  15. Huang, J.Q.; Du, X.L.; Zhao, M.; Zhao, X. Impact of incident angles of earthquake shear (S) waves on 3-D non-linear seismic responses of long lined tunnels. Eng. Geol. 2017, 222, 168–185. [Google Scholar] [CrossRef]
  16. Sun, W.Y.; Ma, Q.G.; Yan, S.H.; Luo, X.X.; Wang, J.H.; Liang, Q.G. Seismic response and damage characteristics of the shallow tunnel with asymmetric loess cover under the oblique incidence of seismic SV wave. Arab. J. Sci. Eng. 2022, 1–19. [Google Scholar] [CrossRef]
  17. Yu, H.T.; Yan, X.; Bobet, A.; Yuan, Y.; Xu, G.P.; Su, Q.K. Multi-point shaking table test of a long tunnel subjected to non-uniform seismic loadings. Bull. Earthq. Eng. 2017, 16, 1041–1059. [Google Scholar] [CrossRef]
  18. Yu, H.T.; Yuan, Y.; Xu, G.P.; Su, Q.K.; Yan, X.; Li, C. Multi-point shaking table test for long tunnels subjected to non-uniform seismic loadings—Part II: Application to the hzm immersed tunnel. Soil Dyn. Earthq. Eng. 2018, 108, 187–195. [Google Scholar] [CrossRef]
  19. Yuan, Y.; Yu, H.T.; Li, C.; Yan, X.; Yuan, J.Y. Multi-point shaking table test for long tunnels subjected to non-uniform seismic loadings—Part I: Theory and validation. Soil Dyn. Earthq. Eng. 2018, 108, 177–186. [Google Scholar] [CrossRef]
  20. Han, J.Y.; El Naggar, M.H.; Zhao, M.; Zhong, Z.L.; Hou, B.W.; Du, X.L. Longitudinal response of buried pipeline under non-uniform seismic excitation from multi-point shaking table tests. Soil Dyn. Earthq. Eng. 2021, 140, 106440. [Google Scholar] [CrossRef]
  21. Chen, J.; Shi, X.J.; Li, J. Shaking table test of utility tunnel under non-uniform earthquake wave excitation. Soil Dyn. Earthq. Eng. 2010, 30, 1400–1416. [Google Scholar] [CrossRef]
  22. Chen, J.; Jiang, L.Z.; Li, J.; Shi, X.J. Numerical simulation of shaking table test on utility tunnel under non-uniform earthquake excitation. Tunn. Undergr. Space Technol. 2012, 30, 205–216. [Google Scholar] [CrossRef]
  23. Yu, H.T.; Yuan, Y.; Qiao, Z.Z.; Gu, Y.; Yang, Z.H.; Li, X.D. Seismic analysis of a long tunnel based on multi-scale method. Eng. Struct. 2013, 49, 572–587. [Google Scholar] [CrossRef]
  24. Li, C.; Yuan, J.Y.; Yu, H.T.; Su, Q.K.; Yuan, Y. Seismic response analysis of long immersed tunnel to longitudinal non-uniform excitation. In Proceedings of the 11th World Congress on Computational Mechanics, Barcelona, Spain, 20–25 July 2014; pp. 1416–1424. [Google Scholar]
  25. Fabozzi, S.; Bilotta, E.; Yu, H.; Yuan, Y. Effects of the asynchronism of ground motion on the longitudinal behaviour of a circular tunnel. Tunn. Undergr. Space Technol. 2018, 82, 529–541. [Google Scholar] [CrossRef]
  26. Tarinejad, R.; Fatehi, R.; Harichandran, R.S. Response of an arch dam to non-uniform excitation generated by a seismic wave scattering model. Soil Dyn. Earthq. Eng. 2013, 52, 40–54. [Google Scholar] [CrossRef] [Green Version]
  27. Isari, M.; Tarinejad, R.; Taghavi Ghalesari, A.; Sohrabi Bidar, A. A new approach to generating non-uniform support excitation at topographic sites. Soils Found. 2019, 59, 1933–1945. [Google Scholar] [CrossRef]
  28. Zhou, Y.Q.; Sheng, Q.; Li, N.N.; Fu, X.D. Preliminary study on time-space effect of the dynamic response of long tunnel under non-uniform ground motion. Rock Soil Mech. 2021, 42, 2287–2297. [Google Scholar]
  29. Xue, B.; Du, X.; Wang, J.; Yu, X. A Scaled Boundary Finite-Element Method with B-Differentiable Equations for 3D Frictional Contact Problems. Fractal Fract. 2022, 6, 133. [Google Scholar] [CrossRef]
Figure 1. Adverse geological structure zone and numerical model of the tunnel.
Energies 15 04599 g001
Figure 2. Flow chart of synthesis method for non-uniform ground motion acceleration.
Energies 15 04599 g002
Figure 3. Acceleration–time history curves of non-uniform seismic load.
Energies 15 04599 g003
Figure 4. The input method of non-uniform seismic.
Energies 15 04599 g004
Figure 5. Bending moment of lining of the tunnel passing through adverse geological structure zone with different inclinations for each cross section along the tunnel axial direction. (It is noted that “No” represents that there is no adverse geological structure zone. Consistency means uniform seismic input and inconsistency means non-uniform seismic input).
Energies 15 04599 g005aEnergies 15 04599 g005b
Figure 6. Bending moment of the lining monitoring points of the tunnel passing through adverse geological structure zone with different inclinations along the tunnel axial direction.
Energies 15 04599 g006aEnergies 15 04599 g006b
Figure 7. Bending moment of lining of the tunnel passing through adverse geological structure zone with different thicknesses for cross section at y = 500 m.
Energies 15 04599 g007
Figure 8. Bending moment of the lining monitoring points of the tunnel passing through adverse geological structure zone with different thicknesses along the tunnel axial direction.
Energies 15 04599 g008aEnergies 15 04599 g008b
Figure 9. Bending moment of the lining monitoring points of the tunnel passing through adverse geological structure zone with different lithologies.
Energies 15 04599 g009
Figure 10. Shear force of lining of the tunnel passing through adverse geological structure zone with different inclinations for each cross section along the tunnel axial direction.
Energies 15 04599 g010aEnergies 15 04599 g010b
Figure 11. Shear force of the lining monitoring points of the tunnel passing through adverse geological structure zone with different inclinations along the tunnel axial direction.
Energies 15 04599 g011aEnergies 15 04599 g011b
Figure 12. Shear force of lining of the tunnel passing through adverse geological structure zone with different thicknesses for cross section at y = 500 m.
Energies 15 04599 g012
Figure 13. Shear force of the lining monitoring points of the tunnel passing through adverse geological structure zone with different thicknesses along the tunnel axial direction.
Energies 15 04599 g013aEnergies 15 04599 g013b
Figure 14. Shear force of the lining monitoring points of the tunnel passing through adverse geological structure zone with different lithologies.
Energies 15 04599 g014
Figure 15. Safety factor distribution of cross section at y = 500 m.
Energies 15 04599 g015aEnergies 15 04599 g015b
Figure 16. Schematic diagram of lining failure crossing different inclinations of adverse geological structure zone at different sections along the tunnel axis.
Energies 15 04599 g016
Figure 17. Schematic diagram of longitudinal cracks along the axial lining of the tunnel crossing different inclinations of adverse geological structure zones.
Energies 15 04599 g017
Table 1. Parameters of materials.
MaterialDensity (kg/m3)Bulk Modulus (GPa)Shear Modulus (GPa)Internal Friction Angle (°)Cohesion (MPa)Tension (MPa)
rock27203.621.9738.61.43.0
lining250016.6712.50——————
contact——6
(Normal stiffness)
6
(Shear stiffness)
30.01.21.6
Table 2. Different adverse geological structure zones.
NumberThickness (m)Inclination (°)Lithology
A1030V
A20.5
A35
A420
B10.545
B290
C145Medium IV
C2Poor IV
C3III
Table 3. The parameters of the adverse geological structure zone with different lithologies.
LithologyDensity (kg/m3)Bulk Modulus (GPa)Shear Modulus (GPa)Internal Friction Angle (°)Cohesion (MPa)Tension (MPa)
III27203.621.9738.61.43.0
Medium IV25003.471.38330.450.6
Poor IV25002.150.8429.790.420.37
V25000.830.3026.570.40.15
Publisher’s Note: MDPI stays neutral with regard to jurisdictional claims in published maps and institutional affiliations.

