
The Method to Determine the Turns Ratio Correction of the Inductive Current Transformer


Institute of Mechatronics and Information Systems, Lodz University of Technology, 90-924 Lodz, Poland
Energies 2021, 14(24), 8602; https://doi.org/10.3390/en14248602
Submission received: 17 November 2021
/
Revised: 11 December 2021
/
Accepted: 17 December 2021
/
Published: 20 December 2021
(This article belongs to the Special Issue Development of Voltage and Current Transformers in Power System)
Abstract
:This paper presents the method for evaluation of the turns ratio correction of the inductive current transformer using the magnetization curves determined at the non-load state and in the load conditions. The presented method may be applied to determine even a fractional winding correction factor. The standard IEC 61869-2 provides the method to determine the turns ratio correction of the tested CT from the measured rms values of voltages on its primary and secondary winding in the non-load state. However, this approach is limited in determining the significant changes in the number of turns of the secondary winding. Moreover, the paper presents the influence of the applied turns ratio correction on the frequency characteristics of the current error and phase displacement of the inductive current transformers evaluated for the transformation of the distorted current.
1. Introduction
Inductive current transformers (CTs) are widely used for measuring purposes in a power grid [1,2,3]. Their popularity results from their high accuracy, reliability and long lifespan. The accuracy of the inductive CT depends mainly on the magnetic material that the magnetic core is made of. Therefore, compensation of their values of current error and phase displacement may be used to ensure higher accuracy at a reduced cost [4,5,6]. One proposed method is to use an active secondary circuit to increase the secondary current with the calculated value resulting from the instantaneous values of the magnetic core excitation current [4]. Another approach is to use an active secondary circuit to implement the computational algorithms from an artificial neural network to reconstruct the waveform of the distorted secondary current [5]. The compensation of the CT transducer may also be realized by appropriate analysis and processing of voltage from the secondary winding [6]. Saturation of the magnetic core of inductive CTs, which has a negative effect on their accuracy, may also be compensated [7,8,9,10,11,12]. The proposed method is to utilize the Kalman filter enabling reconstruction of the waveform of the primary current of the tested CT [12]. Most of the proposed approaches use mathematical algorithms based on the magnetization curves of the magnetic core and measured distortion of the secondary current to reconstruct the magnetic flux density. Therefore, it is possible to determine the magnetic core excitation current and then determine the values of the compensation current [8,9]. Another possibility is to include in the secondary circuit of the inductive CT a controlled voltage source to reduce its load and ensure an undistorted constant value of the magnetic flux density in the magnetic core even in transient states [7]. The pre-saturation phenomenon of the magnetic core may be caused by a load power of the secondary winding that is too high. Therefore, its decrease may lead to increased accuracy in any operating conditions, including transformation of the distorted current [10,11,13].
The most popular approach to achieve a higher accuracy of the inductive CT is to apply the turns ratio correction. Reduced numbers of turns of the secondary windings decrease its turns ratio and thus increase the RMS value of the secondary current. The current error may have a positive value [14,15,16]. The change of its value ΔIz caused by the turns ratio correction is determined by the equation:
where:
- z2N—rated number of turns of the secondary winding resulting from rated turns ratio of the CT;
- Δz2—number of turns of the correction made to the secondary winding.
The lower absolute values of the current error are obtained by the reduced number of turns of the secondary winding. The fractional turns correction (FTC) should be applied if, by unwinding a single turn (Figure 1b), the values of the current error with the low load power of the secondary winding are too highly positive. One of the approaches is to wind the last turn of the secondary winding through the additional hole made in the magnetic core. The proposed solution requires splitting the winding wire into several individual branches (Figure 1c). Therefore, the last turn of winding is made with several wires, some of which are winded through the window of the magnetic core, and the others are made around it. In Figure 1, the secondary winding of the window-type CT without correction (a), with single turn correction (b) and with fractional correction of turns (c) are presented.
The annex 2C of the standard IEC 61869-2 specifies the method for determining the value of the real turns ratio of the CT in its non-load state:
where:
- z2—real number of turns of the secondary winding of the CT;
- z1—real number of turns of the primary winding of the CT;
- U10—RMS value of the supply voltage;
- Uμ—RMS value of the voltage of the magnetic core.
However, it should be mentioned that the presented Formula (2) allows for determining the real turns ratio of the CT when the value of the applied number of turns correction is sufficiently high. Otherwise, when the fractional or only several turns correction is made, the measured RMS values of the voltages do not accurately determine the real turns ratio of the tested CT. This results from the required low measurement uncertainty of those voltages. Since the single turn correction (TC) of the secondary winding of the CT with the rated number of turns of the secondary winding of 1000 causes the difference between the RMS values of secondary and primary voltages equal to about 0.1%, in relation to measured RMS values for windings without applied turns correction. If a single turn correction of the secondary winding of the CT with the rated number of turns of the secondary winding equal to 200, causes the difference between the RMS values of secondary and primary voltages equal to about 0.5%, in relation to measured RMS values for windings without the applied turns correction. The measurement uncertainty of the calculation of the real number of turns of the tested CT results from voltmeters. Considering that their accuracy is equal to ±0.2%, assuming the rectangular probability distribution, the measurement uncertainties of the voltage ratio equals ± 0.24%. In the case of the inductive CT with a rated current ratio equal to 1000 A/5 A, this results in possible detection of the turns ratio with measurement uncertainty equal to ±0.5 turns, while in the case of the inductive CT with the current ratio of 1000 A/1 A this results in measurement uncertainty equal to ±2 turns. The proposed method uses a measured value of the differential current to determine the turns ratio correction of the secondary winding. The value of the differential current without applied turns correction in the case of the inductive CT with the current ratio 1000 A/1 A is equal to 1.45 mA. The value of the differential current after the applied turns correction is equal to 0.45 mA. Therefore, the change of the value of the differential current caused by the applied single turn correction of the secondary winding in considering the case equal to 1 mA. Then, the percentage change of the value of the differential current caused by the applied single turns correction of the secondary winding is also equal to 69%. The value of the differential current without the applied turns correction in the case of the inductive CT with the current ratio 1000 A/5 A is equal to 5.37 mA. The value of the differential current after the applied turns correction is equal to 0.37 mA. Therefore, the change of the value of the differential current caused by the applied fractional turns correction of the secondary winding in considering the case equal to 5 mA. Then, the percentage change of the value of the differential current caused by applied fractional turns correction of the secondary winding is equal to 93%. The measurement uncertainty of the determined turns ratio correction of the tested CT according to the proposed method results from the accuracy of differential current measurements, which is equal to 0.5%. Therefore, the measurement uncertainties specified for inductive CT with the current ratio 1000 A/5 A is equal to ±0.025 turns since a single turn causes the change of the differential current equal to 5 mA. In the case of the inductive CT with the current ratio of 1000 A/1 A, it is equal to ±0.005 turns since a single turn causes the change of the differential current equal to 1 mA.
To determine the values of current error and phase displacement of the CT, it is required that the test system is capable of generating currents with the required high RMS values or other applications of alternative developed measurement methods [14,15,17,18,19,20,21]. Considering the window-type CT, it is possible to use the method based on its ampere-turns condition, where the additional winding with the number of turns resulting from the rated current ratio is winded. Therefore, the tested CT is supplied with the primary current equal to the value of its secondary current [20]. However, to test the CTs transformation accuracy for distorted currents, the power source capable of generating distorted currents with programmable levels of higher harmonics is required [17,22]. Calibration of the CT during the transformation of a sinusoidal current 50/60 Hz requires utilization of the reference CT and currents comparator connected to their secondary windings [23,24]. Other methods to determine the accuracy of tested CTs are based on measuring systems using the Rogowski coil or the current transducer made with flux-gate technology [15,25,26]. These systems may use the transducer with a digital signal proportional to the current error and phase displacement [27]. Such devices use a dual-band A/D converter and keep the accuracy over a wide frequency range. The values of current error and phase displacement of harmonic transformation by the tested CTs may be determined using a two-channel measurement card [28,29].
The presented study concerns the method to determine the turns ratio correction of the inductive CT in the case when the construction of its secondary winding is not specified. This approach can be used for the manufactured inductive CT in order to explain the course of the frequency characteristics of the values of current error and phase displacement determined for the transformation of distorted current harmonics. Moreover, this proposed solution has lower measurement uncertainty in comparison with the solution presented in the standard IEC 61869-2 due to the application of differentially measured current. Therefore, for inductive CTs with a high rated current ratio, the presented method may be used to determine even fractional turn corrections when other methods do not have sufficient accuracy. In this paper, the influence of the applied single and fractional turns correction of the secondary winding on the determined values of current error and phase displacement of the inductive CTs for the transformation of distorted current harmonics is also investigated.
2. The Developed Method to Determine the Turns Ratio Correction
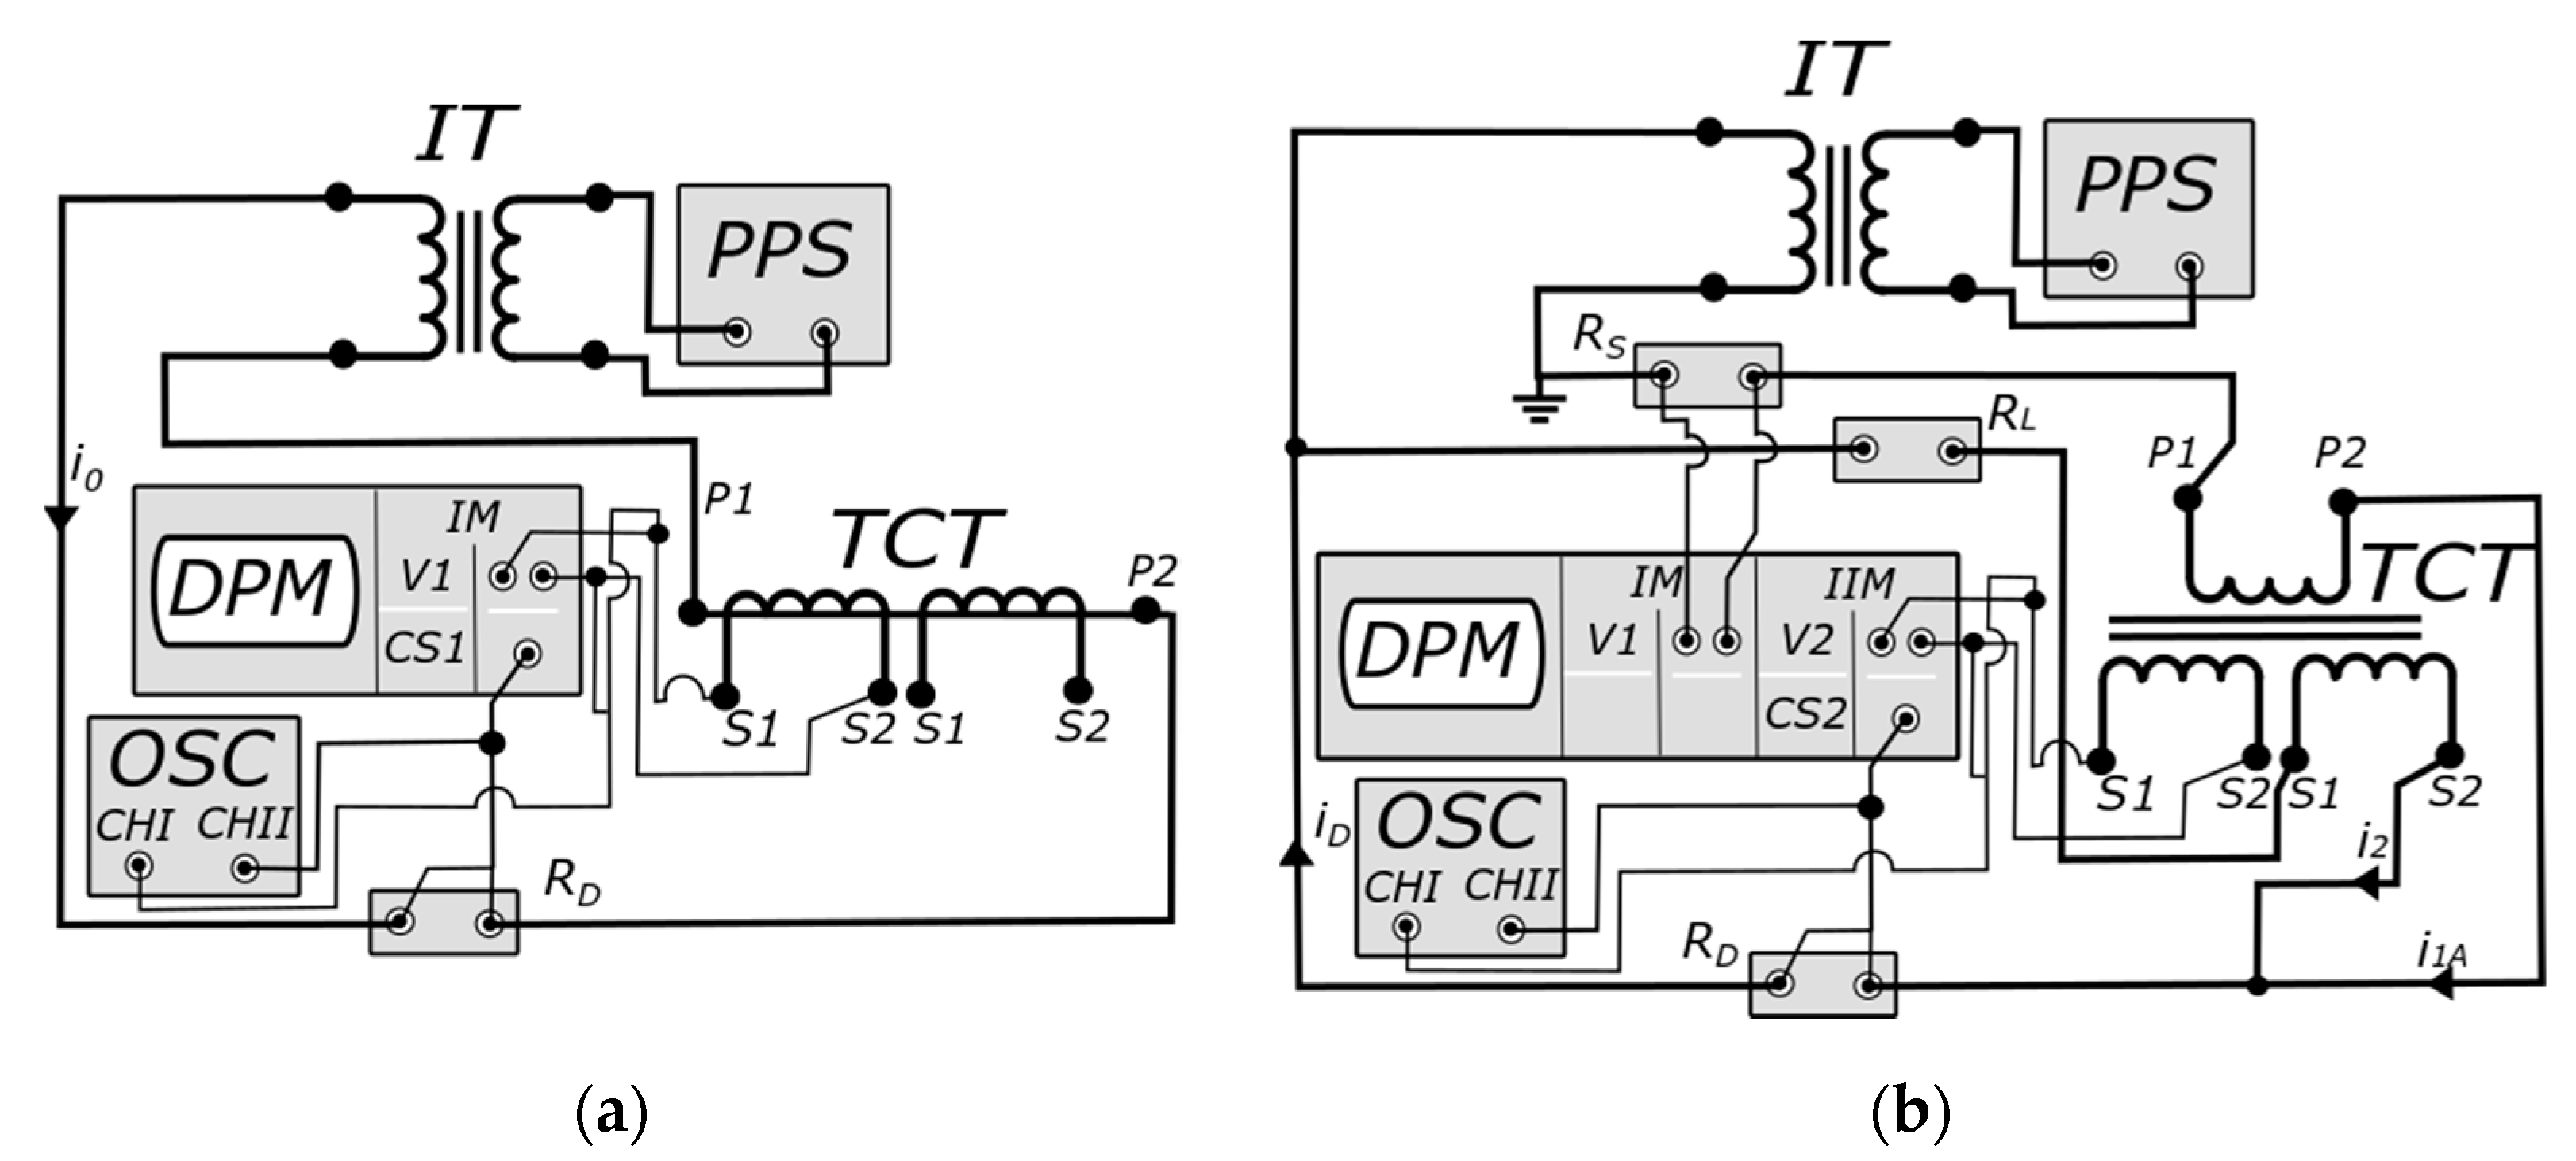
The developed procedure requires the utilization of two measuring systems, in both of which the magnetization curve and the characteristic of the active power losses of the magnetic core of the tested inductive CT are determined. In the first case, the measurements are made in the non-load state of the CT (Figure 2a), while in the second case, the equivalent magnetization curves are determined under the load condition (Figure 2b).
In Figure 2, the following abbreviations are used:
- OSC—oscilloscope;
- TCT—tested CT;
- CS1/CS2—channel designed for connection of a current/voltage probe of the 1st and 2nd module of the digital power meter;
- DPM—digital power meter;
- i1A—instantaneous value of the current in the additional primary winding;
- i2—instantaneous value of the current in the secondary winding of the TCT;
- IM/IIM—1st and 2nd modules of the DPM;
- i0/iD—instantaneous value of the excitation/differential current (with the applied turns ratio correction, the value of the differential current between additional primary and secondary windings of the TCT is different from excitation current);
- RL—load resistor of the secondary winding of the TCT;
- RD—current shunt resistor with a resistance equal to 10 Ω and inductance of less than 10 µH for measurements of voltage associated with the current in the differential connection between the additional primary and the secondary windings of the TCT;
- RS—current shunt resistor with a resistance equal to 0.1 Ω and inductance of less than 10 µH for measurements of voltage associated with the current in the additional primary winding;
- IT—isolation transformer;
- V1/V2—voltage channels of the 1st and 2nd modules of the DPM;
- PPS—programmable power source.
In the presented measuring system in Figure 2a, the magnetization curve, the active power losses and the maximum value of the magnetic core excitation current I0m (in the non-load state, it is the primary current of the TCT) are measured. Moreover, it is also mandatory to measure the instantaneous voltage on the secondary winding, which corresponds in this case to the value of the voltage of the magnetic core on the mutual inductance of the windings. The flowchart showing the steps of the procedure to determine the turns ratio correction of the CT is presented in Figure 3.
In the first step, the maximum value of the magnetic flux density in the magnetic core B0max (Figure 3 step 2a) of the TCT in the non-load state is determined for the given maximum value of the magnetic field strength H0max (Figure 3 step 2b) associated with the maximum value of the excitation current I0max (Figure 3 step 1b). The maximum value of the magnetic field strength is calculated from the following equation:
where:
- z1N—the rated number of turns of the secondary winding resulting from the rated turns ratio of the CT;
- Imax—the maximum value of the magnetic core excitation current;
- lFe—the length of the mean path in the magnetic core.
The oscilloscope connected in the measuring setup presented in Figure 2a determines the dynamic hysteresis loops of the magnetic core of the TCT by the integration of the instantaneous voltage measured on the open secondary winding (Figure 3 Step 1a). The maximum (peak) value of the magnetic flux density B0max is calculated with the following equation:
where:
- u2—instantaneous value of the voltage on the open secondary winding of the TCT;
- sFe—cross-section of the magnetic core.
In the second step, to determine the differential current, the TCT is supplied with the sinusoidal current by the additional primary winding (Figure 2b). The instantaneous value of the voltage on the mutual inductance between TCT windings is measured from the open additional secondary winding. The value of the magnetic flux density in the magnetic core in the load state of TCT is calculated according to relation (4). The maximum value of the differential current Idm (Figure 3 Step 3a) of the TCT is measured for the condition when the maximum magnetic flux density in the magnetic core Bdmax is equal to the value measured in non-load state B0max. Furthermore, the rms value of the current I1A in the additional primary winding is measured.
The maximum value of the magnetic field strength Hdmax (Figure 3 Step 4a) in the loaded state of the secondary winding resulting from the value of the differential current Idm is calculated from relation (3). Then, the value of the applied turns ratio correction Δz (Figure 3 step 5) of the TCT’s secondary winding is determined from the following equation:
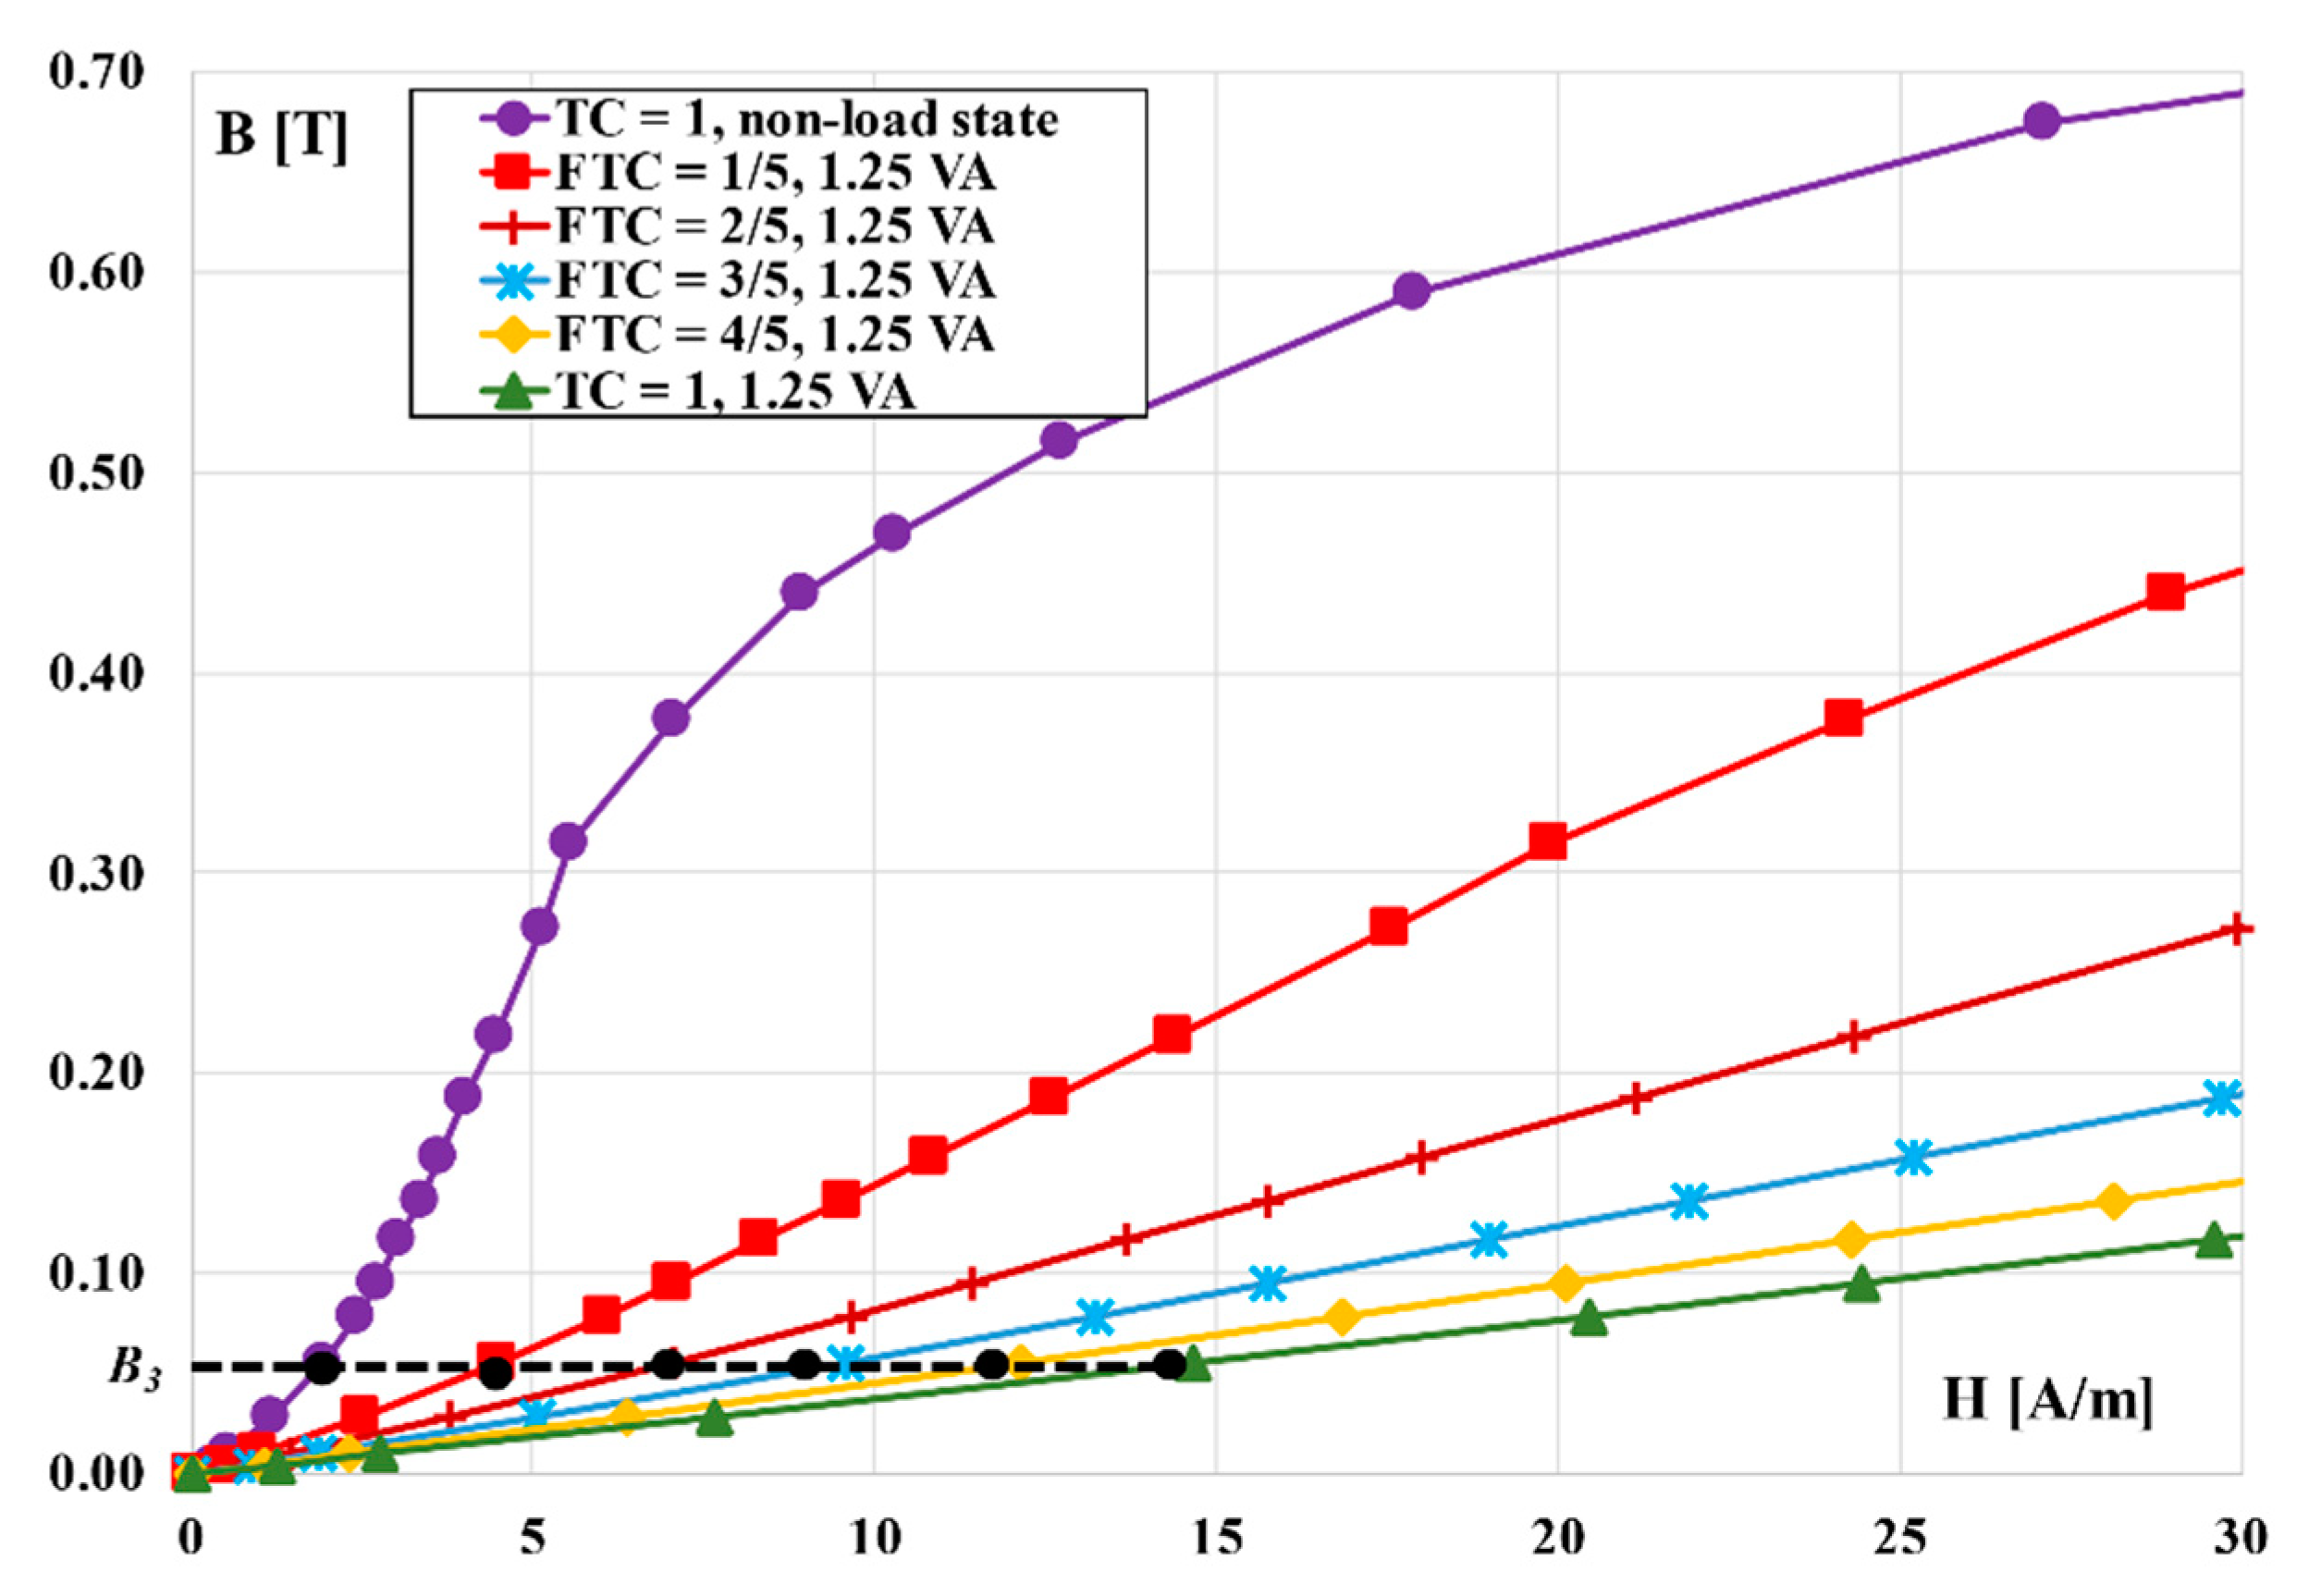
In Figure 4, the magnetization curve of the inductive CT’s magnetic core determined in the non-load state (purple line) and the equivalent magnetization curves determined in the load state of the secondary winding (red and green lines) are presented.
The equivalent magnetization curves in the load state of the secondary winding of the TCT for the same value of the magnetic flux density may achieve different values of the magnetic field strength equal to Hmax(II) or Hmax(I) depending on the applied value of the turns ratio correction. If the value of the differential current Idmax is decreased in relation to the measured magnetic core excitation current I0m, then for the condition B0max = Bdmax, a lower value of the magnetic field strength is achieved (Figure 5, Hmax(II)). In this case, the correction of the number of turns of the secondary winding is made correctly. Otherwise, when the application of the turns ratio correction increases the maximum value of the differential current Idmax, then for the condition B0max = Bdmax, a higher value of the magnetic field strength Hmax(I) is achieved.
3. Tested CT and Application of the Method
The verification of the presented method is performed for inductive CT with a specified number of turns of the easily accessible secondary winding. Therefore, the inductive CT with the rated current ratio equal to 1000 A/5 A has been designed and constructed. The rated load of the secondary winding is equal to 5 VA. Its magnetic core is made of Ni78Fe22 tape (78% nickel and 22% iron). The value of its cross-sectional area SFe is equal to 0.00105 m2, the mean path length of the magnetic flux lFe in the magnetic core is equal to 0.738 m and its weight is 2 kg. The used magnetic core’s material is characterized by an initial magnetic permeability of approximately 4000 and active power losses of approximately 0.05 W/kg at 0.4 T. The secondary winding is made with a copper wire with a diameter of 1.8 mm, coated in double insulation (temperature index 200) from polyester resin with a polyamide-imide top-coat. The toroidal magnetic core is isolated from the secondary winding by the pressboard tape evenly wrapped around its surface. The secondary winding is made in two layers, each of 100 turns connected in series. Its additional primary winding is made with the same number of turns when the ampere-turns method is used.
In order to verify the effectiveness of the method to determine the turns ratio correction of the inductive CT, the first tests were performed on a model with the turns ratio equal to 200/200, the rated secondary current 5 A, and the rated apparent power 5 VA, the single turn correction of the secondary winding was applied. Therefore, its turns ratio is equal to 200/199. The equivalent magnetization curves were determined using an additional secondary winding with 200 turns. It is left open when the secondary winding is used. The measured value of the voltage on this winding corresponds to the voltage of the magnetic cote on the mutual inductance between windings of the TCT. The magnetization curves for the non-load state were determined using the measurement setup presented in Figure 2a, while their equivalent for the load state was designated in the measuring system presented in Figure 2b. The changes of the course of the equivalent magnetization curves with the change of the load of the secondary winding of the TCT and applied single turns ratio correction to increase or decrease its number of turns are shown in Figure 5.
The magnetization curves in the non-load state were plotted with the purple color (uncorrected winding) and brown color (corrected winding). In the load state for the rated load of the secondary winding, they are plotted by the blue color (corrected winding) and the red color (uncorrected winding), while the green color was used for 25% of the rated load (corrected winding). The turns ratio correction changes the value of the differential current between the primary and secondary windings. This value may be higher or lower than the actual excitation current of the magnetic core depending on whether the applied winding correction is decreased or increased in relation to the absolute value of the current error in comparison to the conditions when the uncorrected winding is used. In the case when the number of turns of the secondary winding was reduced by the single turn resulting in the +0.5% change of the value of current error in the positive direction according to Equation (1). Therefore, the equivalent magnetization curve of the TCT for the rated load reaches higher values of the magnetic field strength for the same value of the magnetic flux density B1. Its value in the non-load state H11 changes to the value H12 in the loaded state. The difference between these two operating points is caused by the applied turns ratio correction. An increase of the load of the corrected secondary winding causes the equivalent magnetization curve to increase its slope to achieve the course in the non-load state, i.e., to obtain the real magnetization curve of the magnetic core of the TCT. Therefore, for the same value of the magnetic flux density B2, the magnetic field strength changes from H22 obtained in the loaded state to the value equal to H21 in the non-load state. If the turn ratio is corrected properly, the slope of the equivalent magnetization curve determined in the load state of the TCT is higher than in the case of the non-load state, and the value of the differential current is decreased in relation to the excitation current. Therefore, the values of the magnetic field strength for the same magnetic flux density are decreased, and the magnetization curve is located on the left with respect to the one determined in the non-load state. It is obvious that the application of the single-turn correction for the secondary winding with 200 turns is not reasonable due to the large change of the current error equal to +5%. Therefore, the fractional winding correction should be applied to achieve the lowest possible values of the differential current and the current error.
The influence of the fractional winding correction on the courses of the equivalent magnetizing curves of the TCT with the rated turns ratio 200/200 is shown in Figure 6. Corrections are made by 1/5 turn in five steps up to the one turn correction, resulting in a change of the value of the current error from about +0.1% to +0.5%, respectively. The magnetization curves were determined for 25% of the rated load of the secondary winding.
The change of the value of the applied fractional winding correction causes a change in the slope of the equivalent magnetizing curve determined in the load state of the TCT. Correction by 1/5 of a turn results in increasing the value of the current error from −0.01% to 0.09%, which is compliant with the results of the performed accuracy tests. Increasing the value of the applied fractional winding correction increases the value of the current error by +0.5%.
Application of the developed method enables the possibility to determine the turns ratio correction of the inductive CT. The magnetization curves determined in the load and non-load state are used. If the magnetic flux density is equal to 0.05 T (B3), for the primary current equal to 6 A, the maximum value of the excitation current is equal to 6.447 mA. Using relation (5) for these values, it is possible to determine the number of turns of the applied winding correction from the magnetization curves presented in Figure 6:
- Red color:
- Blue color:
- Green color:
In Figure 7, the equivalent magnetization curves of the TCT are presented. They are determined for factional correction of the secondary winding and its rated load.
The equivalent magnetization curve of TCT for its rated load with a 1/5 turn correction of the secondary winding turns achieves, in relation to other presented cases, lower values of the magnetic field strength for the same values of the magnetic flux density. This is due to the decreased value of the differential current in relation to the excitation current and other cases when the applied turn correction is greater than 1/5. Therefore, the value of the secondary current resulting from the actual turns ratio is increased compared to its value without the turn correction. Therefore, the TCT obtains lower values of the current error for the rated load of the secondary winding. The applied fractional turns number correction is made properly.
4. The Effect of the Applied Turns Ratio Correction on the Frequency Characteristics of Current Error and Phase Displacement
The influence of the applied turn correction of the secondary winding of the TCTs on the determined values of current error and phase displacement for the transformation of distorted current harmonics is investigated. In accordance with Equation (1) for the CT with a rated current ratio equal to 1000 A/5 A, the change of the current error from a single turn correction is equal to:
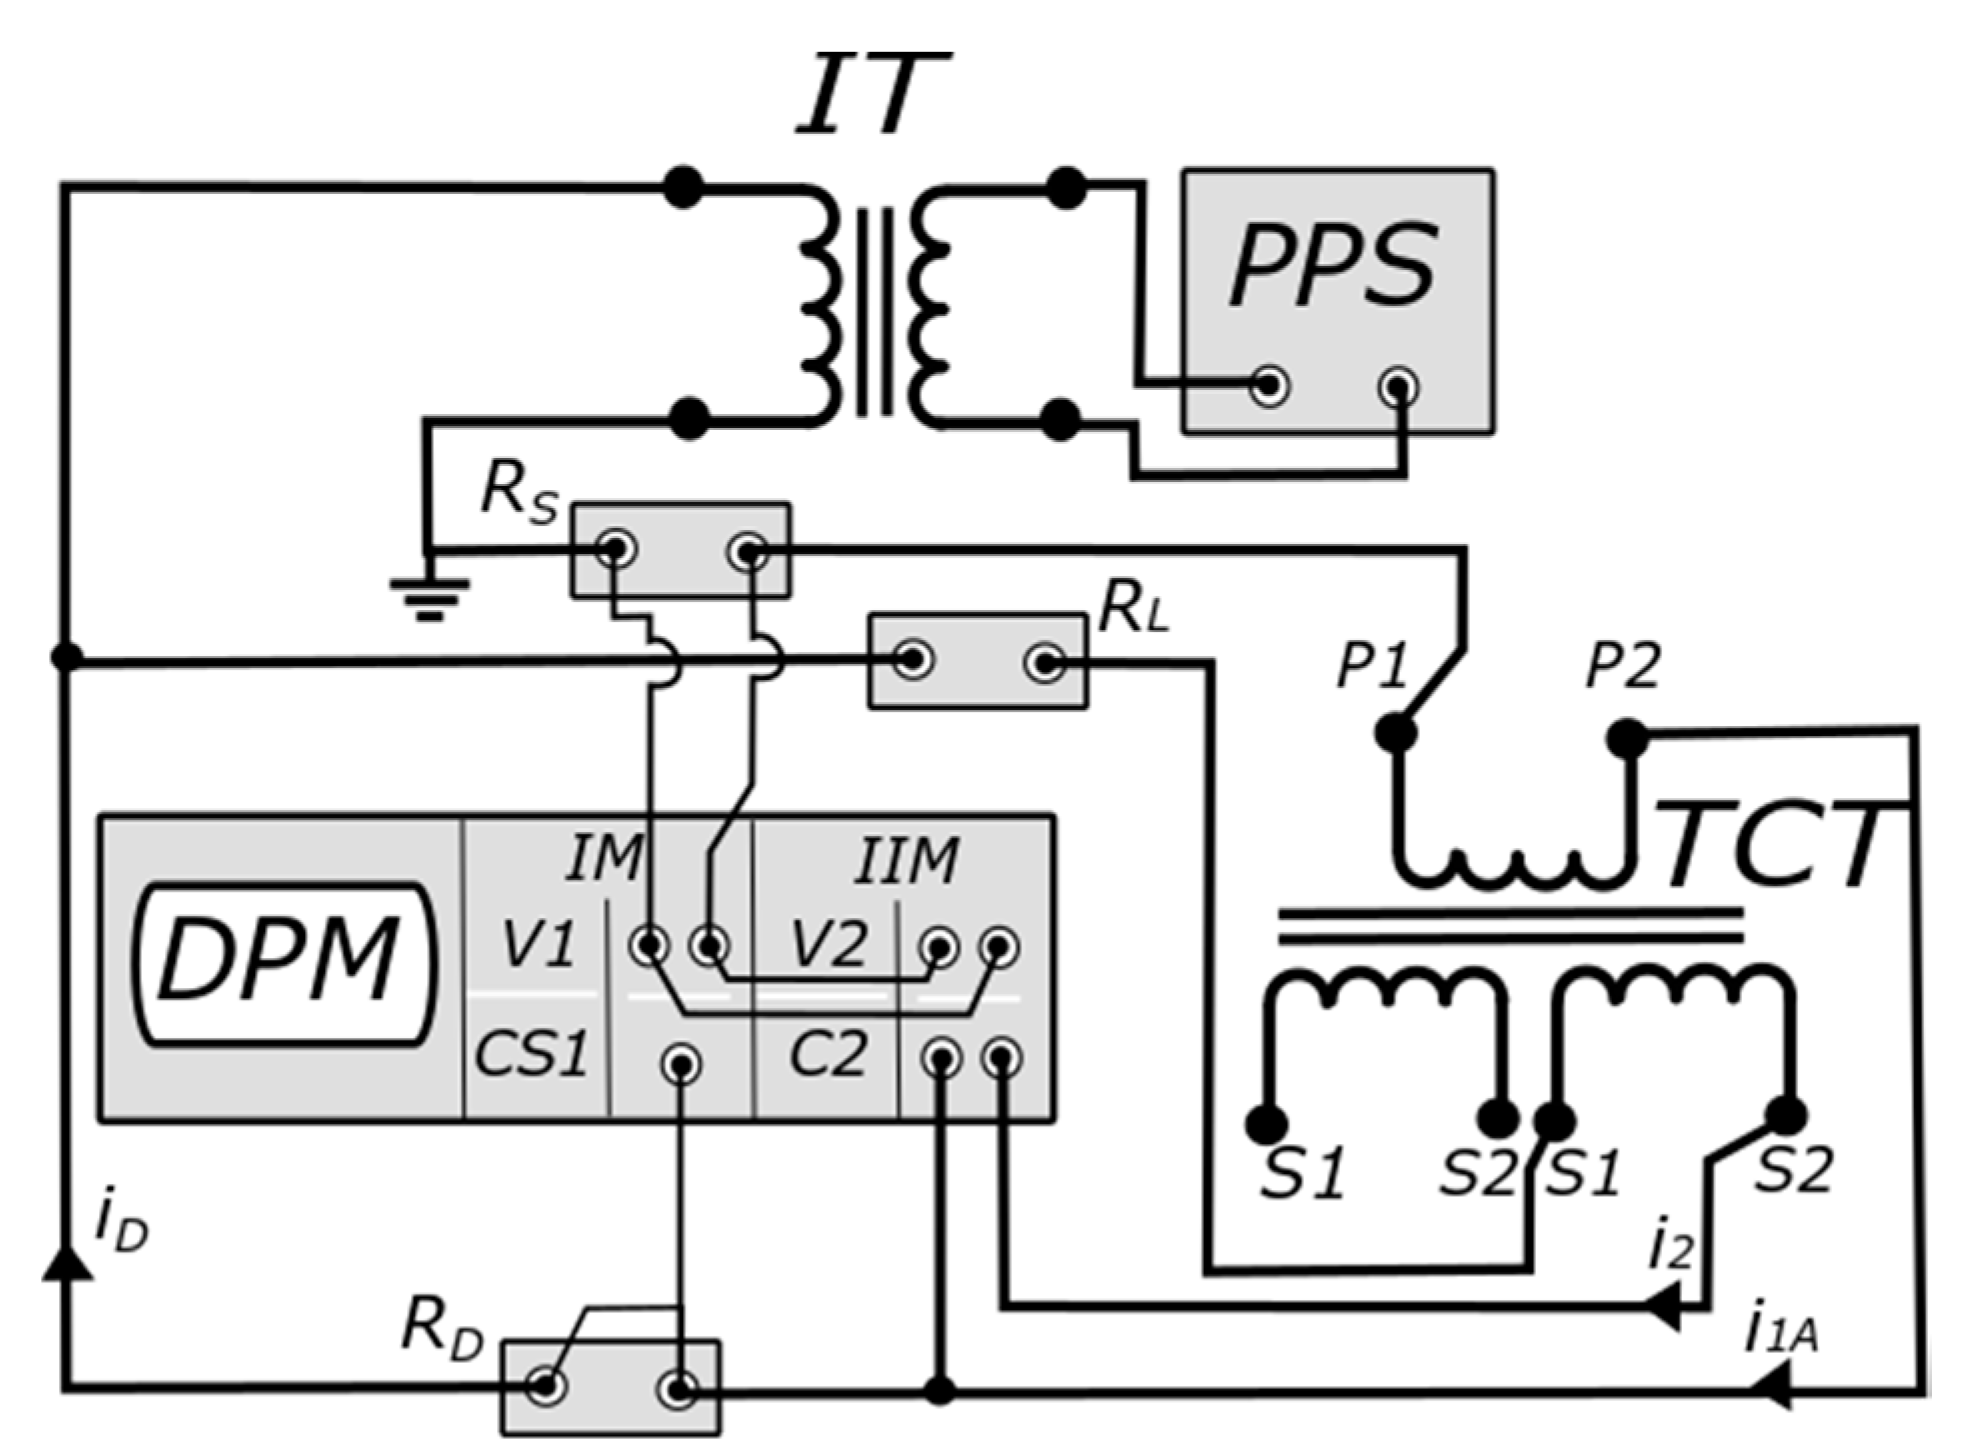
The tests of the influence of the applied turns correction on the frequency characteristics of current error and phase displacement was carried out under the ampere-turns condition of TCT. The measurements were performed by supplying the additional primary winding with the distorted current (main component and single higher harmonic with 10% value of the fundamental harmonic). The measuring system is presented in Figure 8.
The same abbreviations are used as in Figure 1, additionally:
- C2—current channel of the 2nd module of the digital power meter.
In this circuit, the shunt resistors are used to measure the RMS values of the harmonics of distorted current in the additional winding and in the differential connection between the additional primary winding and secondary winding. The differential circuit in ampere-turns condition of the inductive protective CT is presented in the standard IEC 61869-2 and is used to determine the value of the composite error. In the developed method, it is used for the evaluation of the accuracy of inductive CTs during the transformation of distorted currents. In the measuring system in Figure 9, the RMS value of a given harmonic of the distorted current I1Ahk in the additional winding of the CT is determined from the following equation:
where:
- UShk—RMS value of the given harmonic of the distorted voltage on current shunt resistor RS.
The RMS value of a given harmonic of the distorted differential current IDhk is determined from the following equation:
where:
- UDhk—RMS value of the given harmonic of the distorted voltage on current shunt resistor RD.
The composite error ε%Ihk of the given harmonic transformation is determined from the following equation:
Using the Cosine Theorem from determined values of the I1Ahk, IDhk and the value of the phase angle between the hk harmonic of these currents, it is possible to determine the rms value of the given harmonic of the secondary distorted current I2hk of the TCT [20]. Then, the value of the current error of a given harmonic transformation is determined from the following equation:
The value of the phase displacement of a given harmonic transformation is determined from the following equation:
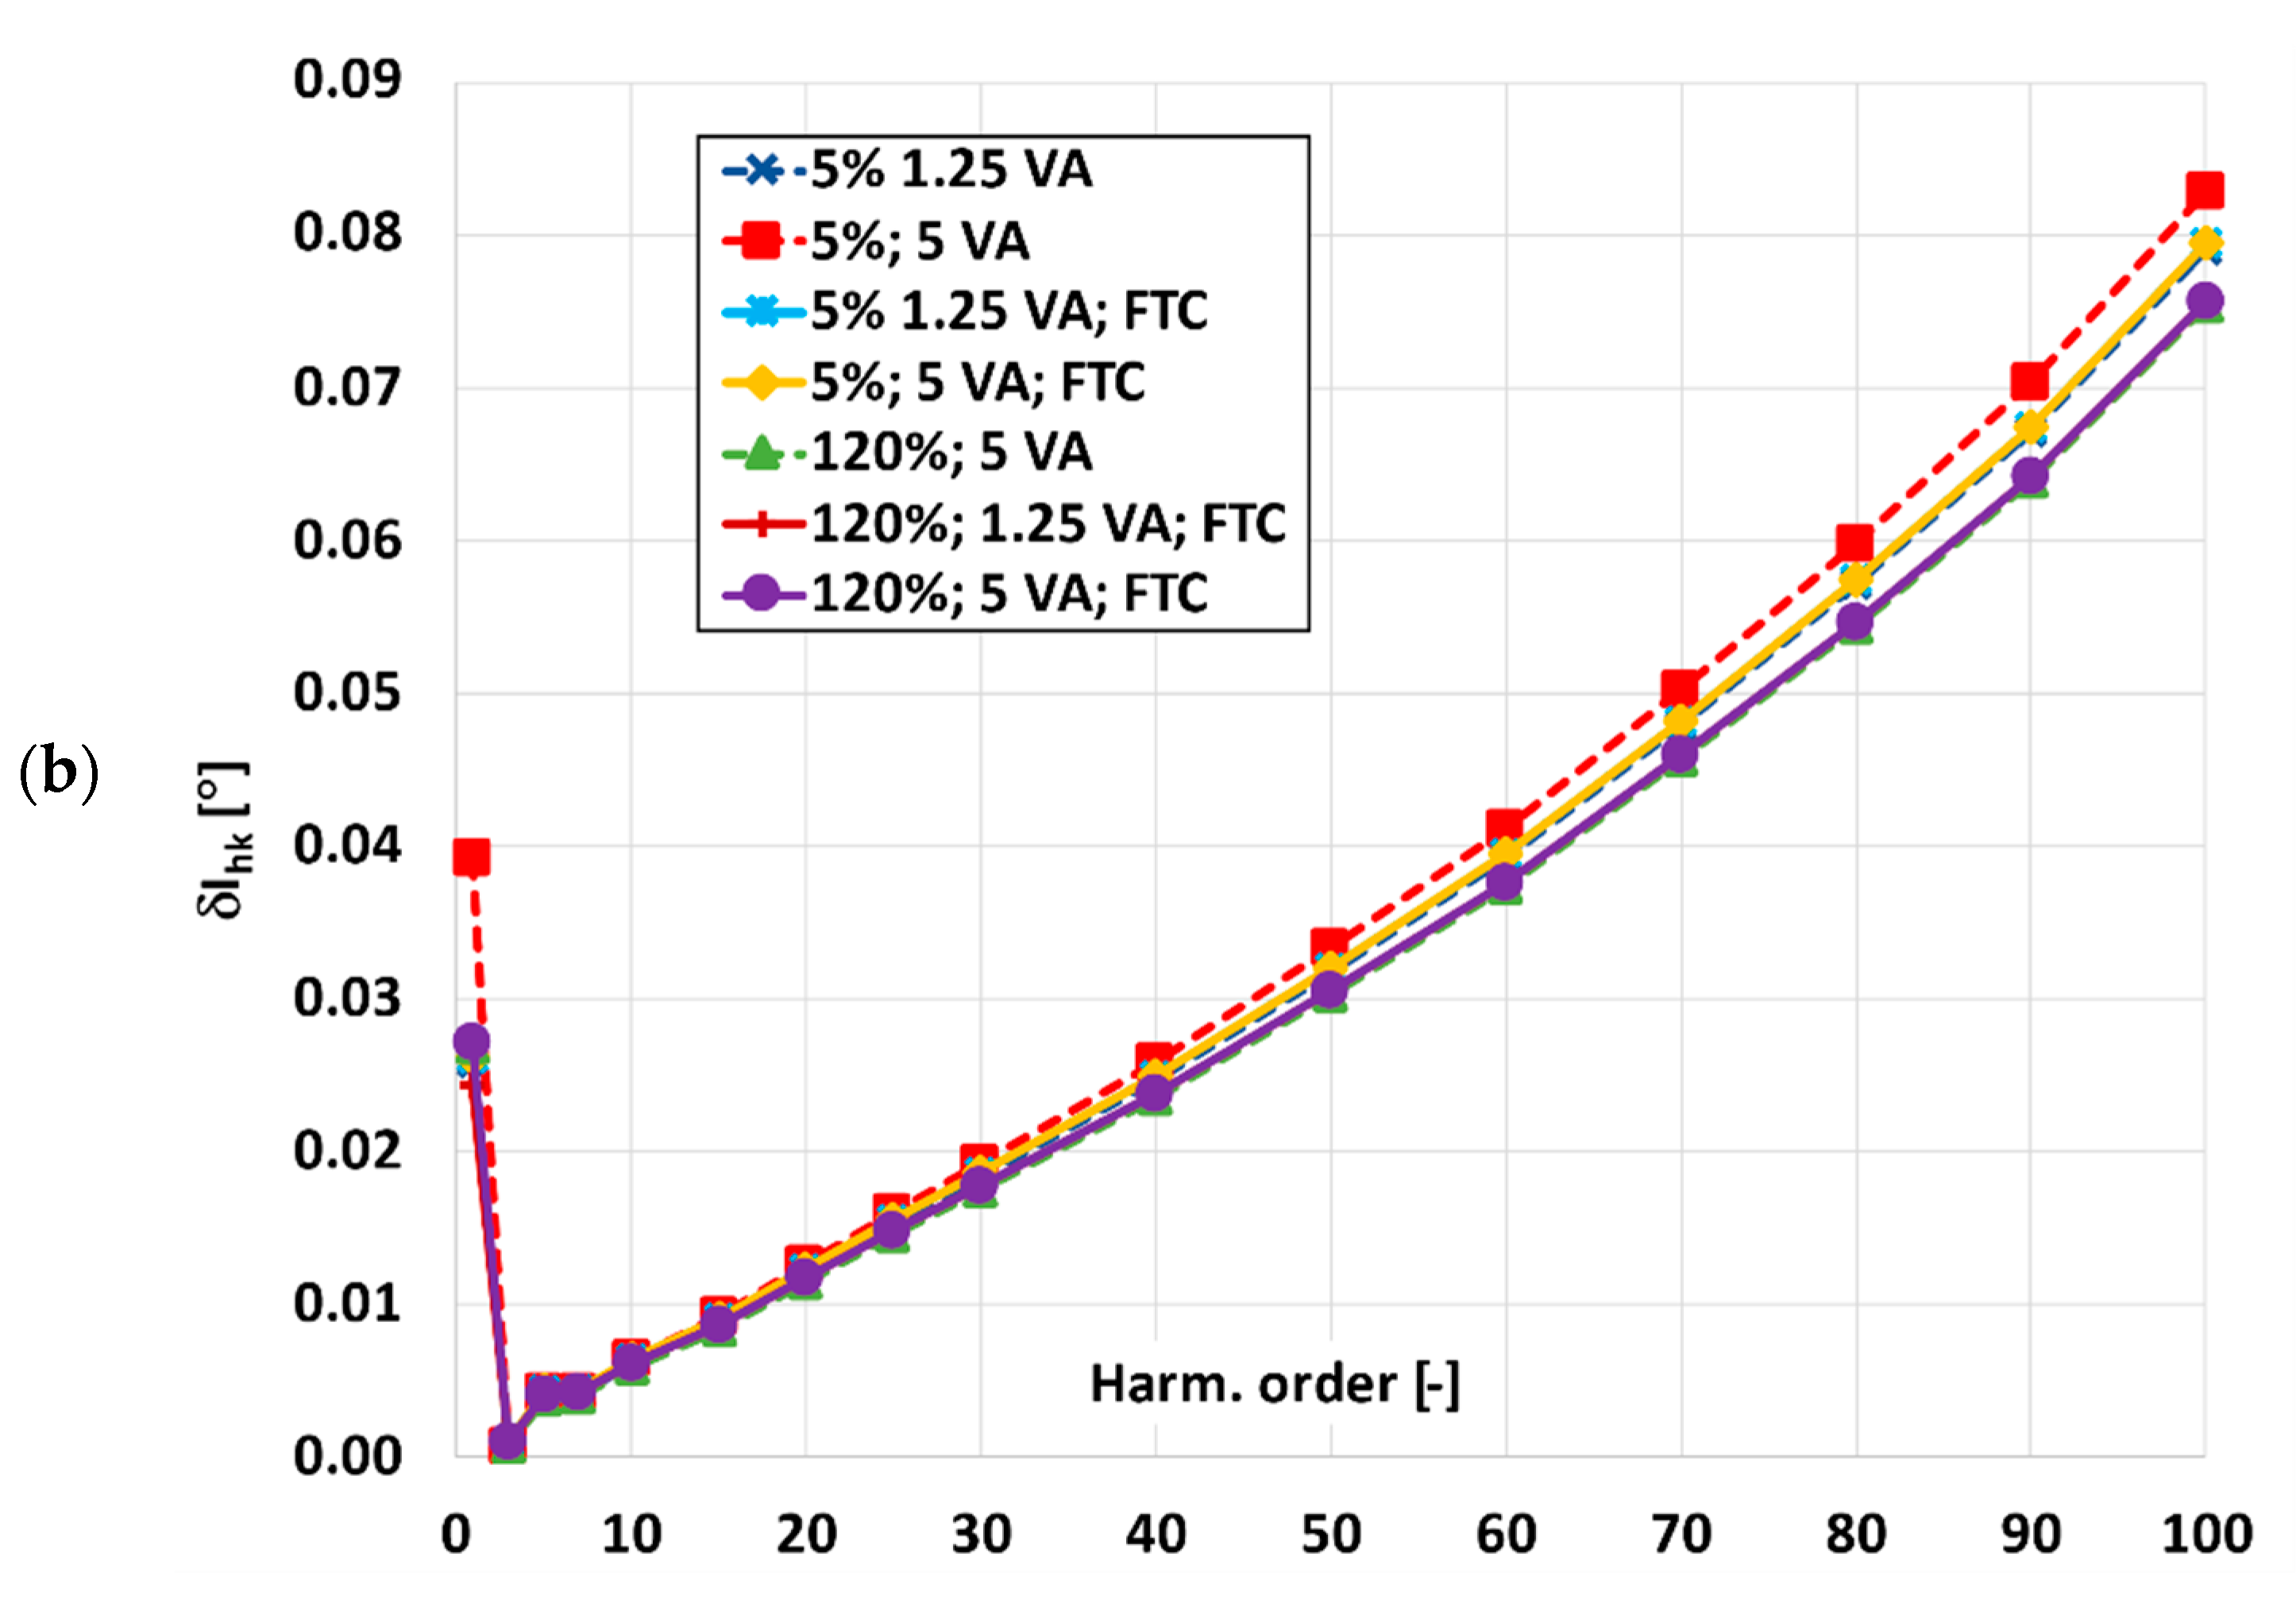
In Figure 9, the frequency characteristics of the values of current error and phase displacement for the transformation of harmonics from the 1st to 100th order by the TCT are presented.
In the case when the number of winding turns is not corrected, the TCT is tested in frequencies ranging from 50 Hz up to 5 kHz and meets the requirements of accuracy class 0.2 (Table 1). In this case, the same error limits as specified for the 50 Hz accuracy class in the standard IEC 61869-2 are adopted for all harmonics.
Using the modified Equation (1), the required value of the fractional turns correction of the secondary winding to ensure for TCT the accuracy class 0.1 from 50 Hz to 5 kHz is determined.
After the fractional turns correction of the secondary winding equal to 1/5, the values of current error are changed by +0.1% in the positive direction over the entire tested frequency range. It was required to use five parallel winding wires with a cross-section of 0.8 mm instead of a single turn of the secondary winding. Their lengths are equal, ensuring approximately the same value of their resistance. Four wires are winded around the magnetic core in the same direction as other turns of the secondary winding, while one wire is directly connected to the output terminal. The real number of turns of the secondary winding is equal to 199.8. In Figure 9, the solid purple line is used to plot results for 120% of the rated primary current, and the solid yellow line is used for 5% of the rated primary current when fractional turns correction is applied. In the case of the corrected secondary winding, the values of current error are the highest for the lowest load of the secondary winding. The solid brown line is used to plot results for 120% of the rated primary current, and the solid blue line is used for 5% of the rated primary current. The use of the fractional turns correction, in the tested frequency range from 50 Hz to 5 kHz, causes TCT with rated primary current 1000 A to meet the requirements of accuracy class 0.1, as defined in Table 1.
5. Conclusions
This paper presents the influence of the applied turns correction on the equivalent magnetization curve in the load condition of the tested inductive CT. The developed method determines its turns ratio correction and the actual turns ratio. The advantage of this solution compared to the method presented in the standard IEC 61869-2 is the possibility to determine even a small correction of the secondary winding’s turns number when a fractional turn is used to improve the CTs accuracy class. The presented results show that the turns ratio correction enabled a reduction of the values of the current error of the harmonics transformation for distorted current. Moreover, if the same accuracy class is preserved, a decrease in the number of turns of the secondary winding makes it possible to increase the rated load of the secondary winding. The applied winding correction has no influence on the values of phase displacements of the harmonics transformation for distorted current. The tests indicated that the obtained frequency characteristics of the values of current error after turns correction of the secondary winding of inductive CT are shifted into the direction of positive values. The curves are parallel in relation to the plots determined for the non-corrected CT and displaced by the value resulting from the applied turns correction.
Funding
This research received no external funding.
Data Availability Statement
The data presented in this study are available on request from the corresponding author. Computer data is not publicly available because it is not suitable for use by another researcher.
Conflicts of Interest
The author declares no conflict of interest.
References
- Kaczmarek, M. Inductive current transformer accuracy of transformation for the PQ measurements. Electr. Power Syst. Res. 2017, 150, 169–176. [Google Scholar] [CrossRef]
- Kaczmarek, M. A practical approach to evaluation of accuracy of inductive current transformer for transformation of distorted current higher harmonics. Electr. Power Syst. Res. 2015, 119, 258–265. [Google Scholar] [CrossRef]
- Kaczmarek, M. Measurement error of non-sinusoidal electrical power and energy caused by instrument transformers. IET Gener. Transm. Distrib. 2016, 10, 3492–3498. [Google Scholar] [CrossRef]
- Pereira, F.A.; Das, F.; Da Costa, E.G.; De Souza, B.A. A method for correcting distorted current waveforms at air-gapped current transformers. IEEE Lat. Am. Trans. 2014, 12, 596–601. [Google Scholar] [CrossRef]
- Haghjoo, F.; Pak, M.H. Compensation of CT distorted secondary current waveform in online conditions. IEEE Trans. Power Deliv. 2016, 31, 711–720. [Google Scholar] [CrossRef]
- Laurano, C.; Toscani, S.; Zanoni, M. A simple method for compensating harmonic distortion in current transformers: Experimental validation. Sensors 2021, 21, 2907. [Google Scholar] [CrossRef]
- Hajipour, E.; Vakilian, M.; Sanaye-Pasand, M. Current-Transformer Saturation Prevention Using a Controlled Voltage-Source Compensator. IEEE Trans. Power Deliv. 2017, 32, 1039–1048. [Google Scholar] [CrossRef]
- Hong, Y.Y.; Wei, D.W. Compensation of distorted secondary current caused by saturation and remanence in a current transformer. IEEE Trans. Power Deliv. 2010, 25, 47–54. [Google Scholar] [CrossRef]
- Hajipour, E.; Vakilian, M.; Sanaye-Pasand, M. Current-Transformer Saturation Compensation for Transformer Differential Relays. IEEE Trans. Power Deliv. 2015, 30, 2293–2302. [Google Scholar] [CrossRef]
- Bauer, J.; Ripka, P.; Draxler, K.; Styblikova, R. Demagnetization of current transformers using PWM burden. IEEE Trans. Magn. 2015, 51, 1–4. [Google Scholar] [CrossRef]
- Sanati, S.; Alinejad-Beromi, Y. Avoid current transformer saturation using adjustable switched resistor demagnetization method. IEEE Trans. Power Deliv. 2021, 36, 92–101. [Google Scholar] [CrossRef]
- Esmail, E.M.; Elkalashy, N.I.; Kawady, T.A.; Taalab, A.M.I.; Lehtonen, M. Detection of Partial Saturation and Waveform Compensation of Current Transformers. IEEE Trans. Power Deliv. 2015, 30, 1620–1622. [Google Scholar] [CrossRef]
- Kaczmarek, M. Estimation of the inductive current transformer derating for operation with distorted currents. Bull. Pol. Acad. Sci. Tech. Sci. 2014, 62, 363–366. [Google Scholar] [CrossRef] [Green Version]
- Draxler, K.; Styblikova, R.; Rada, V.; Kucera, J.; Odehnal, M. Using a current loop and homogeneous primary winding for calibrating a current transformer. IEEE Trans. Instrum. Meas. 2013, 62, 1658–1663. [Google Scholar] [CrossRef]
- Kaczmarek, M.; Stano, E. Proposal for extension of routine tests of the inductive current transformers to evaluation of transformation accuracy of higher harmonics. Int. J. Electr. Power Energy Syst. 2019, 113, 842–849. [Google Scholar] [CrossRef]
- Stano, E. System pomiarowy do sprawdzania dokładności transformacji poszczególnych harmonicznych prądu odkształconego przez indukcyjne przekładniki prądowe. Prz. Elektrotechniczny 2020, 96, 187–190. [Google Scholar] [CrossRef]
- Kaczmarek, M.L.; Stano, E. Application of the inductive high current testing transformer for supplying of the measuring circuit with distorted current. IET Electr. Power Appl. 2019, 13, 1310–1317. [Google Scholar] [CrossRef]
- Cristaldi, L.; Faifer, M.; Laurano, C.; Ottoboni, R.; Toscani, S.; Zanoni, M. A Low-Cost Generator for Testing and Calibrating Current Transformers. IEEE Trans. Instrum. Meas. 2019, 68, 2792–2799. [Google Scholar] [CrossRef]
- Mohns, E.; Roeissle, G.; Fricke, S.; Pauling, F. An AC current transformer standard measuring system for power frequencies. IEEE Trans. Instrum. Meas. 2017, 66, 1433–1440. [Google Scholar] [CrossRef]
- Stano, E.; Kaczmarek, M. Wideband self-calibration method of inductive cts and verification of determined values of current and phase errors at harmonics for transformation of distorted current. Sensors 2020, 20, 2167. [Google Scholar] [CrossRef] [Green Version]
- Kaczmarek, M.; Stano, E. Nonlinearity of Magnetic Core in Evaluation of Current and Phase Errors of Transformation of Higher Harmonics of Distorted Current by Inductive Current Transformers. IEEE Access 2020, 8, 118885–118898. [Google Scholar] [CrossRef]
- Kaczmarek, M.; Kaczmarek, P. Comparison of the wideband power sources used to supply step-up current transformers for generation of distorted currents. Energies 2020, 13, 1849. [Google Scholar] [CrossRef]
- IEC 61869-2: Instrument Transformers—Part 2: Additional Requirements for Current Transformers; International Electrotechnical Commission: Geneva, Switzerland, 2012.
- Jung, J.K.; So, E.; Park, Y.T.; Kim, M. KRISS-NRC intercomparisons of calibration systems for instrument transformers with many different ratios at power frequency. IEEE Trans. Instrum. Meas. 2009, 58, 1023–1028. [Google Scholar] [CrossRef]
- IEC 61869-6 Instrument Transformers—Additional General Requirements for Low-Power Instrument Transformers; International Electrotechnical Commission: Geneva, Switzerland, 2016.
- Suomalainen, E.P.; Hällström, J.K. Onsite calibration of a current transformer using a Rogowski coil. IEEE Trans. Instrum. Meas. 2009, 58, 1054–1058. [Google Scholar] [CrossRef]
- George, N.; Ooka, P.V.; Gopalakrishna, S. An Efficient Digitizer for Calibration of Instrument Transformers. In Proceedings of the 9th IEEE International Workshop on Applied Measurements for Power Systems (AMPS 2018), Bologna, Italy, 26–28 September 2018; pp. 1–6. [Google Scholar]
- Brandolini, A.; Faifer, M.; Ottoboni, R. A simple method for the calibration of traditional and electronic measurement current and voltage transformers. IEEE Trans. Instrum. Meas. 2009, 58, 1345–1353. [Google Scholar] [CrossRef]
- Crotti, G.; Delle Femine, A.; Gallo, D.; Giordano, D.; Landi, C.; Letizia, P.S.; Luiso, M. Calibration of Current Transformers in distorted conditions. J. Phys. Conf. Ser. 2018, 1065, 1–4. [Google Scholar] [CrossRef]
Figure 1.
The secondary winding of the window-type CT without correction (a), with single turn correction (b) and with fractional correction of turns (c).
Figure 1.
The secondary winding of the window-type CT without correction (a), with single turn correction (b) and with fractional correction of turns (c).

Figure 2.
Measuring systems to determine the magnetization curves and the active power losses of the CT: (a) non-load state, (b) load state.
Figure 2.
Measuring systems to determine the magnetization curves and the active power losses of the CT: (a) non-load state, (b) load state.


Figure 3.
The flowchart of the developed method to determine the turns ratio correction of the CT.

Figure 4.
Magnetization curves of the inductive CT (TC—single turn correction, FTC—fractional turn correction).
Figure 4.
Magnetization curves of the inductive CT (TC—single turn correction, FTC—fractional turn correction).

Figure 5.
Equivalent magnetization curves of the TCT (abbreviation: TC—single turn correction).

Figure 6.
Equivalent magnetization curves of the TCT (abbreviation: TC—single turn correction).

Figure 7.
Equivalent magnetization curves of the TCT determined for factional correction of the secondary winding and its rated load (abbreviations: TC—single turn correction, FTC—fractional turn correction).
Figure 7.
Equivalent magnetization curves of the TCT determined for factional correction of the secondary winding and its rated load (abbreviations: TC—single turn correction, FTC—fractional turn correction).

Figure 8.
The measuring system used to determine the values of current error and phase displacement of the TCT for the transformation of the distorted current.
Figure 8.
The measuring system used to determine the values of current error and phase displacement of the TCT for the transformation of the distorted current.


Figure 9.
Influence of the applied fractional turn correction of the secondary winding of the TCT on the values of (a) current error and (b) phase displacement (abbreviation: FTC—fractional turn correction).
Figure 9.
Influence of the applied fractional turn correction of the secondary winding of the TCT on the values of (a) current error and (b) phase displacement (abbreviation: FTC—fractional turn correction).


Table 1.
Accuracy classes of measuring inductive CTs in accordance with the standard IEC 61869-2.
| Acc. Class | Current Error [%] | Phase Displacement [°] | ||||||
|---|---|---|---|---|---|---|---|---|
| 5 | 20 | 100 | 120 | 5 | 20 | 100 | 120 | |
| 0.1 | ±0.4 | ±0.2 | ±0.1 | ±0.1 | ±0.25 | ±0.14 | ±0.09 | ±0.09 |
| 0.2 | ±0.75 | ±0.35 | ±0.2 | ±0.2 | ±0.50 | ±0.25 | ±0.17 | ±0.17 |
| 0.5 | ±1.5 | ±0.75 | ±0.5 | ±0.5 | ±1.50 | ±0.75 | ±0.50 | ±0.50 |
Publisher’s Note: MDPI stays neutral with regard to jurisdictional claims in published maps and institutional affiliations. |
© 2021 by the author. Licensee MDPI, Basel, Switzerland. This article is an open access article distributed under the terms and conditions of the Creative Commons Attribution (CC BY) license (https://creativecommons.org/licenses/by/4.0/).
Share and Cite
MDPI and ACS Style
Stano, E. The Method to Determine the Turns Ratio Correction of the Inductive Current Transformer. Energies 2021, 14, 8602. https://doi.org/10.3390/en14248602
AMA Style
Stano E. The Method to Determine the Turns Ratio Correction of the Inductive Current Transformer. Energies. 2021; 14(24):8602. https://doi.org/10.3390/en14248602
Chicago/Turabian StyleStano, Ernest. 2021. "The Method to Determine the Turns Ratio Correction of the Inductive Current Transformer" Energies 14, no. 24: 8602. https://doi.org/10.3390/en14248602
Note that from the first issue of 2016, this journal uses article numbers instead of page numbers. See further details here.