Article

Numerical Modelling of Various Aspects of Pipe Pile Static Load Test

by
Michał Baca
1,
Alexander L. Ivannikov
2 and
Jarosław Rybak
1,*
1
Department of Geotechnology, Hydro Technology, and Underground and Hydro Engineering, Faculty of Civil Engineering, Wroclaw University of Science and Technology, Wybrzeże Wyspiańskiego 27, 50-370 Wrocław, Poland
2
Department of Automated Control Systems, Institute of Information Technology and Computer Science, National University of Science and Technology MISIS, Leninsky Av. 4, 119991 Moscow, Russia
*
Author to whom correspondence should be addressed.
Energies 2021, 14(24), 8598; https://doi.org/10.3390/en14248598
Submission received: 24 September 2021 / Revised: 21 November 2021 / Accepted: 16 December 2021 / Published: 20 December 2021
(This article belongs to the Special Issue Sustainable Geotechnical Engineering and Its Applications)

Abstract

:
Due to the development of dedicated software and the computing capabilities of modern computers, the application of numerical methods to analyse more complex geotechnical problems is becoming increasingly common. However, there are still some areas which, due to the lack of unambiguous solutions, require a more thorough examination, e.g., the numerical simulations of displacement pile behaviour in soil. Difficulties in obtaining the convergence of simulations with the results of static load tests are mainly caused by problems with proper modelling of the pile installation process. Based on the numerical models developed so far, a new process of static load test modelling has been proposed, which includes the influence of pile installation on the soil in its vicinity and modelling of contact between steel pile and the soil. Although the presented method is not new, this is relevant and important for practitioners that may want to improve the design of displacement piles. The results of the numerical calculations were verified by comparing them with the results of pipe pile field tests carried out in a natural scale on the test field in Southern Poland.

1. Introduction

Deep foundations and foundation piles are inextricably linked to the energy sector. High requirements for critical infrastructure facilities require a high level of reliability, which is characterized by pile foundations working both for pressing and pulling. Due to a very large variety of geotechnical parameters of the subsoil, the optimal design requires both the compliance of the calculation model parameters with the in situ conditions and a proper mathematical description of the subsoil model.
Pipe piles are more sustainable for environment than, for example, concrete piles. Pipe piles are widely used in polar zones and in maritime engineering; therefore, they have a variety of applications. Moreover, applications of steel piles (frequently used for temporary constructions) seem to be a perfect solution for constructions, whose lifetime may be limited by functional (not technical) issues. Steel constructions can be easily disassembled (including foundations) and reused (or just melted). What is more, we propose a method of pile bearing capacity estimation, which could improve the process of pile design and consequently reduce the carbon footprint and emission of greenhouse gases.
The main idea of our study is focused, however, on efficient procedure of installation process modelling in Finite Element Method FEM (Plaxis). The presented results are surprisingly promising considering the fact that the model was checked (but not calibrated) on the basis of real-world tests. Any further validation would be appreciated; however, one must be aware of the fact that in the real world, piles are checked by means of capacity testing in any case.
The widespread introduction of numerical methods such as FEM to geotechnical design requires ongoing calibration for changing geotechnical conditions. The authors of this paper try to introduce and develop an innovative method of design and checking of foundation piles used for the foundation of wind turbine masts and power grids. Earlier works [1,2] presented various aspects of laboratory model tests, their verification and calibration of the numerical model of the experiment. This paper presents the results of numerical analyses for tests carried out on a real-world scale for real foundation piles, carrying compressive loads (including cyclic loads) and pulling forces in the range corresponding to real loads from energy structures. Particular attention was paid to the issue of the effect of the technology of installation of a tubular pile with a closed bottom using the vibration method.
It should be emphasized that displacement piles (including the tested pipe piles with a closed bottom) have a number of advantages related to the improvement of the ground condition in the vicinity of the pile after its installation. What is an undoubted advantage over bored piles, however, is a significant difficulty in numerical modelling in mesh methods, such as FEM. The study deals with significant deformations or even loss of continuity of the mesh of the finite element method. The behaviour of the pile in the soil is a complex issue, which is still examined by many researchers, especially in the case of displacement piles [3,4]. An installation of displacement piles is more invasive to the surrounding soil than the installation of drilled piles and significantly affects changes in soil parameters and consequently the behaviour (displacement) and capacity of the pile under load. Bored piles, despite large piling rigs, do not cause as many problems to the soil and to the neighbourhood, in terms of dynamic effects, compared to hammer driving or vibratory driving. The pile and soil behaviour during installation require thorough experimental investigation [5,6] and the influence of these phenomena on the soil parameters, the stresses around the pile, and consequently the bearing capacity is crucial. For this reason, in some cases, it is not possible to determine the pile-bearing capacity with an accuracy of more than 30% [7]. Numerical simulations can be helpful in better understanding the pile behaviour in soil. Nevertheless, accurate modelling of the changes occurring in the soil due to pile installation often requires the application of complex numerical models or the implementation of different techniques that allow us to include at least some of these changes.
This paper presents the authors’ new approach to the numerical modelling of the pile behaviour in the soil. A Finite Element Method model has been proposed, which allows us to implement changes in the soil surrounding the pile caused by the pile installation (soil displacement). The model was validated on the basis of the results of different types of static load tests performed in real world scale on pipe piles. The results of the preformed pipe pile tests were compared with numerical simulations both with as well as without the pile installation process included.
The basic approach for including the installation effects involves changing the values of soil parameters, mainly increasing the values of the angle of internal friction and soil stiffness, due to a soil compaction increase. Another method of modelling displacement piles in FE models is to impose the effects of the installation through the initial conditions in the model, e.g., by additional displacements around the pile. A simple example of a model estimating the effect of pile installation was presented in [8]. A similar approach was proposed by Krasinski [9] for the numerical modelling of the screw pile installation process; however, a comparison of the simulation results with the field measurements showed that the soil parameters still require additional corrections in the zones next to the pile. Another method, the Press Replace Technique, was introduced in [3]. In this method, using a standard FEM code, the process of pressing piles into sands was modelled. The method is relatively computationally stable and can be used to quantify installation effects. The disadvantage of this method is the problem of proper modelling of the stress state around the pile base.
More advanced methods are part of zipper-type techniques [10] developed from an extension of Cavity Expansion Theory. These models are proper for modelling interactions; nevertheless, they are computationally demanding and require relatively arduous implementation in Finite Element code. For larger friction coefficients and shear-causing mesh distortion, remeshing and other advanced techniques based on mixed Lagrange and Eulerian descriptions can be used: Coupled Eulerian Lagrangian [11,12], Arbitrary Lagrangian Eulerian [13], and Material Point Method [14]. An alternative solution is application of the Discrete Element Method. It allows for a more realistic modelling of soil behaviour by mapping the work of soil particles, including their movement and crushing [5,15,16]. The application of the above-mentioned methods produces promising results in avoiding mesh deformations; however, their implementation in standard FE code can be difficult.
It must be underlined that, while the “installation effects” during pile driving were already widely discussed 30 and even 40 years ago, various aspects of structure-soil and structure-soil-structure interactions (friction between pile and soil, changes in soil stress state, etc.) are still vivid (alive) and up-to-date in the scientific discourse. Recent works on driven pile effects on nearby piles [17,18], and even a sophisticated analysis on the effect of “air in groundwater”-structure interaction [19] (during pile driving) confirms the necessity of developing knowledge on various aspects of this phenomena.
Bearing in mind the complexity of installation effects, it was assumed that time lapses between field tests used for a validation of the current study were sufficient to avoid influences of previous tests. At the same time, the authors are aware of the so-called “setup effect” (pile capacity increase in time) that can be, however, neglected to some extent, when pile displacement in every test performed causes a sufficient displacement of the pile.

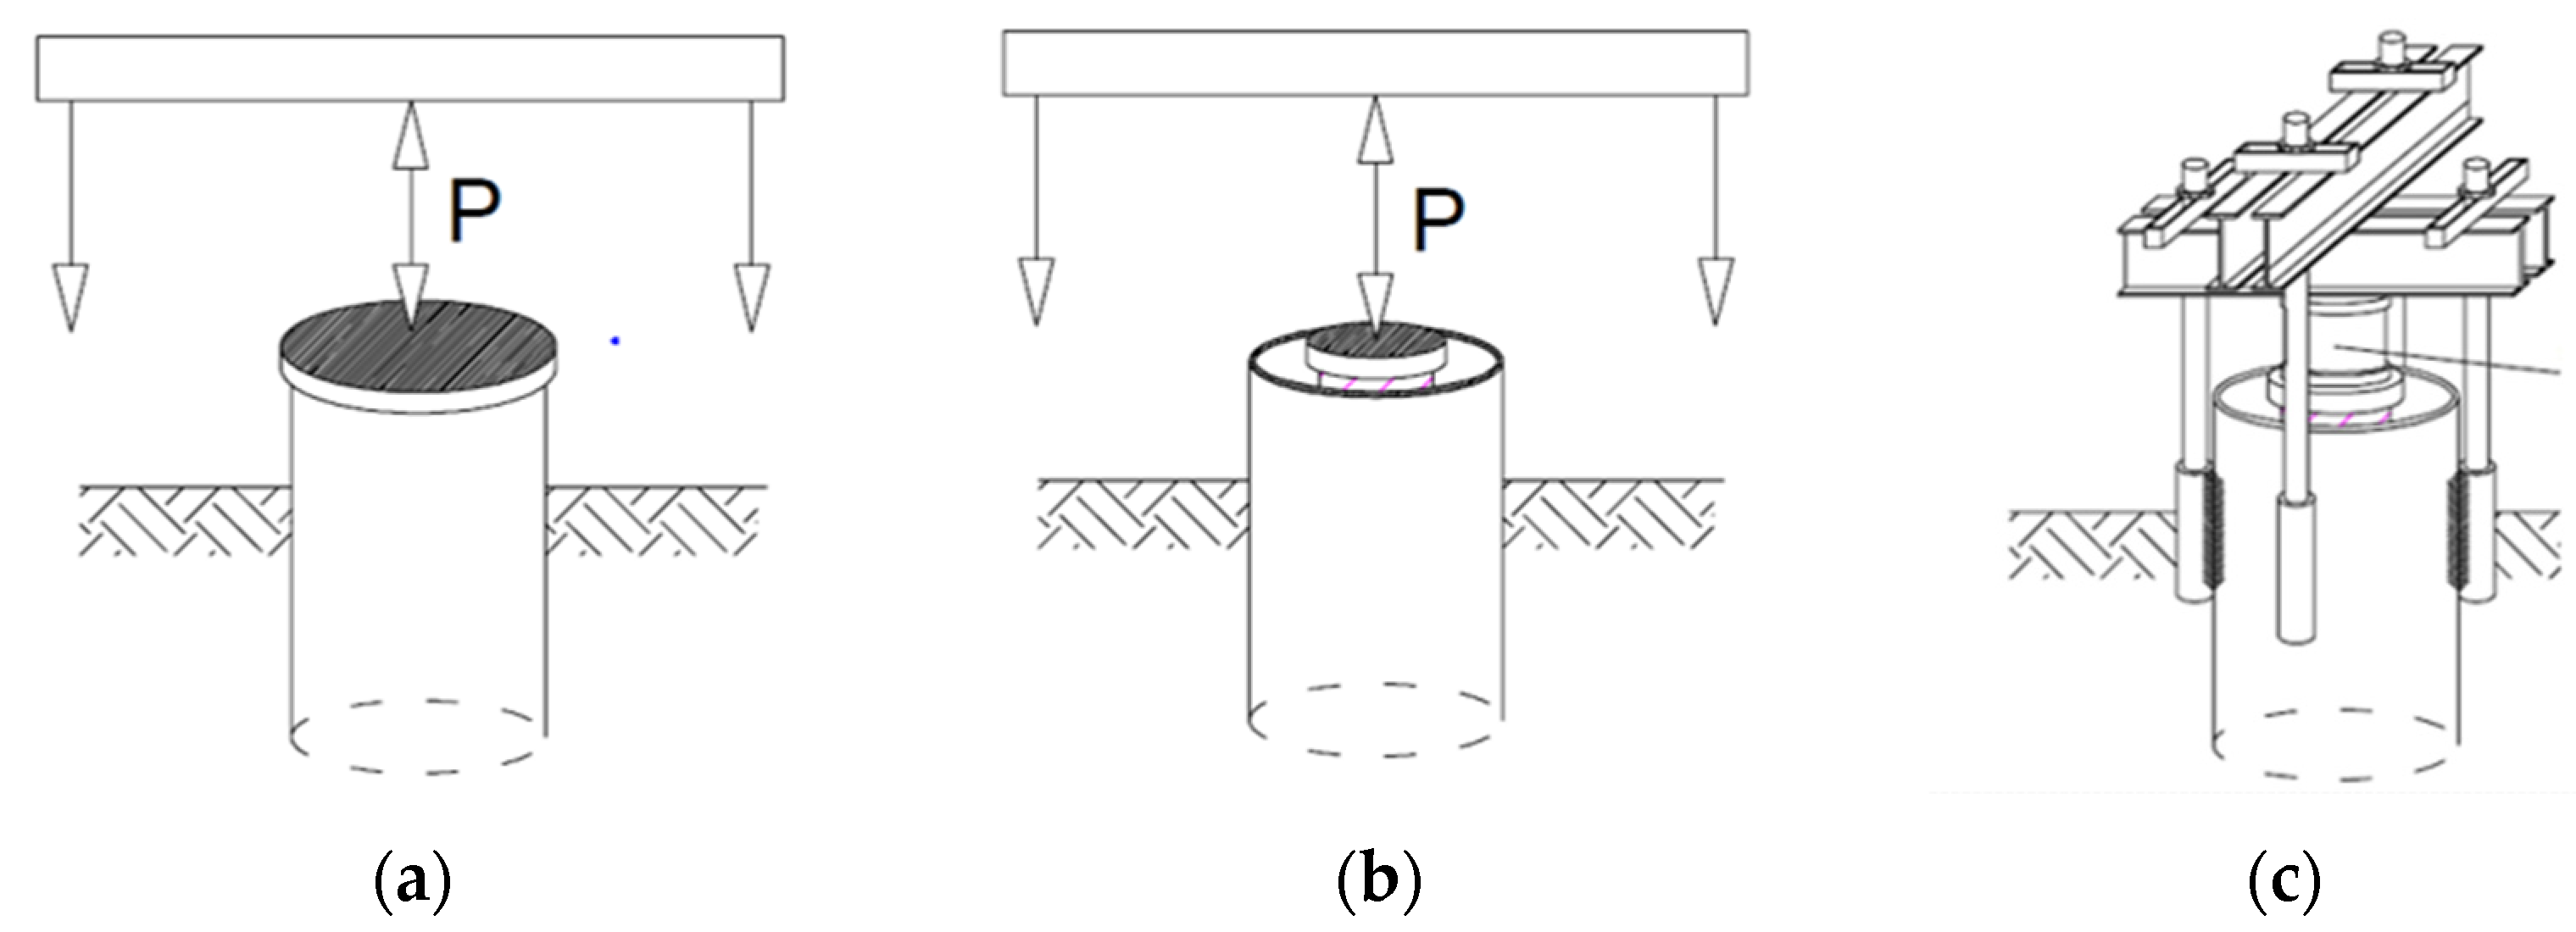
2. New Method of Pipe Piles Bi-Directional Static Load Test

The static load test is considered the most reliable method for pile testing [20]. However, the test requires a suitable retaining structure to apply the required load to the pile. An alternative testing method is the bi-directional static test, in which a retaining structure is not required. The most common test of this type is the Osterberg test [21,22], but other variations of this test have been also developed and performed in Austria [23], Slovakia [24], Serbia [25], and Poland [26,27].
A new variation of the bi-directional test that was introduced in Poland, has been comprehensively and extensively studied through field testing [26,27], laboratory experiments [1], and numerical simulations [2]. The testing program allowed us to perform three types of static load tests (Figure 1) on a test stand containing a loose steel shoe, two steel pipes with different diameters and relevant reaction system. The larger diameter pipe with the shoe is installed in the soil to the desired depth and after that the second pipe is placed inside the outer pipe. Three main stages of the test are presented in Figure 1. Scheme (a) represents a “standard test”, when the load applied to the pile head is transferred to its shaft and its toe (inner pipe is not loaded). Scheme (b) presents a situation with direct loading of the pile toe through a “piston” (inner steel column or pipe) inside the pile. Cases (a) and (b) both require a reaction beam, preferably anchored or just loaded by a relevant kentledge. Figure 1c) presents the idea of “bi-directional” testing based on Osterberg’s idea but without a sacrificial jack.
All loading schemes were used at the test field in Bojszowy Nowe in Southern Poland, for the maintained constant step of load testing of the vibratory driven pile. The diameter of the pile was 40 cm and the pile toe was a round steel slab of the same diameter.
Firstly, the pile was driven to the depth of 6.50 m and tested several times by means of bi-directional SLT according to Figure 1c.
In the second stage, the pile was vibratory driven to the depth of 8 m and a traditional static load test of the entire pile was primarily performed with a load applied to the outer pipe (Figure 1a). Secondly, with the load applied to the inner pipe, a traditional load test of the pile base only was conducted (Figure 1b). For these two stages, an additional anchoring system had to be prepared using adjacent jet-grouting columns. The final stage was a bi-directional static load test again (Figure 1c), when the jack was also placed on the inner pipe, but this time the retaining structure is anchored to the outer pipe. During the test, the inner pipe and toe (base) was driven into the soil while the outer pipe was uplifted with the same load.
For the two first stages of the test, the results can be presented as a Q–s curve for the entire pile and pile base, respectively. In the bi-directional test, two Q–s curves can be determined for pile base compression and shaft uplift behaviour, similarly as in the Osterberg test. These two curves can also be used to plot the equivalent Q–s curve, which describes the performance of the entire pile under a compressive load [7].

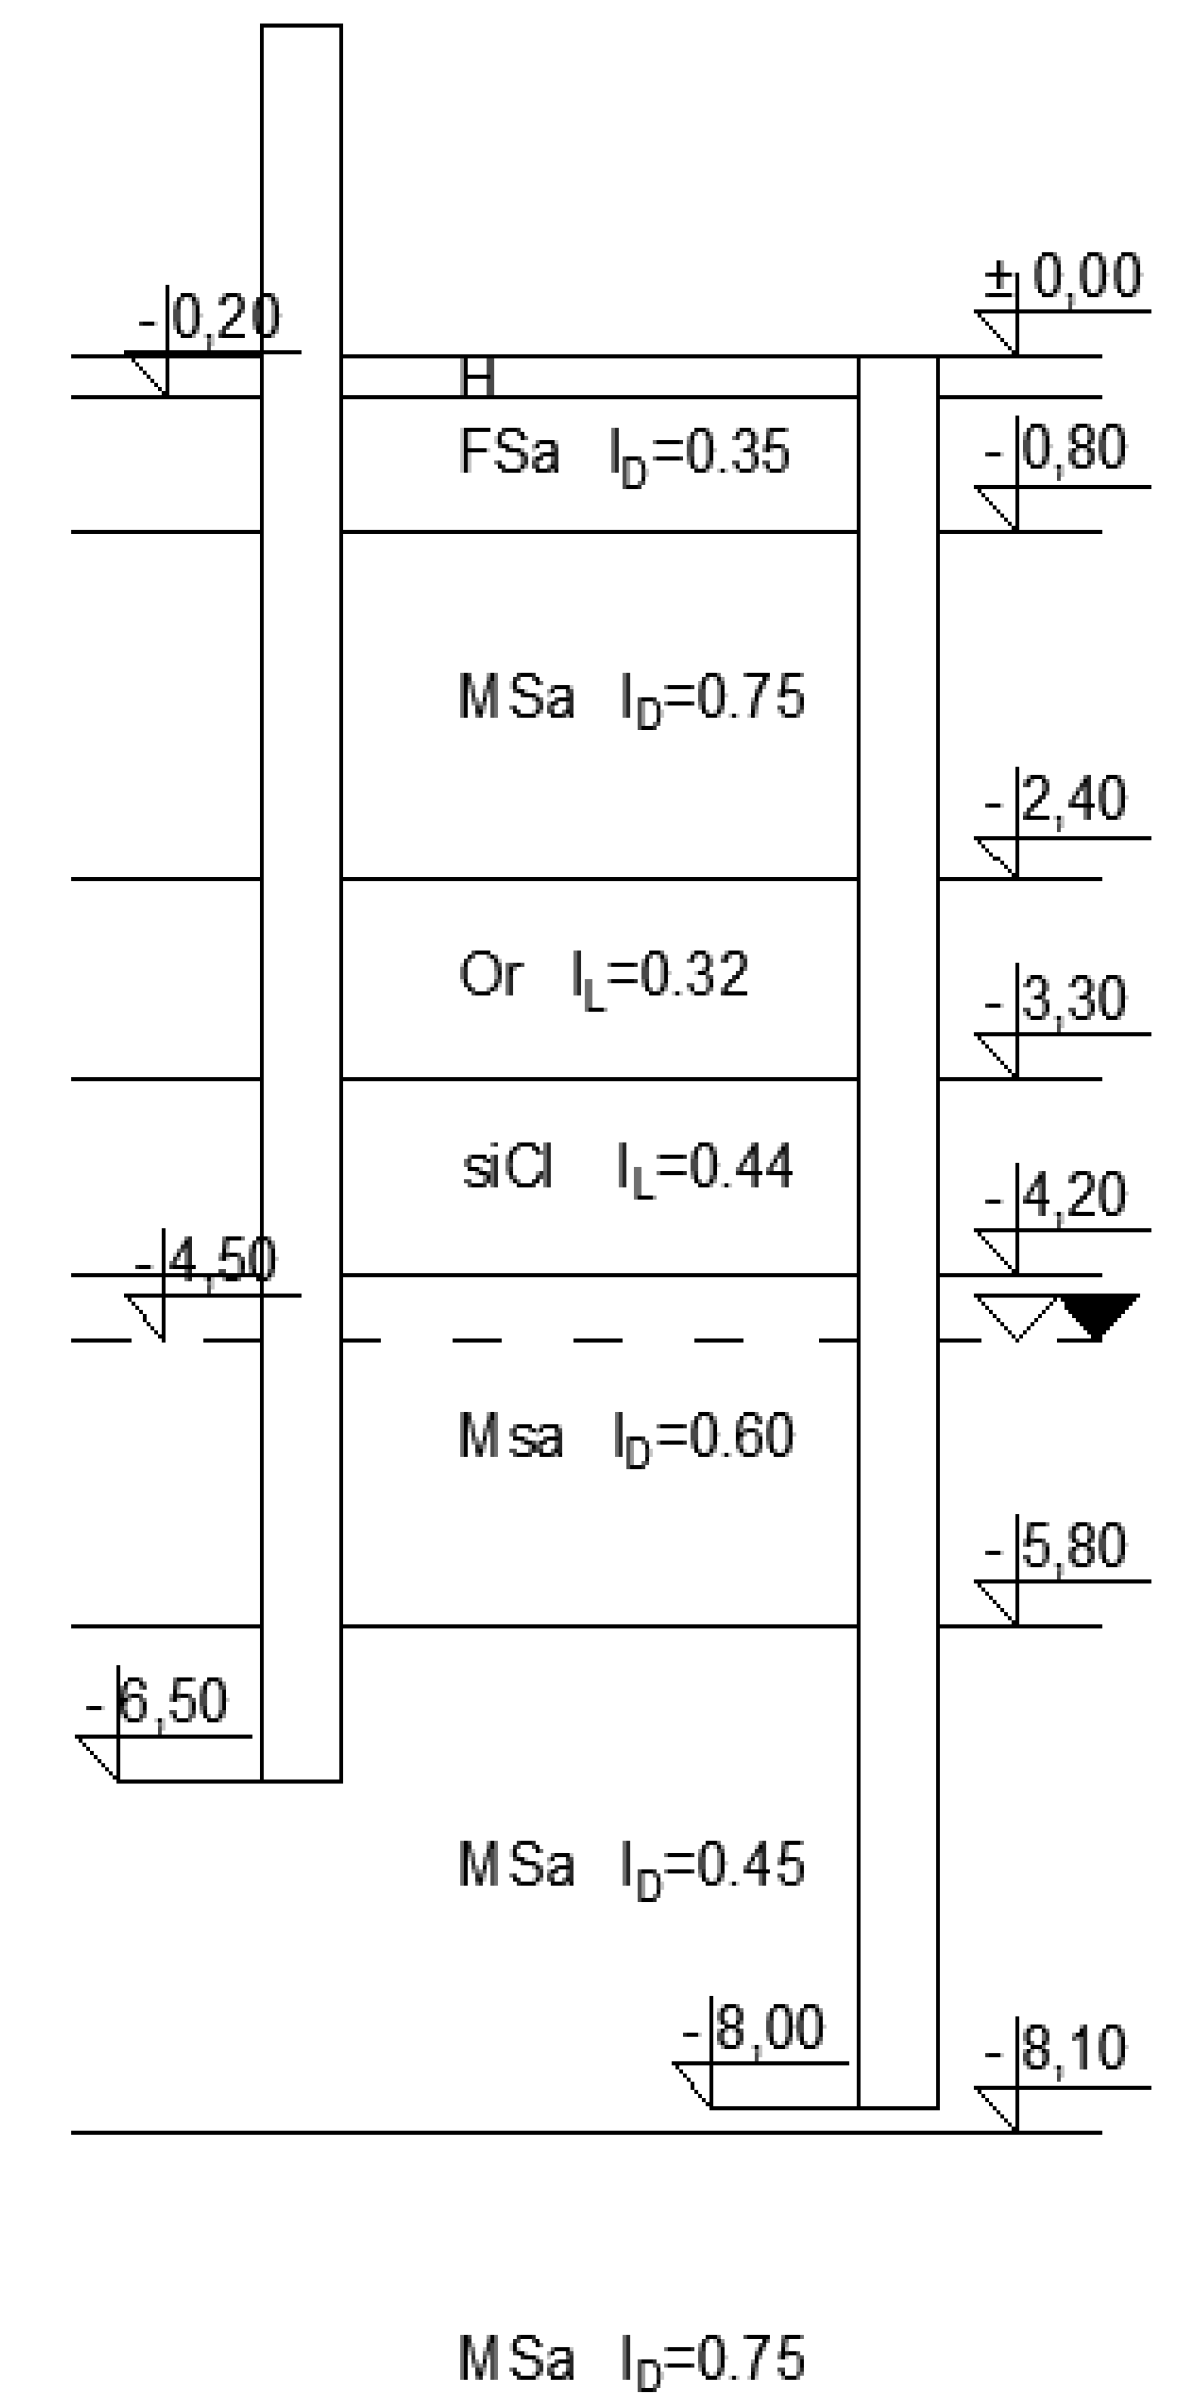
3. Field Investigations

The field tests were performed in Poland in Bojszowy Nowe. The CPTU tests and laboratory test were conducted at the field test site to determine the structure and geotechnical parameters of the subsoil. The structure of the soil was well documented in study [28], when both the geotechnical aspects and the technological aspects of the execution of jet grouting piles were investigated, which served in part as anchor piles in the construction of the current test site. The soil profile along with the location of the piles during the survey is presented in Figure 2. The soil conditions mainly contain sand layers with different coarseness (fine sand (FSa) and medium (MSa)) with single organic (Or) and silty clay (siCl) layers. Soil parameters determined from soil tests [16] are presented in Table 1. In the first stage of pile driving, the depth of embedment reached 6.5 m in medium dense Medium Sand with density index (relative density) equal to 0.45. After preliminary tests, pile was vibratory driven to the depth of 8.0 m, reaching the top of the dense soil layer (Medium Sand with density index (relative density) equal to 0.75). The precise description of the soil profile in the pile location formed the basis for precise numerical modelling where most of the data (geometrical, geotechnical) were taken from a direct field survey [28].
The main component of the test stand was two steel pipes with different diameters. The first pile was Φ400 with a length of 8.0 m and a wall thickness of 10 mm, and the second was Φ320 with a length of 8.3 m and a wall thickness of 10 mm. Both pipes were placed loosely on a steel shoe (toe), an element often used in certain types of displacement piles as a pile base.

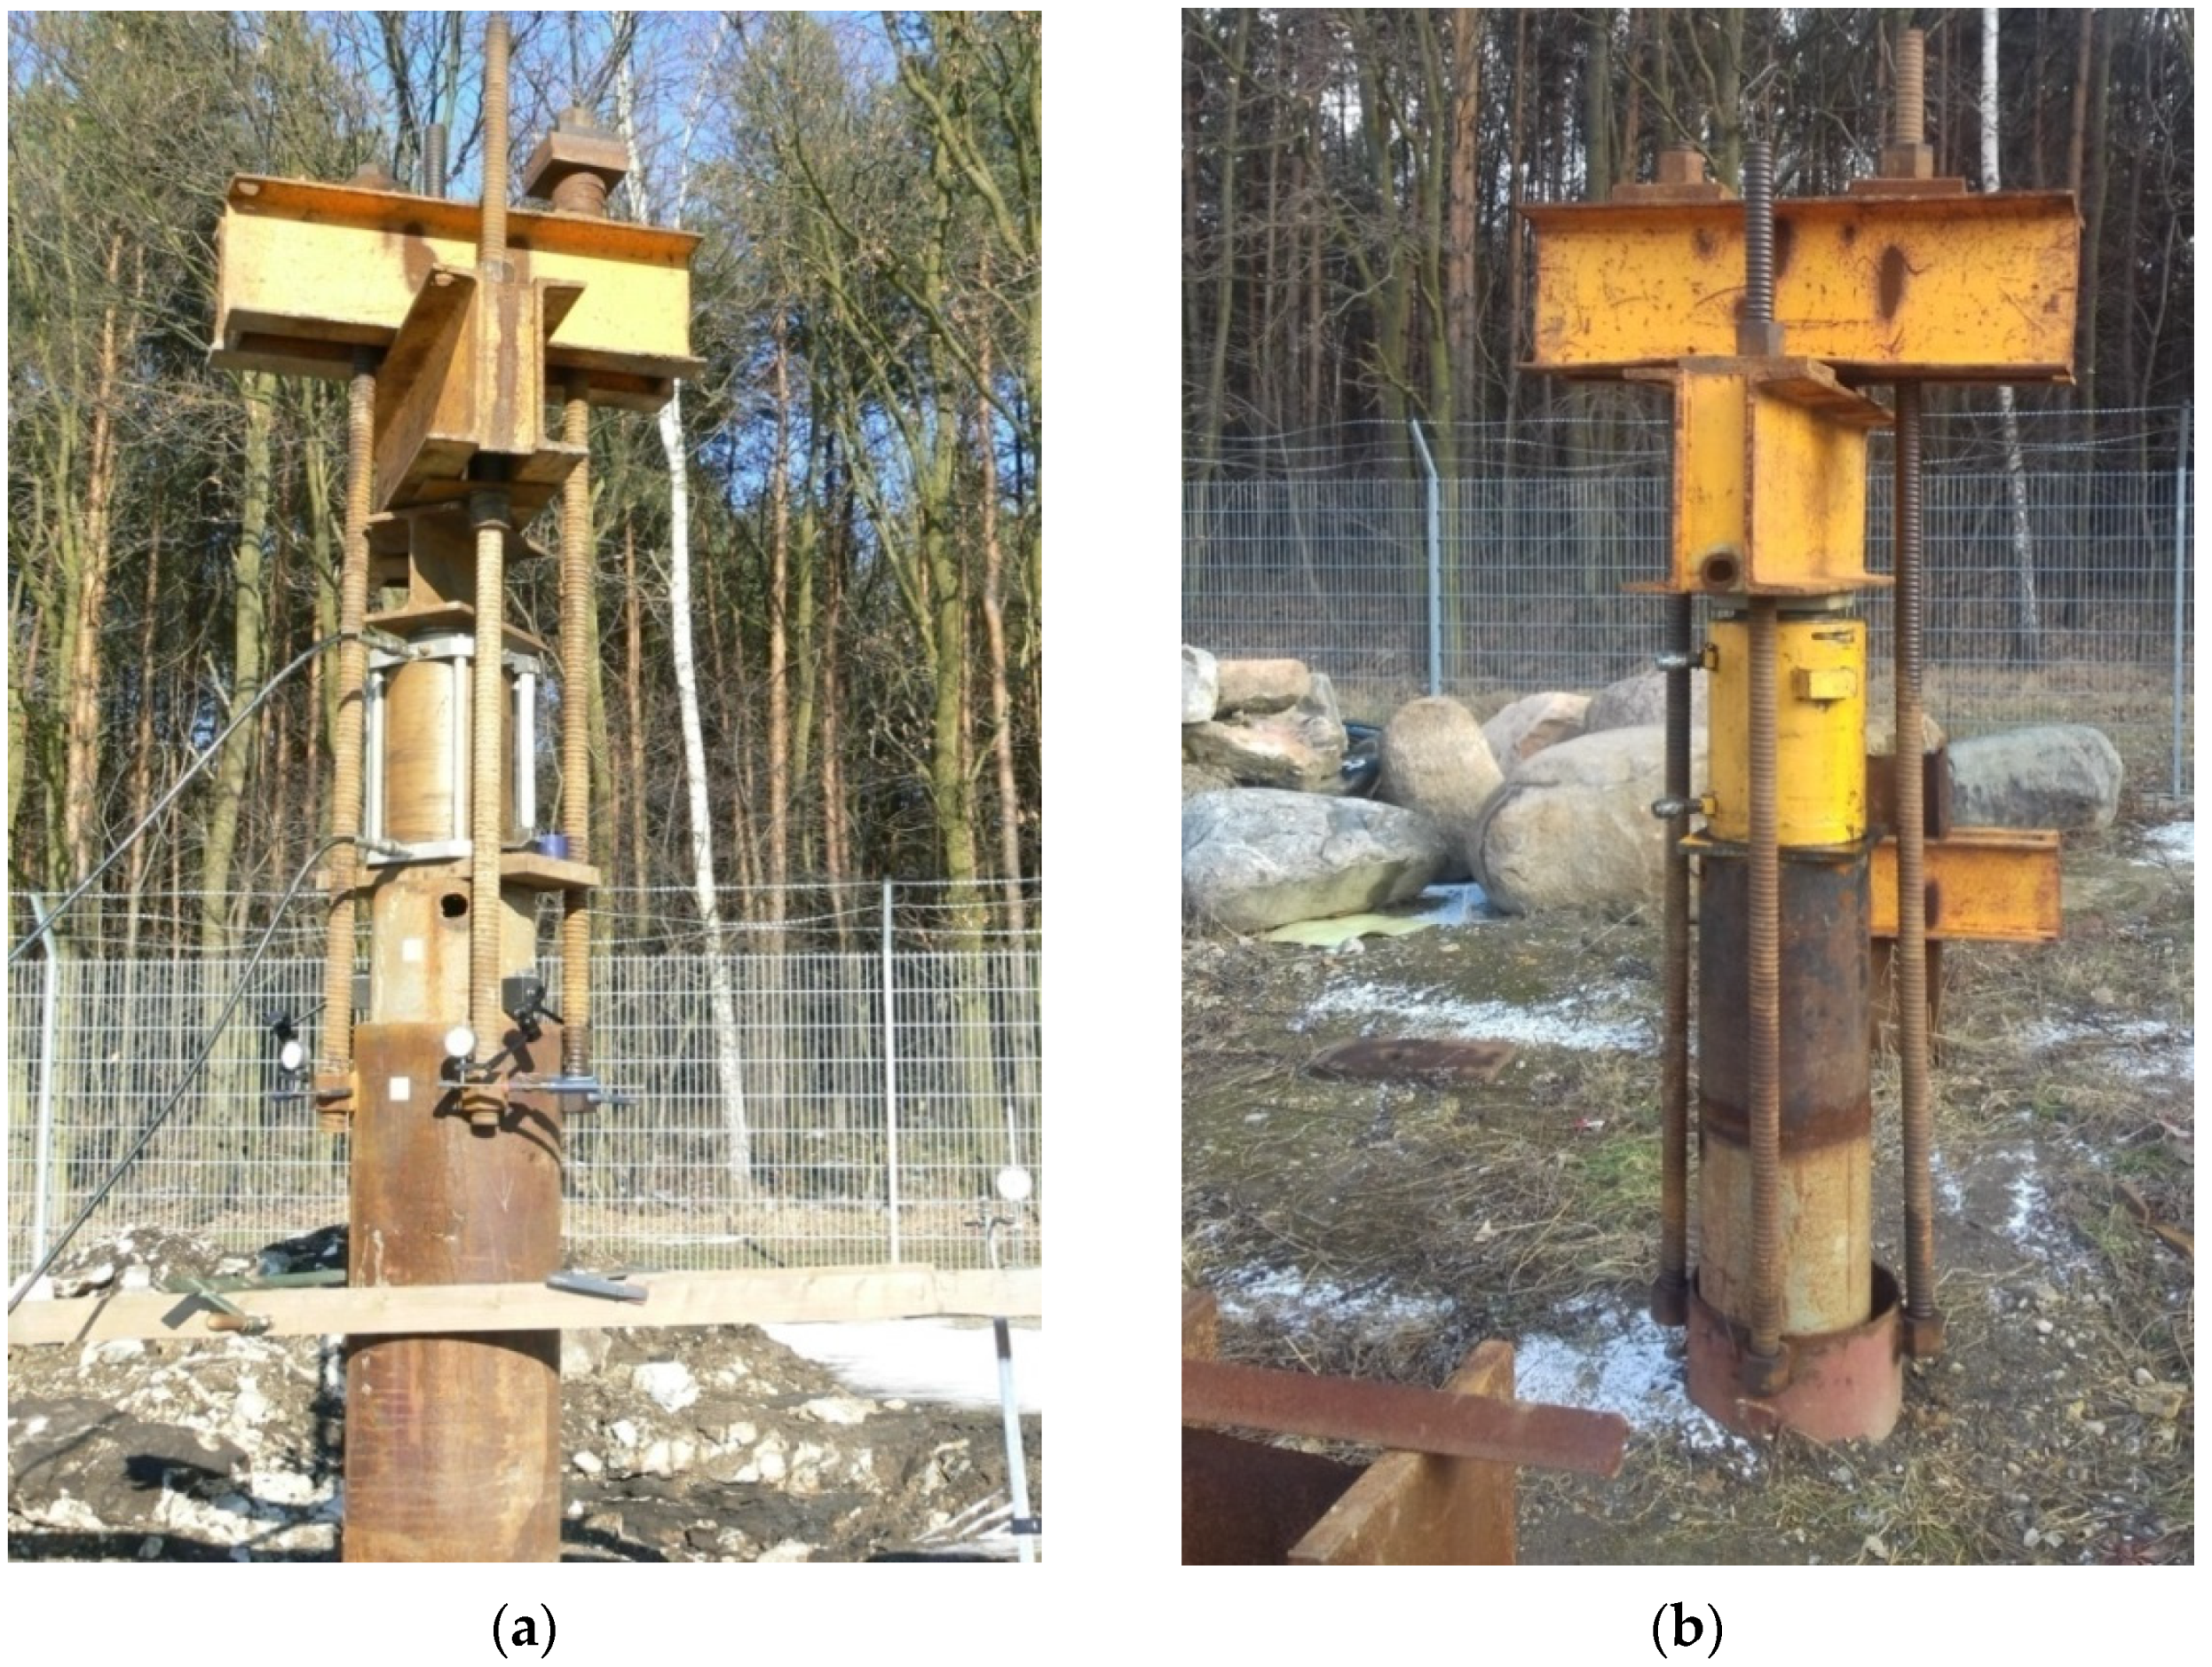
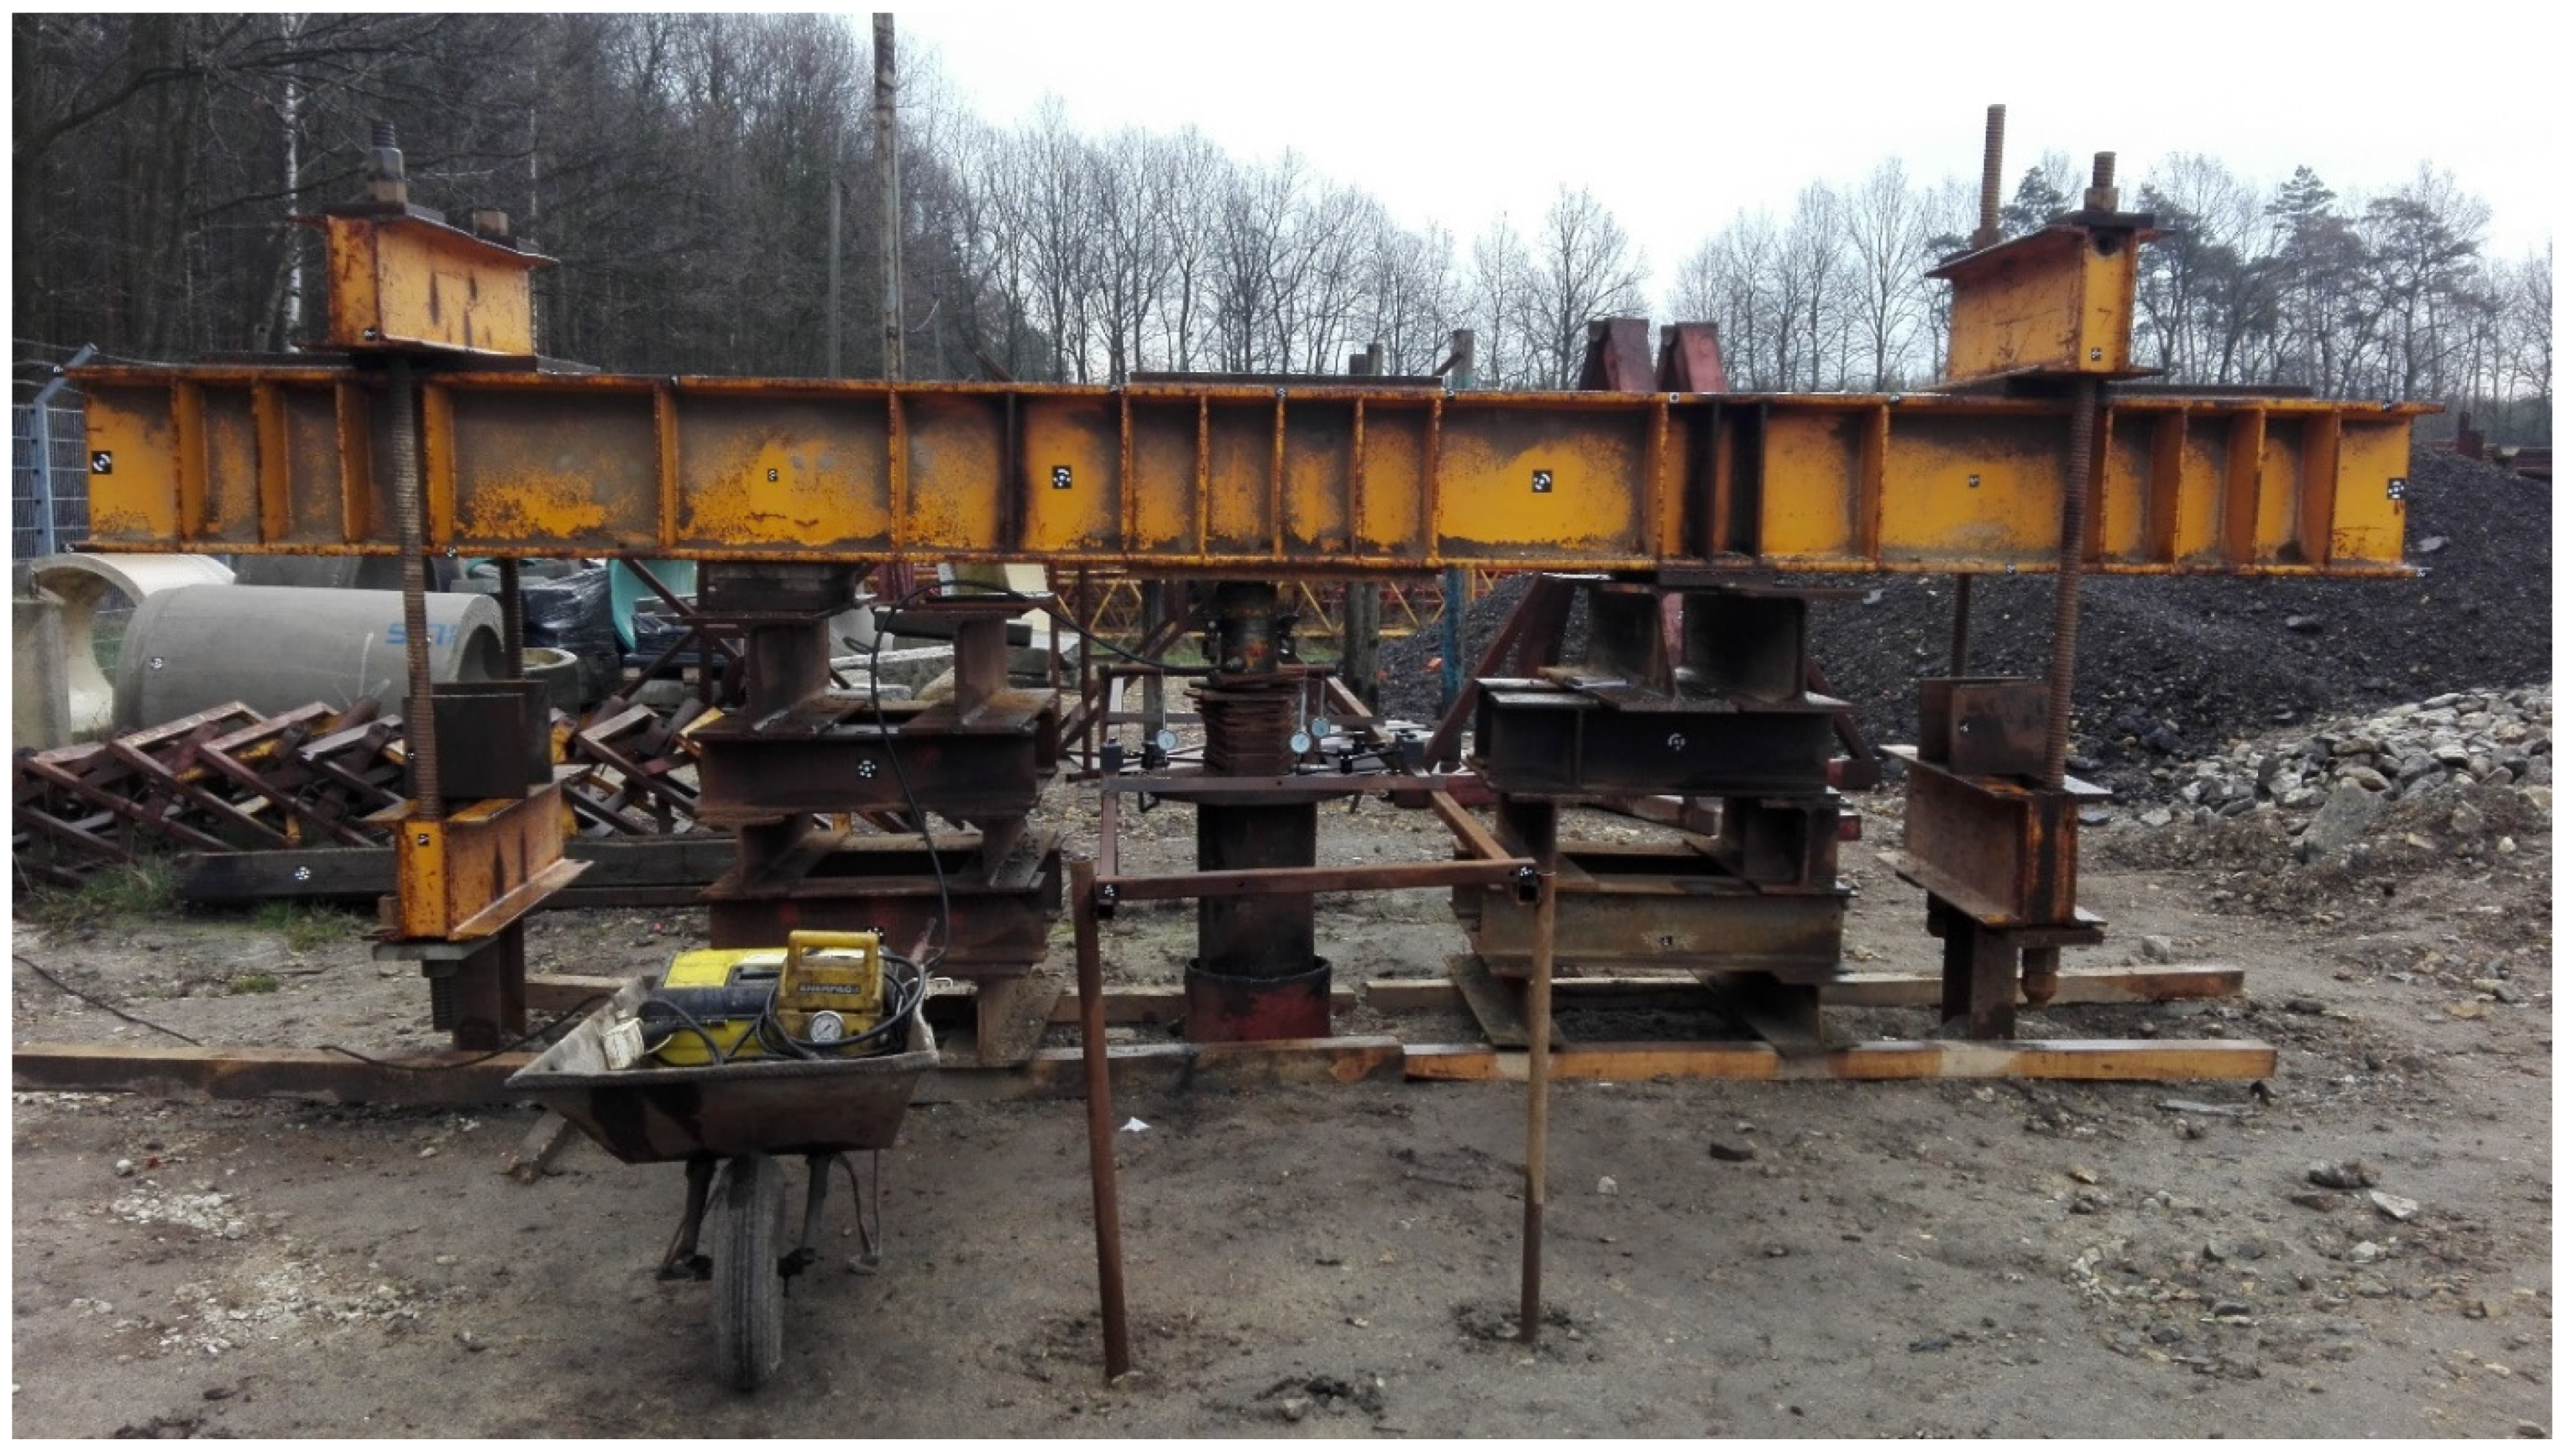
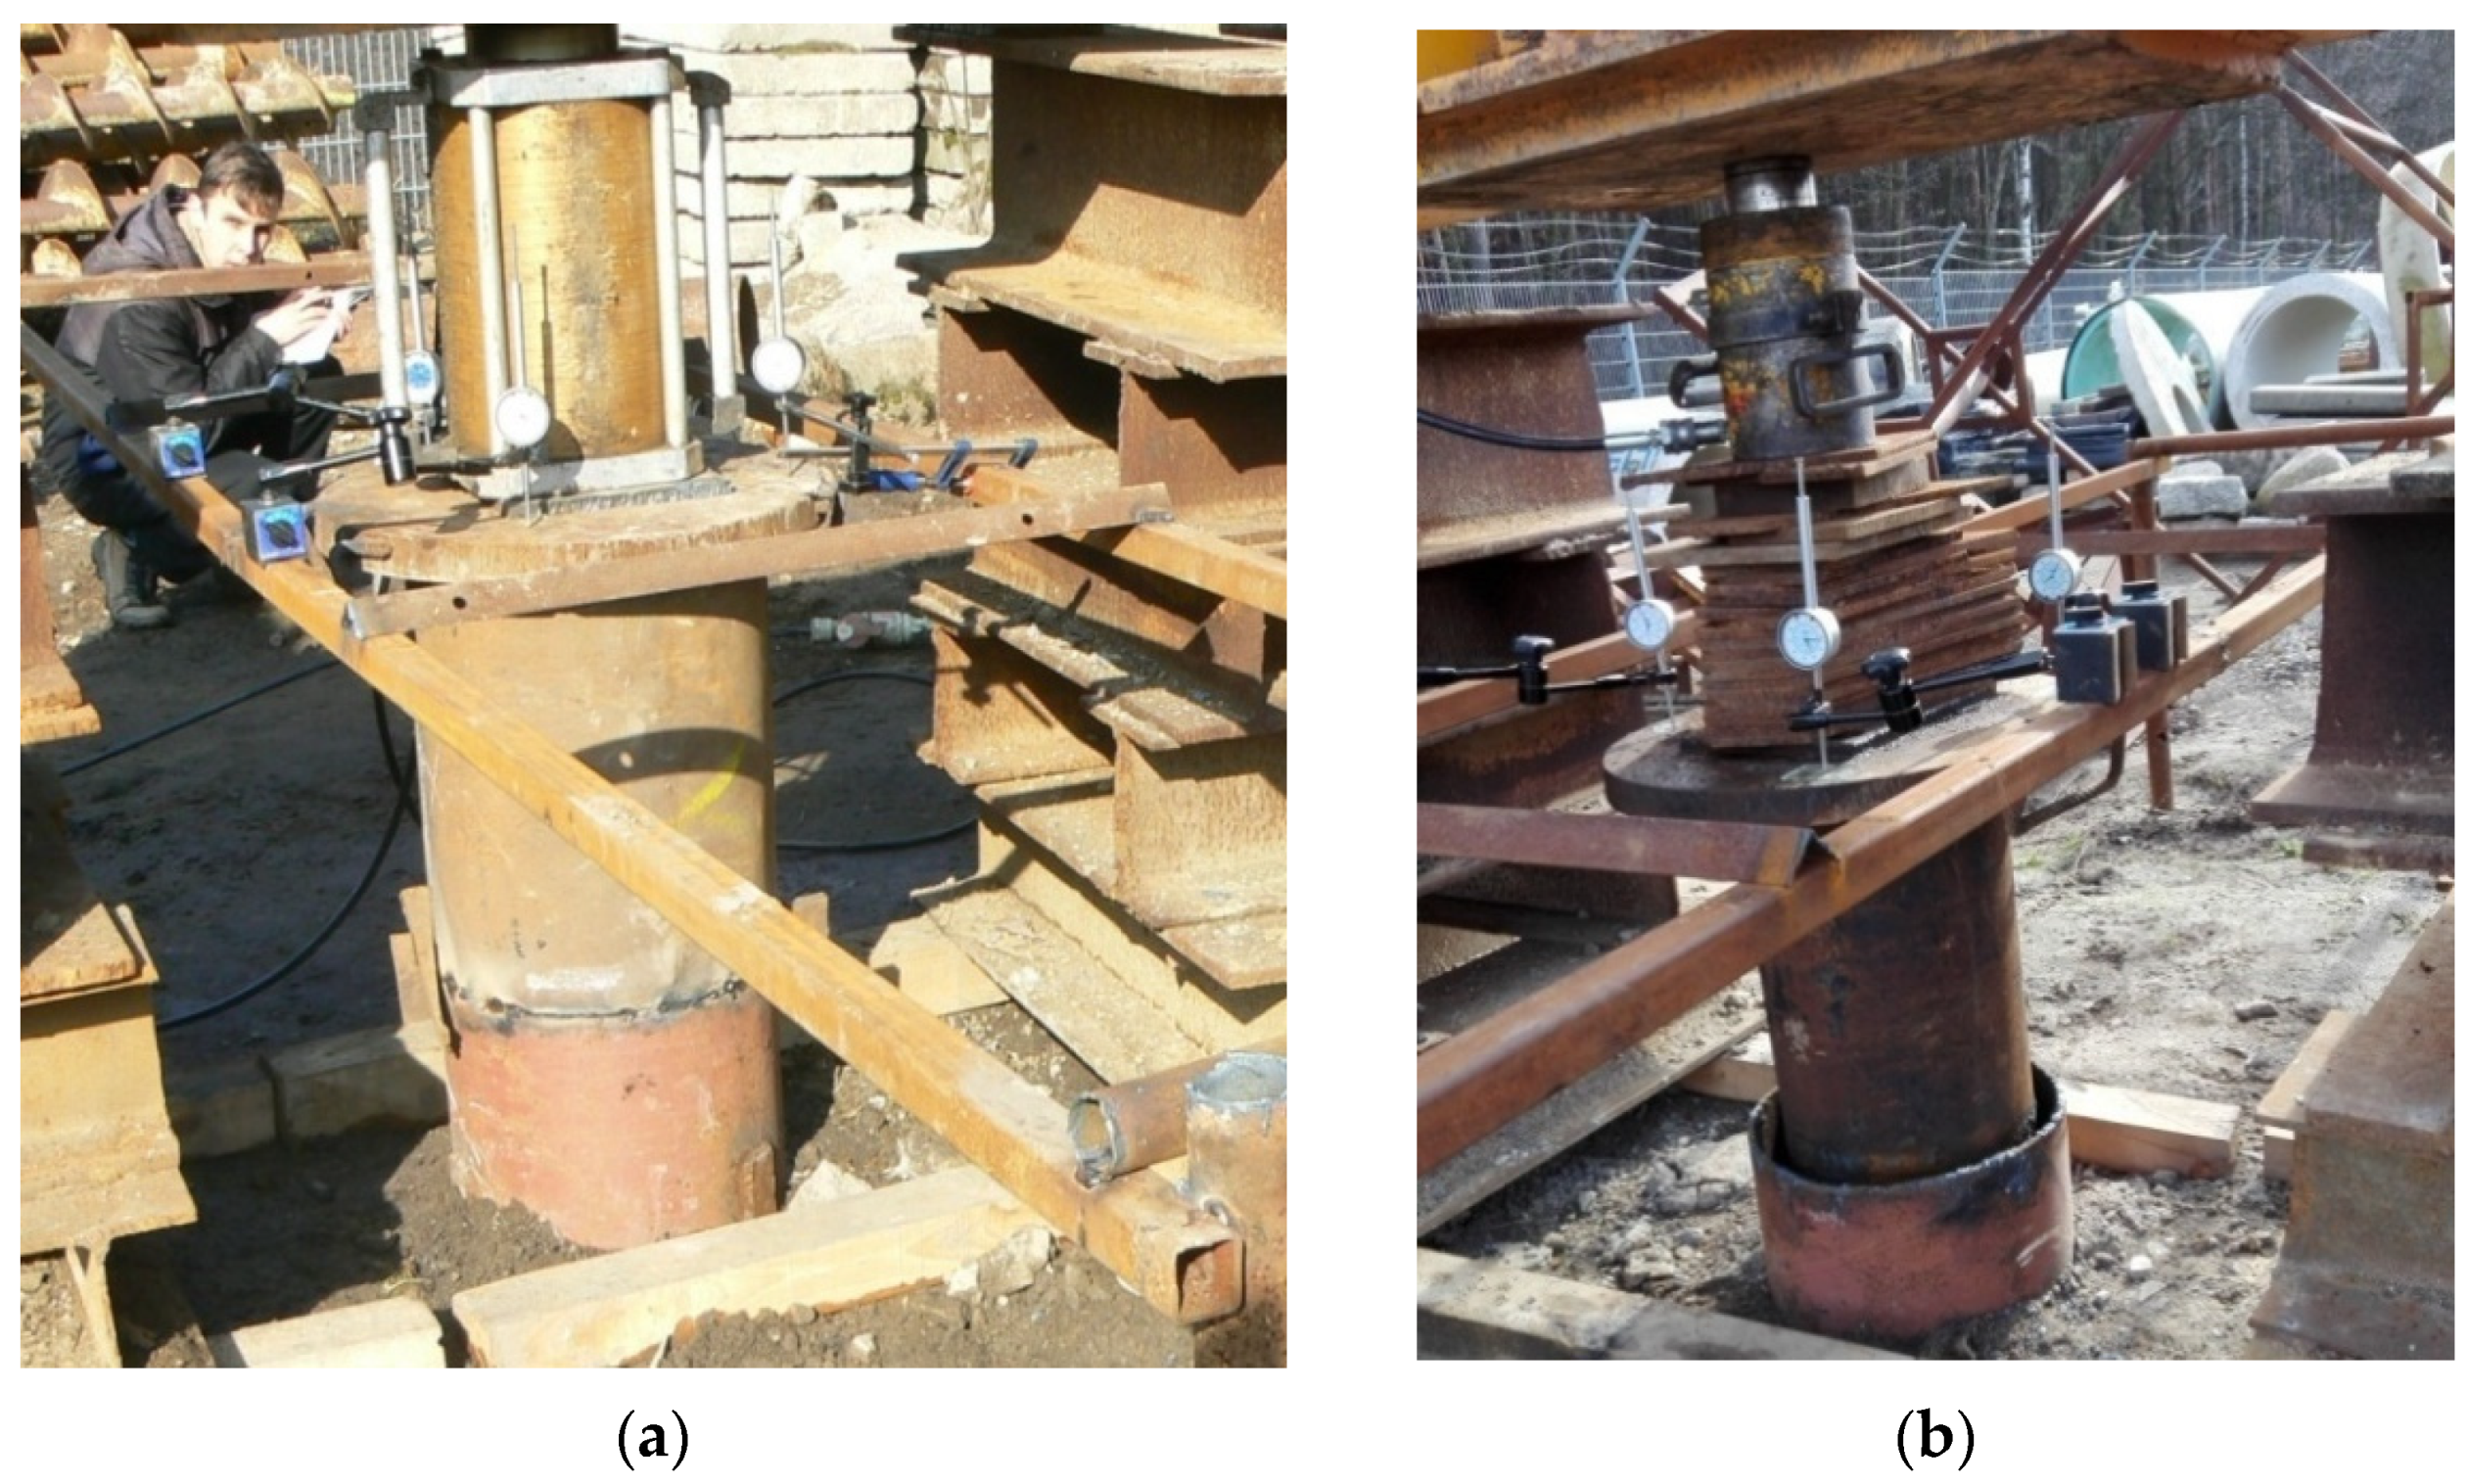
3.1. Testing Procedure

During the installation of the pile, the steel pipe was loosely placed on the shoe and they were both vibrated into the soil up to the base level of 6.5 m. The inner pipe was then placed inside the already installed outer pipe. The field investigations were divided into several stages. Firstly, several bi-directional tests were carried out on pipes installed to 6.5 m (Figure 3a). Then, the outer pipe was driven to the depth of 8.0 m. At this depth, the traditional Static Load Tests using anchor piles (Figure 4) were performed with a load applied to the outer pipe (with measurement of the total load capacity of the pile—Figure 5a), and then to the inner pipe (with measurement of the pile base load capacity only—Figure 5b). For these tests, it was necessary to construct a retaining structure anchored to two jet-grouting piles of diameter Φ800 and length of 10 m, located on both sides of the pile under test at a distance of 1.9 m, as shown in Figure 4. For the final stage, reaction structure was disassembled, and another bi-directional test was performed at a base depth level of 8.0 m (Figure 3b).
During each test, the load was applied using the hydraulic jack and the displacements were measured by means of displacement sensors and surveying methods. The jack was connected to an electric pump equipped with a manometer which measured the oil pressure in the jack, from which the force applied to the pile was calculated with an accuracy of 0.1 kN. Additionally, a system of three displacement sensors was installed, allowing the displacement of the pipes to be measured with an accuracy of 0.01 mm. The pile displacement was considered as stabilised at every load step when the measured average displacement did not exceed 0.05 mm within a time period of 10 min. A more detailed description of the performed tests was introduced in references [26,29].
Additionally, in some surveys the displacement measurements by modern geodetic techniques have been applied, which was further described in the studies [29,30]. Surveys with geodetic techniques allowed for a greater measurement accuracy; however, in this study, the geodetic measurements results were consistent with the results of field surveys, i.e., the load-displacement relationship obtained was similar in both measurement methods.

3.2. Results

The results of the field tests carried out to validate numerical models are presented in the form of Q–s curves presented in figures in Section 4.4. The results of the bi-directional tests are two Q–s curves, describing the uplift of the lateral and settlement of the base. In the case of the traditional static load test, the Q–s curves describing the behaviour of the entire pile under the load and describing the behaviour of the pile base were obtained.

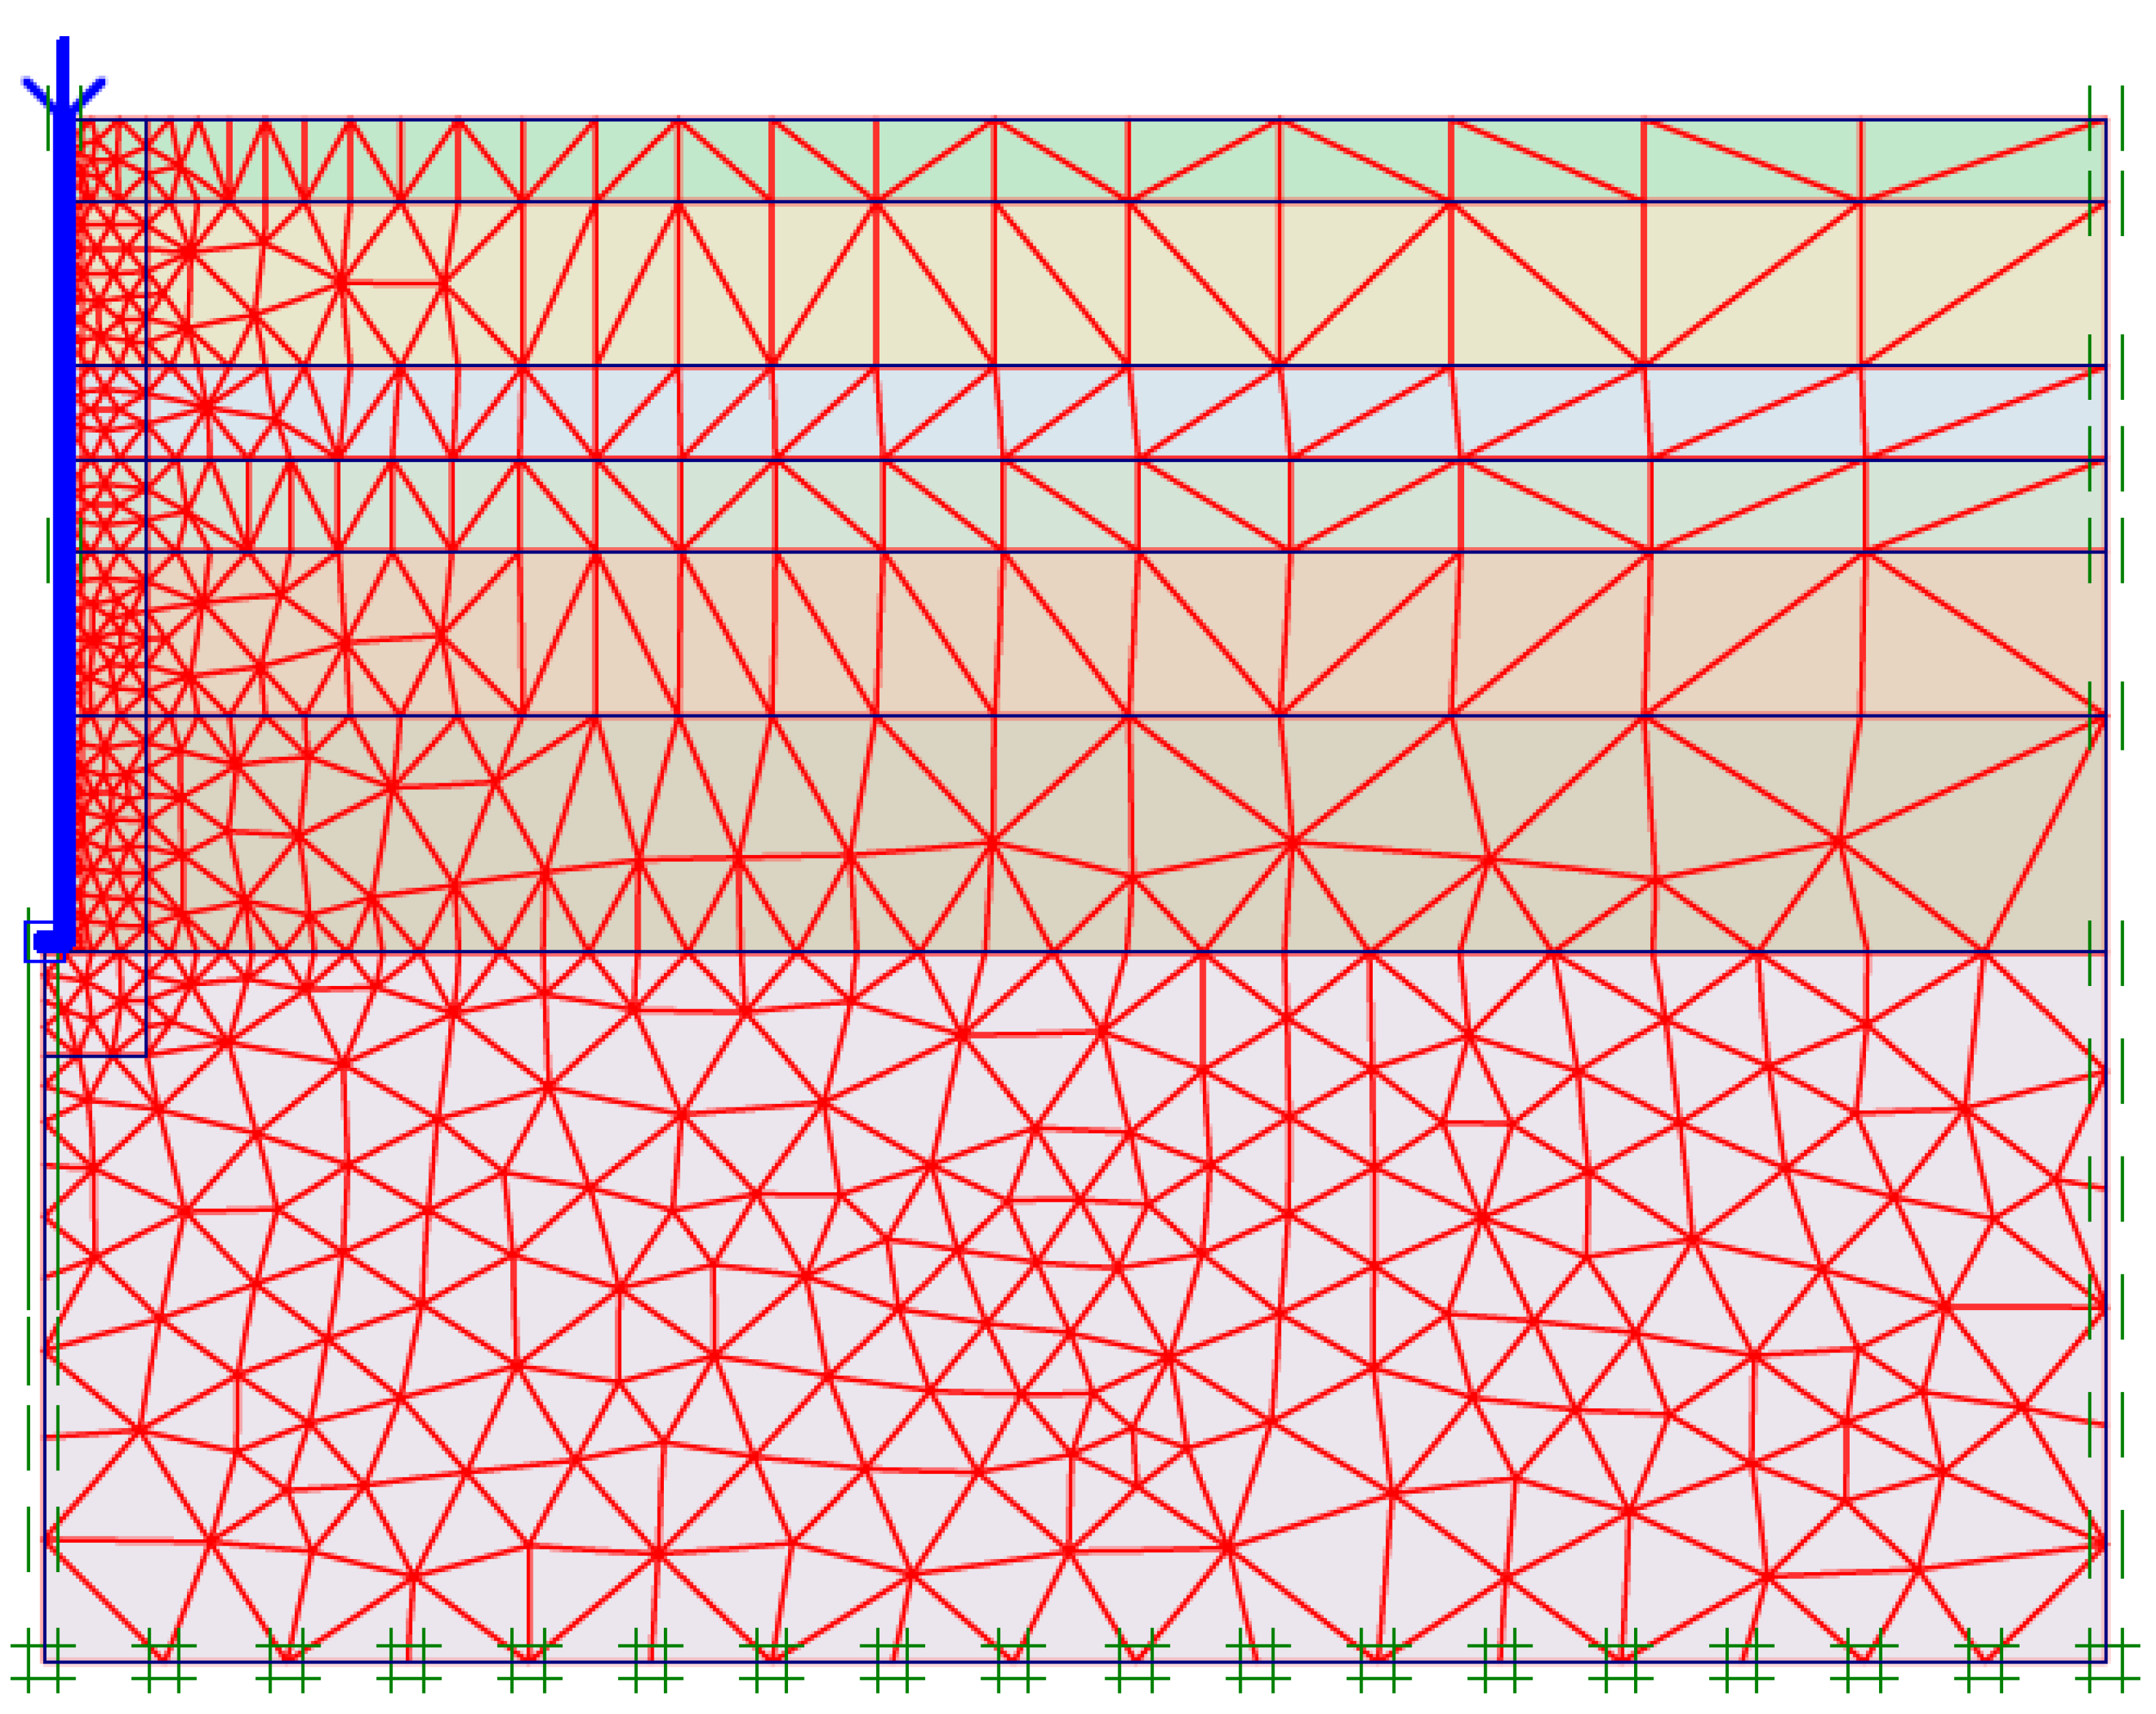
4. Numerical Simulations

The first simulations of pile behaviour were performed with Finite Element Method for small deformations [31], without including the installation effects. Software based on the FEM is widely available, frequently used for the calculation of various geotechnical issues, and relatively computationally undemanding. Numerical modelling without installation effects can only be reliable for drilled (bored) piles, as this pile installation method has the least influence on in situ soil conditions [5]. Simulations carried out by Wehnert and Vermeer [32] in PLAXIS for drilled piles in clay showed a significant influence of the interface layer on the results and proved that in comparison to Soft Soil and Coulomb-Mohr models, the Hardening Soil model allows for a better representation of the pile behaviour, due to the hyperbolic load–deformation relationship and the linear relationship between stress unloading and reloading.

4.1. Assumptions for Calculations

In this study, the calculations were performed by means of the Finite Element Method with PLAXIS v.7.2 software [33] under axial symmetry conditions, using 6-node elements. The steel pile elements were modelled as elastic beam elements, while the soil layers were modelled as volumetric elements with parameters of the Hardening Soil model [31]. Interface contact elements were introduced between the pile and the soil elements to model proper friction and adhesion at contact surfaces.
On the basis of on preliminary simulations, the calculation area was assumed to be a cylinder with a radius of 20.0 m and a height of 15.0 m, while the pile was modelled as a radius of 0.2 m and a length of 8.0 m (according to real world dimensions). The FEM mesh density in the model was further increased in a 1.0 m zone around the pile. The calculation area with the generated finite element mesh and boundary conditions is presented in Figure 6. For the 6.5 m pile depth, only simulations of bi-directional tests were performed, while for the 8.0 m pile depth, the bi-directional tests and the traditional static load test for the entire pile and its base were simulated.
The methods of load application in numerical models, depending on the type of modelled static load test, are presented in Figure 7. The bold line indicates the beam elements representing the outer pipe and steel shoe. Traditional static load tests were modelled by applying a concentrated force to the pile head, and the load was transferred to the soil through beam elements: vertical (outer pipe) and horizontal (shoe) (Figure 7).
The static load test on the pile base, carried out through the inner pipe in the field test, was modelled by applying a concentrated force to a steel shoe (Figure 7b). A small gap between the vertical and horizontal beam elements were modelled, allowing displacement only of the horizontal beam element. Bi-directional tests were performed on a similar model to the previous model, but apart from the force applied to the base, a vertical concentrated force applied to the vertical beam was applied, which allowed us to simulate the uplift of the outer pipe during bi-directional tests (Figure 7c).
The initial calculations were carried out on models including only the original stress state in the soil without including any installation effects. The results of preliminary calculations (presented in further Section 4.4.) showed that the simulations based only on the in situ soil parameters obtained from the CPTU tests are insufficient. Therefore, in this work, an additional modelling step including the installation process was introduced, which makes it possible to use relatively simple steps to achieve a satisfactory fit of the Q–s simulation curve to the field results. A numerical model was developed based on simulations carried out by Krasinski [22] and by Broere and van Tol [21]. In his work, Krasinski [22] investigated the study of screw piles and proposed to model the installation process by soil displacement in the horizontal direction. The application of this installation effect allowed for increasing the stress conditions in the vicinity of the pile and, therefore, increasing the pile bearing capacity obtained in the simulation. The results presented in [22] showed that this modelling method enables us to better represent the changes occurring in the soil, but still requires additional changes in the soil parameters to better match the curve obtained from the numerical simulation with the experimental results. In the present study, some changes, mainly concerning the installation phase, were decided in relation to the above proposed model.

4.2. Model Parameters

Based on the soil parameters determined from soil investigations conducted in the vicinity of the performed field tests [16], for all soil layers, the parameters for the drained Hardening Soil model were derived with correlations from [33,34,35]. The Hardening Soil parameter values determined and used in the calculations are presented in Table 2.
The pipe piles and the steel shoe were modelled as elastic beam elements with E = 210 GPa and ν = 0.3. The wall thickness was assumed to be 0.05 m for the pipe and 0.1 m for the shoe. The beam element parameters determined are summarised in Table 3.

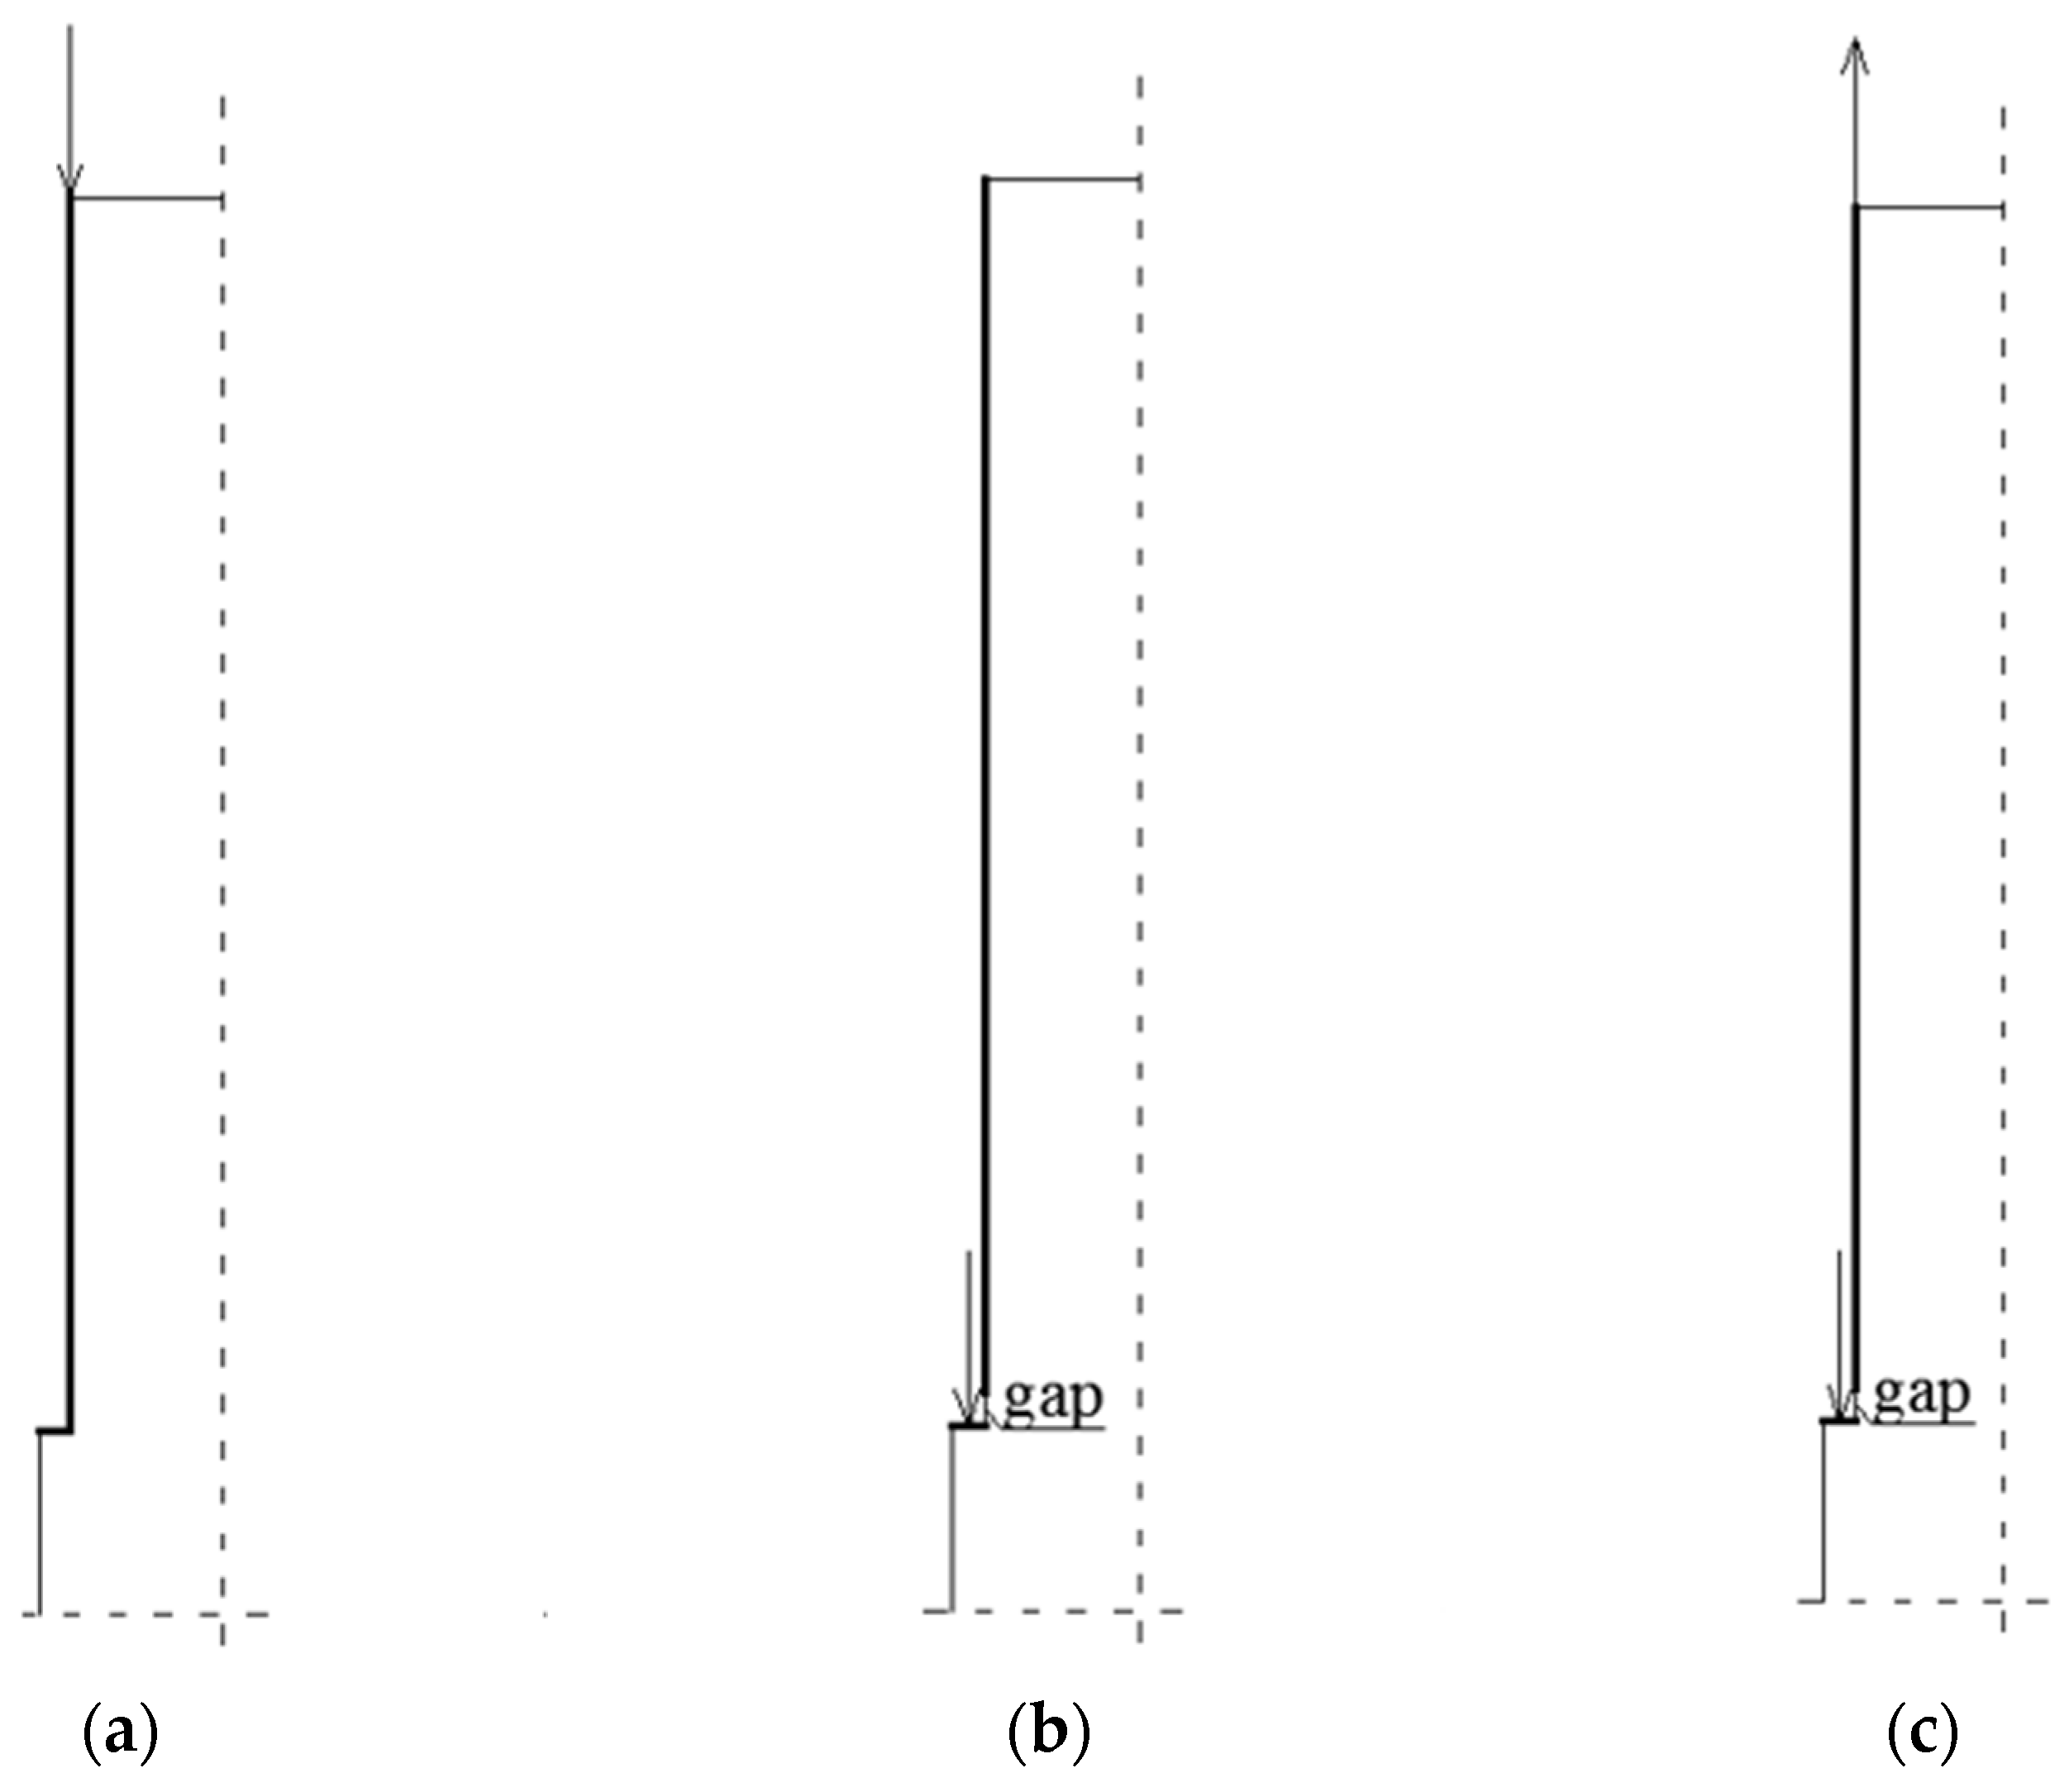
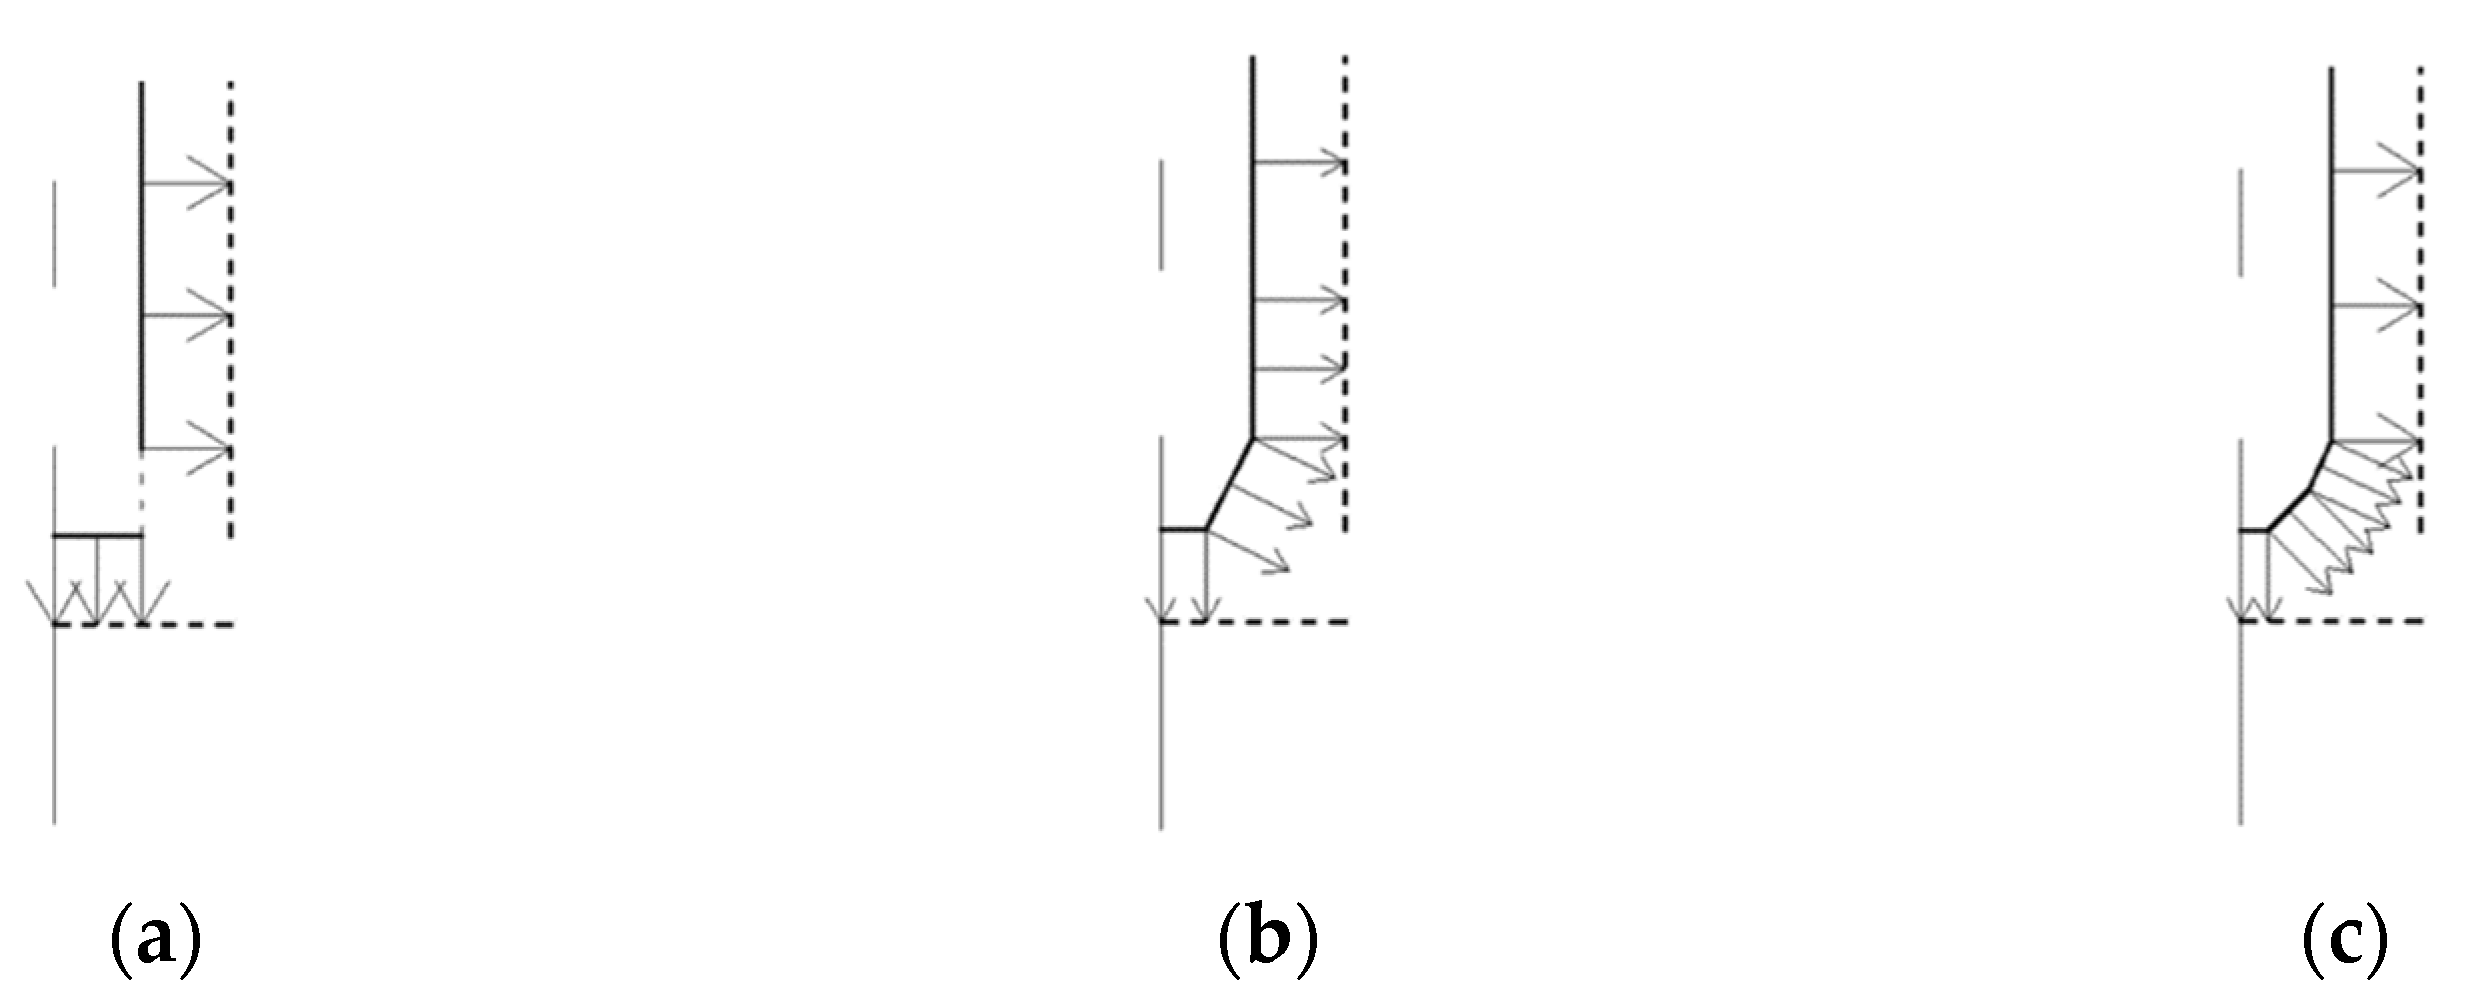
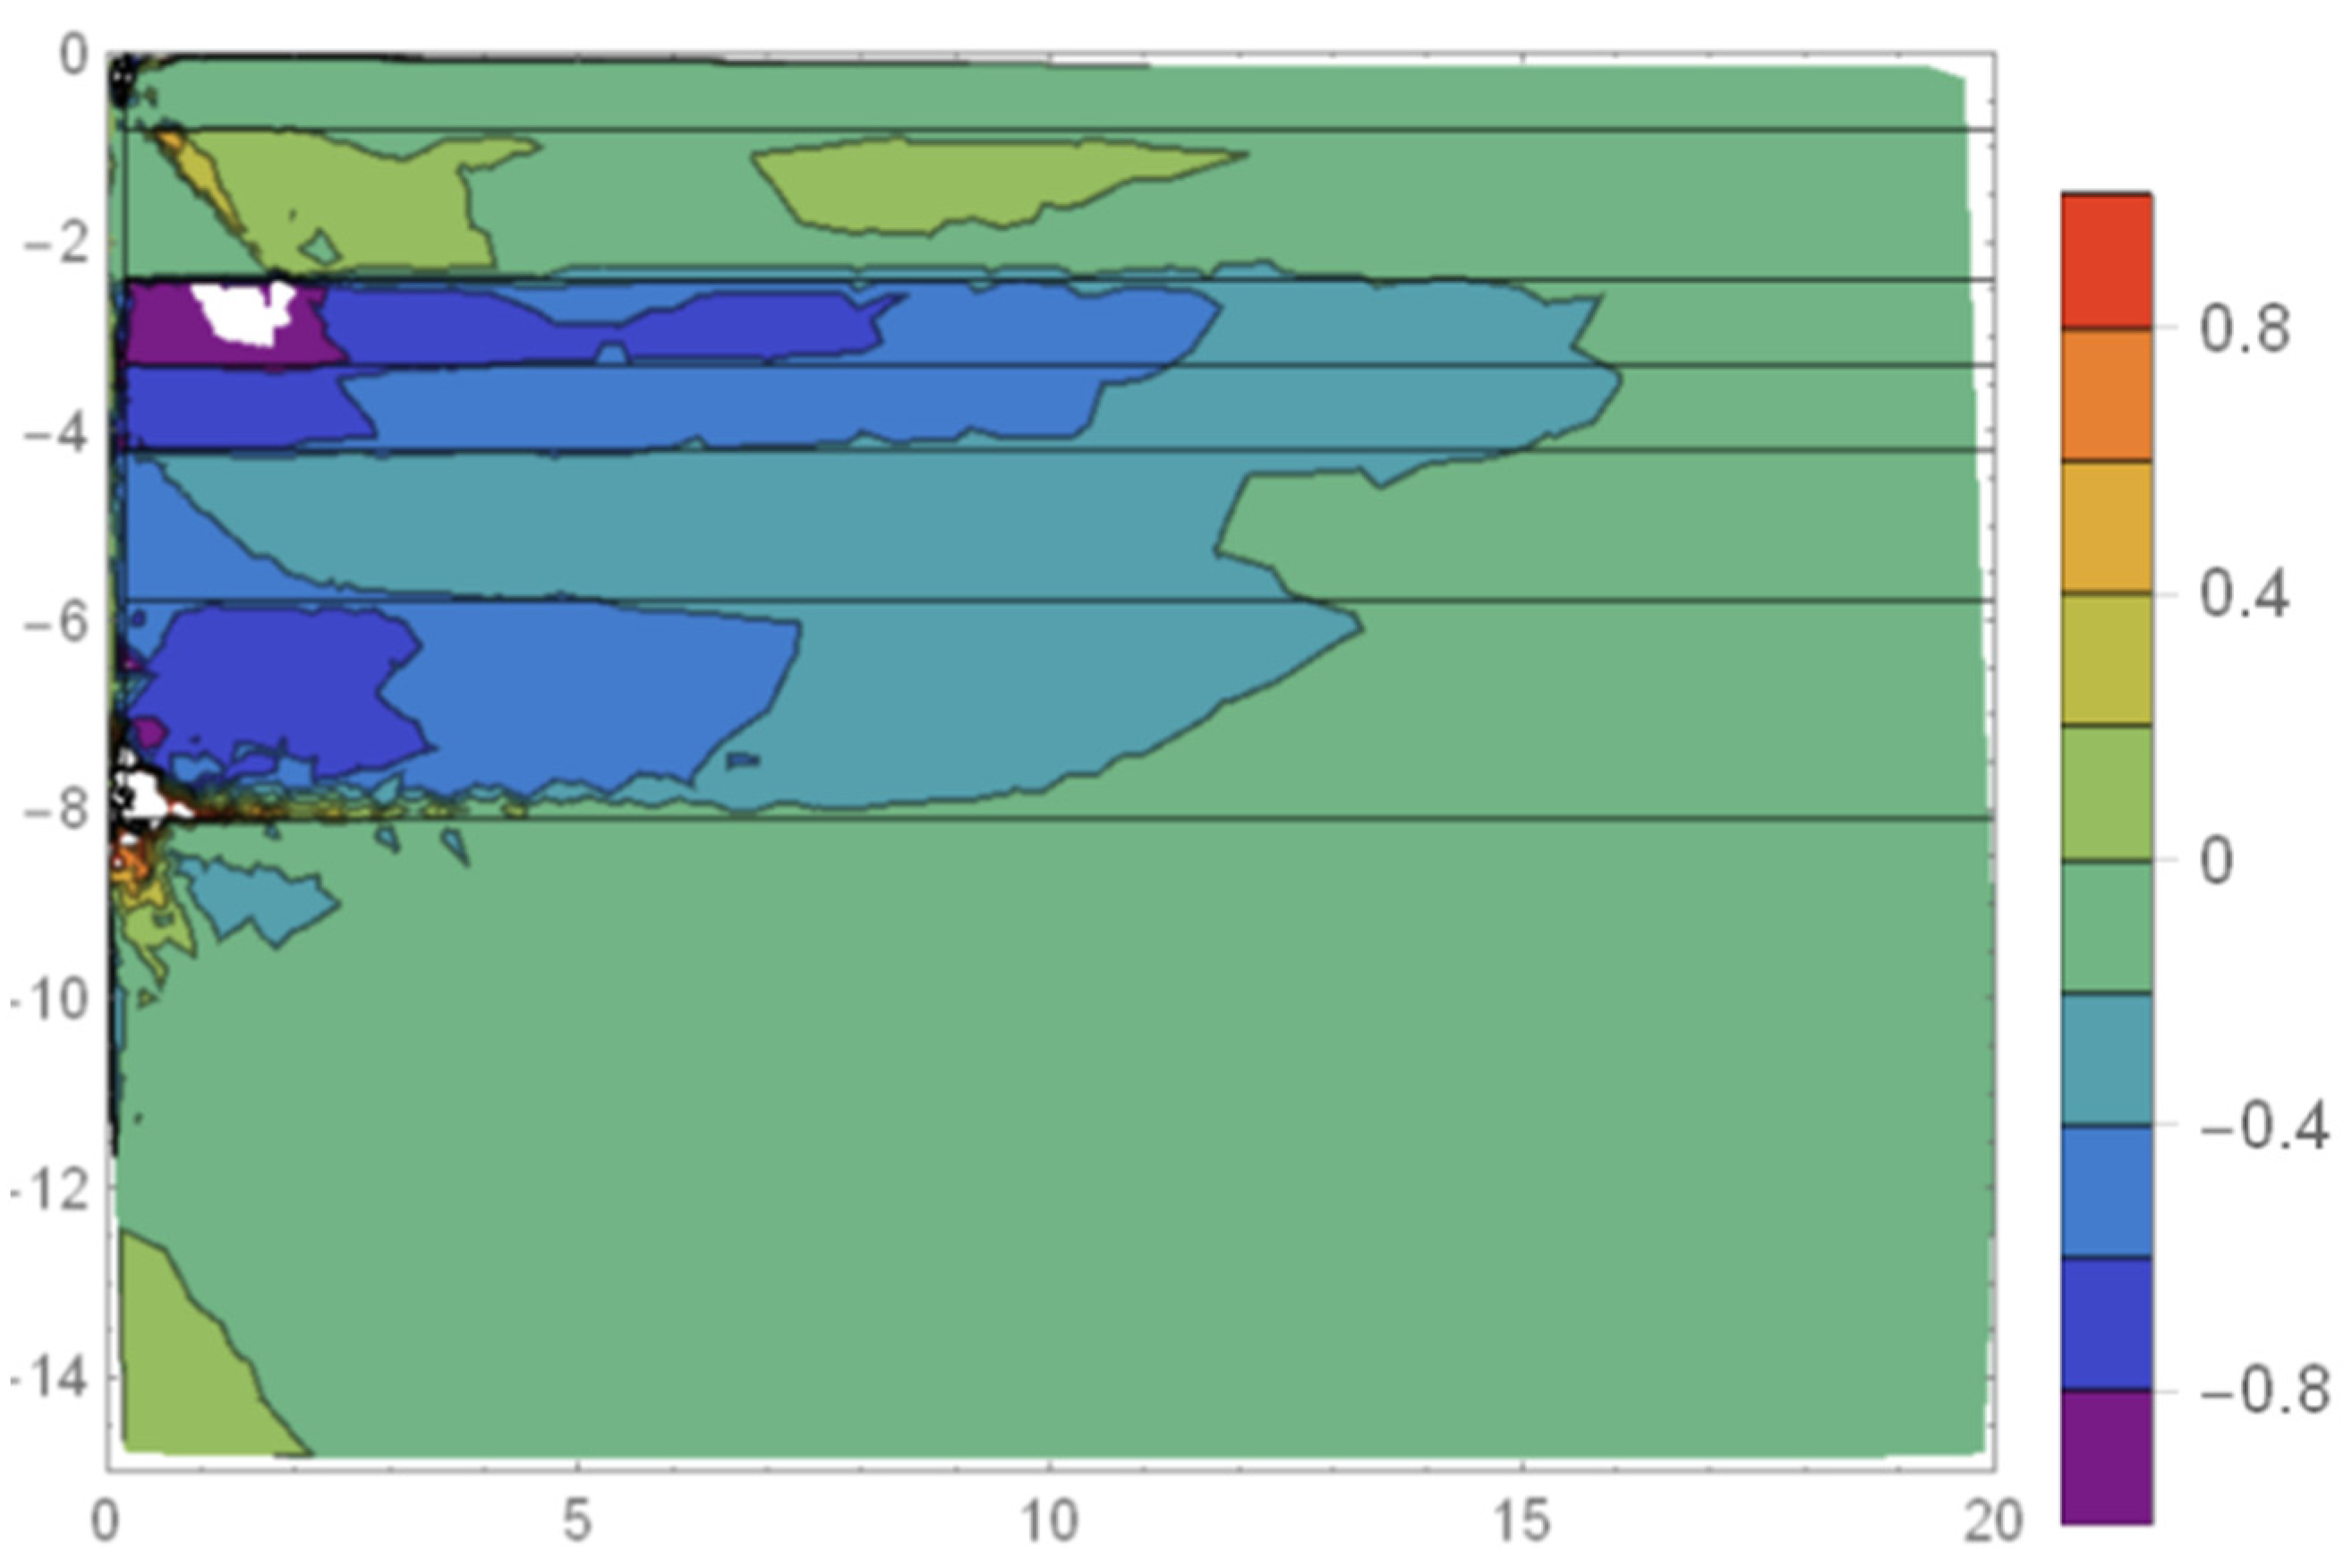
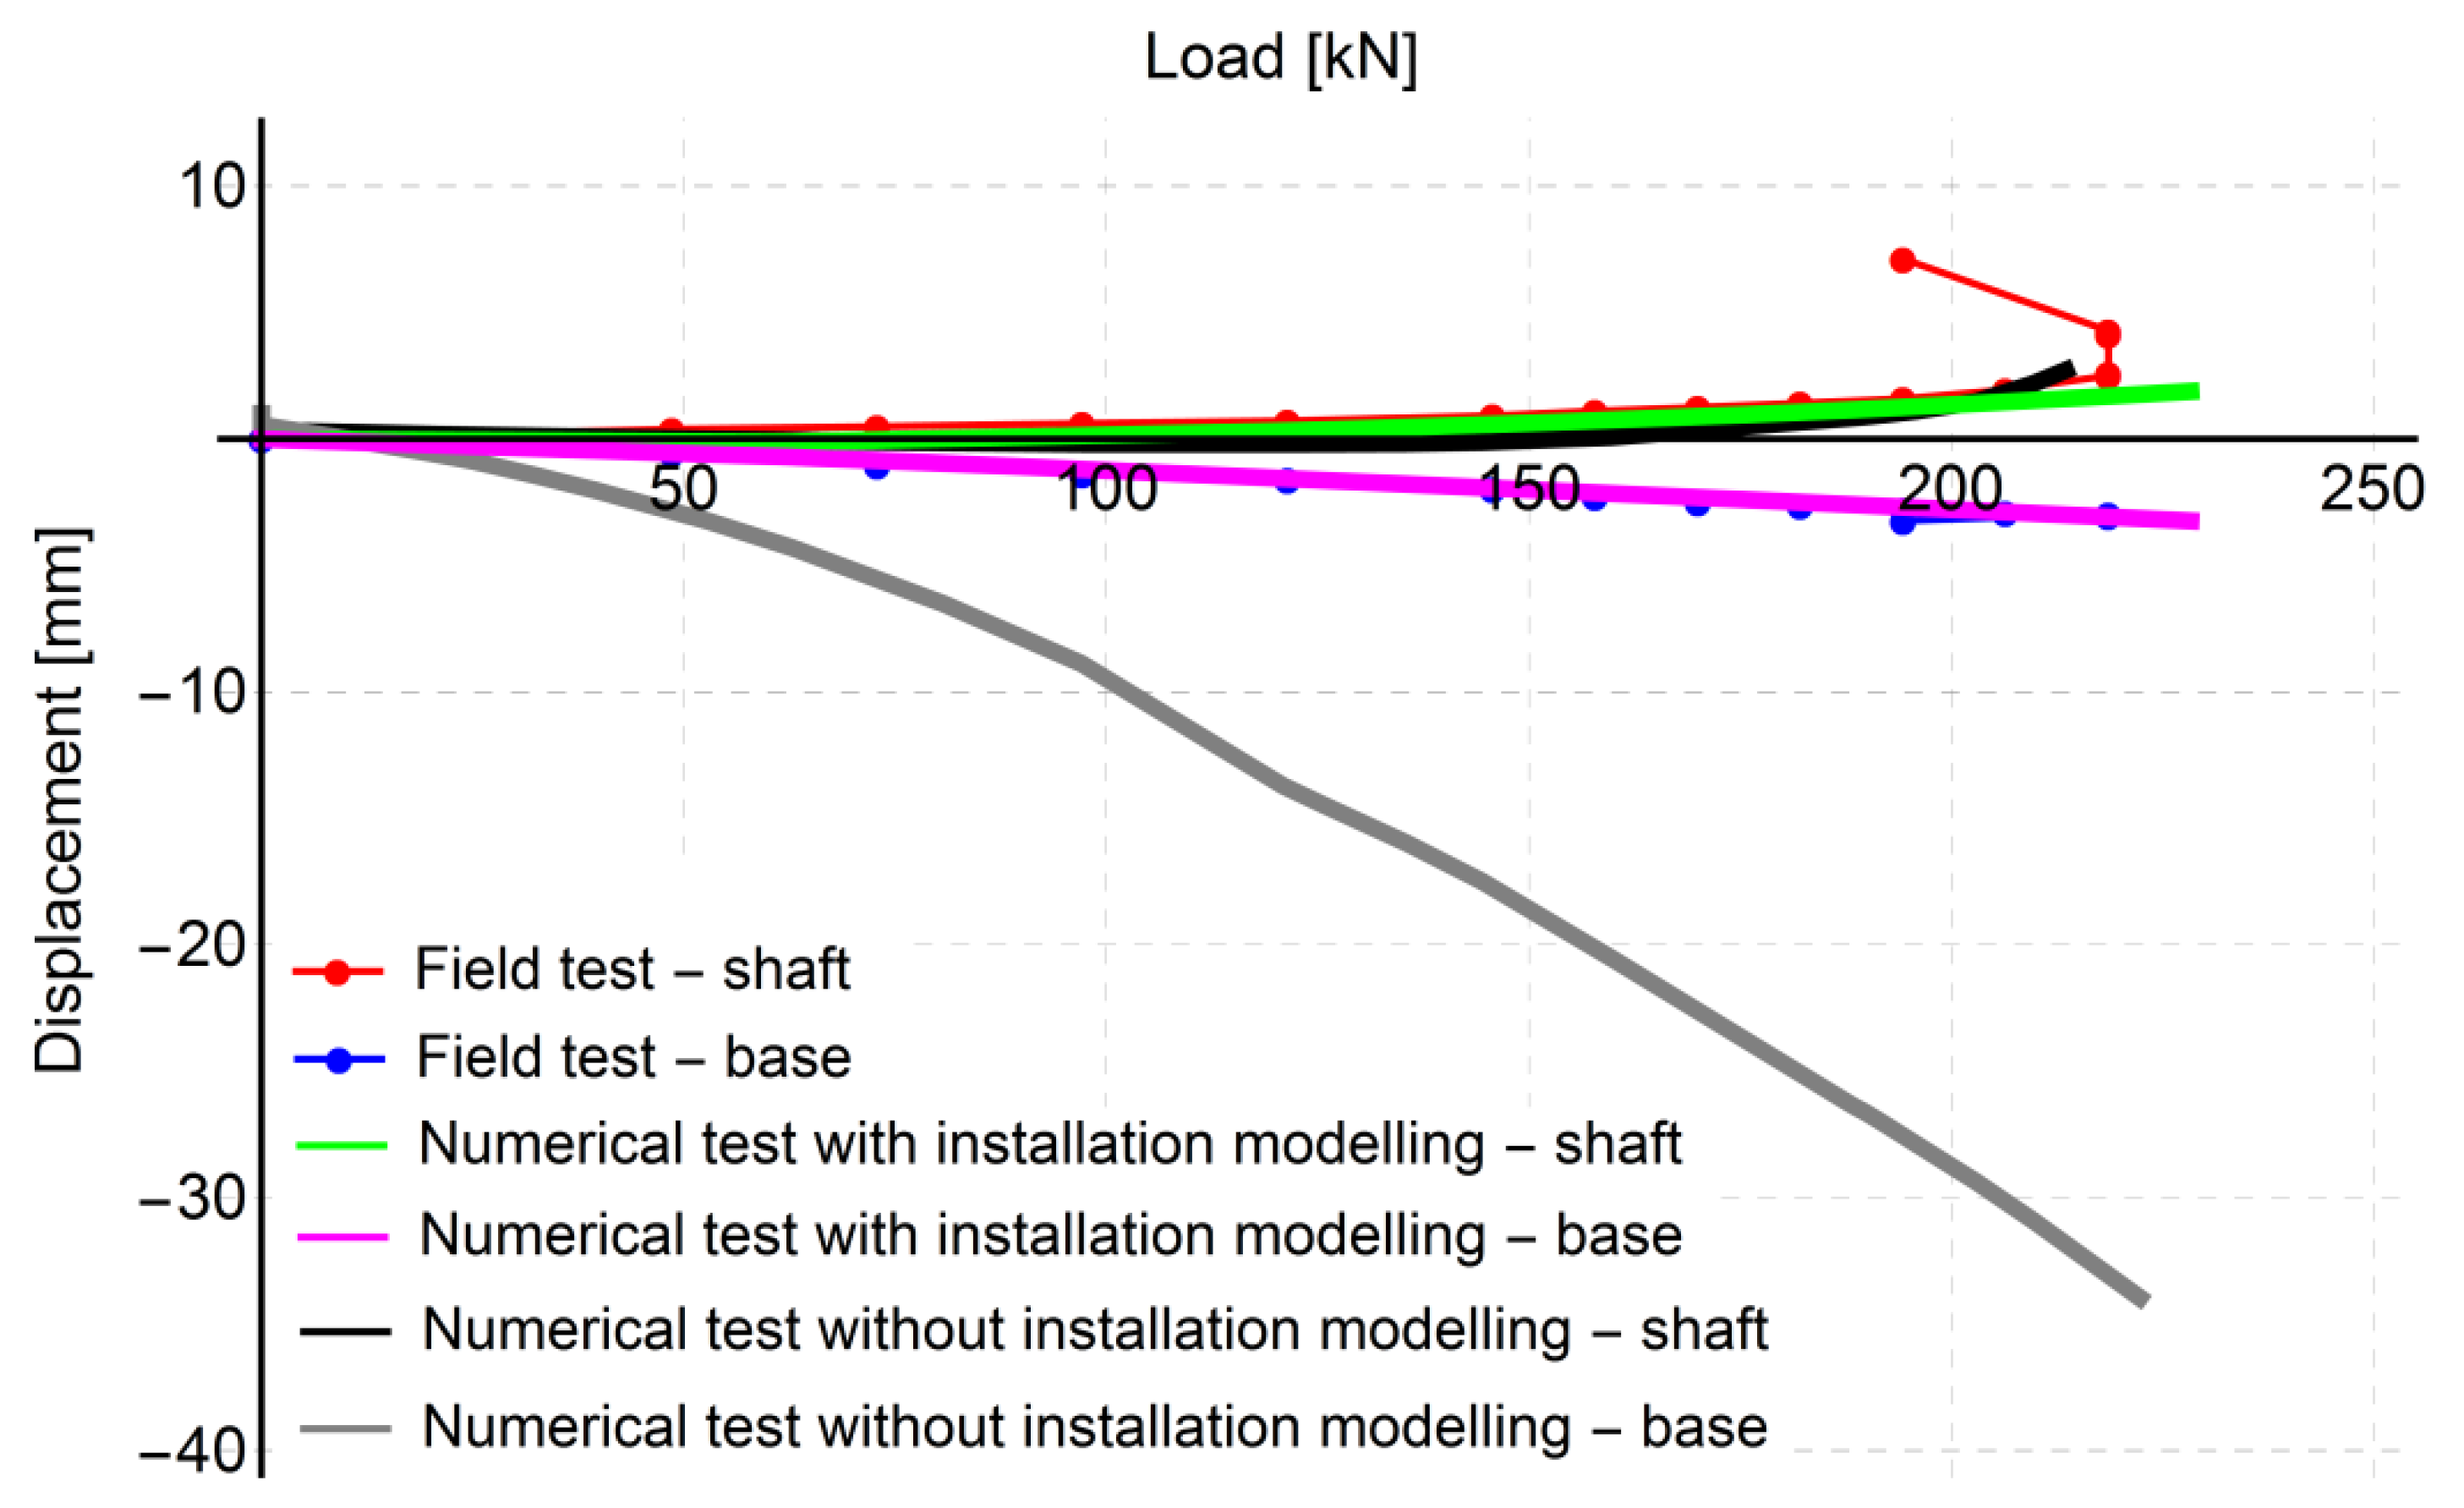
4.3. Consideration of Pile Installation in Numerical Calculations

A single numerical simulation consisted of three main steps:
  • Installation process;
  • Resetting of displacements (updated mesh option in Plaxis v. 7.2), combined with removal of redundant areas.
  • Activation of tubular elements and simulation of static load tests.
The pile installation process was modelled by soil displacement in horizontal and vertical directions. The lateral expansion was assumed in a simplified manner, similar to the Krasinski model [22]. Thus, it was assumed that there is an initial hole with a radius of 0.1 m, to which a displacement forcing is applied from the inside, expanding the hole to a final radius of 0.2 m. Due to the boundary problems described in the literature [22], it was assumed that at the pile head, the displacement is equal to 0 and linearly (mainly to simplify the calculations) increases to a maximum value of 0.1 m, which it reaches at a depth of 0.5 m (Figure 8). The spreading in the pile base region was tested for different variants (Figure 9).
After the installation process, the displacements in the whole model were reset to zero with Updated Mesh option in Plaxis software. This option made it possible to come back to the initial FEM mesh, resetting the deformations of the model but keeping the stress from the previous step. Therefore, the stress state in the soil can include the installation process.
In the last step, the tubular elements appeared in place, where the pipe pile was anticipated. Then, the simulations of the three types of static load tests (Figure 7) were performed. In each test, the single force load was gradually applied to the pile, the result of which was a load-displacement curve for each test.

4.3.1. Modelling of the Pile Base Installation

At the beginning, the model was tested for the proper base representation at the pile embedment of 8.0 m (Figure 7b) and thus for other loading schemes. For a better simulation of the pile base performance, a vertical displacement was proposed on the basis of [8]. The three selected modelling approaches are presented in Figure 9, and the results of FEM calculations of these approaches for pile base simulations in comparison to the field test are presented in Figure 10.
On the basis of the results of the performed calculations presented in Figure 10, the installation method type (c) was selected for further simulations. The results presented in Figure 10 show the great significance of pile base behaviour on the entire pile capacity. Shape of the pile base in the model can be correlated with shape of the finite elements in the base vicinity and therefore the large deformations which there occur. In different conditions, the more optimum the shape could differ from shape received from the presented simulations.

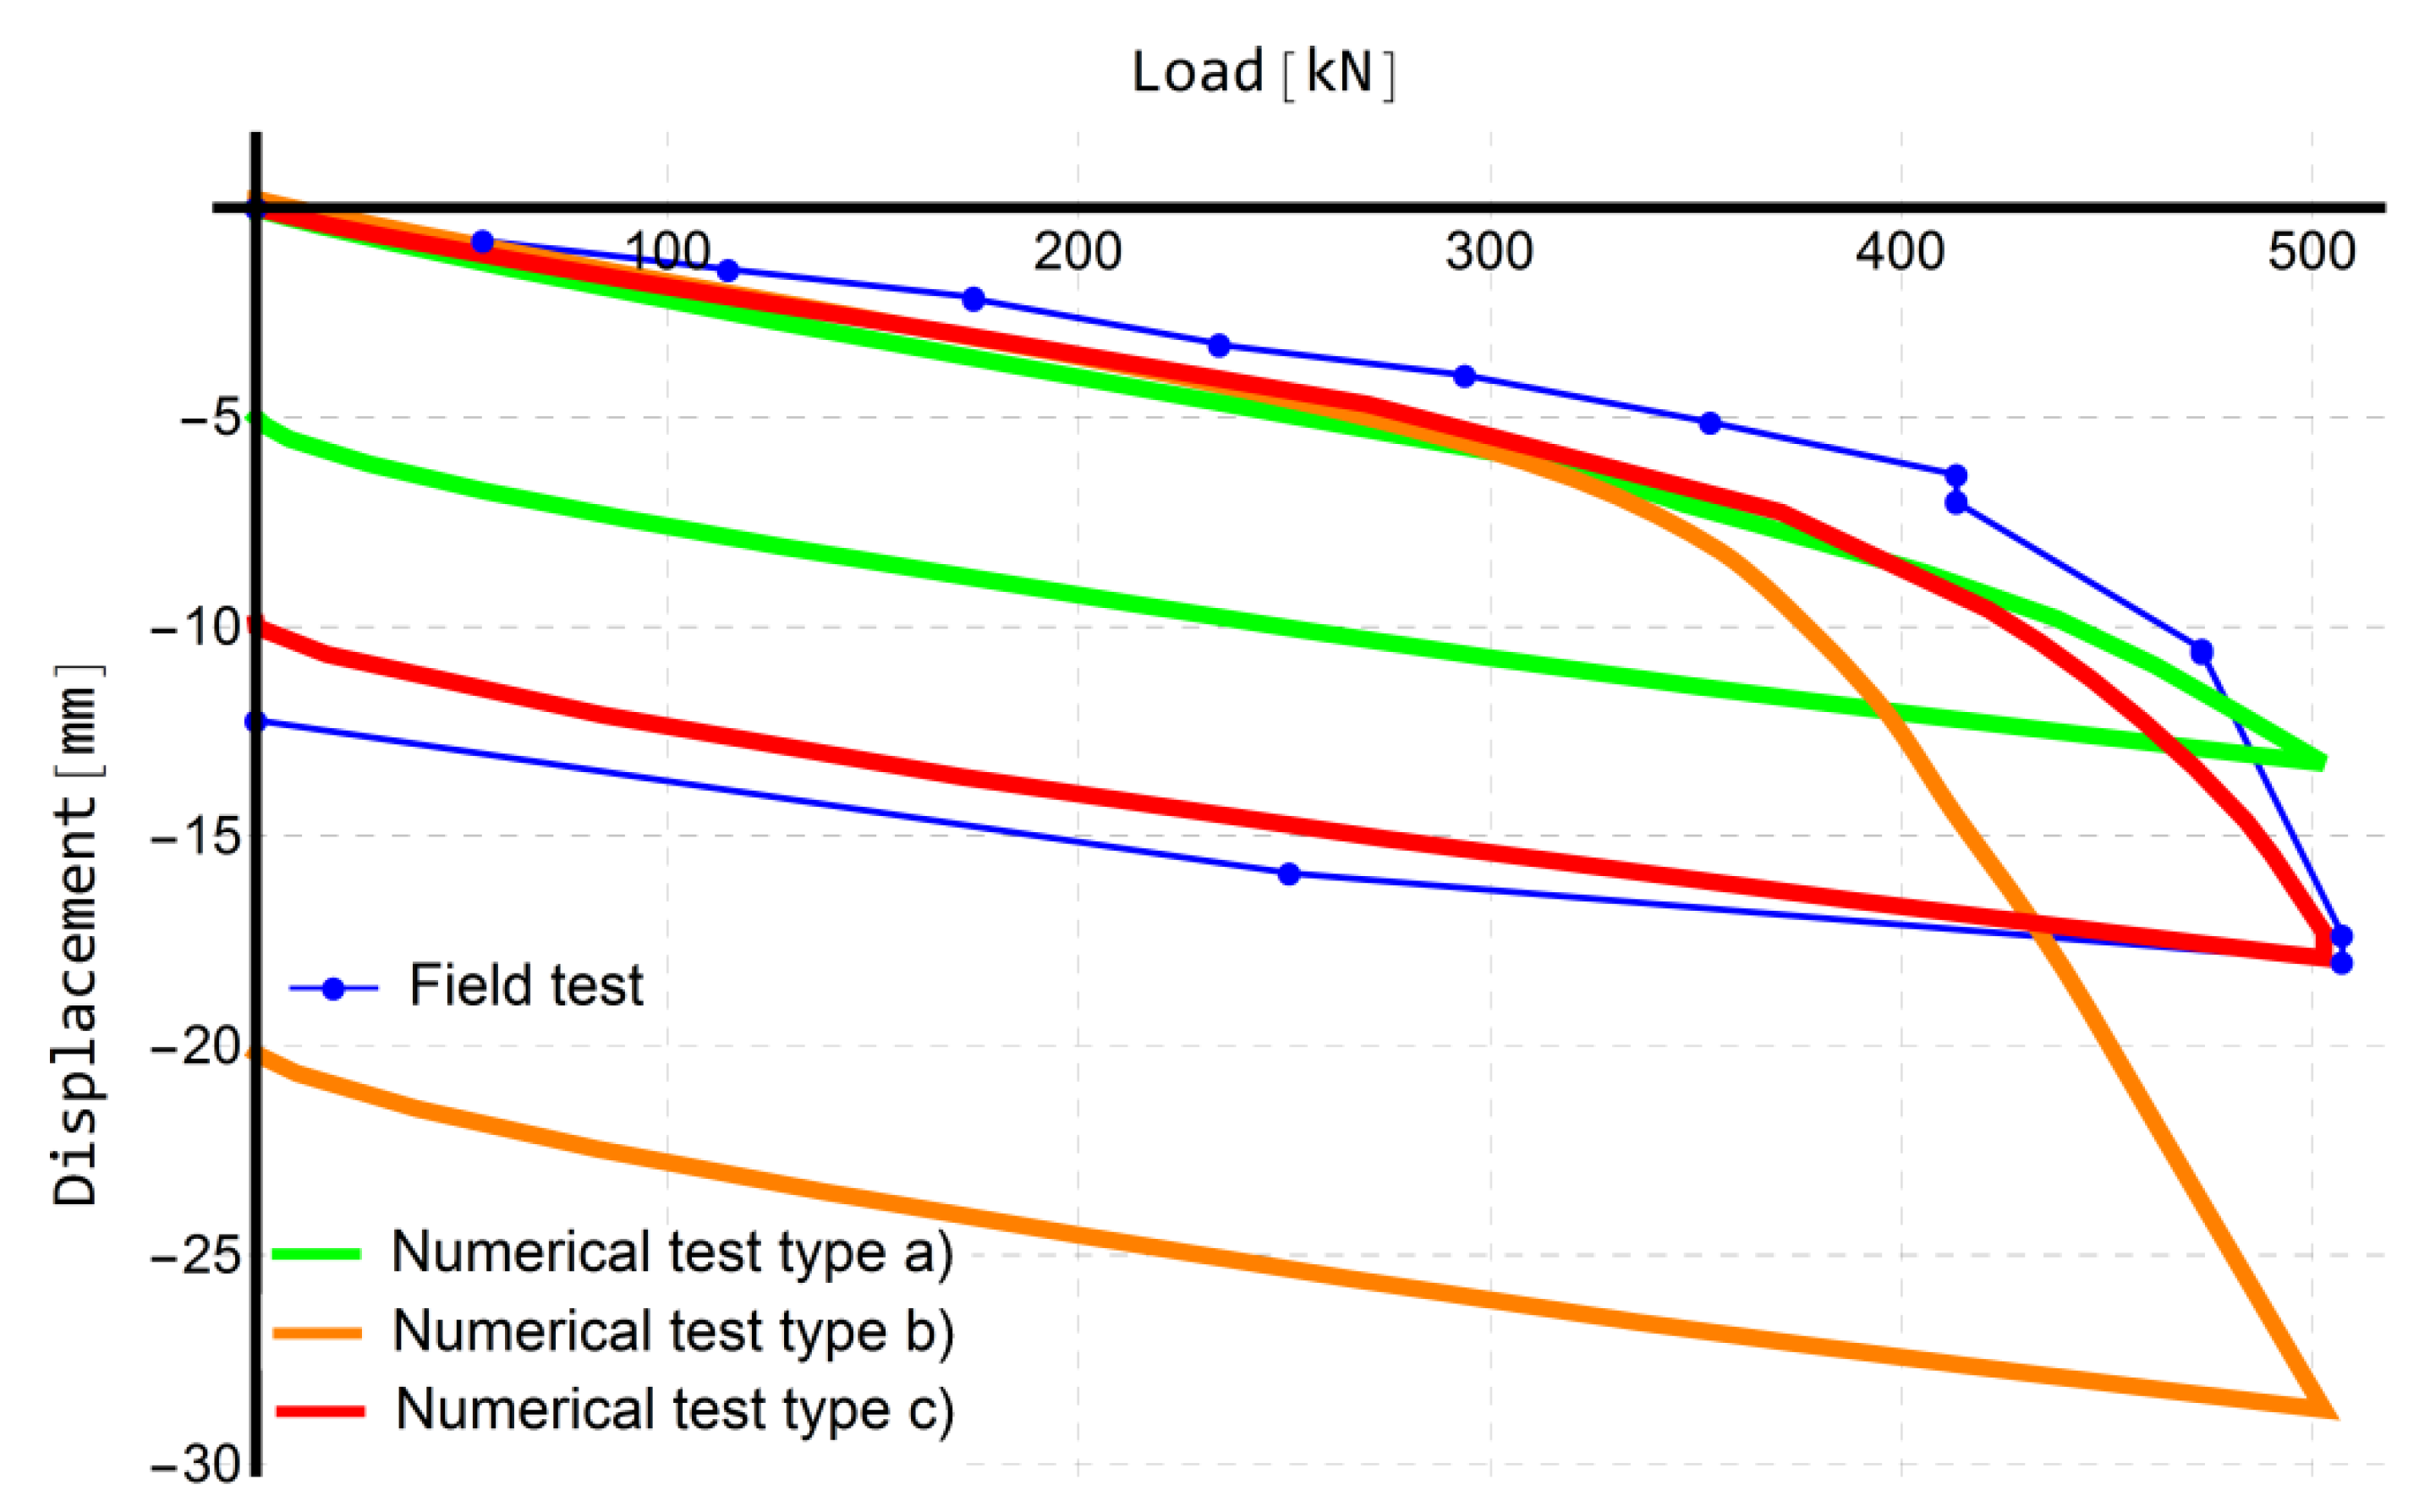
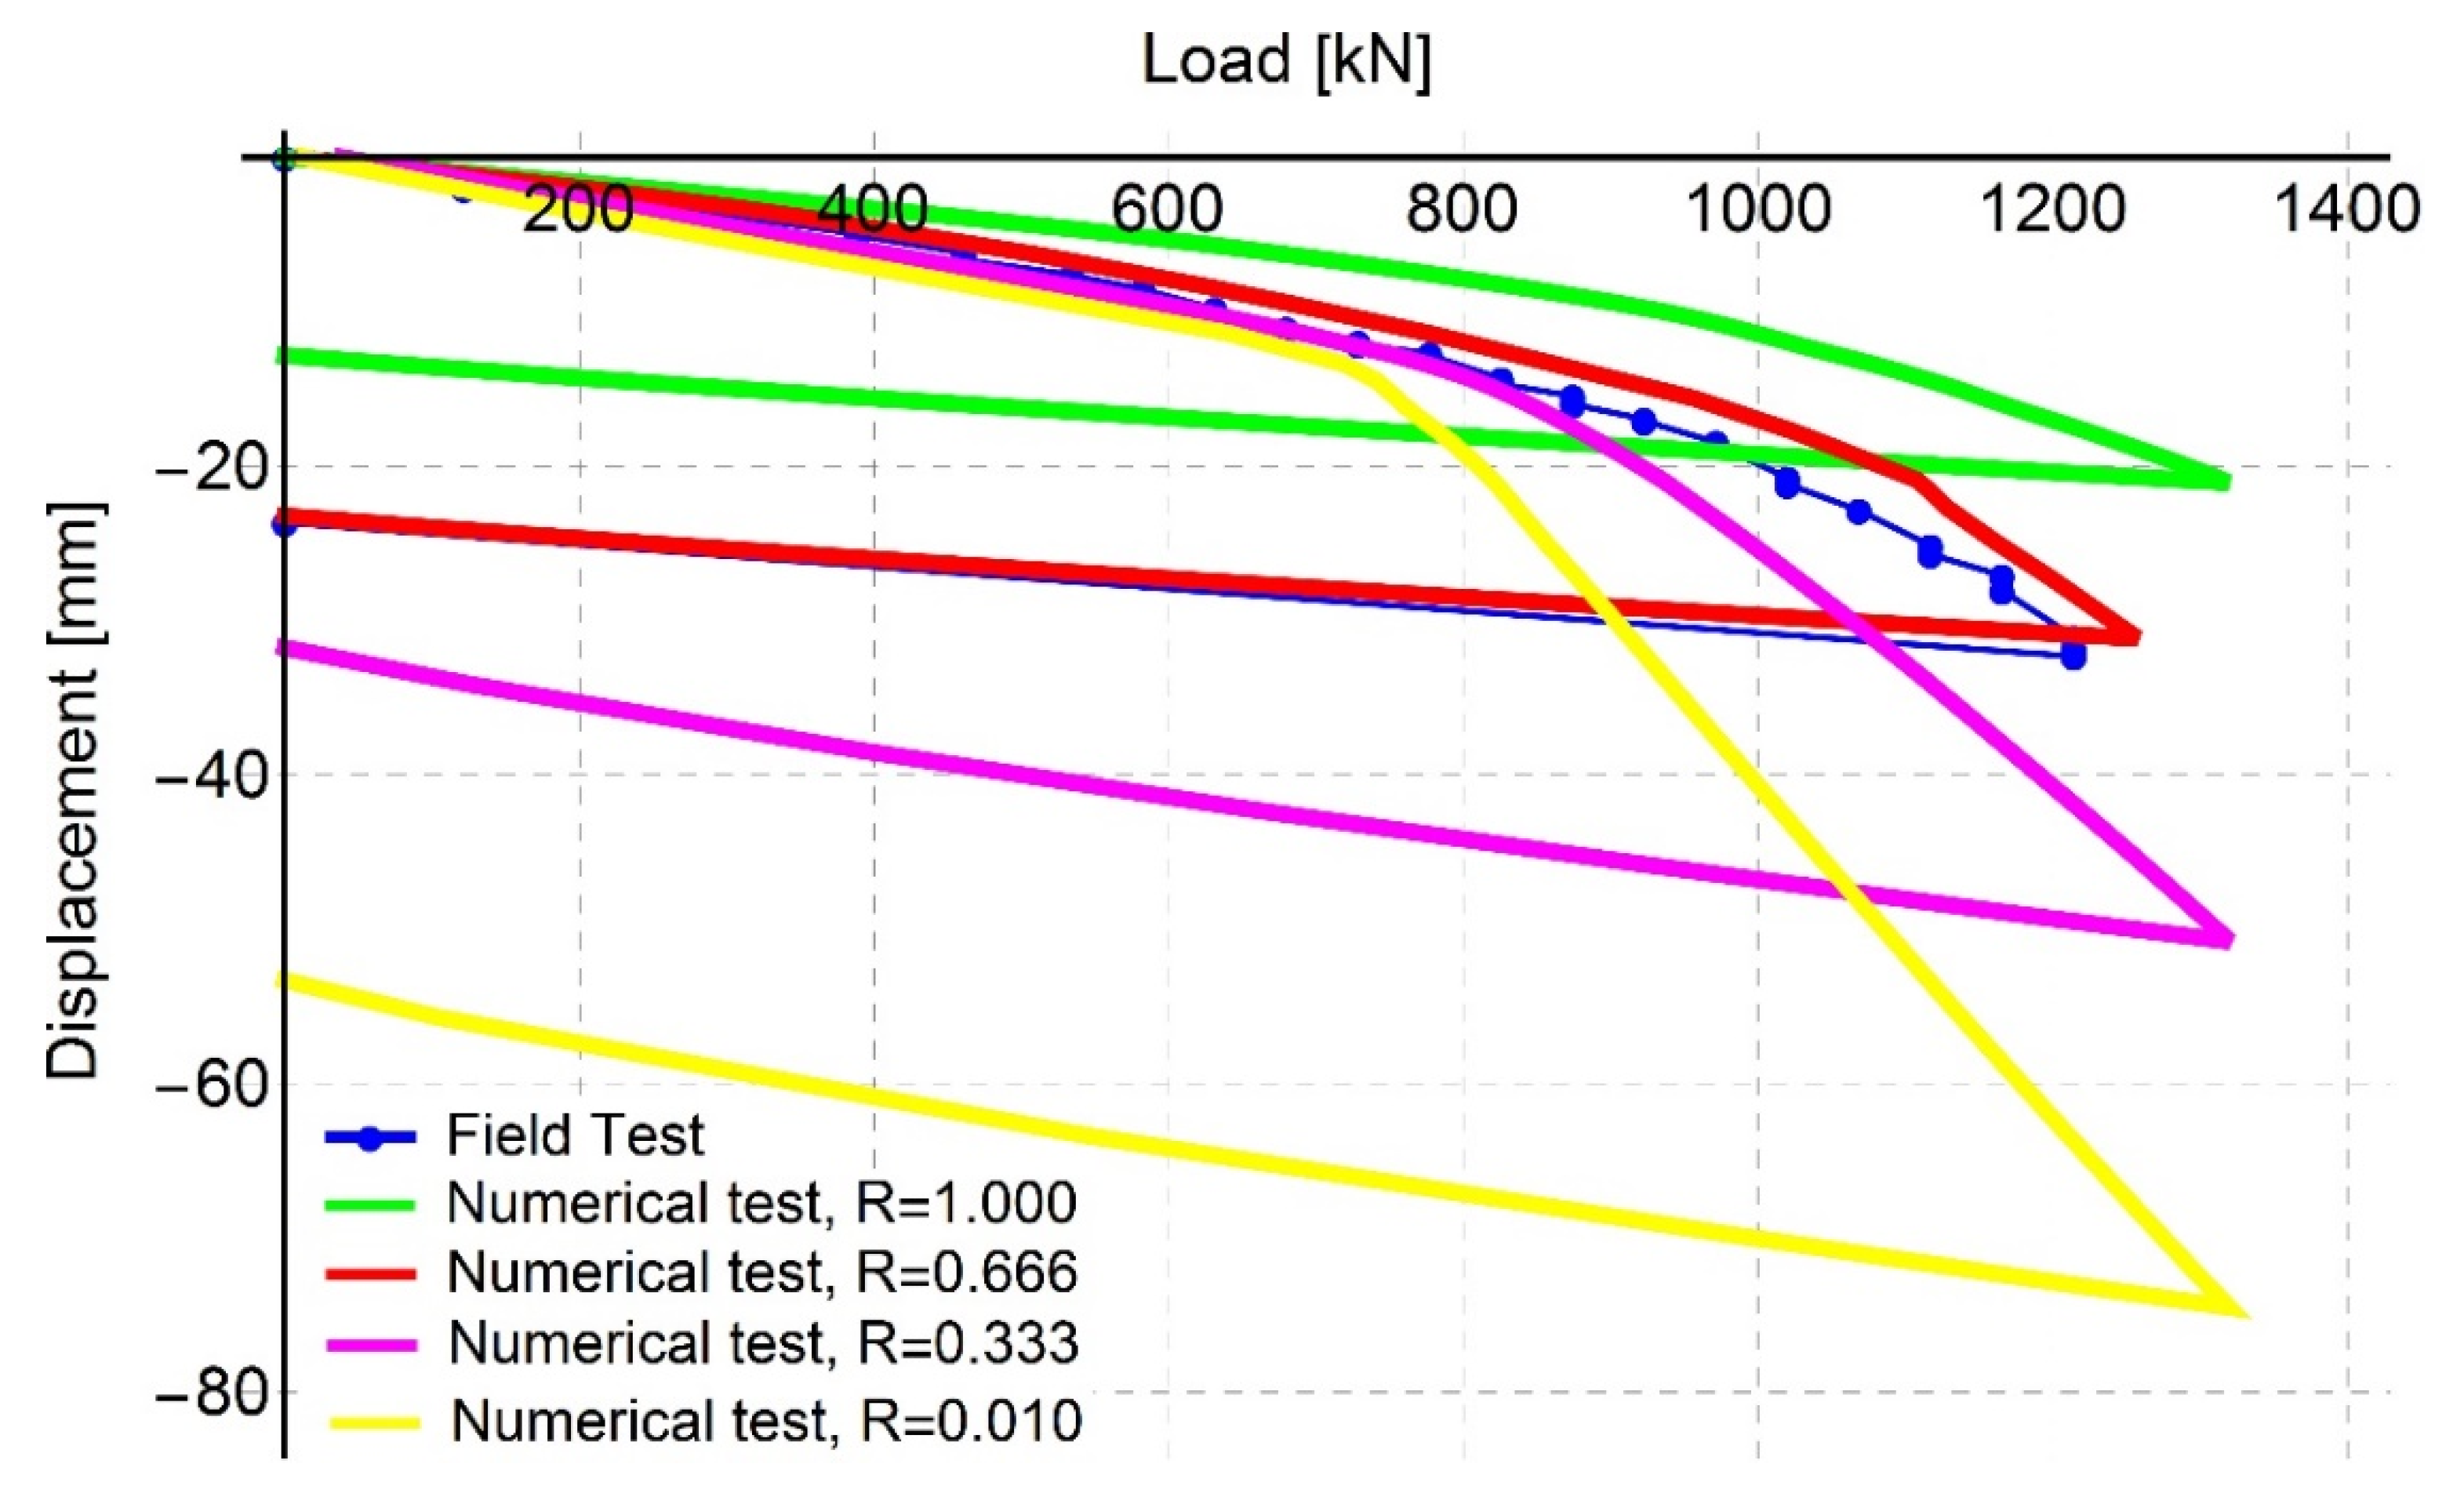
4.3.2. Selection of the Parameter R of the Contact Layer

The model was also tested for its sensitivity to the interface parameter R, describing the contact between the pile and the soil [33]. It must be pointed out here that selection of R (reduction of parameters on contact surface between the steel and the ground) is a different issue and it is considered separately from the change of ground parameters in the compressed zone around the pile. For this purpose, several numerical simulations were carried out for the entire pile embedded to 8.0 m at different values of the R. The value R = 0.666 was found to be the most appropriate and further calculations were carried out for this value. Simulation results for R = 1.000, R = 0.666, R = 0.333, and R = 0.000 in the entire pile simulations are presented in Figure 11. The value of R can be different depending on the soil layer in the pile vicinity, but for simplification of the calculations, a single value was chosen (also because the sand appears in most of the vicinity of the pile).
It should be emphasised that this was the only place where the model parameters were adopted on the basis of the analysis of variants. All the other parameters of the Hardening Soil model values resulted from the literature recommendations rather than matching the calculation results with the measurements.

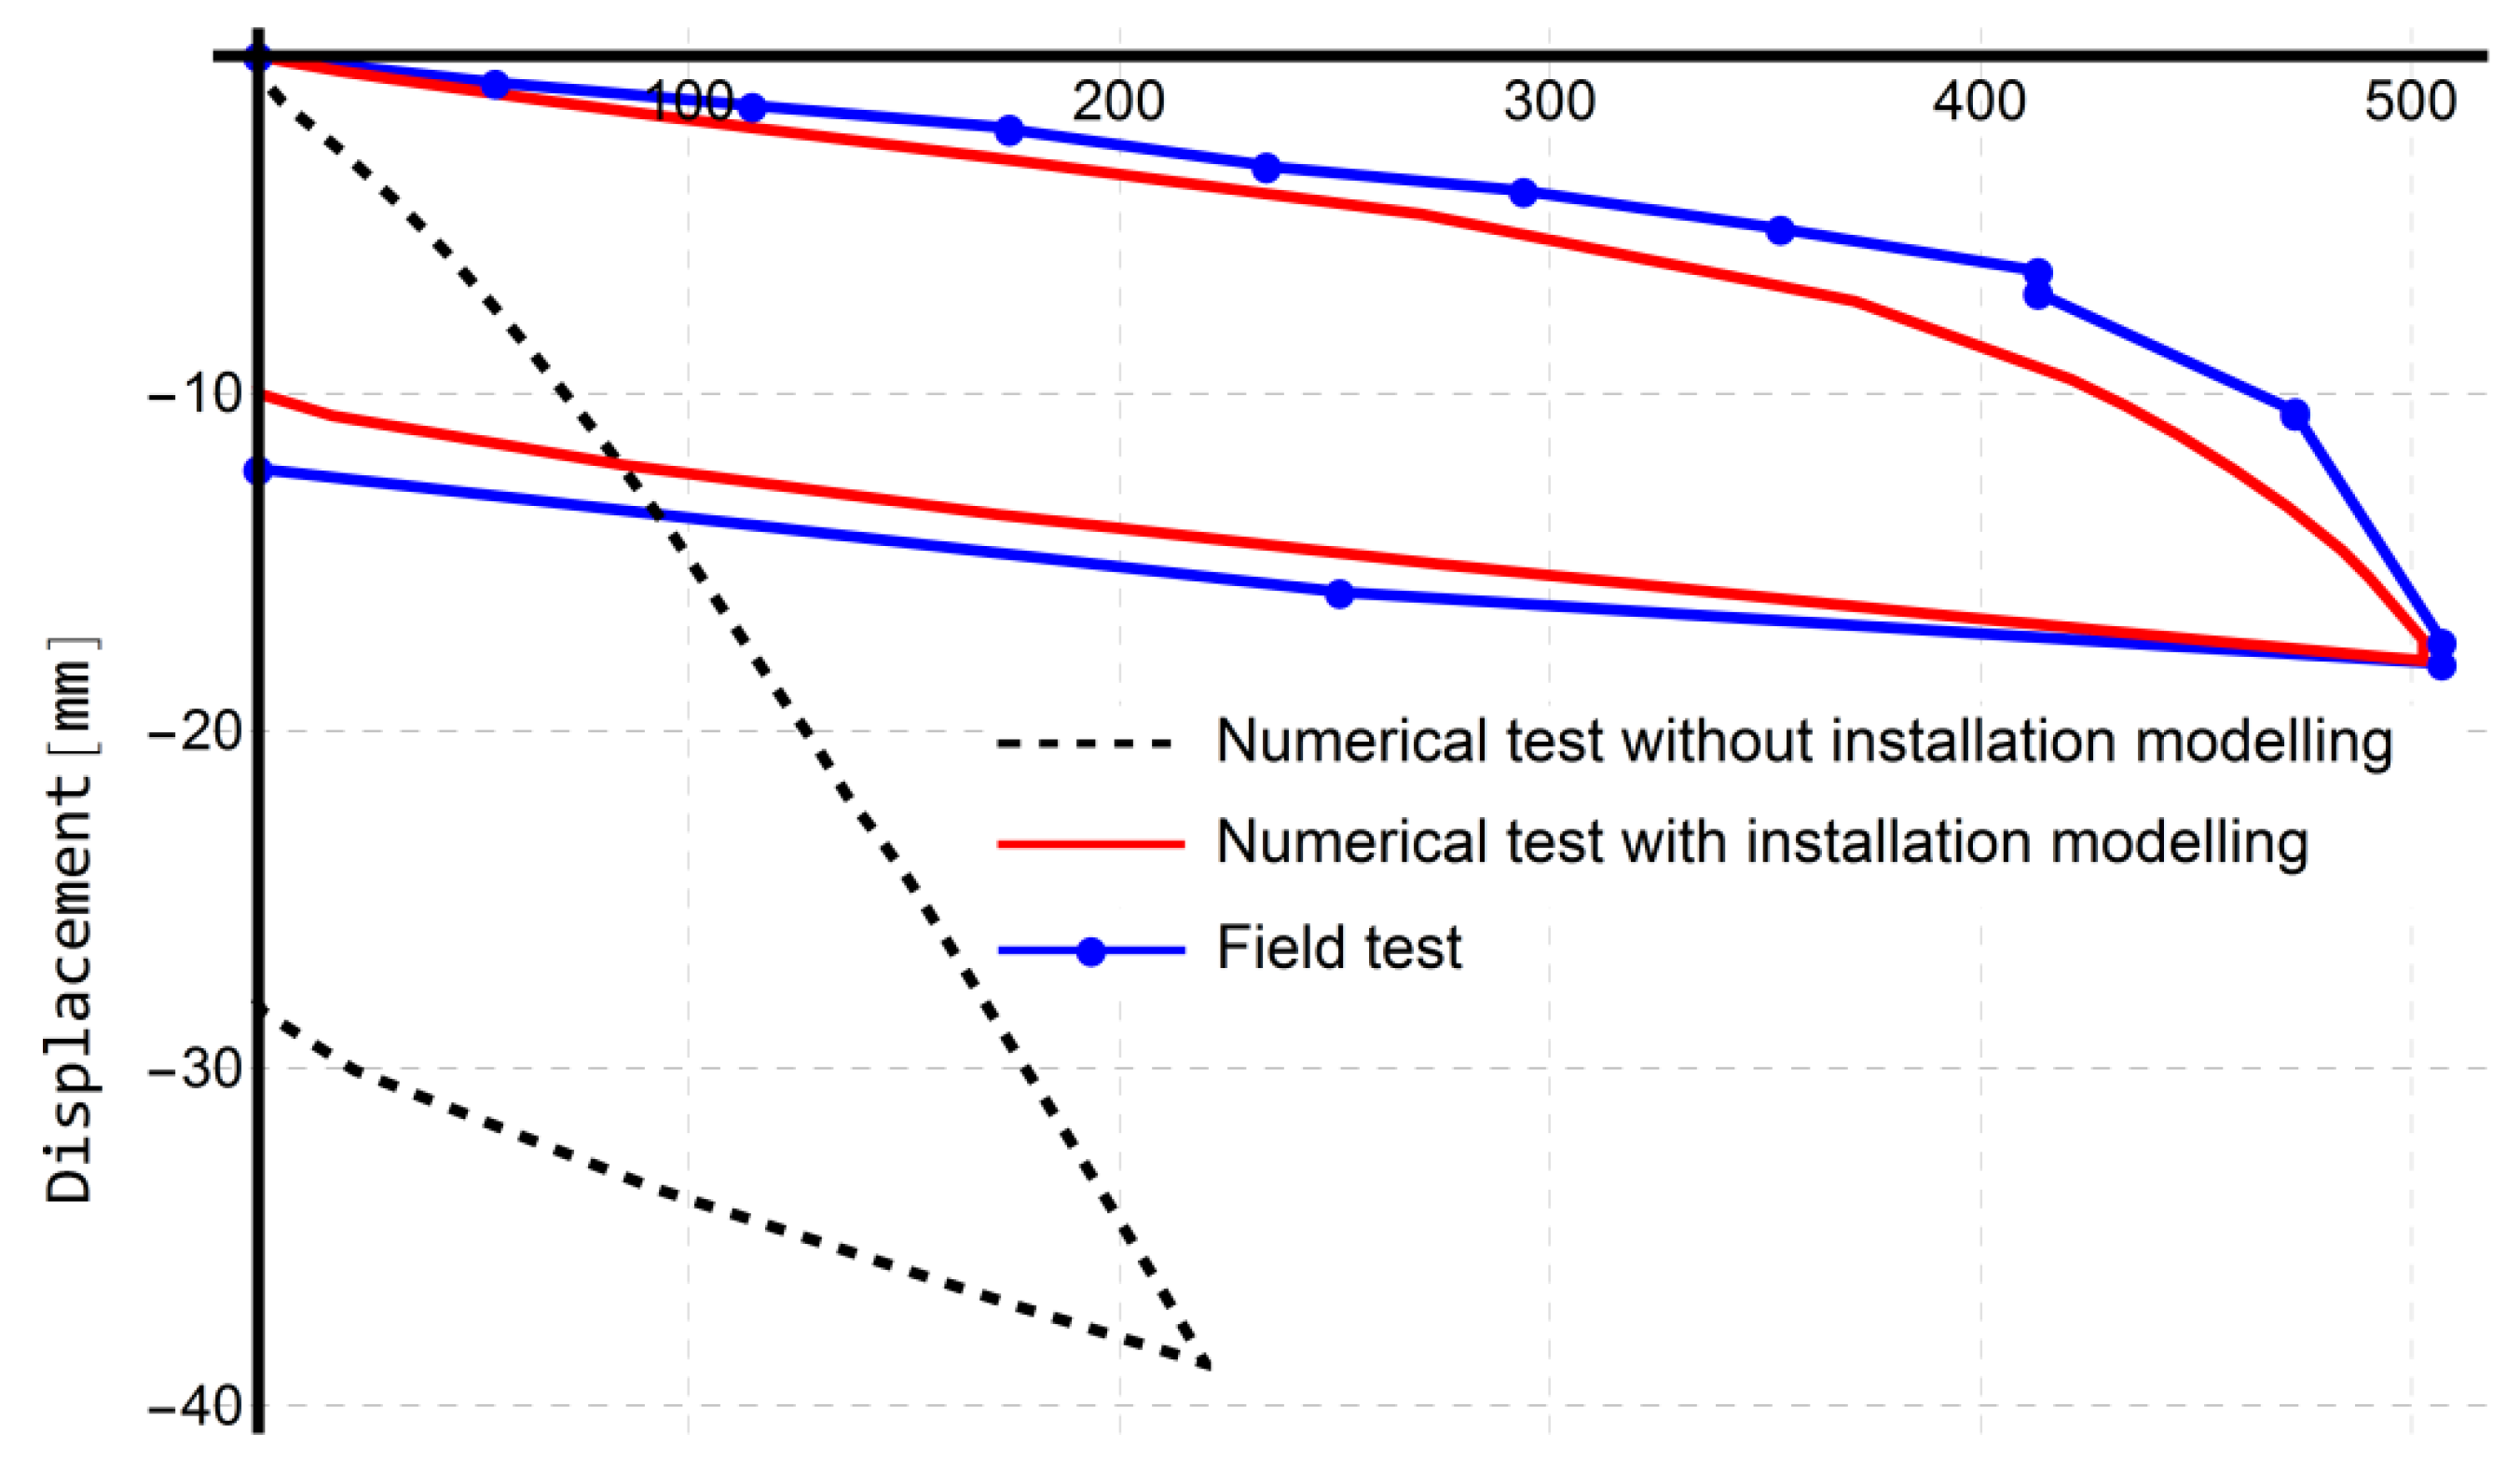
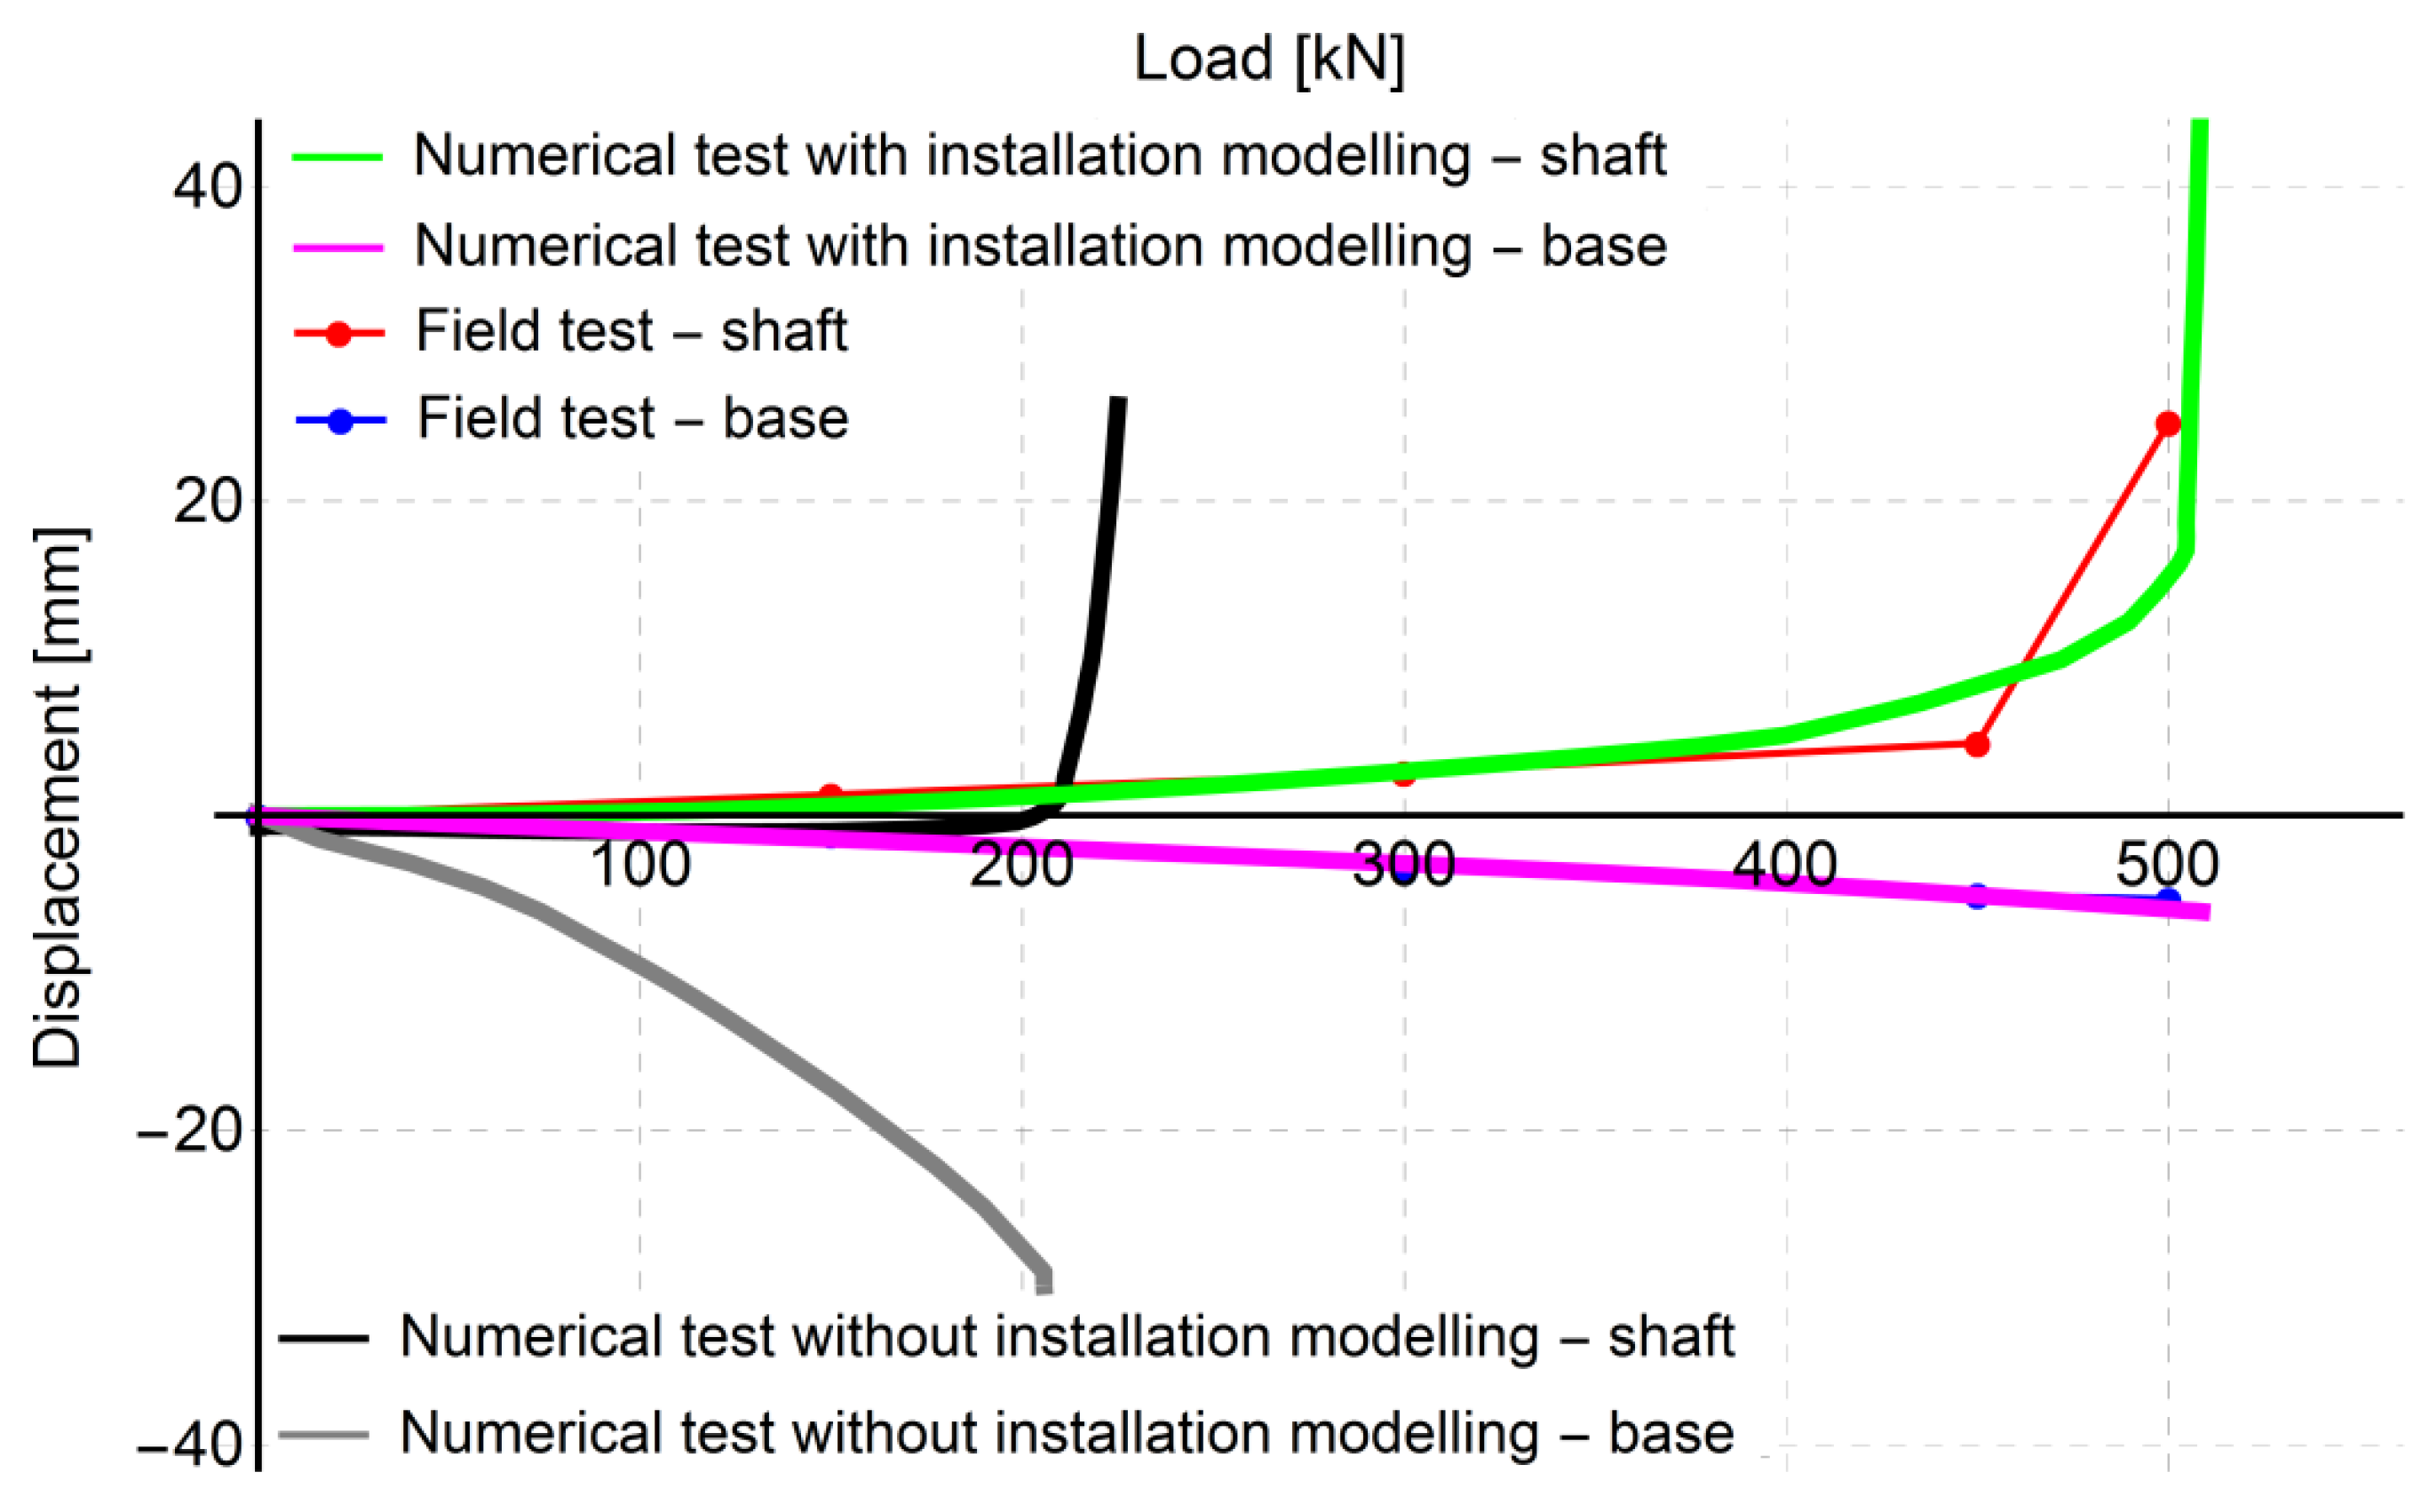
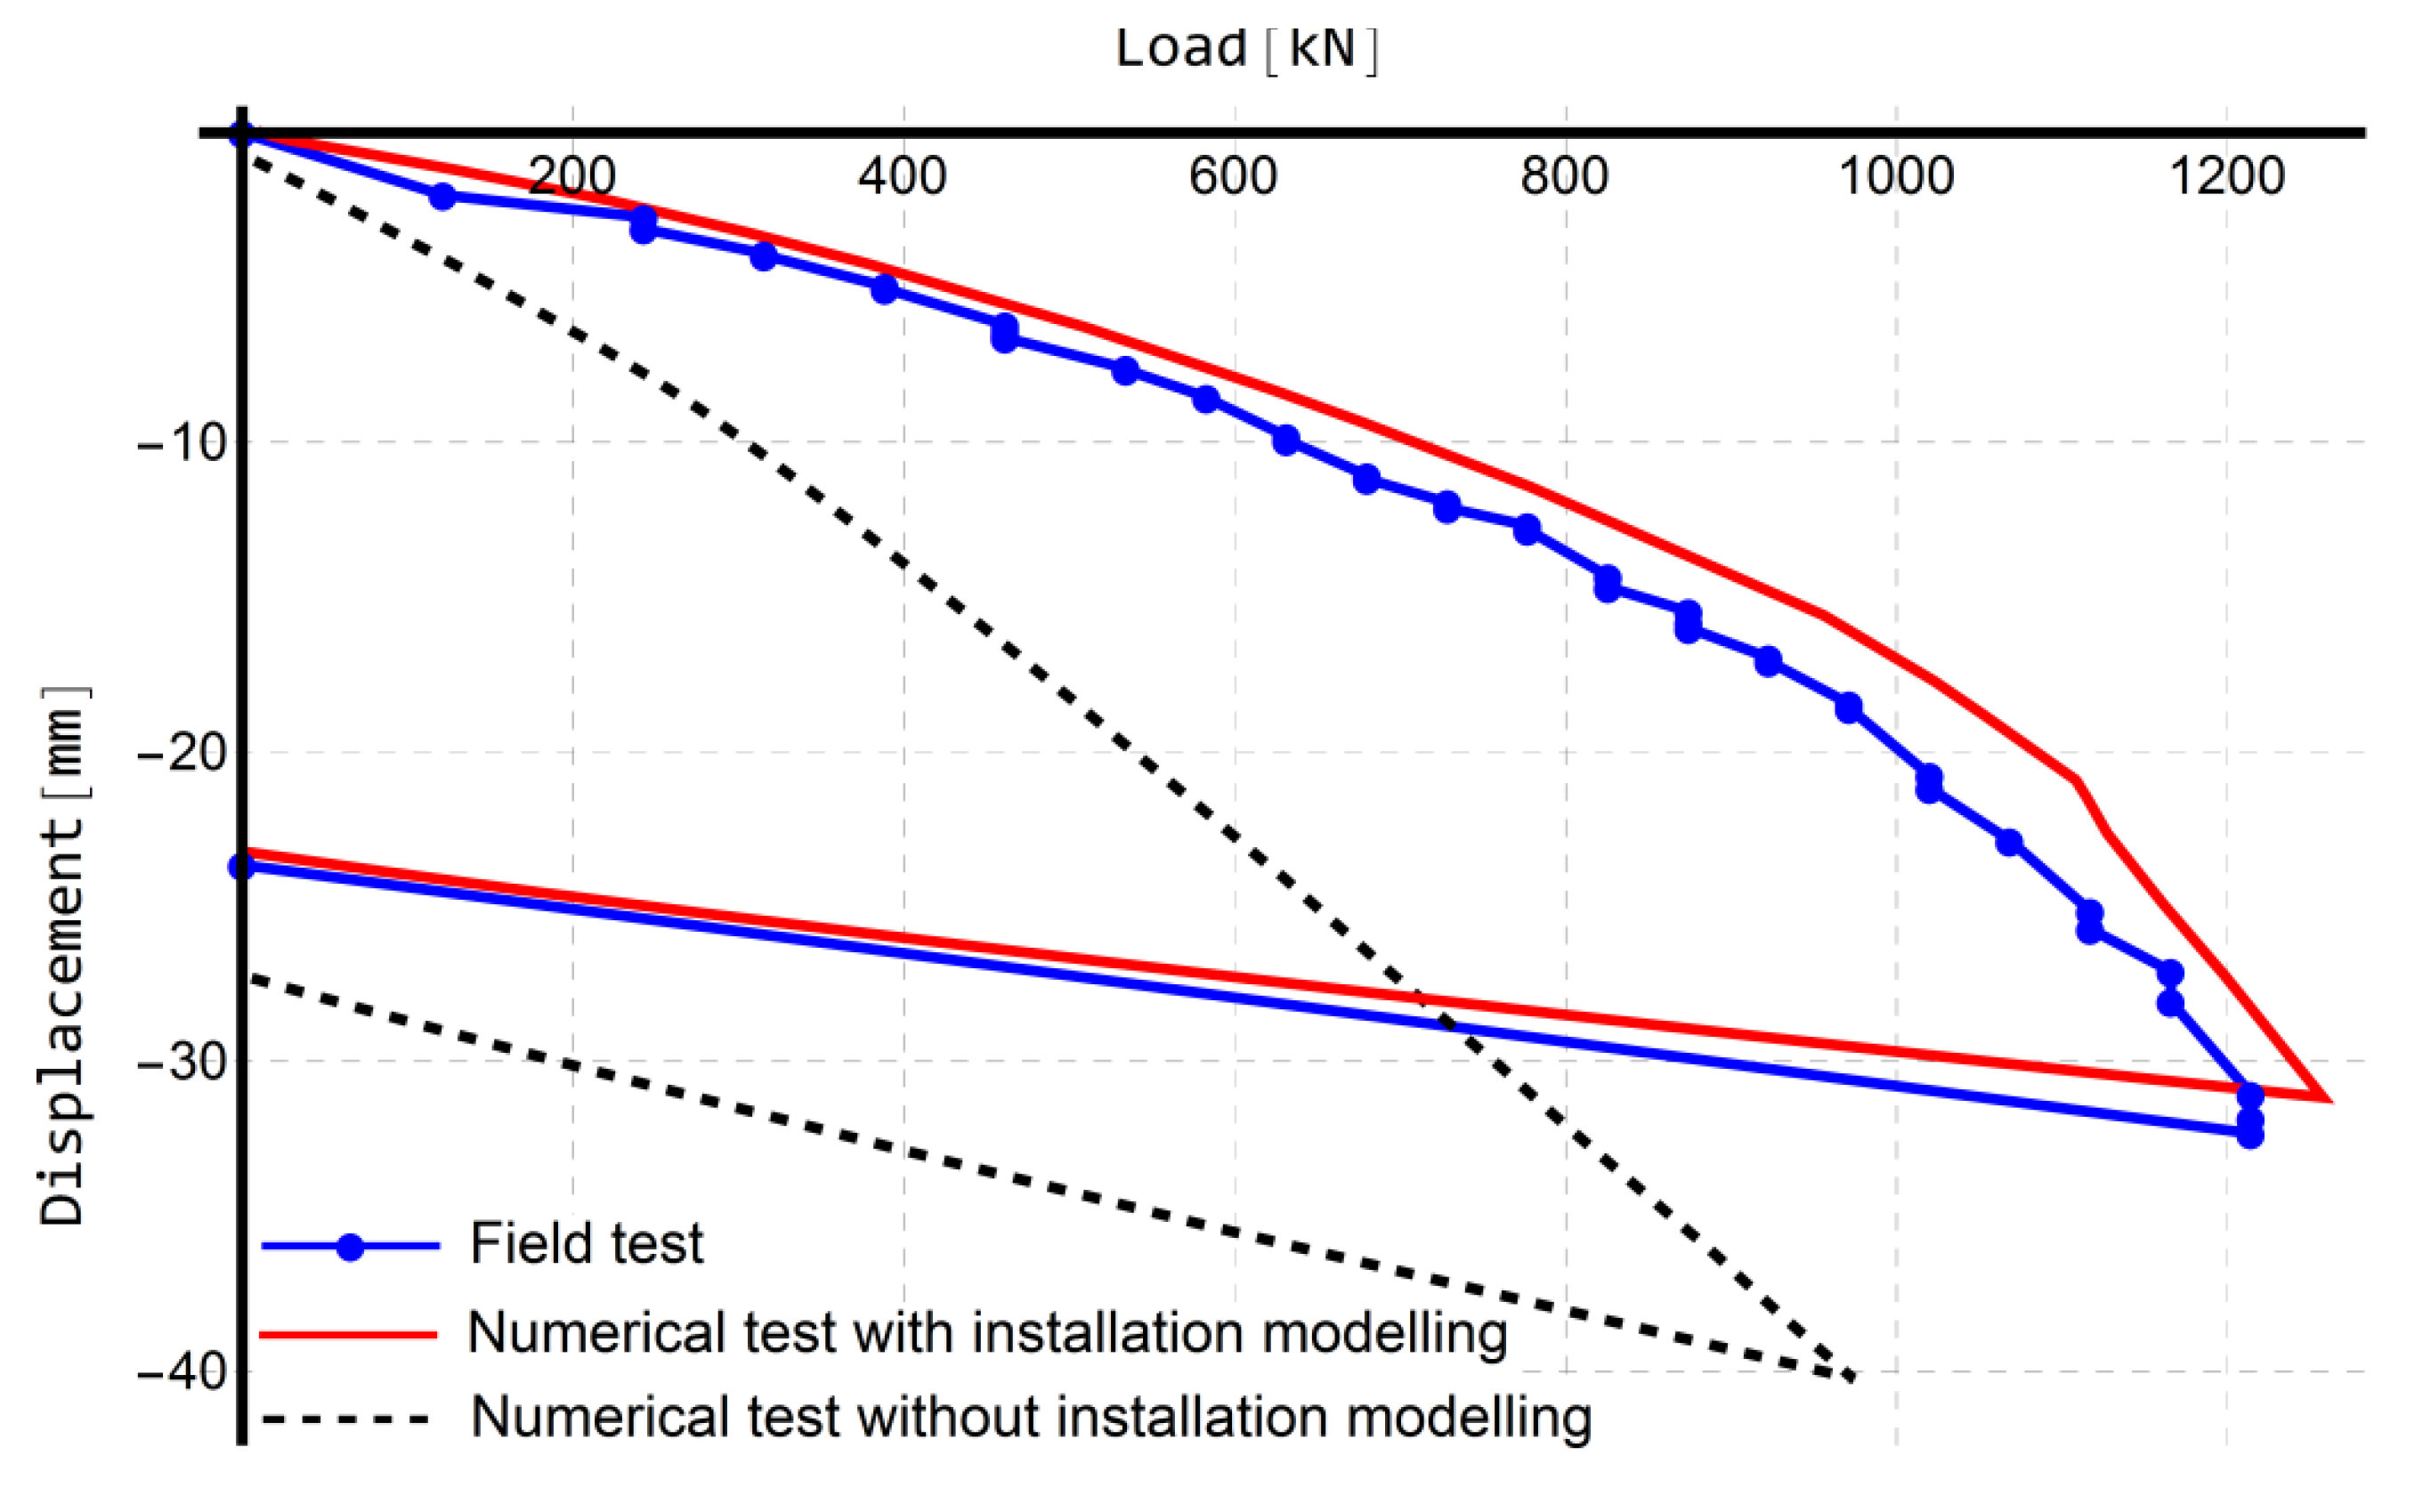
4.4. Results of Simulations

Figure 12 shows selected solutions for the stage after the pile installation but before the modelling of load tests. The assumed dimensions of the calculation area 20 m × 15 m are considered sufficient—the influence of the area edge is negligibly small. Figure 13 shows that the volumetric deformation is strongly influenced by soil stratification. White areas are indicating areas of large mesh distortion, which makes it impossible to determinate the volumetric deformation. Application of more sophisticated methods, presented earlier in this paper, could result in more detailed solutions; however, their implementation is much more complicated.
Figure 14, Figure 15, Figure 16 and Figure 17 present the Q–s relations of the results of the numerical simulations, including the influence of the pile installation, with reference to the static tests performed on real pipe piles in four cases: for the static load test of the entire pile, the static load test of pile base and bi-directional tests both at a pile depth of 6.5 m and at a target depth of 8.0 m.

5. Discussion

The results obtained clearly show the necessity of including the pile installation process in the numerical modelling. Analysing the Q–s curves presented in Figure 14, Figure 15, Figure 16 and Figure 17, it can be observed that the curves obtained from pile simulations without including installation effects significantly differ from the results of field tests. Based only on the soil parameters obtained from in situ tests without including installation effects, the curves obtained for all performed simulations would suggest much lower bearing capacity than from the field tests. This shows how the displacement pile installation changes the soil conditions around the pile and how not including the installation effects can lead to an underestimation of the actual bearing capacity.
The proposed numerical model, based on the models proposed in [8,9], allowed for a simple way of including the pile installation results. The installation process was modelled as the displacement of the soil, mainly in the horizontal direction, before the simulations of static pile tests were performed. The application of this method increased the level of stresses in the model pile vicinity and consequently made it possible to obtain the simulation results with better agreement with field tests. The application of the updated mesh option allows for the summation of influences on stresses in successive steps with simultaneous resetting of displacements, thus avoiding problems associated with the occurrence of large mesh distortions. Additionally, in the Hardening Soil model, changes in stress fields are translated into changes in soil stiffness, which allows for a better representation of the pile installation process. This is mainly the effect of the application of different soil moduli and their influence on stress changes. Therefore, every change in stress during the pile installation influences also the soil stiffness and, consequently, the bearing capacity of the pile. A more detailed description of those phenomena can be found in [32].
A series of field tests conducted on pipe piles made it possible to study various aspects of pile behaviour under different applied loads, which proved useful in the context of its numerical analysis. Based on the base tests, a suitable base modelling was selected to represent the pile base behaviour. An appropriate R parameter for the friction between the pile and the soil was also selected. The obtained R = 0.666 confirms the results obtained for pipe piles by other researchers [36].
Consequently, for all the performed tests including pile installation, higher bearing capacity and better curve fitting were obtained in the simulations, which shows a good model fitting. Moreover, it was possible to achieve satisfactory results without initial changing of the in situ parameters obtained from the soil tests.
However, it was not possible to compare the changes in the soil which occur during static load tests in the pile vicinity. The proposed model does not allow for an accurate reproduction of the stress state around the pile. Nevertheless, it is also difficult to obtain results from field tests. Accurate investigation of a real pile behaviour would require the application of instrumented piles [37,38], deeper analysis of contact effects on the pile surface [39] or model piles in calibration chambers on a geotechnical centrifuge [40,41,42]. It is clear that some recent developments of Material Point Method (MPM) [43] and Particle Finite Element Method (PFEM) [44] offer more sophisticated solutions, but the presented idea seems to be relatively easy to calibrate using SLT or pile driving reports (for precast driven piles). Every installation process and every force applied to pile bottom and shaft, no matter the direction, changes the stress state around the pile. That is why severe rules concerning the time that should elapse from driving (EOD) to the test are established in most codes of practice. If we consider the actual piling technology (vibratory driving) and geotechnical conditions (pile embedded mainly in granular soil), the time required between driving and testing (and between various testing procedures) should exceed 30 days (a month). This minimum recommendation was applied and, moreover, due to logistic difficulties, several periods were even longer. That is why the whole testing program lasted 2 years. The problem of capacity changes in time was widely discussed for over 20 years. Reference [45] emphasises capacity increase over time with a surprising outlier (the authors admit) on the 30th day. It must be underlined that the distance of 1.5 m between pile embedment depths, compared with the pile diameter 0.4 m (reaching almost 4D) is sufficient to neglect possible influence of actions taken at 6.5 m (both: loads and displacements in course of testing, and time dependent effects). Polish codes of practice define the “influence depth” equal to 2.5D. Only in the case of very soft underlying layer the “influence depth” is assumed to be 5D (but this is not the case here). If we consider methods of pile capacity evaluation based on the CPT results, the averaging zones beneath pile base are usually equal to 1.5D.

6. Conclusions

The aim of the numerical simulations was to propose a new modelling process which would allow us to represent field pile tests, both traditional static load tests and bi-directional tests. An appropriate model requires accurate consideration of pile installation influence on the surrounding soil and consequently on pile behaviour under applied load. Each of the methods that are used to describe this issue have certain limitations.
The numerical calculations carried out in this work were performed using the Finite Element Method in Plaxis 2D. This method is commonly used to model various geotechnical issues; however, in simulating the pile installation process, some discrepancies between the results of numerical simulations and the field tests can occur. The application of real field tests to the model validation allowed for positive convergence verification of the model for different types of static test loads.
Based on the field test simulations, it can be concluded that the proposed numerical model shows good convergence with the test results of the real pile test. Ignoring the installation process in simulations allows for proper modelling of the piles installed only with methods that do not significantly change the soil state. In the case of displacement piles (like all steel pipe piles, no matter if they have a bottom plate), the application of a simple soil displacement model allowed us to confirm the increase in pile bearing capacity caused by the installation process.
The authors are fully aware of the fact that pile installation is a complex issue that cannot be accurately reproduced in a simple FEM model; however, the aim of the proposed model was only to simulate its effects. Further verification of the proposed model requires simulation of other field tests in different soil conditions. However, in the simulations carried out, there are some discrepancies in the representation of stress levels, deformations, and plastic phenomena in the soil, but this problem constantly occurs in finite element simulations of pile installation. Improving the convergence of the solution in these areas would require more advanced numerical methods.
The method proposed in this paper can be also helpful in conducting the field static load test. Due to the large cost and technical difficulties, one must gain as much of the information from every STL as possible. Optimal design brings a requirement for very precise data. Acquiring more precise information on pile base and pile shaft capacity helps to reduce the amount of heavy foundation works providing acceptable reliability. Last but not least, the presented study brings some new ideas and solutions to the area of knowledge and geotechnical practice.

Author Contributions

Conceptualization, M.B. and J.R.; methodology, M.B.; software, M.B.; validation, M.B.; formal analysis, M.B.; investigation, M.B. and J.R.; resources, M.B.; data curation, M.B.; writing—original draft preparation, M.B.; writing—review and editing, M.B., J.R. and A.L.I.; visualization, M.B.; supervision, J.R.; project administration, M.B.; funding acquisition, J.R. and A.L.I. All authors have read and agreed to the published version of the manuscript.

Funding

This research received no external funding.

Institutional Review Board Statement

Not applicable.

Informed Consent Statement

Not applicable.

Data Availability Statement

Data supporting reported results can be obtained (on request) from corresponding Autor of this contribution michal.baca@pwr.edu.pl.

Acknowledgments

We would like to acknowledge the professional support of Włodzimierz Brząkała from Wrocław University of Science and Technology, who supervised the numerical studies made for the purposes of the doctoral dissertation of Michał Baca. The authors would also like to express their gratitude to PPI Chrobok S.A. for their kind assistance in assembling all testing appliances for field studies.

Conflicts of Interest

The authors declare no conflict of interest.

References

  1. Baca, M.; Brząkała, W.; Rybak, J. Bi-Directional Static Load Tests of Pile Models. Appl. Sci. 2020, 10, 5492. [Google Scholar] [CrossRef]
  2. Baca, M.; Rybak, J. Pile Base and Shaft Capacity under Various Types of Loading. Appl. Sci. 2021, 11, 3396. [Google Scholar] [CrossRef]
  3. Yang, Z.X.; Gao, Y.Y.; Jardine, R.J.; Guo, W.B.; Wang, D. Large Deformation Finite-Element Simulation of Displacement-Pile Installation Experiments in Sand. J. Geotech. Geoenviron. Eng. 2020, 146, 04020044. [Google Scholar] [CrossRef]
  4. Heins, E.; Bienen, B.; Randolph, M.F.; Grabe, J. Effect of installation method on static and dynamic load test response for piles in sand. Int. J. Phys. Model. Geotech. 2020, 20, 1–23. [Google Scholar] [CrossRef]
  5. Engin, H.K. Modelling Pile Installation Effects: A Numerical Approach. Ph.D. Thesis, The Hong Kong Polytechnic University, Hong Kong, 2013. [Google Scholar] [CrossRef]
  6. Dijkstra, J. On the Modelling of Pile Installation; Delft University of Technology: Delft, The Netherlands, 2009. [Google Scholar]
  7. Randolph, M.F. Science and empiricism in pile foundation design. Geotechnique 2003, 53, 847–874. [Google Scholar] [CrossRef]
  8. Broere, W.; van Tol, A.F. Modelling the bearing capacity of displacement piles in sand. Proc. Inst. Civil Eng.-Geotech. Eng. 2006, 159, 195–206. [Google Scholar] [CrossRef]
  9. Krasinski, A. Numerical simulation of screw displacement pile interaction with non-cohesive soil. Arch. Civil Mech. Eng. 2014, 14, 122–133. [Google Scholar] [CrossRef]
  10. Mabsout, M.E.; Tassoulas, J.L. A finite element model for the simulation of pile driving. Int. J. Numer. Methods Eng. 1994, 37, 257–278. [Google Scholar] [CrossRef]
  11. Qiu, G.; Henke, S.; Grabe, J. Application of a Coupled Eulerian-Lagrangian approach on geomechanical problems involving large deformations. Comp. Geotech. 2011, 38, 30–39. [Google Scholar] [CrossRef]
  12. Konkol, J.; Balachowski, L. Influence of Installation Effects on Pile Bearing Capacity in Cohesive Soils—Large Deformation Analysis Via Finite Element Method. Studia Geotech. Mech 2017, 39, 27–38. [Google Scholar] [CrossRef] [Green Version]
  13. Wang, J.; Gadala, M.S. Formulation and survey of ALE method in nonlinear solid mechanics. Finite Elem. Anal. Design 1997, 24, 253–269. [Google Scholar] [CrossRef]
  14. Bigler, J.; Guilkey, J.; Gribble, C.P.; Hansen, C.D.; Parker, S.G. A Case Study: Visualizing Material Point Method Data. In Proceedings of the Eurographics/IEEE-VGTC Symposium on Visualization, Lisbon, Portugal, 8 May 2006; Ertl, T., Joy, K., Santos, B., Eds.; pp. 299–306. [Google Scholar] [CrossRef]
  15. Lobo-Guerrero, S.; Vallejo, L.E. DEM analysis of crushing around driven piles in granular materials. Geotechnique 2005, 55, 617–623. [Google Scholar] [CrossRef]
  16. Duan, N.; Cheng, Y.P.; Liu, J.W. DEM analysis of pile installation effect: Comparing a bored and a driven pile. Granular Matter 2018, 20, 36. [Google Scholar] [CrossRef] [Green Version]
  17. Fall, M.; Gao, Z.; Ndiaye, B.C. Driven Pile Effects on Nearby Cylindrical and Semi-Tapered Pile in Sandy Clay. Appl. Sci. 2021, 11, 2919. [Google Scholar] [CrossRef]
  18. Jayasinghe, L.B.; Waldmann, D.; Shang, J. Impact of Pile Punching on Adjacent Piles: Insights from a 3D Coupled SPH-FEM Analysis. Appl. Mech. 2020, 1, 47–58. [Google Scholar] [CrossRef] [Green Version]
  19. Fragassa, C.; Topalovic, M.; Pavlovic, A.; Vulovic, S. Dealing with the Effect of Air in Fluid Structure Interaction by Coupled SPH-FEM Methods. Materials 2019, 12, 1162. [Google Scholar] [CrossRef] [Green Version]
  20. Matsumoto, T.; Matsuzawa, K.; Kitiyodom, P. A role of pile load test—Pile load test as element test for design of foundation system. In The Application of Stress-Wave Theory to Piles: Science, Technology and Practice: Proceedings of the 8th International Conference, Lisbon, Portugal, 8–10 September 2008; dos Santos, A.J., Ed.; IOS Press, Cop.: Amsterdam, the Netherlands, 2008; pp. 39–58. [Google Scholar]
  21. Osterberg, J.O. The Osterberg load test method for bored and driven piles the first ten years. In Proceedings of the 7th International Conference and Exhibition on Piling and Deep Foundations, Vienna, Austria, 15–17 June 1998; pp. 1–28. [Google Scholar]
  22. Dai, G.L.; Gong, W.M.; Zhao, X.L.; Zhou, X.Q. Static Testing of Pile-Base Post-Grouting Piles of the Suramadu Bridge. Geotech. Test. J. 2011, 34, 34–49. [Google Scholar]
  23. Hayden, M. Pile HAY-Proof-System: New Test Method for Static Load Tests of Slender Piles. Ground Eng. 2013, 12, 25–28. [Google Scholar]
  24. Mišove, P.; Velič, P. (Projekt Zaťažovacej Skúšky Pilóty Systémom VUIS-P). Private communication, 2010. [Google Scholar]
  25. Berisavljević, D.; Filipović, V.; Stanisavljević, N.; Berisavljević, Z. Experimental analysis of bi-directional pile static load test. ce/papers 2018, 2, 415–420. [Google Scholar] [CrossRef]
  26. Rybak, J.; Baca, M.; Żyrek, T. Practical Aspects of Tubular Pile Axial Capacity Testing. In Proceeding of the 15th International Multidisciplinary Scientific GeoConference, SGEM 2015: Science and Technologies in Geology, Exploration and Mining: Conference proceedings, Albena, Bulgaria, 18–24 June 2015; Volume 2, pp. 549–554. [Google Scholar]
  27. Baca, M.; Rybak, J.; Tamrazyan, A.G.; Żyrek, T. Pile Foot Capacity Testing In Various Cases of Pile Shaft Displacement. In Proceeding of the 16th International Multidisciplinary Scientific GeoConference SGEM 2016: Science and Technologies in Geology, Exploration and Mining: Conference Proceedings, Albena, Bulgaria, 30 June–6 July 2016; Volume 1, pp. 945–950. [Google Scholar]
  28. Majcher-Pisarska, M.; Stelmach, K.; Szczurek, W.J. (Geotechnical Documentation Specifying Groundwater Conditions at the Test Plot in Bojszowy Nowe). Private communication, 2012. (in Polish). [Google Scholar]
  29. Muszyński, Z.; Rybak, J. Application of Geodetic Measuring Methods for Reliable Evaluation of Static Load Test Results of Foundation Piles. Remote Sens. 2021, 13, 3082. [Google Scholar] [CrossRef]
  30. Muszyński, Z.; Rybak, J.; Kaczor, P. Accuracy Assessment of Semi-Automatic Measuring Techniques Applied to Displacement Control in Self-Balanced Pile Capacity Testing Appliance. Sensors 2018, 18, 4067. [Google Scholar] [CrossRef] [PubMed] [Green Version]
  31. De Borst, R.; Vermeer, P. Finite element analysis of static penetration tests. Géotechnique 1984, 34, 199–210. [Google Scholar] [CrossRef]
  32. Wehnert, M.; Vermeer, P. Numerical analyses of load tests on bored piles. In Proceedings of the Numer. Methods Geomechan. NUMOG 9th, Ottawa, ON, Canada, 25–27 August 2004; pp. 505–511. [Google Scholar]
  33. Brinkgreve, R.; Vermeer, P. Plaxis manual. Version 1998, 7, 5.1–5.18. Available online: https://www.civil.iitb.ac.in/~ajuneja/Plaxis%20program/Version%208%20Introductory/Manuals/English/V84-4_MaterialModels.pdf (accessed on 10 December 2021).
  34. Schanz, T.; Vermeer, P.A.; Bonnier, P.G. The hardening soil model: Formulation and verification. In Beyond 2000 in Computational Geotechnics: 10 Years of Plaxis International; Routledge: Abingdon, UK, 1999; pp. 281–296. [Google Scholar]
  35. Truty, A.; Obrzud, R. The Hardening Soil Model a Practical Guidebook; Zace Services Ltd., Software Engineering: Lausanne, Switzerland, 2011. [Google Scholar]
  36. Paik, K.; Salgado, R.; Lee, J.; Kim, B. Behavior of open- and closed-ended piles driven into sands. J. Geotech. Geoenviron. Eng. 2003, 129, 296–306. [Google Scholar] [CrossRef]
  37. Altaee, A.; Fellenius, B.; Evgin, E. Axial load transfer for piles in sand. I. Tests on an instrumented precast pile. Can. Geotech. J. 1992, 29, 11–20. [Google Scholar] [CrossRef] [Green Version]
  38. Wang, Y.; Liu, X.; Sang, S.; Zhang, M.; Wang, P. A Model Test for the Influence of Lateral Pressure on Vertical Bearing Characteristics in Pile Jacking Process Based on Optical Sensors. Sensors 2020, 20, 1733. [Google Scholar] [CrossRef] [Green Version]
  39. Muszyński, Z.; Wyjadłowski, M. Assessment of the shear strength of pile-to-soil interfaces based on pile surface topography using laser scanning. Sensors 2019, 1, 1012. [Google Scholar] [CrossRef] [PubMed] [Green Version]
  40. White, D.J.; Lehane, B.M. Friction fatigue on displacement piles in sand. Geotechnique 2004, 54, 645–658. [Google Scholar] [CrossRef]
  41. Phuong, N.T.V.; van Tol, A.F.; Elkadi, A.S.K.; Rohe, A. Numerical investigation of pile installation effects in sand using material point method. Comp. Geotech. 2016, 73, 58–71. [Google Scholar] [CrossRef]
  42. Phuong, N.T.V.; van Tol, A.F.; Elkadi, A.S.K.; Rohe, A. Modelling of pile installation using the material point method (MPM). In Proceedings of the 8th European Conference on Numerical Methods in Geotechnical Engineering (NUMGE), Delft, The Netherslands, 18–20 June 2014; Hicks, M., Brinkgreve, R., Rohe, A., Eds.; pp. 271–276. [Google Scholar]
  43. Tehrani, F.S.; Nguyen, P.; Brinkgreve, R.B.J.; van Tol, A.F. Comparison of Press-Replace Method and Material Point Method for analysis of jacked piles. Comp. Geotech. 2016, 78, 38–53. [Google Scholar] [CrossRef] [Green Version]
  44. Monforte, L.; Arroyo, M.; Carbonell, J.M.; Gens, A. Coupled effective stress analysis of insertion problems in geotechnics with the Particle Finite Element Method. Comp. Geotech. 2018, 101, 114–129. [Google Scholar] [CrossRef]
  45. Gavin, K.G.; Igoe, D.J.P.; Kirwan, L. The effect of ageing on the axial capacity of piles in sand. Proc. Inst. Civil Eng.-Geotech. Eng. 2013, 166, 122–130. [Google Scholar] [CrossRef]
Figure 1. Subsequent stages of research for both field and numerical studies; (a) full load applied to the outer pipe, (b) load applied to the pile base, (c) bi-directional static load test.
Energies 14 08598 g001
Figure 2. Geotechnical profile with the location of pile embedment for two phases of the survey Stage 1. Pile embedded to the depth of 6.5 m. Stage 2. Pile embedded to the depth of 0 m.
Energies 14 08598 g002
Figure 3. Bi-directional static load test at a pile base depth of 6.5 m (a) and 8.0 m (b).
Energies 14 08598 g003
Figure 4. Test stand for traditional static load test and pile bottom capacity test (through inner pipe).
Energies 14 08598 g004
Figure 5. Static load test with load applied to the outer pipe (a) and inner pipe (b).
Energies 14 08598 g005
Figure 6. Calculation area with finite element mesh and boundary conditions.
Energies 14 08598 g006
Figure 7. Load application scheme for (a) entire pile static load test (b) base static load test (c) bi-directional test.
Energies 14 08598 g007
Figure 8. Radial displacement of soil as pile installation process (description in text).
Energies 14 08598 g008
Figure 9. Modelling methods for pile installation at the base; (a) simplest-rectangular, (b) triangular, (c) polygonal.
Energies 14 08598 g009
Figure 10. Comparison of the results of field test and numerical simulations of the pile base for different approaches of modelling of the pile installation.
Energies 14 08598 g010
Figure 11. Comparison of the results of field tests and numerical simulations for the entire pile for different values of the R parameter.
Energies 14 08598 g011
Figure 12. Vertical displacements for the installation phase of a pile in a stratified medium.
Energies 14 08598 g012
Figure 13. Volumetric deformation in a stratified soil (%).
Energies 14 08598 g013
Figure 14. Comparison of results of field bi-directional test and numerical simulations with and without installation modelling for a pile embedded up to 6.5 m.
Energies 14 08598 g014
Figure 15. Comparison of results of field test and numerical simulations with and without installation modelling for a pile base embedded up to 8.0 m.
Energies 14 08598 g015
Figure 16. Comparison of results of field test and numerical simulations with and without installation modelling for a pile base embedded up to 8.0 m.
Energies 14 08598 g016
Figure 17. Comparison of results of field test and numerical simulations with and without installation modelling for an entire pile embedded up to 8.0 m.
Energies 14 08598 g017
Table 1. Soil Parameters.
SoilSoil Layer
Location
CPTU Tip
Resistance
Shear Strength ParametersIDILEoed
SymbolNameTopBottomqcφ’C’Cu
--mmMPaOkPakPa--MPa
HHumus0.00.23.029.8--0.30-12.1
FSaFine Sand0.20.83.530.5--0.35-15.4
MSaMedium Sand0.82.412.836.0--0.75-63.8
OrOrganic2.43.30.818.05.040.0-0.323.4
siClSilty Clay3.34.21.119.210.069.0-0.448.6
MSaMedium Sand4.25.810.734.7--0.60-53.1
MSaMedium Sand5.88.18.032.7--0.45-35.5
MSaMedium Sand8.110.018.636.2--0.75-92.2
ID—relative soil density, IL—relative soil plasticity, Eoed—oedometer loading stiffness.
Table 2. Hardening Soil model parameters.
LPSoilγφψcEoedrefσoedrefK0NCmE50refEurref
kN/m3ookPaMPakPa--MPaMPa
1-18.529.80.0112.150.50.59118.254.5
2FSa16.630.50.5115.4100.50.59123.470.2
3MSa17.736.06.0163.8200.40.46696.4289.3
4Or16.718.00.053.4300.71.0004.914.8
5siCl19.119.20.0168.6400.70.85012.136.2
6MSa17.734.74.7153.1600.40.51381.7245.2
7MSa17.732.72.7135.5800.50.55954.8164.3
8MSa17.736.26.2192.21100.40.466139.7419.1
γ—unit weight, φ—friction angle, ψ—angle of dilatancy, c—cohesion, K0NC—coefficient of lateral earth pressure for a normally consolidated stress state, σoedref—reference confining pressure, m—power in stress-dependent relation, Eoedref—reference oedometer loading stiffness, E50ref—reference triaxial loading stiffness, Eurref—reference triaxial unloading stiffness.
Table 3. Parameters of beam elements in the numerical model.
EAEIwν
kN/mkNm2/mkN/m/m-
pipe1.05 × 1072187.53.90.3
pile shoe6.30 × 1074.30 × 1057.70.3
EA—axial stiffness, EI—bending stiffness, w—weight of beam element, ν—Poisson’s ratio.
Publisher’s Note: MDPI stays neutral with regard to jurisdictional claims in published maps and institutional affiliations.

