
Blockchain-Enabled Energy Demand Side Management Cap and Trade Model


Abstract
:1. Introduction
2. Related Works
3. Blockchain and Smart Contracts
3.1. Blockchain Technology
- −
- Decentralized problems
- −
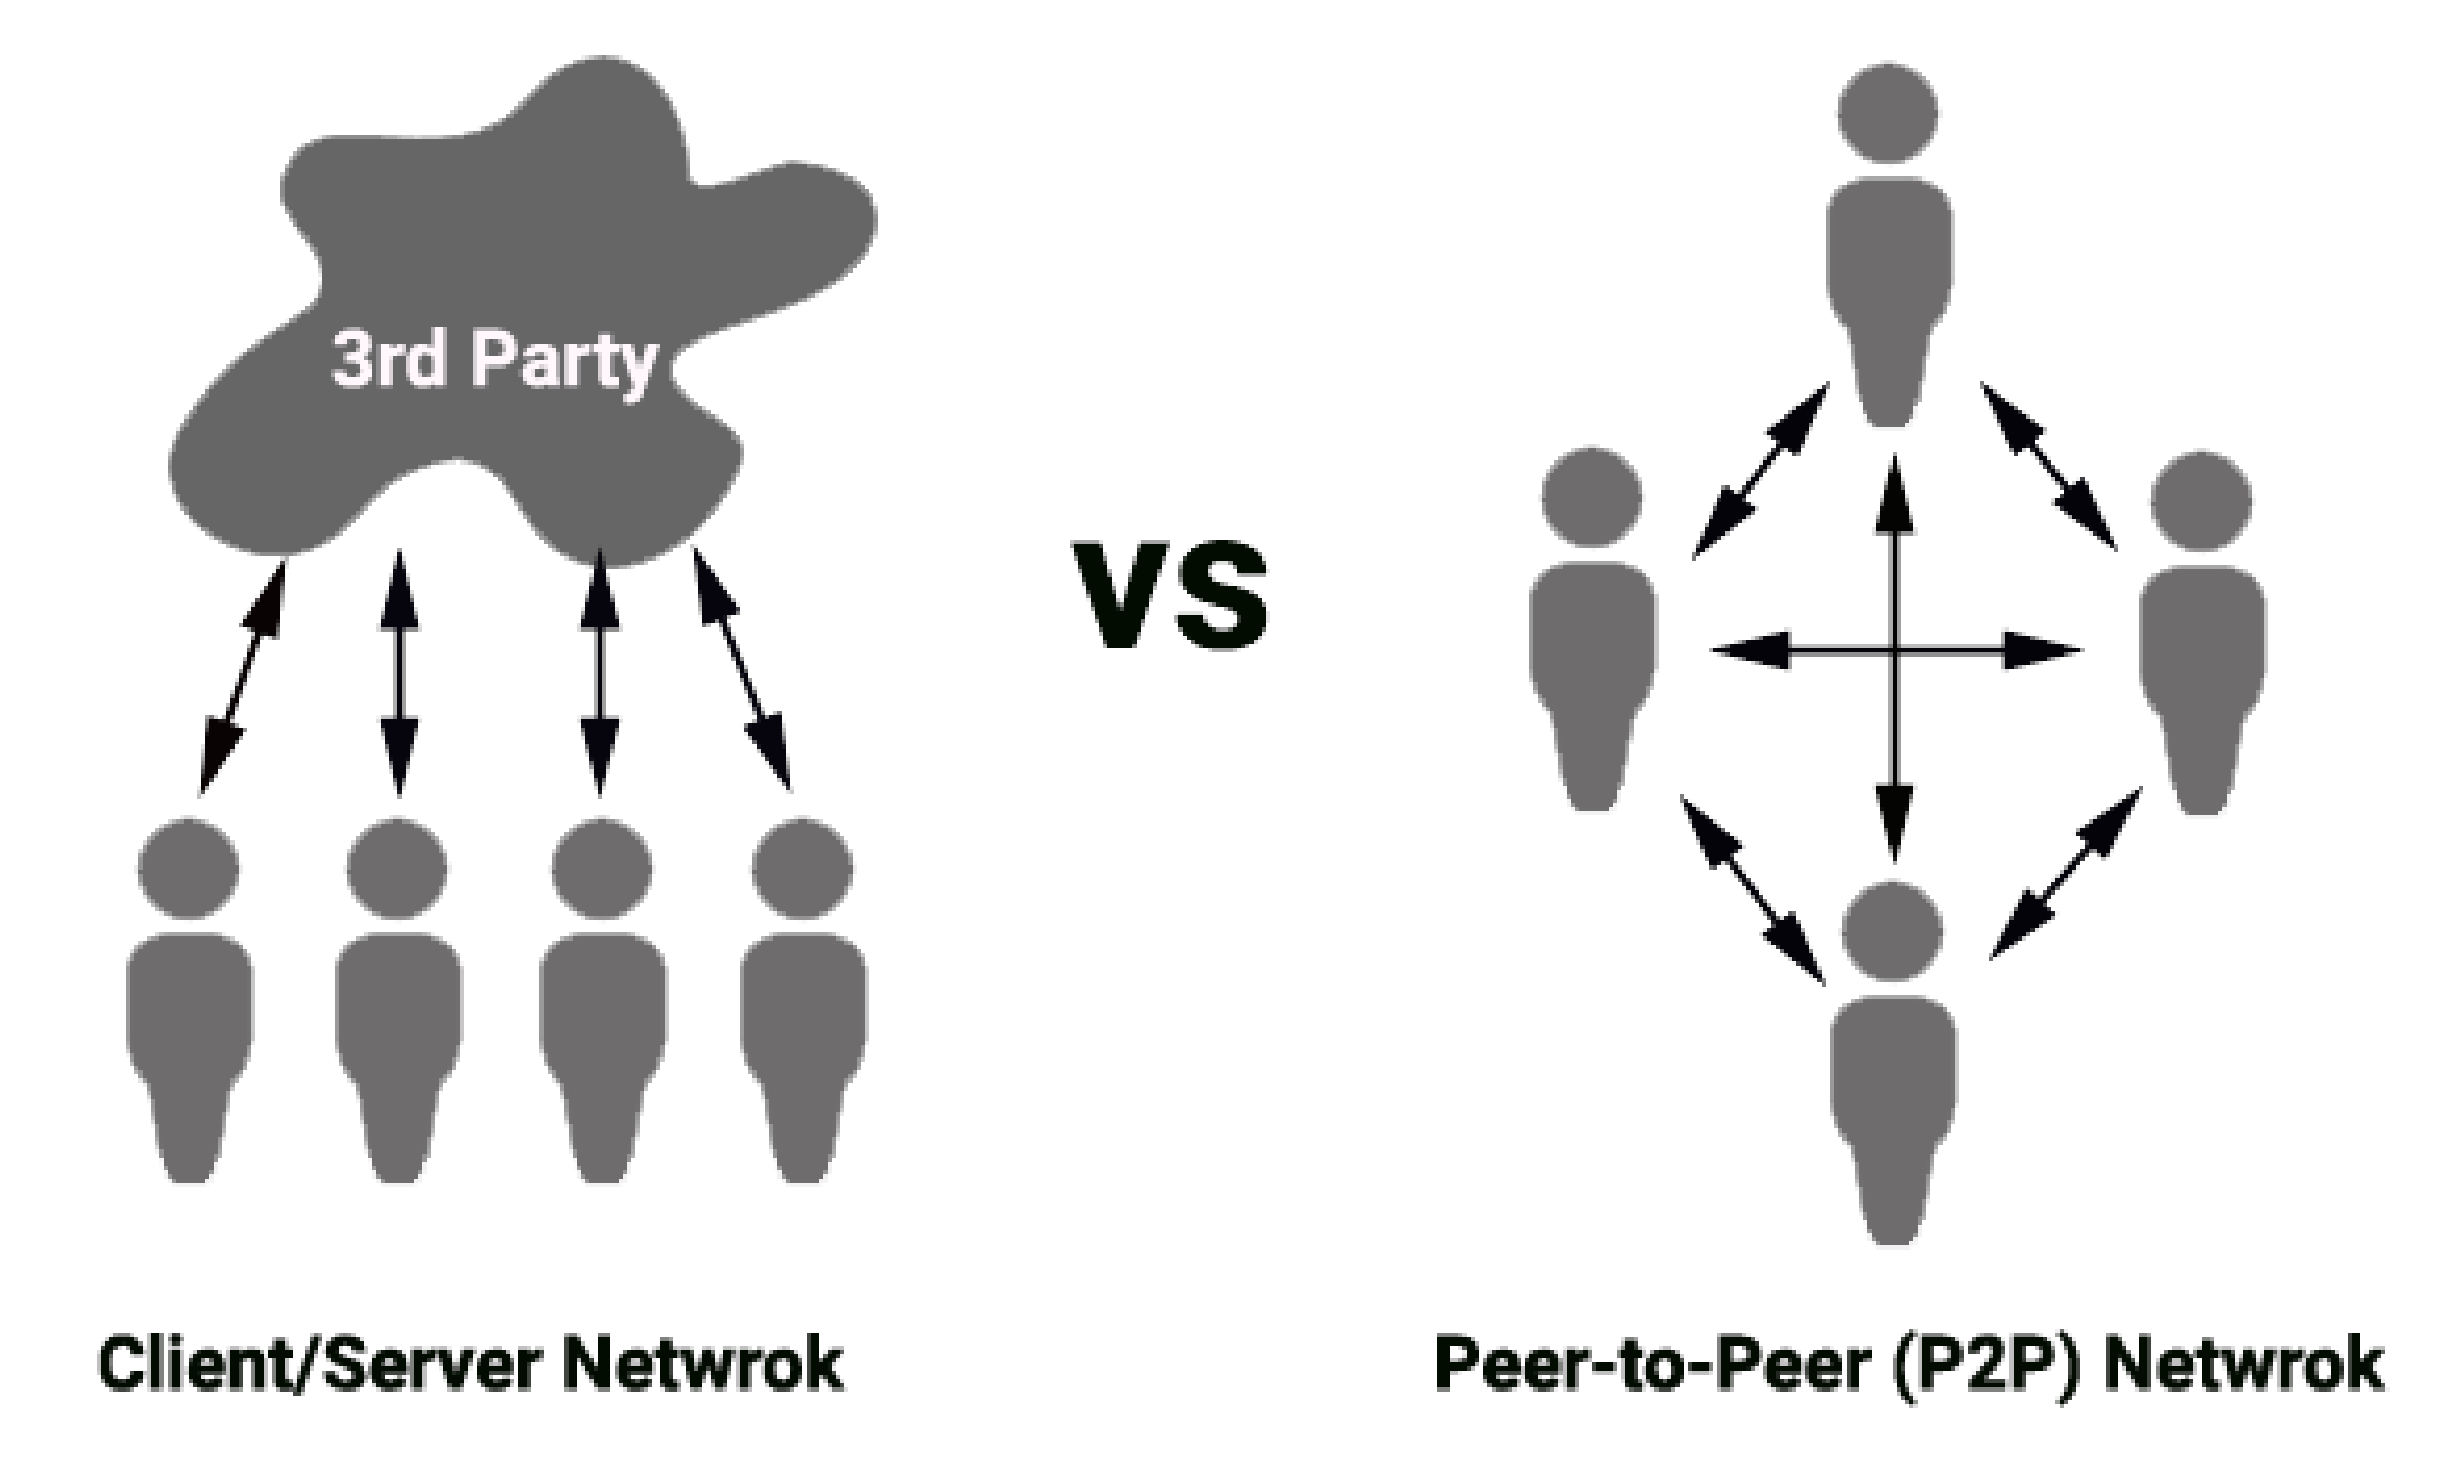
- Peer-to-peer transactions
- −
- Beyond boundaries of trust among unknown peers
- −
- Require validation, verification, and recording of a time-stamped immutable ledger
- −
- Autonomous operations guided by a rule structure and policies
3.2. What Is a Smart Contract?
- −
- Smart contracts are cryptographically secured, immutable, and enforced.
- −
- Smart contracts are fast and inexpensive.
- −
- They offer a multi-sig feature, which means that transactions are executed only when all approvals or signatures are provided.
- −
- They are capable of managing agreements between users without human interruption.
- −
- They may serve as part of other contracts (similar to how a software library works). Smart contracts can run independently and can automatically interact with other smart contracts.
- −
- They store information, such as records, prices, energy consumption, etc., generated by the smart contract itself, fed by another smart contract or an outside oracle.
4. Blockchain-Enabled Energy Cap and Trade DSM Mechanism
4.1. Concept
| Algorithm 1 Energy Cap and Trade |
| 1: Initiate algorithm at time t 2: If t = end of billing period then 3: 4: 5: 6: Goto 1 7: Else Goto 9 8: end if 9: If User = Seller then Step 1: Seller Registration 10: Check if Seller Smart Meter is registered 11: Seller set 12: Offer is stored in matrix: 13: Arrange matrix R from lowest to highest 14: End Seller Registration 15: Else Step 2: Buyer Registration 16: Check if Buyer Smart Meter is registered 17: Seller set 18: Initialize 19: then 20: 21: Goto 2 22: Else 23: then 24: then 24: Buy from Seller the quantity 25: 26: 27: Goto 2 28: Else 29: Buy from Seller the quantity 30: 31: 32: 33: Goto 19 34: end if 35: Else 36: 33: Goto 19 34: end if End Seller Registration 35: end if 36: 21: Goto 2 |
4.2. System Architecture and Functionality
- −
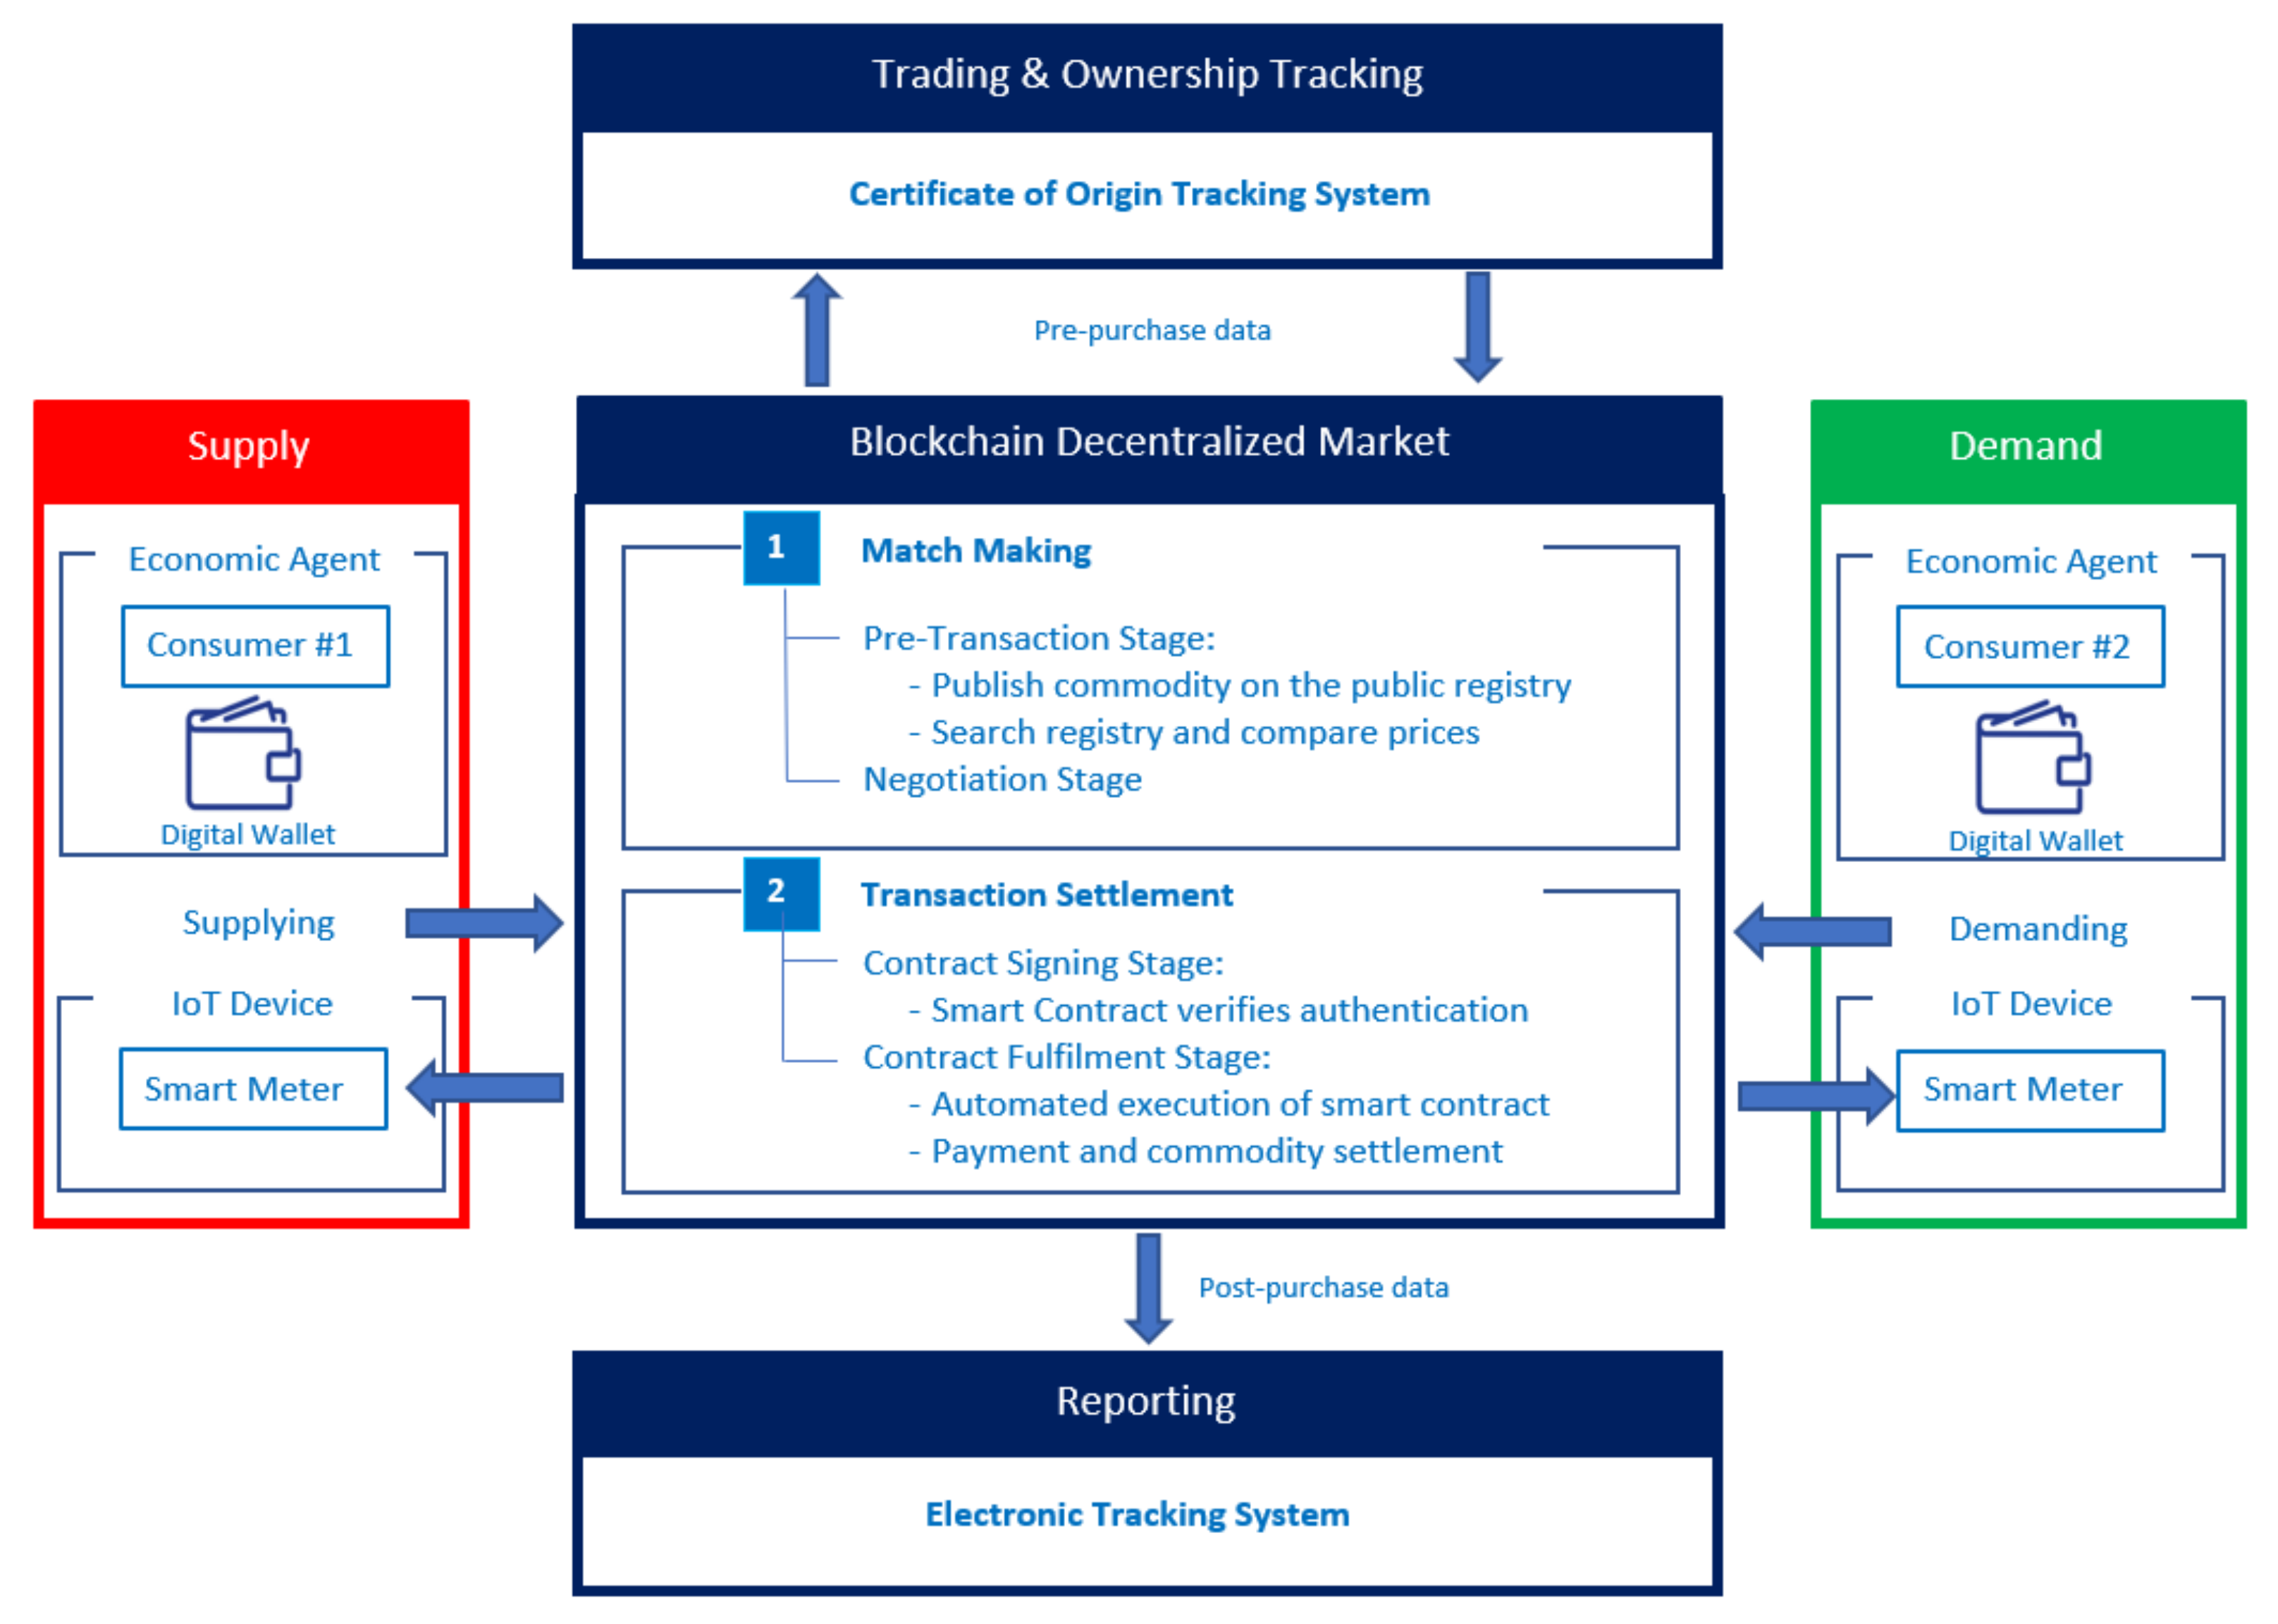
- Data collection is provided by IoT devices connected to Smart Meters
- −
- Smart contracts manage the processing and storage of data on the blockchain network in an autonomous way
- −
- Transactions between selsumers and pursumers are conducted in near real-time using smart contracts and via the Dapp itself.
- −
- Data is recorded and encrypted using cryptography, guaranteeing its immutability and authenticity.
- −
- Smart Contracts automate and ensure that all system functionalities, i.e., billing, trading, and reporting, are carried out correctly without the risk of human error.
5. Case Study
5.1. Selected Model
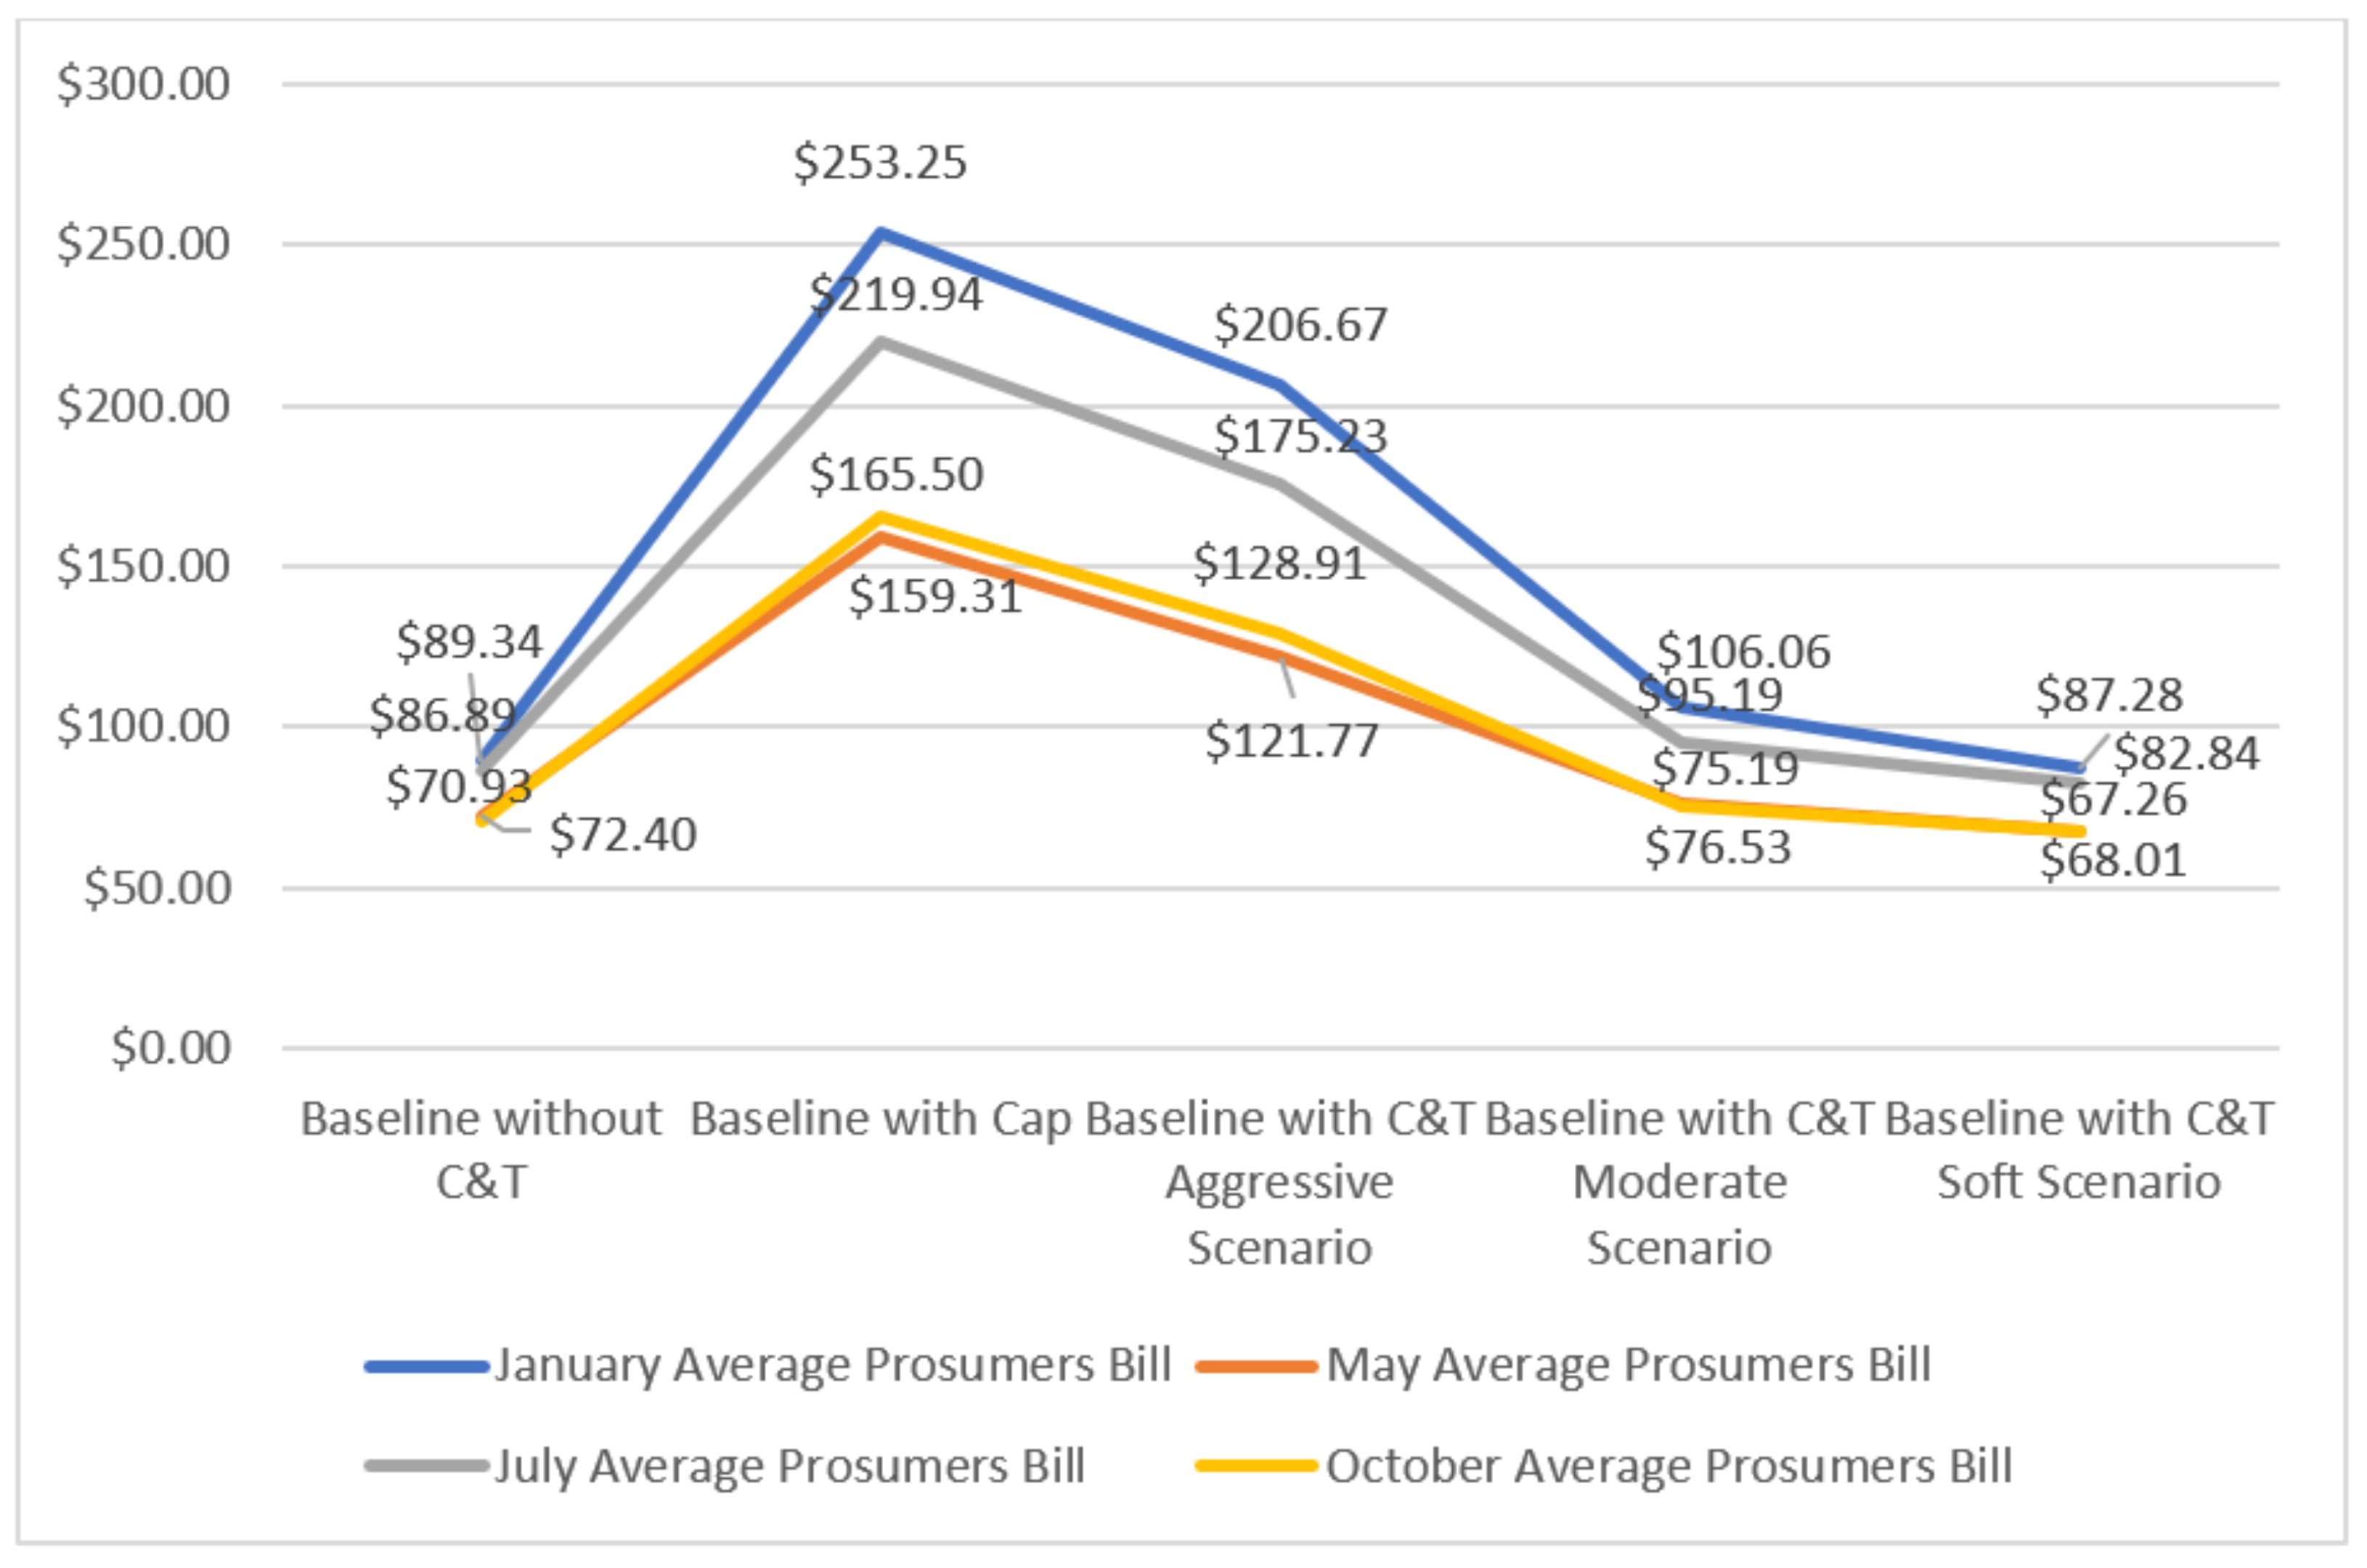
- −
- The variation of the consumer’s monthly electricity bill between the baseline period and under the cap-and-trade DSM program
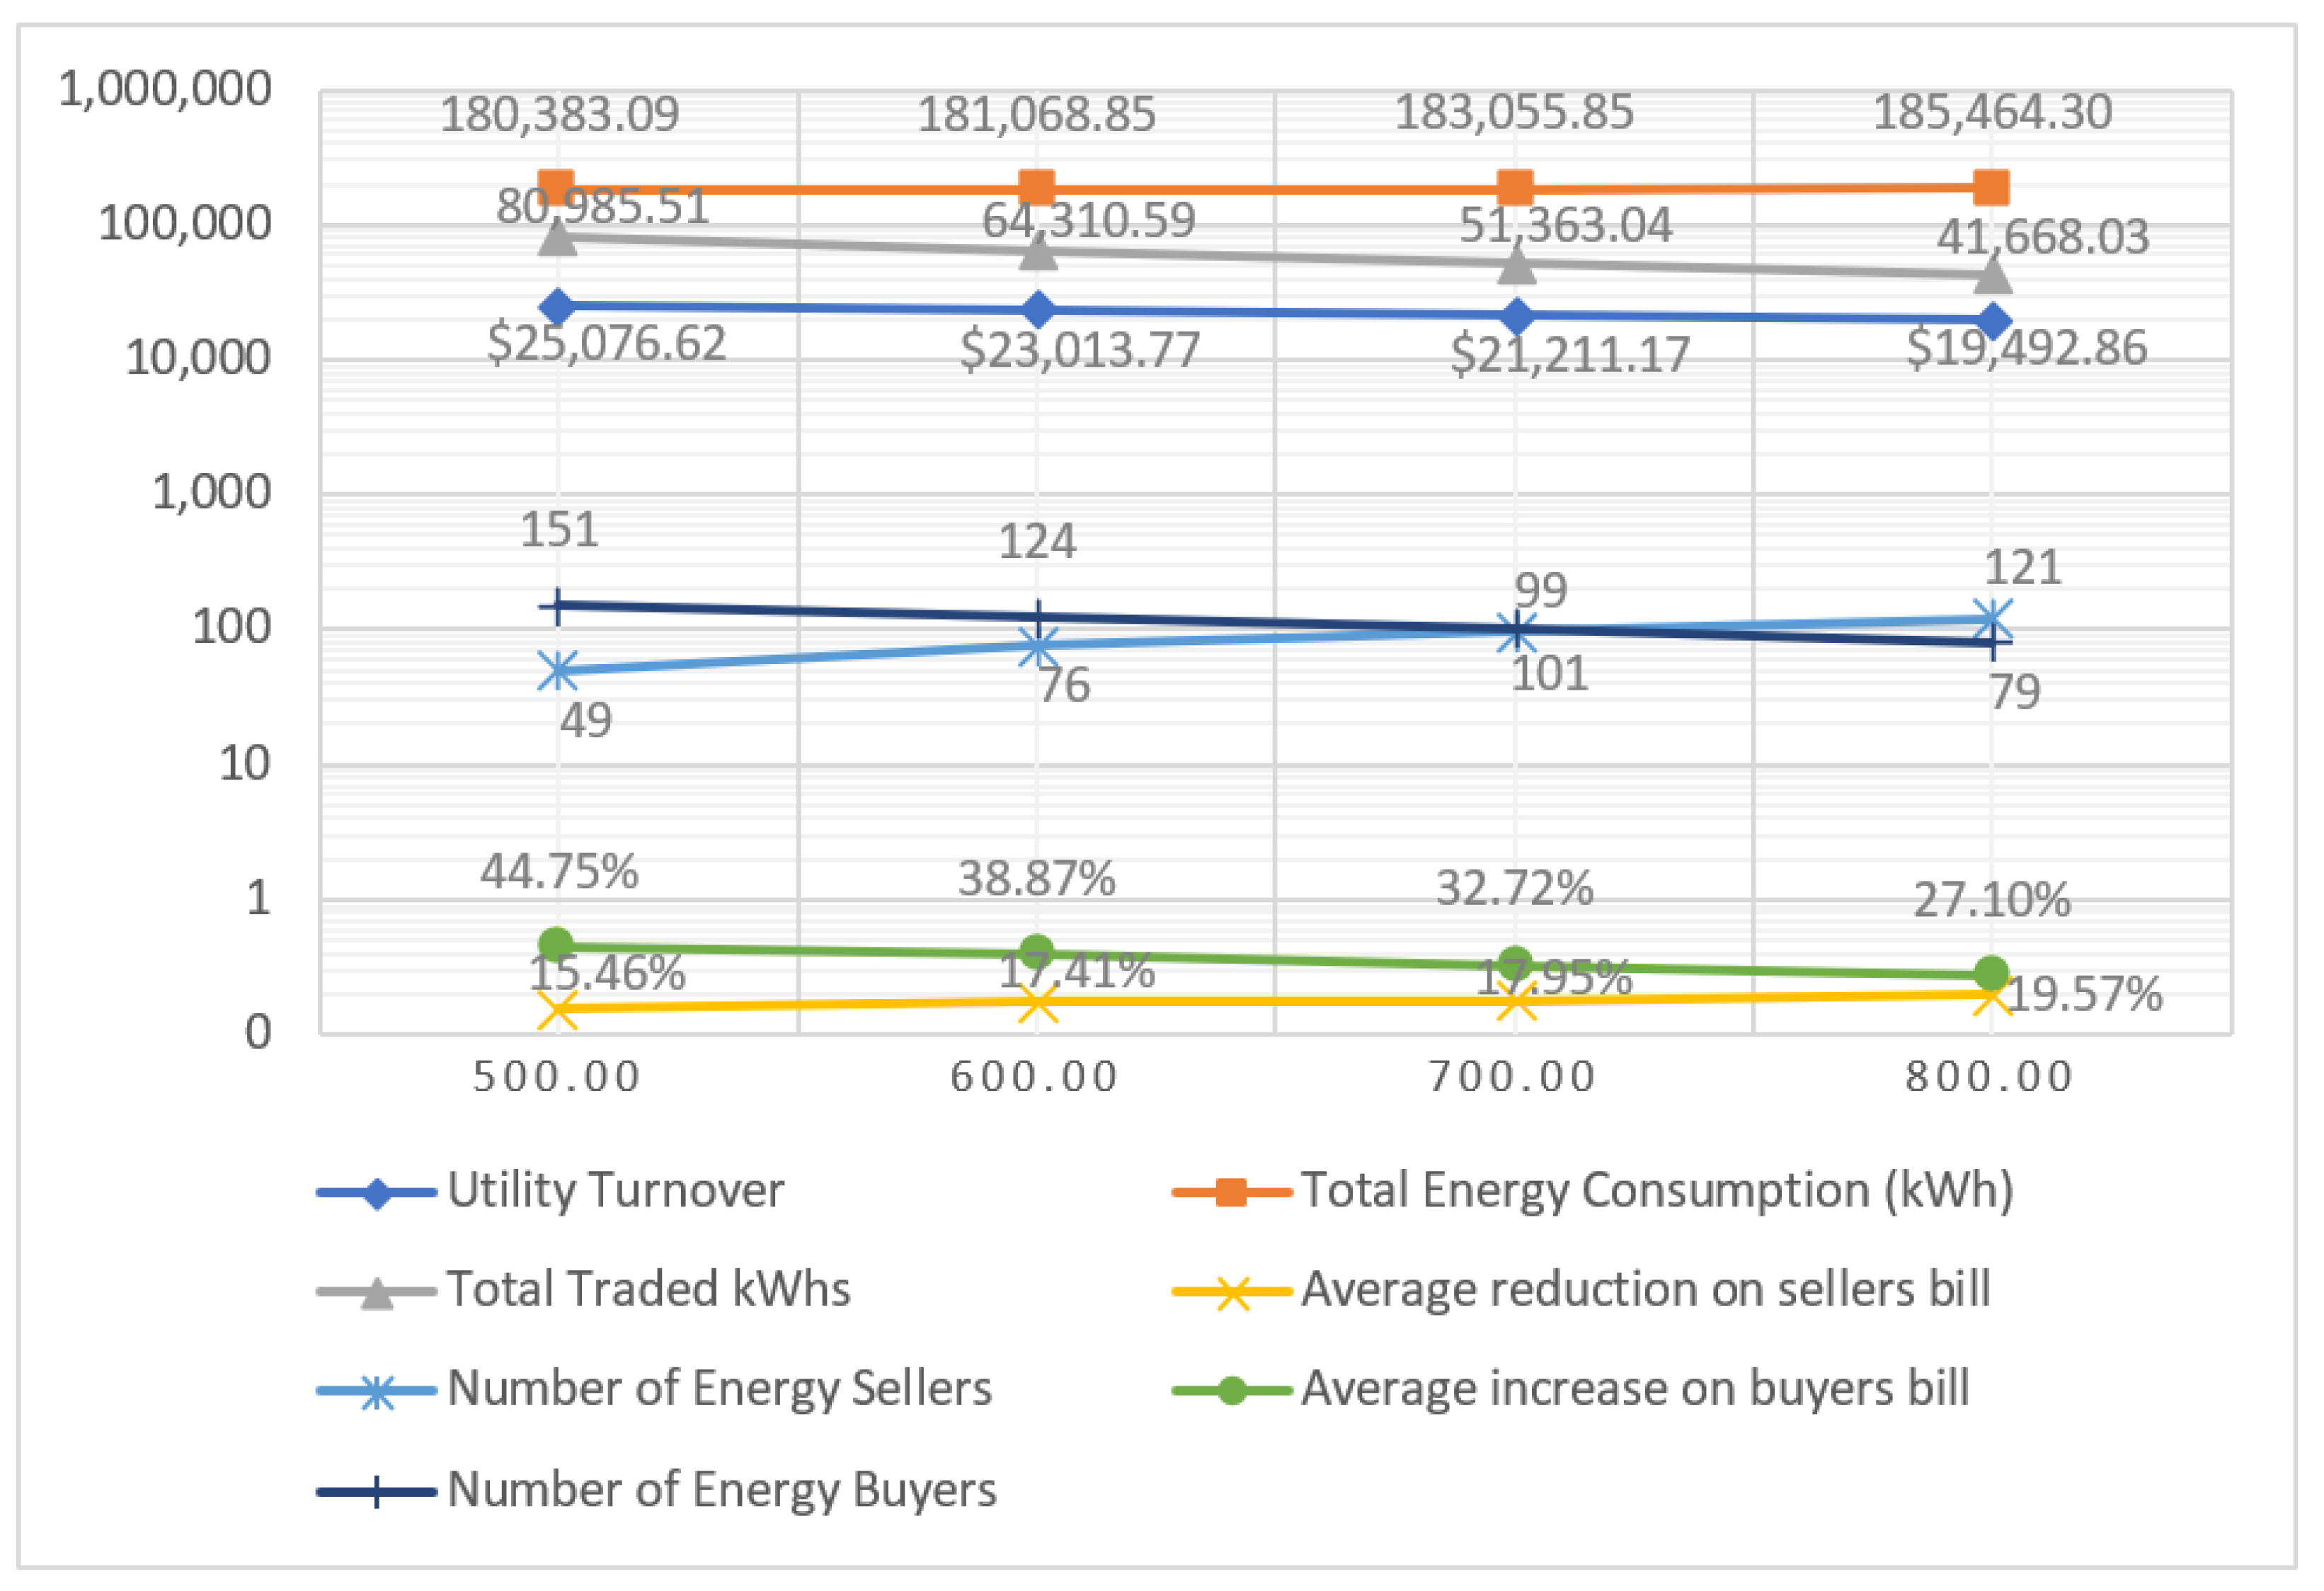
- −
- The variation of the total consumed monthly electric energy of the 200 households between the baseline period and under the cap-and-trade DSM program
- −
- The variation of the total collected monthly electric bills by the utility between the baseline period and under the cap-and-trade DSM program
5.2. Energy Cap and Trade Formulation
- set of all households
- set of time intervals
- : Population (in our case, the 200 households)
- : Household monthly electrical energy consumption in kWh
- : Defined electrical energy cap value in kWh
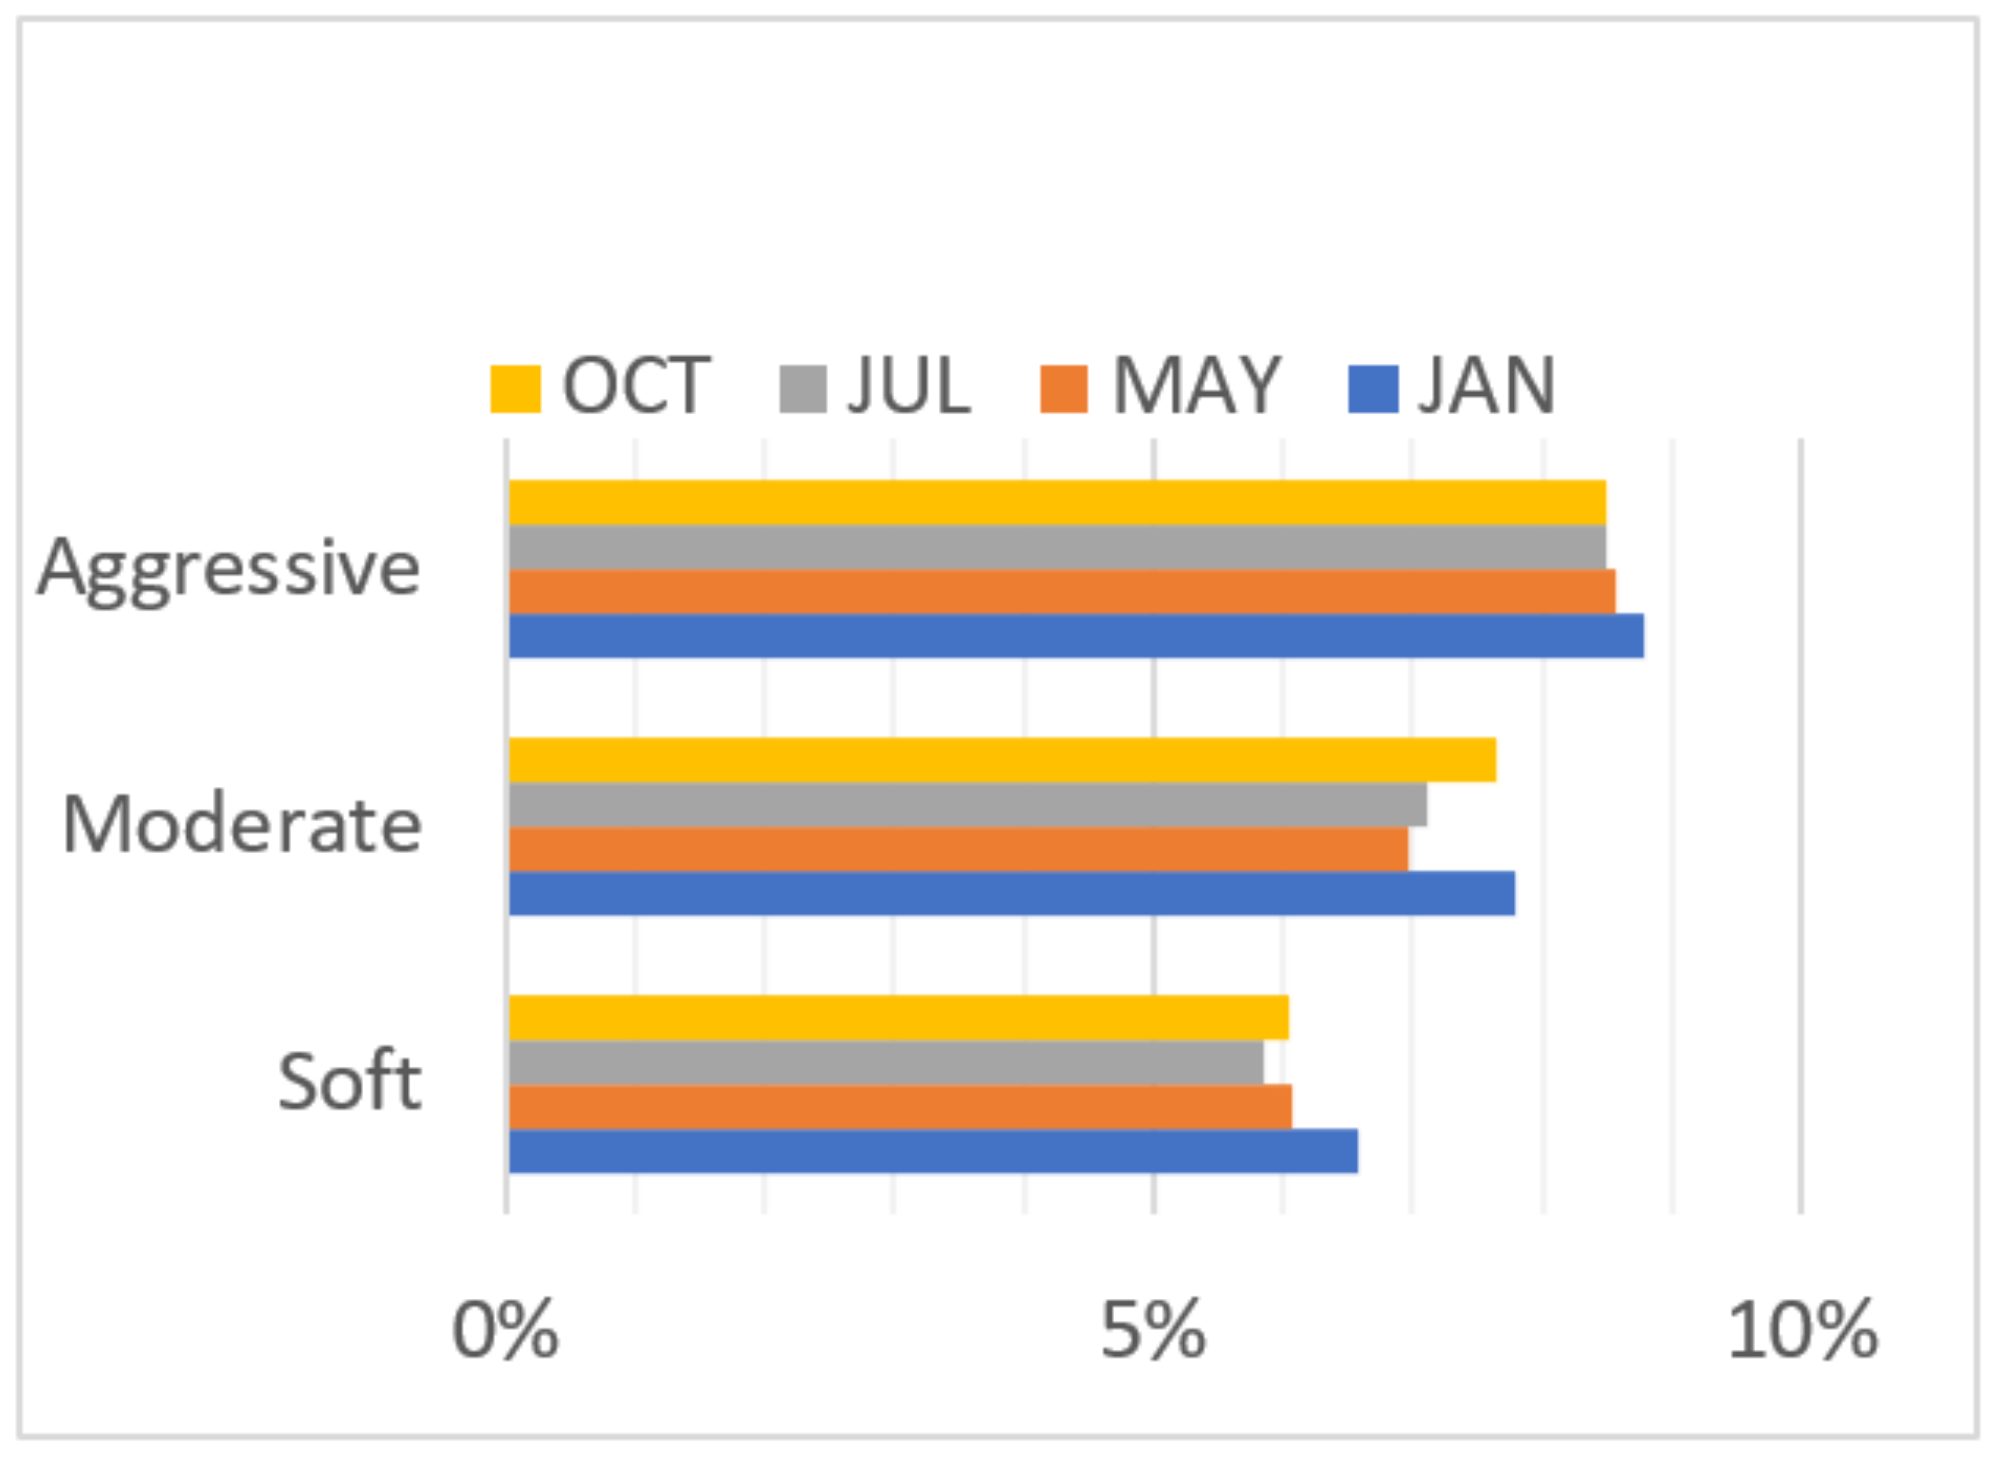
- : Percentage of households to respond to the new rate structure and reduce their monthly electrical energy consumption
- : Baseline total monthly electrical energy consumption of the population in kWh
- : Total monthly electrical energy consumption of the population in kWh after implementation of the Cap-and-Trade scheme
- : Percentage of monthly electrical energy reduction for each household
- : Total monthly electrical energy consumption reduction
- : Baseline total monthly electricity utility bill for household i
- : Total monthly electricity bill after implementation of the Cap-and-Trade scheme for household i
- : Utility electricity rate ($/kWh)
- : Rate for sold electrical energy tokens ($/kWh)
- : Rate for bought electrical energy tokens ($/kWh)
- : Total monthly electrical energy consumed by household i in kWh
- : Total monthly electrical energy sold by household i in kWh
- : Total monthly electrical energy bought by household i in kWh
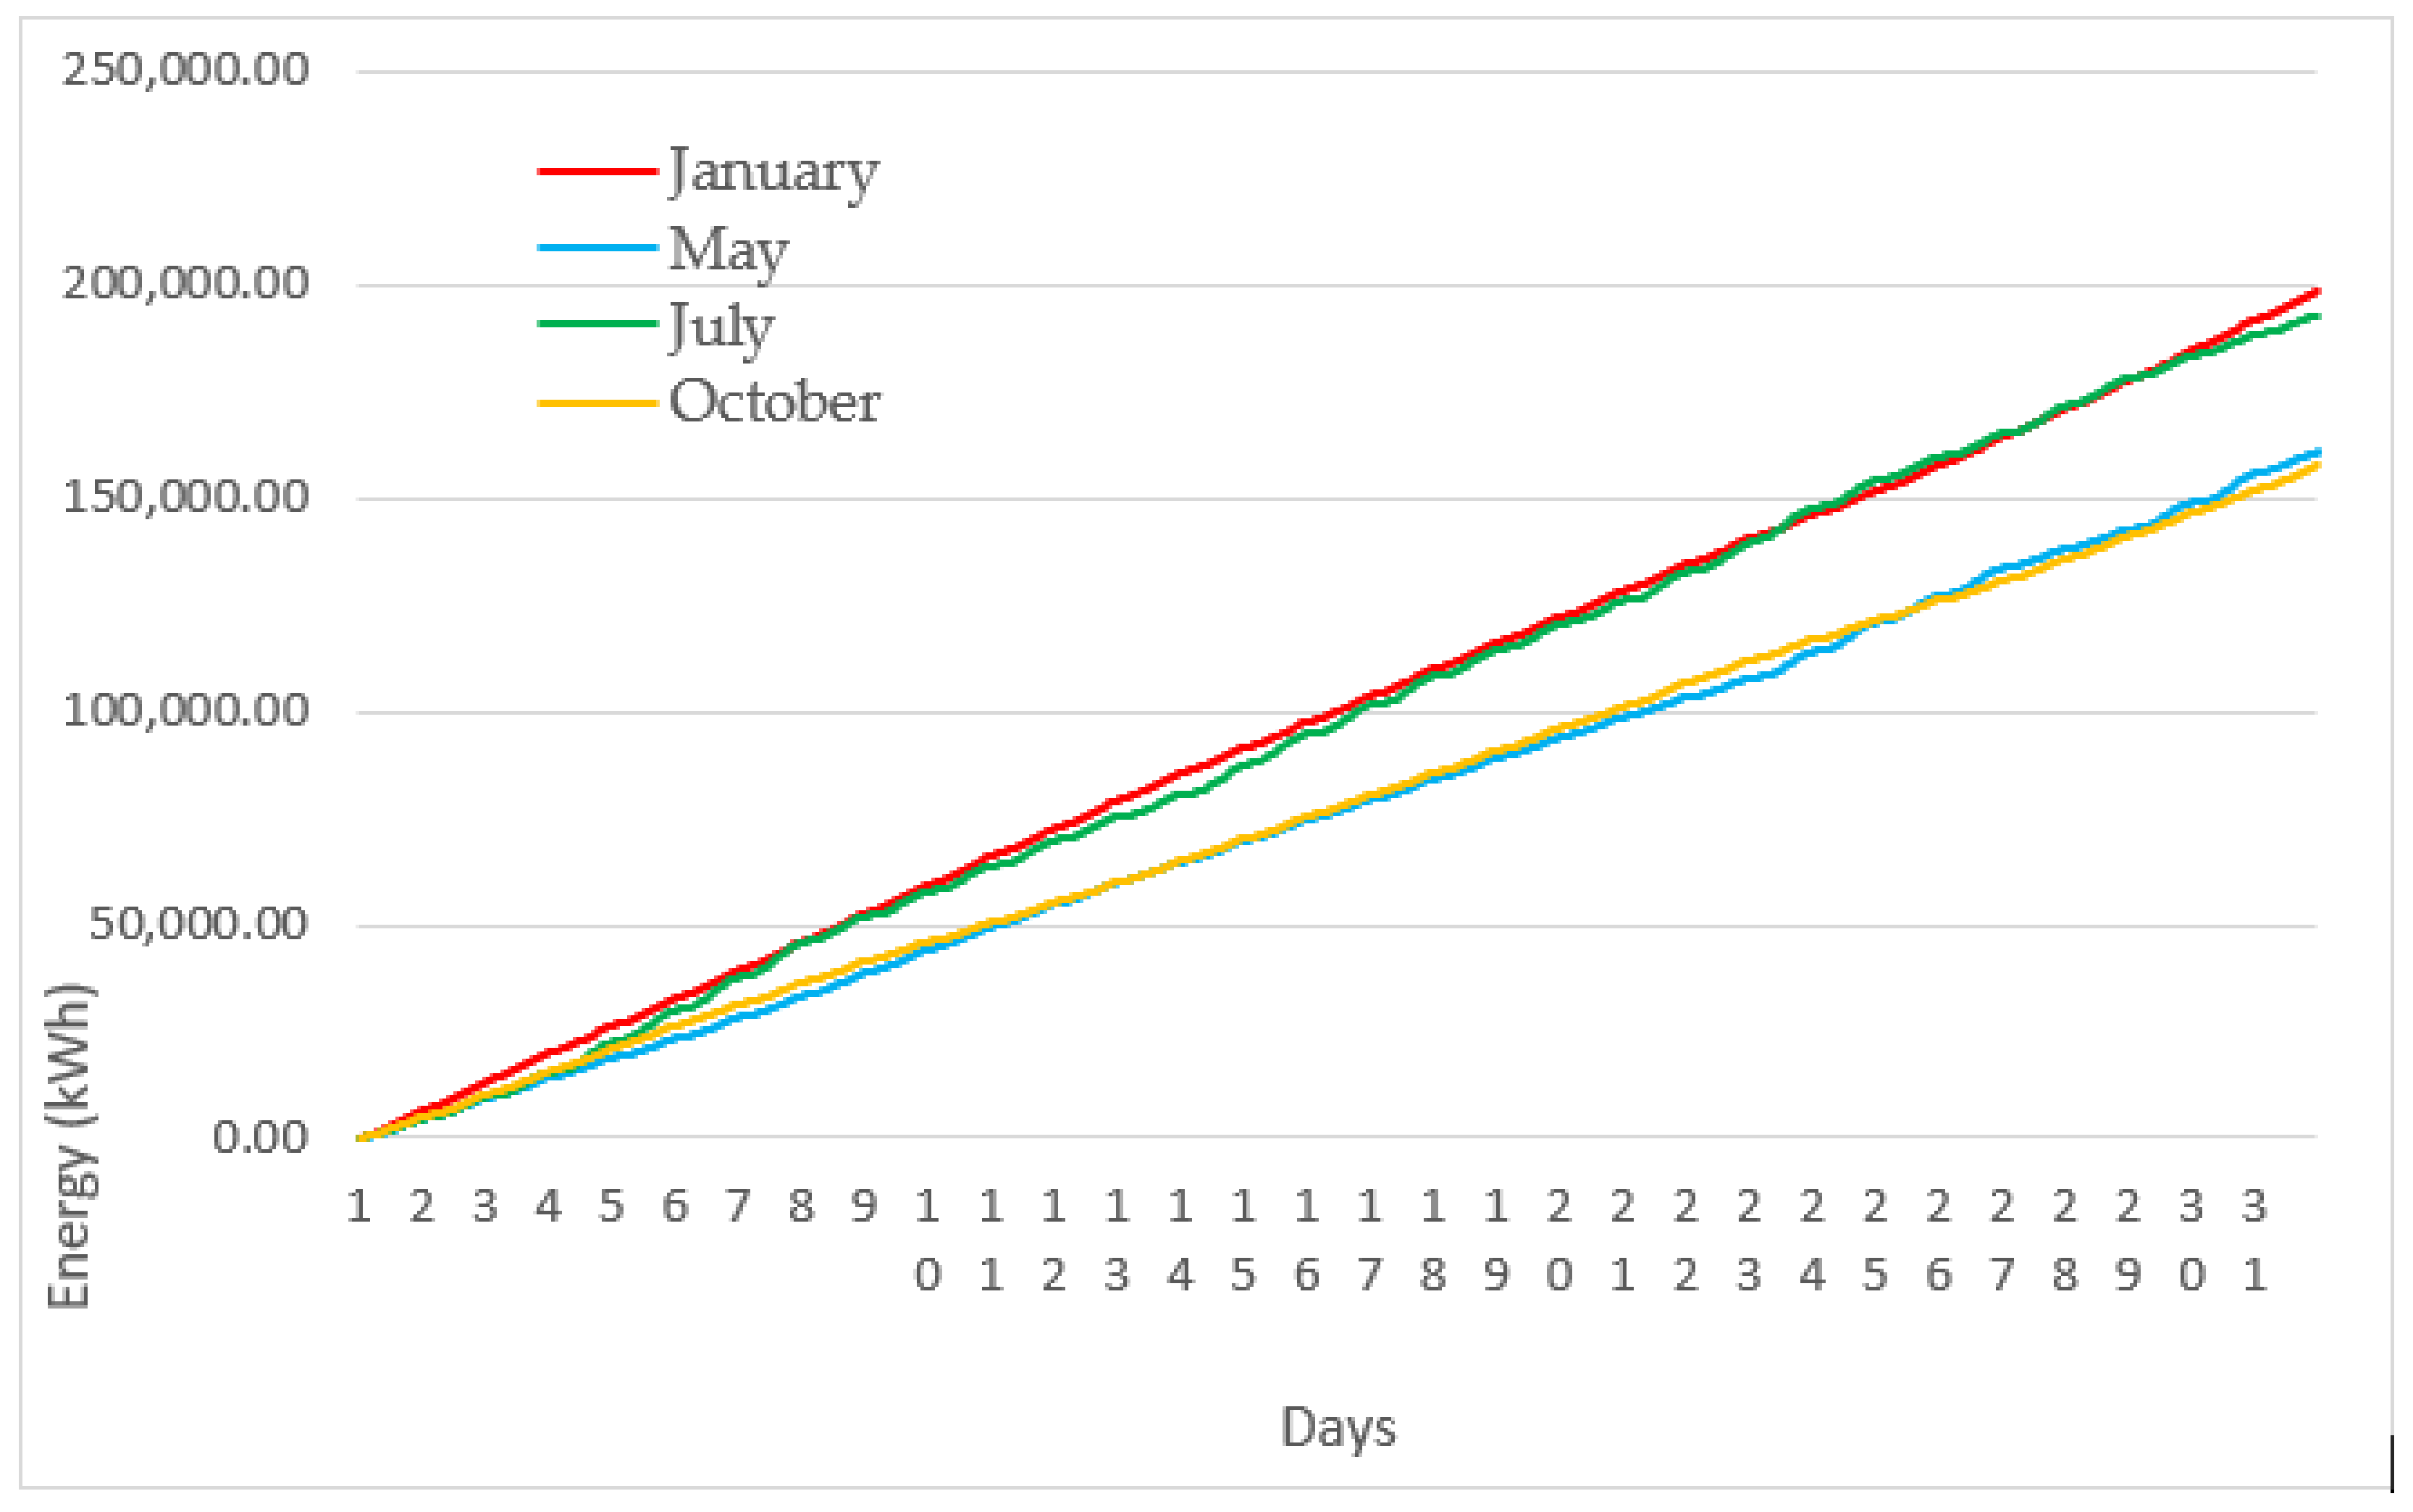
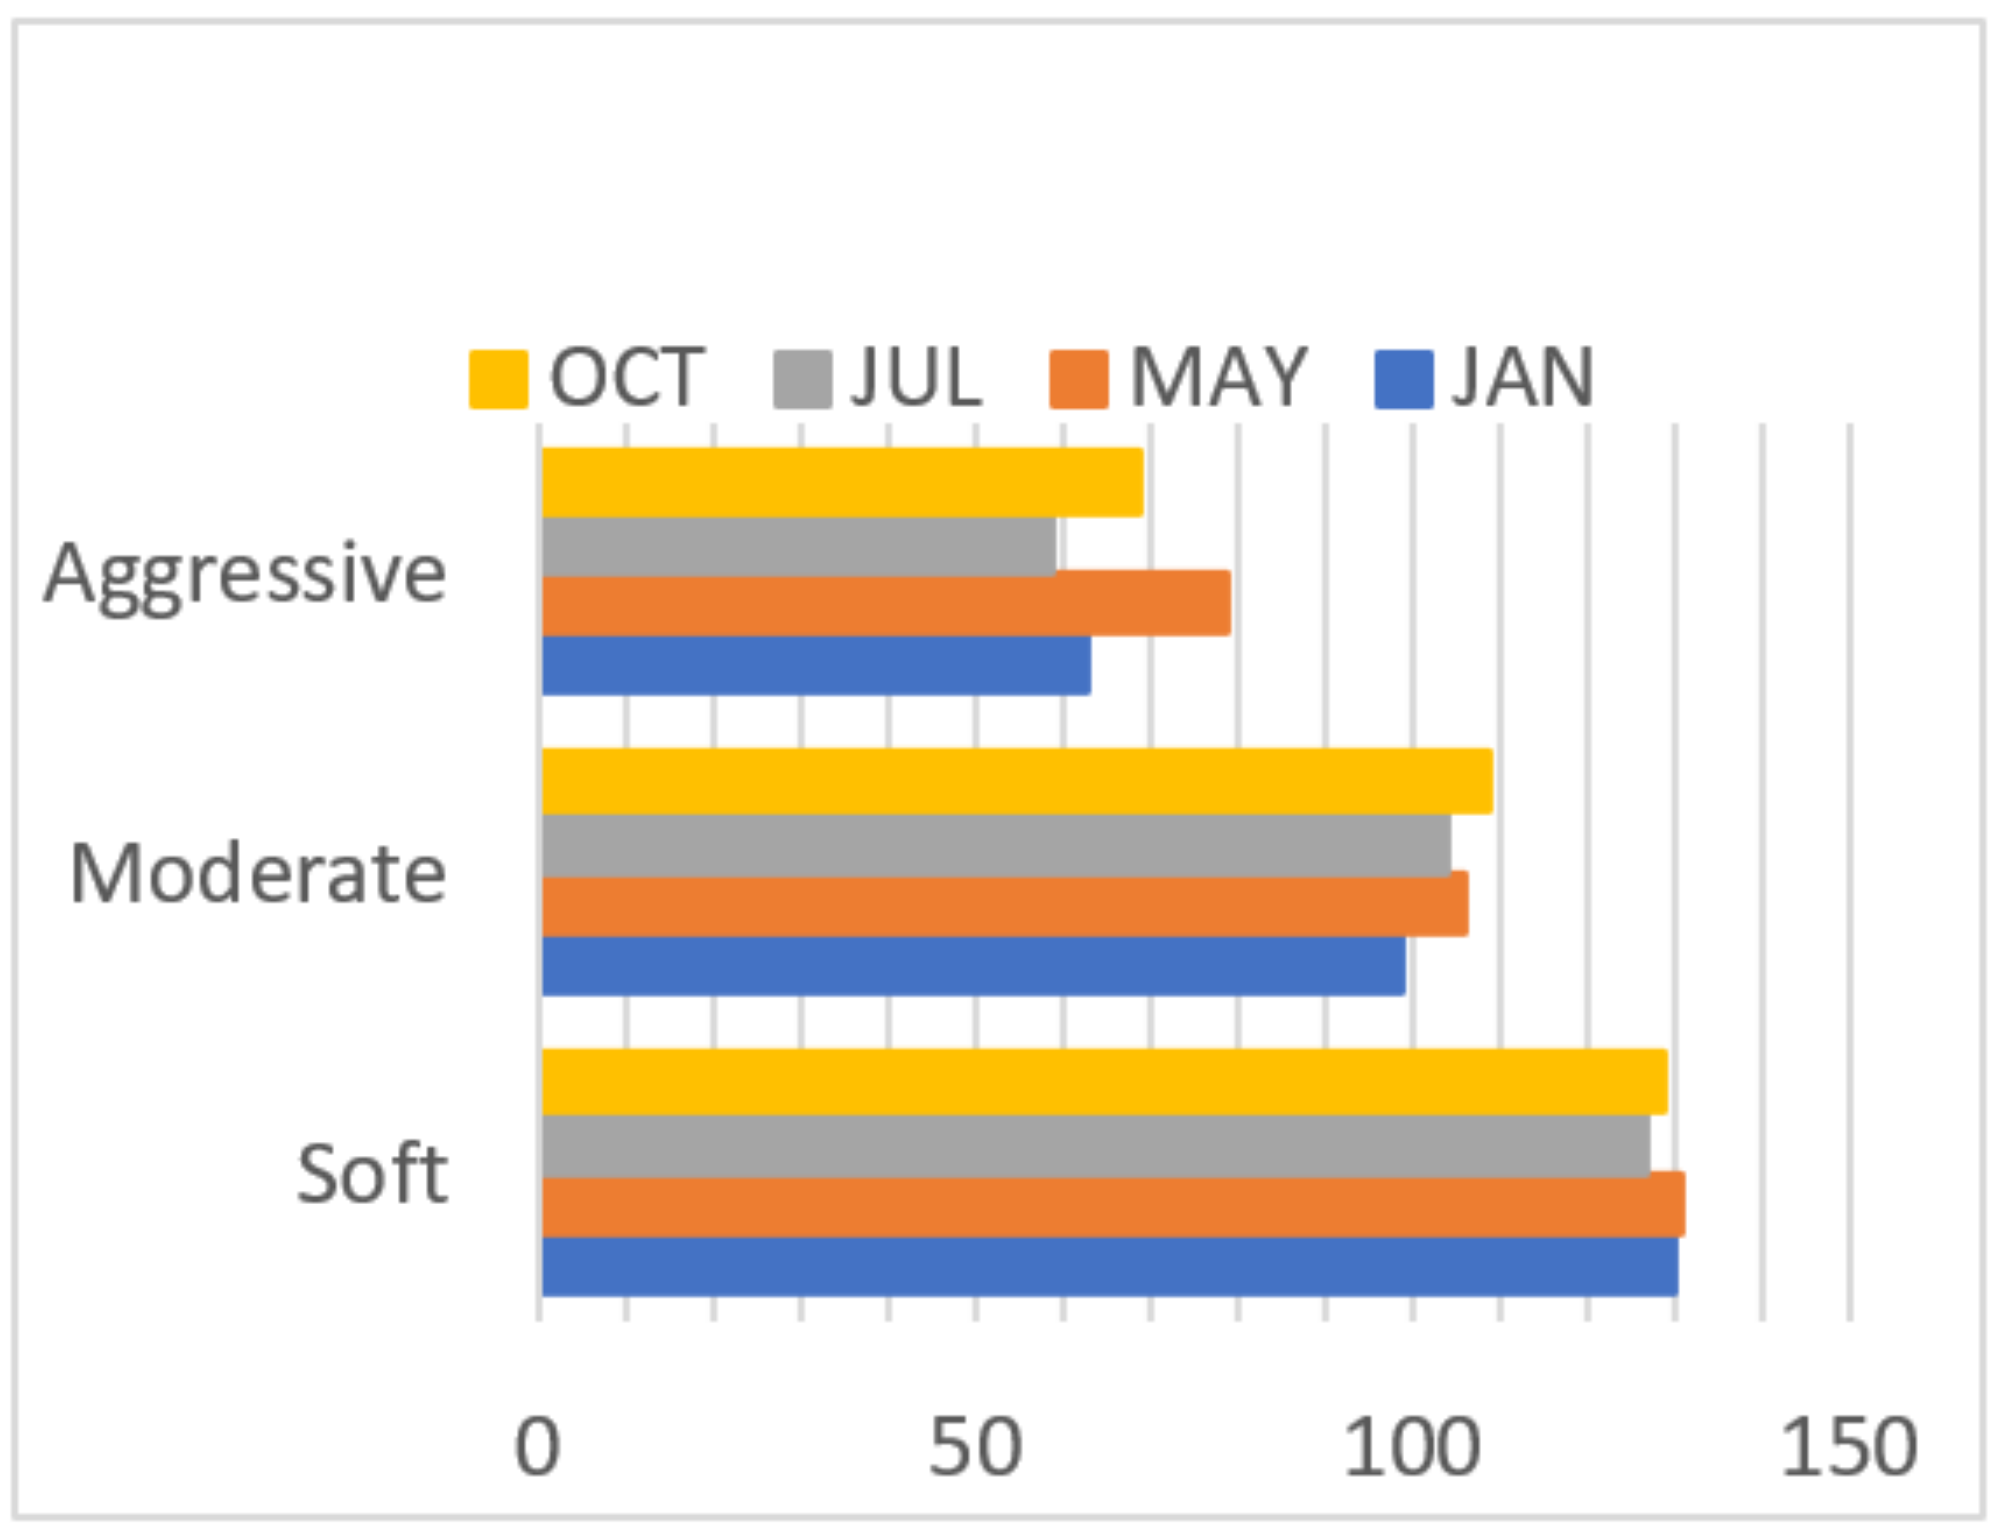
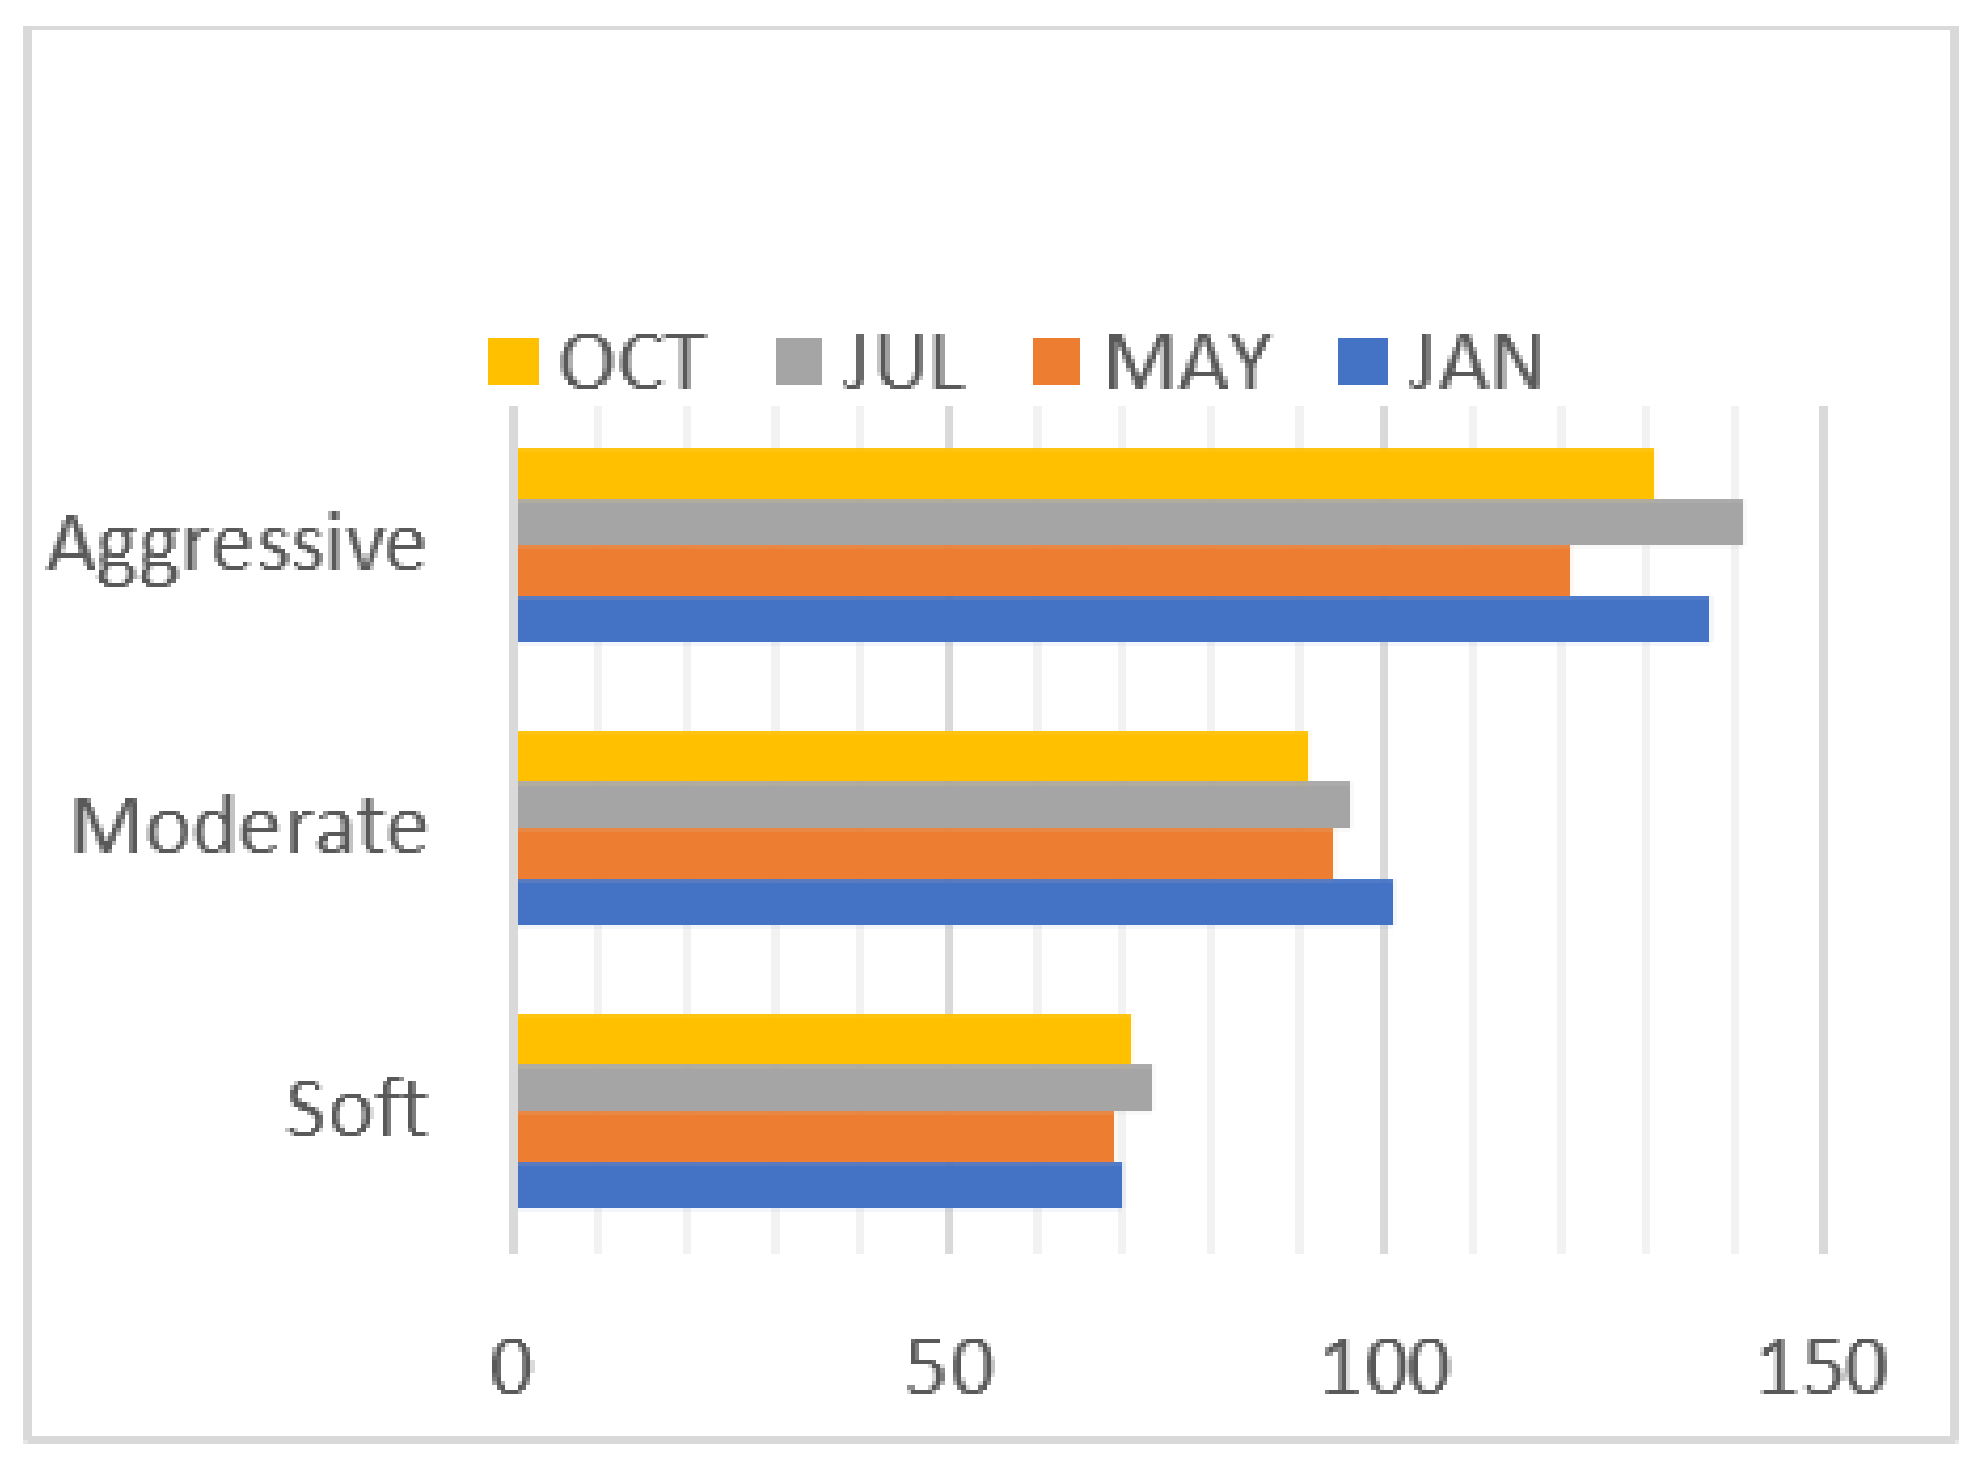
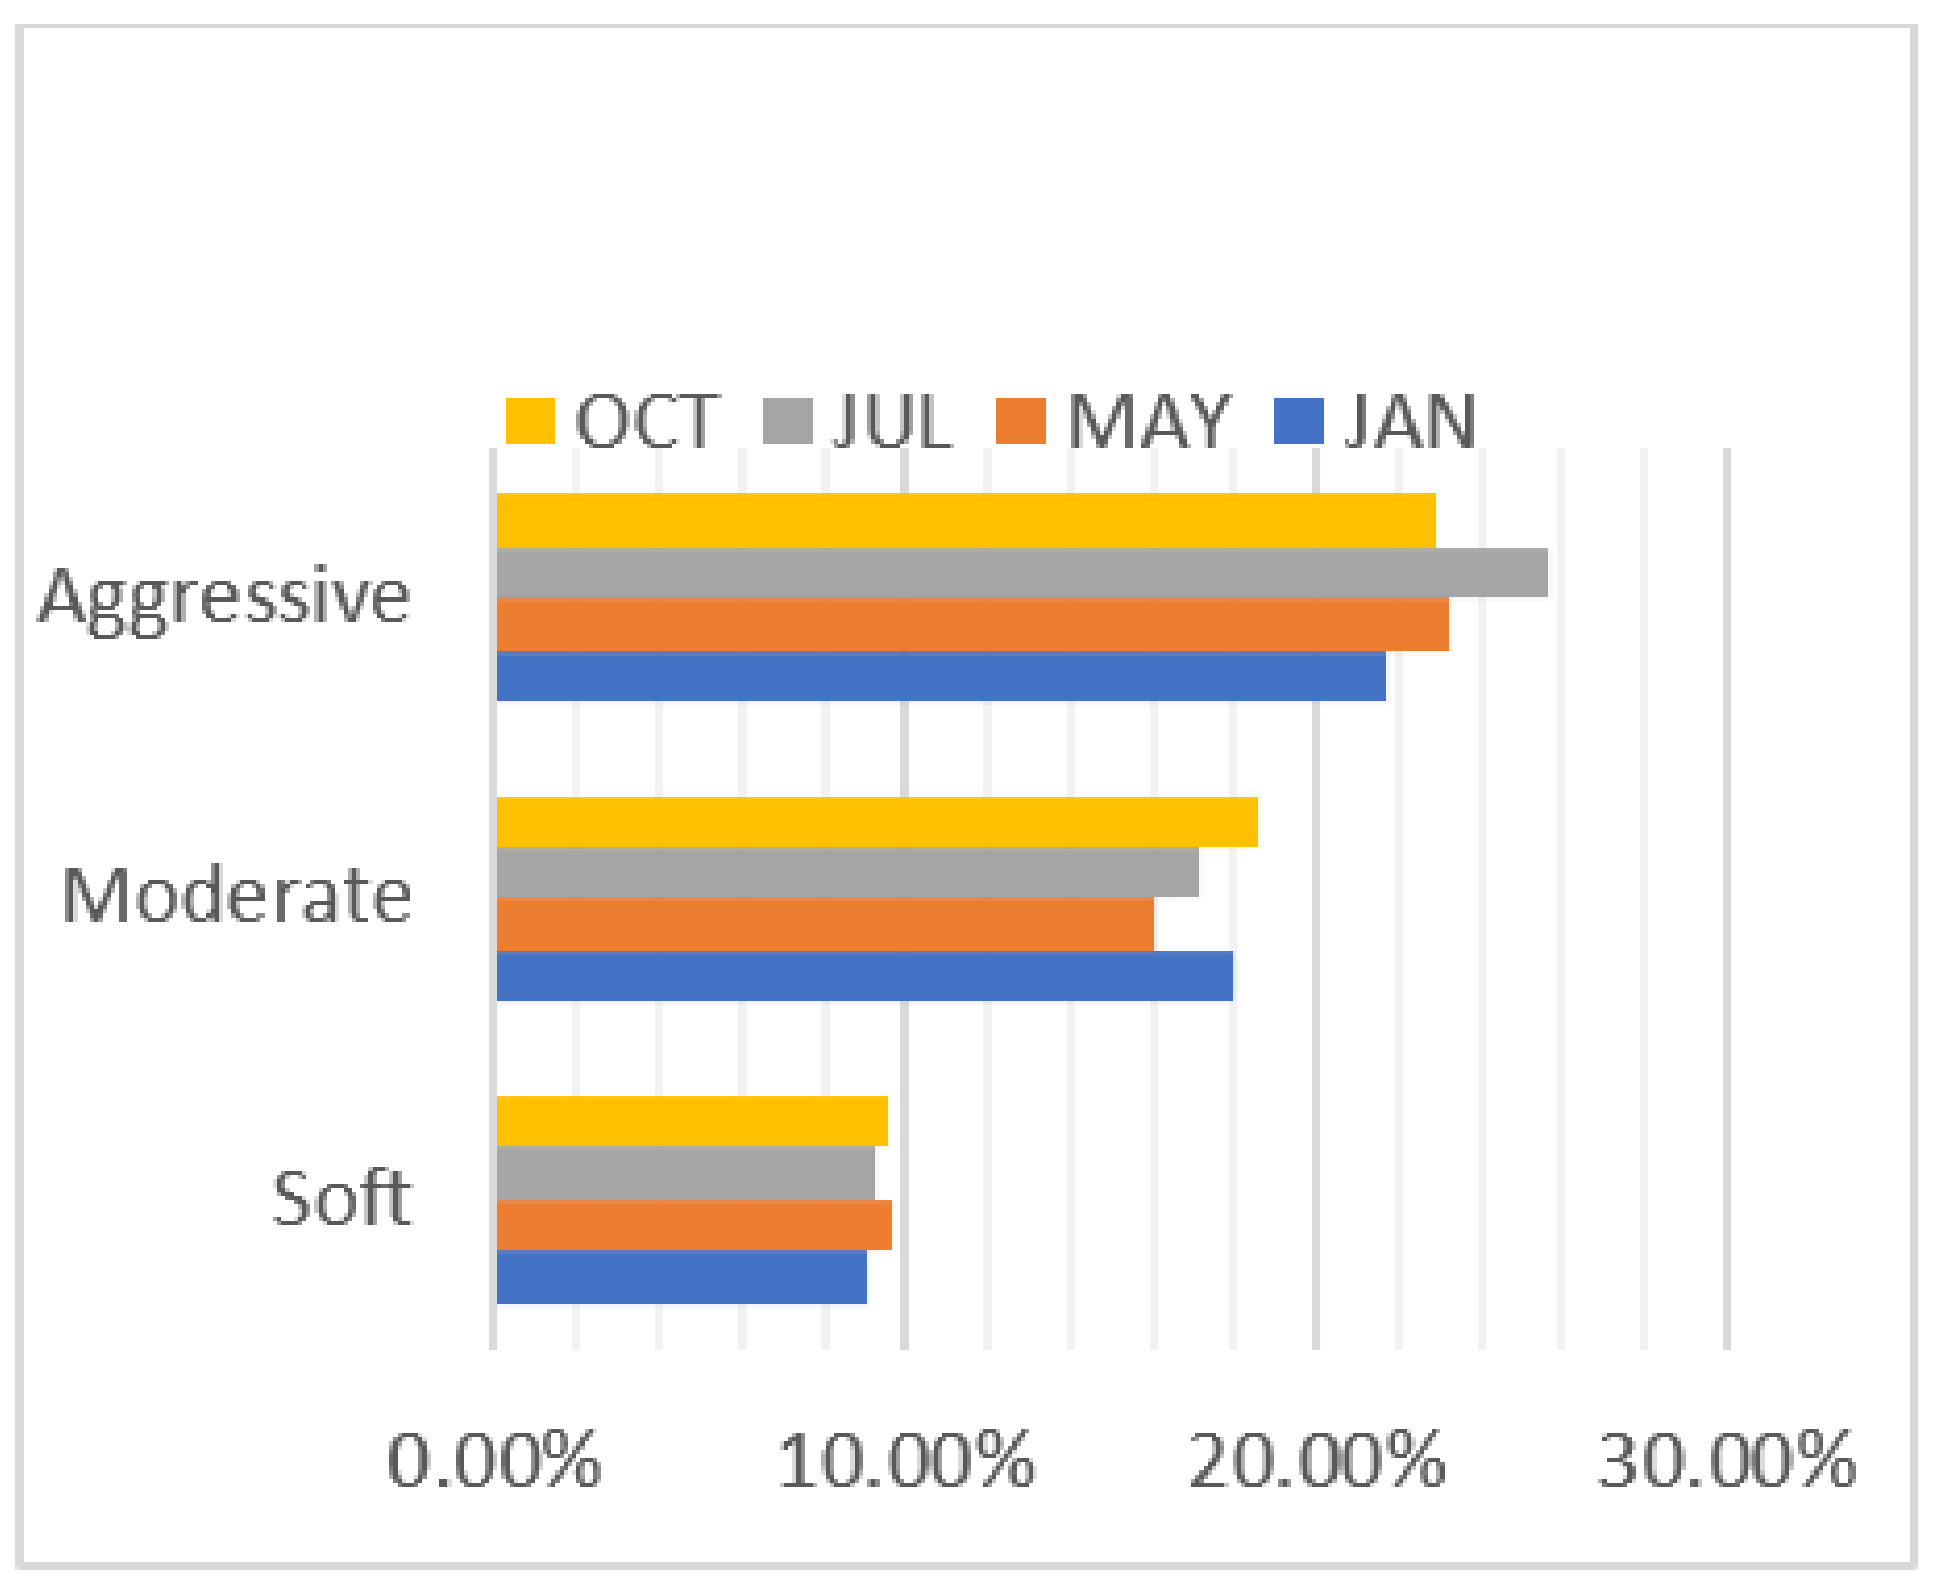
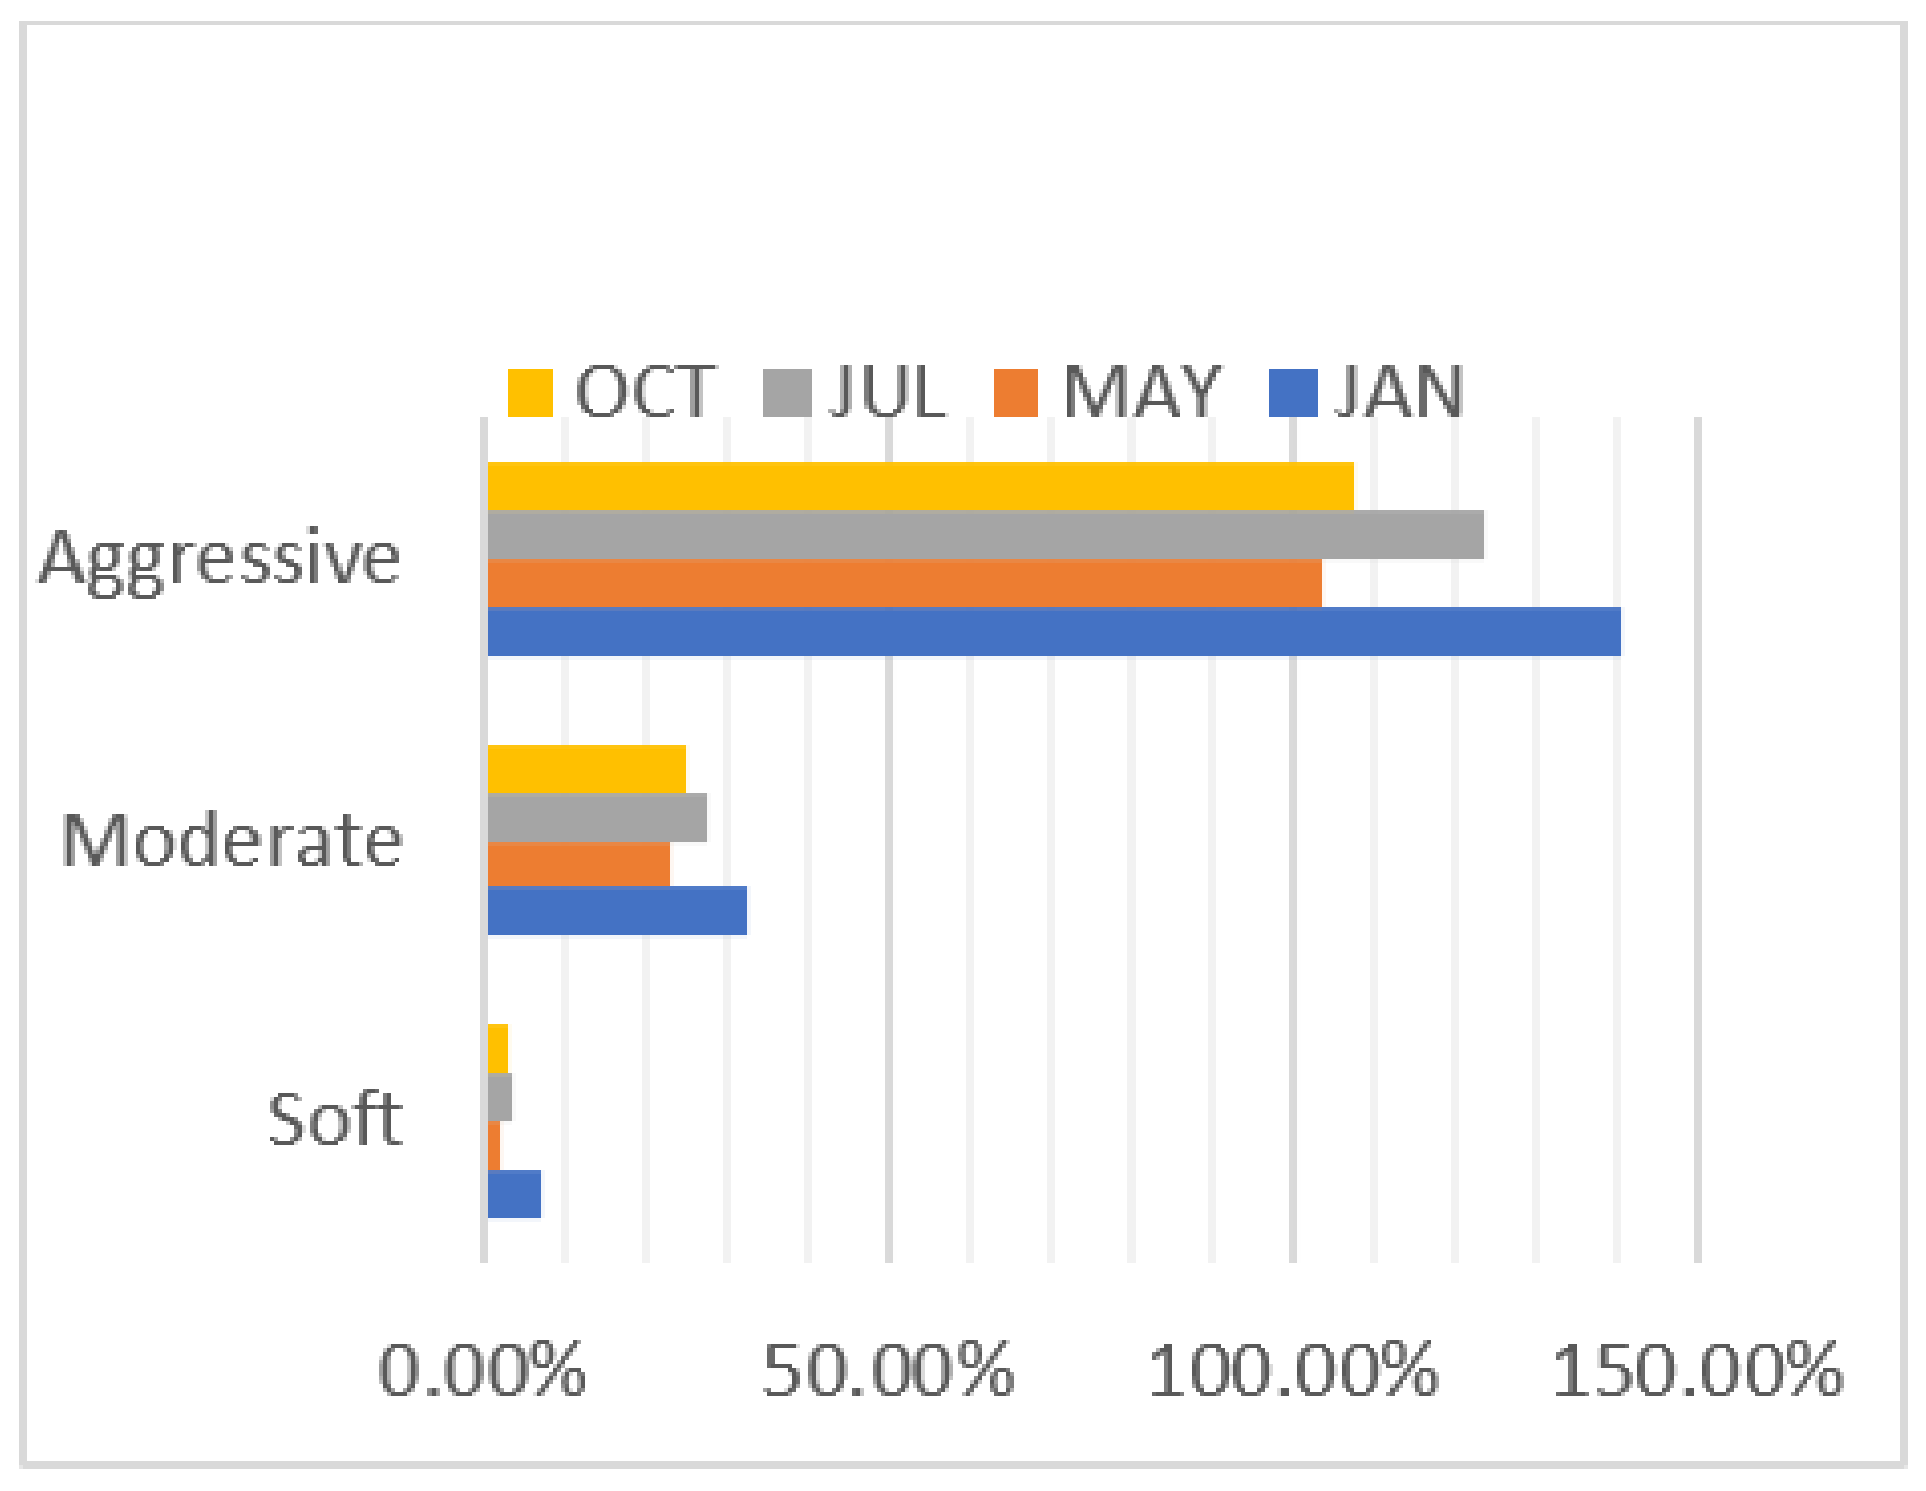
5.3. Simulation Results
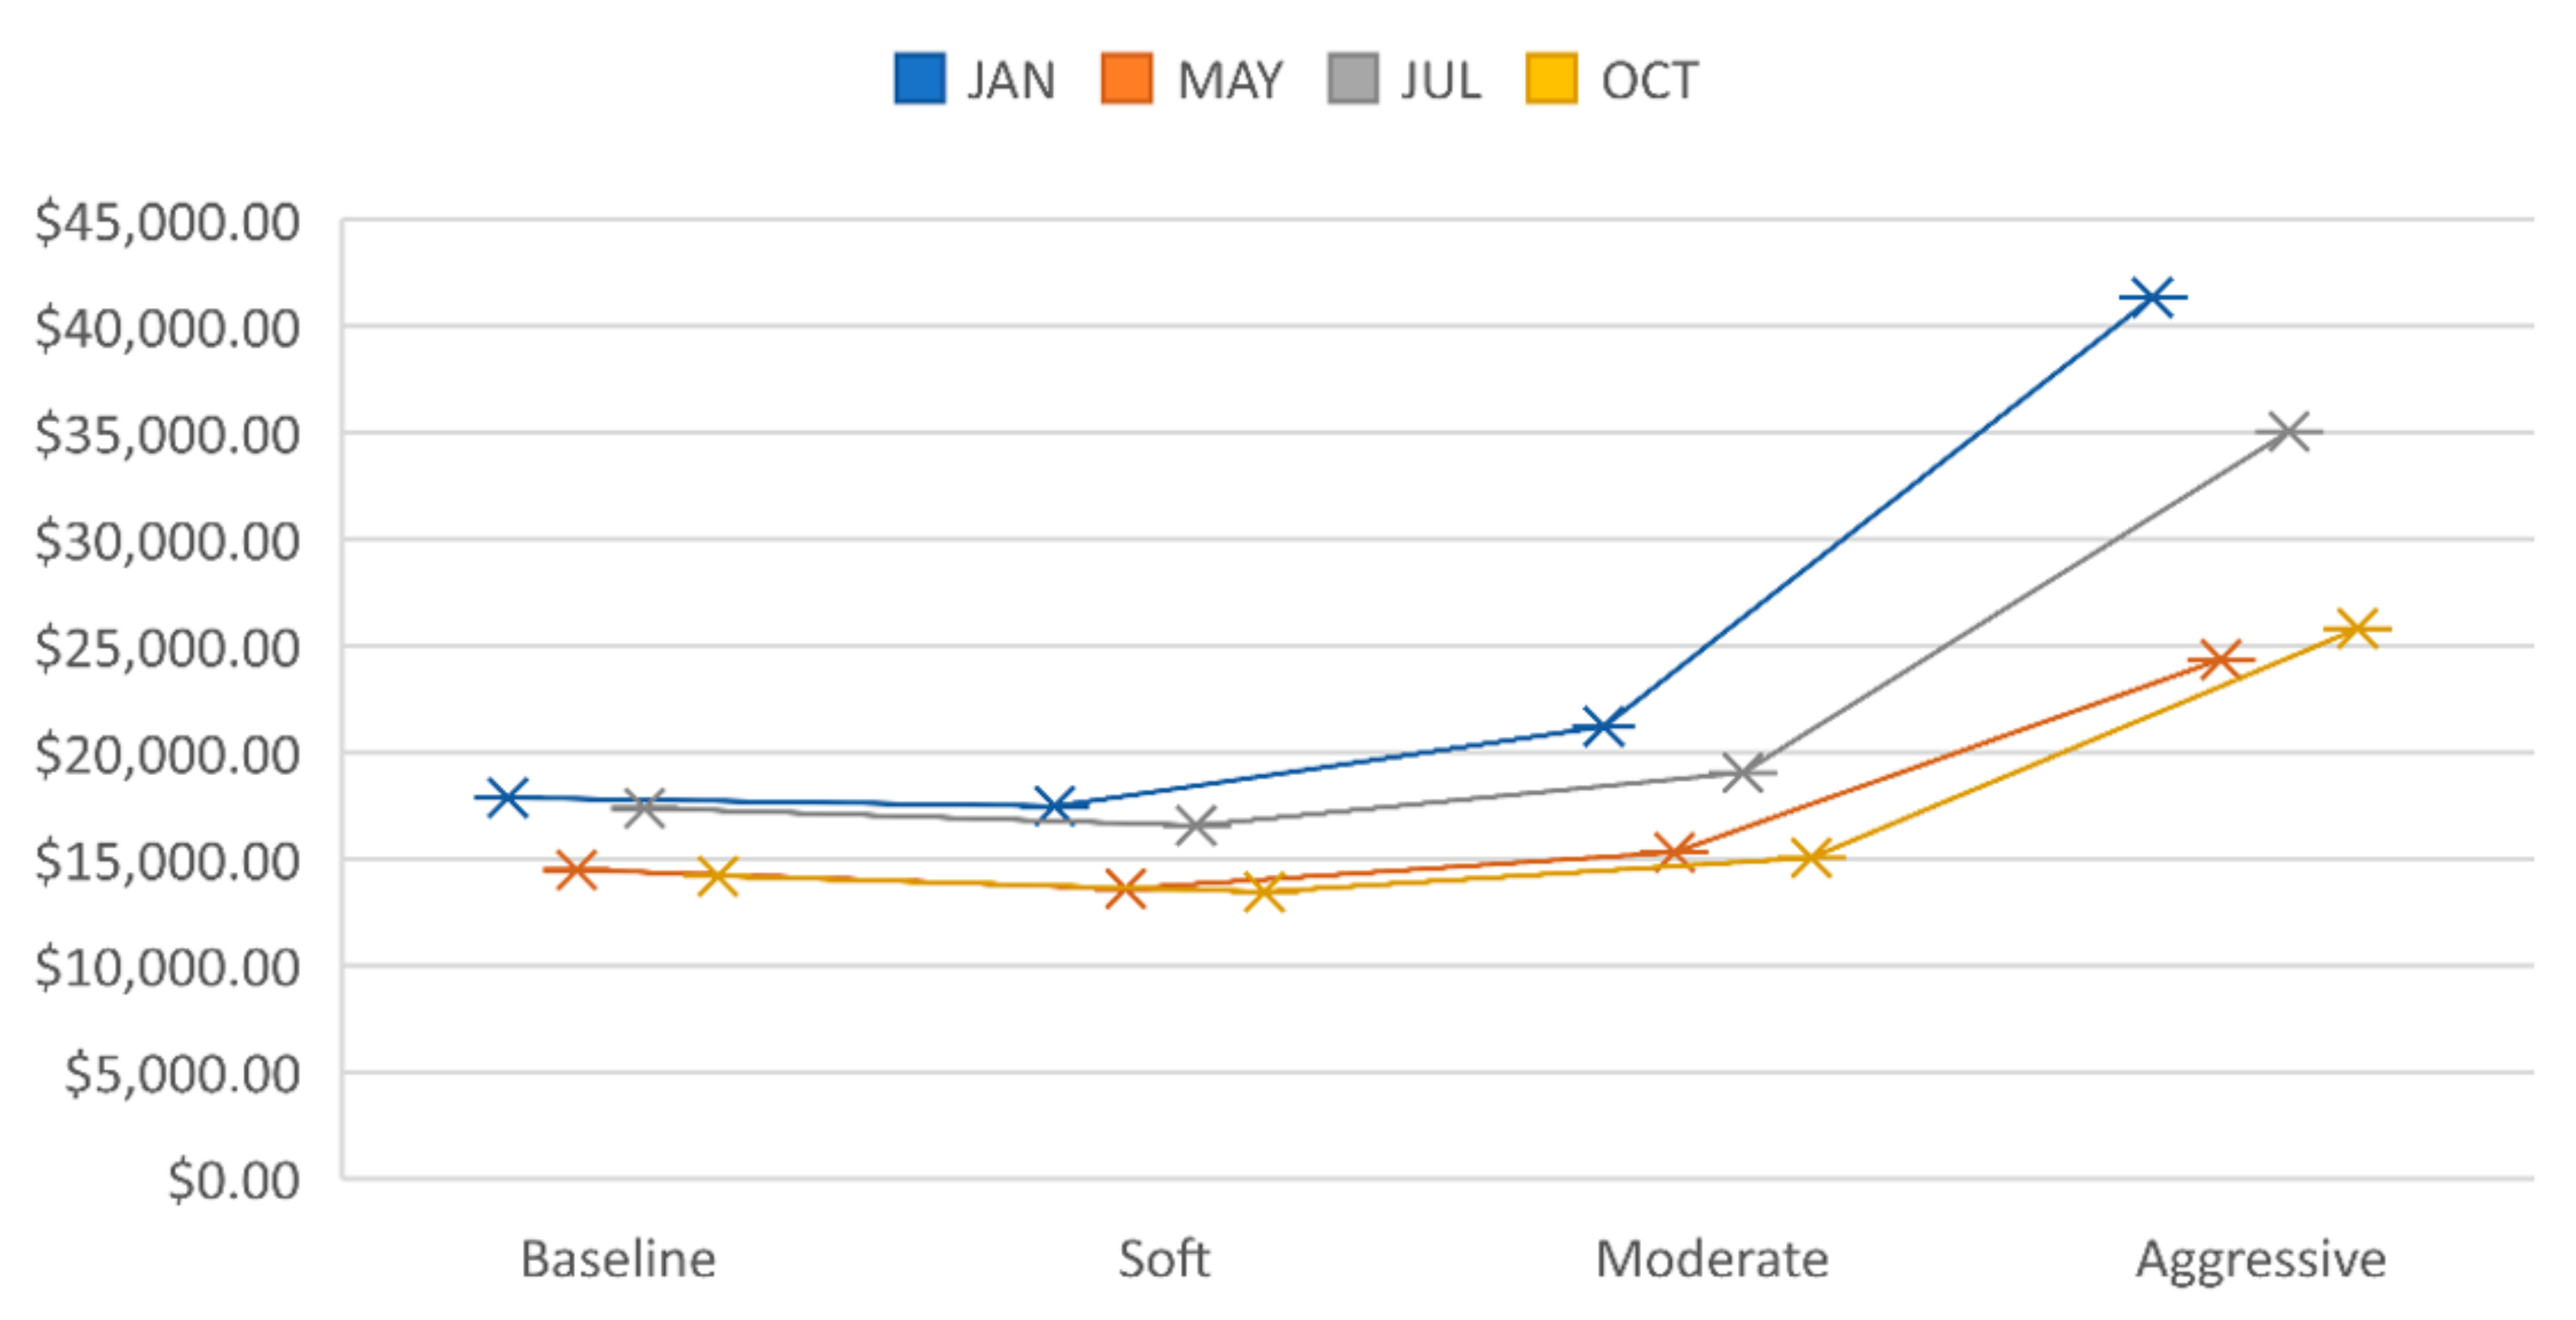
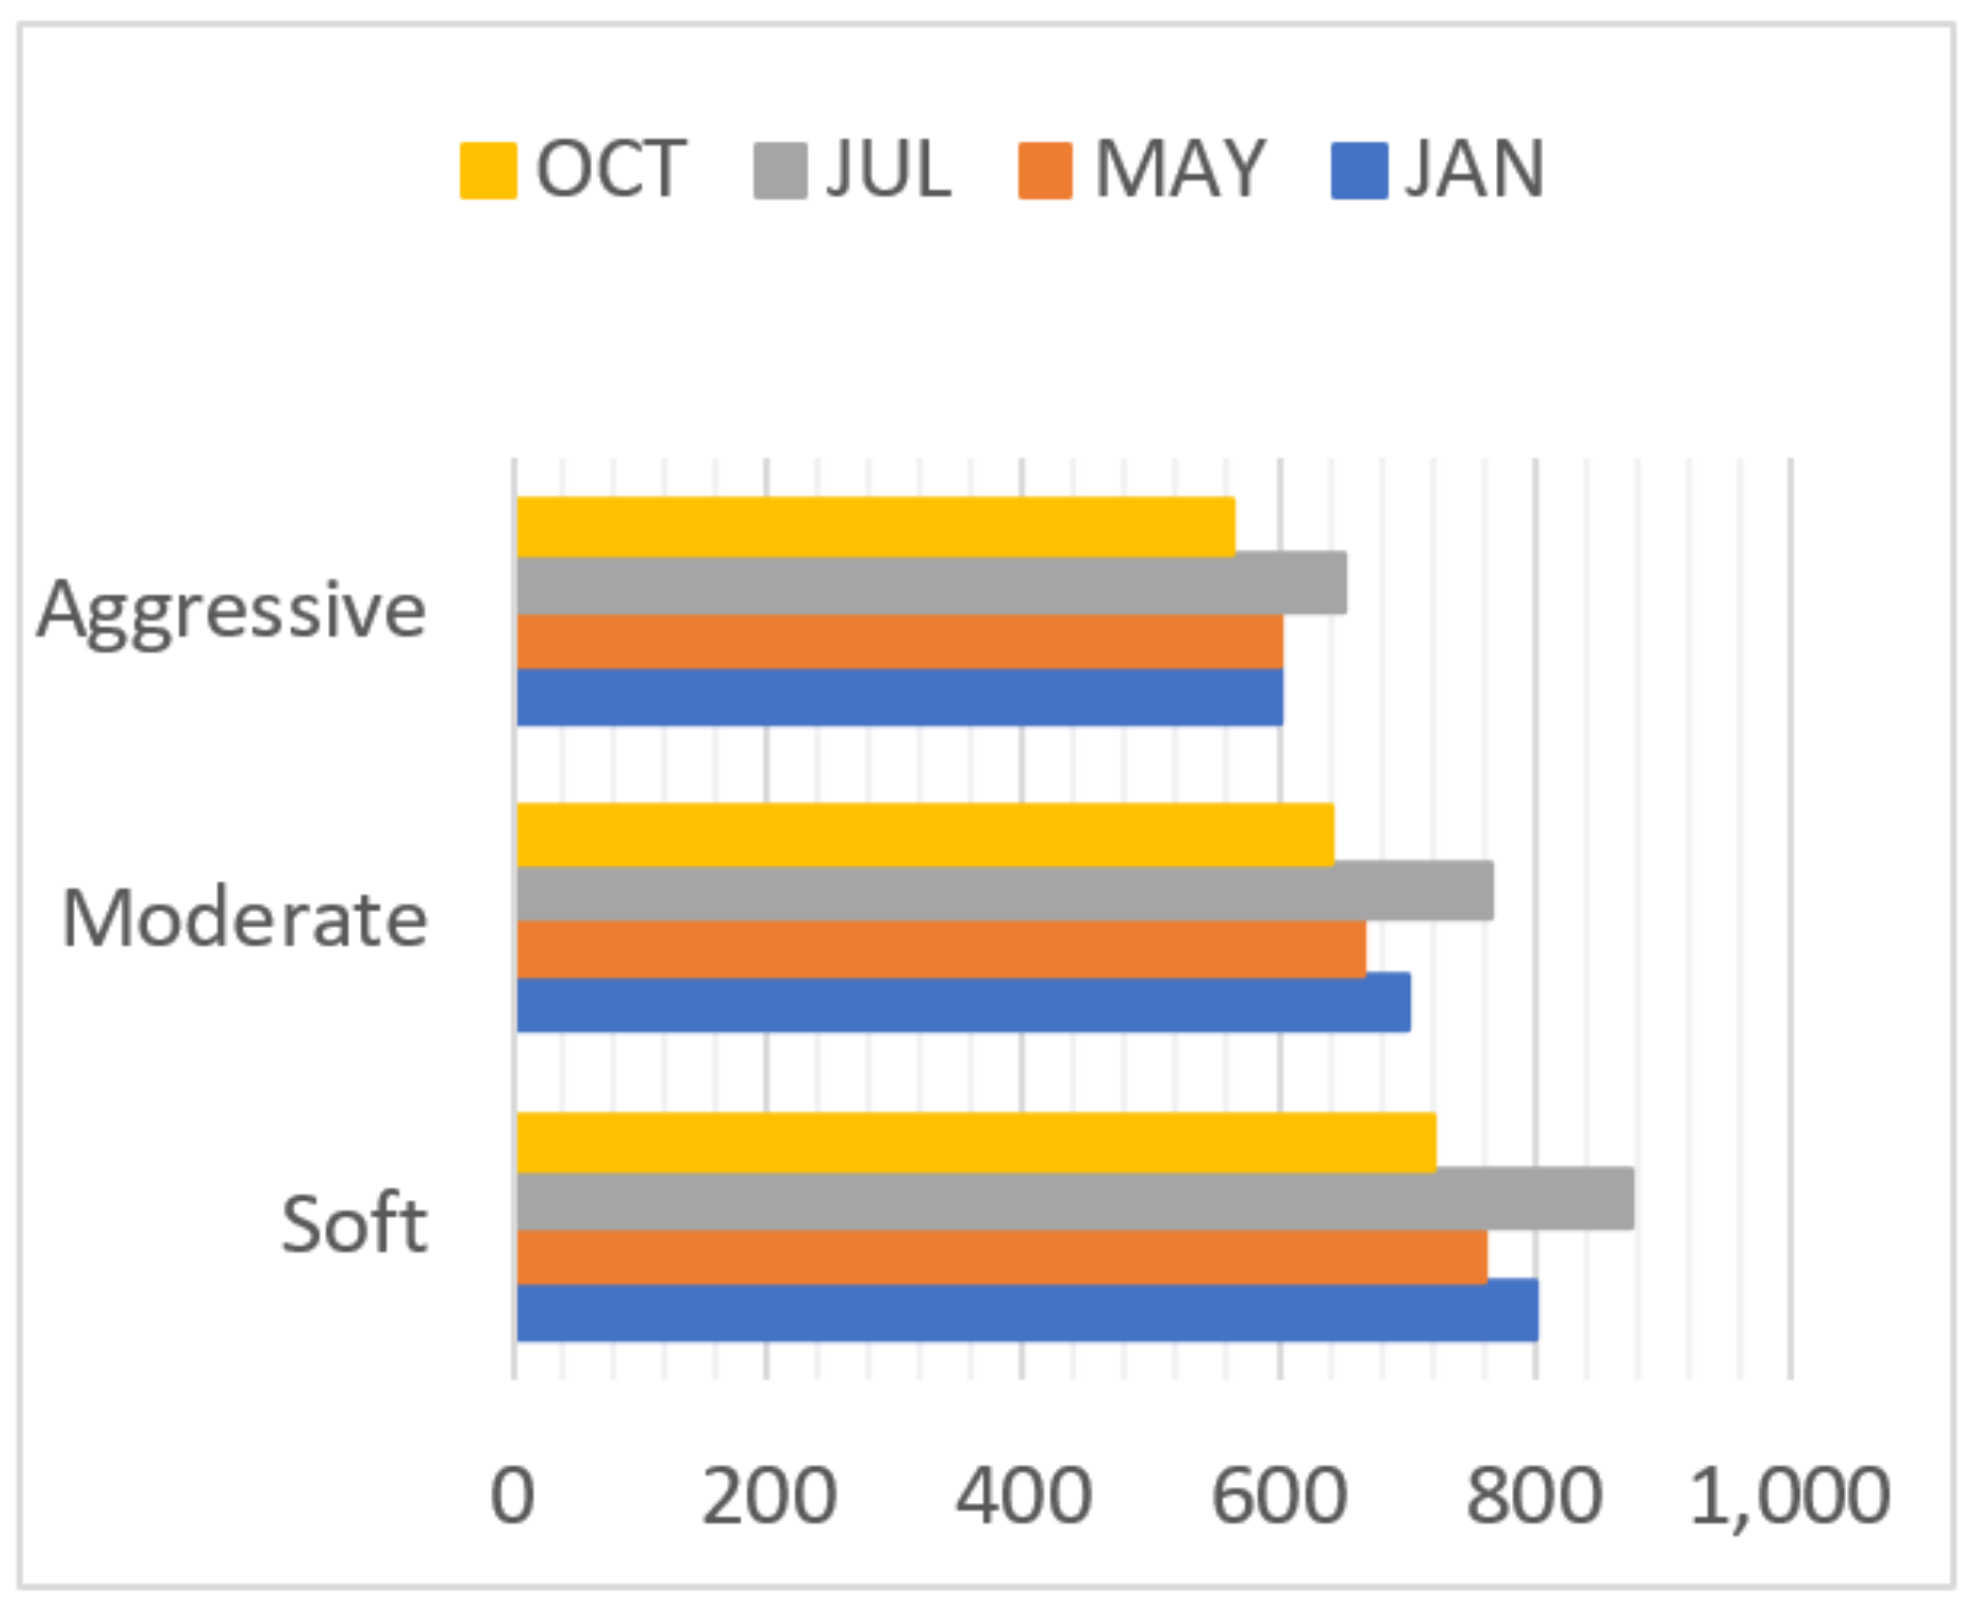
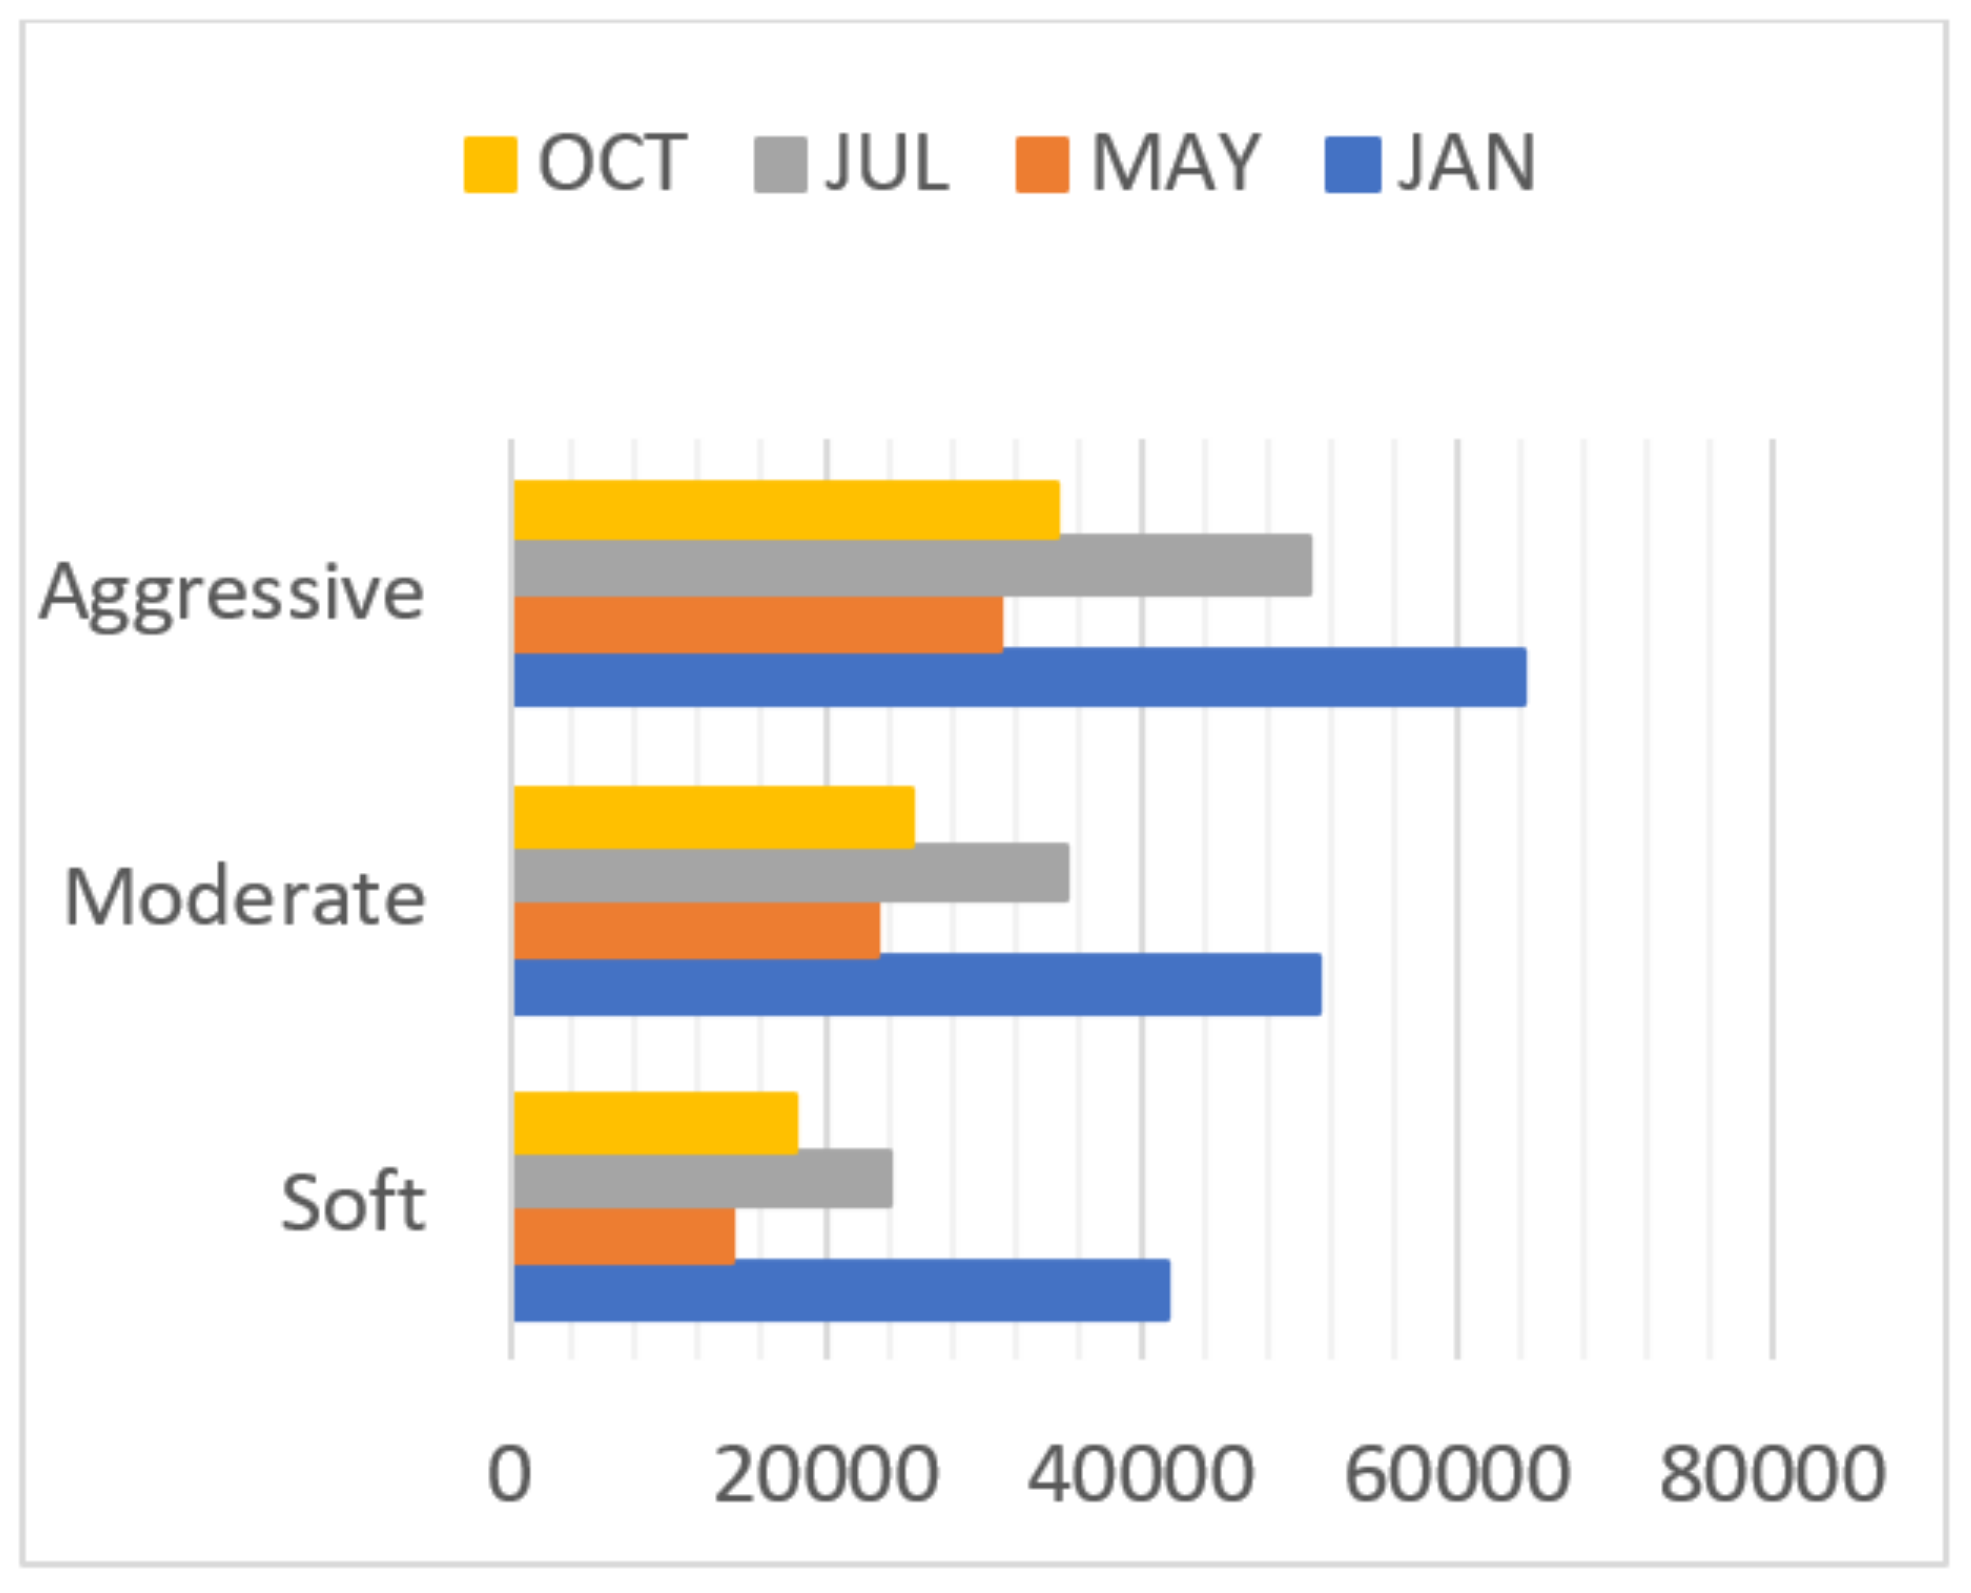
5.4. Sensitivity Analysis
- −
- Cap value
- −
- Energy rates
- −
- Percentage of people reducing their energy consumption
- −
- The energy consumption reduction rate
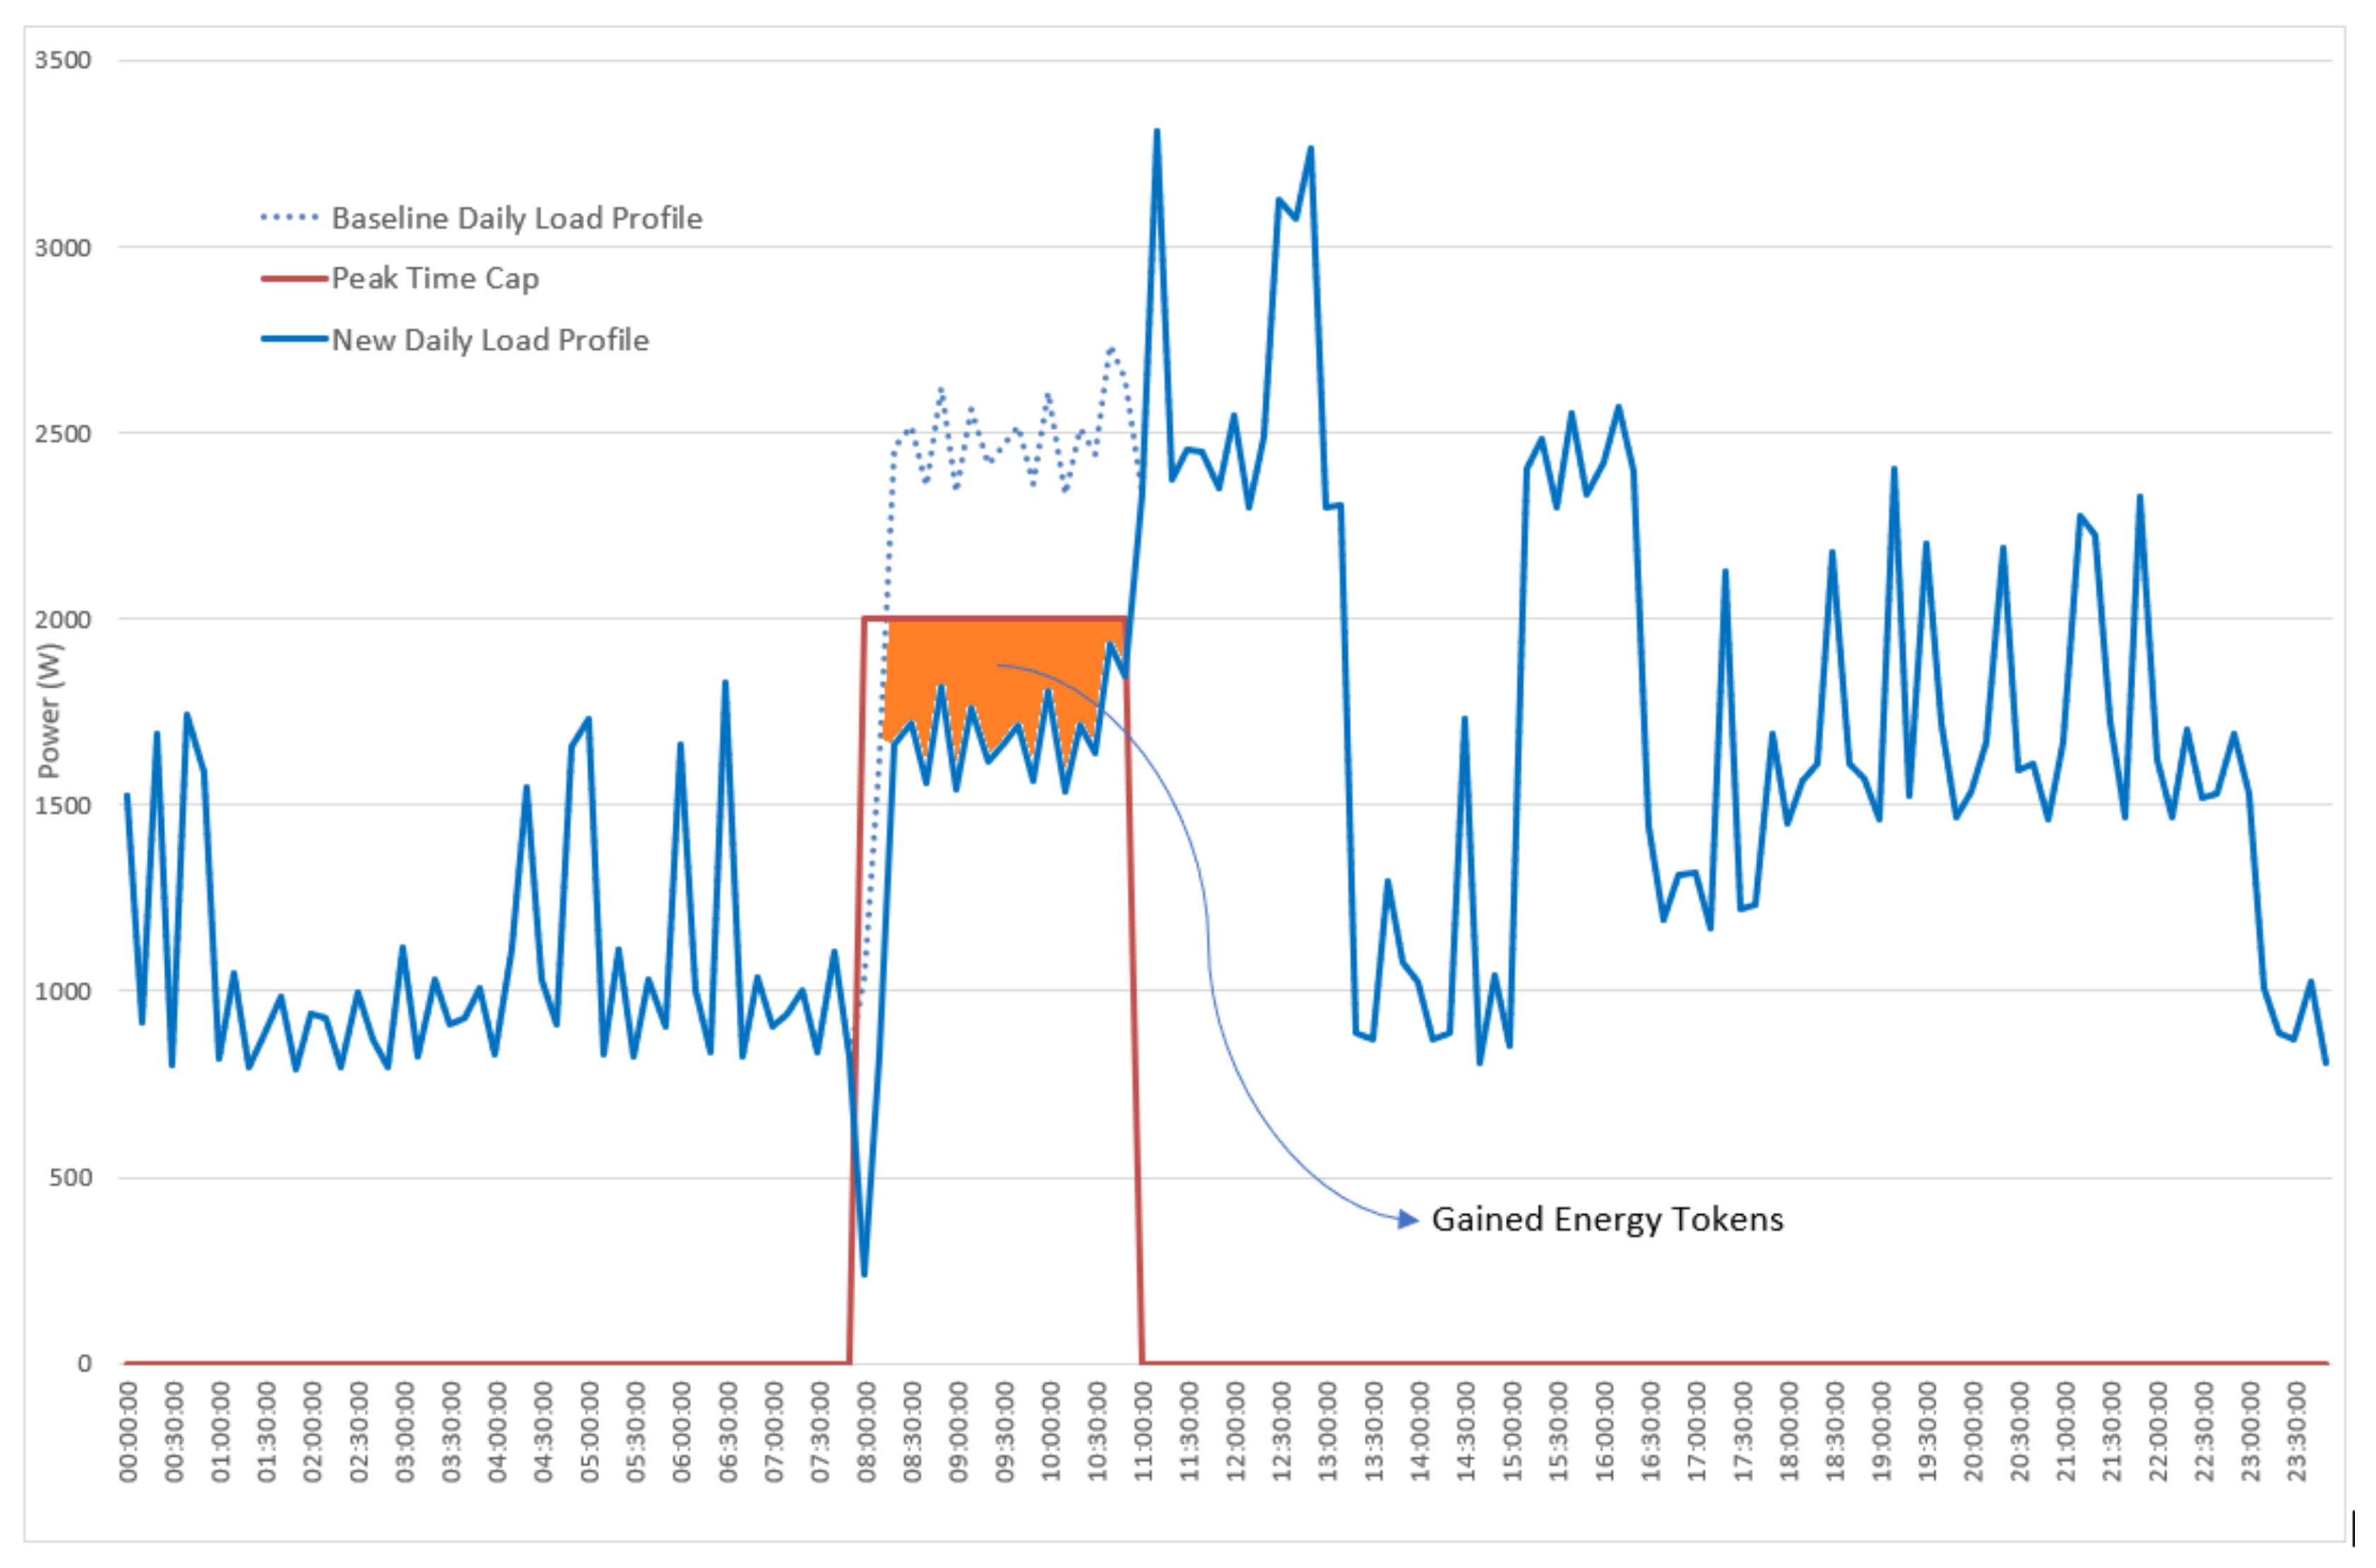
5.5. Other Application: Peak Load Shaving Use Case
- −
- Based on historical data of at least two complete cycles for each household, a cap value will be defined for the peak power during the peak time for every billing cycle
- −
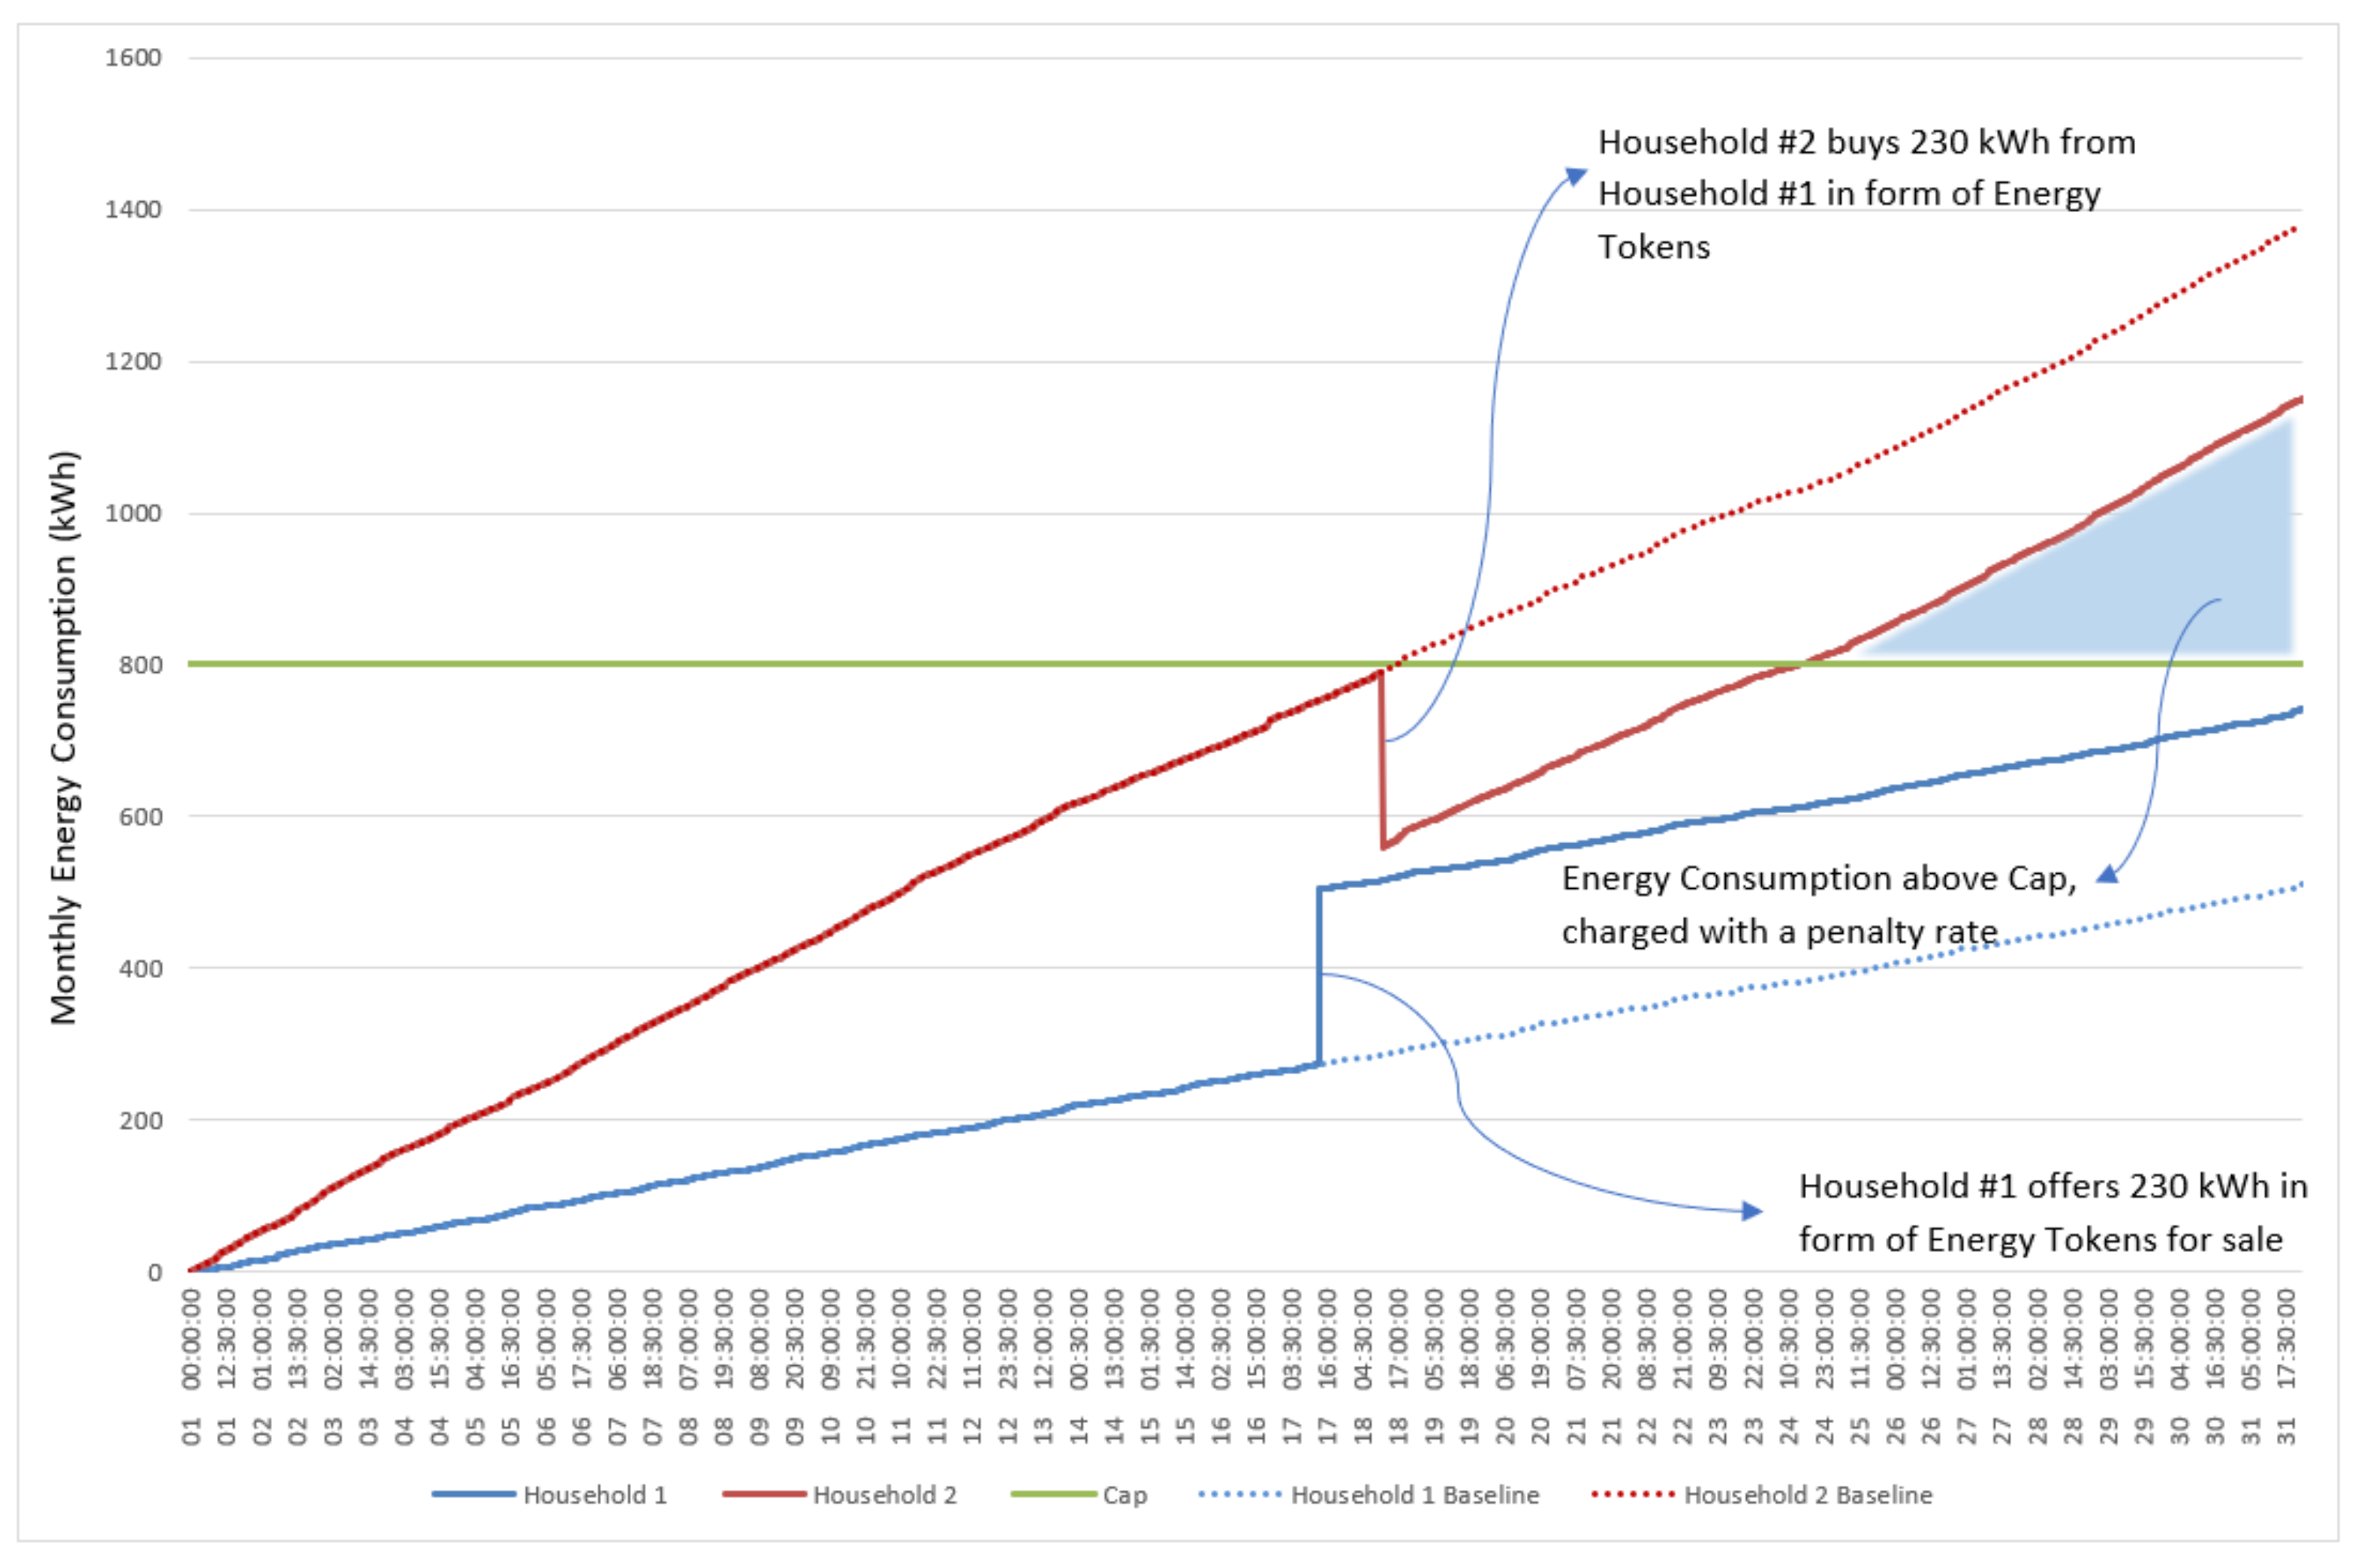
- When the power during the peak period for each household is lower than the set cap, the consumer earns energy tokens equivalent to the amount of energy reduction below the set cap value (as shown in Figure 16)
- −
- The earned tokens can be exchanged with the utility company or the independent system operator (ISO) to pay the monthly energy bill or can be sold to other consumers
- −
- Pursumers can benefit from the bought tokens to pay for the extra charge applied to their energy consumption during on-peak periods
- −
- The complete energy trading process will be similar to the one detailed in Section 4.2
6. Conclusions
Author Contributions
Funding
Institutional Review Board Statement
Informed Consent Statement
Data Availability Statement
Conflicts of Interest
Appendix A
| Energy Trading Smart Contract—Solidity Code |
| Pragma solidity >=0.4.22 <0.6.0; |
| import "./Registeredusers.sol"; |
| // Contract Registeredusers.sol registers a wallet address for each smart meter to enable the registered user to trade energy on blockchain |
| // Contract trading.sol manages and records energy buying or selling transactions |
| contract trading is Registeredusers { |
| struct SellOrder { |
| address seller; |
| uint32 price; |
| uint64 energy; |
| uint64 timestamp; |
| } |
| struct BuyOrder { |
| address seller; |
| uint32 price; |
| uint64 energy; |
| address meterAddress; |
| uint64 timestamp; |
| } |
| // Add registry address |
| address public utilityreg = 0x89205A3A3b2A69De6Dbf7f01ED13B2108B2c43e7; |
| SellOrder[] public sellOrders; |
| BuyOrder[] public buyOrders; |
| //stores the amount of energy supplied by the seller |
| BuyOrder[] public sellerEnergy; |
| mapping(address => uint) public sellIndex; |
| mapping(address => uint) public buyIndex; |
| event sellEvent(address indexed seller, uint32 indexed price, uint64 energy); |
| event buyEvent(address indexed seller, uint32 price, uint64 energy, address meterAddress); |
| function sellEnergy(uint32 aprice, uint64 aenergy, uint64 atimestamp) onlyRegisteredUsers public { |
| // record the sell order |
| uint idx = sellIndex[msg.sender]; |
| sellOrders.push(SellOrder({ |
| seller: msg.sender, |
| price: aprice, |
| energy: aenergy, |
| timestamp: atimestamp |
| })); |
| emit sellEvent(sellOrders[idx].seller, sellOrders[idx].price, sellOrders[idx].energy); |
| } |
| function buyEnergy(address aseller, uint32 aprice, uint64 aenergy, address mAddress, uint64 atimestamp) onlyRegisteredUsers public { |
| // find offer by seller (aseller) |
| uint idx = sellIndex[aseller]; |
| require(0x0 != idx); |
| // check if any matching offer is available |
| if ((sellOrders.length > idx) && (sellOrders[idx].seller == aseller)) { |
| // check if price is matching |
| require(sellOrders[idx].price == aprice); |
| buyIndex[msg.sender] = buyOrders.length; |
| // record the buyer's choice |
| buyOrders.push(BuyOrder({ |
| seller: aseller, |
| price: aprice, |
| energy: aenergy, |
| meterAddress: mAddress, |
| timestamp: atimestamp |
| })); |
| emit buyEvent(aseller, aprice, aenergy, mAddress); |
| //checks if the consumer bought from the seller and stores it |
| // The array sellerEnergy in trading.sol stores the energy transaction |
| require(buyOrders[idx].seller == utilityreg); |
| sellerEnergy.push(BuyOrder({ |
| seller: aseller, |
| price: aprice, |
| energy: aenergy, |
| meterAddress: mAddress, |
| timestamp: atimestamp |
| })); |
| } else { |
| revert(); |
| } |
| } |
| } |
References
- Aoun, A.; Ibrahim, H.; Ghandour, M.; Ilinca, A. Supply Side Management vs. Demand Side Management of a Residential Microgrid Equipped with an Electric Vehicle in a Dual Tariff Scheme. Energies 2019, 12, 4351. [Google Scholar] [CrossRef] [Green Version]
- U.S. Department of Energy (DOE). Benefits of Demand Response in Electricity Markets and Recommendations for Achieving Them: A Report to the United States Congress Pursuant to Section 1252 of the Energy Policy Act of 2005; U.S. DOE: Washington, DC, USA, 2006.
- Lee, E.; Jang, D.; Kim, J. A Two-Step Methodology for Free Rider Mitigation with an Improved Settlement Algorithm: Regression in CBL Estimation and New Incentive Payment Rule in Residential Demand Response. Energies 2018, 11, 3417. [Google Scholar] [CrossRef] [Green Version]
- Garbi, A.; Malamou, A.; Michas, N.; Pontikas, Z.; Doulamis, N.; Protopapadakis, E.; Mikkelsen, T.N.; Kanellakis, K.; Baradat, J.-L. BENEFFICE: Behaviour Change, Consumption Monitoring and Analytics with Complementary Currency Rewards. Proceedings 2019, 20, 12. [Google Scholar] [CrossRef] [Green Version]
- Gillingham, K.; Rapson, D.; Wagner, G. The Rebound Effect and Energy Efficiency Policy. Rev. Environ. Econ. Policy 2016, 10, 68–88. [Google Scholar] [CrossRef] [Green Version]
- Vivanco, D.F.; Kemp, R.; van der Voet, E. How to deal with the rebound effect? A policy-oriented approach. Energy Policy 2016, 94, 114–125. [Google Scholar] [CrossRef] [Green Version]
- Abe, R.; Taoka, H.; McQuilkin, D. Digital Grid: Communicative Electrical Grids of the Future. In IEEE Transactions on Smart Grid; IEEE: Piscataway, NJ, USA, 2011; pp. 399–410. [Google Scholar]
- Mika, B.; Goudz, A. Blockchain-technology in the energy industry: Blockchain as a driver of the energy revolution? With focus on the situation in Germany. Energy Syst. 2020, 12, 285–355. [Google Scholar] [CrossRef]
- Thakkar, A. How Blockchain and Peer-to-Peer Energy Markets Could Make Distributed Energy Resources More Attractive. Bachelor’s Thesis, Duke University, Durham, NC, USA.
- Deloitte. Blockchain Application in Energy Trading. Available online: https://www2.deloitte.com/content/dam/Deloitte/global/Documents/Energy-and-Resources/gx-Blockchain-applications-in-energy-trading.pdf (accessed on 20 September 2021).
- World Energy Council. “The Developing Role of Blockchain”, White Paper in collaboration with Pricewaterhouse Coopers PwC. Available online: https://www.worldenergy.org/assets/downloads/Full-White-paper_the-developing-role-of-blockchain.pdf (accessed on 6 December 2021).
- Babich, V.; Hilary, G. OM Forum—Distributed Ledgers and Operations: What Operations Management Researchers Should Know About Blockchain Technology. Manuf. Serv. Oper. Manag. 2020, 22, 223–240. [Google Scholar] [CrossRef] [Green Version]
- Gaur, G.; Mehta, N.; Khanna, R.; Kaur, S. Demand side management in a smart grid environment. In Proceedings of the 2017 IEEE International Conference on Smart Grid and Smart Cities (ICSGSC), Singapore, 23–26 July 2017; pp. 227–231. [Google Scholar]
- Di Santo, K.G.; Di Santo, S.; Monaro, R.M.; Saidel, M.A. Active demand side management for households in smart grids using optimization and artificial intelligence. Measurement 2018, 115, 152–161. [Google Scholar] [CrossRef]
- Antonopoulos, I.; Robu, V.; Couraud, B.; Kirli, D.; Norbu, S.; Kiprakis, A.; Flynn, D.; Elizondo-Gonzalez, S.; Wattam, S. Artificial intelligence and machine learning approaches to energy demand-side response: A systematic review. Renew. Sustain. Energy Rev. 2020, 130, 109899. [Google Scholar] [CrossRef]
- Vahidi, B.; Dadkhah, A. New Demand Response Platform with Machine Learning and Data Analytics. In Demand Response Application in Smart Grids; Springer: Singapore, 2020; pp. 113–137. [Google Scholar]
- Hajizadeh, A.; Hakimi, S.M. Blockchain in decentralized demand-side control of microgrids. In Blockchain-Based Smart Grids; Academic Press: Cambridge, MA, USA, 2020; pp. 145–167. [Google Scholar]
- Alladi, T.; Chamola, V.; Rodrigues, J.J.P.C.; Kozlov, S.A. Blockchain in Smart Grids: A Review on Different Use Cases. Sensors 2019, 19, 4862. [Google Scholar] [CrossRef] [Green Version]
- Noor, S.; Yang, W.; Guo, M.; van Dam, K.H.; Wang, X. Energy Demand Side Management within micro-grid networks enhanced by blockchain. Appl. Energy 2018, 228, 1385–1398. [Google Scholar] [CrossRef]
- Afzal, M.; Huang, Q.; Amin, W.; Umer, K.; Raza, A.; Naeem, M. Blockchain Enabled Distributed Demand Side Management in Community Energy System with Smart Homes. IEEE Access 2020, 8, 37428–37439. [Google Scholar] [CrossRef]
- Wu, X.; Duan, B.; Yan, Y.; Zhong, Y. M2M Blockchain: The Case of Demand Side Management of Smart Grid. In Proceedings of the 2017 IEEE 23rd International Conference on Parallel and Distributed Systems (ICPADS), Shenzhen, China, 15–17 December 2017; pp. 810–813. [Google Scholar]
- Khatoon, A.; Verma, P.; Southernwood, J.; Massey, B.; Corcoran, P. Blockchain in Energy Efficiency: Potential Applications and Benefits. Energies 2019, 12, 3317. [Google Scholar] [CrossRef] [Green Version]
- Nakamoto, S. Bitcoin: A Peer-to-Peer Electronic Cash System. 2008. Available online: https://bitcoin.org/bitcoin.pdf (accessed on 20 September 2021).
- Mougayar, W. The Business Blockchain: Promise, Practice, and Application of the Next Internet Technology; John Wiley and Sons: Hoboken, NJ, USA, 2016. [Google Scholar]
- German-Mexican Energy Partnership and Florence School of Regulation. Blockchain Meets Energy—Digital Solu-tions for a Decentralized and Decarbonized Sector. June 2019. Available online: https://fsr.eui.eu/wp-content/uploads/Blockchain_meets_Energy_-_ENG.pdf (accessed on 6 December 2021).
- Maher, A.; Moorsel, A. Blockchain based smart contracts: A systematic mapping study. arXiv 2017, arXiv:1710.06372. [Google Scholar]
- Detecon Consulting. The Advantages of ‘Blockchain Smart Contracts’. 12 December 2012. Available online: https://www.detecon.com/en/knowledge/advantages-blockchain-smart-contracts (accessed on 20 September 2021).
- Seyfang, G. The New Economics of Sustainable Consumption; Palgrave Macmillan: London, UK, 2009. [Google Scholar]
- Scholl, G.; Rubik, F.; Kalimo, H.; Biedenkopf, K.; Söebech, Ó. Policies to promote sustainable consumption: Innovative approaches in Europe. Nat. Resour. Forum 2010, 34, 39–50. [Google Scholar] [CrossRef]
- OECD. Promoting Sustainable Consumption: Good Practices in OECD Countries. 2008. Available online: https://www.oecd.org/greengrowth/40317373.pdf (accessed on 20 September 2021).
- OECD. The Distributional Effects of Environmental Policy. 2006. Available online: https://www.oecd.org/env/tools-evaluation/36830749.pdf (accessed on 20 September 2021).
- CEDD. Préservation de L’environnement, Équité Et Accès Aux Services Essentiels. Conseil Économique Pour Le Développement Durable. 2011. Available online: https://www.ecologique-solidaire.gouv.fr/sites/default/files/CEDD%20-%20Pr%C3%A9servation%20de%20l%E2%80%99environnement%2C%20%C3%A9quit%C3%A9%20et%20acc%C3%A8s%20aux%20services%20essentiels.pdf (accessed on 20 September 2021).
- UK Department of Energy and Climate. Available online: www.decc.gov.uk/en/content/cms/funding/fuel_poverty/strategy/strategy.aspx (accessed on 20 September 2021).
- Khandker, S.R.; Barnes, D.F.; Samad, H.A. Welfare Impacts of Rural Electrification: A Case Study from Bangladesh; World Bank Policy Research Working Paper Series; The World Bank: Washington, DC, USA, 2009. [Google Scholar]
- Lankton, N.K.; Wilson, E.V.; Mao, E. Antecedents and determinants of information technology habit. Inf. Manag. 2010, 47, 300–307. [Google Scholar] [CrossRef]
- Khandker, S.R.; Barnes, D.F.; Samad, H.A. Energy Poverty in Rural and Urban India: Are the Energy Poor Also Income Poor? World Bank Policy Research Working Paper No. 5463; The World Bank: Washington, DC, USA, 2010. [Google Scholar] [CrossRef]
- Residential Energy Consumption Survey (RECS); US Department of Energy, Energy Information Administration. 2009. Available online: http://www.eia.gov/consumption/residential/ (accessed on 20 September 2021).
- Goulder, L.H.; Schein, A.R. Carbon taxes versus cap and trade: A critical review. Clim. Chang. Econ. 2013, 4, 1350010. [Google Scholar] [CrossRef]
- Wang, M.; Zhou, P. Impact of Permit Allocation on Cap-and-trade System Performance under Market Power. Energy J. 2020, 41. [Google Scholar] [CrossRef]
- Groenenberg, H.; Blok, K. Benchmark-based emission allocation in a cap-and-trade system. Clim. Policy 2002, 2, 105–109. [Google Scholar] [CrossRef]
- Muratori, M. Impact of Uncoordinated Plug-In Electric Vehicle Charging on Residential Power Demand—Supplementary Data; National Renewable Energy Laboratory-Data (NREL-DATA): Golden, CO, USA, 2017. [Google Scholar]


| Monthly Energy Consumption (kWh) | Number of Households | |||
|---|---|---|---|---|
| January | May | July | October | |
| 0–600 | 29 | 31 | 17 | 43 |
| 601–800 | 61 | 80 | 53 | 71 |
| 801–1000 | 54 | 59 | 58 | 60 |
| 1001–1200 | 11 | 21 | 32 | 14 |
| 1201–1400 | 9 | 6 | 22 | 6 |
| 1401–1600 | 15 | 1 | 9 | 3 |
| 1601–1800 | 9 | 0 | 5 | 1 |
| 1801–2000 | 3 | 2 | 2 | 1 |
| 2001–2200 | 2 | 0 | 2 | 1 |
| >2200 | 7 | 0 | 0 | 0 |
| Parameter | Aggressive Strategy | Moderate Strategy | Soft Strategy |
|---|---|---|---|
| Cap Value as percentile of the Population’s Monthly Energy Consumption | 15 percentiles | 30 percentiles | 45 percentiles |
| Cap Charge | $0.50 | $0.20 | $0.12 |
| Average Energy Token Price | $0.20 | $0.15 | $0.10 |
Publisher’s Note: MDPI stays neutral with regard to jurisdictional claims in published maps and institutional affiliations. |
© 2021 by the authors. Licensee MDPI, Basel, Switzerland. This article is an open access article distributed under the terms and conditions of the Creative Commons Attribution (CC BY) license (https://creativecommons.org/licenses/by/4.0/).
Share and Cite
Aoun, A.; Ibrahim, H.; Ghandour, M.; Ilinca, A. Blockchain-Enabled Energy Demand Side Management Cap and Trade Model. Energies 2021, 14, 8600. https://doi.org/10.3390/en14248600
Aoun A, Ibrahim H, Ghandour M, Ilinca A. Blockchain-Enabled Energy Demand Side Management Cap and Trade Model. Energies. 2021; 14(24):8600. https://doi.org/10.3390/en14248600
Chicago/Turabian StyleAoun, Alain, Hussein Ibrahim, Mazen Ghandour, and Adrian Ilinca. 2021. "Blockchain-Enabled Energy Demand Side Management Cap and Trade Model" Energies 14, no. 24: 8600. https://doi.org/10.3390/en14248600