Article

Intelligent Service Selection in a Multi-Dimensional Environment of Cloud Providers for Internet of Things Stream Data through Cloudlets

by
Omid Halimi Milani
1,
Seyyed Ahmad Motamedi
2,
Saeed Sharifian
2 and
Morteza Nazari-Heris
3,*
1
Department of Electrical and Computer Engineering, University of Illinois at Chicago, Chicago, IL 60607, USA
2
Department of Electrical Engineering, Amirkabir University of Technology (Tehran Polytechnic), Tehran 159163-4311, Iran
3
Department of Architectural Engineering, 104 Engineering Unit A, Pennsylvania State University, University Park, PA 16802, USA
*
Author to whom correspondence should be addressed.
Energies 2021, 14(24), 8601; https://doi.org/10.3390/en14248601
Submission received: 29 October 2021 / Revised: 2 December 2021 / Accepted: 10 December 2021 / Published: 20 December 2021

Abstract

:
The expansion of Internet of Things (IoT) services and the huge amount of data generated by different sensors signify the importance of cloud computing services such as Storage as a Service more than ever. IoT traffic imposes such extra constraints on the cloud storage service as sensor data preprocessing capability and load-balancing between data centers and servers in each data center. Furthermore, service allocation should be allegiant to the quality of service (QoS). In the current work, an algorithm is proposed that addresses the QoS in storage service allocation. The proposed hybrid multi-objective water cycle and grey wolf optimizer (MWG) considers different QoS objectives (e.g., energy, processing time, transmission time, and load balancing) in both the fog and cloud Layers, which were not addressed altogether. The MATLAB script is used to simulate and implement our algorithms, and services of different servers, e.g., Amazon, Dropbox, Google Drive, etc., are considered. The MWG has 7%, 13%, and 25% improvement, respectively, in comparison with multi-objective water cycle algorithm (MOWCA), k-means based GA (KGA), and non-dominated sorting genetic algorithm (NSGAII) in metric of spacing. Moreover, the MWG has 4%, 4.7%, and 7.3% optimization in metric of quality in comparison to MOWCA, KGA, and NSGAII, respectively. The new hybrid algorithm, MWG, not only yielded to the consideration of three objectives in service selection but also improved the performance compared to the works that considered one or two objective(s). The overall optimization shows that the MWG algorithm has 7.8%, 17%, and 21.6% better performance than MOWCA, KGA, and NSGAII in the obtained best result by considering different objectives, respectively.

Graphical Abstract

1. Introduction

Cloud computing is a new Internet-based technology that stores data on servers and makes it available to clients on demand. Two of the most important drivers in its increased utilization are cost reductions and the streamlining of technological infrastructure [1]. In recent years, cloud computing has gotten a lot of press in both the corporate and academic worlds. This is a service- and application-related technology that runs on a distributed network, employs virtual resources, and may be accessed via networking and Internet standards [2,3]. The Internet of Things (IoT) and its potential needs have enhanced the importance of cloud computing. The number of cloud-based servers that provide the proper structure for IoT manifestation has expanded. Plus, there are a large number of users and sensors that produce a high volume of data [4]. The proper usage of cloud services based on QoS criteria is essential. Furthermore, sensors have a limited battery and should work for a long time without a need to recharge. Distributed clouds can be helpful in processing IoT sensors’ data [5].
One of the issues that must be considered in modern systems is energy consumption, which should be considered on both sides, users and servers. Furthermore, optimal energy consumption can have a significant impact on reducing air pollution. According to data released in 2014, the American data centers consumed 70 billion KW/h of Electrical energy. Therefore, there is a lot of research focusing on energy consumption [6,7,8]. On the other side, building energy efficiency and estimating building occupancy information effectively in real time as well as reducing the energy consumption in non-residential buildings are studied widely in the literature [9,10]. Large companies such as Amazon, Google, Salesforce, Microsoft, and IBM have begun to set up a new data center to host Internet applications and data processing centers. The current service providers give users the option of using services based on their demands and paying according to their usage (pay as you go) [11]. The necessity of maintaining data drives the usage of storage services [12]. To address overload in one service, load balancing among different services was proposed in the literature [13,14].
IoT devices include many examples of sensors that have different applications in smart homes, healthcare, transportation, building, and cities. Storing data in cloud services is cost effective, which is practical in addressing the high demand for IoT devices. However, cloud storage services face challenges such as energy consumption and load balancing among services [14,15]. The existence of different service providers makes it difficult to choose the proper service. Furthermore, the network has an arbitrary topology, and selecting an appropriate service among the available services of different service providers becomes another issue that should be considered. Another commonly discussed issue in cloud computing is the processing time. The needed time to process various data is based on data type, size, and rates [16,17]. There are several works around service allocation.
To the best of our knowledge, there is no work with capabilities of minimizing energy consumption and reducing service completion time, in addition to addressing load balancing among services, and the short comparison is available in the table. Considering different services from a variety of service providers is also addressed in the present work. A hybrid modified MOWCA and GWO algorithm have been proposed in the present study. The modified algorithm can explore better; as a result, a better solution set can be proposed. Two layers, fog and cloud, will be managed simultaneously to have a comprehensive solution. Finally, a structured technique for analyzing complex decisions in addition to different methods is used to evaluate the proposed algorithm.
The remainder of this paper is organized as follows: In Section 2, a brief discussion about recent articles in this area is presented. Architecture, algorithms, and mathematical models are presented in Section 3. In Section 4, the proposed method is evaluated and compared to other works. In Section 5, the paper is concluded.

2. Related Work

Cloud computing and IoT are used in a variety of fields, including medical engineering and social media [18]. A variety of architectures and algorithms are proposed in this area to fulfill users’ demands efficiently.

2.1. Architectures in Service Allocation

Some cloud-based architecture is centralized, and the centralized architecture creates a latency in the processing and storing of data. The latency is because of the great distance between IoT devices and cloud providers. Therefore, the fog architecture can reduce latency. Managing energy consumption is presented in edge computing for IoT (ECIoT) architecture and leads to an optimal solution [19]. Fog computing was introduced in 2012 by researchers of the Cisco company with a new view to the set of all networks (including 3 G/4 G/LTE/5 G) and everything (all smart objects, Internet of Everything) with a hierarchical structure. Using the architecture expressed in fog–cloud, the energy optimization of both cloud and fog layers can be managed simultaneously to contribute to the IoT development goal [20]. Fog computing architecture involves three main layers: IoT devices as the first layer, the fog layer as the second layer, and finally, the cloud layer [8,15].
Cloudlet is a project presented by a group of researchers from Mellon University [21]. The goal of using cloudlets is to have available resources near the IoT devices. Data compromise risk is reduced by having edge computing. Cloudlets have more capacity for processing and battery power in comparison to other fog nodes.

2.2. Algorithms in Service Allocation

Researchers have indicated that service allocation is an NP-hard problem. There are no polynomial-time algorithms for NP-hard problems. Some research focused on designing a deep neural network, the hybrid usage of deep neural networks, and metaheuristic algorithms, which all can be considered as alternative solutions. In the current study, there are different services available to be selected; however, considering the proper service is challenging. Moreover, there are different objectives considered in this work that boost the probability of trapping at a local minimum. To escape from the local minimum, bio-inspired algorithms are considered as they have shown a good capability for handling this issue [22]. A bunch of studies is concentrated on load balancing. Researchers are using definitive and innovative methods in a fair distribution of loads among services. The primary objective of load balancing is preventing overload in services. In [23], a random algorithm is used for outsourcing data to different services in which the physical distance is a criterion for selecting a service. In some cases, service failure occurs due to a lack of attention to the load balancing between services [24]. In [25], using the honeybee algorithm and introducing a new algorithm named honey bee behavior–inspired load balancing (HBB-LB) address equitable load distribution between virtual machines and maximizes processing speed. Round robin is also used for equitable load distribution. Broberg et al. [26] chose low-cost cloud storage services with the meta content delivery network (CDN) method. They found and optimized service selection based on its cost; the process did not encompass an equitable load distribution between storage services [27,28]. In [29,30], a kind of NSGAII is used to address load balancing as the main criteria.
Some studies are performed to reduce completion time. Services have different processing speeds [31]. In [32], a model for load balancing on the Internet is presented, aiming to reduce the overall processing time for different tasks. In the other work, both the firefly algorithm and particle swarm optimization are made to balance the load of the entire system and reduce the makespan as well [33]. In [34], the MOGWO method, which is one of the multi-objective algorithms, is used to distribute data equitably among virtual machines and to reduce the working time. In [35], by using the GWO algorithm, the time of the makespan is diminished, and other determinants of QoS are not considered. In another research, the combined GWO and cuckoo search algorithm is used to minimize the makespan and to reduce the needed services [36]; however, other aspects of service allocation are not considered. In [37], the integer programming method is used to reduce the cost of storing data and data retrieval time in a multi-cloud provider environment. In [38], particle swarm optimization (PSO) is used to minimize the cost of the sending and processing of different tasks. The game theory is used for task scheduling in [39] for designing the mathematical model. The algorithm is proposed to deal with big data and to consider energy consumption. However, the available bandwidth as one of the factors in transmitting data and energy consumption is not considered. In [40], an adaptive mode for assigning different services for tasks by considering the time is used. In [41], the proposed algorithm is used to achieve the minimum energy and running time in which load balancing is not considered. In [42], in addition to minimizing energy consumption, the GWO and BAT algorithms are used to distribute the work equitably among services. In another research, energy and cost are optimized in service allocation [43]. In [44], the NSGAII algorithm is used to achieve the minimum energy and makespan for service allocation in which load balancing is not considered. The Pareto’s results as one of the important factors in multi-objective problems are improved. Both energy consumption and load balancing between solutions are considered while satisfying the spacing metric [45]. Table 1 summarizes and compares the proposed model in this study with those introduced in the literature.

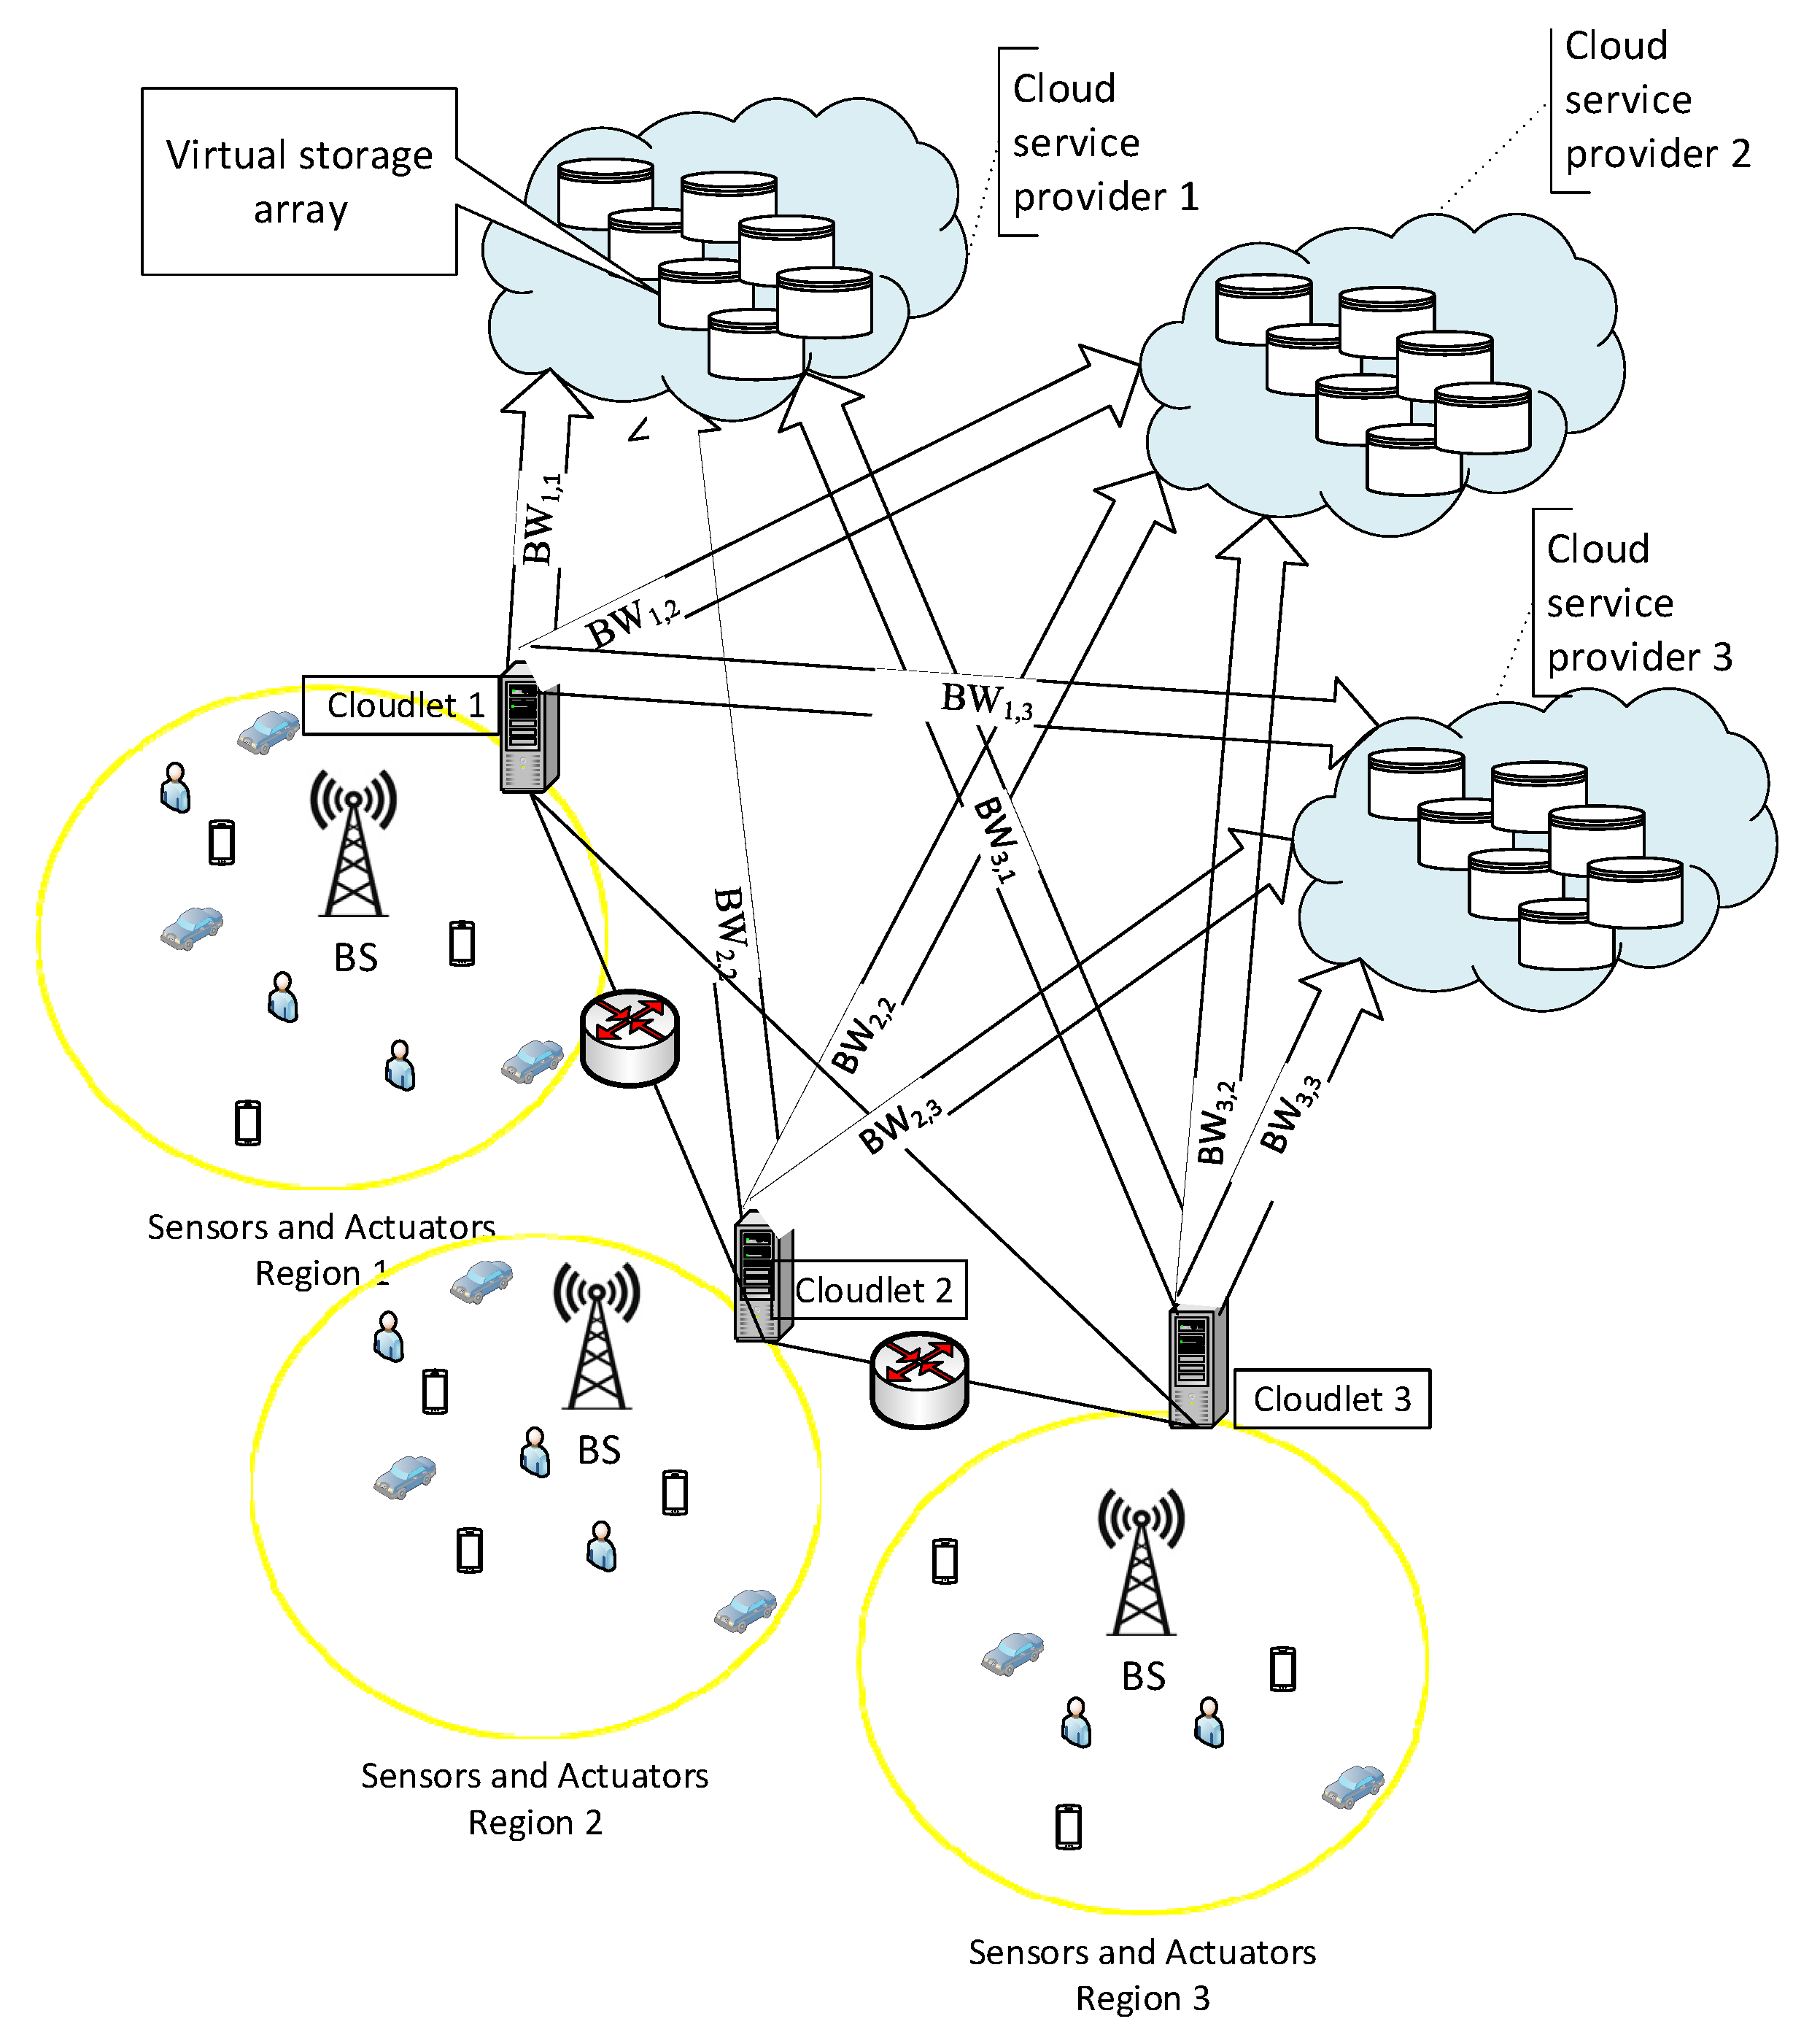
3. Proposed Algorithm for Fog–Cloud Architecture

The system model consists of different parts, as illustrated in Figure 1. Storing data as fast as possible by consuming less energy is critical. The first cloudlets are assumed as the first sub-layer in the presented model. Neighbor cloudlets are considered as a second sub-layer in the model. To accomplish the processing of data as quickly as possible, the distribution of data among different cloudlets is adopted to avoid overload. Using the distributed model is not only limited to failure in service allocation but also reduces energy consumption. The reliability of the system is reduced by rejecting a request from different users. Furthermore, rejecting requests destroys the service level agreement. The distribution of data among various services increases the availability of services due to more available free space. The availability of different services is one of the QoS factors. Therefore, the distribution of data among different services satisfies the QoS. By distributing data among services, failure in one service does not lead to loss of all data [8].
Each cloudlet manages a batch of data to be processed in or out of that cloudlet. The proposed algorithm runs in cloudlet to find appropriate services in and out of cloudlet in both layers. The storage capacity and CPU are both considered in service allocation.

3.1. Mathematics and Cost Functions

In this section, the mathematical model is introduced. In Table 2, the description of parameters is listed.

3.1.1. Mathematical Model for Energy Consumption

Servers consume energy in both idle and busy modes. According to [46], the energy consumption of servers can be represented by a linear relationship between energy consumption and CPU utilization. Energy consumption can be calculated according to the proportion of service usages [47]. The total energy consumption in allocating services to a batch of data is Etot.
E t o t = j = 1 m [ f j × ( ( E j b u s y E j i d l e ) × i = 1 n ( f i j × D i ) c p j + E j i d l e ) ] s . t .   i = 1 n f i j × D i c p j j = 1 , , m  
f j has two values: 1 when the service is utilized and 0 when the service is not used. f i j has two values and it can be either zero or one, it is 1 when data “i” is outsourced to service “j”.

3.1.2. Mathematical Model for Processing Time

Processing time has a direct relation to the size of data and a reverse relation to the number of CPUs in one service according to (2).
T c =   m a x j { i = 1 n f i j × D i C n j } ; j = 1 , 2 , , m

3.1.3. Mathematical Model for Load Balancing in the Fog Layer

As mentioned, load balancing will increase the availability of services. The load balancing in the fog layer is addressed in (3) [29].
L B c = 1 n i = 1 n ( c a p T i c a p C i c a p T c a p C ¯ ) 2

3.1.4. Mathematical Model for Transmission Time

The data are outsourced to the appropriate storage service after being pre-processed. The total transmission time for a batch of data is shown in (4).
T s = m a x j { i = 1 n z = 1 k x i z × D i B W j z } ; j = 1 , 2 , , m
xiz can be either zero or one, it is one when the storage services are selected, and it is 0 when the storage service is not selected.

3.1.5. Mathematical Model for Load Balancing in the Cloud Layer

There are different services that are suggested by a variety of service providers. The minimum value for (5) satisfies the reliability of the system.
L B s = 1 n i = 1 n ( c a p T s i c a p S i c a p T s c a p S ¯ ) 2
Different equations are addressed in this work, all of which are important for service selection to be considered all together, as a result, the multi-objective algorithms are proposed.

3.2. Proposed Hybrid Algorithm

The block diagram of the proposed algorithm is shown in Figure 2. Monitoring services and making the decision based on the gathered information are done in the first cloudlet in which the data are received.
The water cycle algorithm is adopted from nature. It is a population-based algorithm like a genetic algorithm [47]. Each member of the population is represented by 3 × n matrix (6).
L p i = { D 1 D 2 D n C a C b C c S a ´ S b ´ S c ´ }
The costs of different layers are shown in (7).
C o s t F o g _ l a y e r E t o t , T c , L B c C o s t s t o r a g e E t o t , T s , L B s
The goal is to minimize all five objects in the problem (8). No other solution cannot dominate a solution in the Pareto. In mathematical terms, p 1 P dominates p 2 P if two conditions are satisfied [48].
C o s t i ( p 1 ) C o s t i ( p 2 ) i { E t o t , T c , L B c , T s , L B s } and C o s t j ( p 1 ) C o s t j ( p 2 ) j { E t o t , T c , L B c , T s , L B s }
The number of solutions in the first iteration of the algorithm in the resultant Pareto is low, but gradually, the number of non-dominated solutions is increased by moving the answers to the global minimum in the proposed algorithm. In the MOWCA, the solutions are governed by the sea and the rivers. The answers go toward Pareto, and Pareto is going to be updated. Finally, the answers in Pareto are categorized as a sea and rivers based on crowding distance [49].

Hybrid Multi-Objective Water Cycle and Grey Wolf Optimizer (MWG)

Escaping from the local minimum is important and, for this reason, determining appropriate d m a x   is essential. Furthermore, G as a coefficient is used in the process of generating new solutions, and it is crucial for a better exploration of the solution space.
The GWO algorithm is one of the fastest optimization methods [50]. The MWG algorithm is the modified combined algorithm, which optimizes the hyperparameter of the multi-objective algorithm and provides better exploration in the solution space in comparison to the naïve ones. In the beginning, a population with 10 members is randomly generated. Each member of this population has three features based on three hyperparameters of multi-objective algorithm. MWG optimizes the objects based on the initialized values. Then, the MWG determines the crowding distance and dominant solutions. Crowding distance is calculated for all non-dominant solutions. The main objective of using crowding distance is to increase the diversity of solutions. In the rest of the paper, the mathematics of the algorithm is given and Table 3 includes the mathematical symbols.
In the exploration phase of the algorithm, new positions for rivers and streams are achieved based on Equations (9)–(11).
p S t r e a m j + 1 = p S t r e a m j + r a n d × G × ( p S e a j p S t r e a m j )
p S t r e a m j + 1 = p S t r e a m j + r a n d × G × ( p R i v e r j p S t r e a m j )
p R i v e r j + 1 = p R i v e r j + r a n d × G × ( p S e a j p R i v e r j )
A large value for d m a x prevents convergence, and a smaller value of d m a x tends to trap in the vicinity of the sea and reduces the exploration. The value of d m a x controls the position of different solutions around the sea, and it decreases gradually based on (12).
d m a x i + 1 = d m a x i d m a x i i t r
Finally, the position of a hunt is calculated as (13)–(16):
D α = | F X α X | D β = | F X β X | D δ = | F X δ X |
X 1 = | X α A ( D α ) | X 2 = | X β A ( D β ) | X 3 = | X δ A ( D δ ) |
The vectors of A and F are calculated based on (15).
A = 2 a r 1 a                         F = 2 r 2
X ( t + 1 ) = X 1 ( t ) + X 2 ( t ) + X 3 ( t ) 3
To get close to the prey, the amount of a reduces from 2 to 0 gradually. All the values in the obtained Pareto are normalized based on their objectives. The cost is defined as the summation of all five objectives for each solution in the Pareto. The best answer choice is the one with the minimum cost.
In the next iteration, for normalizing the achieved Pareto, the previously selected best results are considered. Unlike single-objective problems, which are concluded in one cost at the end of each iteration, there is a Pareto in multi-objective algorithm, which involves different solutions at the end of each iteration.

4. Simulation

The number of CPUs in a service plays an important role in the processing speed. For example, t2.nano has one CPU, and t2.large has two CPUs, all of which are assumed in the simulation environment as a variety of available services [51]. The cloud services have different throughputs, which lead to different transmission times. Table 4 illustrates the different cloud service providers’ throughput, which is adapted from [52]. Different data volume is considered according to real IoT sensors’ data for storing in three batches. For different scenarios, different batch sizes are considered. Moreover, 80% of services are contemplated to be needed to fulfil the demand for a batch of size 400 to validate the reliability of service allocation. The data size has a uniform distribution between 20 and 500 for each batch of data [52,53].
There is a relationship between the number of CPUs and energy consumption in each service. According to the SPECpower benchmark, the maximum power consumption was assumed to be 250 W for each CPU. To consider energy, 200 W in the idle mode and 300 W in the busy mode were assumed for each CPU [54].

4.1. Simulation Setups

It is assumed that there are 32 storage services in the cloud layer and 32 processing services in the fog layer. There are multi-objective algorithms that addressed energy and load-balancing in service selection in recent years, such as NSGAII and the modified GA called KGA. In the KGA, k-means is used to have an elitist set of the population [29]. The average results of 10 separate runs for each algorithm are calculated. The Pareto’s answers are sorted, and the mean of 10 separate Paretos is calculated for each objective. The results are reported in the BOX diagram, which has a quartet and means. The box diagram gives a better visual distribution of solutions for each objective in the resultant Pareto. Numerical experiments are conducted using MATLAB on a Laptop with a Core i7 2.59–2.60 GHz CPU. The number of populations for the first part of the MWG algorithm is 10, and for the second part of the MWG algorithm it is 50.
The setting parameters of other algorithms in the simulation are listed in Table 5.

4.2. Evaluation

In Figure 3, the distribution of different solutions’ energy consumption in the Pareto of various algorithms is shown. Based on Figure 3, the percentage of the resultant solutions, which have a minimum energy consumption from MWG, is more in comparison to the other algorithms’ result. Thus, it gives us more options in selecting the best solution that satisfies other objectives (e.g., processing time, load balancing). Meanwhile, the resultant solution from MWG has a minimum energy consumption in comparison to the other algorithms’ result.
In the MWG, rivers and seas lead other answers toward the optimum solution. The number of solutions in Pareto for MWG is more than that in the other two KGA and NSGAII algorithms based on energy consumption criteria. Figure 4 shows the distribution of different solutions’ processing time in the Pareto for different algorithms. If time plays a critical role, the MWG recommends some solutions that have less processing time in comparison to other algorithms, even for a specific case, such as the maximum demand scenario.
Another factor that should be considered for the service allocation is the load balancing between the VMs in the cloudlet as well as services from different cloudlets.
Figure 5 shows the distribution of different solutions’ load balancing in the Pareto of various algorithms. Service may fail because of the overload. Thus, having a fair distribution of data among services increases reliability as one of the critical factors in QoS. NSGAII and KGA use the method of mutation and crossover. These methods are good in escaping from a local minimum; they are random-based methods in which the global minimum may be ignored as well. Based on Figure 5, the resultant solution from MWG has a minimum energy consumption in comparison to the other algorithms’ result.
On the other hand, many services such Dropbox, after processing data, outsource data to cloud storage services for storing. Service providers around the world provide a variety of services for users. The throughput of different service providers varies. Therefore, the needed time to outsource data to cloud services varies based on available bandwidth. Figure 6 shows the distribution of different solutions’ transmission time in the Pareto of various algorithms. Based on Figure 6, the percentage of the resultant solutions that have a minimum transmission time from MWG are more in comparison to the other algorithms’ result. Therefore, it gives us more options in selecting the best solution that satisfies other objectives (e.g., processing time, load balancing). Meanwhile, the resultant solution from MWG has a minimum transmission time in comparison to the other algorithms’ result.

4.3. Metric of Spacing

The statistic factor for comparing two different multi-objective algorithms is the regularity of answers in the Pareto. This factor is demonstrated with a metric of spacing. Regularity in different algorithm’s Pareto is calculated based on (17).
S P = 1 n p f 1 i = 1 n p f ( d i ρ d ¯ ρ ) 2
The other important factor in the multi-objective algorithms is to have a comprehensive solution. Solutions should consider all objectives and have a better distribution. The smaller value for SP based on (17) shows that the solutions in the Pareto are distributed better than in the one with a larger value for SP. The average metric of spacing for MWG is improved 7%, 13%, and 25% in comparison to that for MOWCA, KGA, and NSGAII, respectively. Detailed results are listed in Table 6.

4.4. Metric of Quality

The quality of the Pareto shows the difference between the optimum and obtained results. Since the optimum solutions are not defined in NP-HARD problems, the new method is suggested in which the quality of Pareto among different algorithms can be compared.
In Algorithm 1, all solutions are gathered from different algorithms’ Pareto. Solutions are sorted based on the non-dominated solution. Then, solutions are sorted based on crowding distance. Finally, an aggregated Pareto is achieved. The number of solutions from each algorithm’s Pareto in the Aggregated Pareto shows the quality of different algorithms in comparison to each other. By considering all workloads, the MWG algorithm has 4%, 4.7%, and 7.3% advantages in metric of quality in comparison to MOWCA, KGA, and NSGAII, respectively.
Algorithm 1 Pareto Quality Function (Metric of Quality)
Inputs: Different Algorithms’ solutions in their Pareto
Output: The percentage of each Algorithms’ solutions in the new optimum Pareto
1: Insert Pareto of the AlgorithmsTT
2: pop ← Nondominated Sorted population
3: CD ← Crowding Distance (pop)
4: Aggregated Pareto ← Sort pop based on CD
5: N a ← Number of Algorithms
6: for k = 1 to N a do
7:  for j = 1 to Number of Solutions in Kth Algorithm’s Pareto do
8:    if Solutionsj  Aggregated Pareto Set then
9:    end if
10:   end for
11:   Metric of Quality(k) = N ( k ) N s p
12: end for

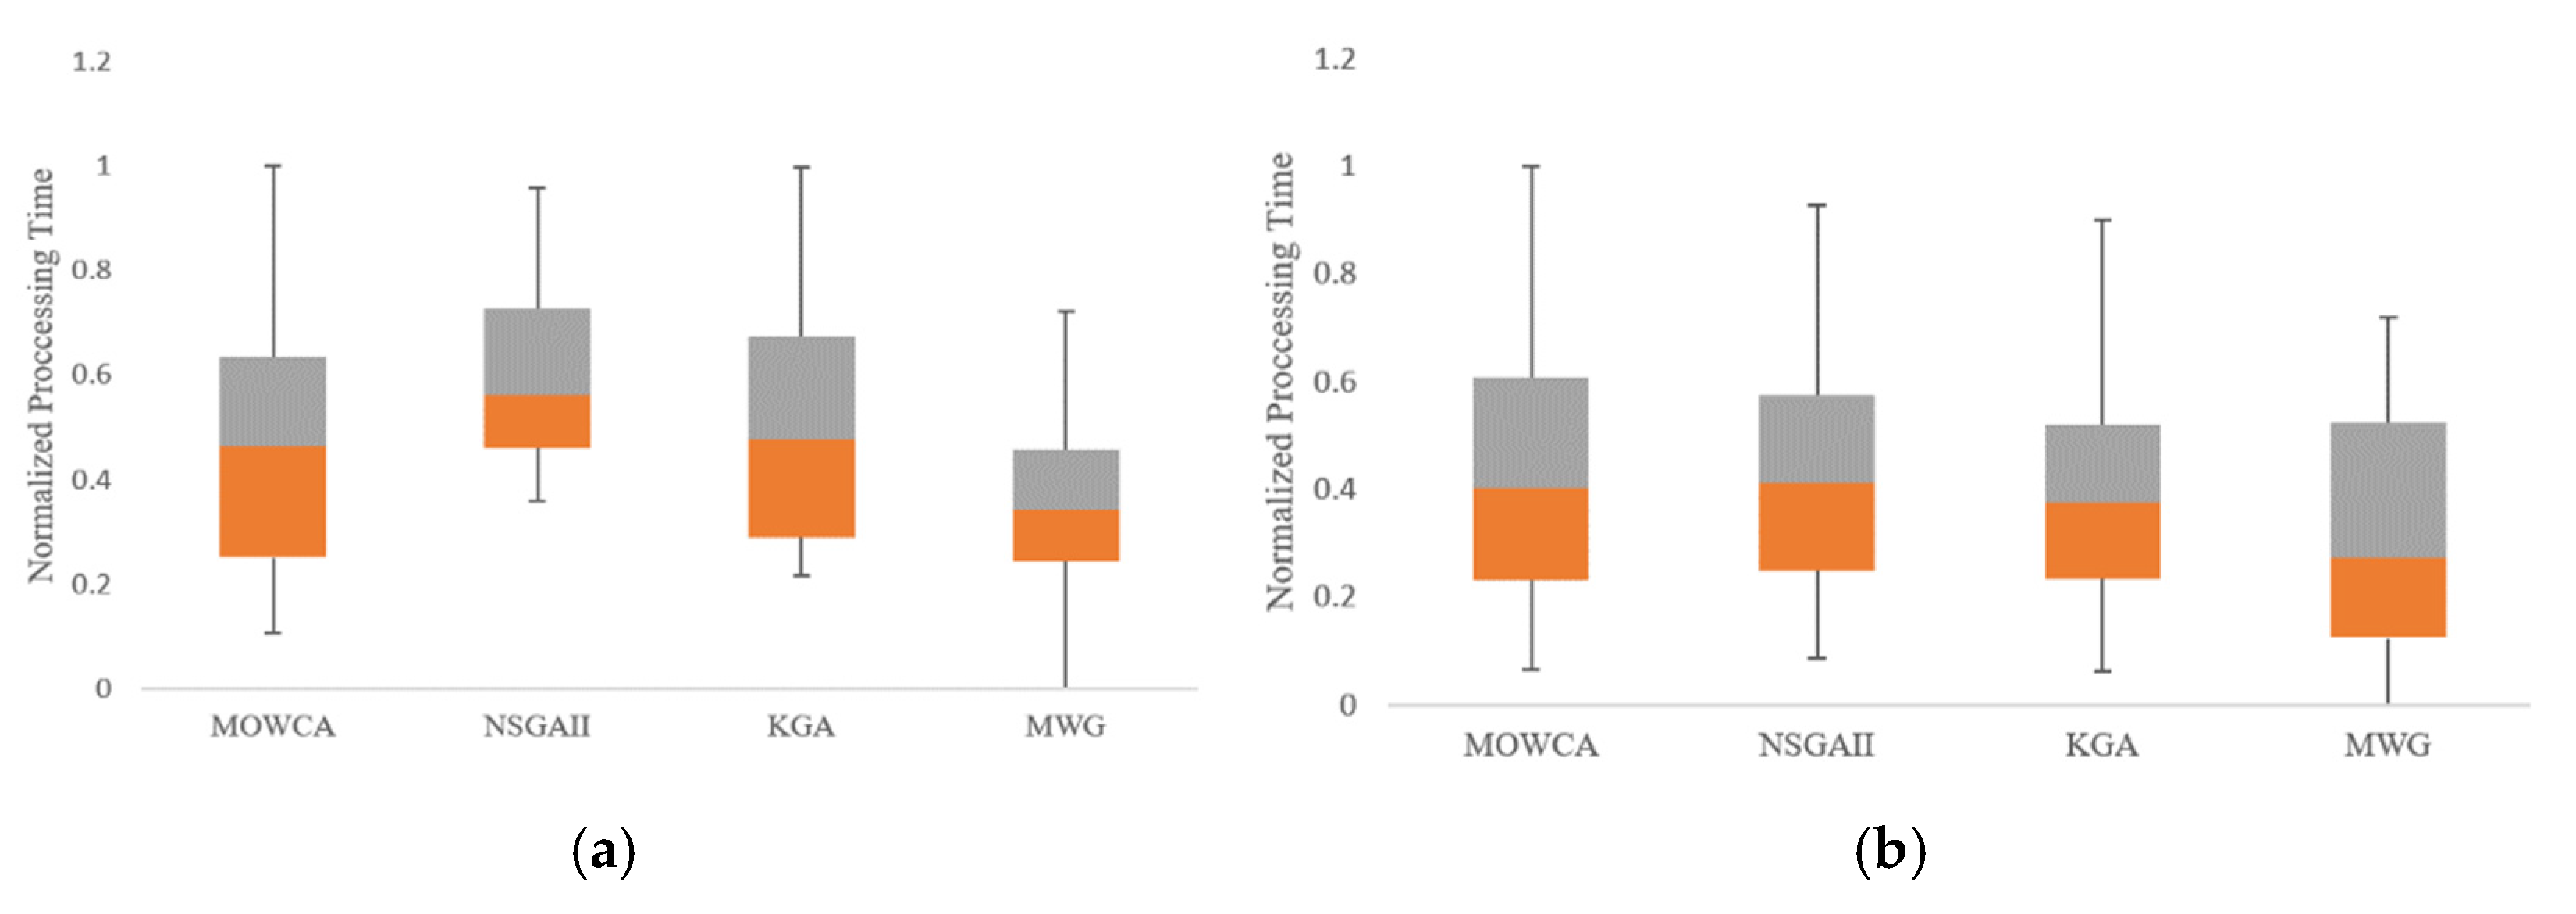
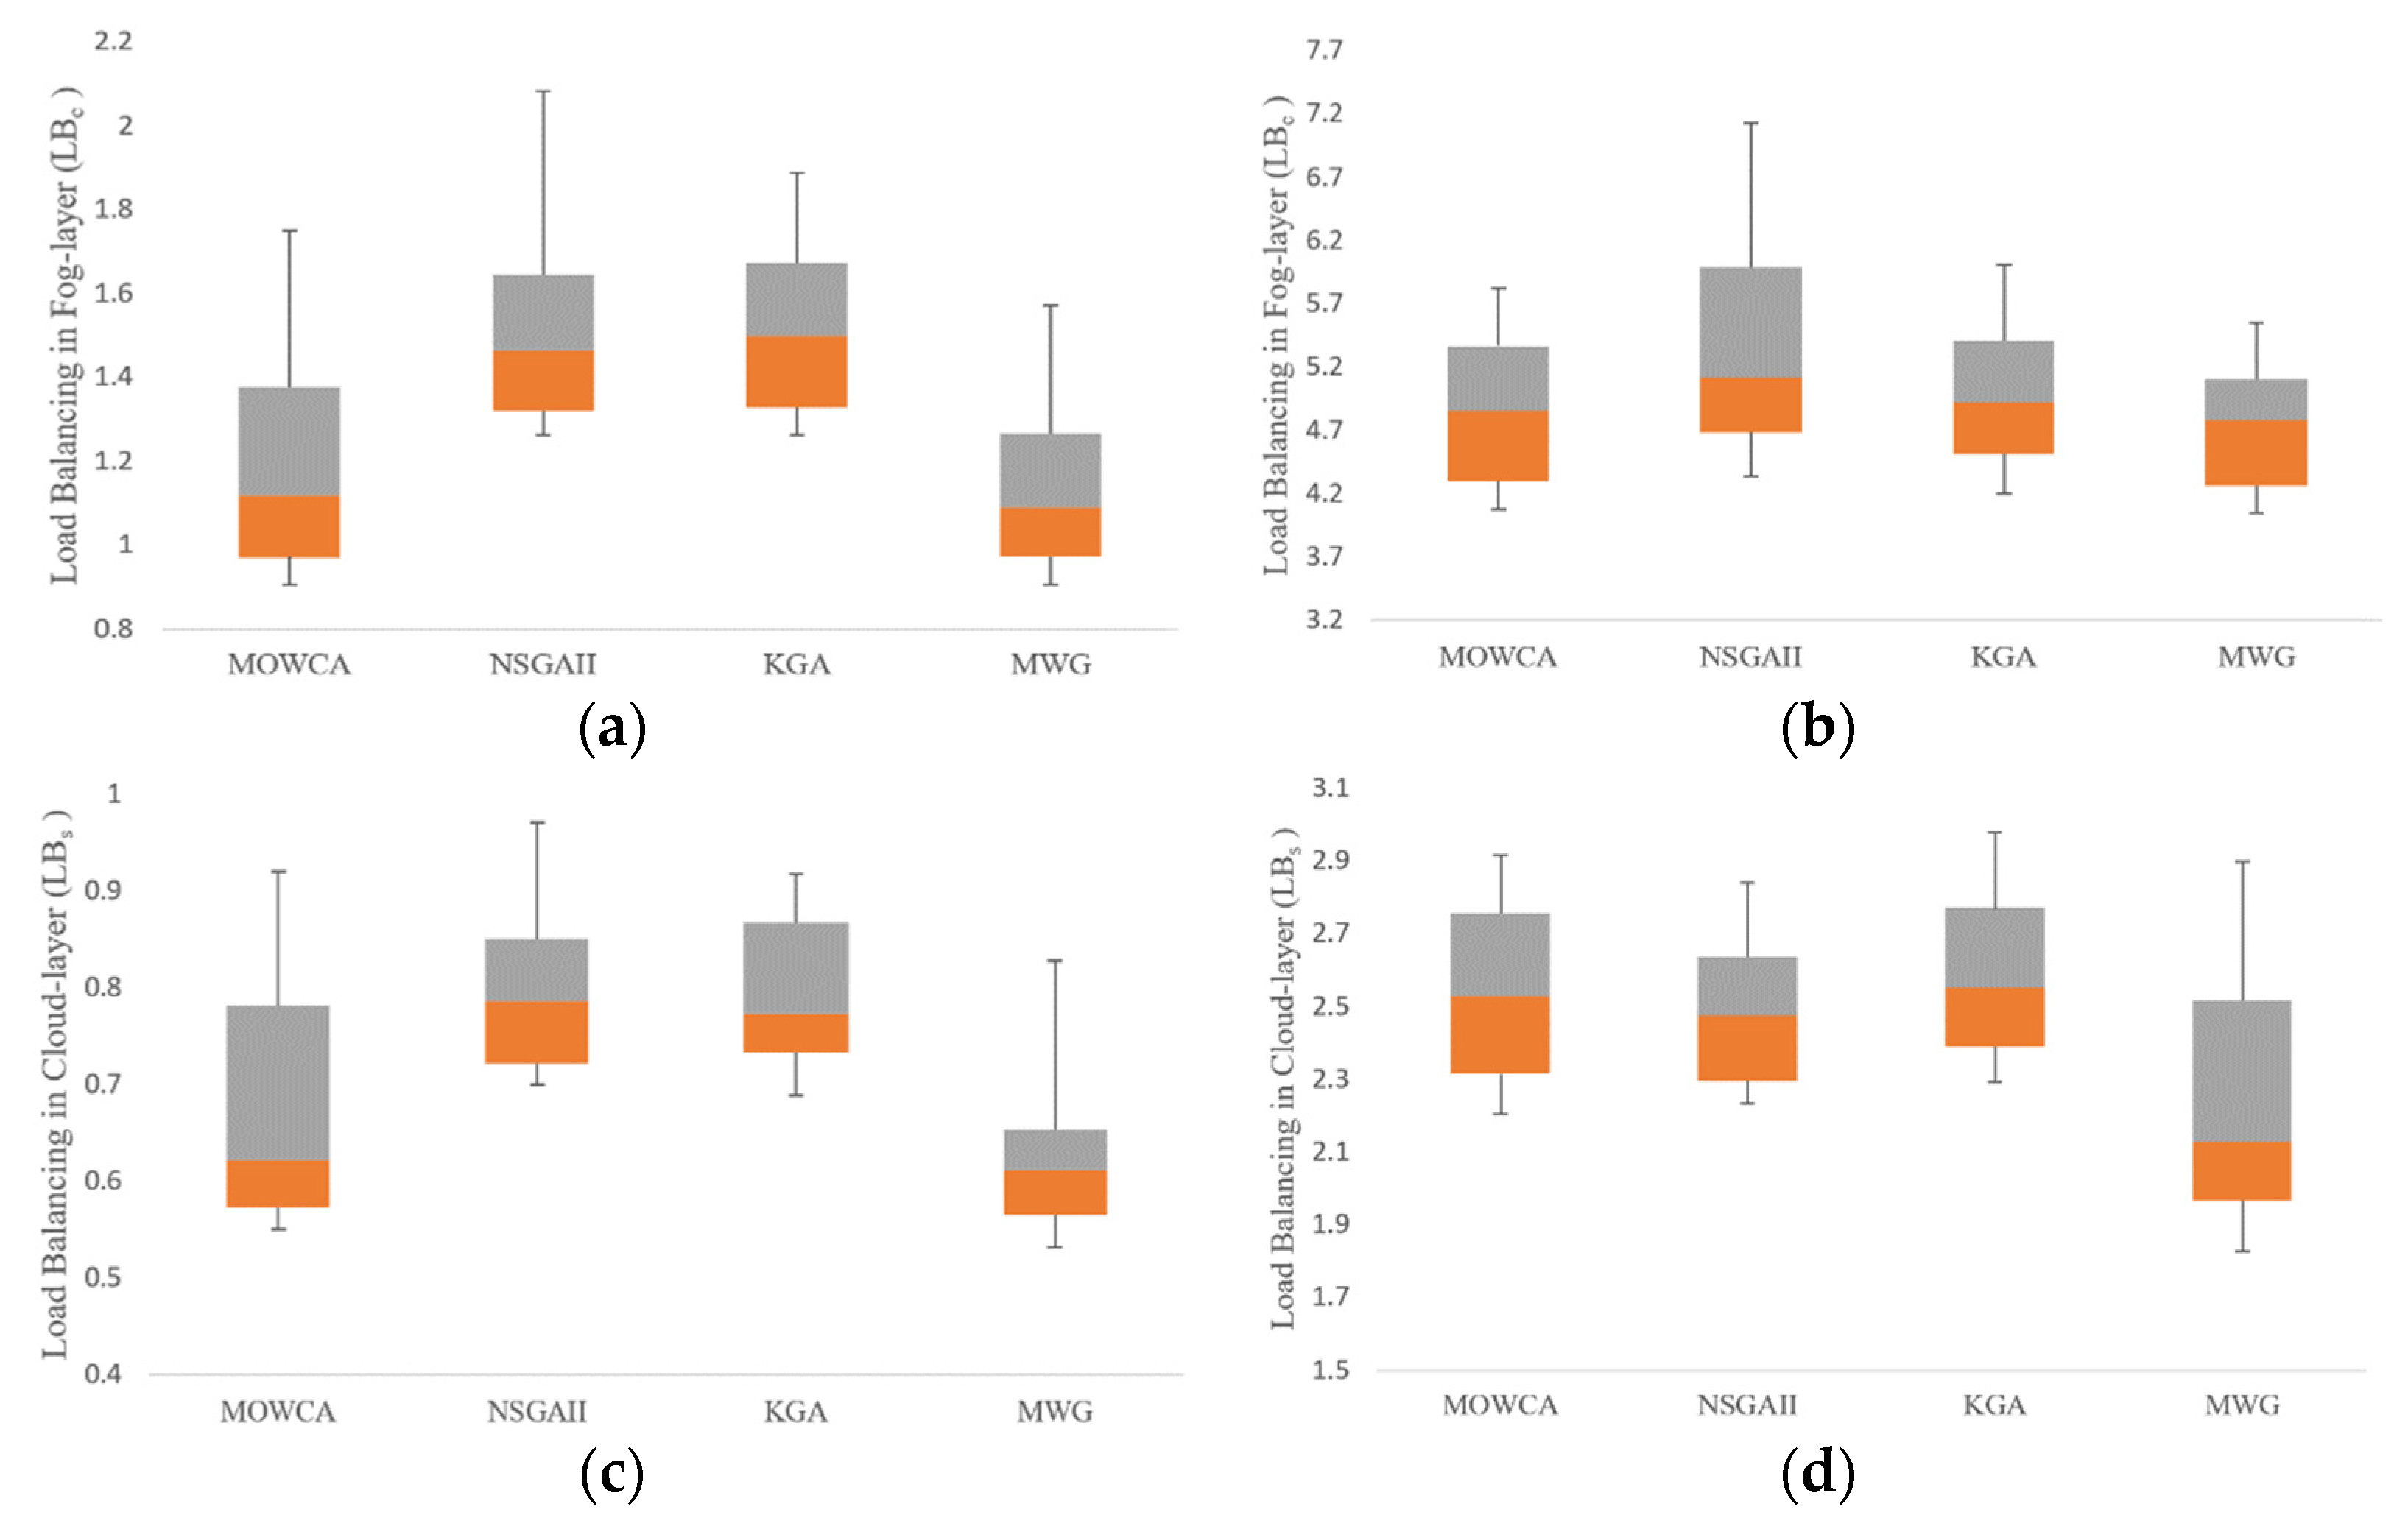
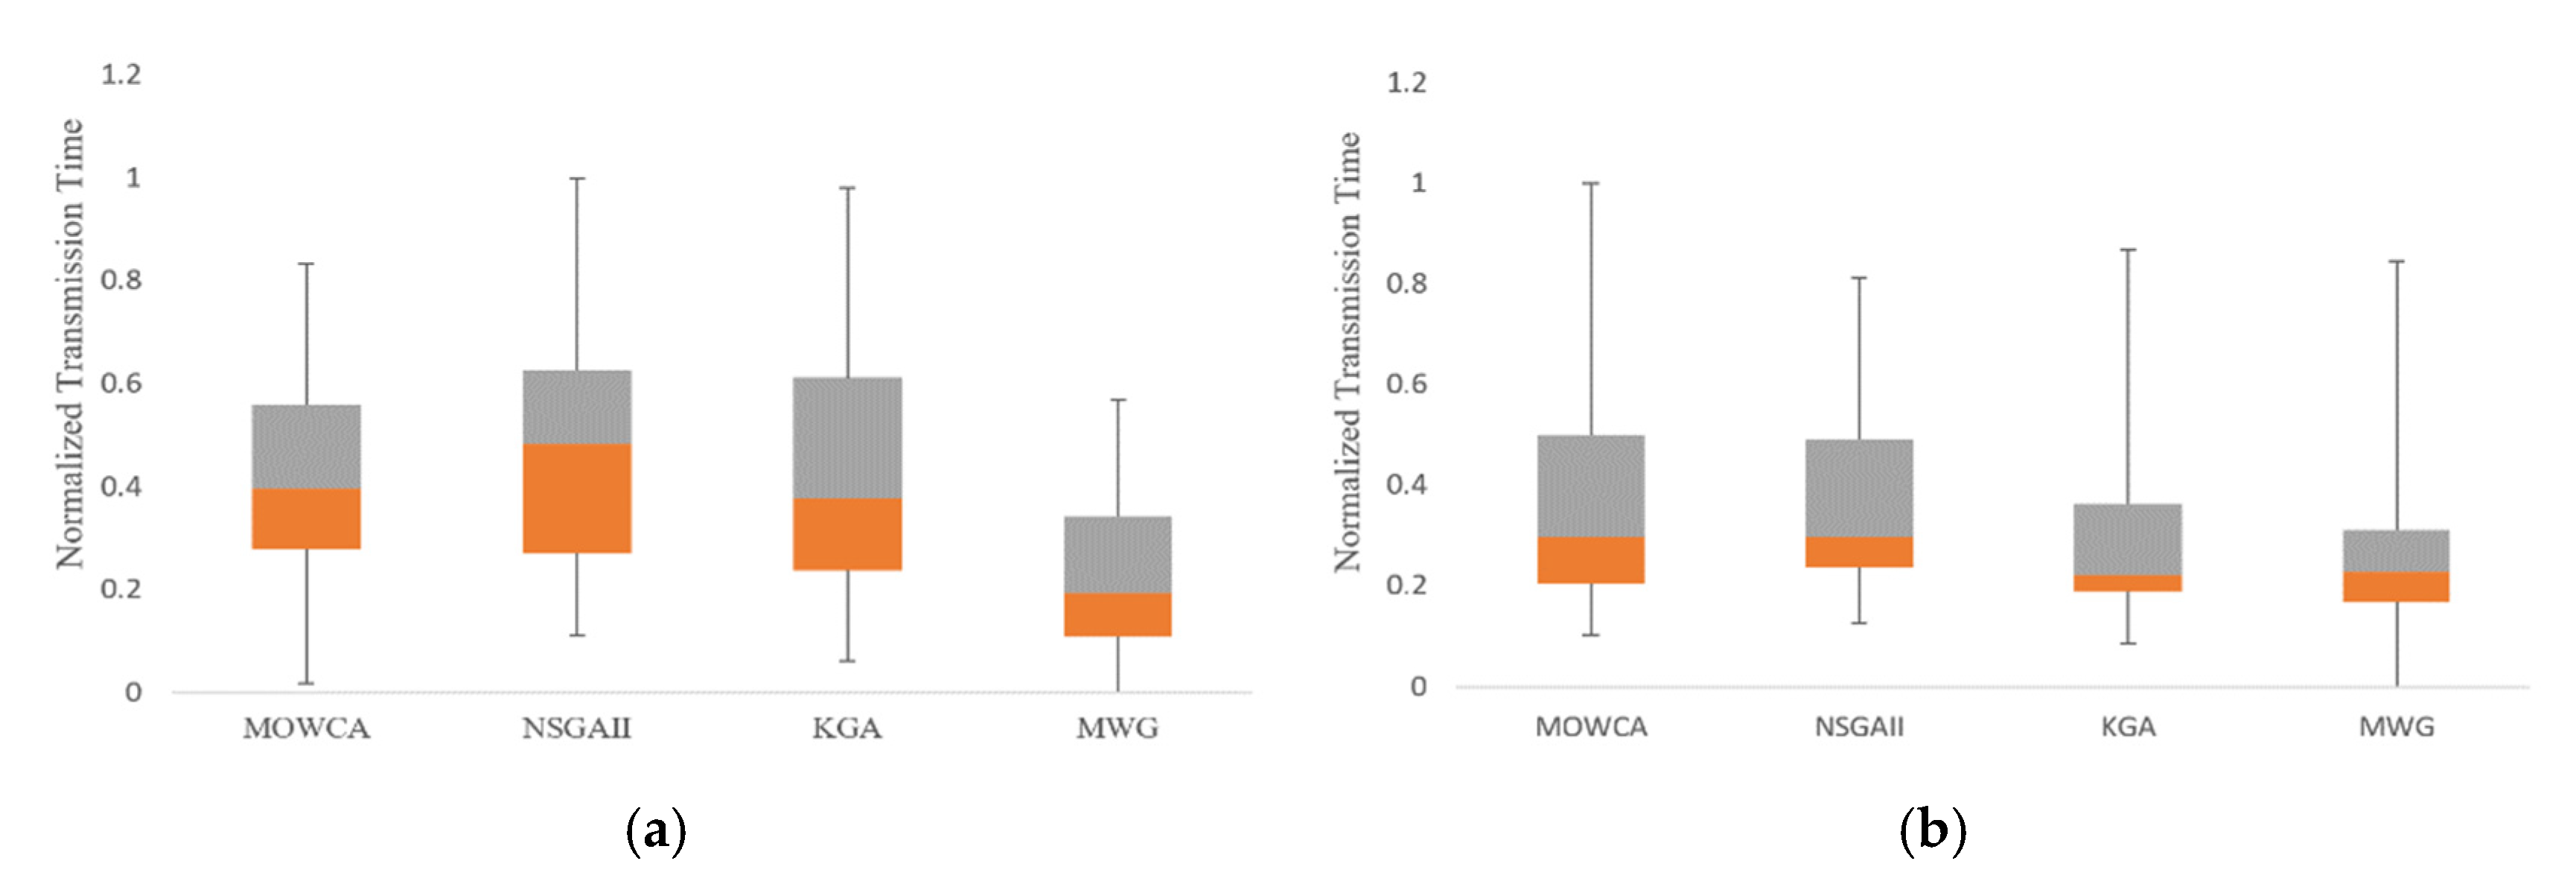
4.5. Evaluation of the Optimum Result

The answer choice with the minimum cost is considered as the best in each Pareto based on the analytic hierarchy process (AHP) [55]. The alternatives are solutions in the Pareto, and the criteria are the mentioned five objectives. All objectives are considered to have the same importance. The best solution among the Pareto’s solutions of each algorithm is determined based on AHP. Table 7 shows a comparison between different algorithms in each objective (e.g., the MWG has a 32.15% improvement in processing time for 200 data items).
The overall optimization results show that MWG algorithm has 7.8%, 17%, and 21.6% better performance in comparison with MOWCA, KGA, and NSGAII based on the obtained result from Pareto.

5. Conclusions

This paper presented a new hybrid multi-objective algorithm for storage service selection in a collaborative and heterogeneous cloud and fog environment. Five objectives are considered altogether in the proposed work. The mathematical models for energy, load-balancing, and time are proposed in this study. Numerical experiments are conducted to compare the performances of the proposed MWG, MOWCA, KGA, and NSGAII. Testing results in a case study demonstrate the better performances of MWG in metric of spacing and metric of quality in comparison to MOWCA, KGA, and NSGAII. In comparison to MOWCA, KGA, and NSGAII, the average metric of spacing for MWG improved by 7%, 13%, and 25%, respectively. On the other hand, the total optimization findings reveal that the MWG algorithm outperforms MOWCA, KGA, and NSGAII by 7.8%, 17%, and 21.6%, respectively, based on the Pareto result. The analysis of the obtained results show that the energy consumption is reduced, fair load distribution among services is achieved, and the time for processing and transmitting is optimized. The Pareto and the optimum result show the superiority of the proposed hybrid MWG algorithm in comparison to other algorithms in service selection. In future works, the influence of other parameters, such as the node price will be added as an object to the mathematical model, which will be analyzed in more detail. Additionally, other practical applications will be considered, such as latency and user’s demands and constraints. Furthermore, the algorithm with better performance in terms of quality of service can be proposed.

Author Contributions

Conceptualization, O.H.M., S.A.M. and S.S.; methodology, O.H.M.; software, O.H.M.; validation, S.A.M., S.S. and M.N.-H.; formal analysis, O.H.M. and M.N.-H.; investigation, O.H.M.; resources, M.N.-H.; data curation, O.H.M.; writing—original draft preparation, O.H.M.; writing—review and editing, S.A.M., S.S. and M.N.-H.; visualization, O.H.M., S.A.M. and S.S.; supervision, S.A.M. and S.S.; project administration, S.A.M., S.S. and M.N.-H. All authors have read and agreed to the published version of the manuscript.

Funding

This research received no external funding.

Institutional Review Board Statement

Not applicable.

Informed Consent Statement

Not applicable.

Data Availability Statement

Not applicable.

Conflicts of Interest

The authors declare no conflict of interest.

References

  1. Palos-Sanchez, P.R. Drivers and barriers of the cloud computing in SMEs: The position of the European union. Harv. Deusto Bus. Res. 2017, 6, 116–132. [Google Scholar] [CrossRef]
  2. Palos-Sanchez, P.R.; Arenas-Marquez, F.J.; Aguayo-Camacho, M. Cloud computing (SaaS) adoption as a strategic technology: Results of an empirical study. Mob. Inf. Syst. 2017, 2017, 2536040. [Google Scholar] [CrossRef] [Green Version]
  3. Rezaei, R.; Chiew, T.K.; Lee, S.P.; Aliee, Z.S. A semantic interoperability framework for software as a service systems in cloud computing environments. Expert Syst. Appl. 2014, 41, 5751–5770. [Google Scholar] [CrossRef]
  4. Singh, S.P.; Nayyar, A.; Kumar, R.; Sharma, A. Fog computing: From architecture to edge computing and big data processing. J. Supercomput. 2018, 75, 2070–2105. [Google Scholar] [CrossRef]
  5. Baker, T.; Asim, M.; Tawfik, H.; Aldawsari, B.; Buyya, R. An energy-aware service composition algorithm for multiple cloud-based IoT applications. J. Netw. Comput. Appl. 2017, 89, 96–108. [Google Scholar] [CrossRef] [Green Version]
  6. Varghese, B.; Buyya, R. Next generation cloud computing: New trends and research directions. Future Gener. Comput. Syst. 2018, 79, 849–861. [Google Scholar] [CrossRef] [Green Version]
  7. Singh, S.; Chana, I.; Singh, M.; Buyya, R.; Gill, S.S. SOCCER: Self-optimization of energy-efficient cloud resources. Clust. Comput. 2016, 19, 1787–1800. [Google Scholar] [CrossRef]
  8. Jain, A.; Pattanaik, K.K.; Kumar, A.; Bellavista, P. Energy and congestion aware routing based on hybrid gradient fields for wireless sensor networks. Wirel. Netw. 2020, 27, 175–193. [Google Scholar] [CrossRef]
  9. Huang, Q. Occupancy-Driven Energy-Efficient Buildings Using Audio Processing with Background Sound Cancellation. Buildings 2018, 8, 78. [Google Scholar] [CrossRef] [Green Version]
  10. Franco, A.; Miserocchi, L.; Testi, D. HVAC energy saving strategies for public buildings based on heat pumps and demand controlled ventilation. Energies 2021, 14, 5541. [Google Scholar] [CrossRef]
  11. Durao, F.; Carvalho, J.F.S.; Fonseka, A.; Garcia, V.C. A systematic review on cloud computing. J. Supercomput. 2014, 68, 1321–1346. [Google Scholar] [CrossRef]
  12. Gheisari, M.; Alzubi, J.; Zhang, X.; Kose, U.; Saucedo, J.A.M. A new algorithm for optimization of quality of service in peer to peer wireless mesh networks. Wirel. Netw. 2020, 26, 4965–4973. [Google Scholar] [CrossRef]
  13. Montazerolghaem, A.; Yaghmaee, M.H.; Leon-Garcia, A.; Naghibzadeh, M.; Tashtarian, F. A load-balanced call admission Controller for IMS cloud computing. IEEE Trans. Netw. Serv. Manag. 2016, 13, 806–822. [Google Scholar] [CrossRef] [Green Version]
  14. Tall, H.; Chalhoub, G.; Hakem, N.; Misson, M. Load balancing routing with queue overflow prediction for WSNs. Wirel. Netw. 2017, 25, 229–239. [Google Scholar] [CrossRef]
  15. Pan, J.; McElhannon, J. Future edge cloud and edge computing for internet of things applications. IEEE Internet Things J. 2017, 5, 439–449. [Google Scholar] [CrossRef]
  16. Moreno-Vozmediano, R.; Montero, R.S.; Huedo, E.; Llorente, I.M. Cross-site virtual network in cloud and fog computing. IEEE Cloud Comput. 2017, 4, 46–53. [Google Scholar] [CrossRef] [Green Version]
  17. Ben Halima, R.; Kallel, S.; Klai, K.; Gaaloul, W.; Jmaiel, M. Formal verification of time-aware cloud resource allocation in business process. In Proceedings of the OTM Confederated International Conferences on the Move to Meaningful Internet Systems, Rhodes, Greece, 24–28 October 2016; pp. 400–417. [Google Scholar] [CrossRef]
  18. Hossain, M.S.; Muhammad, G. Cloud-assisted Industrial Internet of Things (IIoT)—Enabled framework for health monitoring. Comput. Netw. 2016, 101, 192–202. [Google Scholar] [CrossRef]
  19. Li, S.; Zhang, N.; Lin, S.; Kong, L.; Katangur, A.; Khan, M.K.; Ni, M.; Zhu, G. Joint admission control and resource allocation in edge computing for internet of things. IEEE Netw. 2018, 32, 72–79. [Google Scholar] [CrossRef]
  20. Peng, L.; Dhaini, A.R.; Ho, P.-H. Toward integrated Cloud–Fog networks for efficient IoT provisioning: Key challenges and solutions. Future Gener. Comput. Syst. 2018, 88, 606–613. [Google Scholar] [CrossRef]
  21. Vhora, F.; Gandhi, J. A comprehensive survey on mobile edge computing: Challenges, tools, applications. In Proceedings of the Fourth International Conference on Computing Methodologies and Communication (ICCMC), Erode, India, 11–13 March 2020; pp. 49–55. [Google Scholar] [CrossRef]
  22. Krishnan, P.; Raz, D.; Shavitt, Y. The cache location problem. IEEE/ACM Trans. Netw. 2000, 8, 568–582. [Google Scholar] [CrossRef]
  23. Liu, L.; Fan, Q. Resource allocation optimization based on mixed integer linear programming in the multi-cloudlet environment. IEEE Access 2018, 6, 24533–24542. [Google Scholar] [CrossRef]
  24. Osanaiye, O.; Chen, S.; Yan, Z.; Lu, R.; Choo, K.-K.R.; Dlodlo, M. From cloud to fog computing: A review and a conceptual live VM migration framework. IEEE Access 2017, 5, 8284–8300. [Google Scholar] [CrossRef]
  25. Krishna, P.V. Honey bee behavior inspired load balancing of tasks in cloud computing environments. Appl. Soft Comput. 2013, 13, 2292–2303. [Google Scholar] [CrossRef]
  26. Broberg, J.; Buyya, R.; Tari, Z. MetaCDN: Harnessing ‘storage clouds’ for high performance content delivery. J. Netw. Comput. Appl. 2009, 32, 1012–1022. [Google Scholar] [CrossRef]
  27. Lu, Z.H.; Gao, X.H.; Huang, S.J.; Huang, Y. Scalable and reliable live streaming service through coordinating CDN and P2P. In Proceedings of the IEEE 17th International Conference on Parallel and Distributed Systems (ICPADS), Washington, DC, USA, 7–9 December 2011; pp. 581–588. [Google Scholar] [CrossRef]
  28. Zhang, P.; Zhou, M.; Wang, X. An intelligent optimization method for optimal virtual machine allocation in cloud data centers. IEEE Trans. Autom. Sci. Eng. 2020, 17, 1725–1735. [Google Scholar] [CrossRef]
  29. Peng, G.; Wang, H.; Dong, J.; Zhang, H. Knowledge-based resource allocation for collaborative simulation development in a multi-tenant cloud computing environment. IEEE Trans. Serv. Comput. 2016, 11, 306–317. [Google Scholar] [CrossRef] [Green Version]
  30. Goudarzi, M.; Zamani, M.; Haghighat, A.T. A fast hybrid multi-site computation offloading for mobile cloud computing. J. Netw. Comput. Appl. 2017, 80, 219–231. [Google Scholar] [CrossRef]
  31. Melodia, T.; Pompili, D.; Gungor, V.C.; Akyildiz, I.F. Communication and coordination in wireless sensor and actor networks. IEEE Trans. Mob. Comput. 2007, 6, 1116–1129. [Google Scholar] [CrossRef] [Green Version]
  32. Lu, T.; Ai, Q. Interactive energy management of networked microgrids-based active distribution system considering large-scale integration of renewable energy resources. Appl. Energy 2016, 163, 408–422. [Google Scholar] [CrossRef]
  33. Aruna, M.; Bhanu, D.; Karthik, S. An improved load balanced metaheuristic scheduling in cloud. Clust. Comput. 2017, 22, 10873–10881. [Google Scholar] [CrossRef]
  34. Ding, S.; Chen, C.; Xin, B.; Pardalos, P.M. A bi-objective load balancing model in a distributed simulation system using NSGA-II and MOPSO approaches. Appl. Soft Comput. 2018, 63, 249–267. [Google Scholar] [CrossRef]
  35. Dasgupta, K.; Mandal, B.; Dutta, P.; Mandal, J.K.; Dam, S. A Genetic algorithm (GA) based load balancing strategy for cloud computing. Procedia Technol. 2013, 10, 340–347. [Google Scholar] [CrossRef] [Green Version]
  36. Ramezani, F.; Lu, J.; Taheri, J.; Zomaya, A.Y. A Multi-Objective Load Balancing System for Cloud Environments; British Computer Society; Oxford University Press: Oxford, UK, 2017. [Google Scholar] [CrossRef]
  37. Liu, G.; Shen, H. Minimum-cost cloud storage service across multiple cloud providers. IEEE/ACM Trans. Netw. 2017, 25, 2498–2513. [Google Scholar] [CrossRef]
  38. Pandey, S.; Wu, L.; Guru, S.M.; Buyya, R. A particle swarm optimization-based heuristic for scheduling workflow applications in cloud computing environments. In Proceedings of the 24th IEEE International Conference on Advanced Information Networking and Applications (AINA), Perth, WA, Australia, 20–23 April 2010; pp. 400–407. [Google Scholar] [CrossRef]
  39. Yang, J.; Jiang, B.; Lv, Z.; Choo, K.-K.R. A task scheduling algorithm considering game theory designed for energy management in cloud computing. Future Gener. Comput. Syst. 2017, 105, 985–992. [Google Scholar] [CrossRef]
  40. Mishra, S.K.; Puthal, D.; Sahoo, B.; Jena, S.K.; Obaidat, M.S. An adaptive task allocation technique for green cloud computing. J. Supercomput. 2017, 74, 370–385. [Google Scholar] [CrossRef]
  41. Bilgaiyan, S.; Sagnika, S.; Das, M. A Multi-objective cat swarm optimization algorithm for workflow scheduling in cloud computing environment. In Intelligent Computing, Communication and Devices; Springer: Berlin/Heidelberg, Germany, 2014; pp. 73–84. [Google Scholar] [CrossRef]
  42. Ramezani, F.; Lu, J.; Hussain, F.K. Task-based system load balancing in cloud computing using particle swarm optimization. Int. J. Parallel Program. 2013, 42, 739–754. [Google Scholar] [CrossRef]
  43. Akhter, N.; Othman, M. Energy aware resource allocation of cloud data center: Review and open issues. Clust. Comput. 2016, 19, 1163–1182. [Google Scholar] [CrossRef]
  44. Sofia, A.S.; Ganeshkumar, P. Multi-objective task scheduling to minimize energy consumption and makespan of cloud computing using NSGA-II. J. Netw. Syst. Manag. 2017, 26, 463–485. [Google Scholar] [CrossRef]
  45. Milani, O.H.; Motamedi, S.A.; Sharifian, S. Multiobjective optimization in the cloud computing environment for storage service selection. In Proceedings of the 4th Iranian Conference on Signal Processing and Intelligent Systems (ICSPIS), Tehran, Iran, 25–27 December 2018; pp. 65–69. [Google Scholar] [CrossRef]
  46. Fan, X.; Weber, W.-D.; Barroso, L.A. Power provisioning for a warehouse-sized computer. In Proceedings of the SPAA07 19th ACM Symposium on Parallelism in Algorithms and Architectures, San Diego, CA, USA, 9–13 June 2007; pp. 13–23. [Google Scholar] [CrossRef]
  47. Eskandar, H.; Sadollah, A.; Bahreininejad, A.; Hamdi, M. Water cycle algorithm—A novel metaheuristic optimization method for solving constrained engineering optimization problems. Comput. Struct. 2012, 110–111, 151–166. [Google Scholar] [CrossRef]
  48. Chunlin, L.; Layuan, L. Cost and energy aware service provisioning for mobile client in cloud computing environment. J. Supercomput. 2015, 71, 1196–1223. [Google Scholar] [CrossRef]
  49. Sadollah, A.; Eskandar, H.; Kim, J.H. Water cycle algorithm for solving constrained multi-objective optimization problems. Appl. Soft Comput. 2015, 27, 279–298. [Google Scholar] [CrossRef]
  50. Mirjalili, S.; Mirjalili, S.M.; Lewis, A. Grey wolf optimizer. Adv. Eng. Softw. 2014, 69, 46–61. [Google Scholar] [CrossRef] [Green Version]
  51. Zheng, Q.; Li, R.; Li, X.; Shah, N.; Zhang, J.; Tian, F.; Chao, K.-M.; Li, J. Virtual machine consolidated placement based on multi-objective biogeography-based optimization. Future Gener. Comput. Syst. 2016, 54, 95–122. [Google Scholar] [CrossRef] [Green Version]
  52. Chung, J.Y.; Ha, S.; Hong, J.W.K. A management architecture for client-defined cloud storage services. Int. J. Netw. Manag. 2015, 35, 435–453. [Google Scholar] [CrossRef]
  53. Ahrabian, A.; Kolozali, S.; Enshaeifar, S.; Cheong-Took, C.; Barnaghi, P. Data analysis as a web service: A case study using IoT sensor data. In Proceedings of the IEEE International Conference on Acoustics, Speech and Signal Processing (ICASSP), New Orleans, LA, USA, 5–9 March 2017; pp. 6000–6004. [Google Scholar] [CrossRef] [Green Version]
  54. Gao, Y.; Guan, H.; Qi, Z.; Hou, Y.; Liu, L. A multi-objective ant colony system algorithm for virtual machine placement in cloud computing. J. Comput. Syst. Sci. 2013, 79, 1230–1242. [Google Scholar] [CrossRef]
  55. Saaty, T.L. What is the analytic hierarchy process? In Mathematical Models for Decision Support; Springer: Berlin/Heidelberg, Germany, 1988; pp. 109–121. [Google Scholar] [CrossRef]
Figure 1. Proposed architecture from sensors through cloudlet to cloud providers for storing IoT data.
Energies 14 08601 g001
Figure 2. Decision-making block diagram.
Energies 14 08601 g002
Figure 3. Comparison between algorithms due to the distribution of different solutions’ energy consumption in the resulted Pareto after 100 iterations for (a) 100 data items and (b) 400 data items.
Energies 14 08601 g003
Figure 4. Comparison between algorithms due to the distribution of different solutions’ processing time in the resulted Pareto after 100 iterations for (a) 100 data items and (b) 400 data items.
Energies 14 08601 g004
Figure 5. Comparison between algorithms due to the distribution of different solutions’ load balancing in the resulted Pareto after 100 iterations for (a) 100 data items in the fog layer, (b) 400 data items in the fog layer, (c) 100 data items in the cloud layer, and (d) 400 data items in the cloud layer.
Energies 14 08601 g005
Figure 6. Comparison between algorithms due to the distribution of different solutions’ transmission time in the resulted Pareto after 100 iterations for (a) 100 data items and (b) 400 data items.
Energies 14 08601 g006
Table 1. Comparison of the proposed algorithms in this study.
ReferencesProcessing TimeTransmission TimeLoad BalancingEnergy
[25,29]
[32]
[34,35]
[40]
[41]
[43]
[44,45]
The current study
Table 2. Symbols and notations of objects’ functions.
SymbolDescription
EidleEnergy consumption in an idle mode
EbusyEnergy consumption in a busy mode
DData volume
mNumber of available services in fog layer
nNumber of data
f j An active indicator of cloudletj
f i j Allocate indicator of ith data to cloudletj
EtotTotal energy consumption in each solution
C n j Number of CPUs
T c Time criterion for processing in the fog layer
c a p T i c a p C i The used percentage of cloudlets.
c a p T c a p C ¯ The average usage ratio of cloudlets
L B c Load-balancing criterion among services in fog layer
T s Consumed time criterion in transmitting to cloud layer
kNumber of storage services
B W j z Bandwidth between jth cloudlet and zth cloud
L B s Load-balancing criterion among services in cloud layer
P Total number of populations in multi-objective algorithms
p i The ith solution in P
DiThe ith data’s volume
C a The ath cloudlet’s service
cpjThe capacity of the jth cloudlet’s service
S a ´ The a ´ th cloud storage’s service
Table 3. Mathematical symbols of a proposed algorithm.
SymbolDescription
p S t r e a m j Solution j, which is considered as a stream in the algorithm
p S e a j Solution j that is considered as a sea in the algorithm
p R i v e r j The solution that is considered as a river in the algorithm
GThe coefficient for generating new solutions
d m a x i The maximum acceptable distance between solutions and the sea in the algorithm
X The position of a solution as a hunt in the algorithm
X α The first-best solution in the algorithm
X β The second-best solution in the algorithm
X δ The third-best solution in the algorithm
X ( t + 1 ) The new result, which is calculated for Nsr, C, and d m a x
randA number between 0 and 1
itrThe current iteration in the algorithm
r1A random vector in the range (0,1]
r2A random vector in the range (0,1]
npfThe number of solutions in the Pareto
d i p Shows the distance between every two answer choices in the Pareto
d ¯ p Shows the average distance between every two answer choices in the Pareto
Table 4. Different cloud service providers’ throughput [52]. Reproduced from [52], the name of the publisher: Wiley Online Library.
Cloud Service ProviderThroughput (Mbps)
Amazon S3a1.349
Box2.128
Dropbox2.314
OneDrive2.233
Google Drive4.465
SugarSync2.171
Cloud Mine1.474
Rackspace1.704
Table 5. Different algorithms and the setting parameters.
AlgorithmsParametersSettings
NSGAII [44]Population size (pop), crossover probability, mutation probability50, 0.8, 1
KGA [29]Population size (pop), crossover probability, mutation probability, number of centroids50, 0.8, 0.1, 4
MOWCA [50]Population size (pop), number of streams, the distance of sea (dmax)50, 4, 1
Table 6. Metric of spacing for different algorithms.
Data NumberIterationKGA [24]Max SNSGAII [41]Max SMOWCA [45]Max SMWGMax S
Min SMin SMin SMin S
100100130134165189102112114139
200237244257259232248210215
400311325352389304314267269
Table 7. Comparison of algorithms’ best solution based on AHP.
Main AlgorithmObjectives100 DataKGANSGAII200 DataKGANSGAII400 DataKGANSGAII
MOWCAMOWCAMOWCA
MWGEnergy1.374.115.481.793.065.11.63.24
Load balancing, fog4.9530.6933.666.5714.1415.155.1315.3820.51
Load balancing, cloud6.1230.0133.7110.0824.1126.2816.6826.0530.23
Processing time4.3115.4734.7220.9332.1537.819.3329.5232.69
Transmission time5.6411.5417.696.638.6313.956.119.814.17
Publisher’s Note: MDPI stays neutral with regard to jurisdictional claims in published maps and institutional affiliations.

