Article

Suppression Method of Partial Discharge Interferences Based on Singular Value Decomposition and Improved Empirical Mode Decomposition

Key Laboratory of Engineering Dielectrics and Its Application, Ministry of Education, School of Electrical and Electronics Engineering, Harbin University of Science and Technology, Harbin 150080, China
*
Authors to whom correspondence should be addressed.
Energies 2021, 14(24), 8579; https://doi.org/10.3390/en14248579
Submission received: 28 October 2021 / Revised: 8 December 2021 / Accepted: 17 December 2021 / Published: 20 December 2021

Abstract

:
Partial discharge detection is an important means of insulation diagnosis of electrical equipment. To effectively suppress the periodic narrowband and white noise interferences in the process of partial discharge detection, a partial discharge interference suppression method based on singular value decomposition (SVD) and improved empirical mode decomposition (IEMD) is proposed in this paper. First, the partial discharge signal with periodic narrowband interference and white noise interference x(t) is decomposed by SVD. According to the distribution characteristics of single values of periodic narrowband interference signals, the singular value corresponding to periodic narrowband interference is set to zero, and the signal is reconstructed to eliminate the periodic narrowband interference in x(t). IEMD is then performed on x(t). Intrinsic mode function (IMF) is obtained by EMD, and based on the improved 3σ criterion, the obtained IMF components are statistically processed and reconstructed to suppress the influence of white noise interference. The methods proposed in this paper, SVD and SVD + EMD, are applied to process the partial discharge simulation signal and partial discharge measurement signal, respectively. We calculated the signal-to-noise ratio, normalized correlation coefficient, and mean square error of the three methods, respectively, and the results show that the proposed method suppresses the periodic narrowband and white noise interference signals in partial discharge more effectively than the other two methods.

Graphical Abstract

1. Introduction

Partial discharge (PD) is one of the manifestations of electrical equipment insulation aging, and one of the main reasons for further deterioration and failure of insulation [1,2,3]. PD signal detection is an effective means used to evaluate and diagnose the insulation state of electrical equipment [4,5]. However, in the actual PD signal detection process, the measured PD signal is often annihilated by noise interferences due to the complex electromagnetic environment and extremely weak PD signal [6,7]. Periodic narrowband and white noise interferences impose the most serious influences on PD signal detection. Therefore, it is of great significance to suppress them effectively.
Extensive studies have been conducted on noise interference suppression in PD signals. Zhao et al. suppressed periodic narrowband interference through fast Fourier transform (FFT) without prior knowledge, but the threshold was not easily determined and there was an edge effect [8]. Luo et al. proposed that the frequency of periodic narrowband interference can be identified by combining the local energy ratio of the power spectrum and clustering algorithm [9], thus allowing the determination of the threshold. However, the residual noise was large. In [10], the white noise interference in the PD signal was effectively suppressed by using the discrete wavelet transform (DWT). Shams et al. proposed using maximum overlap discrete wavelet transform (MODWT) to denoise the partial discharge signal, the processing object is PD signal of cable defects under different noise levels, and the noise reduction effect was superior [11]. Soltani et al. proposed that the good ability of artificial neural network (ANN) in curve fitting can be used to suppress the white noise interference of different types of measured RF signals [12].
In addition to the above methods, singular value decomposition (SVD) is an effective interference suppression method, which has been extensively used in PD signal interference suppression. This method realizes PD signal interference suppression by selecting the appropriate singular value threshold [13,14]. In [15], the PD signal was decomposed by SVD, and the singular value corresponding to the periodic narrowband interference was determined; in this way, the signal was reconstructed to achieve periodic narrowband interference suppression. Ashtiani et al. proposed an adaptive SVD method to suppress noise interference and achieved certain results [16]. Zhou et al. proposed an adaptive short-time singular value decomposition (ASTSVD) method to denoise PD signal, this method obtains the denoised PD signal by selecting the singular value representing PD signal and removing the singular value representing the noise interference [17]. Wei et al. proposed using S-transform to process PD UHF signal, and time-frequency analysis of S-transform results to obtain the number of source signals. Singular value decomposition (SVD) is performed on the PD signal detected by a single channel to obtain the multi-channel signal. The obtained characteristic matrix is jointly approximately diagonalized, and finally the background noise in the multi-channel PD UHF signal is separated [18].
In this paper, it is found that SVD is not effective in suppressing white noise interference. To suppress white noise more effectively, a type of empirical mode decomposition (EMD) is introduced. EMD, which was proposed by Huang et al. in 1988, is used to process nonstationary and nonlinear signals, and has been applied in many fields [19]. EMD decomposes the multi-time scale component signal into multiple intrinsic mode functions (IMFs) from high to low frequencies to distinguish noise interference and the measured signal [20]. Reference [21] proposed using EMD to suppress white noise interference in the PD signal and it has exhibited good robustness. Further research showed that EMD has low efficiency on periodic narrowband interference suppression in this paper.
This paper proposes a new white noise and periodic narrowband interference suppression method based on SVD and IEMD to solve the deficiency of SVD in white noise interference suppression and the disadvantage of EMD in periodic narrowband interference suppression. First, PD and interference signals are simulated in Section 2. PD signals containing white noise and periodic narrowband interference were decomposed by SVD in Section 3, and the singular values corresponding to periodic narrowband interference were then set to zero to suppress periodic narrowband interference. Different from previous studies, this paper studies the suppression effect of SVD on white noise interference; different singular values were reserved and the signals were reconstructed. PD signals containing periodic narrowband interference and PD signals containing white noise interference are decomposed by EVD to study the suppression effect in Section 4. The signal, whose periodic narrowband interference was suppressed by SVD, was analyzed by IEMD in Section 5 to solve the modal aliasing problem in the IMF component. In a new processing method proposed in this paper, the IMF components obtained by EMD are statistically analyzed and processed based on the improved 3σ criterion. The processed IMF component was reconstructed to achieve white noise suppression. Actual measurement of PD signals interferences suppressed are discussed in Section 6. Finally, conclusions are summarized in Section 7.
The result shows the proposed method has more advantages in suppressing periodic narrowband and white noise interference in PD signal detection than SVD and SVD + EMD. However, the construction of the Hankle matrix makes the amount of calculations larger, so it is necessary to control the amount of data of the signal so as to improve the calculation efficiency.

2. PD and Interference Signals for Simulation Analysis

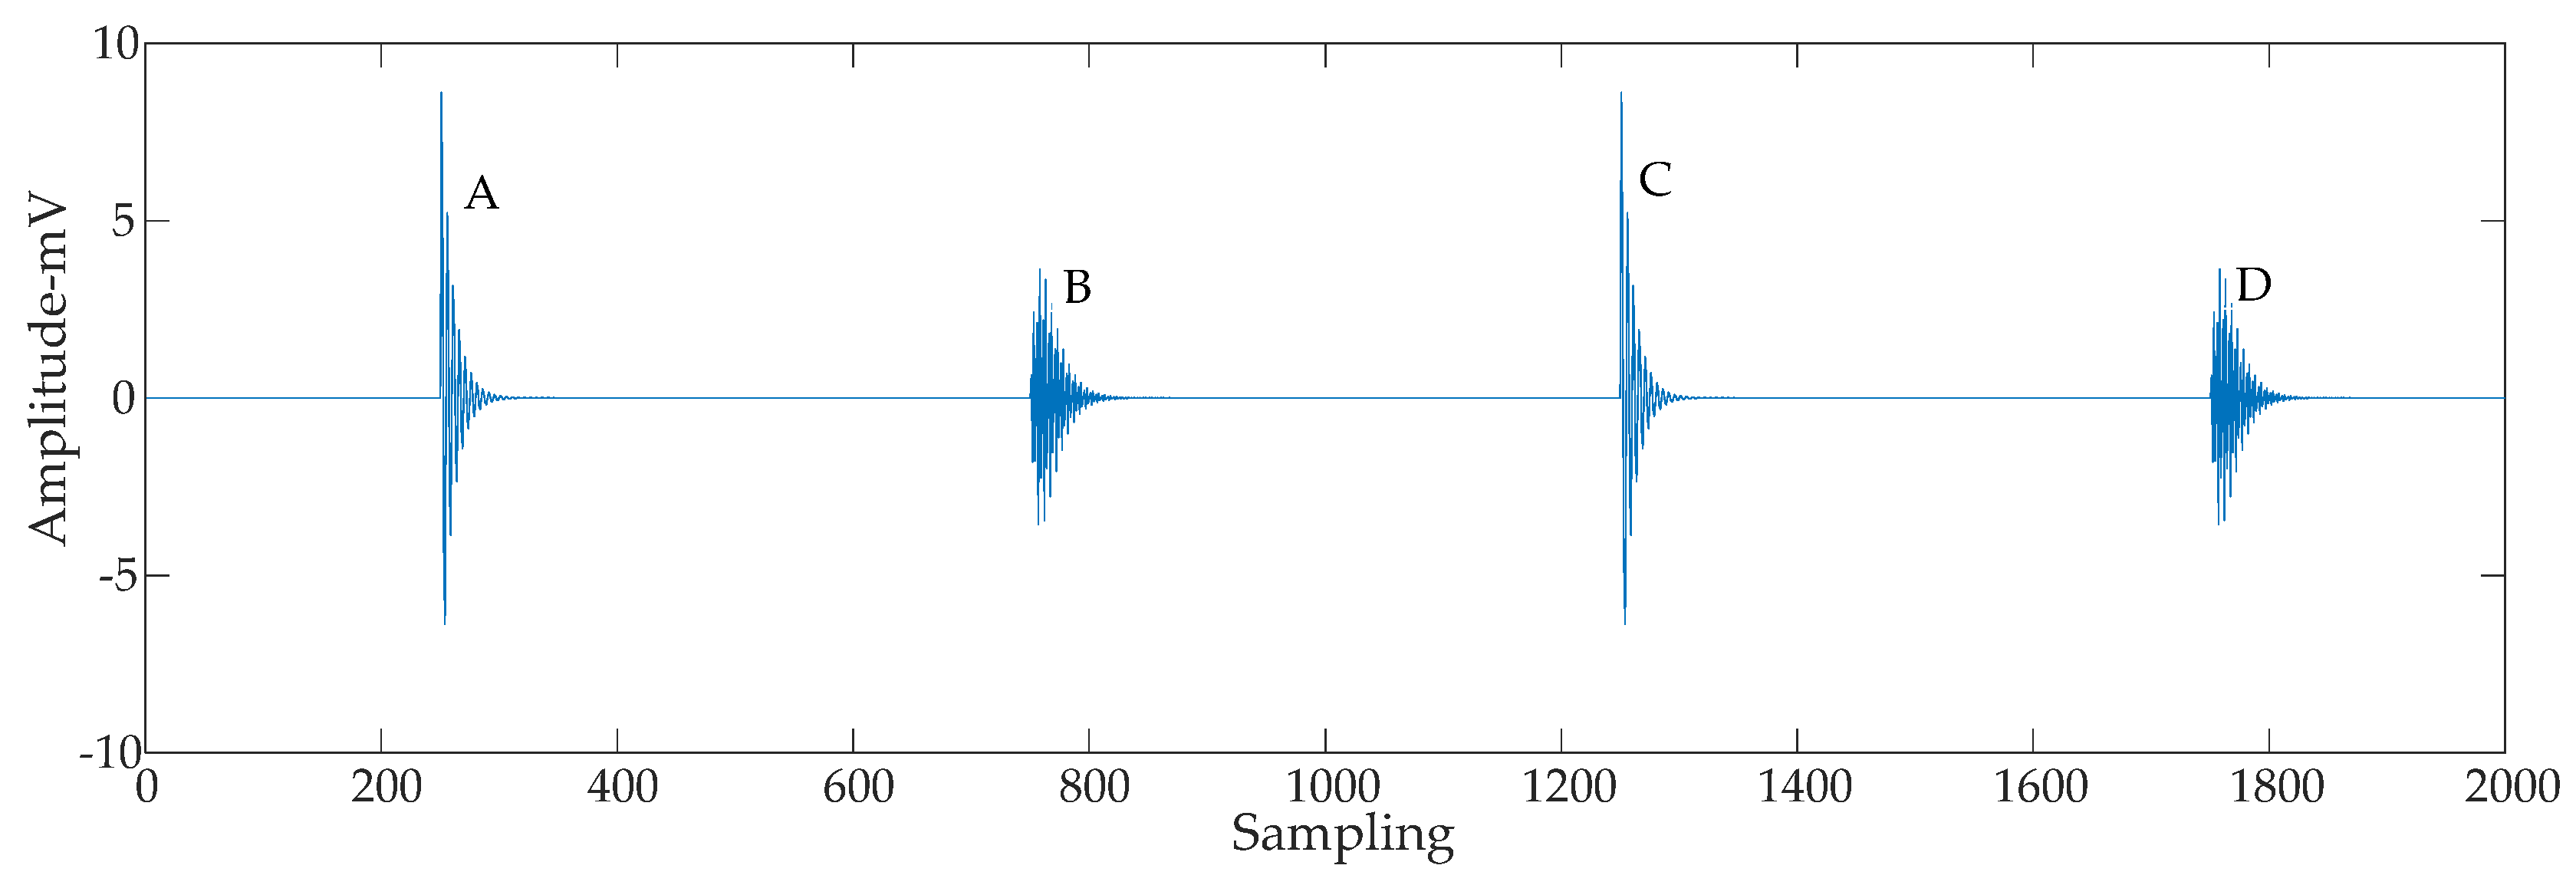
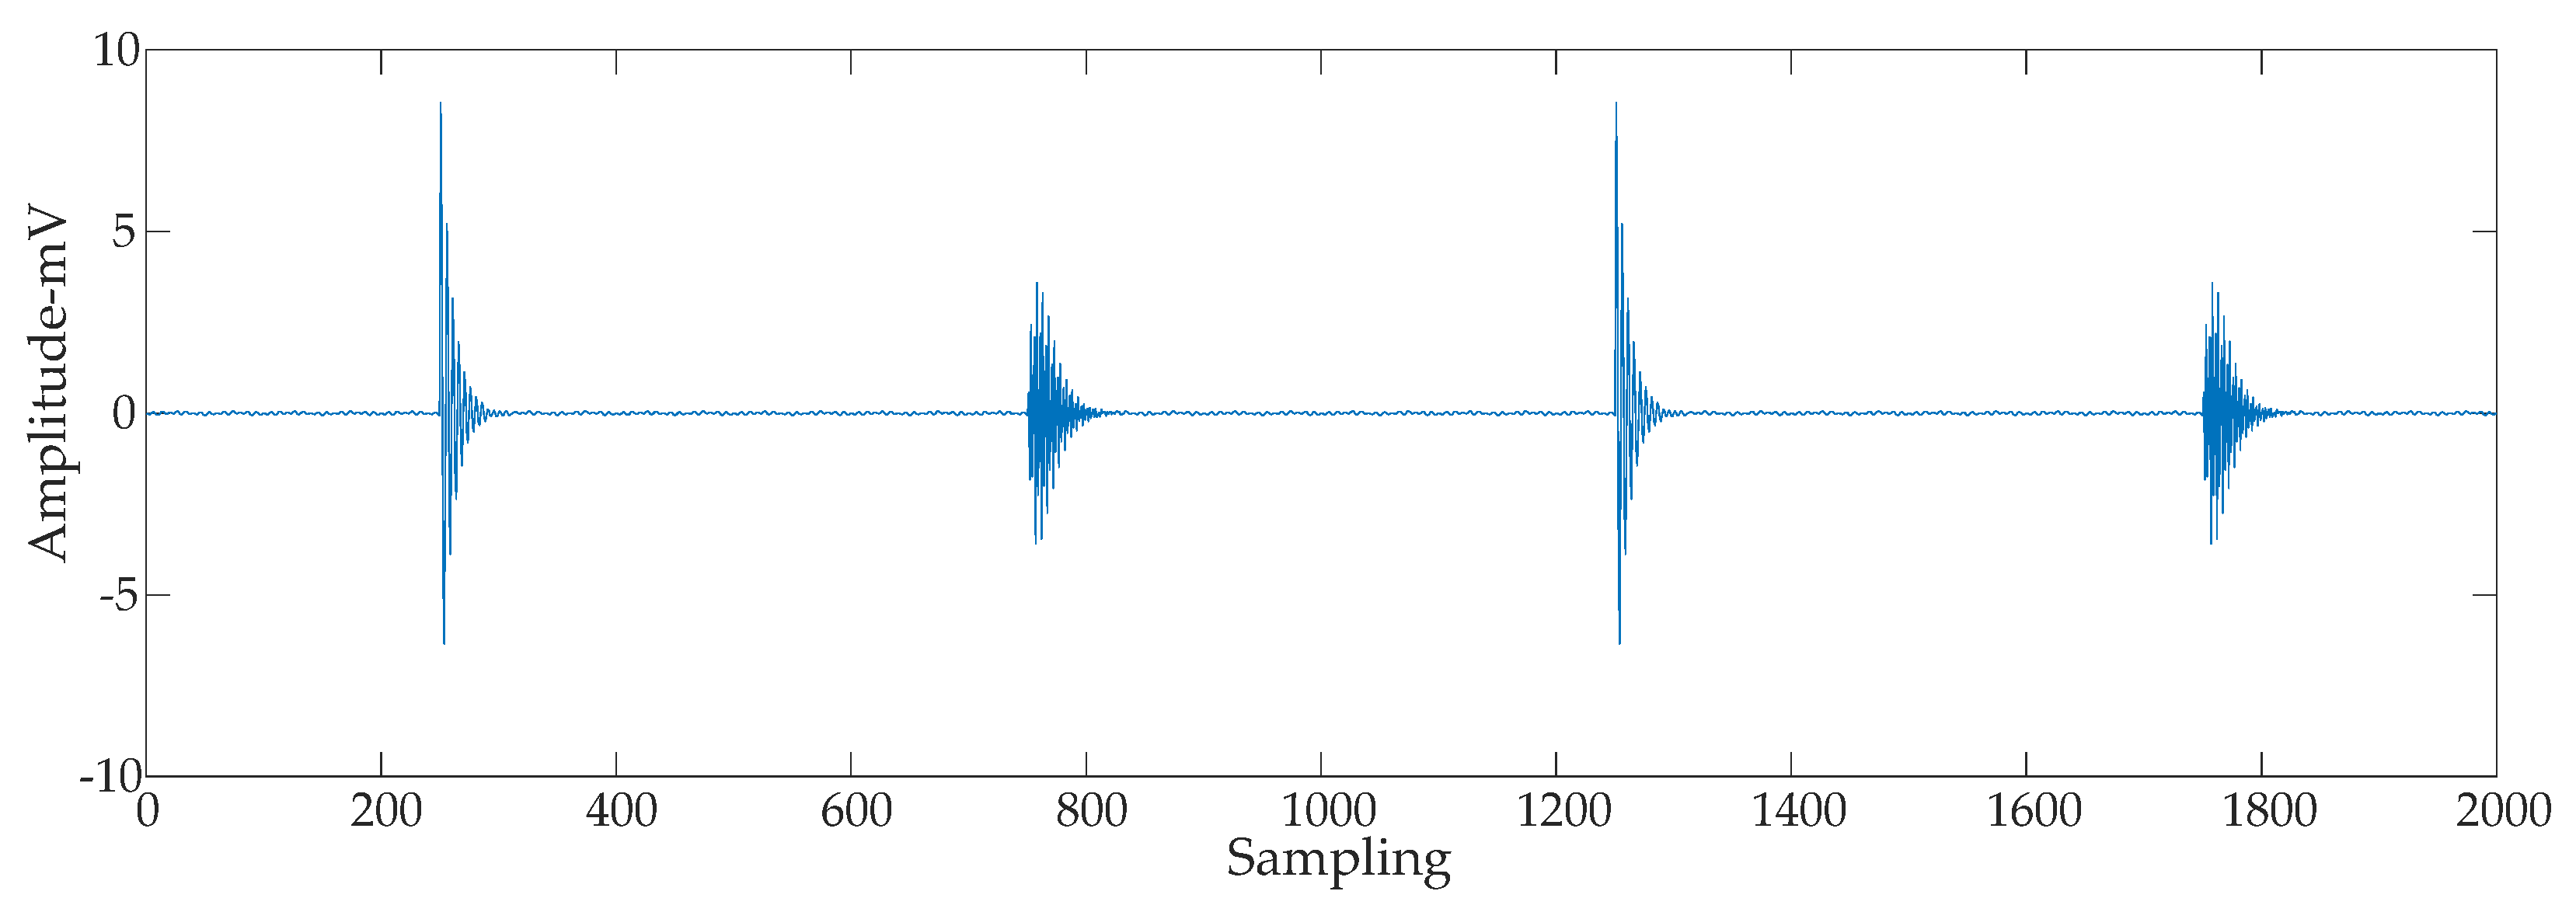
2.1. PD Signal Simulation

PD signal is a type of pulse signal. Based on previous studies, this paper selected the single exponential decay oscillation model D1 and the double exponential decay oscillation model D2 to simulate the PD signal [22]. The specific expressions are as follows:
D 1 = A 1 e t / τ sin ( 2 π f c t )
D 2 = A 2 ( e 1.3 t / τ e 2.2 t / τ ) sin ( 2 π f c t )
In Equations (1) and (2), A1 and A2 are the amplitudes of the PD signal, τ is the attenuation coefficient, fc is the attenuated oscillation frequency, and t is the duration of PD signal pulse [23].
In this paper, four groups of PD signal pulses are simulated in MATLAB (version 2017, MathWorks, Natick, MA, USA), and the parameters are listed in Table 1. Signals A and C are single exponential decay oscillations, and B and D are double exponential decay oscillations. The sampling frequency is 100 Msamples/s, and the sampling time is 20 μs (number of sampling points N = 2000). The PD simulation signal is shown in Figure 1.

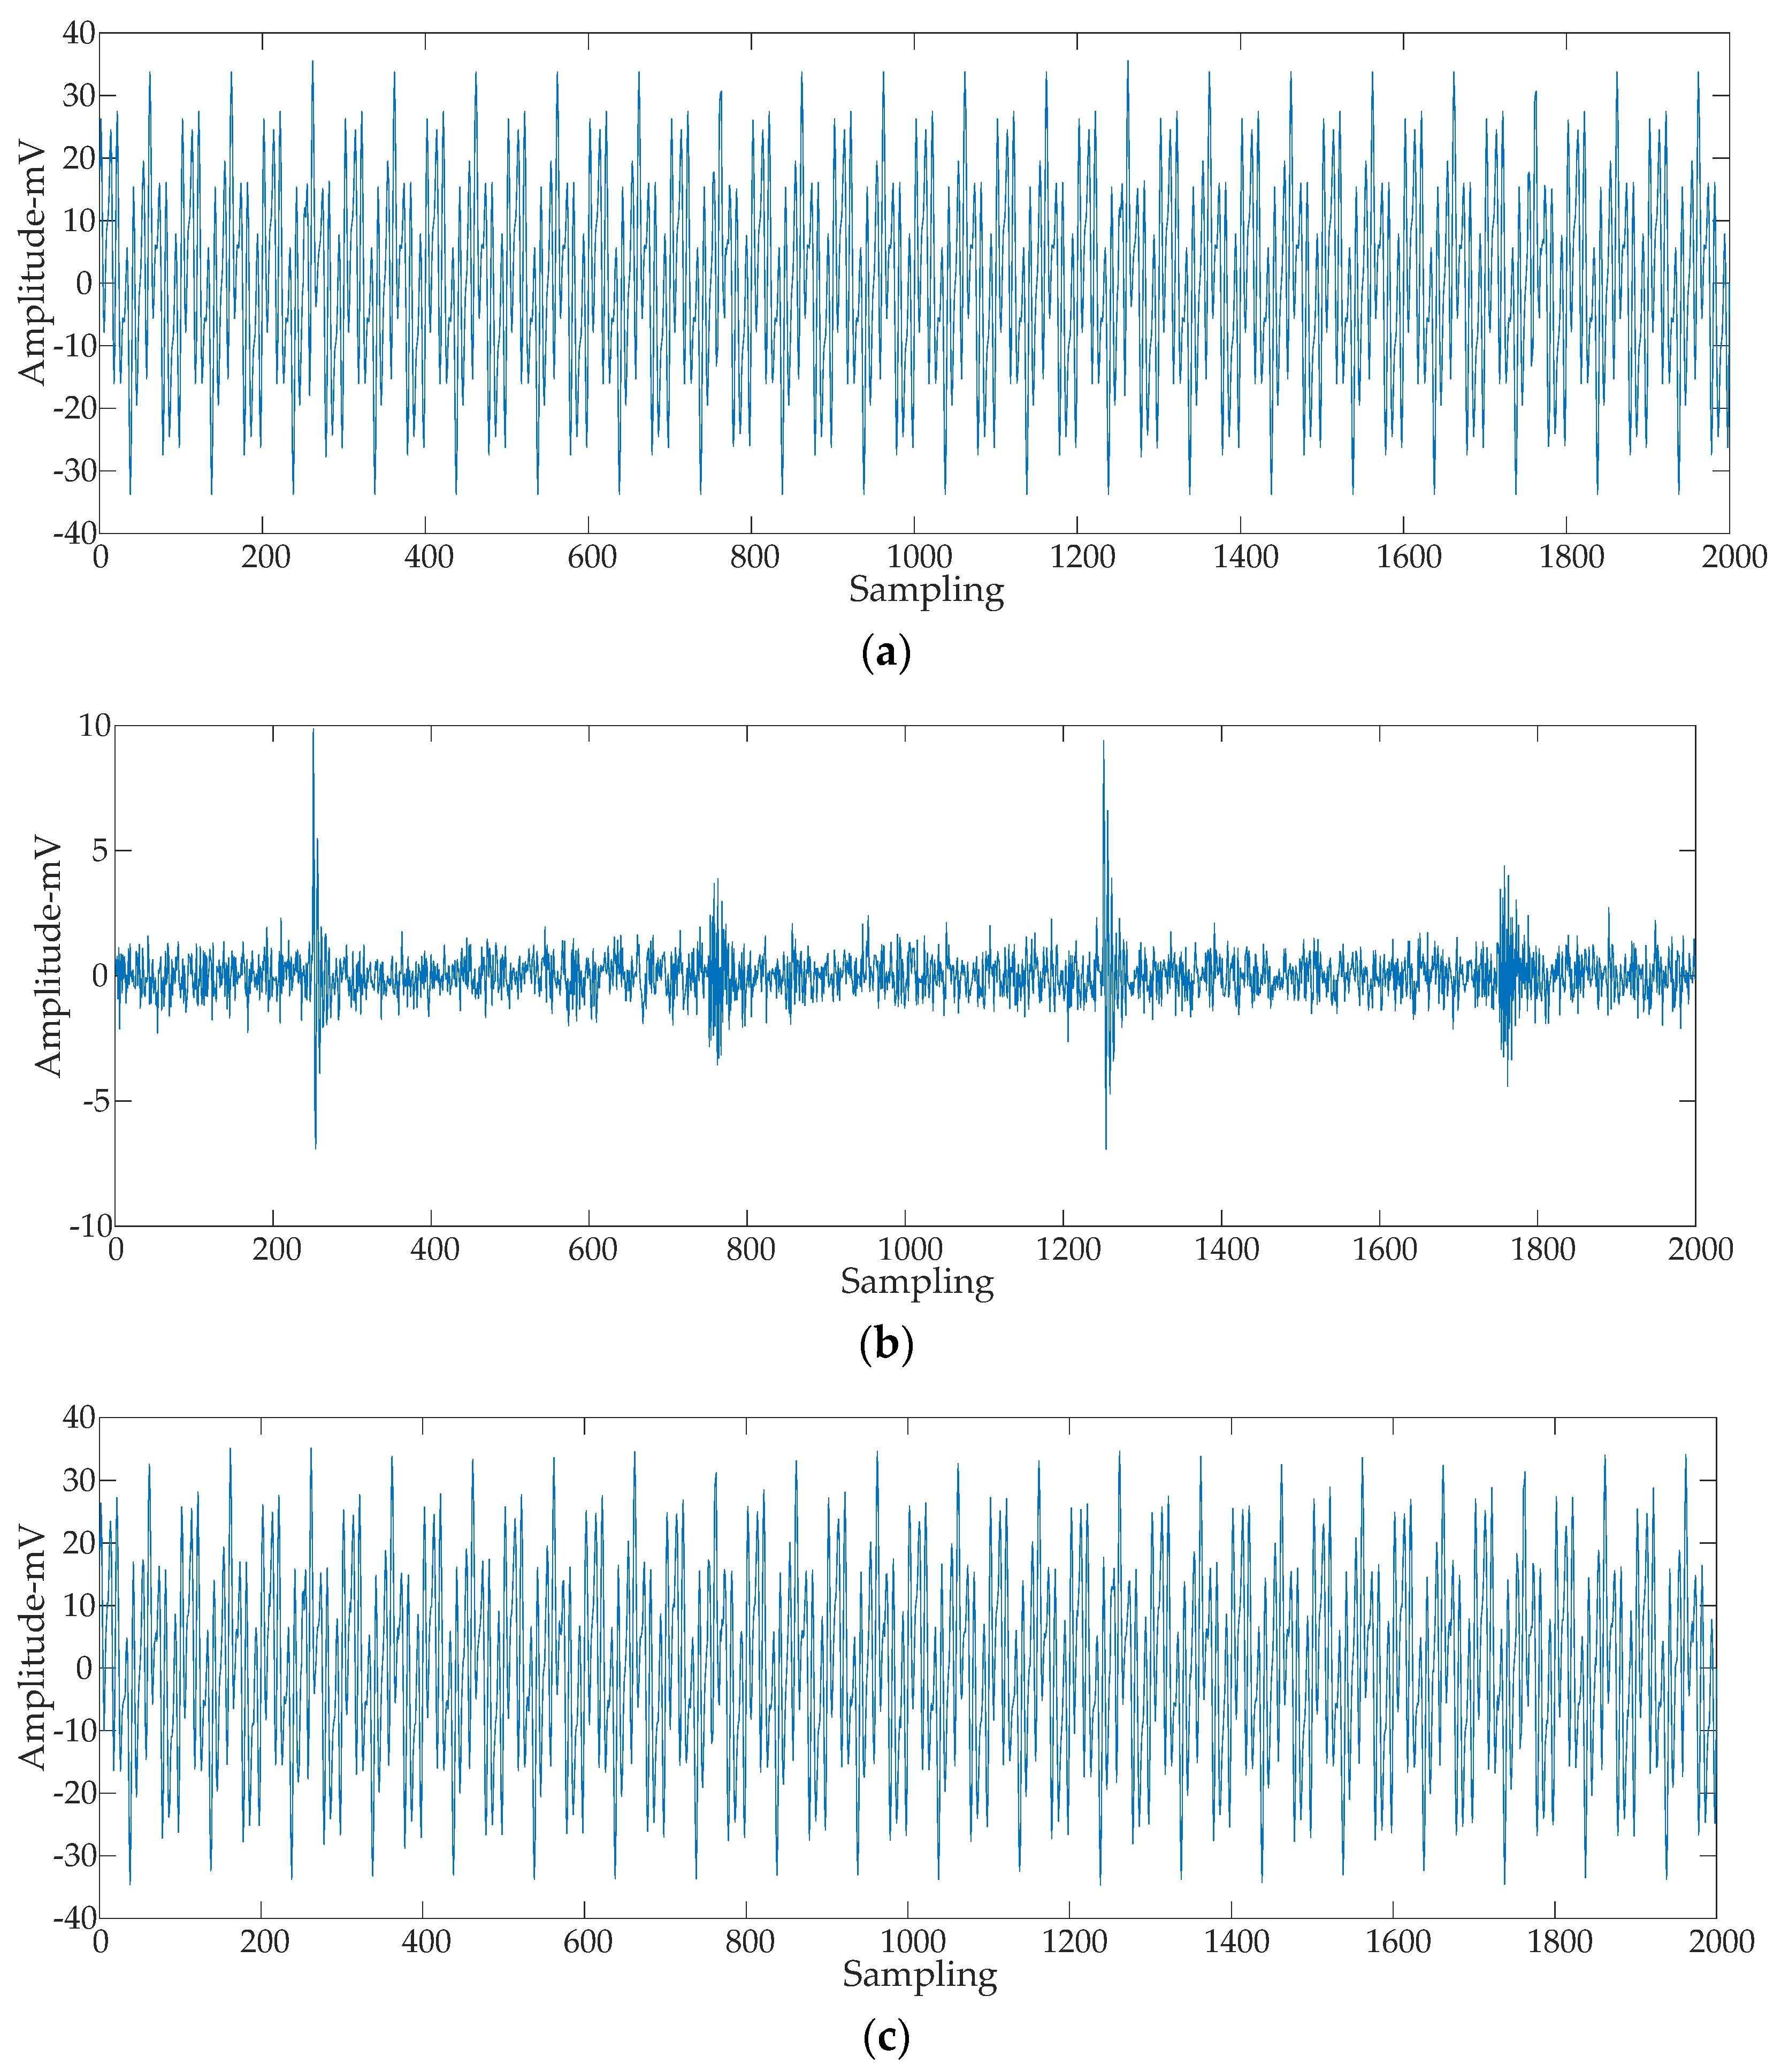
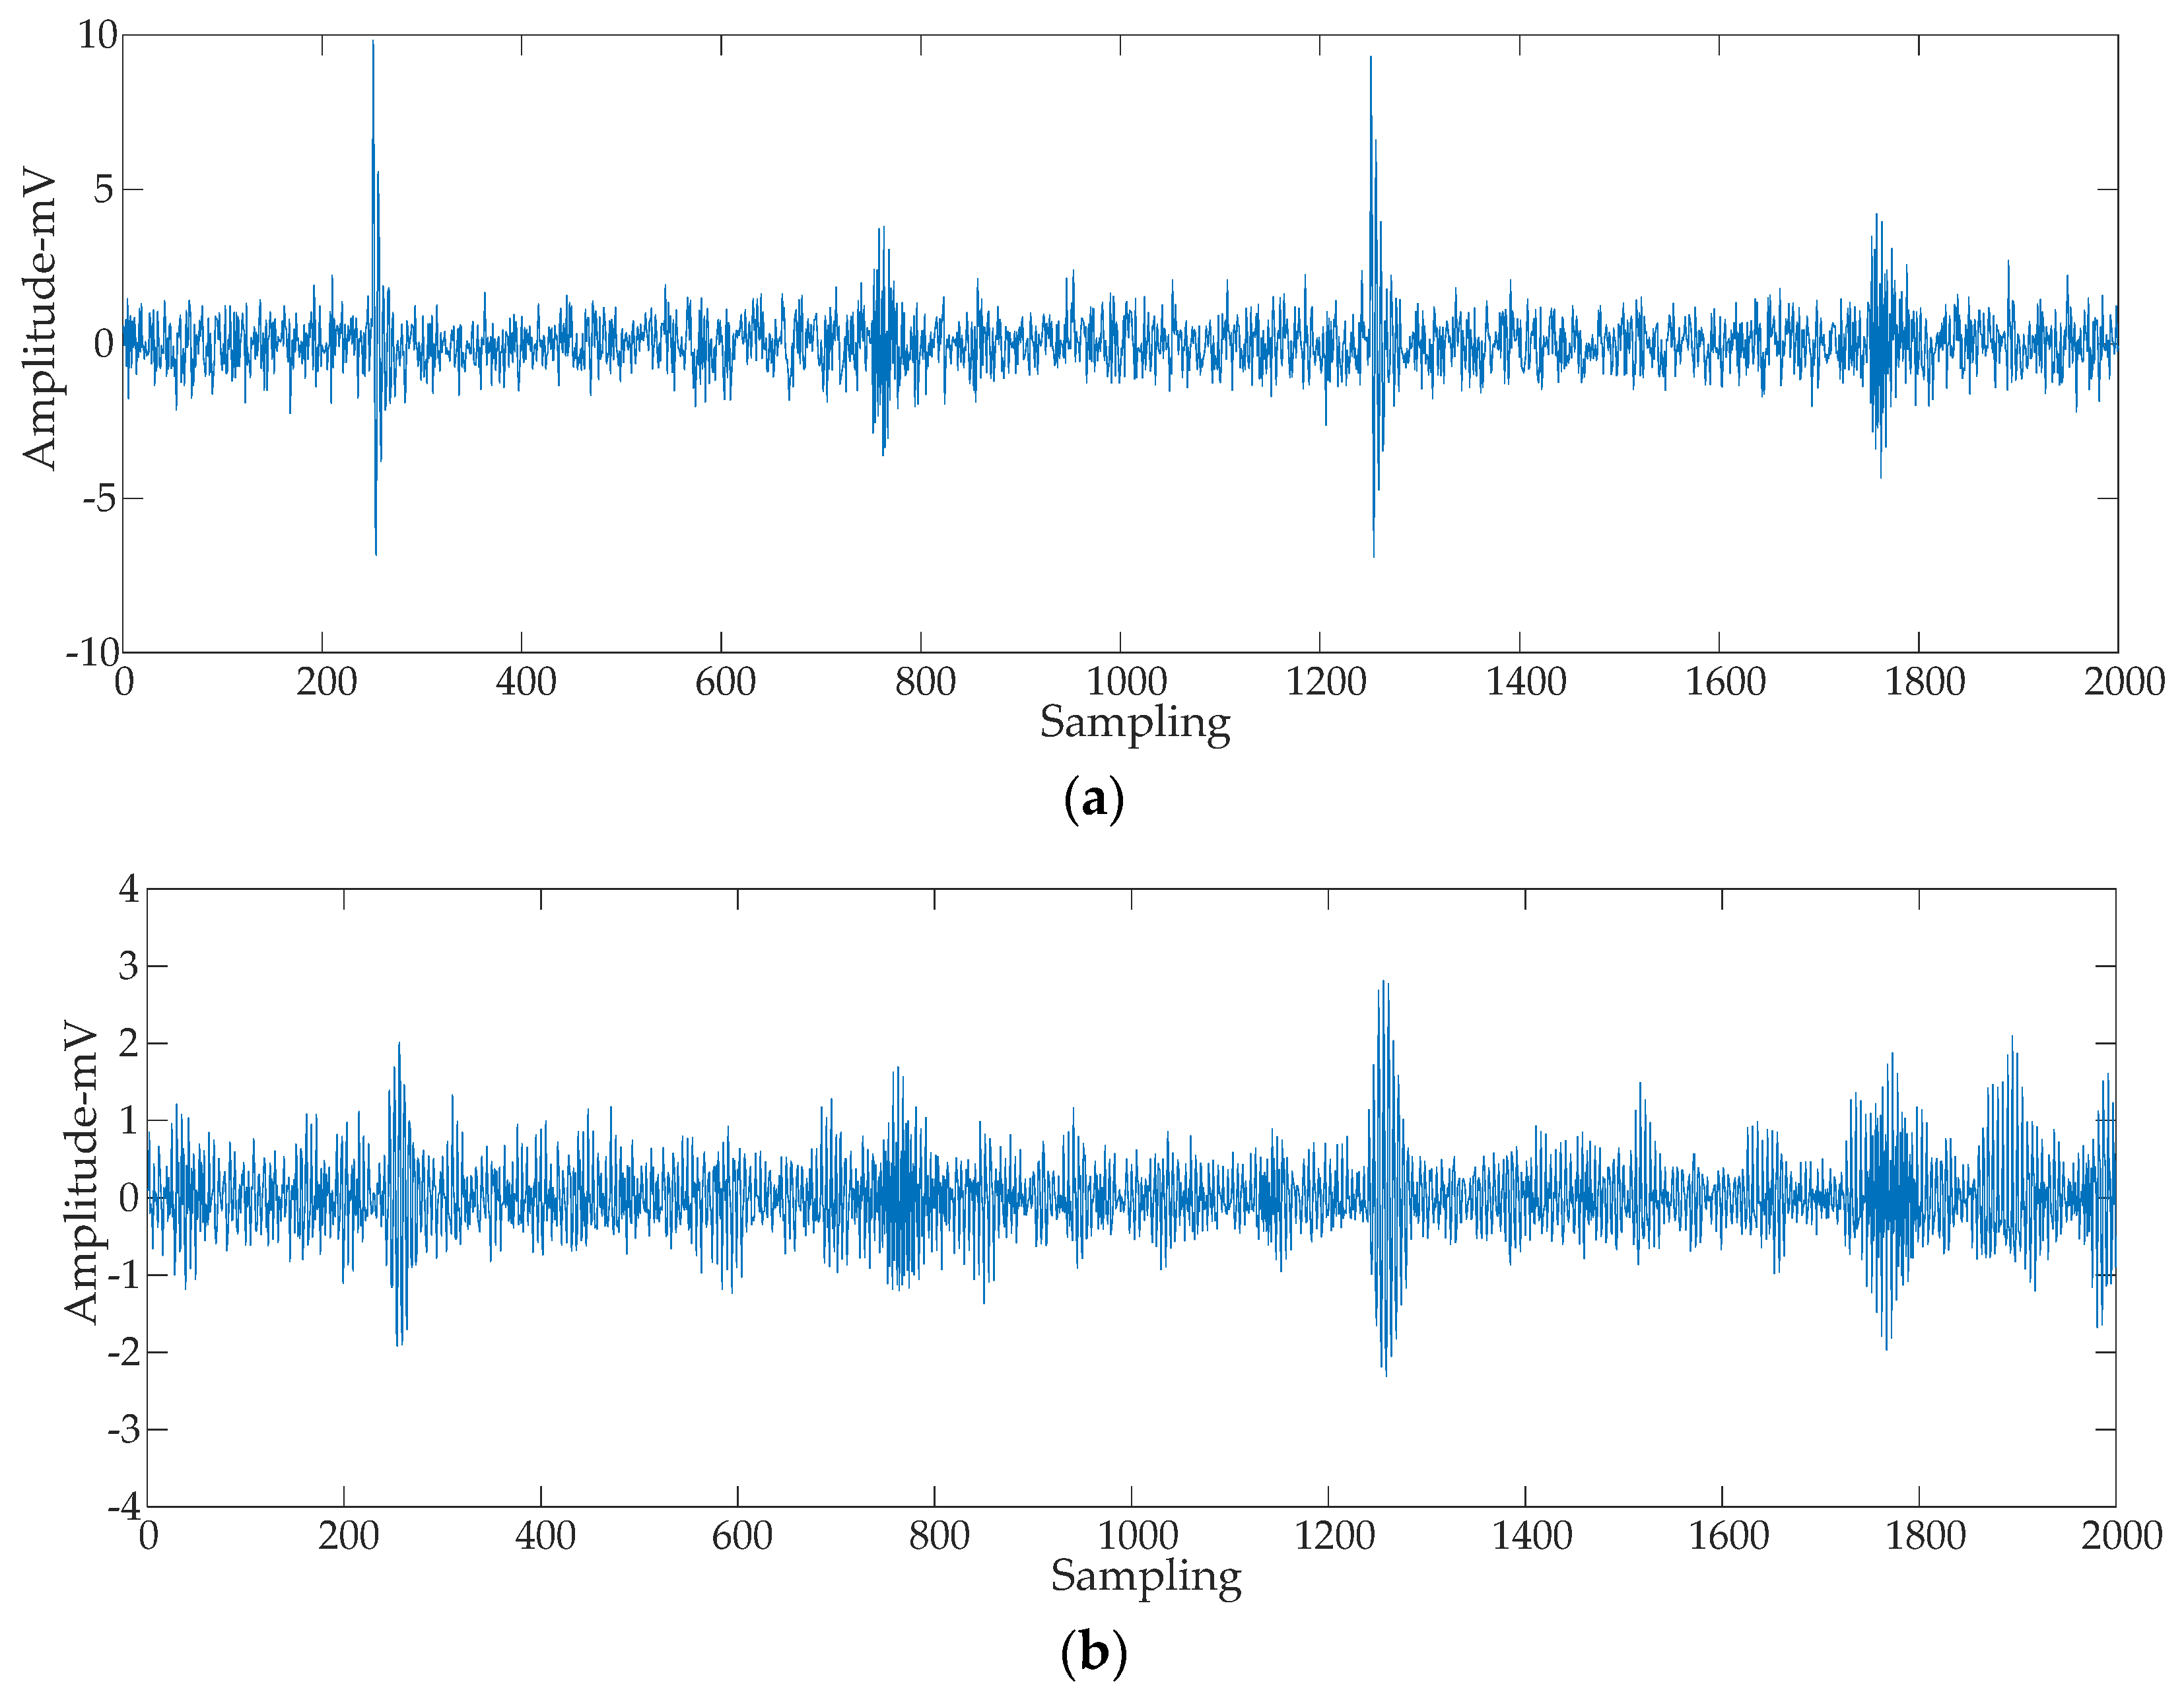
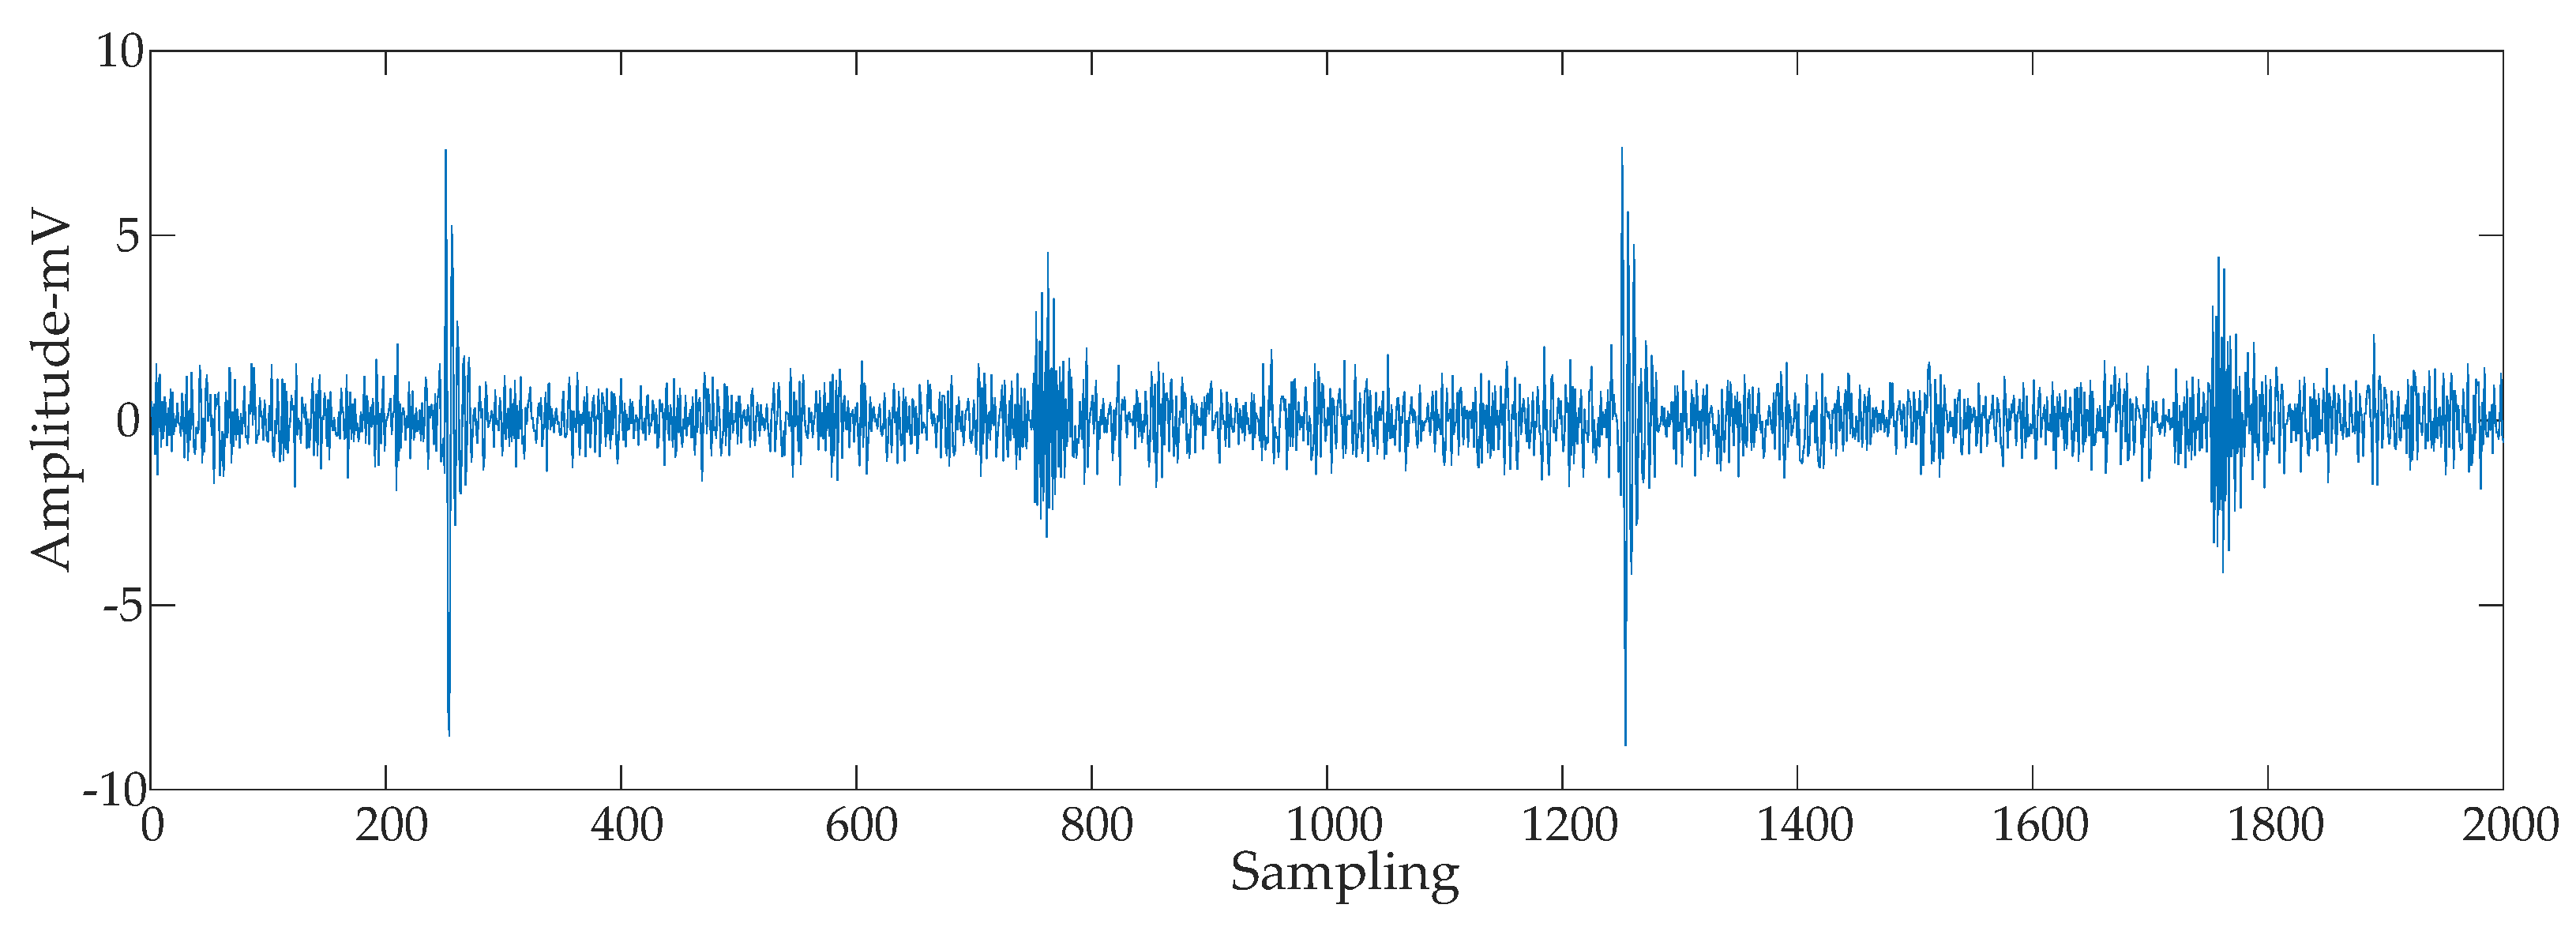
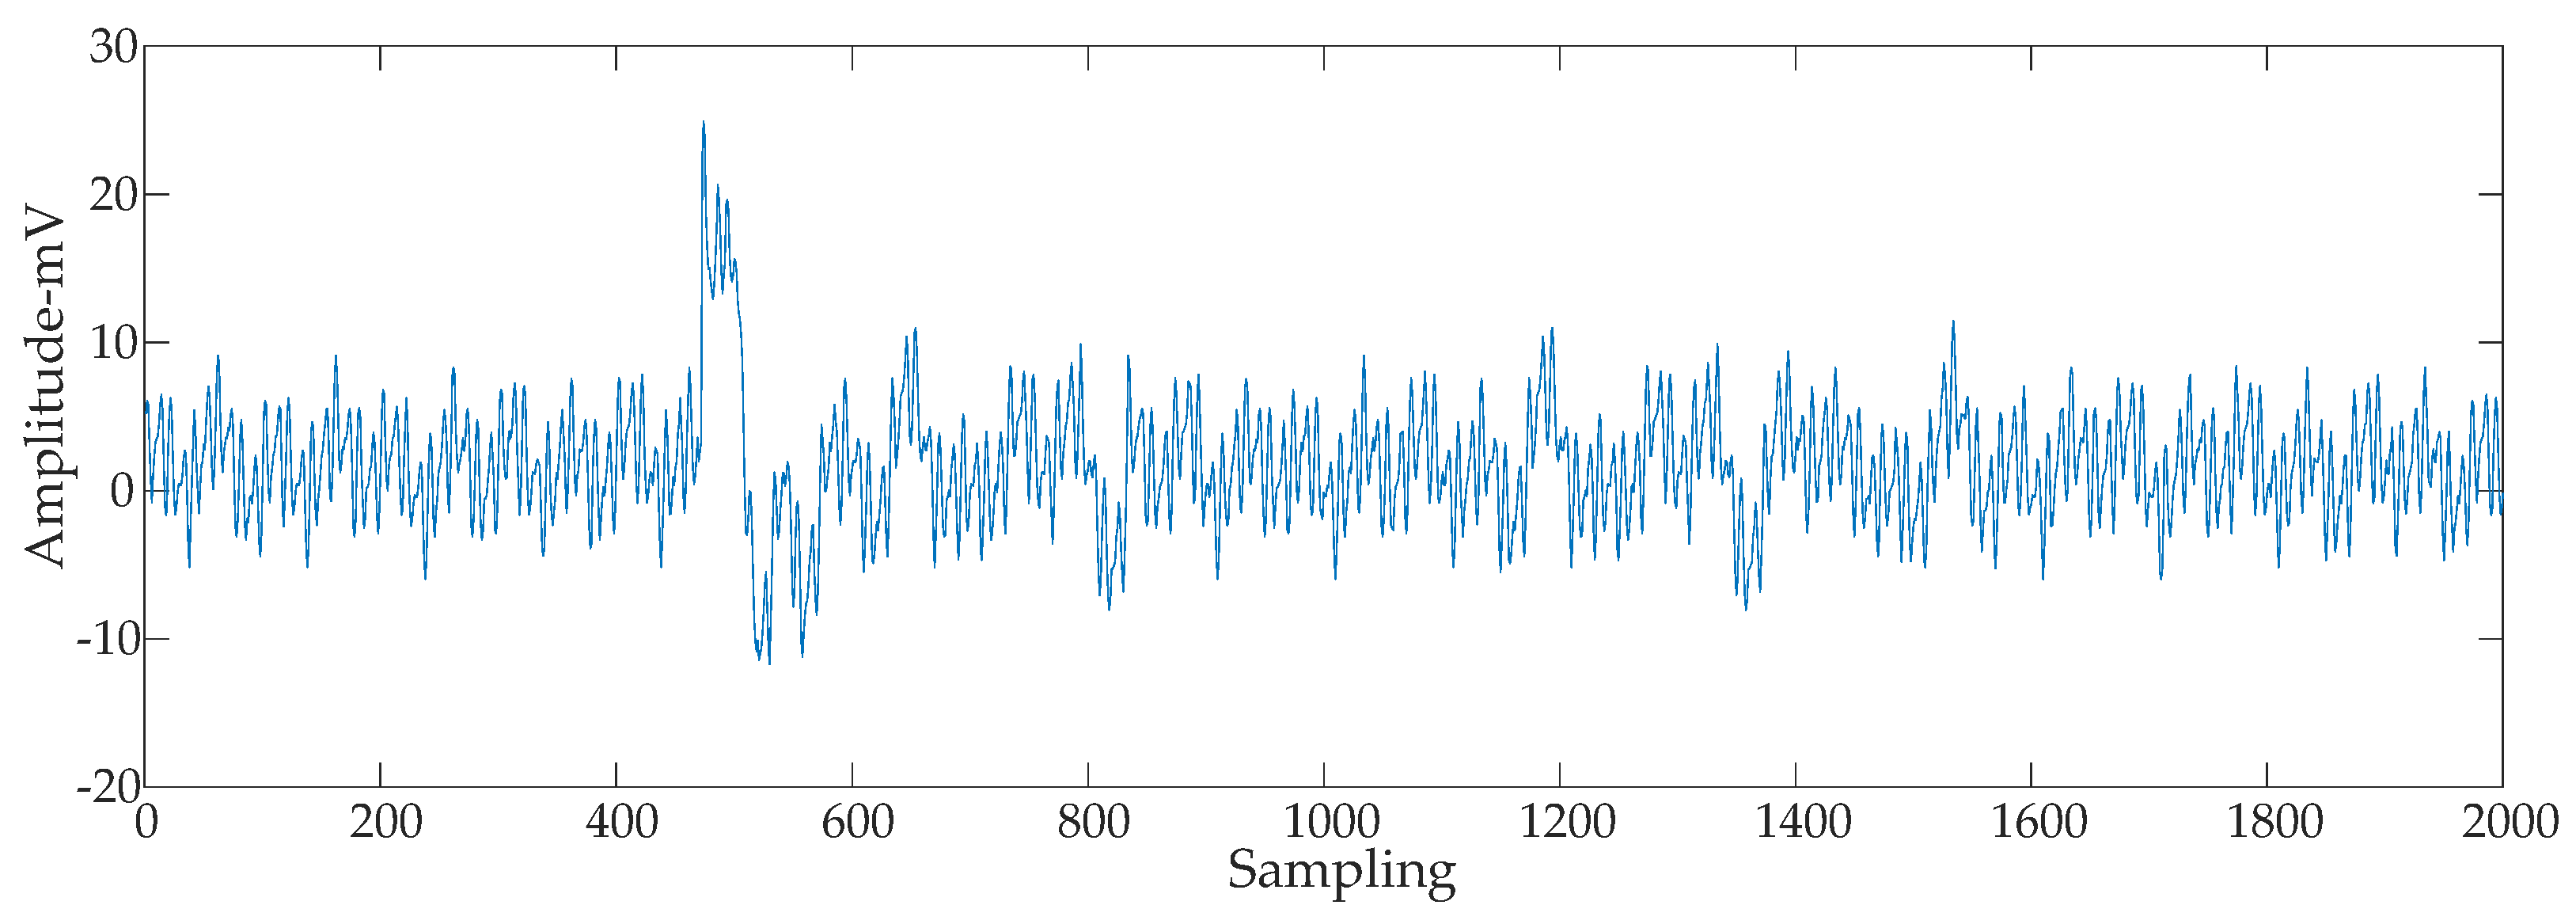
2.2. Simulation of PD Signal with Noise

The periodic narrowband interference is mainly carrier communication interference, with a frequency range of 0.5~25 MHz. The periodic narrowband interference signal is generated by the superposition of sinusoidal signals with different frequencies, and its mathematical expression is
C ( t ) = i = 1 h A i sin ( 2 π f i t )
In the formula: Ai is the amplitude, fi is the frequency, and h is the number of the periodic narrowband interference signals.
Parameter values of the periodic narrowband interference simulation signal are listed in Table 2. The PD signal superimposed with the periodic narrowband interference signals is shown in Figure 2a. A gaussian white noise simulation signal is generated by MATLAB and superimposed with the PD signal, thus yielding a signal-to-noise ratio (SNR) of −2 dB. The waveform is shown in Figure 2b. Figure 2c shows the superposition of the PD signal with a white noise interference signal, where the SNR is −2 dB and the periodic narrowband interference signals.

3. Simulation Analysis of SVD Suppression Effect on Interference Signal

3.1. SVD of Signal

SVD is an important matrix decomposition method, which is extensively used in signal processing. Its noise reduction principle is to use the energy separability of the measured and the noise signals [24,25]; SVD is performed on the matrix that contains signal features according to the corresponding relationship of the singular values among the measured and noise signals. The singular value corresponding to the measured signal is retained, and the singular value corresponding to the noise signal is set to zero. An inverse SVD operation is used to reconstruct the signal, so as to suppress the noise interference.
To perform SVD of the discrete signals x(i) (i = 1, 2, …, N) with noise interference, it is necessary to map them to an m × n dimensional phase space first, followed by the construction of the Hankel matrix. The Hankel matrix is a special matrix type with equal elements on the antidiagonal. Signal x(i) constructs the m × n Hankel matrix as shown by the following expression.
H = [ x ( 1 ) x ( 2 ) x ( n ) x ( 2 ) x ( 3 ) x ( n + 1 ) x ( m ) x ( m + 1 ) x ( N ) ]
In Equation (4), m is the embedding dimension, N is the signal length, and N = m + n − 1.
When constructing the Hankel matrix for signal x(i), different embedding dimensions M will lead to differences in the SVD denoising outcomes. Therefore, it is of great significance to select the optimal embedding dimension m of the Hankel matrix to improve the noise reduction performance of the SVD. To achieve full separation of the signal and noise, the product of the number of rows m and the number of columns n of the Hankel matrix should be as large as possible [26]. According to the inequality principle, when the signal length N is odd, m = (N + 1)/2. When N is even, m = N/2.
For a Hankel matrix H with an order m × n, there exist orthogonal matrices URm×m and VRn × n such that
H = U V T
In the equation Σ = diag(λ1, λ2, …, λr) is the r-order diagonal matrix; λ1, λ2, …, λr are nonzero singular values of the matrix H, and λ1λ2 ≥ … ≥ λr > 0; r is the rank of matrix H, and rmin (m, n). U = [u1, u2, …, um], V = [v1, v2, …, vn], where U and V are left and right singular vectors, respectively [27]. In this case, Equation (5) is the SVD of matrix H.

3.2. Signal Reconstruction Based on SVD Results

The matrix H can be split into the sum of several low-rank matrices Hi,
H = i = 1 r λ i u i v i T = i = 1 r H i
If signal x(i) is the superposition of the PD signal with the periodic narrowband and white noise interference signal, the matrix H can be expressed as H = Hp + Hn + Hw, where Hp, Hn, and Hw correspond to the PD signal, periodic narrowband, and white noise interference signals, respectively. The singular value λi reflects the energy concentration of each signal. According to the singular value distribution characteristics of the PD and interference signals, after the determination of the threshold interval of singular value, the reconstructed trajectory matrix Hr is obtained based on an inverse SVD operation,
H r = [ x r ( 1 , 1 ) x r ( 1 , 2 ) x r ( 1 , n ) x r ( 2 , 1 ) x r ( 2 , 2 ) x r ( 2 , n + 1 ) x r ( m , 1 ) x r ( m , 2 ) x r ( m , n ) ]
In Equation (7), xr(m, n) is the element of the reconstructed trajectory matrix. The elements on the diagonal of the reconstructed trajectory matrix Hr are numerically close but not equal. The average value of the antidiagonal elements of Hr is calculated to obtain the reconstructed one-dimensional signal Xr(i), and the calculation is expressed by Equation (8).
X r ( i ) = { 1 i j = 1 i H r ( j , i j + 1 ) , 1 i < m 1 m j = 1 m H r ( j , i j + 1 ) , m i n 1 N i + 1 j = i n + 1 m H r ( j , i j + 1 ) , i > n

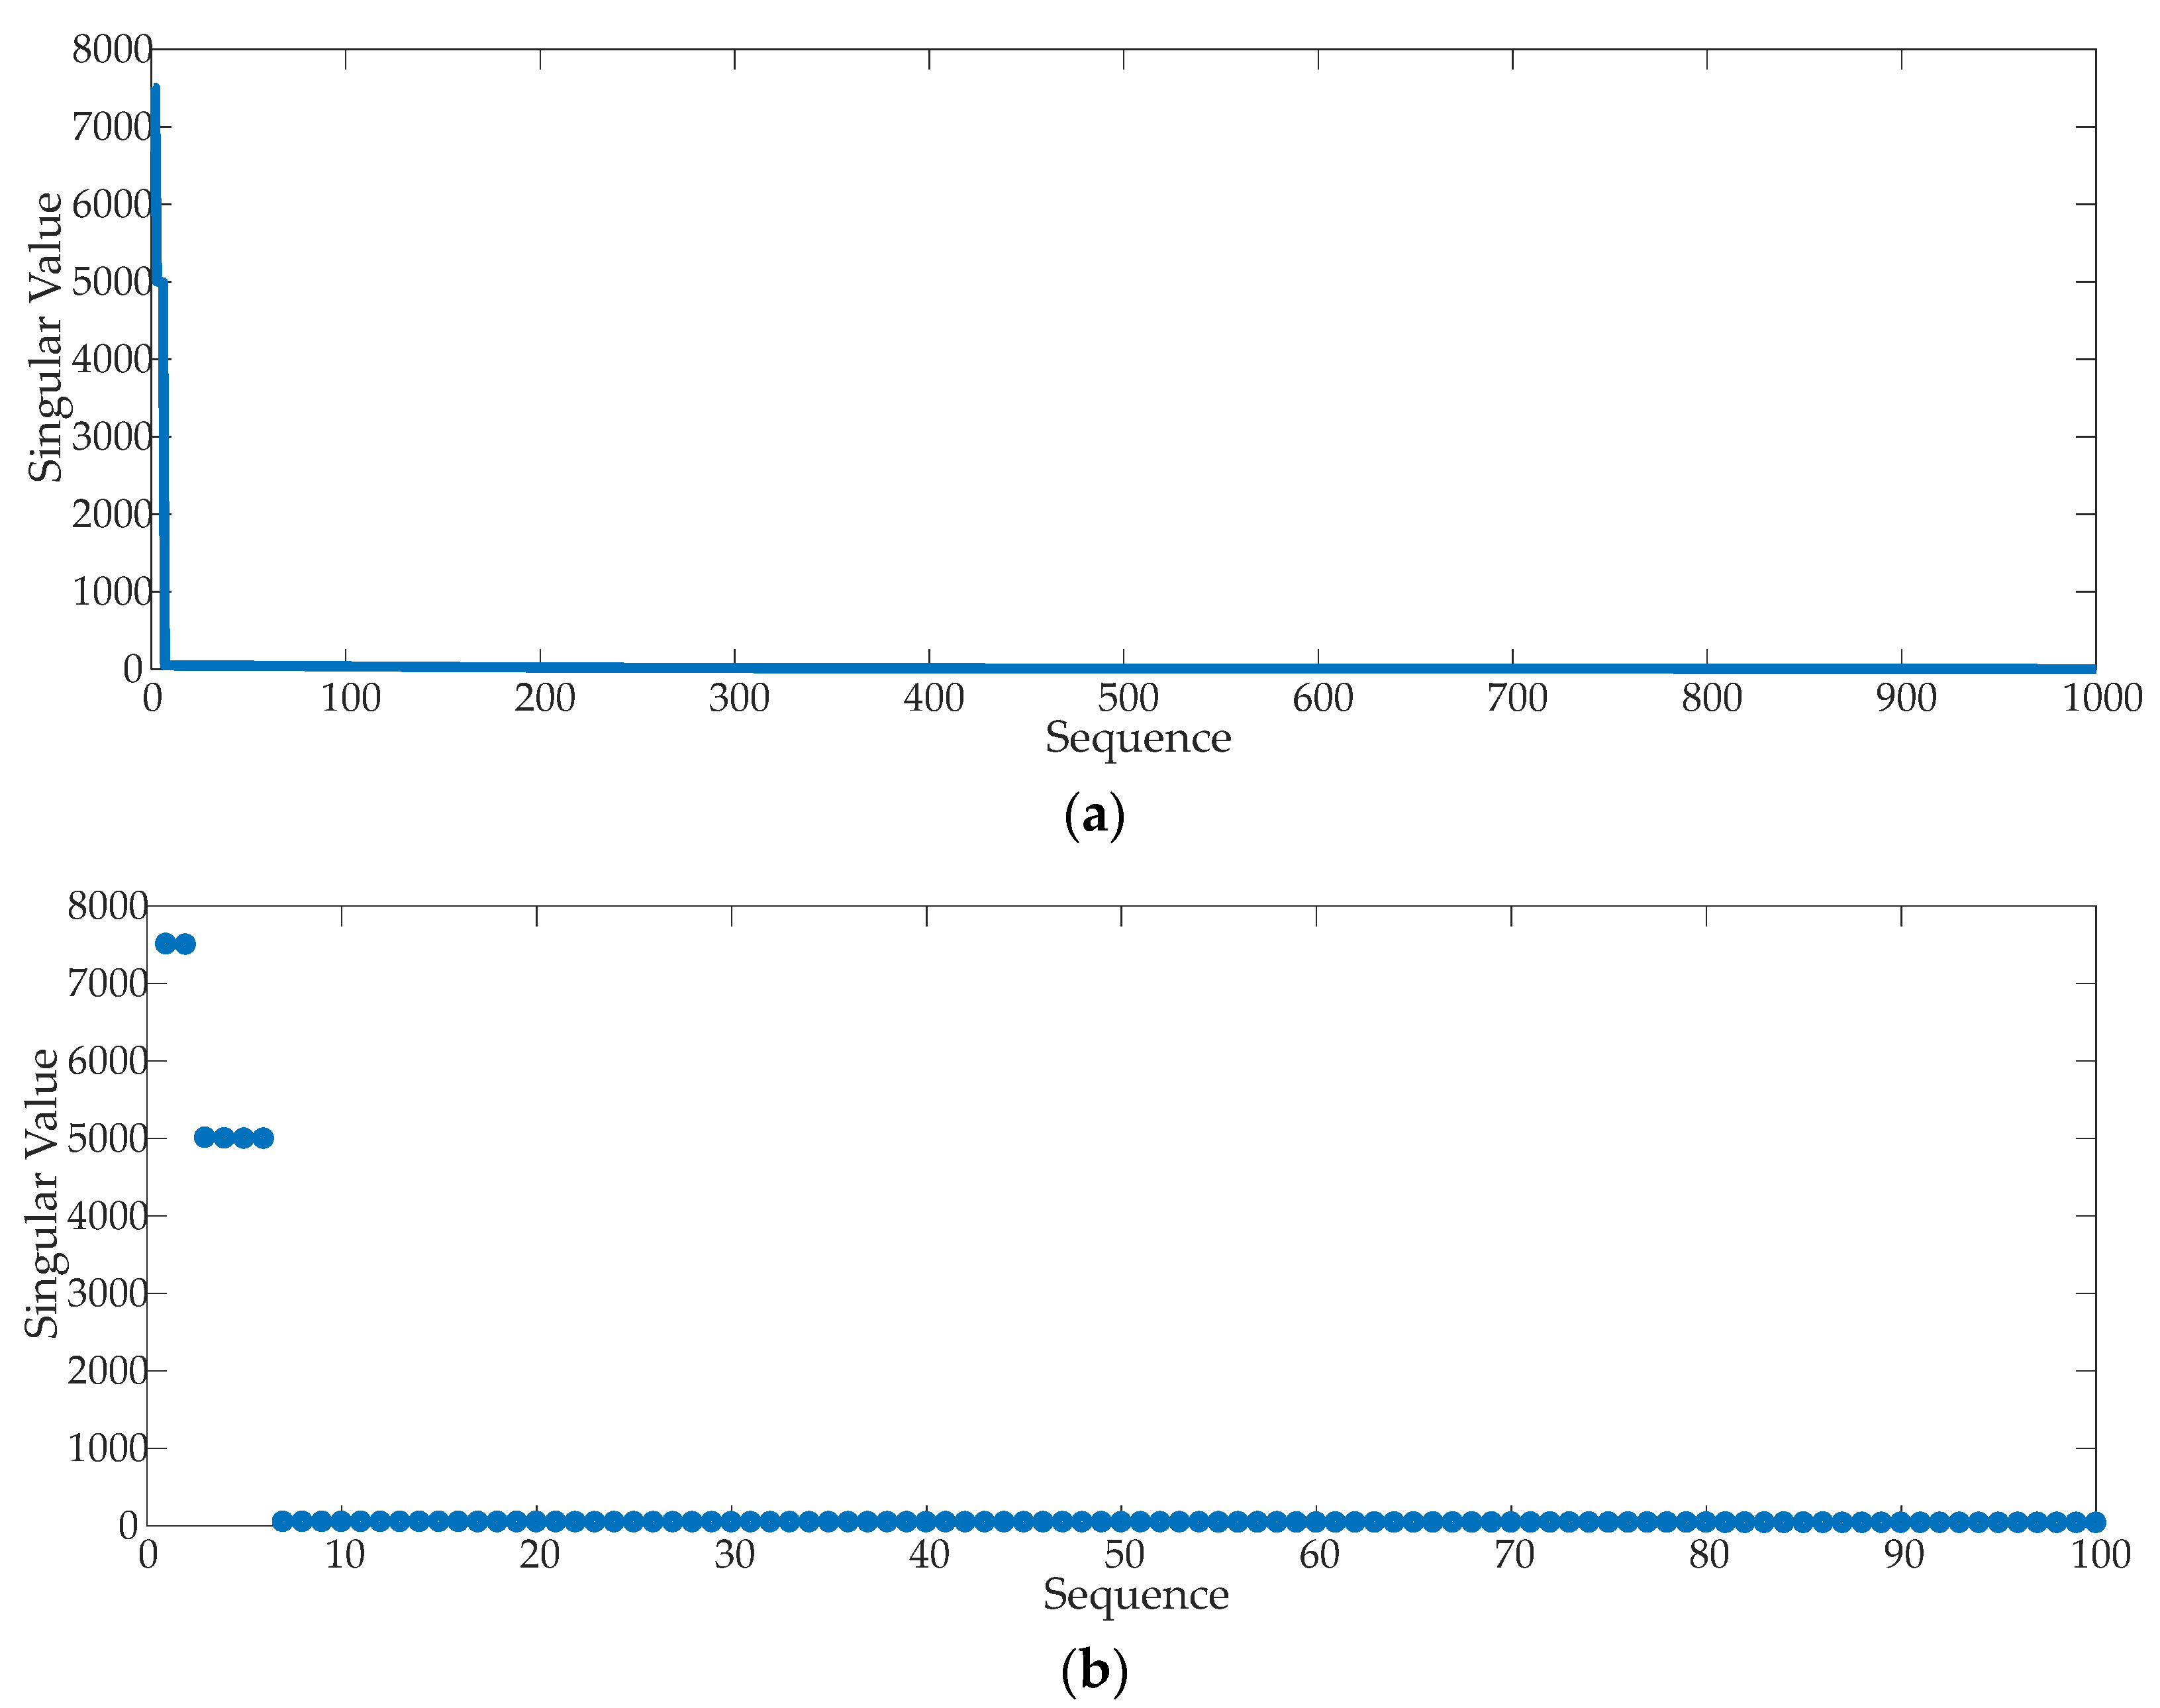
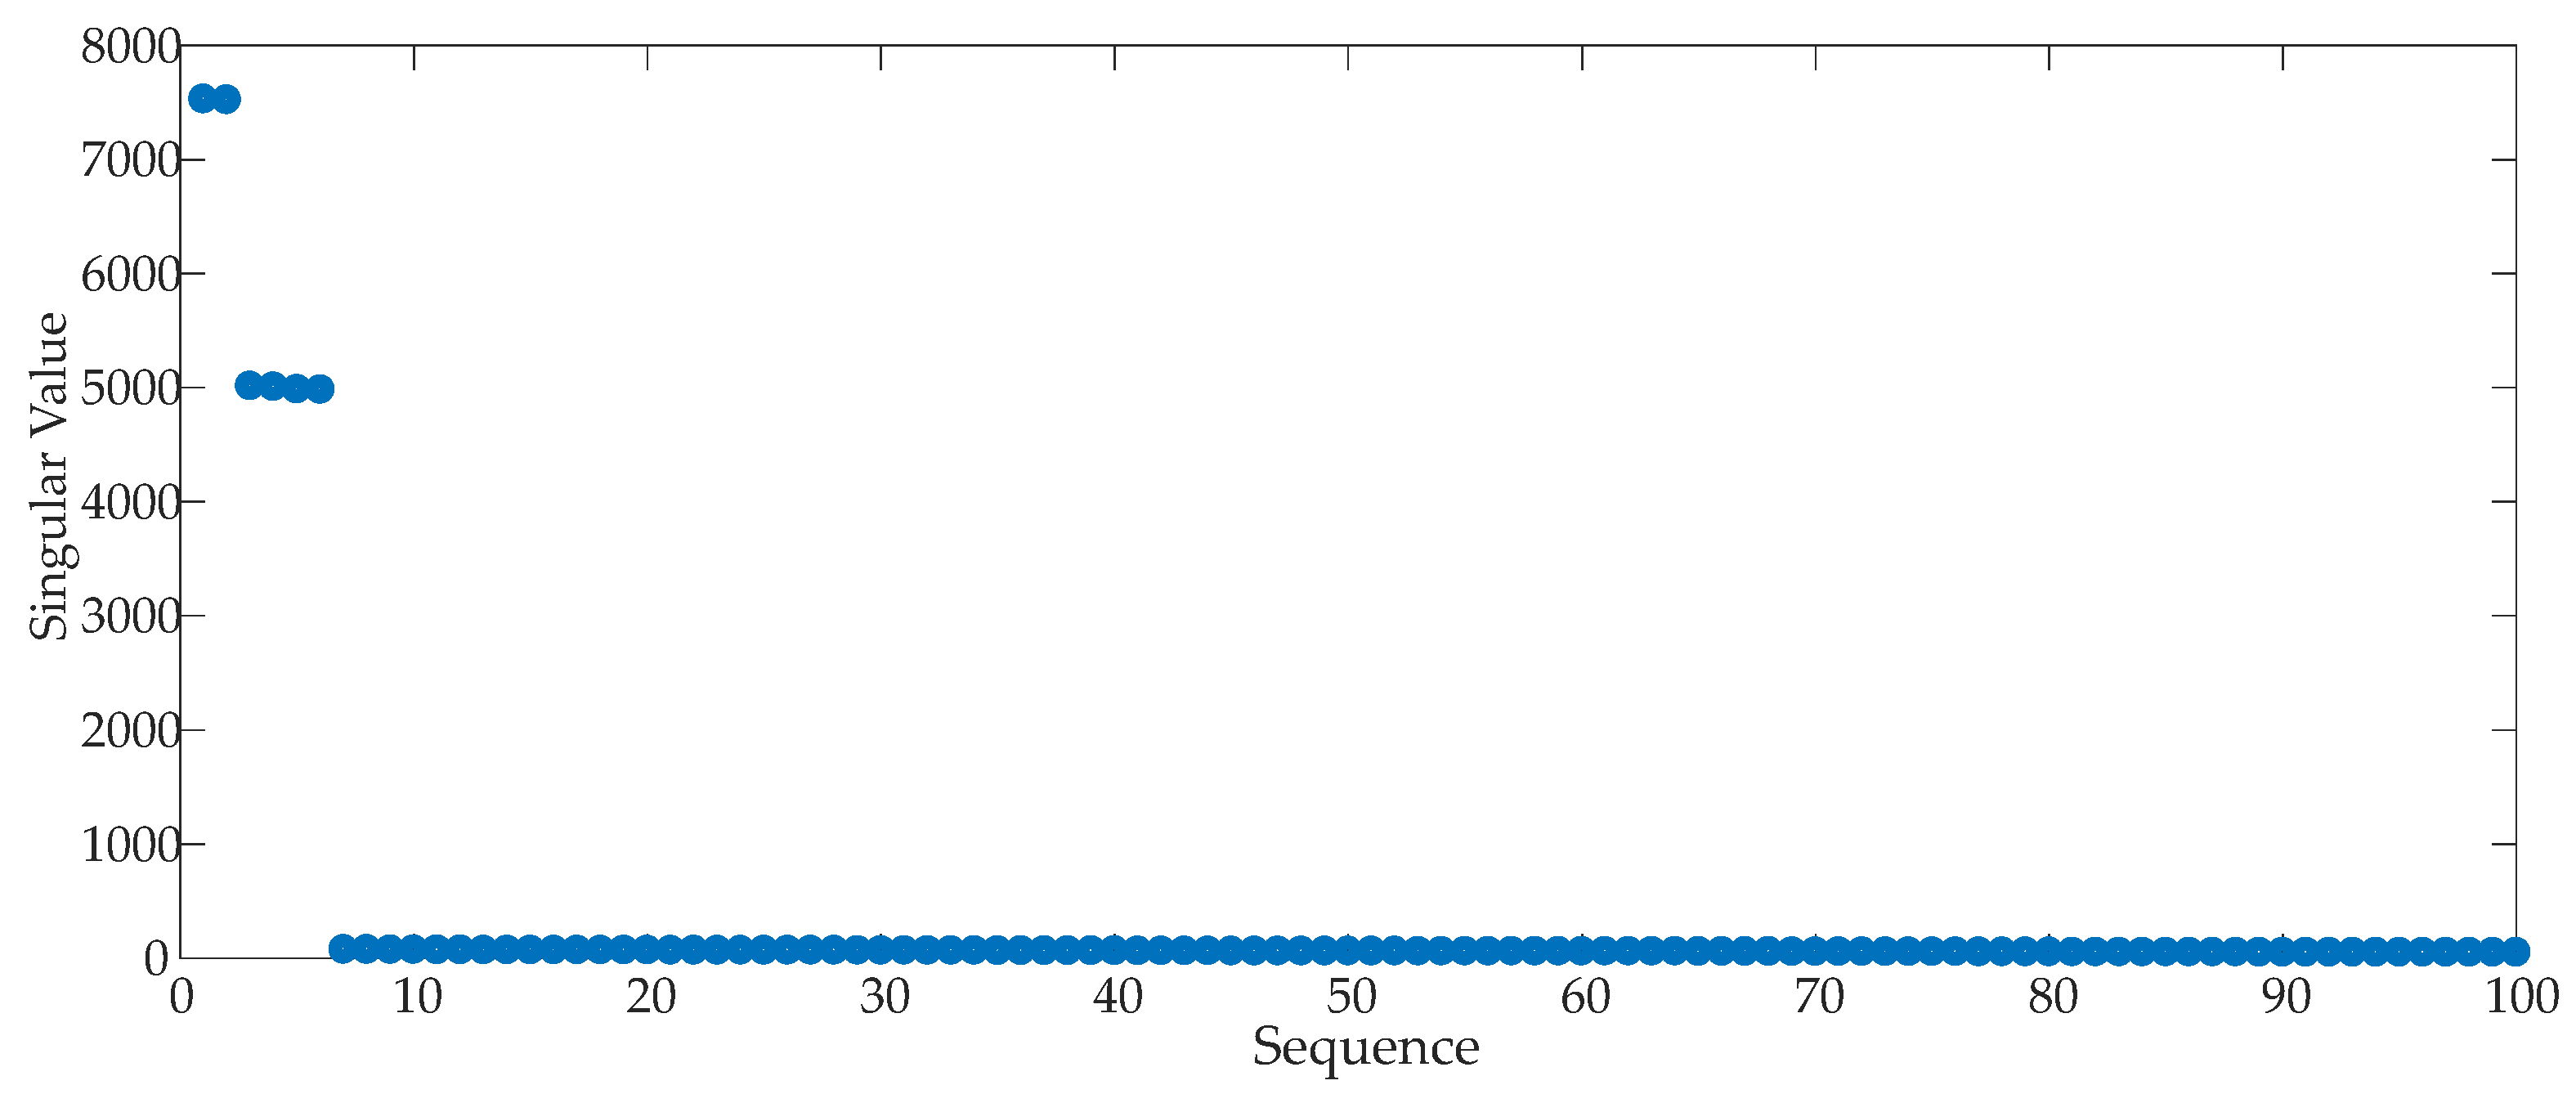
3.3. Singular Value Distribution Characteristics of Periodic Narrowband Interference Signals

The PD simulation signal superimposed with periodic narrowband interference in Section 2.2 is decomposed by SVD, and the singular value distribution is shown in Figure 3a. To observe the distribution of singular values, the first 100 large singular values are used, as shown in Figure 3b.
The energy of the periodic narrowband interference signal is larger than that of the PD signal [28]. In the singular value distribution, the periodic narrowband interference signal corresponds to a large singular value. As shown in Figure 3, the first six singular values are much larger than those of the subsequent order and appear in “pairs.” The periodic narrowband interference signal corresponds to it, and the periodic narrowband interference signal of each frequency corresponds to two (a pair of) singular values. For periodic narrowband interference, the corresponding “singular value pair” contains most of its effective information. These “singular value pairs” can be set to zero to retain the singular value corresponding to the PD signal. The signal is reconstructed by an inverse SVD operation so as to realize periodic narrowband interference suppression.

3.4. Analysis on the Suppression of SVD on Periodic Narrowband Interference

The PD signal superposed with three frequencies in Section 2.2 was decomposed by SVD, the singular value corresponding to the periodic narrowband interference signal was set to zero, and the signal was reconstructed. The obtained aperiodic narrowband interference waveform is shown in Figure 4.
To quantitatively analyze the effect of SVD on suppressing periodic narrowband interference, this paper introduces three evaluation indices: SNR, normalized correlation coefficient (NCC), and the mean-squared error (MSE). The specific calculation formulas are shown in Equations (9)–(11). The larger the SNR is, the closer the NCC is to unity, and the smaller the MSE is, the better the noise reduction effect is.
SNR = 10 lg ( i = 1 N | x ( i ) | 2 i = 1 N | y ( i ) x ( i ) | 2 )
NCC = i = 1 N x ( i ) y ( i ) ( i = 1 N x 2 ( i ) ) ( i = 1 N y 2 ( i ) )
MSE = 1 N i = 1 N | y ( i ) x ( i ) | 2
In the equations above, x(i) is the PD signal, and y(i) is the signal after interference suppression.
Substitution of the PD simulation signal and signal denoised by SVD in Equations (9)–(11) yields SNR = 26.66, NCC = 99.89%, and MSE = 7.97 × 10⁻⁴. It can be observed from the calculation results that the periodic narrowband interference is suppressed effectively.

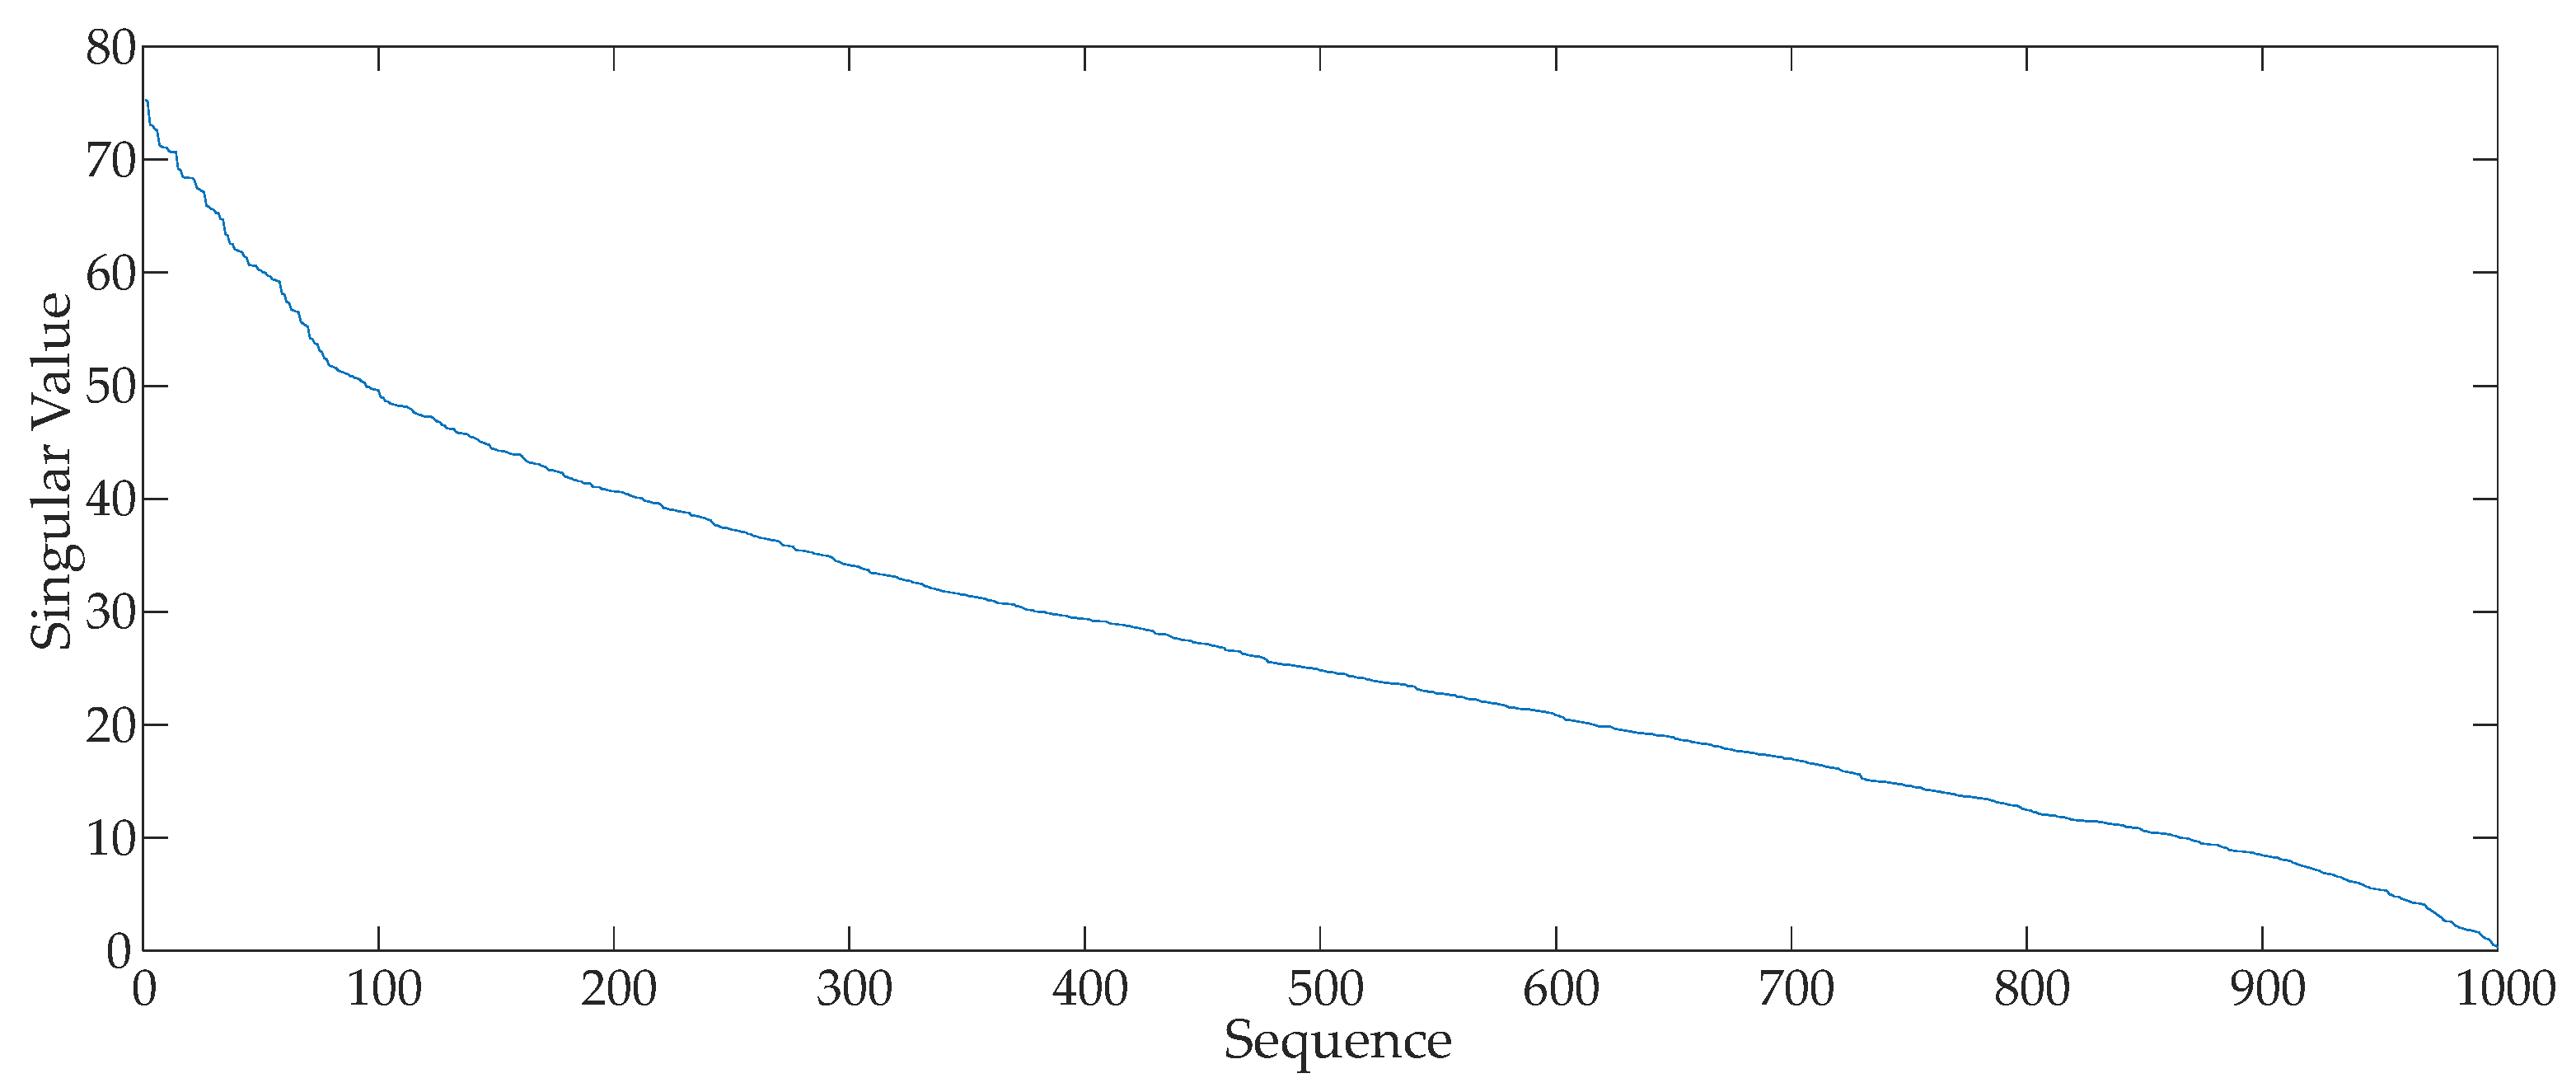
3.5. Singular Value Distribution Characteristics of White Noise Interference Signals

Theoretically, the singular value of the PD signal is greater than that of the white noise. After determining the singular value threshold of the PD signal, the singular value corresponding to white noise interference is set to zero, so as to suppress white noise interference in the PD signal. SVD was performed on the signals in Section 3.4 without periodic narrowband interference, and the singular value distribution obtained is shown in Figure 5.
As shown in Figure 5, there is no obvious inflection point in the distribution of singular values. Thus, it is difficult to distinguish the singular values corresponding to the PD signal and white noise interference signal, that is, it is difficult to determine the singular value threshold of the PD signal. To study the suppression effect of SVD on white noise interference, different numbers of singular values were retained. Assuming i (i = 1, 2, …, 1000) is the number of the singular values that are retained, the first i singular values is retained and the remaining singular values are set to zero; the SNR, NCC, and MSE values of the reconstructed signal are then calculated. The obtained distribution curve is shown in Figure 6. Based on these results, SNRmax = 0.52, NCCmax = 65.05%, and MSEmin = 0.33. According to the three evaluation indices, it can be inferred that the effect of white noise interference suppression of the PD signal by SVD is not ideal.

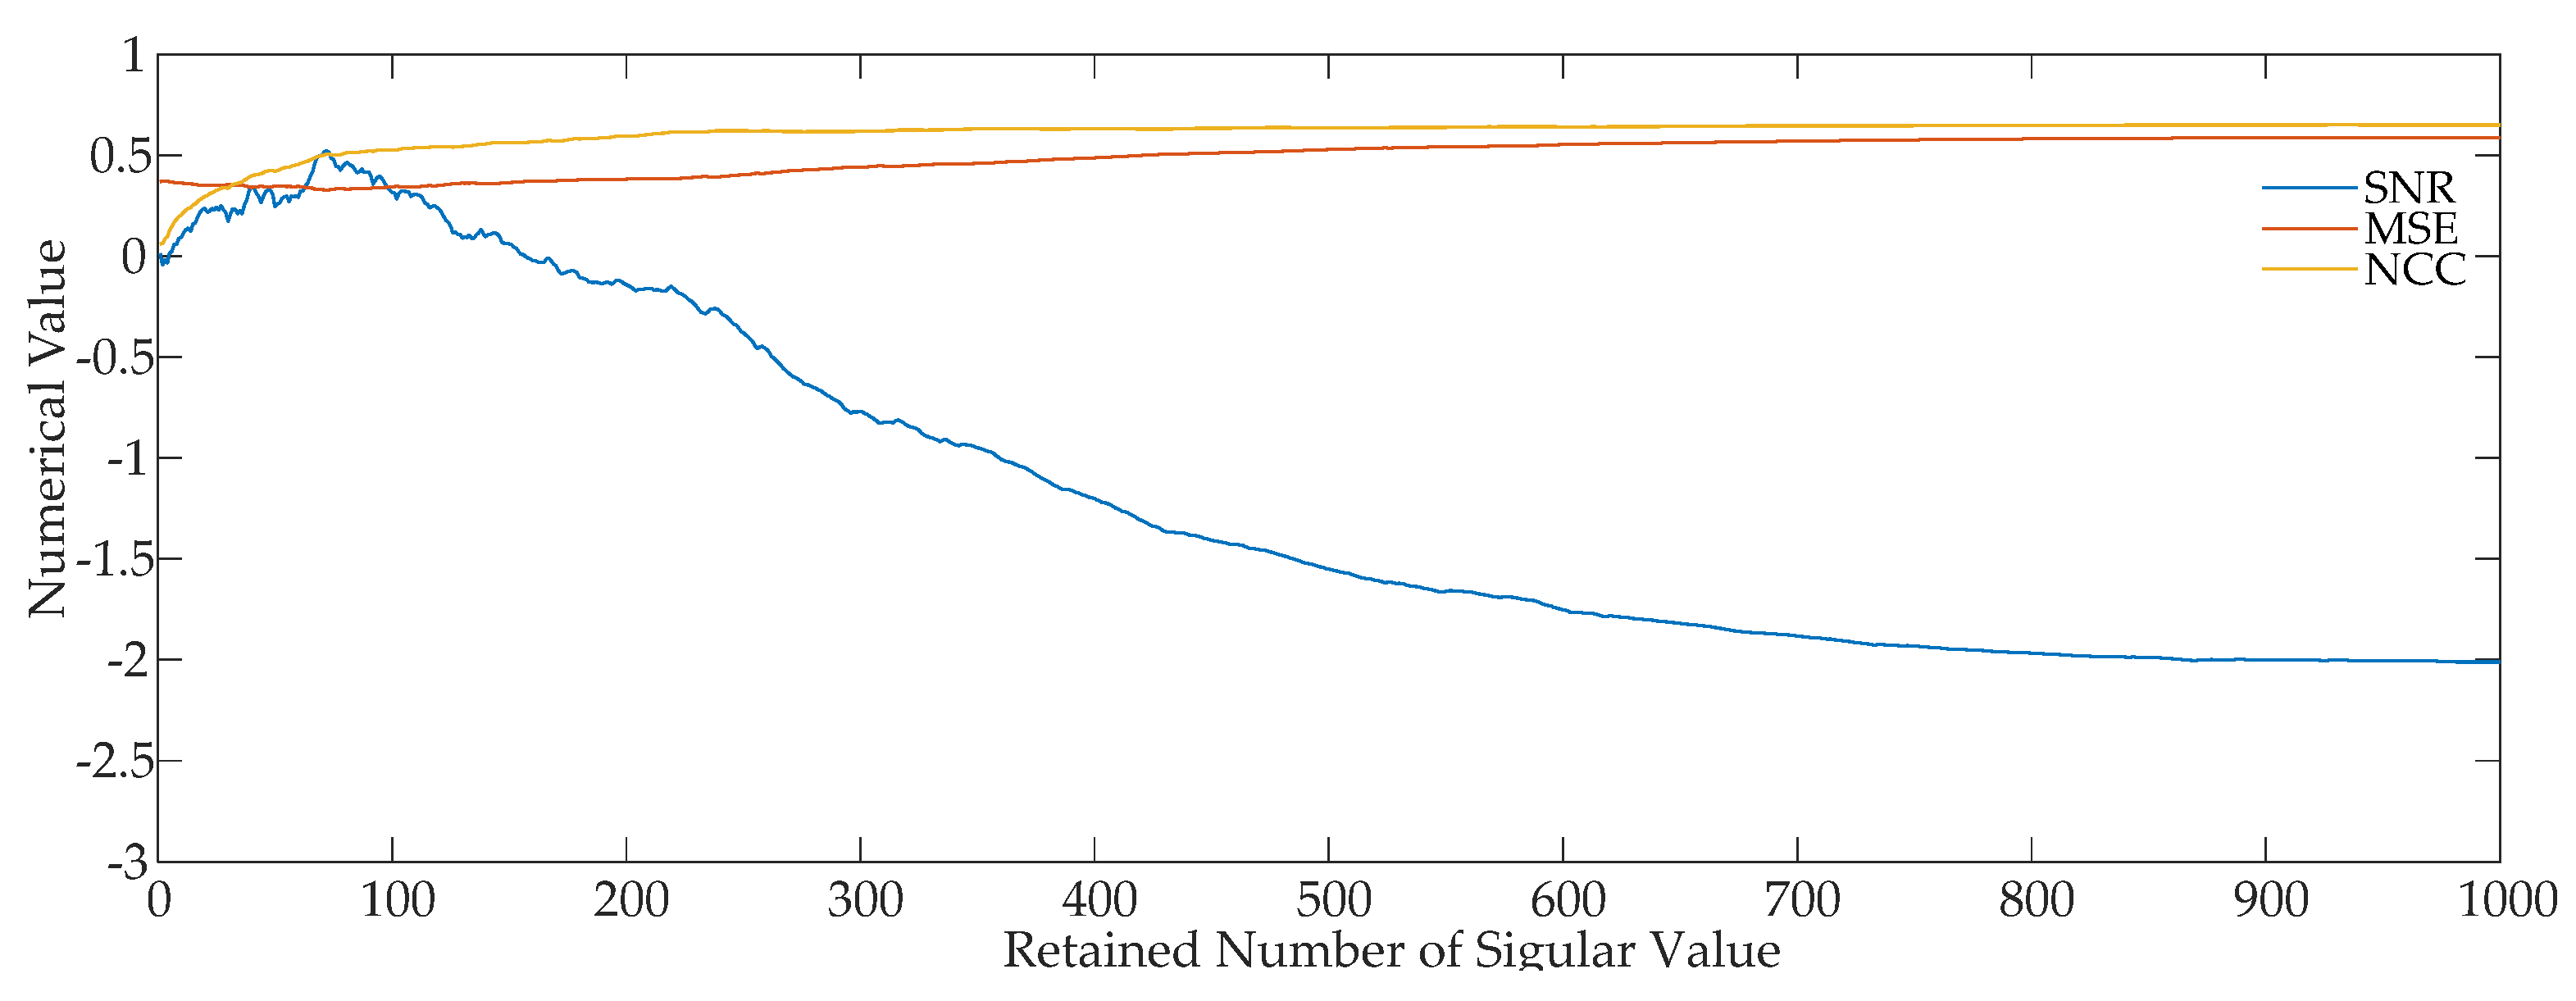
3.6. SVD Suppression Effect in the Presence of White Noise and Periodic Narrowband Interference

The PD signal superimposed with a white noise for which the SNR is −2 dB and the periodic narrowband interference signals in Section 2.2 is decomposed by SVD. The singular value distribution is shown in Figure 7 (only the first 100 singular values are drawn).
In Figure 7, the first six singular values appear in pairs and are much larger than the other singular values. The distribution of singular values in Figure 7 is similar to that in Figure 3b. Thus, it can be concluded that there is still a corresponding relationship between “singular value pairs” and periodic narrowband interference. If the “singular value pair” corresponding to periodic narrowband interference is set to zero, the reconstructed signal waveform is shown in Figure 8a. To study the effects of SVD on the suppression of periodic narrowband interference in the presence of white noise, the PD signal was superposed with a white noise signal for which the SNR is −2 dB as a whole signal, and the SNR, NCC, and MSE of the reconstructed signals were calculated. The results showed that SNR = 21.94, NCC = 99.68%, and MSE = 6.5 × 10⁻³. SVD is used to suppress the white noise interference of the reconstructed signal with periodic narrowband interference, and the waveform obtained is shown in Figure 8b. By calculating the SNR, NCC, and MSE of the reconstructed signals, SNR = 0.52, NCC = 50.49%, and MSE = 0.33 were obtained.
Figure 8 shows that when the PD signal contains both white noise and periodic narrowband interference, the waveform of SVD for periodic narrowband interference suppression is very close to that of Figure 2b. The calculated results of SNR, NCC, and MSE show that SVD is effective in suppressing periodic narrowband interference signals. However, compared with the original PD signal, the amplitude attenuation of the waveform after suppression of white noise interference is serious, and there are more residual interferences. The evaluation indices SNR, NCC, and MSE show that SVD has a poor suppression effect on white noise interference.

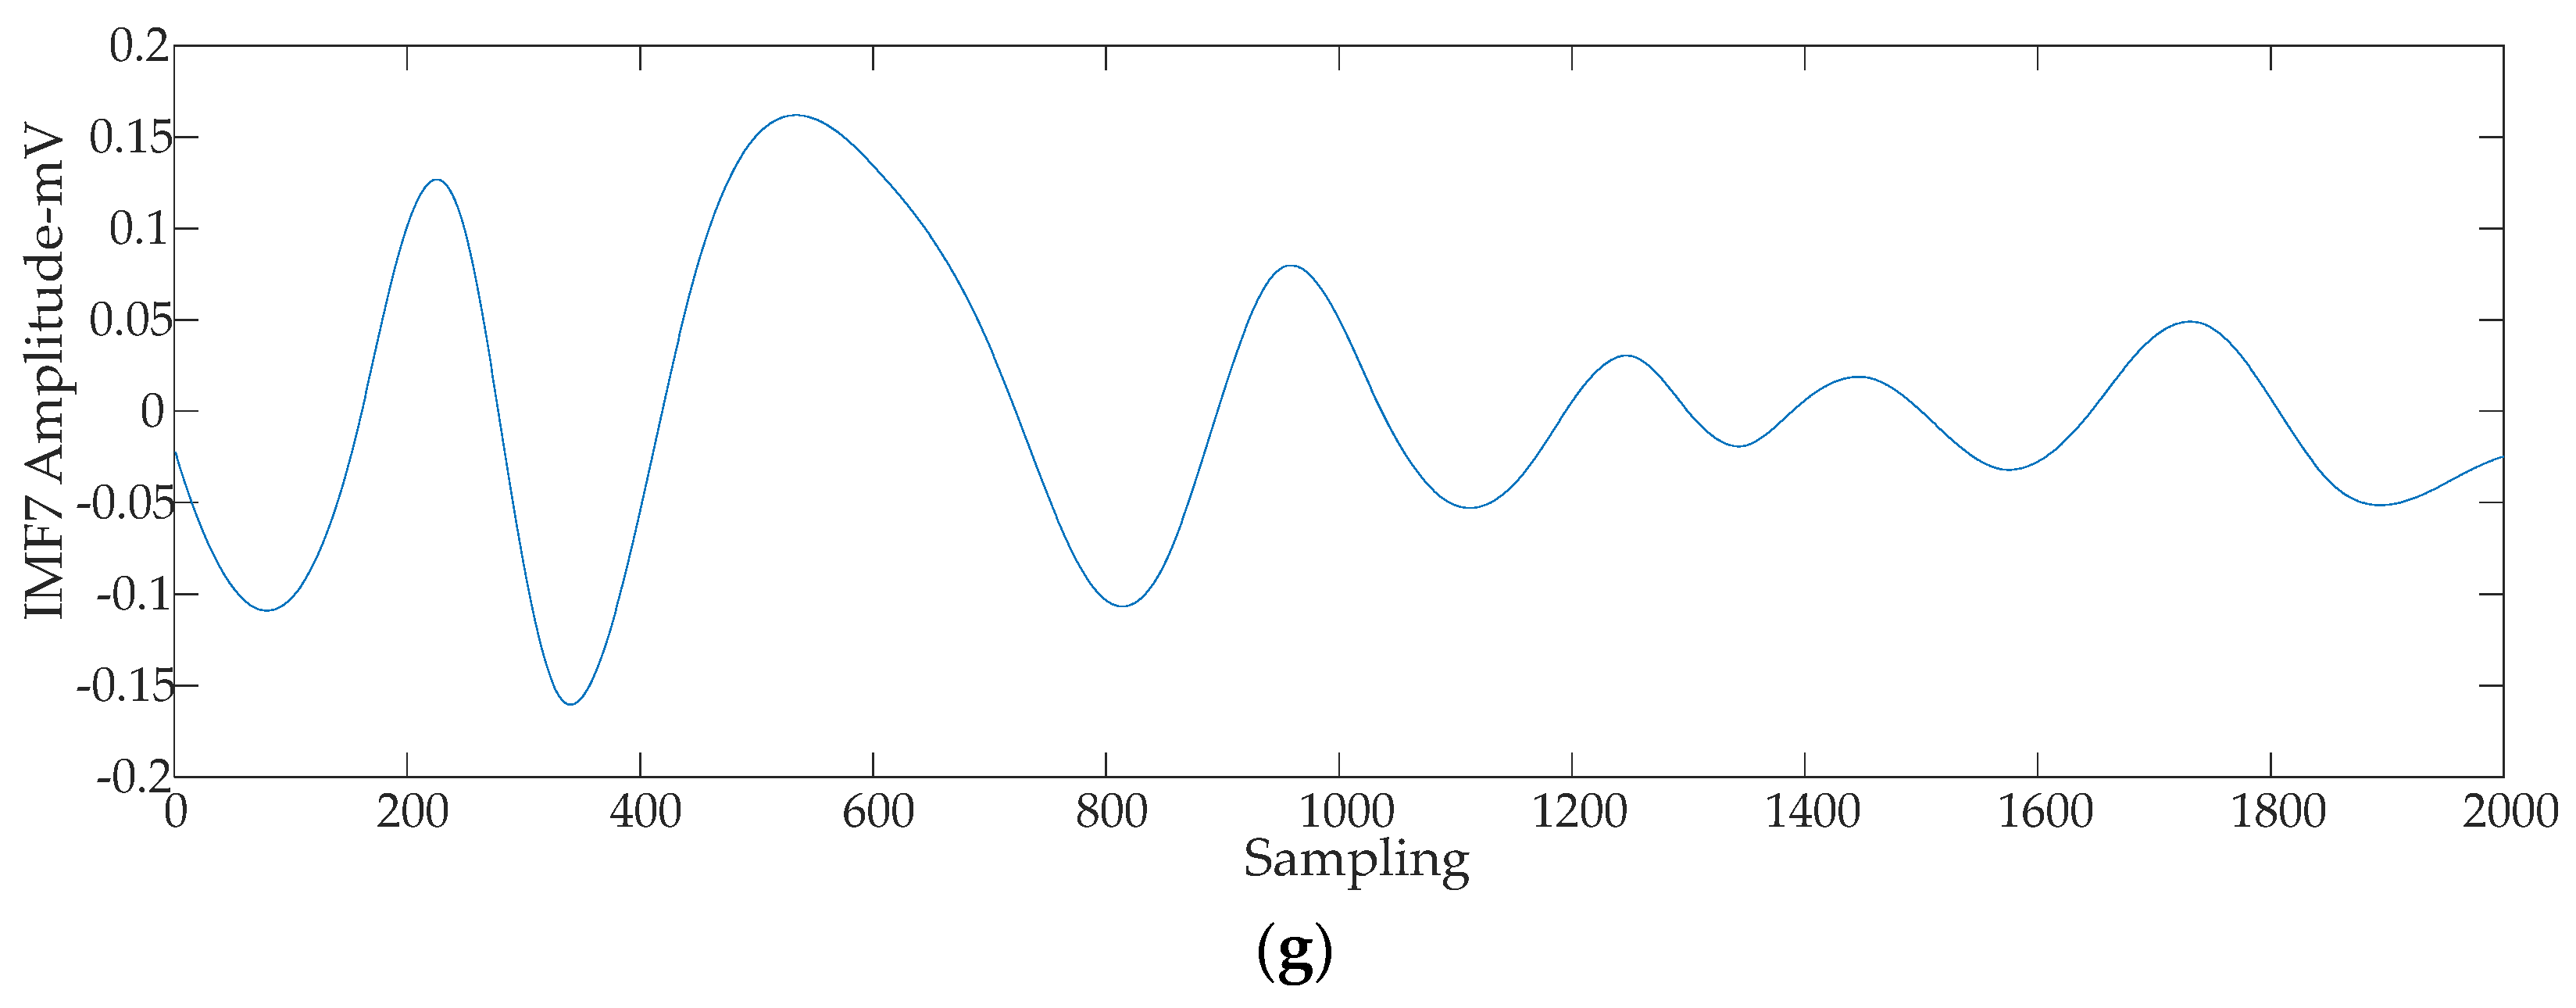
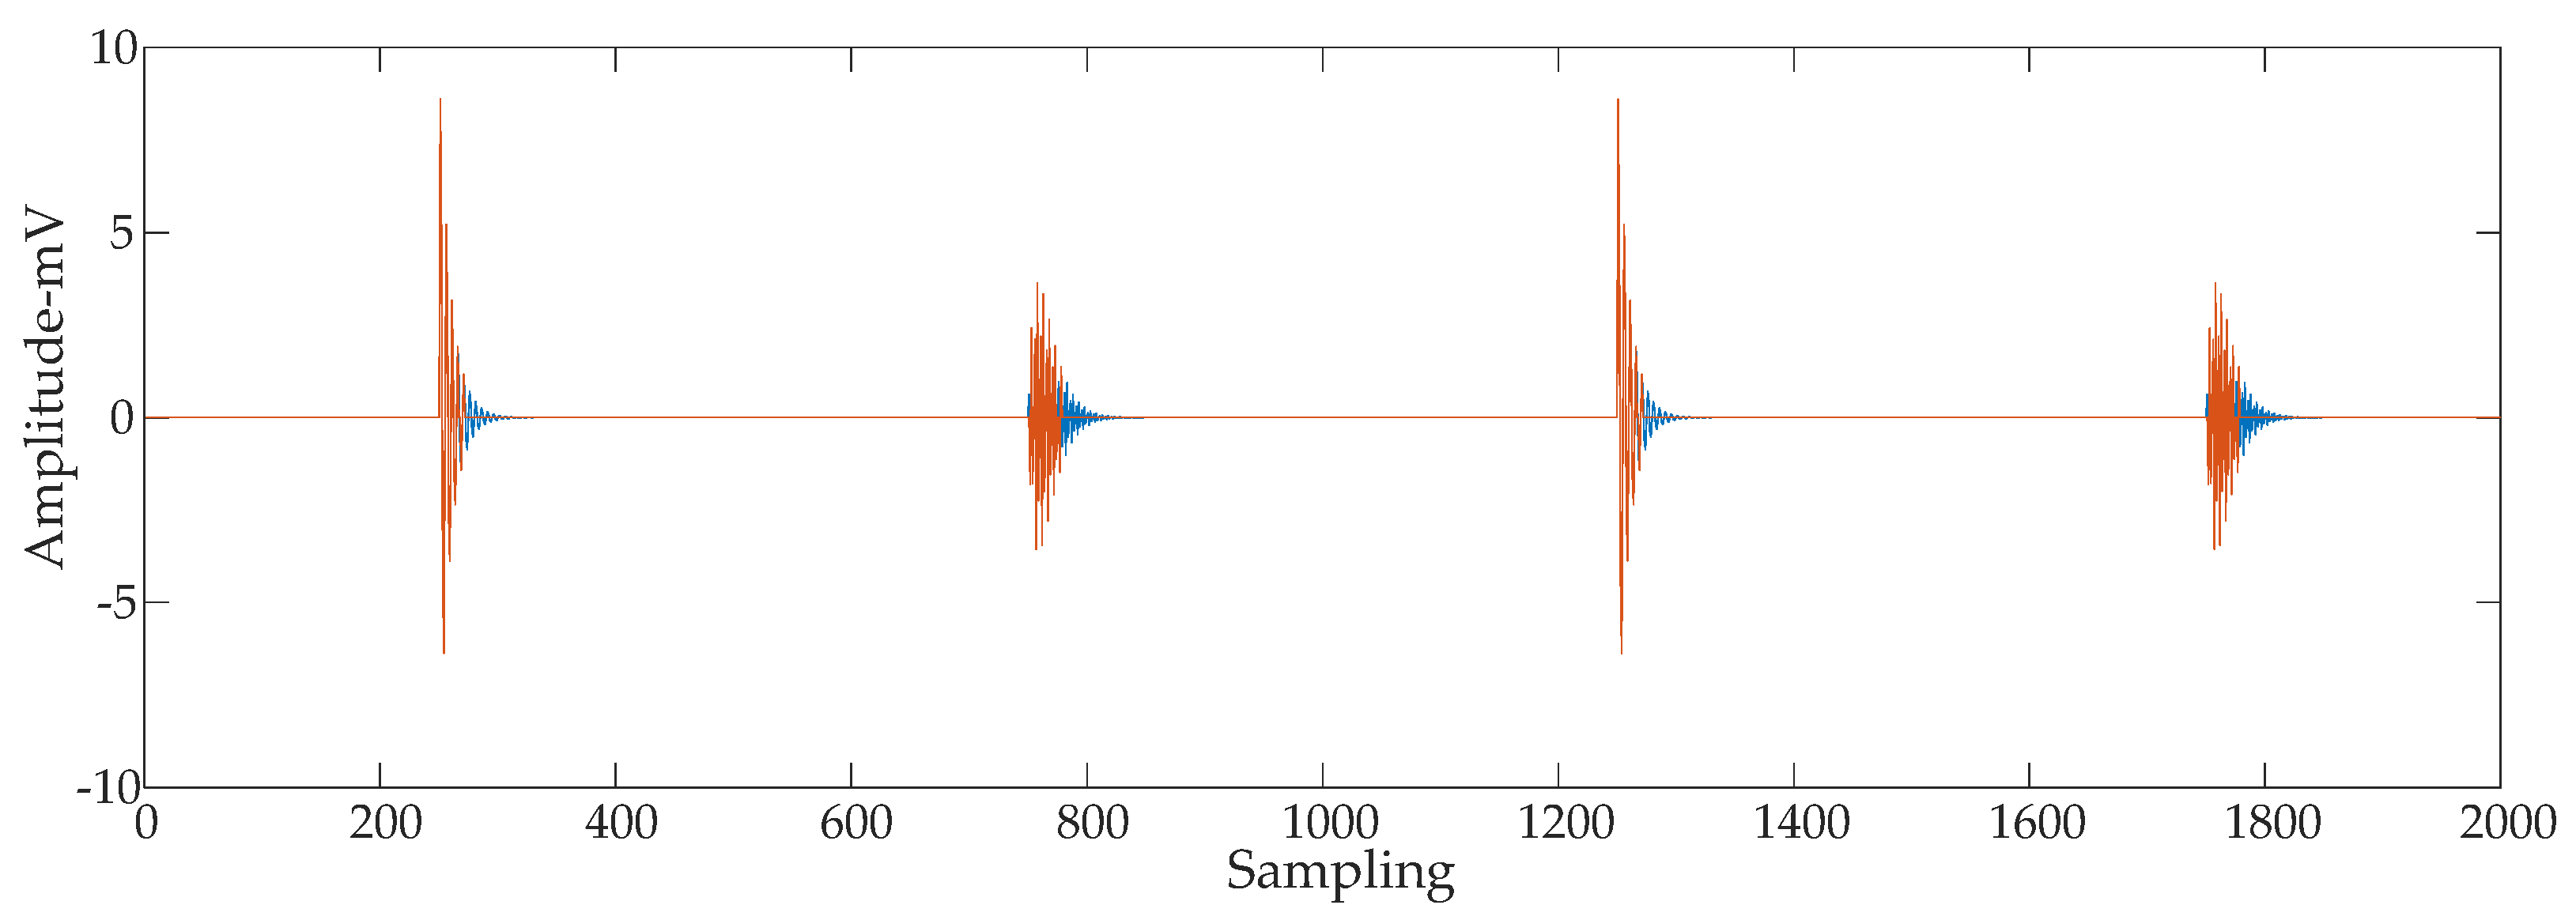
4. Simulation Analysis of Suppression Effect of EMD on Interference Signal

4.1. EMD

EMD is used to decompose multi-time scale component signals into multiple IMF components hi(t) with high to low frequencies and a residual component rn(t) [29,30], namely,
x ( t ) = i = 1 n h i ( t ) + r n ( t )
In Equation (12), hi(t) is the IMF component of order i and rn(t) is the residual component of order n. The IMF components decomposed by EMD need to satisfy the following constraint conditions:
(1)
In the entire data sequence interval, the number of extreme points is equal to or differs by at most one unit from the number of zero crossings.
(2)
The upper envelope and the lower envelope are symmetric about the time axis, that is, the mean value m(t) = 0.
For the signal x(t), the EMD process is as follows:
(1)
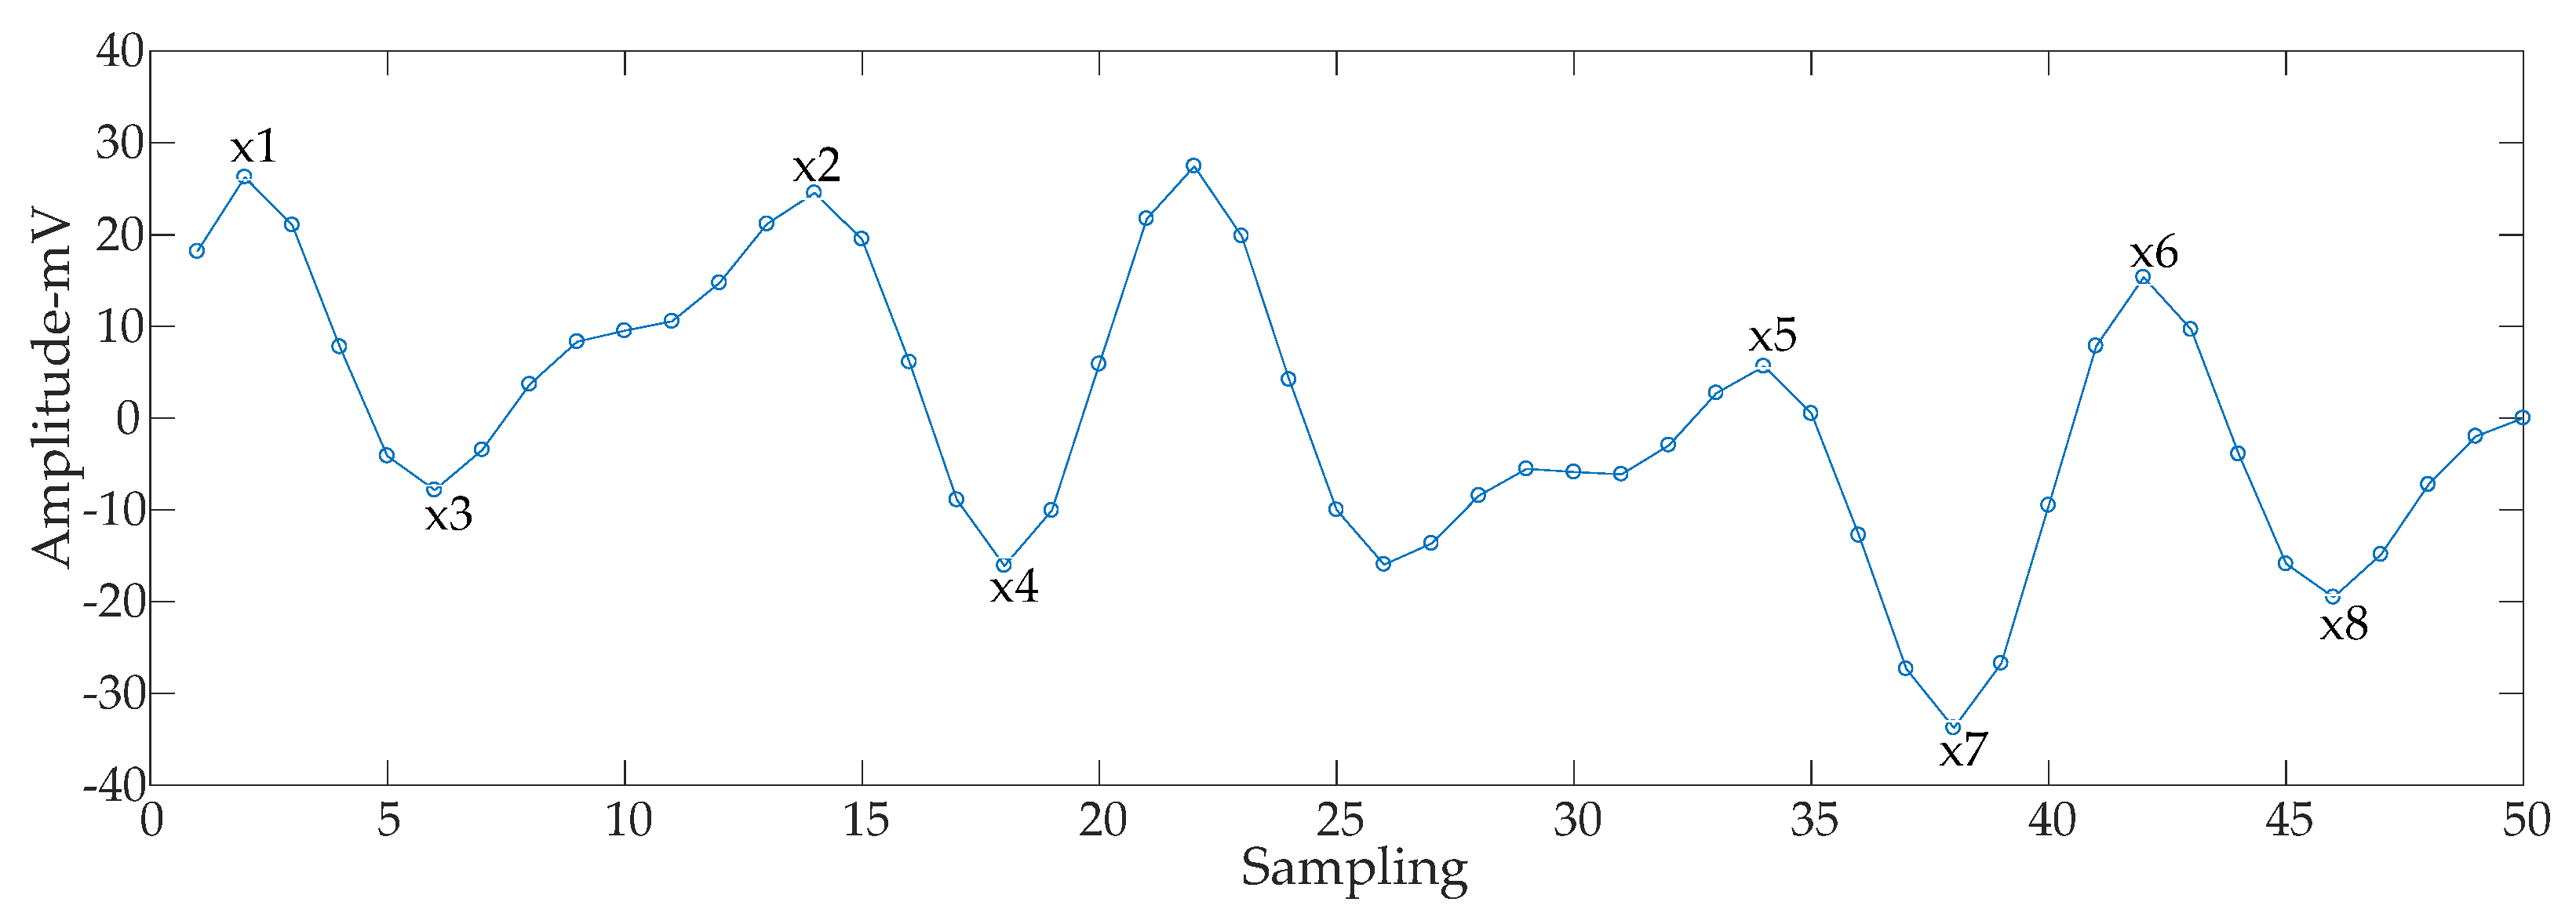
Find all maximum and minimum points of signal x(t).
(2)
The upper envelope emax(t) and the lower envelope emin(t) are obtained by the cubic spline interpolation method to interpolate the maximum and minimum points, respectively.
(3)
Calculate the average value of the upper envelope emax(t) and the lower envelope emin(t) as follows:
m ( t ) = [ e max ( t ) + e min ( t ) ] 2
(4)
Remove m(t) from x(t) and separate h(t) as follows:
h ( t ) = x ( t ) m ( t )
(5)
Determine whether h(t) satisfies the two constraints of the IMF. If so, h1(t) = h(t) is the first-order IMF component, and step (6) is executed. Otherwise, let x(t)= h(t) and repeat steps (1)–(5) until the condition is satisfied.
(6)
Let r1(t) = x(t) − h1(t) to determine whether r1(t) is a monotone function or the absolute value is small enough. If so, EMD ends. Otherwise, let x(t) = r1(t) and return to step (1).

4.2. Endpoint Effect

The endpoint effect is generated because extreme points need to be used in the process of EMD. However, the endpoints at both ends of the signal may not be extreme points. If the end point is directly regarded as the extreme point, there will be errors and the signal will be distorted. Therefore, the endpoint effect of EMD needs to be suppressed.
In this paper, the mean extension method is adopted to suppress the endpoint effect of EMD. First, two maximum points and two minimum points closest to the left and right endpoints are found, respectively. The average values are respectively considered as the endpoint values of the upper and the lower envelopes. As shown in Figure 9, at the left endpoint, the two nearest maximum points are x1 and x2, and the average value of x1 and x2 is obtained as x1′; x1′ is then used as the left endpoint value of the upper envelope. Similarly, the average values of x3 and x4 are the left endpoint values of the lower envelope. The average values of x5 and x6 are the right endpoint values of the upper envelope. The average values of x7 and x8 are the right endpoint values of the lower envelope.

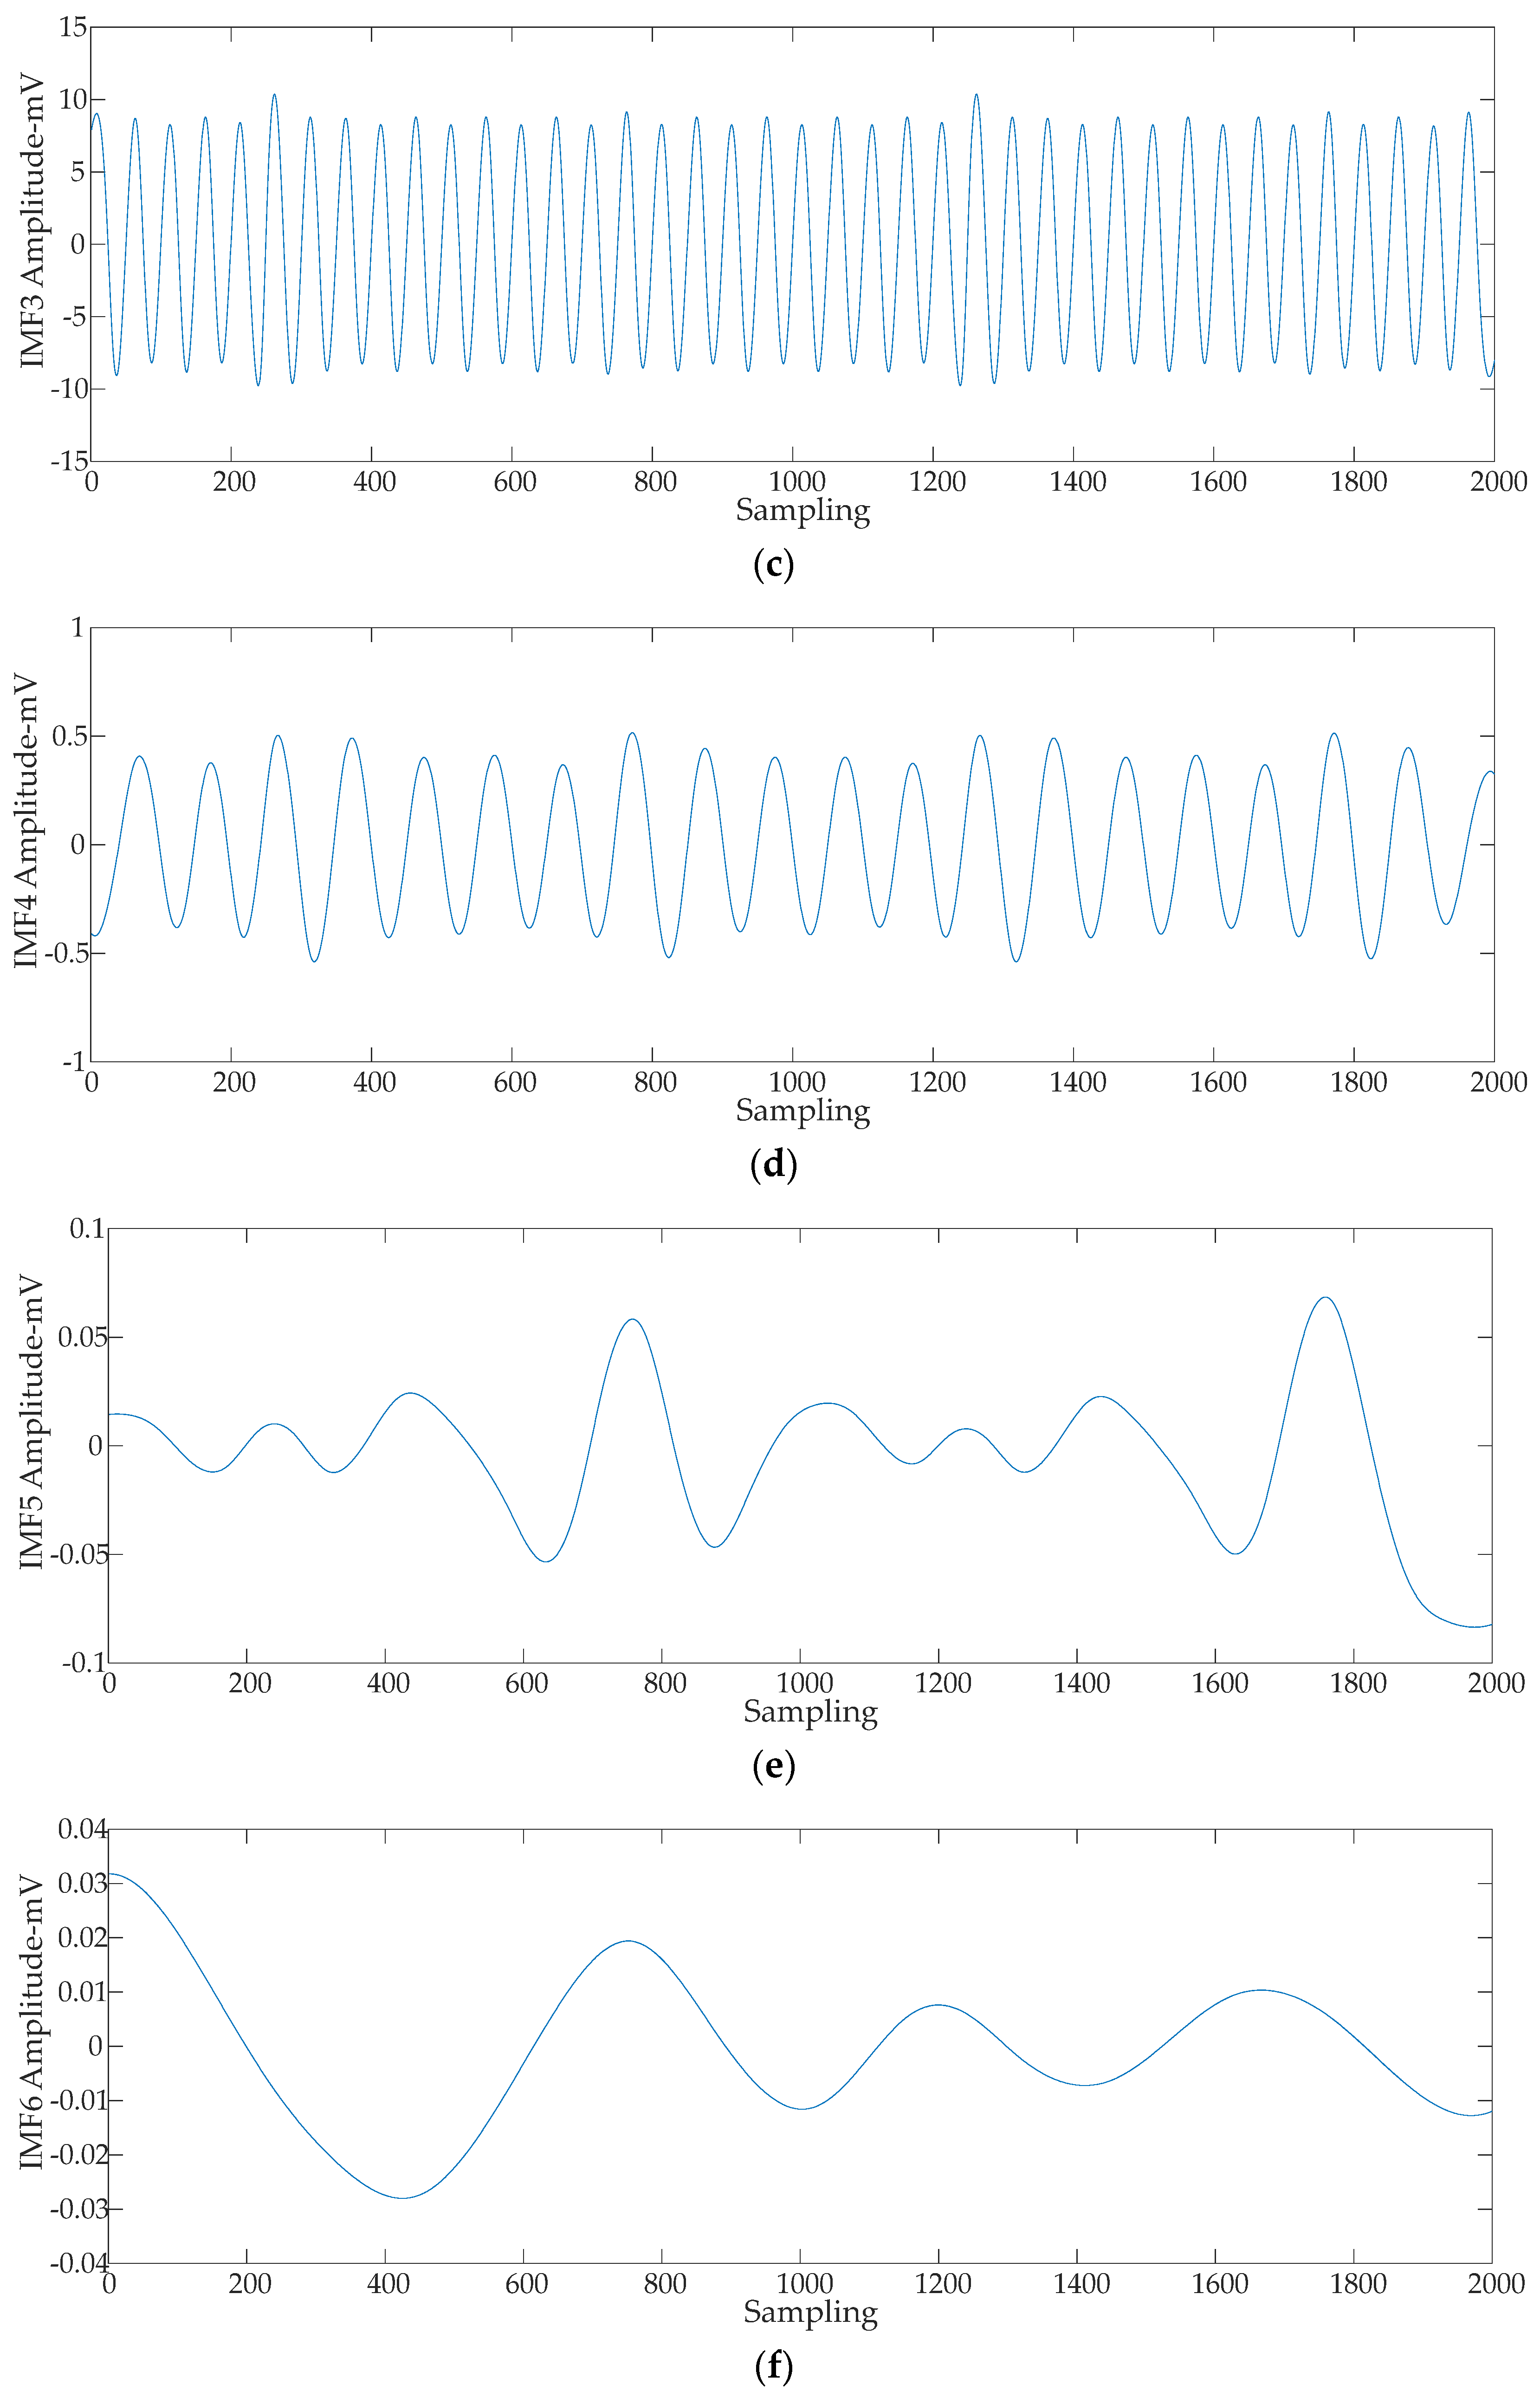
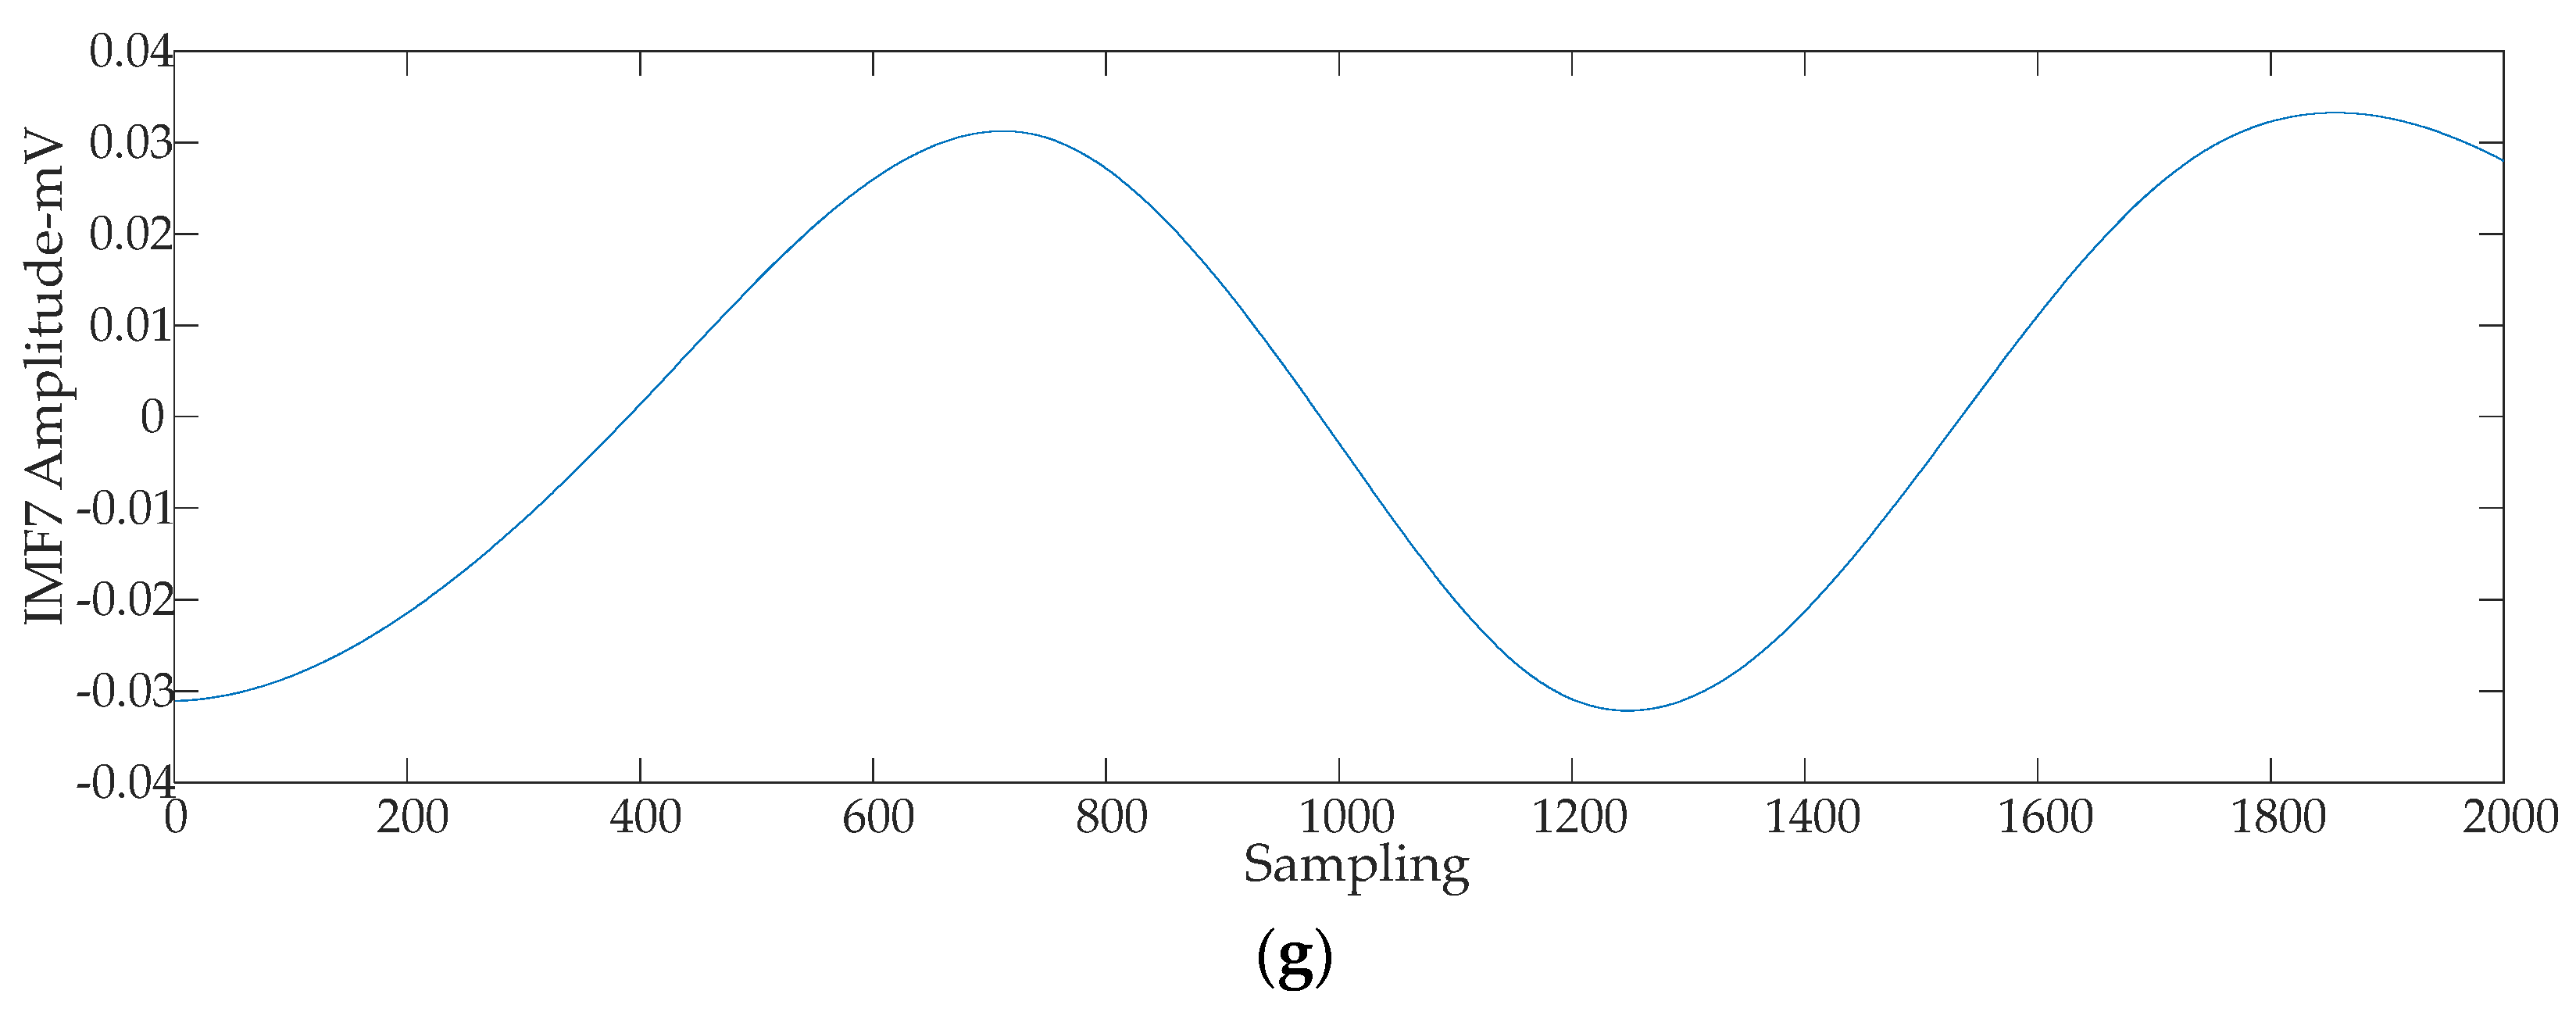
4.3. Suppression Effect of EMD on Periodic Narrowband Interference

EMD is performed on the PD simulation signal superimposed with periodic narrowband interference in Section 2.2 and the IMF components obtained are shown in Figure 10.
The basic idea of EMD is to decompose the signal into IMF components from high to low frequencies [31] so that the characteristics of the extracted PD signal can be displayed at different resolutions. Figure 10 shows that the frequency of the IMF1 component is the highest, and the frequency of each IMF component decreases in turn. Different IMF components represent different time scales, and the main characteristics of PD signals cannot be clearly observed in these IMF components. Therefore, EMD cannot adequately suppress the periodic narrowband interference in PD signals.

4.4. Suppression Effect of EMD on White Noise

In Section 3.4 the signal after periodic narrowband interference suppression is decomposed by EMD, and the IMF components obtained are shown in Figure 11.
Figure 11 shows the high frequency components are IMF1 and IMF2, and they contain obvious partial discharge simulation signal distribution characteristics. In other words, the IMF1 and IMF2 components contain the main characteristics of the PD signals. The signals corresponding to the IMF1 and IMF2 components are reconstructed, and the waveform thus obtained is shown in Figure 12. The values SNR = 0.70, NCC = 65.89%, MSE = 0.29 are obtained by calculating the SNR, NCC, and MSE of the reconstructed signals. From the reconstructed signal waveform and calculated results, it can be observed that even though the EMD is better than the SVD method in suppressing white noise interference, there is still considerable residual noise.

5. IEMD Method for Interference Suppression of PD Signal

5.1. IMF Component Processing Method Based on Improved 3σ Criterion

The main reason the EMD method has more residual interference in white noise suppression is the phenomenon of mode mixing in the IMF component. As shown in Figure 11, white noise interference and PD signals are still aliased together within the IMF component. To solve this problem, this paper introduces the 3σ criterion commonly used in gross error detection [32,33]. Gross error is defined as the error which does not have a clear distribution law or follow a random distribution law in the error theory. The IMF components obtained after the EMD of white noise interference contained in the PD signal still follow a random distribution [34], whereas the PD signal does not obey this distribution rule. The PD signal can be regarded as the “gross error,” and statistical processing can be conducted according to the criterion to realize the separation of white noise interference and PD signals.
As the PD signal is a damped oscillation wave, to extract the PD signal from the IMF components more accurately, this paper makes improvements on the basis of the traditional 3σ criterion and conducts statistical processing on each IMF component based on the improved 3σ criterion. The specific process is as follows:
(1)
Estimate the absolute value of each sequence of IMF component hi(t) to obtain the absolute value sequence f(t). The standard deviation of f(t) is obtained as σ, and the threshold th = 3σ.
(2)
According to the threshold, identify the “gross error” outside the threshold range in the hi(t) component.
(3)
A new sequence f′(t) is obtained by removing the “gross error” from the f(t) sequence. The standard deviation of f′(t) is σ′, and th′= 3σ′.
(4)
Assess whether a “gross error” exists in hi(t). If so, go back to Step (3). If not, end the statistical processing.
Signal reconstruction was conducted for each IMF component after statistical processing. The comparison between the obtained waveform and the original PD signal is shown in Figure 13. As shown in the figure, the PD signal was restored and the white noise interference suppression effect is good.
Based on these results, it can be concluded that SVD has obvious advantages in periodic narrowband interference suppression of the PD signal compared with EMD, and the EMD method based on the improved 3σ criterion can make up for the deficiency of SVD in the suppression of white noise interference of the PD signal. In summary, this paper proposes a new PD signal interference suppression method that combines SVD and EMD based on the improved 3σ criterion. The specific steps are as follows:
(1)
The PD signal with periodic narrowband interference and white noise interference is decomposed by SVD.
(2)
According to the singular value distribution characteristics of the periodic narrowband interference signals, the singular value corresponding to periodic narrowband interference is determined and set to zero. Signal reconstruction is completed by an inverse SVD operation, and periodic narrowband interference suppression is realized.
(3)
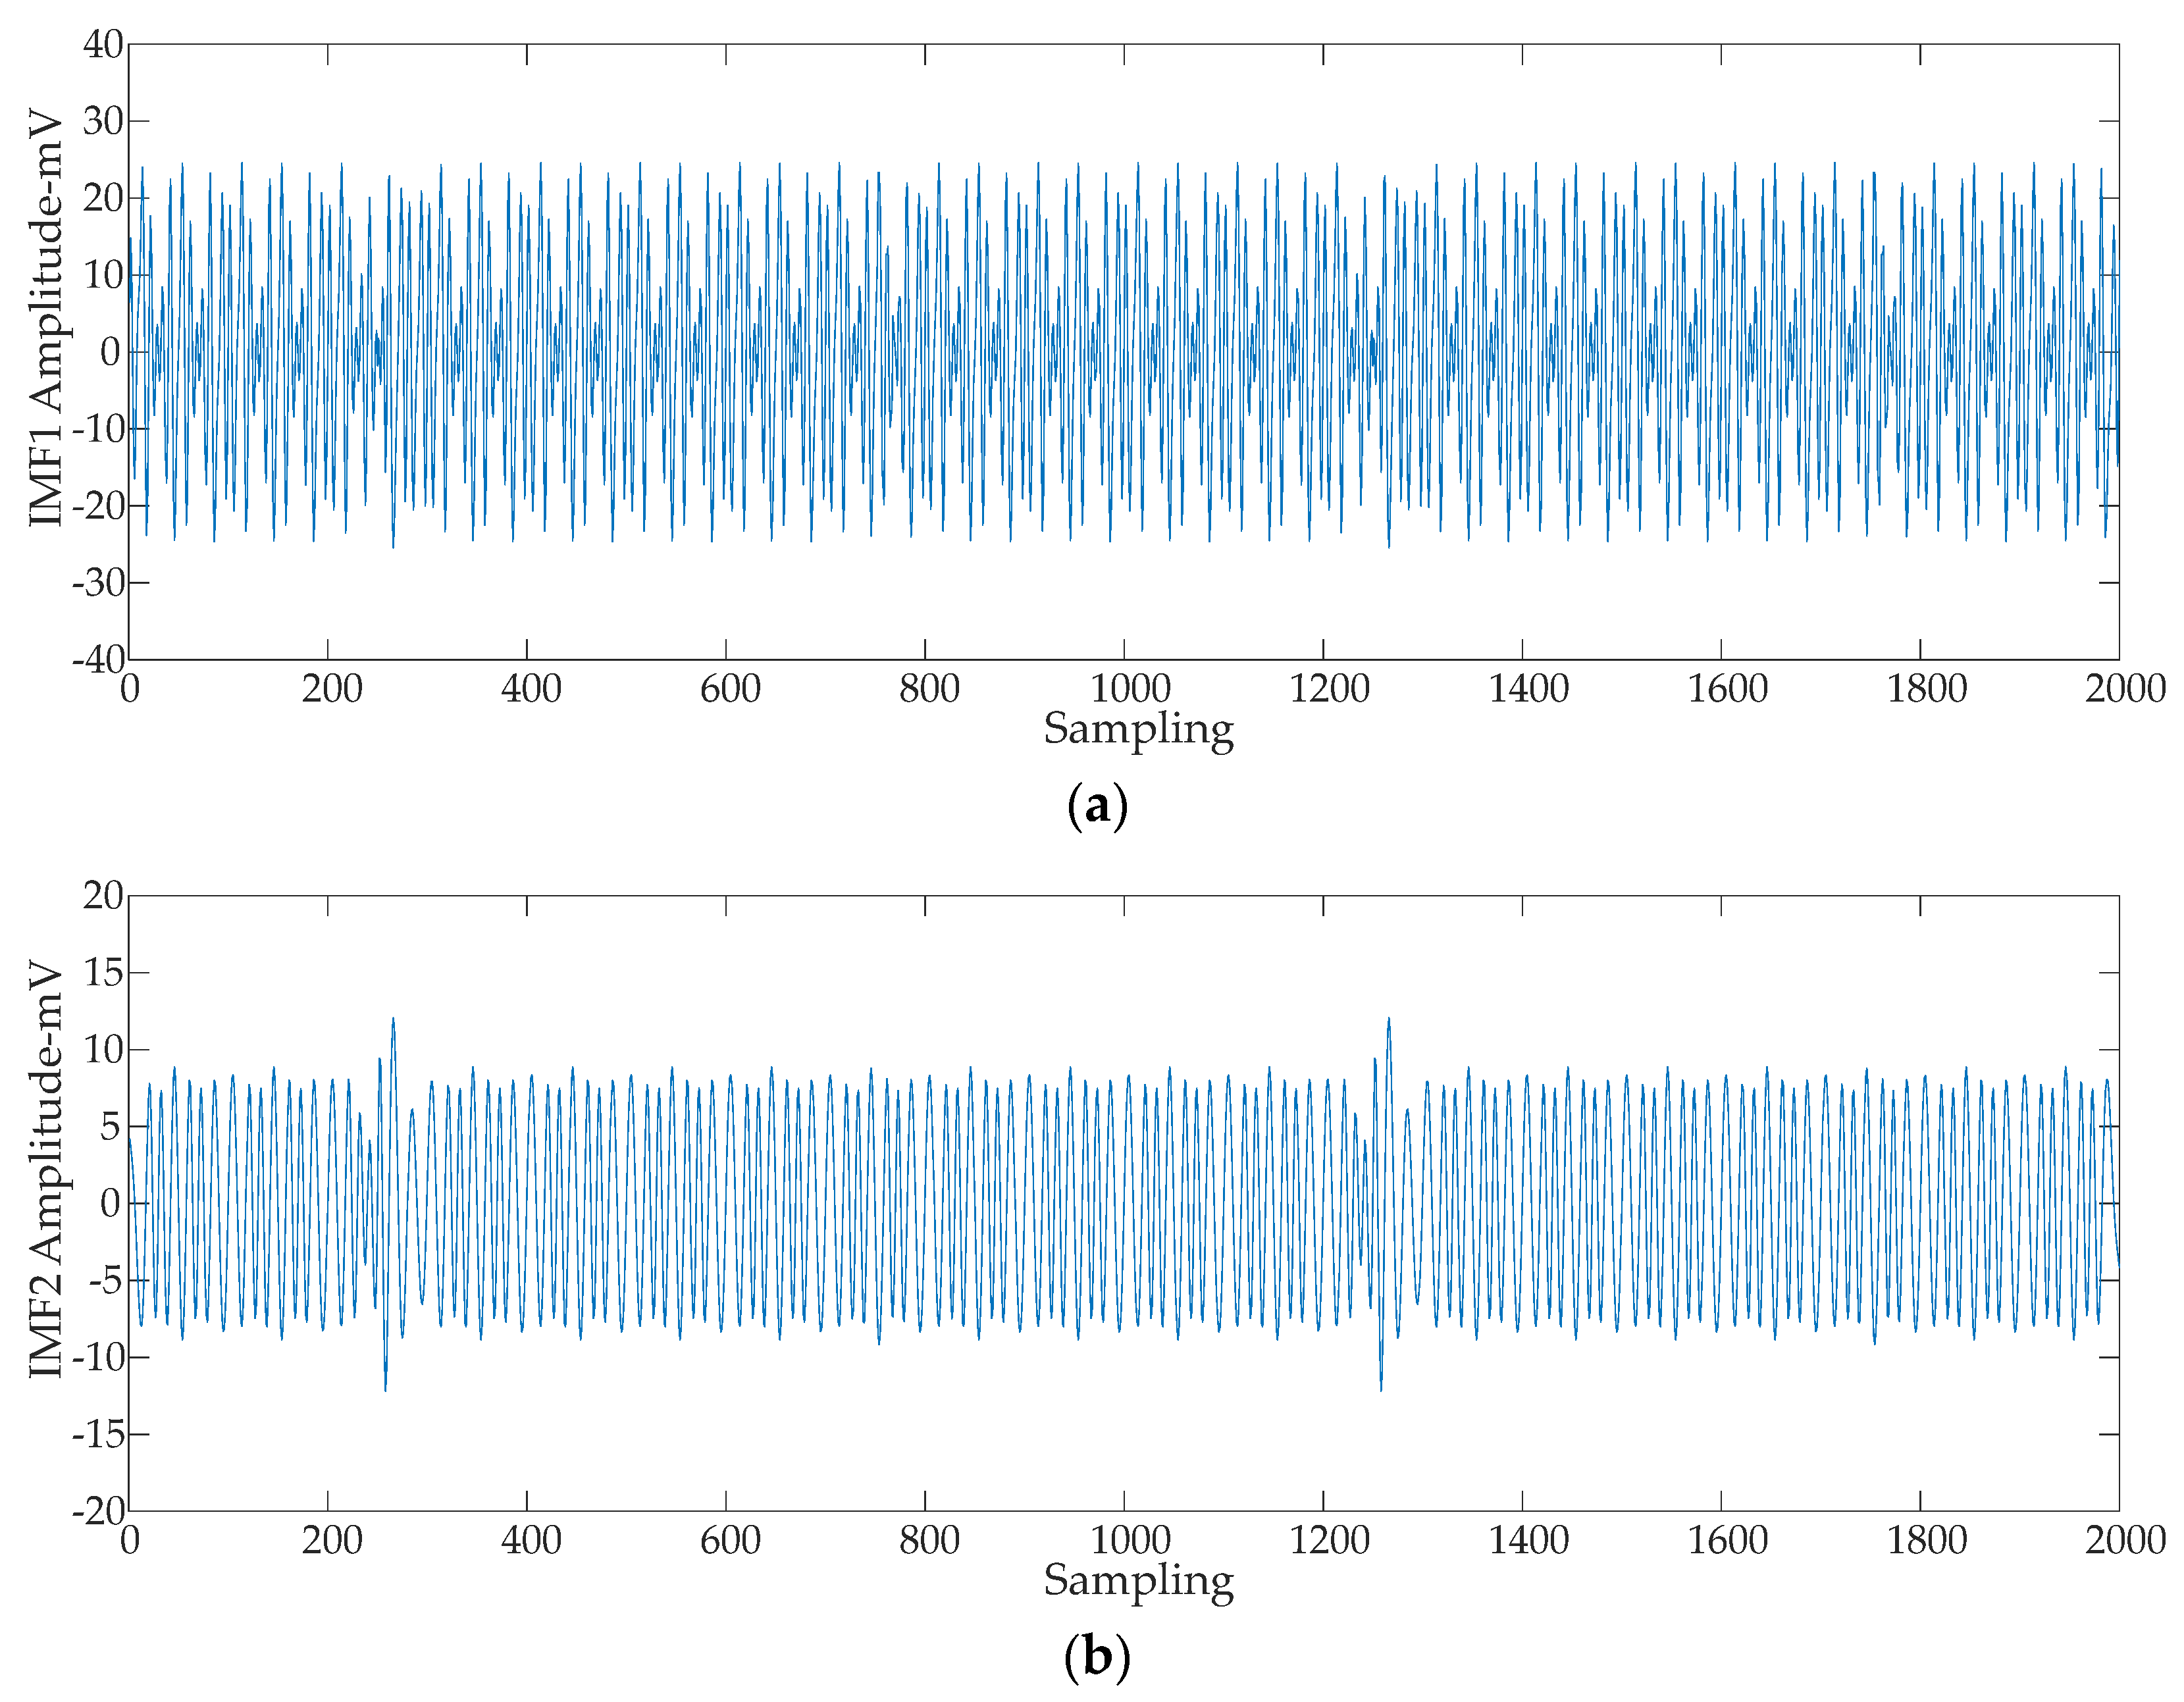
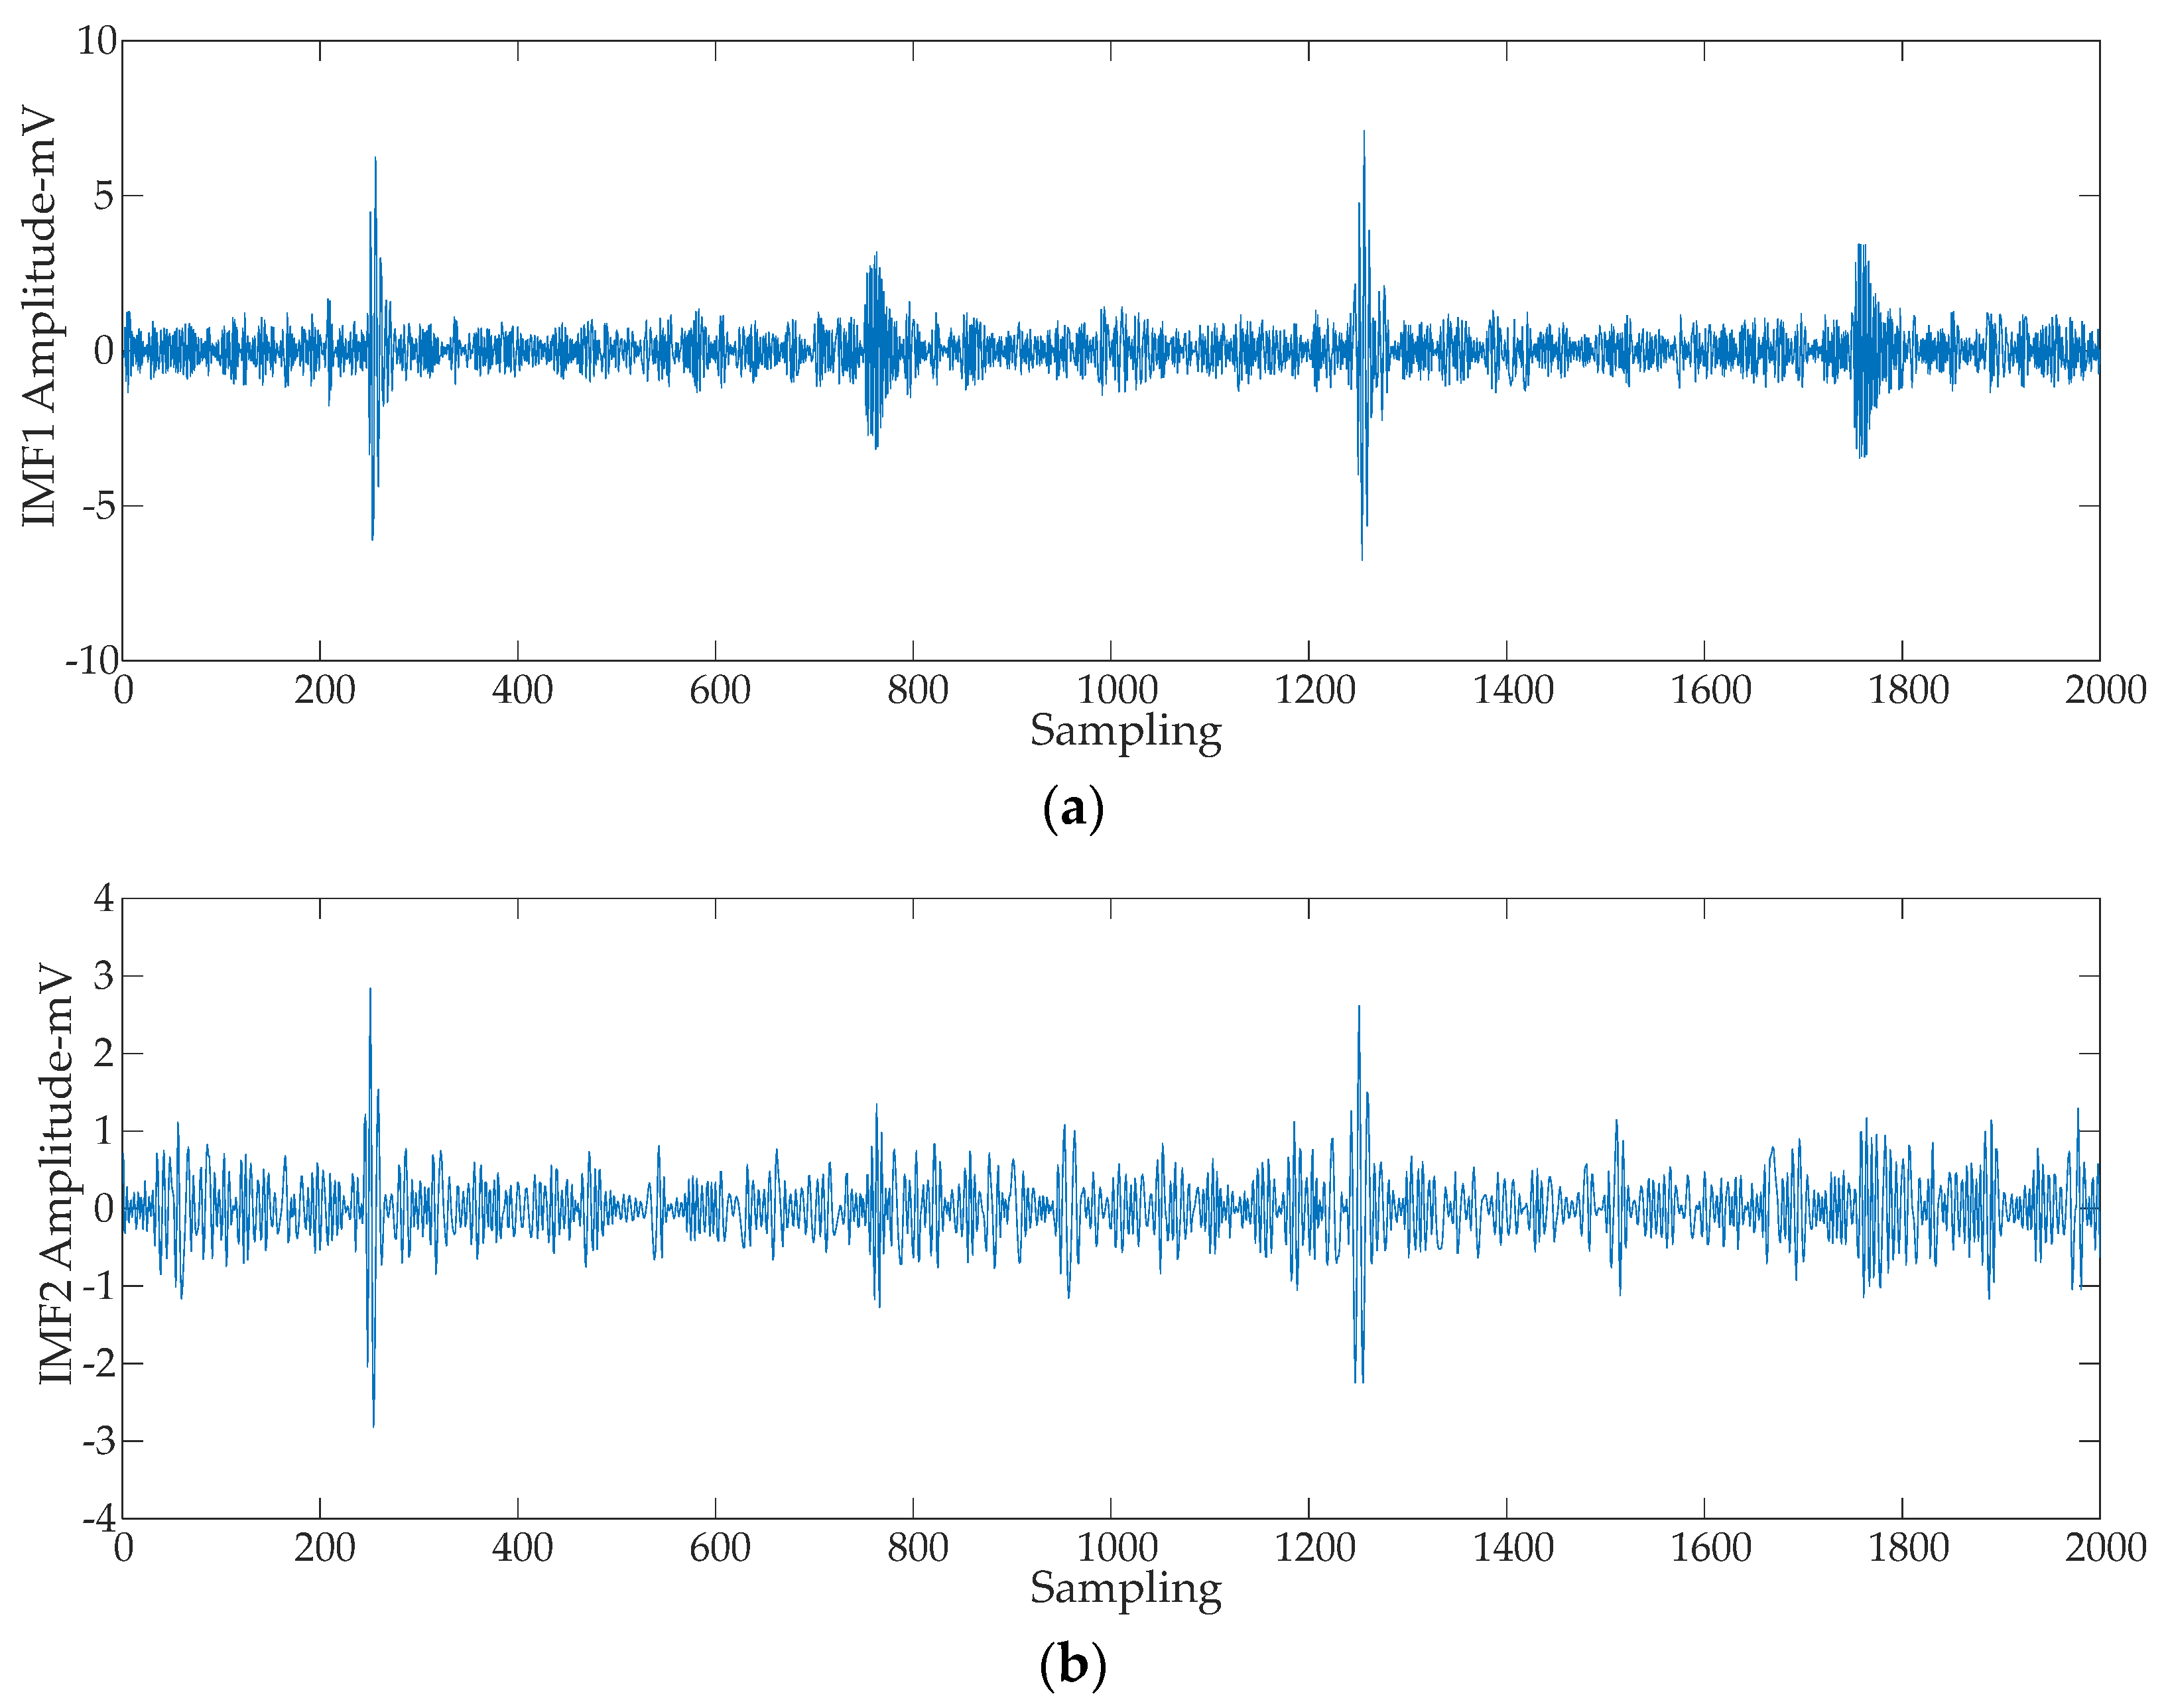
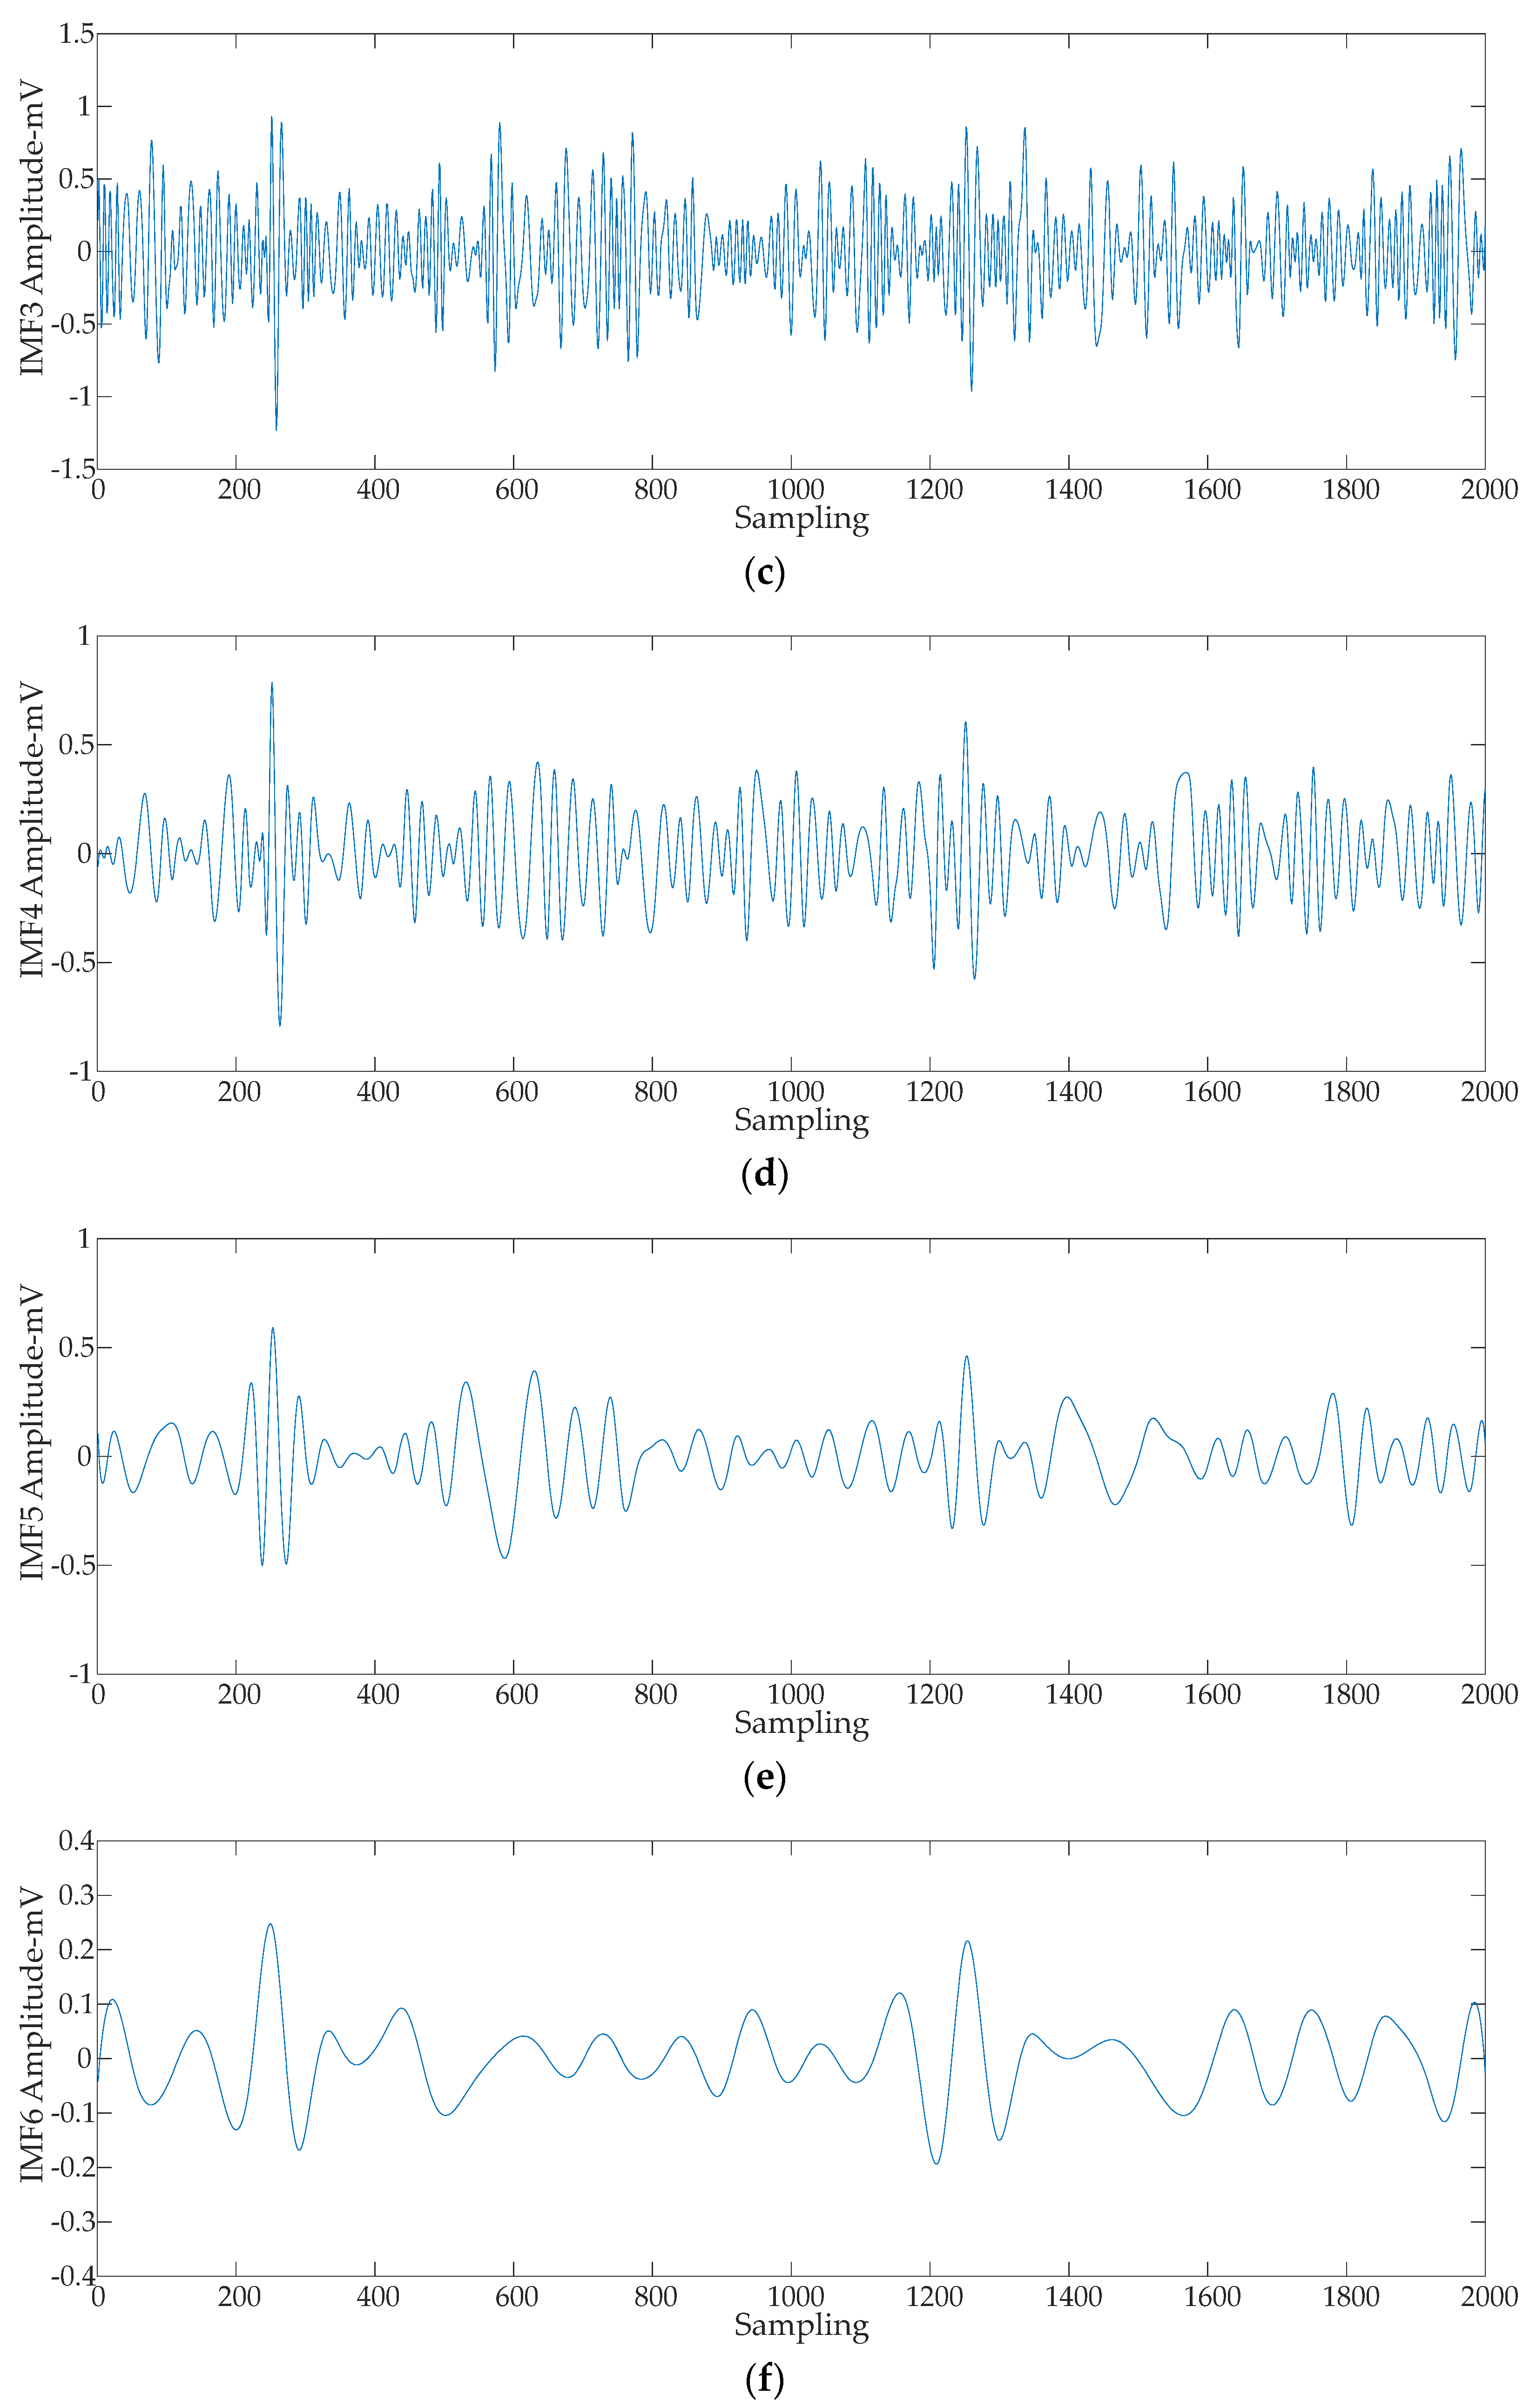
The IMF component is obtained by EMD of the signal after SVD interference suppression.
(4)
Based on the improved 3σ criterion, the IMF components are statistically processed.
(5)
The IMF component after processing is reconstructed to achieve the suppression of white noise interference to obtain the PD signal.

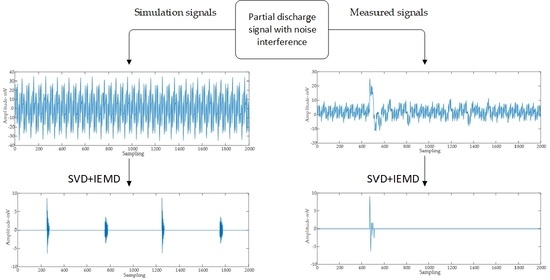
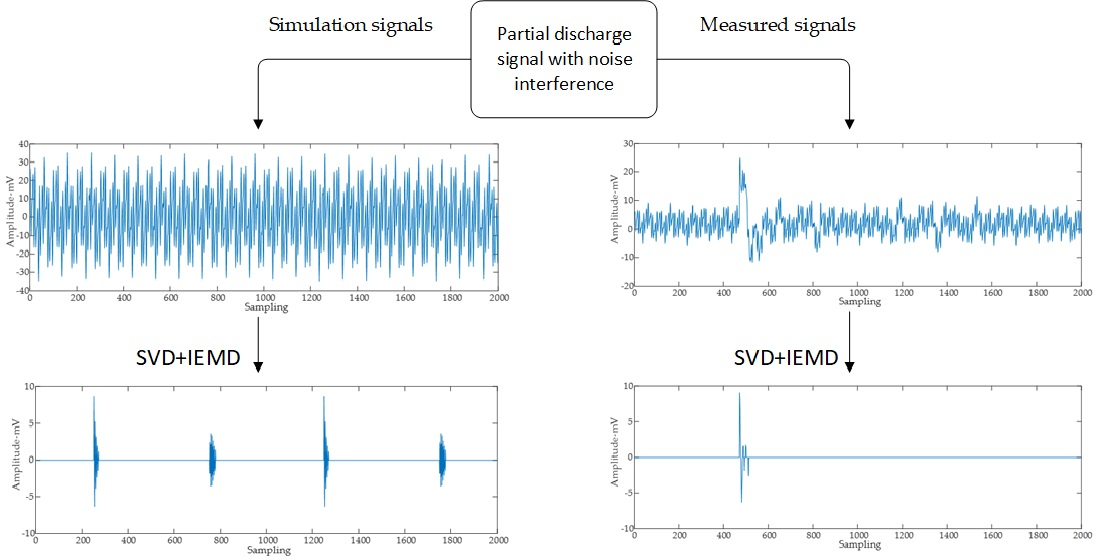
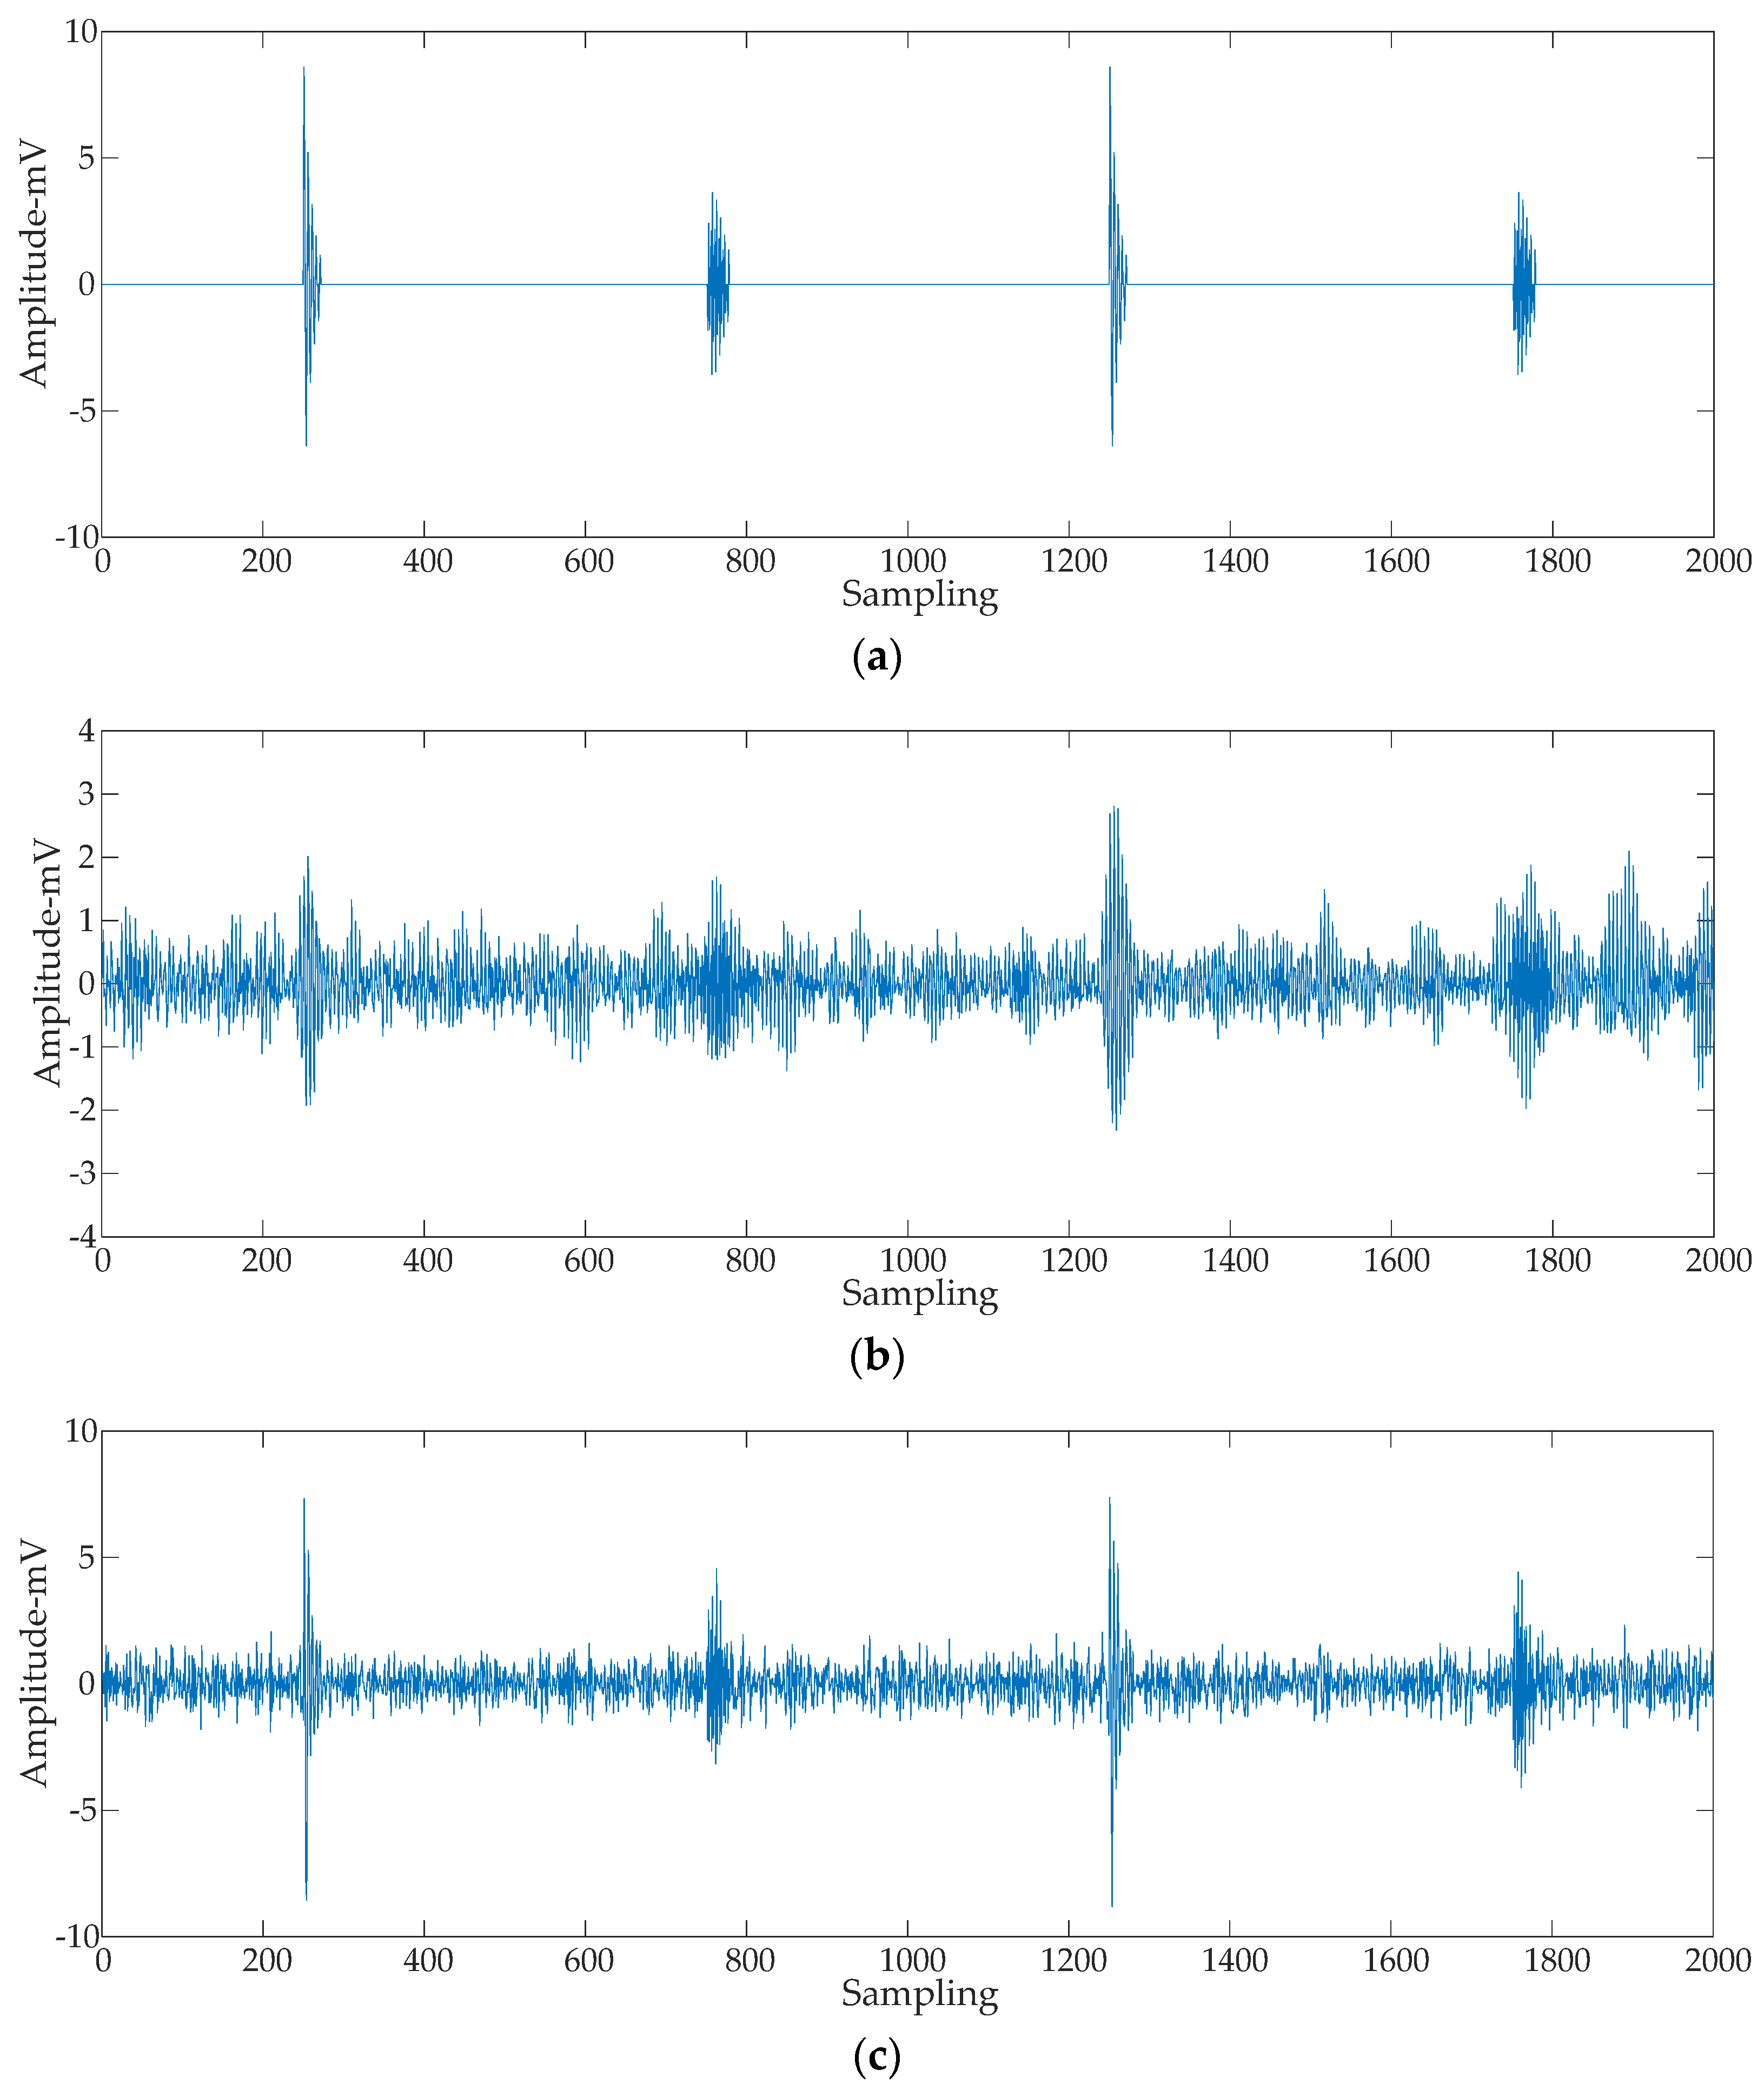
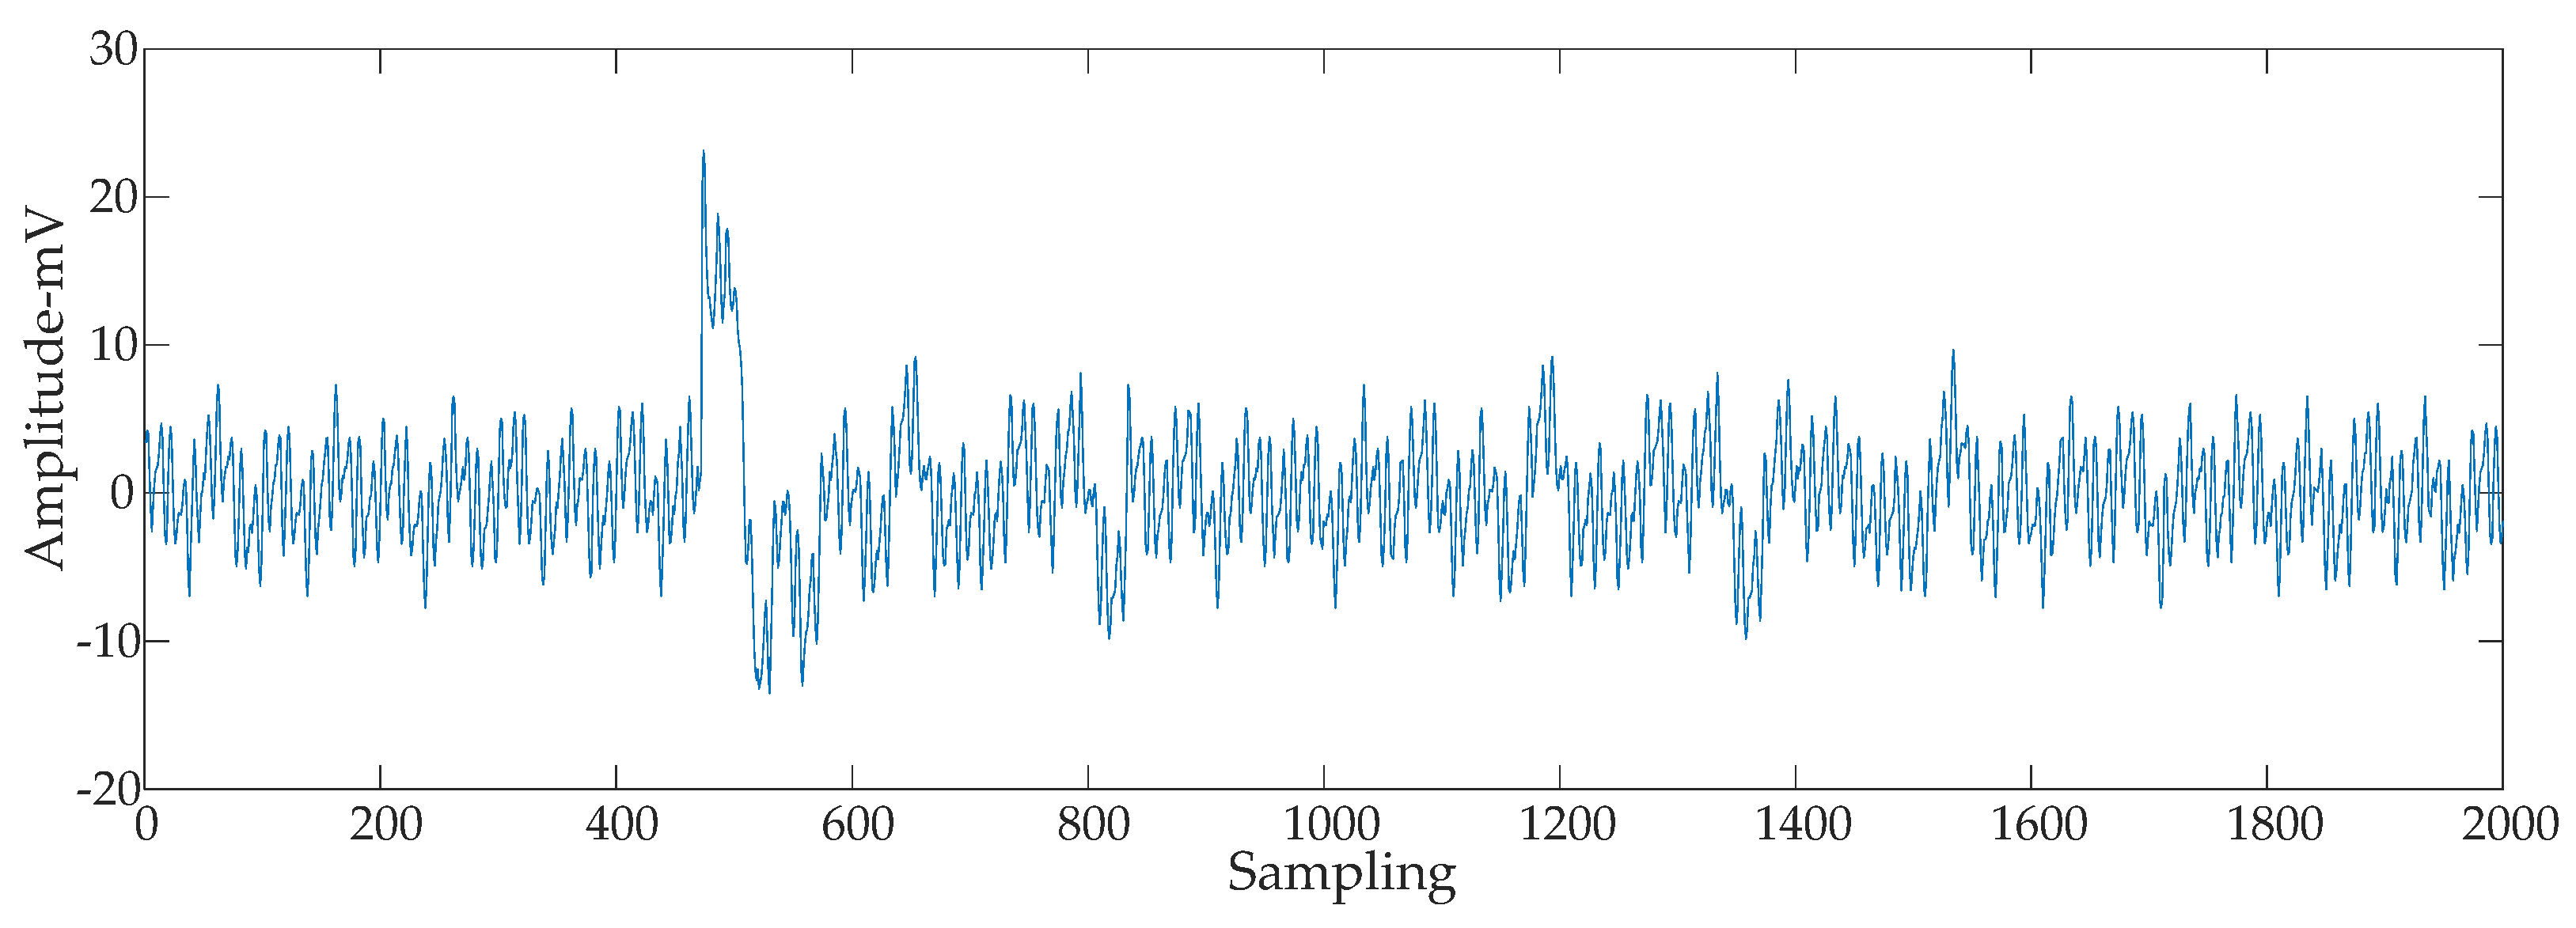
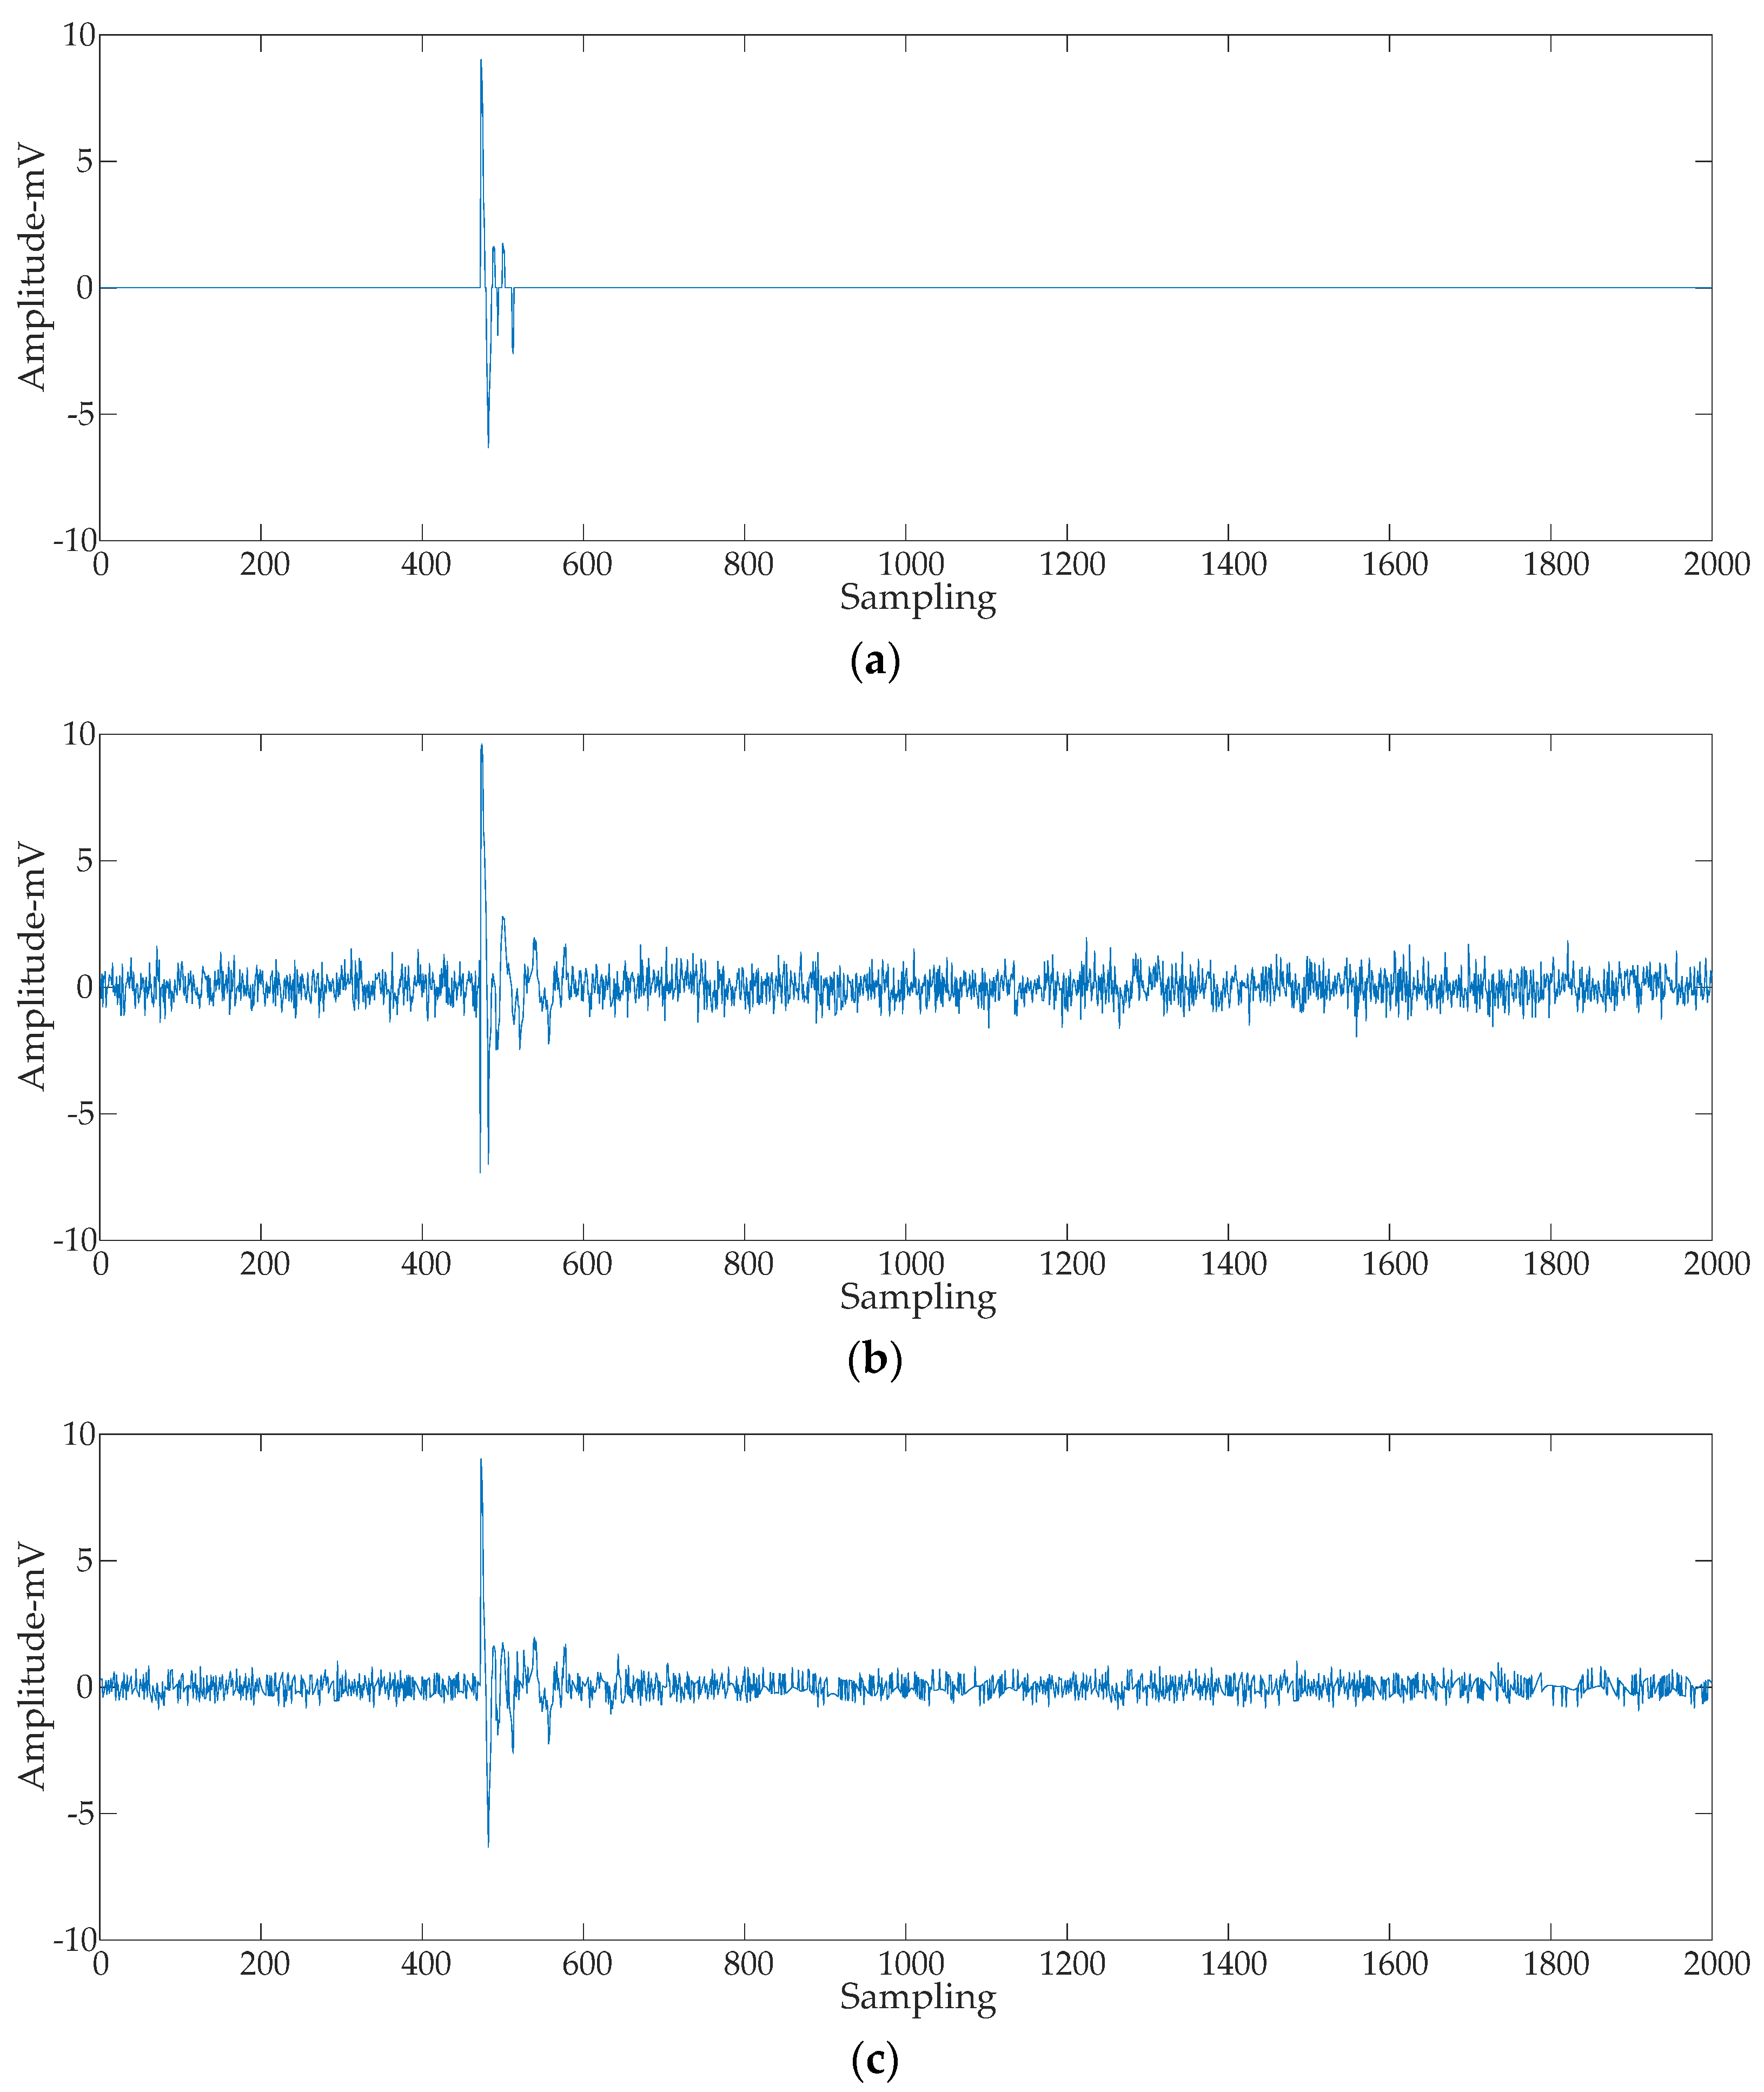
5.2. Comparison of Interference Suppression Effects

The PD signals with periodic narrowband and white noise interference in Section 2.2 were suppressed according to the method described in this paper. As a comparison, the above PD signals were processed by the SVD and the SVD + EMD methods. The results are shown in Figure 14. Compared with Figure 14, it can be observed that the SVD method leads to an obvious inefficient suppression of white noise interference, and the PD signal cannot be effectively extracted. The residual noise of the waveform is larger after the elimination of the interference by the EMD. The proposed method can effectively suppress periodic narrowband and white noise interference.
The SNR, NCC, and MSE interference suppression results of the three methods were obtained and are listed in Table 3. It can be shown that the method proposed in this paper has a better effect on the suppression of periodic narrowband and white noise interference and can restore the PD pulse waveform more effectively.

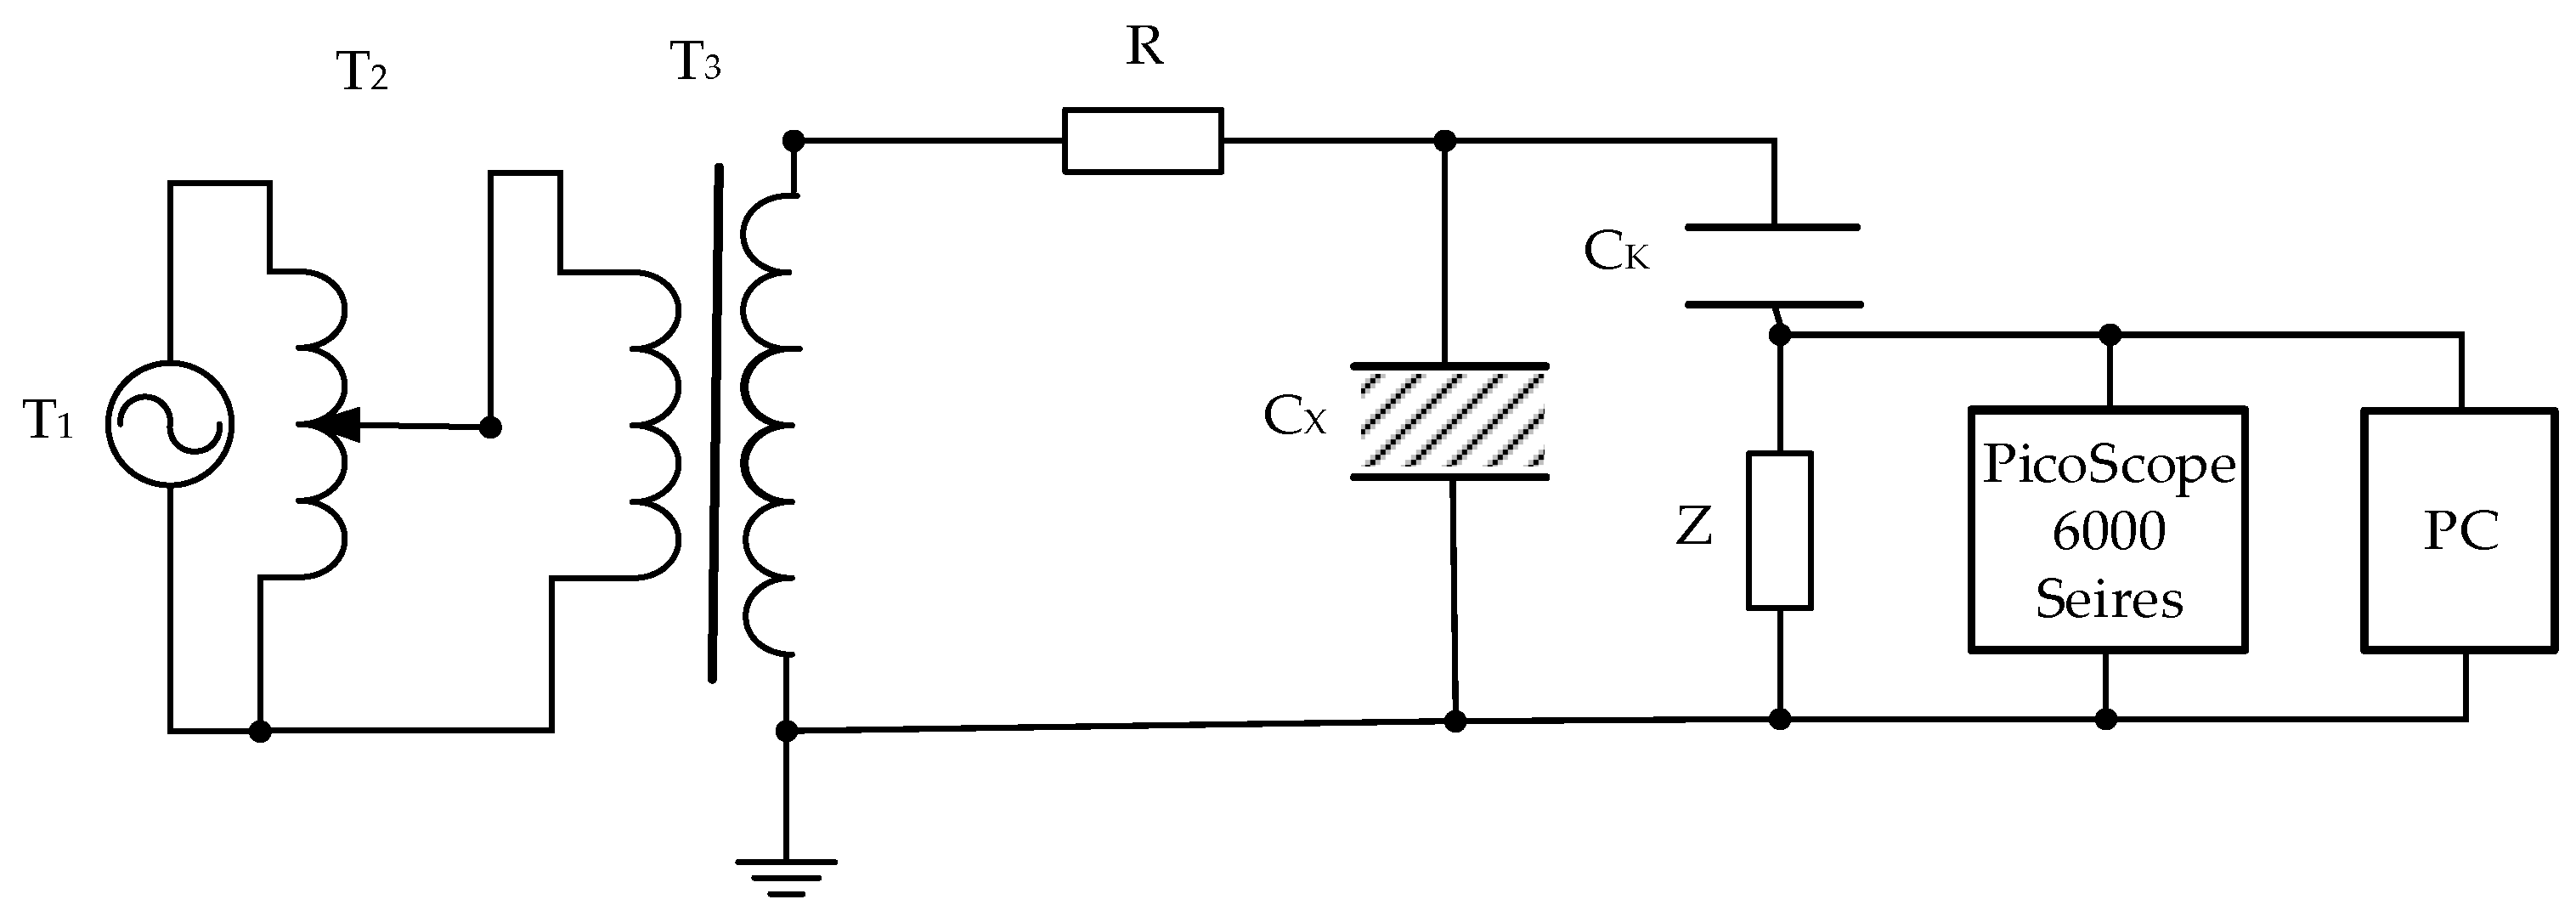
6. Actual Measurement of PD Interference Suppression

To verify the effectiveness of the proposed interference suppression method for the measured PD signal, a PD detection experiment with 10 kV XLPE electric cables was conducted in the laboratory. The data acquisition card model used is PicoScope 6000 Series (the maximum sampling rate was 5 GS/s), the experimental circuit diagram is shown in Figure 15: T1 is a voltage source, T2 is a voltage regulator, T3 is a transformer, R is protective resistance, CX is the test object, CK is coupling capacitance, and Z is detection impedance (GSJFY-3000, the bandwidth is 350 MHz). The measured PD signal is shown in Figure 16, where the sampling frequency is 100 M Samples/s and the sampling time is 20 μs. The measurement results may contain direct current (DC) components. It is necessary to calculate the mean value of the signal sequence to determine whether there are DC components. The average value of the signal sequence, m = 1.86, was obtained, and this average value was removed, i.e., x2(i) = x(i) − m; the resulting signal with the DC component eliminated is shown in Figure 17.
The proposed method and the SVD and EMD methods are used for interference suppression processing of the measured signals, and the interference suppression results are shown in Figure 18.
The noise suppression ratio is used to evaluate the interference suppression results, and is calculated as follows:
ρ = 10 ( lg σ 1 2 lg σ 2 2 )
In Equation (15), σ1 and σ2 are the standard deviations of signals before and after interference suppression, respectively. The noise suppression ratio ρ can reflect the degree of interference suppression. The larger the value is, the higher the noise reduction rate is. The noise suppression ratio of the three methods was calculated, and the results are shown in Table 4. The comparison shows that the proposed method is more effective in suppressing periodic narrowband and white noise interference.

7. Conclusions

In this paper, a PD interference suppression method based on SVD and IEMD was proposed. This method can suppress periodic narrowband and white noise interference in PD signals. The effectiveness of the proposed method was verified based on the simulation and analysis of the measured results. The following conclusions were obtained:
(1)
The singular value distribution characteristics of periodic narrowband interference are obvious. SVD can effectively suppress the periodic narrowband interference in PD signals, but it has poor suppression effects on white noise interference.
(2)
EMD is better than SVD in suppressing white noise interference, but SVD has obvious advantages in suppressing periodic narrowband interference.
(3)
Based on the improved 3σ criterion, statistical processing of the IMF derived from EMD can effectively solve the problem of mode mixing of EMD and can more effectively suppress the interference of white noise.
(4)
Compared with SVD and SVD + EMD interference suppression methods, the proposed method yields larger SNR values, waveform similarity coefficients closer to unity, smaller MSE values, and larger noise suppression ratios. For the simulated and measured signals, the PD pulse waveform can be restored more effectively.

Author Contributions

Conceptualization, L.L. and X.W.; methodology, L.L. and X.W.; software, L.L.; validation, L.L. and X.W.; formal analysis, L.L. and X.W.; data curation, L.L.; writing—original draft preparation, L.L.; writing—review and editing, L.L. and X.W.; visualization, L.L.; supervision, X.W.; project administration, X.W. All authors have read and agreed to the published version of the manuscript.

Funding

This research was funded by the National Key Research and Development Program of China, grant number 2017YFB0902705.

Institutional Review Board Statement

Not applicable.

Informed Consent Statement

Not applicable.

Data Availability Statement

Not applicable.

Conflicts of Interest

The authors declare no conflict of interest.

References

  1. Baug, A.; Choudhury, N.R.; Ghosh, R.; Dalai, S.; Chatterjee, B. Identification of single and multiple partial discharge sources by optical method using mathematical morphology aided sparse representation classifier. IEEE Trans. Dielectr. Electr. Insul. 2017, 24, 3703–3712. [Google Scholar] [CrossRef]
  2. Li, J.; Han, X.; Liu, Z.; Yao, X. A Novel GIS Partial Discharge Detection Sensor with Integrated Optical and UHF Methods. IEEE Trans. Power Deliv. 2018, 33, 2047–2049. [Google Scholar] [CrossRef]
  3. Santos, M.G.; Braulio, G.A.; Bernardes, J.V.; De Salles, C.; Milanez, J.R.C.; Bortoni, E.C.; Bastos, G.S. Continuous Partial Discharges Analysis During Automated Thermal Cycle Aging Experiment. IEEE Trans. Energy Convers. 2020, 35, 1989–1992. [Google Scholar] [CrossRef]
  4. Wu, Y.; Wang, G.; Bi, J.; Li, J.; Peng, X.; Liu, T. Interference Rejection of High Voltage Cables Partial Discharge Detection Based on Combina-tion Features Analysis. In Proceedings of the 2019 IEEE PES Asia-Pacific Power and Energy Engineering Conference (APPEEC), Macao, China, 1–4 December 2019; pp. 1–5. [Google Scholar]
  5. Abdel-Galil, T.K.; El-Hag, A.; Gaouda, A.M.; Salama, M.M.; Bartnikas, R. De-noising of partial discharge signal using eigen-decomposition technique. IEEE Trans. Dielectr. Electr. Insul. 2008, 15, 1657–1662. [Google Scholar] [CrossRef]
  6. Tang, J.; Dong, Y.; Fan, L.; Li, L. Feature information extraction of partial discharge signal with complex wavelet trans-form and singular value decomposition based on Hankel matrix. Proc. CSEE 2015, 35, 1808–1817. (In Chinese) [Google Scholar]
  7. Rajendran, A.; Meena, K.P.; Buijupati, N.R. Simulation of partial discharges and implementation of noise elimination techniques. In Proceedings of the 2017 3rd International Conference on Condition Assessment Techniques in Electrical Systems (CATCON), Rupnagar, India, 16–18 November 2017; pp. 412–417. [Google Scholar]
  8. Zhao, Y.; Liu, X. Extracting Partial Discharge Signals of Generator Based on Elevated Minimum Description Length Cri-terion and Fast Fourier Transform. In Proceedings of the 2009 International Conference on Measuring Technology and Mechatronics Automation, Zhangjiajie, China, 11–12 April 2009; pp. 222–225. [Google Scholar]
  9. Luo, X.; Niu, H.; Wu, J. A modified method of suppressing narrow-band interference using FFT power spectrum. In Proceedings of the 2013 IEEE International Conference on Solid Dielectrics (ICSD), Bologna, Italy, 30 June–4 July 2013; pp. 83–87. [Google Scholar]
  10. Shim, I.; Soraghan, J.; Siew, W.H. Detection of PD utilizing digital signal processing methods. Part 3: Open-loop noise reduction. IEEE Electr. Insul. Mag. 2001, 17, 6–13. [Google Scholar] [CrossRef]
  11. Shams, M.A.; Anis, H.I.; El-Shahat, M. Denoising of Heavily Contaminated Partial Discharge Signals in High-Voltage Cables Using Maximal Overlap Discrete Wavelet Transform. Energies 2021, 14, 6540. [Google Scholar] [CrossRef]
  12. Soltani, A.A.; El-Hag, A. Denoising of Radio Frequency Partial Discharge Signals Using Artificial Neural Network. Energies 2019, 12, 3485. [Google Scholar] [CrossRef] [Green Version]
  13. Zhu, J.; He, B.; Wang, X.; Cui, L.; Li, Y. Extraction of Partial Discharge Signal Feature Based on Dual-tree Complex Wave-let Transform and Singular-value Decomposition. In Proceedings of the 2018 Condition Monitoring and Diagnosis (CMD), Perth, WA, Australia, 23–26 September 2018; pp. 1–5. [Google Scholar]
  14. Ashtiani, M.B.; Shahrtash, S.M. Partial discharge de-noising employing improved singular value decomposition. In Proceedings of the 2012 Annual Report Conference on Electrical Insulation and Dielectric Phenomena, Montreal, QC, Canada, 14–17 October 2012; pp. 137–140. [Google Scholar]
  15. Ran, H.; Xu, Y.; Jiang, J.; Tang, K.; He, Z.; Zhang, T.; Tang, X. Application of Singular Value Reconstruction in Suppressing Narrowband Interference of Partial Discharge. In Proceedings of the 2019 4th International Conference on Power and Renewable Energy (ICPRE), Chengdu, China, 21–23 September 2019; pp. 239–243. [Google Scholar]
  16. Ashtiani, M.B.; Shahrtash, S.M. Partial discharge de-noising employing adaptive singular value decomposition. IEEE Trans. Dielectr. Electr. Insul. 2014, 21, 775–782. [Google Scholar] [CrossRef]
  17. Zhou, K.; Li, M.; Li, Y.; Xie, M.; Huang, Y. An Improved Denoising Method for Partial Discharge Signals Contaminated by White Noise Based on Adaptive Short-Time Singular Value Decomposition. Energies 2019, 12, 3465. [Google Scholar] [CrossRef] [Green Version]
  18. Wei, L.; Liu, Y.; Cheng, D.; Li, P.; Shi, Z.; Huang, N.; Ai, H.; Zhu, T. A Novel Partial Discharge Ultra-High Frequency Signal De-Noising Method Based on a Single-Channel Blind Source Separation Algorithm. Energies 2018, 11, 509. [Google Scholar] [CrossRef] [Green Version]
  19. Huang, N.E.; Shen, Z.; Long, S.R.; Wu, M.C.; Shih, H.H.; Zheng, Q.; Yen, N.-C.; Tung, C.C.; Liu, H.H. The empirical mode decomposition and the Hilbert spectrum for nonlinear and non-stationary time series analysis. Proc. Math. Phys. Eng. Sci. 1998, 454, 903–995. [Google Scholar] [CrossRef]
  20. Herold, C.; Wenig, S.; Leibfried, T. Advanced de-noising of power cable Partial Discharge signals by Empirical Mode De-composition. In Proceedings of the 2010 20th Australasian Universities Power Engineering Conference, Christchurch, New Zealand, 5–8 December 2010; pp. 1–5. [Google Scholar]
  21. Chan, J.C.; Ma, H.; Saha, T.K.; Ekanayake, C. Self-adaptive partial discharge signal de-noising based on ensemble empirical mode decomposition and automatic morphological thresholding. IEEE Trans. Dielectr. Electr. Insul. 2014, 21, 294–303. [Google Scholar] [CrossRef]
  22. Zhong, J.; Bi, X.; Shu, Q.; Chen, M.; Zhou, D.; Zhang, D. Partial Discharge Signal Denoising Based on Singular Value Decomposition and Empirical Wavelet Transform. IEEE Trans. Instrum. Meas. 2020, 69, 8866–8873. [Google Scholar] [CrossRef]
  23. Yan, Z. A New Adaptive Threshold Algorithm for Narrow-band Interference Suppression in Partial Discharge Based on Improved Empirical Mode Decomposition and MDL Criterion. In Proceedings of the 2010 International Conference on Intelligent Computation Technology and Automation, Changsha, China, 11–12 May 2010; Volume 1, pp. 203–206. [Google Scholar]
  24. Ren, W.; Song, J.; Tian, S.; Zhang, X. Estimation of the Equivalent Number of Looks in SAR Images Based on Singular Value Decomposition. IEEE Geosci. Remote Sens. Lett. 2015, 12, 2208–2212. [Google Scholar] [CrossRef]
  25. Beard, J.K. Singular Value Decomposition of a Matrix Representation of the Costas Condition for Costas Array Selection. IEEE Trans. Aerosp. Electron. Syst. 2021, 57, 1139–1161. [Google Scholar] [CrossRef]
  26. Govindarajan, S.; Subbaiah, J.; Cavallini, A.; Krithivasan, K.; Jayakumar, J. Partial Discharge Random Noise Removal Using Hankel Matrix-Based Fast Singular Value Decomposition. IEEE Trans. Instrum. Meas. 2019, 69, 4093–4102. [Google Scholar] [CrossRef]
  27. Li, Q.; Bu, B.; Zhao, J. A Novel Hierarchical Situation Awareness Model for CBTC Using SVD Entropy and GRU With PRD Algorithms. IEEE Access 2021, 9, 132290–132300. [Google Scholar] [CrossRef]
  28. Yang, X.; Huang, H.; Shu, Q.; Zhang, D.; Chen, B. Partial Discharge Signal Extraction Method Based on EDSSV and Low Rank RBF Neural Network. IEEE Access 2021, 9, 9744–9752. [Google Scholar] [CrossRef]
  29. Karaaslan, O.F.; Bilgin, G. Comparison of Variational Mode Decomposition and Empirical Mode Decomposition Features for Cell Segmentation in Histopathological Images. In Proceedings of the 2020 Medical Technologies Congress (TIPTEKNO), Antalya, Turkey, 19–20 November 2020; pp. 1–4. [Google Scholar]
  30. Gan, G.; Zhou, X.; Li, H. Predicting Trend of High Frequency CSI 300 Index: Based on Empirical Mode Decomposition and BP Neural Network. In Proceedings of the 2021 4th International Conference on Artificial Intelligence and Big Data (ICAIBD), Chengdu, China, 28–31 May 2021; pp. 315–319. [Google Scholar]
  31. Huang, S.; Zhang, Y.; Liu, Z. Image feature extraction and analysis based on Empirical mode decomposition. In Proceedings of the 2016 IEEE Advanced Information Management, Communicates, Electronic and Automation Control Conference (IMCEC), Xi’an, China, 3–5 October 2016; pp. 615–619. [Google Scholar]
  32. Ahmed, M.S.; Indira, B. Detection of exudates from RGB fundus images using 3σ control method. In Proceedings of the 2017 International Conference on Wireless Communications, Signal Processing and Networking (WiSPNET), Chennai, India, 22–24 March 2017; pp. 767–770. [Google Scholar]
  33. Yücetaş, M.; Pulkkine, M.; Gronicz, J.; Halonen, K. A temperature sensor with 3σ inaccuracy of +0.5/−0.75 °C and energy per conversion of 0.65 μJ using a 0.18 μm CMOS technology. In Proceedings of the 2013 NORCHIP, Vilnius, Lithuania, 11–12 November 2013; pp. 1–4. [Google Scholar]
  34. Wu, Z.; Huang, N.E. A study of the characteristics of white noise using the empirical mode decomposition method. Proc. R. Soc. A 2004, 460, 1597–1611. [Google Scholar] [CrossRef]
Figure 1. Partial discharge (PD) simulation signals.
Energies 14 08579 g001
Figure 2. Noising PD simulation signals. (a) PD signal superimposed with the periodic narrowband interference signals. (b) PD signal superposition with white noise interference signal. (c) PD signal superposition with white noise and the periodic narrowband interference signals.
Energies 14 08579 g002
Figure 3. Singular value distribution of PD signal superimposed with the periodic narrowband interference signals. (a) Singular value distribution. (b) First 100 singular value distributions.
Energies 14 08579 g003
Figure 4. Suppression of periodic narrowband interference based on singular value decomposition (SVD).
Energies 14 08579 g004
Figure 5. Singular value distribution of PD superimposed with a white noise signal.
Energies 14 08579 g005
Figure 6. Distributions of evaluation indices.
Energies 14 08579 g006
Figure 7. Singular value distribution of PD signal superimposed with white noise and periodic narrowband interference signals.
Energies 14 08579 g007
Figure 8. Removal of periodic narrowband interference by PD signal superimposed with white noise. (a) Periodic narrowband interference suppression. (b) White noise interference suppression.
Energies 14 08579 g008
Figure 9. Mean continuation diagram.
Energies 14 08579 g009
Figure 10. Empirical mode decomposition (EMD) PD superimposed narrowband interference signal. (a) IMF1-component. (b) IMF2-component. (c) IMF3-component. (d) IMF4-component. (e) IMF5-component. (f) IMF6-component. (g) IMF7-component.
Energies 14 08579 g010aEnergies 14 08579 g010bEnergies 14 08579 g010c
Figure 11. EMD for PD superimposed white noise interference signal. (a) IMF1-component. (b) IMF2-component. (c) IMF3-component. (d) IMF4-component. (e) IMF5-component. (f) IMF6-component. (g) IMF7-component.
Energies 14 08579 g011aEnergies 14 08579 g011bEnergies 14 08579 g011c
Figure 12. White noise interference suppression achieved by the EMD method.
Energies 14 08579 g012
Figure 13. White noise interference suppression achieved by the IEMD method.
Energies 14 08579 g013
Figure 14. Results of interference suppression methods. (a) Interference suppression results of the proposed method. (b) Interference suppression results of SVD. (c) Interference suppression results of SVD + EMD.
Energies 14 08579 g014
Figure 15. Experimental circuit diagram.
Energies 14 08579 g015
Figure 16. Partial discharge measured in the laboratory.
Energies 14 08579 g016
Figure 17. Laboratory measurement signal with DC component removed.
Energies 14 08579 g017
Figure 18. Denoising results of partial discharge signal measured in the laboratory. (a) Denoising results of the proposed method. (b) Denoising results of SVD. (c) Denoising results of SVD + EMD.
Energies 14 08579 g018
Table 1. PD Simulation signal parameters.
Partial Discharge (PD) PulseABCD
Signal amplitude (A/mV)10201020
Oscillation frequency (fc/MHz)20402040
Attenuation coefficient (τ/μs)0.10.150.10.15
Table 2. Parameters of narrowband Interference simulation signals.
Narrowband InterferenceC1C2C3
signal amplitude (Ai/mV)101510
Frequency (fi/MHz)21015
Table 3. Denoising evaluation of simulation signal results.
Noise Reduction MethodSignal-to-Noise Ratio (SNR)Normalized Correlation Coefficient (NCC)Mean-Squared Error (MSE)
Method used in this paper14.8698.35%0.01
SVD0.5265.05%0.33
SVD + EMD0.7065.89%0.29
Table 4. Evaluation of denoising results of PD signals measured in the laboratory.
Noise Reduction MethodMethod Used in This PaperSVDSVD + EMD
ρ14.1711.0912.11
Publisher’s Note: MDPI stays neutral with regard to jurisdictional claims in published maps and institutional affiliations.

