
Colombia’s GHG Emissions Reduction Scenario: Complete Representation of the Energy and Non-Energy Sectors in LEAP


Abstract
:1. Introduction
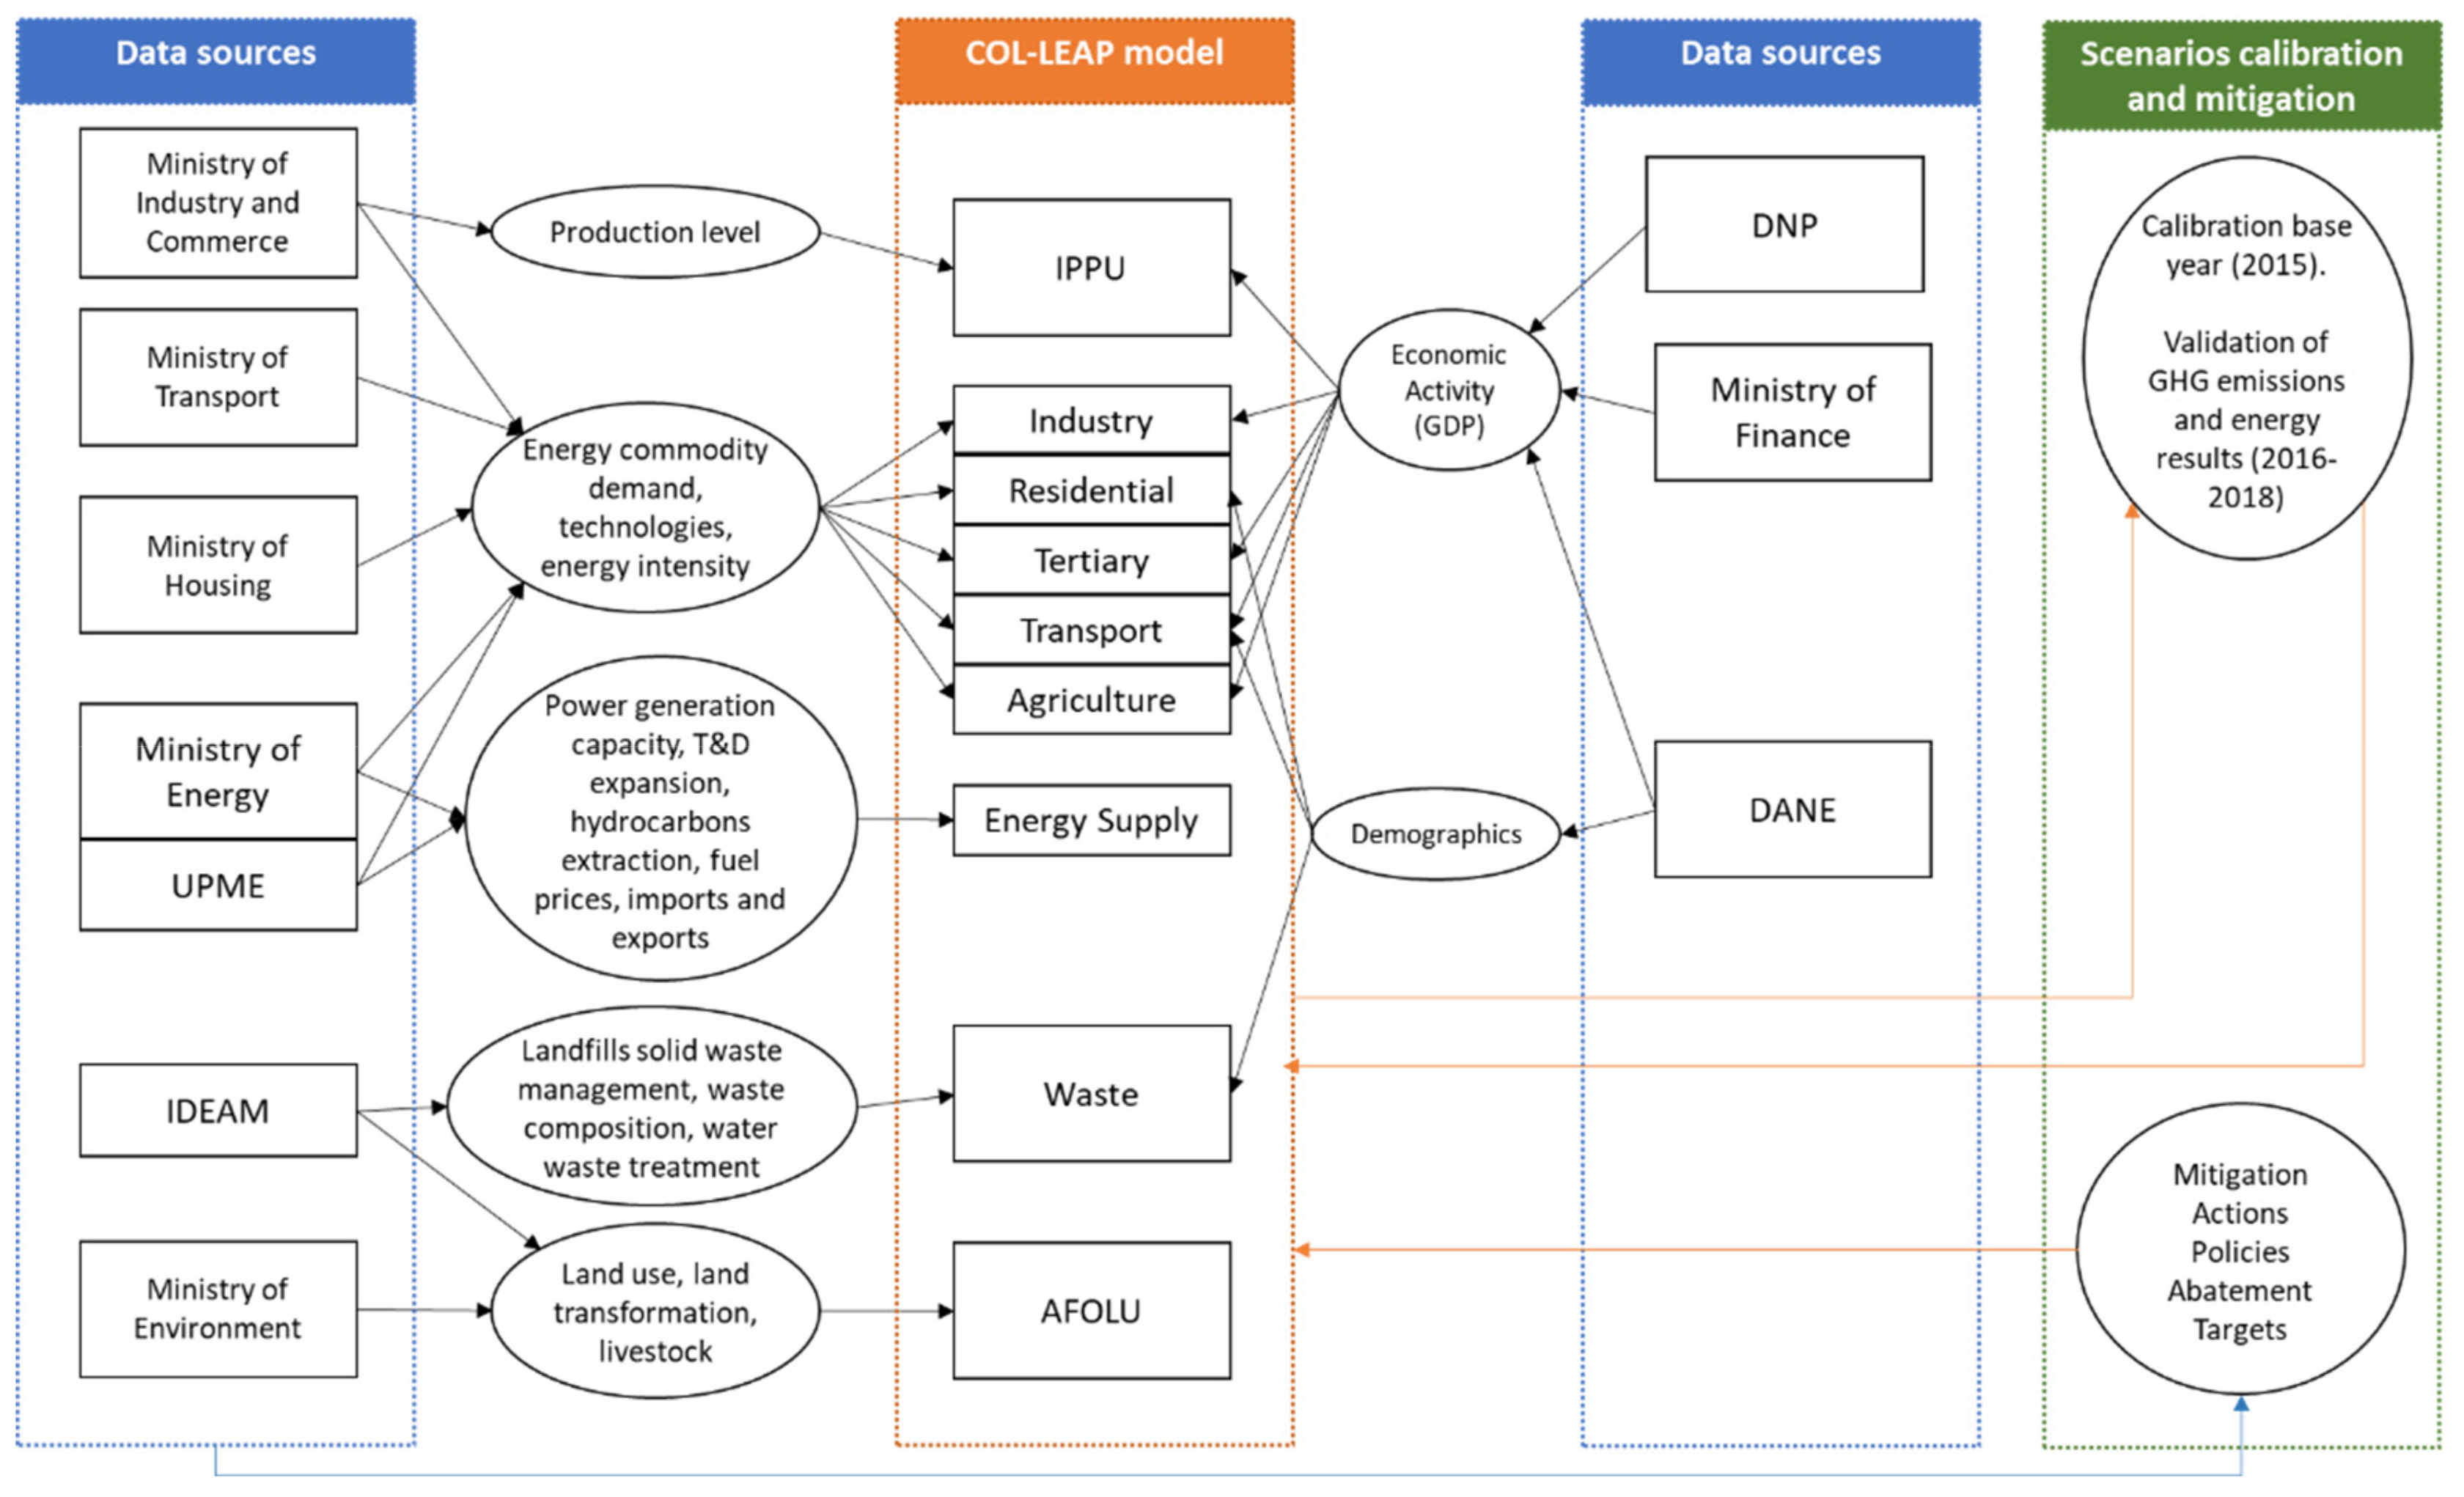
2. Methodology and Data
2.1. Data Gathering
2.2. LEAP Tool
2.3. Structure of Colombian NDC LEAP Model
2.3.1. Energy Demand Sectors
Industry
Transport
Tertiary, Residential, and Agriculture
2.3.2. Supply and Transformation Sectors
The Power Sector
Fossil Fuel Extraction
Other Fuels
Fugitive
2.3.3. IPPU
2.3.4. AFOLU
2.3.5. Waste
3. Scenarios
3.1. Reference Scenario
3.2. Mitigation Scenario
4. Results
4.1. Reference Scenario
4.2. Mitigation Scenario
5. Conclusions
Author Contributions
Funding
Institutional Review Board Statement
Informed Consent Statement
Conflicts of Interest
Appendix A. Complementary Tables

| 2010 | 2011 | 2012 | 2013 | 2014 | 2015 | Average | ||
|---|---|---|---|---|---|---|---|---|
| Refined Oil | [PJ] | 666 | 680 | 678 | 631 | 548 | 542 | 624 |
| Energy consumption | [PJ] | 51 | 56 | 56 | 55 | 47 | 53 | 53 |
| Energy Intensity | [PJ/PJ] | 0.077 | 0.083 | 0.082 | 0.087 | 0.085 | 0.098 | 0.085 |
| Share | ||||||||
| Diesel | [%] | 0.02 | 0.04 | 0.06 | 0.01 | 0.02 | 0.02 | 0.03 |
| Fuel Oil | [%] | 5.55 | 5.65 | 0.56 | 0.45 | 0.03 | 0.05 | 2.08 |
| Refinery Gas | [%] | 29.87 | 28.57 | 28.52 | 22.11 | 13.72 | 12.75 | 22.83 |
| LPG | [%] | 2.93 | 2.44 | 3.80 | 5.45 | 7.41 | 16.20 | 6.31 |
| Natural Gas | [%] | 61.61 | 63.29 | 67.05 | 71.98 | 78.82 | 70.97 | 68.74 |
| Gasoline | [%] | 0.00 | 0.00 | 0.00 | 0.00 | 0.00 | 0.01 | 0.00 |
| Kerosene | [%] | 0.00 | 0.00 | 0.00 | 0.00 | 0.00 | 0.00 | 0.00 |
| Region | Mining | Post-Mining | ||
|---|---|---|---|---|
| CO2 | CH4 | CO2 | CH4 | |
| Cundinamarca | 0.077 | 13.03 | 0.018 | 3.909 |
| Boyacá | 0.077 | 7.17 | 0.018 | 2.151 |
| N Santander | 0.077 | 7.17 | 0.018 | 2.151 |
| Antioquia | 0.077 | 2.93 | 0.018 | 0.879 |
| V Cauca | 0.077 | 2.93 | 0.018 | 0.879 |
| Cauca | 0.077 | 2.93 | 0.018 | 0.879 |
| Casanare | 0.077 | 1.95 | 0.018 | 0.585 |
| Average Underground | 0.077 | 8.926 | 0.018 | 2.678 |
| Cesar | - | 0.89 | - | 0.267 |
| La Guajira | - | 0.89 | - | 0.267 |
| Santander | - | 0.4 | - | 0.12 |
| Córdoba | - | 0.59 | - | 0.177 |
| Average surface | - | 0.888 | - | 0.266 |
| Scope | Mitigation Measure | Explanation | Target 2030 | Assumptions | Implementation in LEAP |
|---|---|---|---|---|---|
| Residential sector | NAMA Refrigerators | Change the coolant used in national production and imports of refrigerators, which would reduce the electricity demand of the refrigerators stock. | More efficient refrigerators: 60% of national stock | Replacement will be the result of the natural replacement of obsolete stock. | Change of the share of technology in the residential sector |
| Residential and tertiary | Efficient new buildings | Improve the efficiency of new buildings by better materials use and novel design techniques. | 20% reduction of energy intensity [MJ/m2] foal all new buildings | The area will grow by 23 million m3. Savings are only in terms of electricity demand. | Reduction of energy intensity in proportion to the expected area of new buildings and efficiency targets and penetration of more efficient technologies. |
| Tertiary sector | Thermal districts | Avoid the installation of air conditioning systems by the thermal district in public and commercial buildings. | 90 Million refrigeration tonnes | Without thermal districts, conventional AC would be used. | Switch demand from the AC category to thermal districts module by reducing energy intensity [MJ/COP] |
| Agriculture and fishing | Agriculture efficiency (panela and coffee NAMA) | Change of diesel engines for electric engines, and increase the use of biomass for thermal processes in a more efficient manner. | Replace 50% of fossil fuels with biomass in coffee and panela crops, and improve the efficiency of the thermal process by 2% | The measure could be equally implemented in all farms/production sites. | Modification of energy intensity factor in proportion to the share of coffee and panela energy demand in the agriculture-fishing sector. |
| Transport, industry, and supply | Carbon tax | Impose a tax on fossil fuels in certain sectors such as transport, refineries, and industry. Demand will respond to price increase according to specific elasticities defined for each sector. | US$7/tCO2 | Lineal and general demand elasticity to fuel price increase | Modification of energy intensity in relation to sector-specific elasticity and CO2 content of energy vector. |
| All demand sectors | Demand management | Promote demand response through the introduction of aggregators and incentives. | Reduce by 20% the difference between the peak and valley of the annual electricity demand load curve. | Demand management will be possible with aggregators, smart meters, and incentives to the industry. | Change of the system load curve |
| Industry | Sustainable cement | Increase the use of biomass and solid waste in the kiln. | 15% of kiln energy needs cover with biomass and waste | It is possible to replace coal with biomass and waste without modifying the kiln | Change of fuel mix |
| Brick Development | Replacement of coal and liquid fossil fuels with natural gas and biomass. | Fuel mix: 60% natural gas and 40% charcoal and firewood in thermal processes | Current technology can operate with future fuel mix | Change of fuel mix | |
| Industry Efficiency | Promote energy efficiency programs aiming to improve production practices, and to a lesser extend equipment. | Technologies with better efficiency will reach 30% indirect heat and other end-uses. | It is possible to replace 30% of the technologies (e.g.,: engines, boilers, compressors). Replacement also reflects changes in production behavior. | Share of the best technology in Colombia/international | |
| Fuel replacement industry | Replacement of coal and liquid fossil fuels with natural gas (when suitable) | Replace 20% of liquid fossil fuels with natural gas | There is a different potential by sector | Change of fuel mix | |
| Electricity supply | Thermal generator efficiency | Preventive and corrective maintenance to augment the efficiency of coal and natural gas power plants. | Increase by 2% the energy efficiency of coal and natural gas power plants | The measure will apply to all coal and natural gas power plants. Maintenance will correct efficiency degradation due to normal operation. | Increase the efficiency of the technology (coal or natural gas) to the desired level. |
| Diversification Capacity Generation | Increase the penetration of wind and solar in the generation mix. Additionally, include biogas and geothermal in the generation mix. | Capacity defined in PEN 2015 | The power capacity proposed in the Colombian energy plan will match the future electricity demand | Change the exogenous capacity according to the Colombian energy plan (PEN) | |
| Coal extraction | Mining energy efficiency | Improve the efficiency of the mining activities without changes in technologies nor fuel mix. | Reduce energy intensity of electricity and diesel by 1%. | Changes in production techniques/processes reach energy reductions without technology changes | Change of auxiliary fuel intensity |
| Oil refining | Energy Efficiency Refineries | Improve the efficiency of refining activities without changes in technologies nor fuel mix. | Reduce by 16% energy intensity of refineries (feedstock not included) | Changes in production techniques/processes reach energy reductions without technology changes | Change of auxiliary fuel intensity |
| Transport | NAMA_TOD | Nationally Appropriate Mitigation Action—Transport Oriented Development (TOD). | The goal is to implement four TOD projects in four cities. The goal is to reduce motorized activity in 2030 with respect to BAU: Passenger light: 0.7%; Taxis: 0.6%; Buses: 0.4%; Medium trucks: 0.01%. | Despite this type of intervention take time to consolidate, it was assumed they will be in place since 2021 and there will be results in emissions since then. | Modal share changes. We create a technology to represent non-motorized modes, with no energy consumption. |
| Aviation performance improvements | Performance-Based Navigation (PBN) in domestic aviation. | The mitigation action proposes to cover 60% of the national airports, to improve the fuel efficiency of the commercial flights. | It was assumed some airports won’t be able to implement PBN in the next years, so the action affects only a proportion of the domestic operations. | Reduction in fuel intensity factors. | |
| Scrapping and cargo fleet renewal program. | It consists of disintegrating and renovating the oldest vehicles in the cargo fleet. It affects trucks with a gross vehicle weight greater than 10.5 tons and more than 20 years old. | The program seeks to renovate 57,000 trucks between 2015 and 2030. | Older trucks tend to be used much less than new trucks, and that might affect the potential to reduce CO2eq. It was assumed that the program is accompanied by the optimization of freight operations, so in the end, the net effect is positive. | It is represented using the scrappage and fraction of scrapped replaced functions. | |
| Urban logistics improvements | Urban logistics improvements in the main cities in the country. | These mitigation actions seek to improve the operation of urban logistics in the main cities in the country. | It was assumed that the potential to improve current practices is significant. It is assumed that a national program will be able to cover almost 100% of the operations since the beginning of the action in 2017. This action depends on many external factors, and this is not captured by the assumptions in the model. | Modal share changes. We create a technology to represent avoided activity per year. | |
| NAMA_TANDEM | Nationally Appropriate Mitigation Action—Active transport and travel demand management (TAnDem). | It seeks to promote the use of non-motorized modes in urban passenger transport. The goal is to reduce motorized activity in 2030 with respect to BAU: Passenger light: 0.6%; Taxis: 1.6%; Motorcycles: 0.2%. | It is assumed that the action is generating benefits in GHG emissions since its beginning in 2019. The potential was modeled considering the effects of similar projects in Colombia and Latin America. | Modal share changes. We create a technology to represent non-motorized modes, with no energy consumption. | |
| Multimodal freight transport—River/Road | Increase the participation of waterborne transport in the freight segment. | By modal substitution, the goal is to reduce between 30,000–132,000 t CO2eq per year in the period 2016–2030. | It is assumed that the main benefits will come from the proportion of freight transport by the river, but there is also an opportunity to improve the road complementary segment. | Modal share changes in road transport.Increase in fuel intensity factors for navigation. | |
| Multimodal freight transport—Train/Road | Increase the participation of rail transport in the freight segment. | By modal substitution, the goal is to reduce between 9000–112,000 t CO2eq per year in the period 2021–2030. | It is assumed that the main benefits will come from the proportion of freight transport by train, but there is also an opportunity to improve the road complementary segment. | Modal share changes in road transport.Increase in fuel intensity factors for trains. | |
| Electric mobility program | Increase the participation of electric vehicles. | In terms of activity (VKTs) in 2030 there is this participation of electricity: Passenger light: 22%; Taxis: 5%; Buses: 10%; Medium trucks: 8%. | It is assumed the incentives and other complementary programs will be implemented on time to reach the goal in the electric fleet by 2030. | Sales share changes in road transport. | |
| Metro Bogotá | The first line of the Bogotá Metro. | By modal substitution, the goal is to reduce 132,000 t CO2eq per year in the period 2028–2030. | It is assumed that the substitution effects will be gradual and so will be the effects in emissions reduced. | Sales share changes in road transport.Modal share changes. | |
| Intercity train Metropolitan Area of Bogota | Regional tram to serve the Metropolitan Area of Bogotá. | By modal substitution, the goal is to reduce 32,000 t CO2eq per year in the period 2024–2030. | It is assumed that the substitution effects will be gradual and so will be the effects in emissions reduced. | Sales share changes in road transport.Modal share changes. | |
| Fugitives | Compressors in natural gas activities | Improve the sealing of compressors in the extraction and transportation of natural gas. | 20% less emission in venting | Works on compressors will be lineal from 2018 to reach the target in 2030. | Reduction of emission factor |
| Glycol use optimization | Reduce fugitive emissions by optimizing the use of the glycol. | Reduction of emissions by 2% | The reduction of the emission factor reflects the potential assed in some wells in Colombia. This can be extrapolated to the total national production. | Reduction of emission factor | |
| Recovery in storage tanks | Recovery of fugitive emissions in storage facilities and preventing gas leakages by continuous inspections. | 13% less emissions in distribution | All storage facilities might reach the same level of reduction as the pilot projects in some facilities in Colombia have done *. | Reduction of emission factor |
| Scope | Measure | Explanation | Target 2030 | Assumptions | Implementation in LEAP |
|---|---|---|---|---|---|
| Substances | ODS substitutes | Reduce the use and management of ODS substances | Reduce the use of the most polluting HFCs by 15% | The replacement of substance with other HFCs is possible without affecting the performance of cooling technologies and there will be market acceptance. | Change in production activity |
| Process emissions | Chemical industry | Reduce process emissions in the industry by improvements in reactions | Reduce 10% process emission in nitric acid production | An emission factor lower than the standard IPCC is possible by improvements in production. | Reduction of emission factor |
| Scope | Measure | Explanation | Target 2030 | Assumptions | Implementation in LEAP |
|---|---|---|---|---|---|
| Wastewater | Nama coffee and panela wastewater treatment | Wastewater treatment of coffee and panela farms | 5% of water treated with septic tank and burning of 4ktCH4. | All farms are similar and have access to wastewater treatment facilities close to production. | Change in the share of technologies in residential-rural and industry-coffee/sugar wastewater management |
| Solid Waste | Use of biogas in landfills | Use of landfill gas for the production of electricity | 3% of CH4 emissions in major landfills | The production of electricity in landfills covers local electricity demand. Surplus of electricity is neglected. | CH4 recovery variable in function of emission in reference scenario |
| Biogas management water treatment | Recovery of CH4 in wastewater treatment plants to destroy CH4 molecules and emit CO2. | 35% wastewater treated with plants with CH4 recovery | Recovered CH4 is used to partially cover sites own energy requirements (electricity and heat) | Change in the share of technologies in residential-urban wastewater management | |
| Biogas burning in landfills | Recovery of CH4 in landfills to destroy CH4 molecules and emit CO2. | 1.5% of CH4 emissions | Combustion is efficient and most CH4 molecules are destroyed | CH4 use variable in function of emission in reference scenario. | |
| Recycling of plastic paper and glass | Increase the recycling rate of plastic, paper and glass at national level. | 15% in major landfills | Recycling is possible in landfills linked to the five biggest cities. Waste sorting is done outside the landfill facilities. | Change in the amount of solid waste (plastic, glass, and paper disposed) in landfills used in the calculation of emissions. | |
| Biological mechanical treatment systems | Composting of organic component of municipal solid waste to prevent CH4 emissions. | 5% of biological part of waste in major landfills | Organic waste is extracted at the entrance of the landfill | Reduction of the amount of municipal solid waste reaching landfills, and a proportional increase in the solid waste treated by mechanical biological treatment plants. |
| Scope | Measure | Explanation | Target 2030 | Assumptions | Implementation in LEAP |
|---|---|---|---|---|---|
| Land use | Deforestation reduction | Deforestation rates are reduced following the ambitions included in the NREF | Reduction of 40kha/yr | Reduction of deforestation linked to illegal activities, intensive agriculture and intensive mining, among others is possible by policies, regulation and surveillance of protected areas. | Results are fed from AFOLU model (exogenous) into subcategories 3B1 |
| AMTEC rice | Implementation of AMTEC mode for rice production: Volumetric water consumption management; reduction in the use of fertilizers in the productive system; and management of harvest residues. | 80% of crops | De adoption of the AMTEC method by rice producer will not present opposition | Results are fed from AFOLU model (exogenous) into subcategories 3C4 y 3C5 | |
| NAMA Coffee (land use) | Implement strategies for the mitigation of GHG generated in the production, harvest and post-harvest stages of Colombian coffee at the farm level. | 1.2 kHa/yr. of crops with shade | The benefits of crops with shade are the same in all regions and conditions | Reduction of fertilizer used by coffee crops. | |
| NAMA Panela (land use) | Encourage the efficient use of synthetic fertilizers and promote the reduction of burns | 1500 sugar mills with 800 ha of restoration | Data from the "Andina" region are extrapolated to the national level (14.8 tCO2/ha/year.) | Results are fed from AFOLU model (exogenous) into subcategories 3B2bi | |
| Forest plantations | Increased establishment of forest plantations in non-forest areas prior to planting | 15 kha/yr | Plantation harvesting is within a cycle equal or less than one year. | Results are fed from AFOLU model (exogenous) into subcategories 3B2a. | |
| Cocoa crops | Increase in areas dedicated to the cultivation of cocoa under agroforestry systems (SAF), and land rehabilitation. | 80k Ha | Given that for the productive sector only 7.6% of the productive units use chemical fertilizers and 6.5% apply organic fertilizers, the use of fertilizers will not be taken into account in the quantification of emission reductions. | Results are fed from AFOLU model (exogenous) into subcategories 3B2a. | |
| Ecological restoration | Reforestation of already deforested lands | 1 million Ha | Land will be restored and protected 20 years. Then, land will pass to the category of land that remains as it is. | Results are fed from AFOLU model (exogenous) into subcategories 3B2a. | |
| Biomass use | Efficient wood stoves | Provide more efficient firewood stoves to households that currently use firewood for cooking | 700,000 new stoves | People will continue using firewood for cooking. New stoves will improve efficiency and reduce wood consumption per capita in rural areas. | Increase penetration of effect stoves in demand sector (residential—rural). |
| Livestock | NAMA Livestock | Reduce GHG emissions generated in livestock production and increase carbon removals from ago-ecosystems dedicated to livestock by intensifying the production of livestock systems and increasing efficiency (less land for animal farming). | 38% of livestock farms. Emission factor reduction of 0.55%. And 68kHa of livestock farming to be restored. | 1% les fertilizer for 27% of cattle.Almost all land restauration is attributed to 1 of the 10 defined regions, | Reduction of CH4 emissions by enteric fermentation. Reduction of nitrogen fertilizers. And carbon sequestration in soils and biomass from a series of measures (From AFOLU land model) |
References
- Intended Nationally Determined Contributions (INDCs) | UNFCCC. Available online: https://unfccc.int/process-and-meetings/the-paris-agreement/nationally-determined-contributions-ndcs/indcs (accessed on 10 September 2021).
- IDEAM and Clima Soluciones SAS. Biennial Update Report (BUR). BUR 2. National Inventory Report. April 2019. Available online: https://unfccc.int/sites/default/files/resource/NIR_BUR2_Colombia.pdf (accessed on 6 March 2020).
- Delgado, R.; Espinosa, M.; Cadena, A.I.; Sandova, J.; Alvarez, C. Formulation of a Nationally Determined Contribution to the mitigation of Climate Change. Colombian case. In Proceedings of the 39th IAEE International Conference, Bergen, Norway, 19–22 June 2016; Available online: https://www.iaee.org/en/publications/proceedingsabstractpdf.aspx?id=13678 (accessed on 23 September 2020).
- Available Educational Version of the Carbon Calculator | Calculadora Colombia. 2050. Available online: https://calculadora2050.minambiente.gov.co/en/noticias/available-educational-version-carbon-calculator (accessed on 15 September 2021).
- IRENA. Scenarios for the Energy Transition: Global Experience and Best Practices; IRENA: Abu Dhabi, United Arab Emirates, 2020; p. 88. [Google Scholar]
- United Nations-ECLAC. Assessment of Development Account Project 06/07 AM Strengthening National Capacities to Design and Implement Sustainable Energy Policies for the Production and Use of Biofuels in Latin America and the Caribbean. 2015. Available online: https://www.cepal.org/sites/default/files/publication/files/40163/S1501327_en.pdf (accessed on 13 June 2021).
- Nieves, J.A.; Aristizábal, A.J.; Dyner, I.; Báez, O.; Ospina, D.H. Energy demand and greenhouse gas emissions analysis in Colombia: A LEAP model application. Energy 2019, 169, 380–397. [Google Scholar] [CrossRef]
- Nieves, J.A.; Aristizábal, A.J.; Dyner, I.; Báez, O.; Ospina, D. Energy Analysis of the Tertiary Sector of Colombia and Demand Estimation Using LEAP. In Proceedings of the 2018 ICAI Workshops (ICAIW), Bogota, Colombia, 1–3 November 2018; pp. 1–6. [Google Scholar] [CrossRef]
- Arango-Aramburo, S.; Veysey, J.; Martínez-Jaramillo, J.E.; Díez-Echavarría, L.; Calderón, S.L.; Loboguerrero, A.M. Assessing the impacts of nationally appropriate mitigation actions through energy system simulation: A Colombian case. Energy Effic. 2020, 13, 17–32. [Google Scholar] [CrossRef]
- Simsek, Y.; Sahin, H.; Lorca, Á.; Santika, W.G.; Urmee, T.; Escobar, R. Comparison of energy scenario alternatives for Chile: Towards low-carbon energy transition by 2030. Energy 2020, 206, 118021. [Google Scholar] [CrossRef]
- Islas-Samperio, J.M.; Manzini, F.; Grande-Acosta, G.K. Toward a Low-Carbon Transport Sector in Mexico. Energies 2020, 13, 84. [Google Scholar] [CrossRef] [Green Version]
- Castrejón, D.; Zavala, A.M.; Flores, J.A.; Flores, M.P.; Barrón, D. Analysis of the contribution of CCS to achieve the objectives of Mexico to reduce GHG emissions. Int. J. Greenh. Gas Control 2018, 71, 184–193. [Google Scholar] [CrossRef]
- McPherson, M.; Karney, B. Long-term scenario alternatives and their implications: LEAP model application of Panama׳s electricity sector. Energy Policy 2014, 68, 146–157. [Google Scholar] [CrossRef]
- DNP. Manual Modelo de Equilibio General Computable (MEG4C). 2015. Available online: https://colaboracion.dnp.gov.co/CDT/Ambiente/2015%20Manual%20MEG4C.pdf (accessed on 16 June 2021).
- DANE. Proyecciones y retroproyecciones de población. In Proyecciones y Retroproyecciones de Población 1950–2070; DANE: Bogotá, Colombia, 2020. [Google Scholar]
- UPME. Plan Energético Nacional 2020–2050; UPME: Bogotá, Colombia, 2019. [Google Scholar]
- DNP. Proyección de PIB Sectoriales; National Planning Department of Colombia (DNP): Bogotá, Colombia, 2020. [Google Scholar]
- MinHacienda. Marco Fiscal de Mediano Plazo 2019; Ministry of Finance and Public Credit: Bogotá, Colombia, 2019. [Google Scholar]
- Heaps, C.G. LEAP: The Low Emissions Analysis Platform; Stockholm Environment Institute: Somerville, MA, USA, 2020; Available online: https://leap.sei.org (accessed on 30 April 2021).
- ETSAP. Overview of TIMES Modelling Tool. 2020. Available online: https://iea-etsap.org/index.php/etsap-tools/model-generators/times (accessed on 9 June 2021).
- IPCC. Climate Change 2014: Synthesis Report; IPCC: Geneva, Switzerland, 2014. [Google Scholar]
- IDEAM; PNUD; MADS; DNP; CANCILLERÍA. Segundo Informe Bienal de Actualización de Colombia ante la Convención Marco de las Naciones Unidas para el Cambio Climático (CMNUCC); IDEAM: Bogotá, Colombia, 2018. [Google Scholar]
- Pulido, A.D.; Chaparro, N.; Granados, S.; Ortiz, E.; Rojas, A.; Torres, C.F.; Turriago, J.D. Informe de Inventario Nacional de GEI de Colombia; Instituto de Hidrología, Meteorología y Estudios Ambientales IDEAM, Programa de las Naciones Unidas para el Desarrollo PNUD: Bogotá, Colombia, 2019. [Google Scholar]
- UPME. Primer Balance de Energía Útil Para Colombia y Cuantificación de las Pérdidas Energéticas Relacionadas y la Brecha de Eficiencia Energética; UPME: Bogotá, Colombia, 2018. [Google Scholar]
- UPME. Beco: Consulta; UPME: Bogotá, Colombia, 2018. [Google Scholar]
- IPCC. Directrices del IPCC de 2006 Para los Inventarios Nacionales de Gases de Efecto Invernadero. Volumen 3: Procesos Industriales y uso de Productos; IPCC: Geneva, Switzerland, 2006. [Google Scholar]
- LEAP. LEAP User Guide. Low Emissions Analysis Platform (LEAP); Stockholm Environment Institute: Stockholm, Sweden, 2020. [Google Scholar]
- Ministerio de Transporte. Transporte en Cifras 2013–2018; Ministerio de Transporte: Bogotá, Colombia, 2019. [Google Scholar]
- Naturgas. Estadísticas Sobre Conversiones a GNV; Naturgas: Bogotá, Colombia, 2020. [Google Scholar]
- Behrentz, E.; Espinosa, M.; Joya, S.; Peña, C.; Prada, A. Productos Analíticos Para Apoyar la Toma de Decisiones Sobre Acciones de Mitigación a Nivel Sectorial: Curvas de Abatimiento Para Colombia Documento Genera; Universidad de los Andes: Bogotá, Colombia, 2014. [Google Scholar]
- Cadena, A.; Bocarejo, J.; Rodriguez, M.; Rosales, R.; Arguello, R.; Delgado, R.; Florez, E.; Espinosa, M.; Lombo, C.; Lopez, H.; et al. Upstream Analytical Work to Support Development of Policy Options for Mid- and Long-Term Mitigation Objectives in Colombia—Informe Producto C; Universidad de los Andes: Bogotá, Colombia, 2016. [Google Scholar]
- EEA. EMEP/EEA Air Pollutant Emission Inventory Guidebook. 2019. Available online: http://efdb.apps.eea.europa.eu (accessed on 20 June 2020).
- USDE-EPA. Fuel Economy. Government Source for Fuel Economy Information. 2020. Available online: www.fueleconomy.gov (accessed on 20 June 2020).
- IEA. Fuel Economy in Major Car Markets—Technology and Policy Drivers 2005–2017; IEA: Paris, France, 2019. [Google Scholar]
- ICCT. Estimating the Fuel Efficiency Technology Potential of Heavy-Duty Trucks in Major Markets Around the World; ICCT: London, UK, 2016. [Google Scholar]
- Dargay, J.; Gately, D.; Sommer, M. Vehicle Ownership and Income Growth, Worldwide: 1960–2030 Author(s): Joyce Dargay, Dermot Gately and Martin Sommer Published by : International Association for Energy Economics Stable. Energy 2007, 28, 143–170. Available online: http://www.jstor.org/stable/41323125 (accessed on 1 April 2016).
- DANE. Cuentas Nacionales: Agregados Macroeconomicos—Base 2015; DANE: Bogotá, Colombia, 2020. [Google Scholar]
- DANE. Encuesta Nacional de Calidad de Vida—ECV 2015; DANE: Bogotá, Colombia, 2015. [Google Scholar]
- UPME. Plan Indicativo de Abastecimiento de Combustibles Líquidos; UPME: Bogotá, Colombia, 2019. [Google Scholar]
- UPME. Estudio Técnico Para el Plan de Abastecimiento de Gas Natural; UPME: Bogotá, Colombia, 2020; p. 143. [Google Scholar]
- UPME; Ministerio de Minas y Energía. Análisis prospectivo del mercado nacional e internacional del carbón térmico, metalúrgico y antracita producido en Colombia. 2020. Available online: https://www1.upme.gov.co/simco/Cifras-Sectoriales/EstudiosPublicaciones/Analisis_prospectivo_mercado_nal_internal_carbon_termico.zip (accessed on 24 September 2021).
- UPME. Plan de Expansión de Referencia Generación—Transmisión 2016–2030. National Official Plan. 2016. Available online: http://www.upme.gov.co/Fotonoticias/Plan_GT_2016-2030_Preliminar_21-11-2016.pdf (accessed on 19 May 2020).
- XM. XM Portal BI—Oferta. 2020. Available online: http://portalbissrs.xm.com.co/Paginas/Home.aspx# (accessed on 9 June 2021).
- Veysey, J. NEMO: The Next Energy Modeling System for Optimization. 2020. Available online: https://www.sei.org/projects-and-tools/tools/nemo-the-next-energy-modeling-system-for-optimization/ (accessed on 30 April 2021).
- XM. Informe Seguimiento Cogeneradores Resolución CREG 005 de 2010; XM: Medellín, Colombia, 2019. [Google Scholar]
- UPME. Capacidad Instalada de Autogeneración y Cogeneración en Sector de Industria, Petróleo, Comercio y Público del País; UPME: Bogotá, Colombia, 2014. [Google Scholar]
- Superintendencia de Servicios Publicos. Sistema Unico de Información—Superservicios. Database. Available online: http://www.sui.gov.co/web/datos-abiertos (accessed on 15 June 2021).
- IPSE. Monitoreo y Fortalecimiento Empresarial en la Colombia No Interconectada; IPSE: Cali, Colombia, 2019. [Google Scholar]
- UPME. Factores de Emisión de los Combustibles Colombianos—FECOC. 2016. Available online: http://www.upme.gov.co/calculadora_emisiones/aplicacion/calculadora.html (accessed on 19 May 2021).
- Minambiente; IDEAM. Propuesta de Nivel de Referencia de las Emisiones Forestales por Deforestación en Colombia Para Pago por Resultados de REDD+ bajo la CMNUCC; Minambiente: Bogotá, Colombia; IDEAM: Bogotá, Colombia, 2019. [Google Scholar]
- IPCC. 2006 IPCC Guidelines for National Greenhouse Gas Inventories CHAPTER 3—SOLID WASTE DISPOSAL V5. 2006. Available online: https://www.ipcc-nggip.iges.or.jp/public/2006gl/pdf/5_Volume5/V5_3_Ch3_SWDS.pdf (accessed on 25 May 2020).
- Minambiente, Colombia. Contribución Prevista y Nacionalmente Determinada (indc) de Colombia-Documento de Soporte. 2015. Available online: https://www.minambiente.gov.co/images/cambioclimatico/pdf/documentos_tecnicos_soporte/Contribuci%C3%B3n_Nacionalmente_Determinada_de_Colombia.pdf (accessed on 25 September 2021).
- Minambiente, Colombia. NDC de COLOMBIA—ACTUALIZACIÓN 2020 Versión Para Consulta Pública. 2020. Available online: http://www.andi.com.co/Uploads/Documento%20NDC%20para%20consulta%20ciudadanos.pdf (accessed on 25 September 2021).
- UPME. Plan Energetico Nacional Colombia: Ideario Energético 2050; UPME: Bogotá, Colombia, 2015. [Google Scholar]
- Pronóstico de demanda. Available online: https://www.xm.com.co/Paginas/Consumo/pronostico-de-demanda.aspx (accessed on 29 September 2021).
- IPCC. 2006 IPCC Guidelines for National Greenhouse Gas Inventories. Chapter 4: Fugitive Emissions, V2.4. 2006. Available online: https://www.ipcc-nggip.iges.or.jp/public/2006gl/pdf/2_Volume2/V2_4_Ch4_Fugitive_Emissions.pdf (accessed on 25 September 2021).


| Parameter | Units | 2015 | 2020 | 2030 | 2050 | Source |
|---|---|---|---|---|---|---|
| Population | Million | 46.4 | 50.3 | 55.7 | 61.9 | [15] |
| Urban areas | % | 75.4% | 76.0% | 76.8% | 76.0% | [15] |
| Rural areas | % | 24.6% | 24.0% | 23.2% | 24.0% | [15] |
| Urban household size | people | 3.4 | 3.2 | 2.9 | 2.4 | [15,16] |
| Rural household size | people | 4.0 | 3.9 | 3.7 | 3.2 | [15,16] |
| Annual GDP growth * | % | 2.30% | 3.40% | 3.50% | - | [17,18] |
| Sub-Sector | End Uses | Fuels | Equipment |
|---|---|---|---|
| 1A2a—Iron and steel 1A2b—Non-ferrous metals 1A2c—Chemicals 1A2d—Pulp, paper, and printing 1A2e—Food, beverages, and tobacco 1A2f—Non-metallic minerals 1A2g—Transport equipment 1A2h—Machinery 1A2j—Wood and wood products 1A2l—Textiles and leather 1A2m—Industry not specified 1A2i—Mining and quarrying 1A2k—Construction | 1. Direct Heating 2. Indirect Heating 3. Machine Drive 4. Refrigeration 5. Cooling 6. Lighting 7. Others | 1. Bagasse 2. Coal 3. Natural gas 4. Firewood 5. Oil 6. Waste 7. Charcoal 8. Coke 9. Diesel 10. Fuel oil 11. LPG 12. Gasoline 13. Kerosene | 1. Existing efficiency 2. Best efficiency available in Colombia 3. Best efficiency available worldwide |
| Type | Natural Gas | Diesel | Gasoline |
|---|---|---|---|
| Units | MPG | MPG | MPG |
| Car | 18.2 | 21.6 | 19.3 |
| Bus | 5.2 | 6.1 | 5.1 |
| Medium Truck | 5.8 | 8.8 | 7.9 |
| Big Truck | 3.9 | 5.9 | 5.3 |
| Pick up | 18.2 | 21.6 | 19.3 |
| Micro Bus | 11.9 | 13.9 | 12.5 |
| Motorcycle | - | 75.5 | 57.3 |
| Taxi | 18.2 | 21.6 | 19.3 |
| Tractor | 3.5 | 5.3 | 4.7 |
| End-Use | Commercial | Public |
|---|---|---|
| Water Heating | 0.0143 | 0.0488 |
| Cooking | 0.0068 | 0.0024 |
| Lighting | 0.0034 | 0.0009 |
| Machine Drive | 0.0033 | 0.0019 |
| Air Conditioning | 0.0128 | 0.0046 |
| Refrigerators | 0.0010 | 0.0003 |
| Others | 0.0039 | 0.0054 |
| End-Use | Urban | Rural |
|---|---|---|
| Cooking | 2446 | 2661 |
| Water heating | 918 | 917 |
| Lighting | 57 | 40 |
| TV | 92 | 52 |
| Air Conditioning | 3599 | 3599 |
| Refrigerators | 403 | 403 |
| Wash machine | 119 | 119 |
| Air Fan | 49 | 64.5 |
| Others | 294 | 206 |
| Diesel | Coal | Fuel Oil | Gas | Jet Gasoline | Fuel Mix | |
|---|---|---|---|---|---|---|
| Efficiency | 29% | 32% | 23% | 44% | 26% | 33% |
| Hydro | Gas | Coal | Small Hydro | Biomass | Wind | Solar | Geothermal | Other | Total | |
|---|---|---|---|---|---|---|---|---|---|---|
| 2030 | 13,520 | 4470 | 1930 | 1260 | 0 | 362 | 90.5 | 0 | 88.3 | 21,720 |
| 2010 | 2011 | 2012 | 2013 | 2014 | 2015 | |
|---|---|---|---|---|---|---|
| Bagasse | 14.9 | 13.4 | 13.9 | 14.2 | 16.3 | 16.2 |
| Coal | 8.9 | 9.1 | 9.6 | 7.9 | 9.2 | 9.2 |
| Natural Gas | 49 | 47.5 | 46.7 | 48.4 | 47.5 | 47.8 |
| Hydro | 0.6 | 0.7 | 0.6 | 0.6 | 0.6 | 0.5 |
| Oil | 11.9 | 15.6 | 15.6 | 13.1 | 11.9 | 11.8 |
| Diesel | 13.4 | 12.5 | 12.4 | 14.4 | 13.3 | 13.3 |
| LPG | 1.2 | 1.2 | 1.2 | 1.4 | 1.3 | 1.2 |
| Units | 2010–2015 | |
|---|---|---|
| Coal production 2010-2015 | [TJ] | 14,701,512 |
| Natural gas use in mining | [TJ] | 8266 |
| Diesel use in mining | [TJ] | 88,303 |
| Gasoline use in mining | [TJ] | 584 |
| Natural Gas Intensity | [TJ/TJ Coal] | 0.000562 |
| Diesel Intensity | [TJ/TJ Coal] | 0.006006 |
| Gasoline Intensity | [TJ/TJ Coal] | 0.000040 |
| Annual Growth | Source | |
|---|---|---|
| Livestock | 4.0% for Birds | FENAVI (National Federation of Poultry Farmers) |
| 1.5% for Pigs | PorkColombia (National Pig Farming Fund) | |
| According to historical annual growth | ||
| Land burned | 1% in biomass in cropland and grasslands 3% per year for forest land | IDEAM |
| Deforestation | 2.9% for forested lands 1.27% for croplands 1.02% for grasslands | IDEAM-(SMBYC)MEDS (Reference Level of Forest Emissions) [50] |
| Forest plantations | According to the National Forest Development Plan | IDEAM |
| Sector | Mitigation Measure | Sector | Mitigation Measure |
|---|---|---|---|
| Energy | NAMA Refrigerators | Energy | Metro Bogotá |
| Efficient new buildings | Intercity train Metropolitan Area | ||
| Thermal districts | Compressors in pipelines | ||
| Agriculture energy efficiency | Glycol use optimization | ||
| Carbon tax | Recovery in storage tanks | ||
| Demand management | IPPU | ODS substitutes | |
| Sustainable cement | Chemical industry | ||
| Brick Development | Waste | Coffee and panela wastewater | |
| Industry Efficiency | Use of biogas in landfills | ||
| Fuel replacement industry | Biogas management water treatment | ||
| Thermal generator efficiency | Biogas burning in landfills | ||
| Diversification Capacity Generation | Recycling of plastic paper and glass | ||
| Mining energy efficiency | Biological mechanical treatment | ||
| Energy Efficiency Refineries | AFOLU | Deforestation reduction | |
| NAMA TOD | AMTEC rice | ||
| Aviation performance improvements | NAMA Coffee (land use) | ||
| Scrapping and cargo fleet renewal program. | NAMA Panela (land use) | ||
| Urban logistics improvements | Forest plantations | ||
| NAMA TANDEM | Cocoa crops | ||
| Freight transport—River/Road | Ecological restoration | ||
| Freight transport—Train/Road | Efficient wood stoves | ||
| Electric mobility program | NAMA Livestock |
| IPCC Category | 2015 | 2020 | 2025 | 2030 |
|---|---|---|---|---|
| 1—Energy | 87 | 88 | 106 | 125 |
| 2—IPPU | 9 | 11 | 15 | 18 |
| 3—AFOLU | 118 | 170 | 186 | 175 |
| 4—Waste | 19 | 22 | 25 | 28 |
| Total | 233 | 291 | 332 | 346 |
| 2010 | 2030 | |||
|---|---|---|---|---|
| PJ | Share | PJ | Share | |
| Coal | 87 | 8% | 99 | 5% |
| Natural Gas | 170 | 15% | 296 | 15% |
| Wood | 154 | 14% | 146 | 8% |
| Gasoline | 148 | 13% | 340 | 18% |
| Diesel | 223 | 20% | 468 | 24% |
| Coke | 16 | 1% | 1 | 0% |
| LPG | 29 | 3% | 45 | 2% |
| Kerosene | 36 | 3% | 82 | 4% |
| Electricity | 190 | 17% | 335 | 17% |
| Other fossil | 22 | 2% | 12 | 1% |
| Other | 53 | 5% | 93 | 5% |
| Total | 1126 | 1916 | ||
| Individual Potential | Mitigation Scenario | Variation | |
|---|---|---|---|
| Energy | 21.1 | 17.2 | −18.1% |
| IPPU | 1.4 | 1.6 | +12.1% |
| AFOLU | 75.8 | 75.7 | −0.2% |
| Waste | 1.3 | 1.2 | −9.5% |
| Total | 99.6 | 95.7 | −3.9% |
Publisher’s Note: MDPI stays neutral with regard to jurisdictional claims in published maps and institutional affiliations. |
© 2021 by the authors. Licensee MDPI, Basel, Switzerland. This article is an open access article distributed under the terms and conditions of the Creative Commons Attribution (CC BY) license (https://creativecommons.org/licenses/by/4.0/).
Share and Cite
Correa-Laguna, J.D.; Pelgrims, M.; Espinosa Valderrama, M.; Morales, R. Colombia’s GHG Emissions Reduction Scenario: Complete Representation of the Energy and Non-Energy Sectors in LEAP. Energies 2021, 14, 7078. https://doi.org/10.3390/en14217078
Correa-Laguna JD, Pelgrims M, Espinosa Valderrama M, Morales R. Colombia’s GHG Emissions Reduction Scenario: Complete Representation of the Energy and Non-Energy Sectors in LEAP. Energies. 2021; 14(21):7078. https://doi.org/10.3390/en14217078
Chicago/Turabian StyleCorrea-Laguna, Juan David, Maarten Pelgrims, Monica Espinosa Valderrama, and Ricardo Morales. 2021. "Colombia’s GHG Emissions Reduction Scenario: Complete Representation of the Energy and Non-Energy Sectors in LEAP" Energies 14, no. 21: 7078. https://doi.org/10.3390/en14217078