
A Probabilistic and Value-Based Planning Approach to Assess the Competitiveness between Gas-Fired and Renewables in Hydro-Dominated Systems: A Brazilian Case Study

Abstract
:1. Introduction
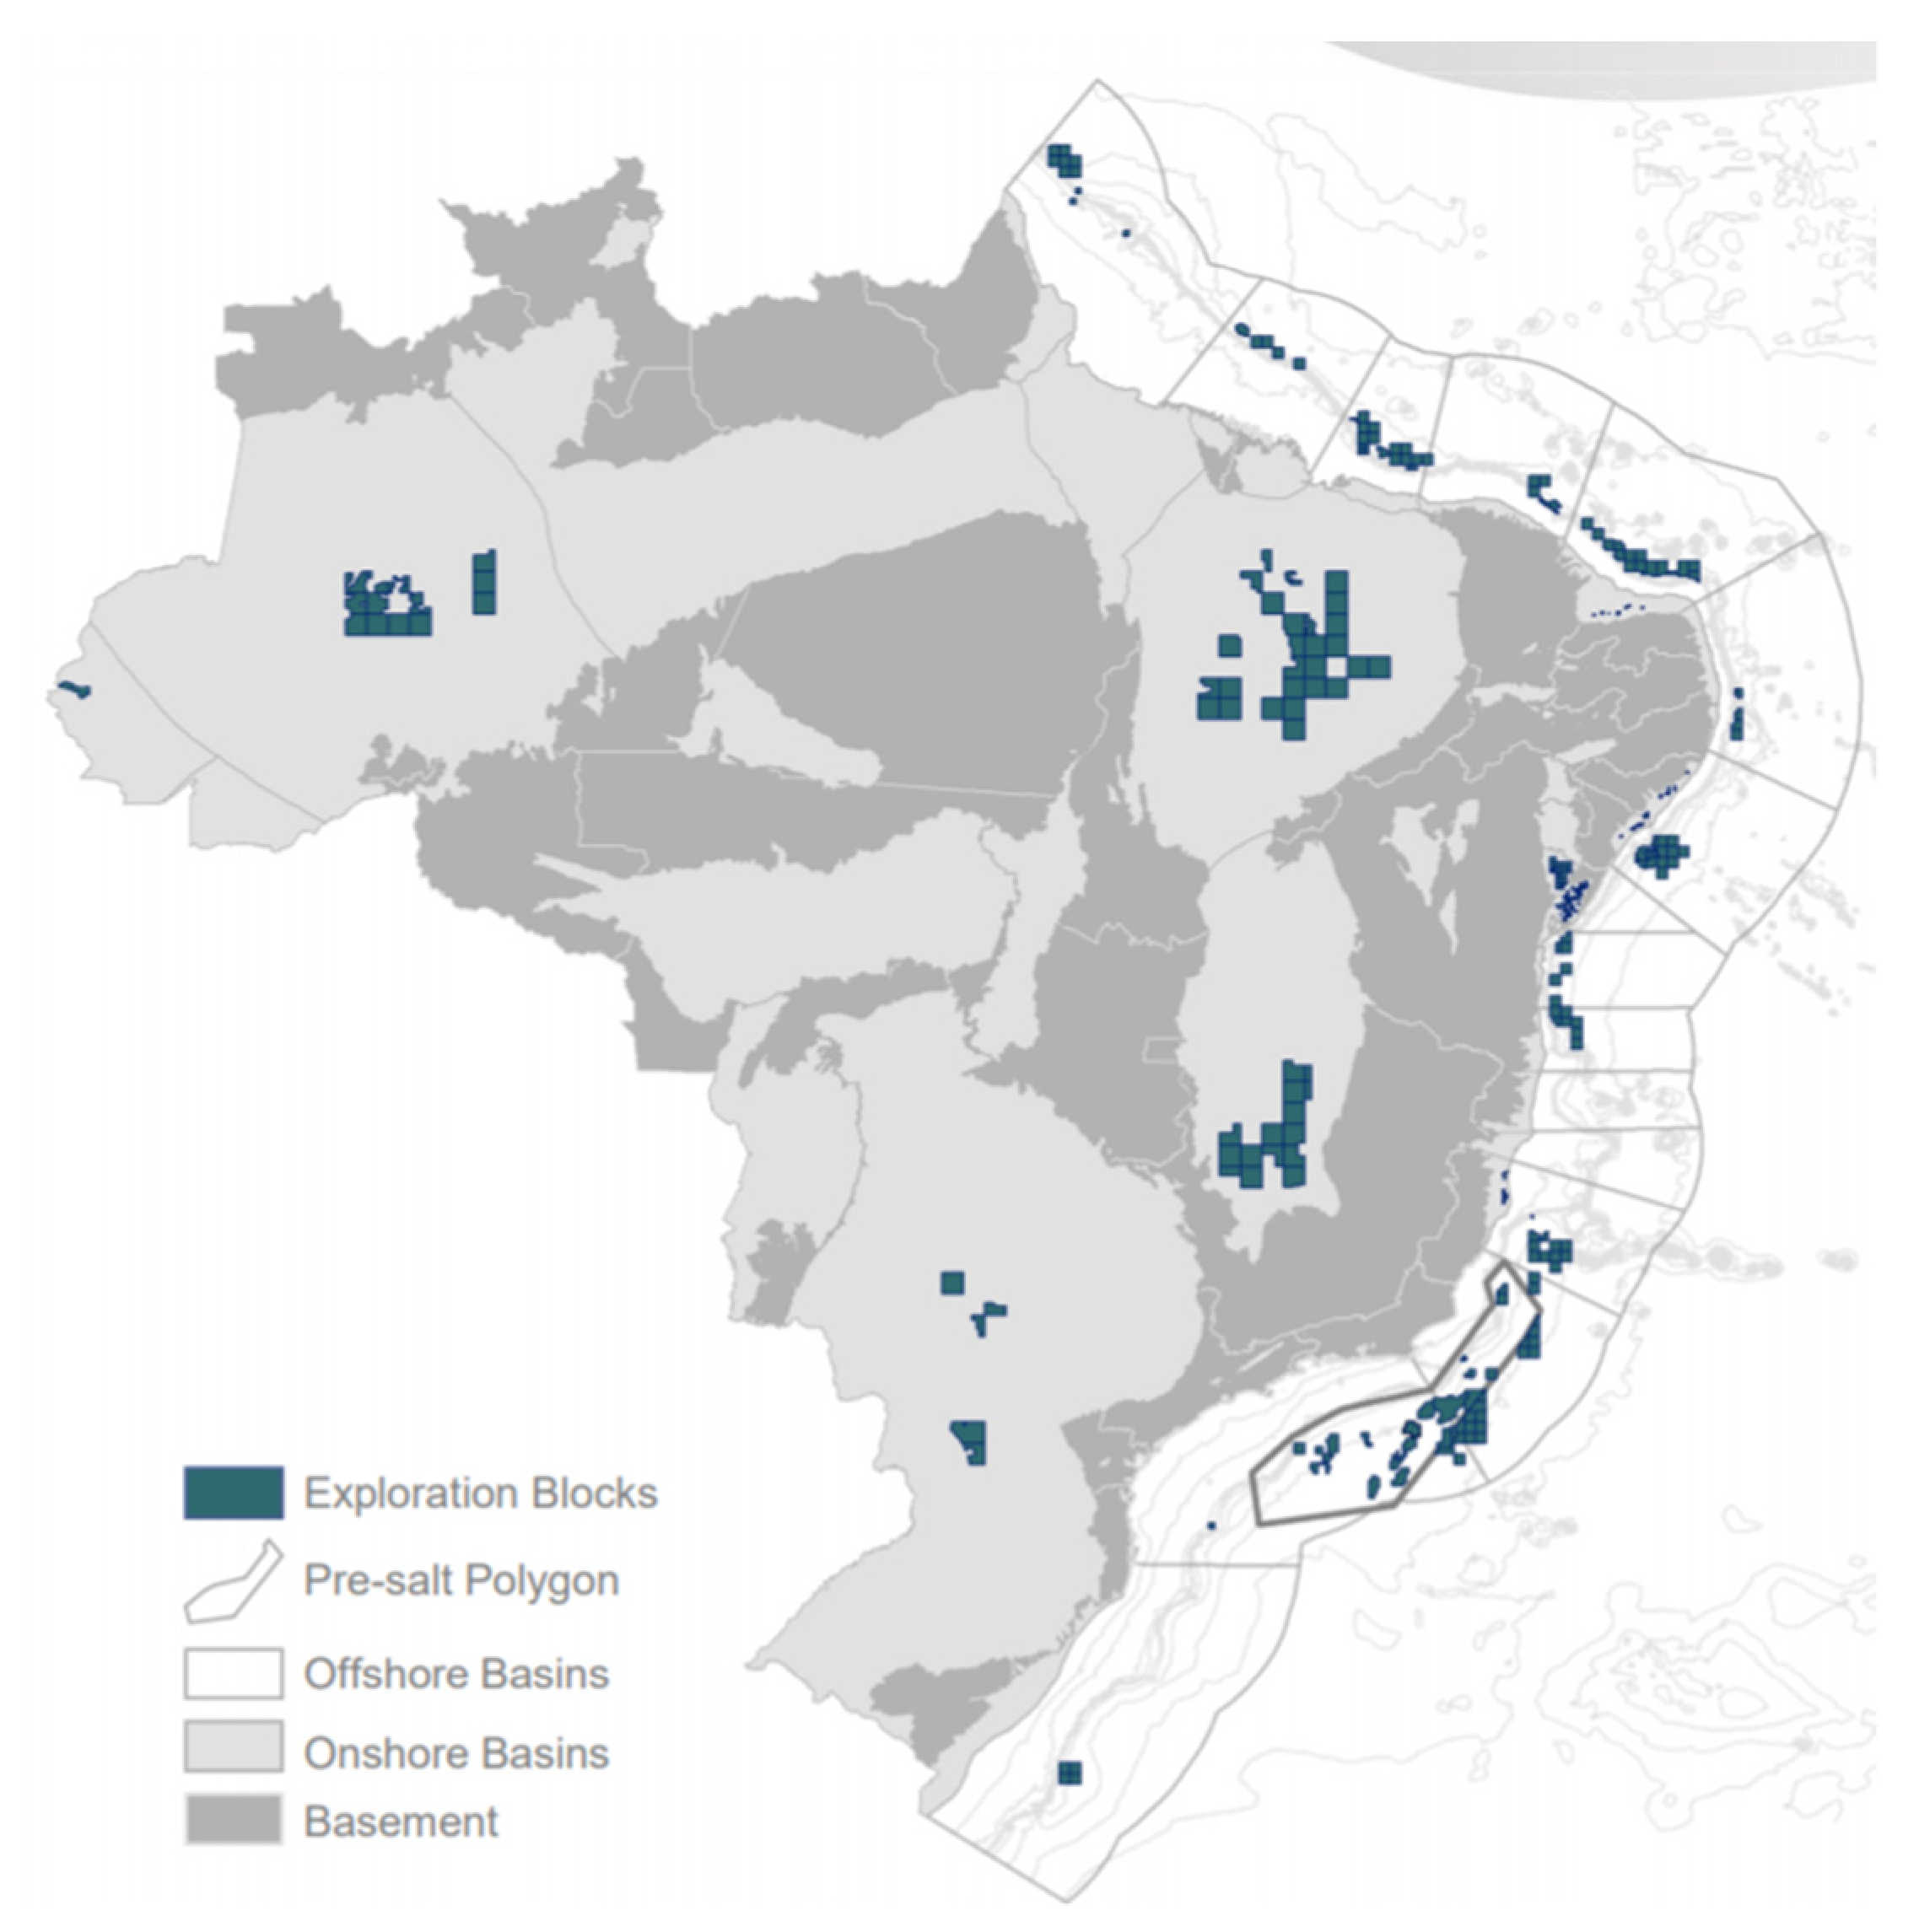
1.1. The Brazilian Power System and Problem Description
1.2. Objectives of This Work
1.3. Literature Survey and Paper Contributions
2. Methodology
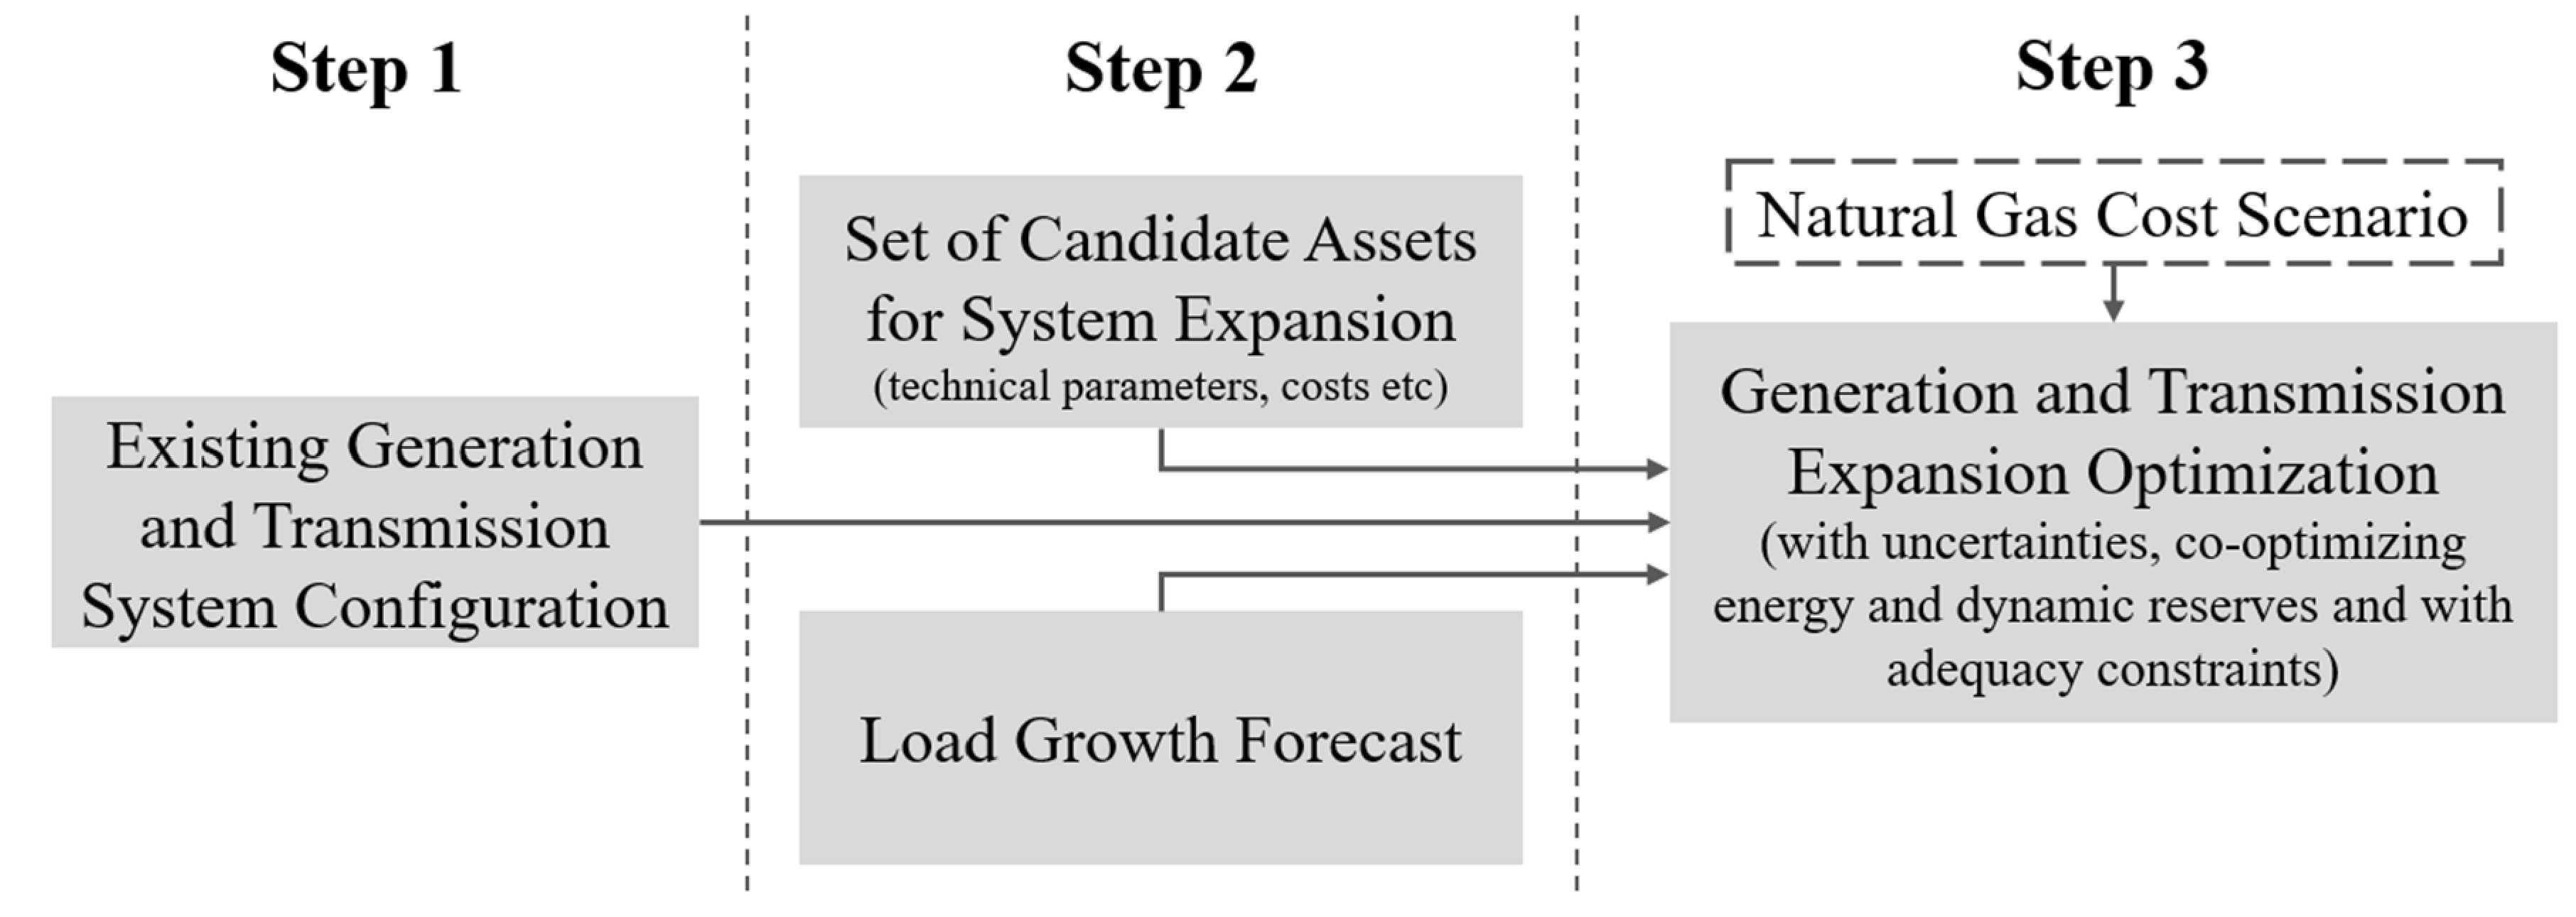
- Step 1:
- Start from an existing generation-transmission system configuration over a given horizon;
- Step 2:
- Define a load growth scenario and a set of generation expansion candidates, as well as their CAPEX & OPEX and technical characteristics;
- Step 3:
- for a given gas price delivered at the power plant, utilize the solution strategy defined in the capacity expansion planning model explained in the next section to determine the sizing of the gas-fired plants in the system to supply the load growth.
2.1. Solution Strategy
2.2. Problem Formulation
- Objective Function:
- Load Balance:
- Operative Variables Limits:
- Ramp-up and Ramp-down Limits:
- Operating Reserve and Adequacy Constraints:
- Hydro Power Plants Constraints:
- Energy Storage Equipment Constraints:
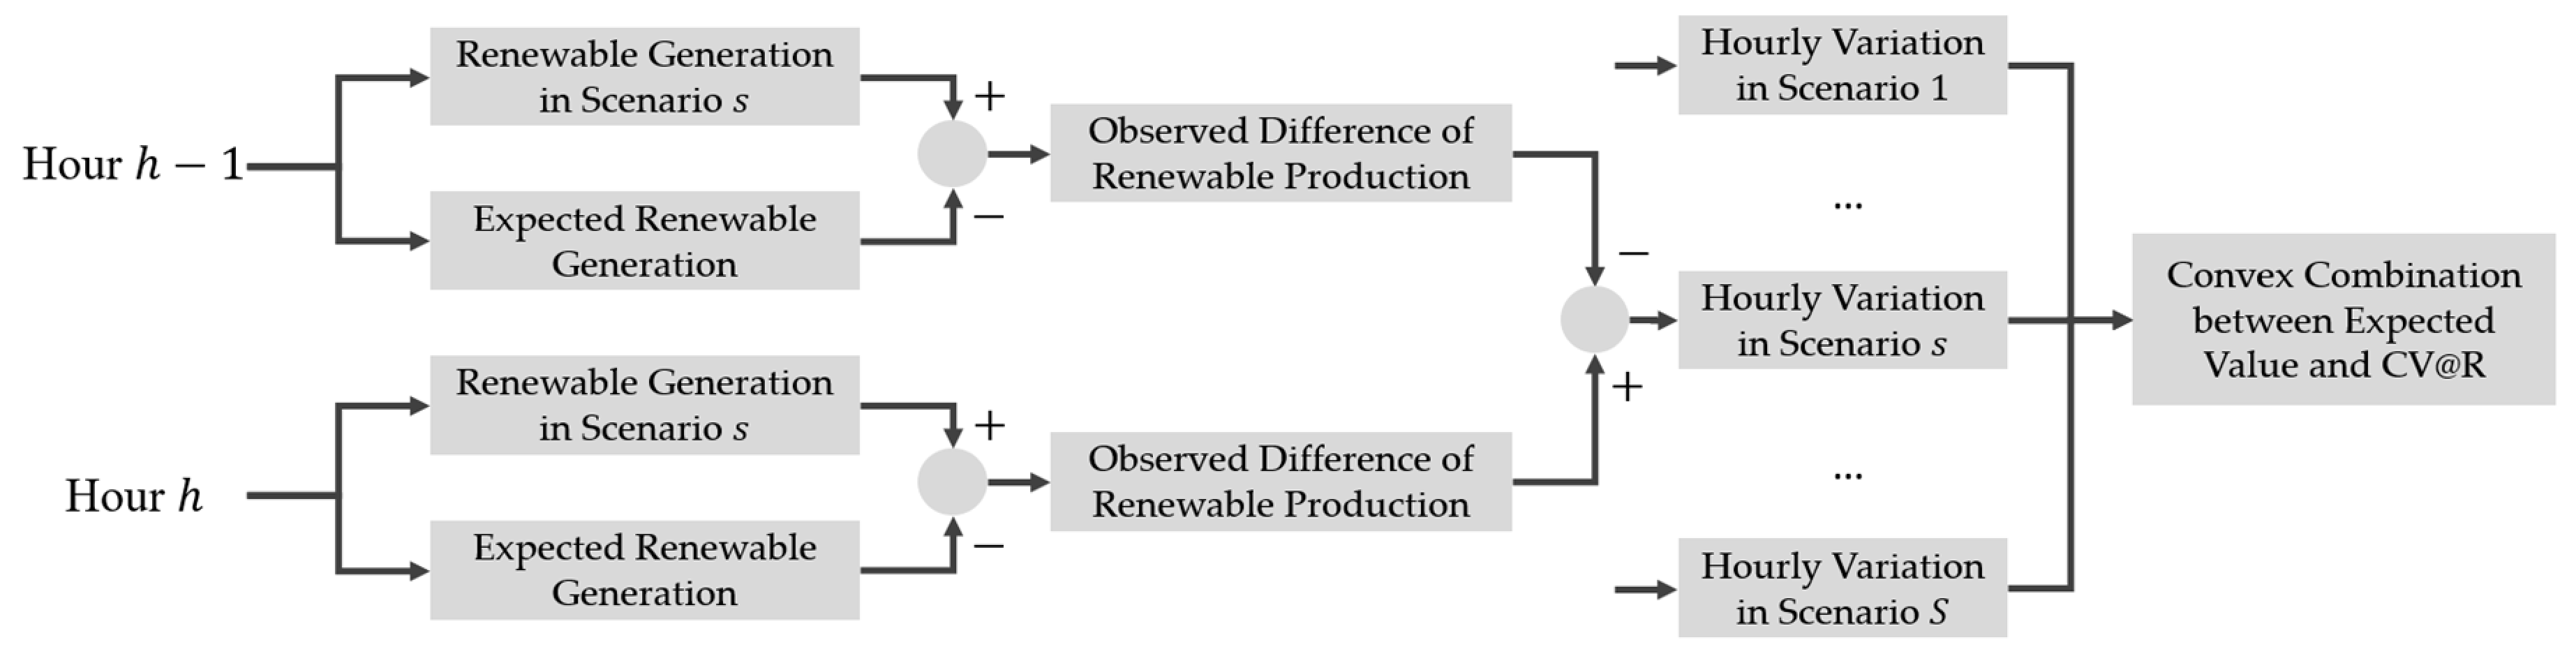
- Dynamic Probabilistic Reserve Formulation:
- Binary Variables:
2.3. Solution Approach
3. Case Study: Assessing the Competitiveness of Base-Load Gas Generation from Pre-salt Gas Fields
Assumptions
4. Results and Discussion
4.1. Value of Pre-Salt Natural Gas Power Plants: Energy-Only Cost Analysis
4.2. Pre-Salt Natural Gas Breakeven Price—Considering Security and Adequacy Constraints
- TPPs contribute for operating reserve (due to its small flexible portion) and firm capacity requirements;
- The growth of VRE increases the operating reserve requirements;
- The optimal volume of capacity additions of baseload dispatch increases the hydro storage levels, thus enabling hydro plants to supply, in a cost-effective way, the operating reserves dynamically defined. An interesting discussion—but out of the scope of this paper—is how to share the benefits associated to the reserves provision between hydro (“executers”) and the base load gas plants (“enablers”).
5. Conclusions
Author Contributions
Funding
Institutional Review Board Statement
Informed Consent Statement
Conflicts of Interest
Nomenclature
| Water inflow | ||
| Bus index | ||
| Operative cost | ||
| Loss of load cost | ||
| Energy imports/exports | ||
| Maximum energy transfer | ||
| Power generation | ||
| Maximum/minimum generation | ||
| Expected generation | ||
| Hour index | ||
| Existing power plant index | ||
| Annualized investment cost | ||
| Candidate index | ||
| Set of candidates for generation, transmission and energy storage equipment | ||
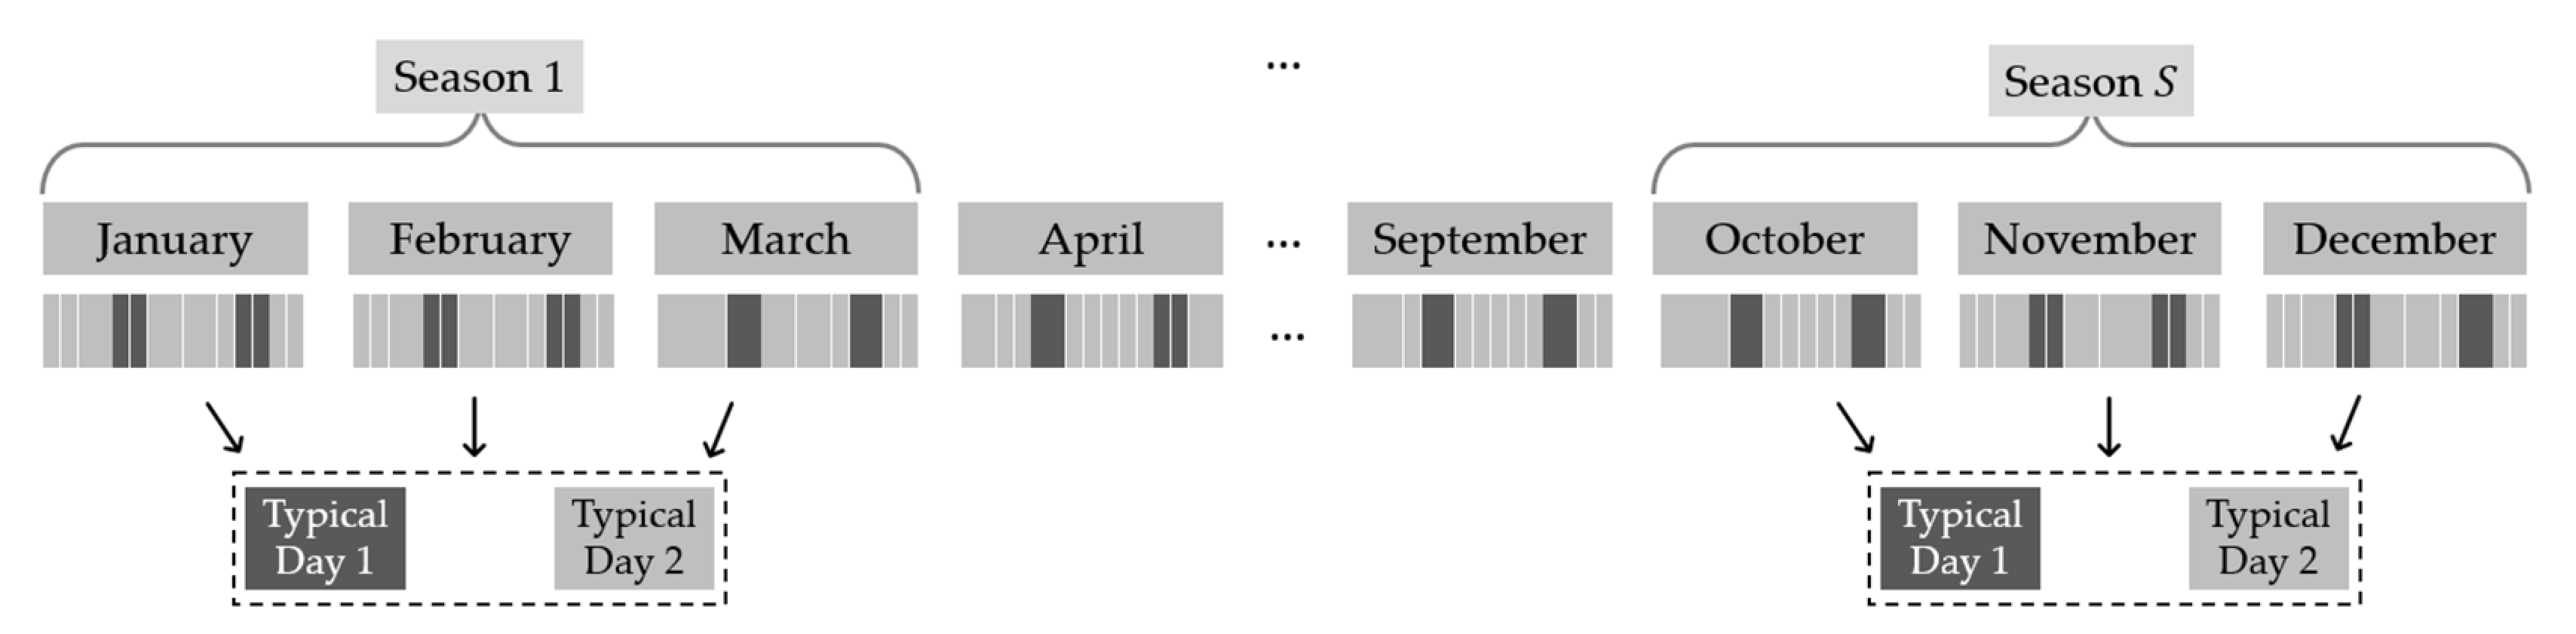
| Typical day index | ||
| Set of upstream reservoirs | ||
| Scenario probability | ||
| Minimum outflow from reservoir | ||
| Power reserve | ||
| Dynamically reserve requirements | ||
| Scenario index | ||
| Seasons index | ||
| Water discharged into the turbines | ||
| Water spillage | ||
| Maximum/minimum reservoir levels | ||
| Reservoir level by the beginning/end of the period | ||
| Volume of the storage equipment | ||
| Maximum storage equipment volume | ||
| Decision of investing in a candidate | ||
| Percentile of the scenarios | ||
| Weight of the typical day in its season | ||
| Absolute difference of the variation of the total renewable production between hours stages | ||
| Maximum ramp-up/ramp-down | ||
| Stage energy loss | ||
| Water losses | ||
| Battery charge/discharge | ||
| Maximum output capacity | ||
| Convex combination parameter | ||
| Energy loss in charging process | ||
| Energy production function | ||
| Depth of loss of load | ||
| Firm capacity | ||
| Maximum/minimum firm capacity requirements |
References
- Barroso, L.A.; Rudnick, H.; Mocarquer, S.; Kelman, R.; Bezerra, B. LNG in South America: The markets, the prices and the security of supply. In Proceedings of the IEEE Power and Energy Society General Meeting: Conversion and Delivery of Electrical Energy in the 21st Century, PES, Pittsburgh, PA, USA, 20–24 July 2008. [Google Scholar]
- Bezerra, B.; Barroso, L.A.; Kelman, R.; Flach, B.; Latorre, M.; Campodonico, N.; Pereira, M. Integrated Electricity–Gas Operations Planning in Long-term Hydroscheduling Based on Stochastic Models. In Hanbook of Power Systems I, Energy Systems; Springer: Berlin/Heidelberg, Germany, 2010; Volume 1, pp. 3–32. [Google Scholar]
- Chabar, R.M.; Barroso, L.A.; Granville, S.; Pereira, M.V.; Iliadis, N. Optimization of Fuel Contract Management and Maintenance Scheduling for Thermal Plants in Hydro-Based Power Systems. In Proceedings of the Powergen Europe, Conference & Exhibition, Milan, Italy, 28–30 June 2005. [Google Scholar]
- Street, A.; Barroso, L.A.; Chabar, R.; Mendes, A.T.S.; Pereira, M.V. Pricing Flexible Natural Gas Supply Contracts under Uncertainty in Hydrothermal Markets. IEEE Trans. Power Syst. 2008, 23, 1009–1017. [Google Scholar] [CrossRef]
- Barroso, L.A.; Flach, B.; Kelman, R.; Bezerra, B.; Binato, S.; Bressane, J.M.; Pereira, M.V. Integrated gas-electricity adequacy planning in Brazil: Technical and economical aspects. In Proceedings of the IEEE Power Engineering Society General Meeting, San Francisco, CA, USA, 16 June 2005. [Google Scholar]
- IRENA. Renewable Energy Auctions: Status and Trends Beyond Price; International Renewable Energy Agency: Abu Dhabi, United Arab Emirates, 2019. [Google Scholar]
- Porrua, F.; Bezerra, B.; Barroso, L.A.; Lino, P.; Ralston, F.; Pereira, M. Wind power insertion through energy auctions in Brazil. In Proceedings of the IEEE PES General Meeting, Minneapolis, MN, USA, 25–29 July 2010. [Google Scholar]
- Bezerra, B.; Barroso, L.A.; Brito, M.; Porrua, F.; Flach, B.; Pereira, M.V. Measuring the hydroelectric regularization capacity of the Brazilian hydrothermal system. In Proceedings of the IEEE PES General Meeting, Minneapolis, MN, USA, 25–29 July 2010; pp. 1–7. [Google Scholar]
- De Marreco, J.M.; Carpio, L.G.T. Flexibility valuation in the Brazilian power system: A real options approach. Energy Policy 2006, 34, 3749–3756. [Google Scholar] [CrossRef]
- Hinderaker, L.; Njaa, S. Utilization of associated petroleum gas (APG)—The Norwegian experience. In Proceedings of the Society of Petroleum Engineers—SPE Russian Oil and Gas Technical Conference and Exhibition, Moscow, Russia, 26 October 2010; Volume 2, pp. 837–848. [Google Scholar]
- Crespo, L. STE Plants: Beyond Dispatchability Firmness of Supply and Integration with VRE. Energy Procedia 2015, 69, 1241–1248. [Google Scholar] [CrossRef] [Green Version]
- Pérez-Arriaga, I. Security of electricity supply in Europe in a short, medium and long-term perspective. Eur. Rev. Energy Mark. 2007, 2, 1–28. [Google Scholar]
- Faria, E.; Barroso, L.A.; Kelman, R.; Granville, S.; Pereira, M.V. Allocation of Firm-Energy Rights among Hydro agents using Cooperative Game Theory: An Aumann-Shapley approach. IEEE Trans. Power Syst. 2009, 24, 541–551. [Google Scholar] [CrossRef]
- Unsihuay, C.; Lima, J.W.M.; De Souza, A.C.Z. Modeling the integrated natural gas and electricity optimal power flow. In Proceedings of the IEEE Power Society General Meeting, Tampa, FL, USA, 24–28 June 2007; pp. 1–7. [Google Scholar]
- Unsihuay-Vila, C.; Marangon-Lima, J.W.; De Souza, A.C.Z.; Perez-Arriaga, I.J.; Balestrassi, P.P. A model to long-term, multiarea, multistage, and integrated expansion planning of electricity and natural gas systems. IEEE Trans. Power Syst. 2010, 25, 1154–1168. [Google Scholar] [CrossRef]
- De Mello, O.D.; Ohishi, T. An integrated dispatch model of gas supply and thermoelectric systems. In Proceedings of the 15th Power Systems Computation Conference 2005, Liege, Belgium, 22–26 August 2005. [Google Scholar]
- He, C.; Wu, L.; Liu, T.; Shahidehpour, M. Robust Co-Optimization Scheduling of Electricity and Natural Gas Systems via ADMM. IEEE Trans. Sustain. Energy 2017, 8, 658–670. [Google Scholar] [CrossRef]
- Chaudry, M.; Jenkins, N.; Strbac, G. Multi-time period combined gas and electricity network optimisation. Electr. Power Syst. Res. 2008, 78, 1265–1279. [Google Scholar] [CrossRef]
- An, S.; Li, Q.; Gedra, T.W. Natural Gas and Electricity Optimal Power Flow. In Proceedings of the IEEE Power Engineering Society Transmission and Distribution Conference, Dallas, TX, USA, 7–12 September 2003; Volume 1, pp. 138–143. [Google Scholar]
- Salimi, M.; Ghasemi, H.; Adelpour, M.; Vaez-ZAdeh, S. Optimal planning of energy hubs in interconnected energy systems: A case study for natural gas and electricity. IET Gener. Transm. Distrib. 2014, 9, 695–707. [Google Scholar] [CrossRef] [Green Version]
- Zhou, X.; Guo, C.; Wang, Y.; Li, W. Optimal expansion co-planning of reconfigurable electricity and natural gas distribution systems incorporating energy hubs. Energies 2017, 10, 124. [Google Scholar] [CrossRef] [Green Version]
- Barati, F.; Seifi, H.; Sepasian, M.S.; Nateghi, A.; Shafie-Khah, M.; Catalao, J.P.S. Multi-Period Integrated Framework of Generation, Transmission, and Natural Gas Grid Expansion Planning for Large-Scale Systems. IEEE Trans. Power Syst. 2015, 30, 2527–2537. [Google Scholar] [CrossRef]
- Qiu, J.; Yang, H.; Dong, Z.Y.; Zhao, J.H.; Meng, K.; Luo, F.J.; Wong, K.P. A Linear Programming Approach to Expansion Co-Planning in Gas and Electricity Markets. IEEE Trans. Power Syst. 2016, 31, 3594–3606. [Google Scholar] [CrossRef]
- Chen, H.; Baldick, R. Optimizing short-term natural gas supply portfolio for electric utility companies. IEEE Trans. Power Syst. 2007, 22, 232–239. [Google Scholar] [CrossRef]
- Massé, P.; Gibrat, R. Application of Linear Programming to Investments in the Electric Power Industry. Manag. Sci. 2016, 3, 149–166. [Google Scholar] [CrossRef]
- Oree, V.; Sayed Hassen, S.Z.; Fleming, P.J. Generation expansion planning optimisation with renewable energy integration: A review. Renew. Sustain. Energy Rev. 2017, 69, 790–803. [Google Scholar] [CrossRef]
- Sadeghi, H.; Rashidinejad, M.; Abdollahi, A. A comprehensive sequential review study through the generation expansion planning. Renew. Sustain. Energy Rev. 2017, 67, 1369–1394. [Google Scholar] [CrossRef]
- Ringkjøb, H.K.; Haugan, P.M.; Solbrekke, I.M. A review of modelling tools for energy and electricity systems with large shares of variable renewables. Renew. Sustain. Energy Rev. 2018, 96, 440–459. [Google Scholar] [CrossRef]
- Van Stiphout, A.; De Vos, K.; Deconinck, G. The Impact of Operating Reserves on Investment Planning of Renewable Power Systems. IEEE Trans. Power Syst. 2017, 32, 378–388. [Google Scholar] [CrossRef]
- Aghaei, J.; Akbari, M.A.; Roosta, A.; Gitizadeh, M.; Niknam, T. Integrated renewable-conventional generation expansion planning using multiobjective framework. IET Gener. Transm. Distrib. 2012, 6, 773–784. [Google Scholar] [CrossRef]
- Jirutitijaroen, P.; Singh, C. Reliability and cost tradeoff in multiarea power system generation expansion using dynamic programming and global decomposition. IEEE Trans. Power Syst. 2006, 21, 1432–1441. [Google Scholar] [CrossRef]
- Gorenstin, B.G.; Campodonico, N.M.; Costa, J.P.; Pereira, M.V.F. Power System Expansion Planning Under Uncertainty. IEEE Trans. Power Syst. 1993, 8, 129–136. [Google Scholar] [CrossRef] [Green Version]
- Løken, E. Use of multicriteria decision analysis methods for energy planning problems. Renew. Sustain. Energy Rev. 2007, 11, 1584–1595. [Google Scholar] [CrossRef]
- Bucksteeg, M.; Niesen, L.; Weber, C. Impacts of dynamic probabilistic reserve sizing techniques on reserve requirements and system costs. IEEE Trans. Sustain. Energy 2016, 7, 1408–1420. [Google Scholar]
- Zhou, Z.; Botterud, A. Dynamic scheduling of operating reserves in co-optimized electricity markets with wind power. IEEE Trans. Power Syst. 2014, 29, 160–171. [Google Scholar] [CrossRef]
- Bruninx, K.; Van den Bergh, K.; Delarue, E.; D’haeseleer, W. Optimization and allocation of spinning reserves in a low-carbon framework. IEEE Trans. Power Syst. 2015, 31, 872–882. [Google Scholar] [CrossRef] [Green Version]
- De Vos, K.; Stevens, N.; Devolder, O.; Papavasiliou, A.; Hebb, B.; Matthys-Donnadieu, J. Dynamic dimensioning approach for operating reserves: Proof of concept in Belgium. Energy Policy 2019, 124, 272–285. [Google Scholar] [CrossRef]
- Qiu, T.; Xu, B.; Wang, Y.; Dvorkin, Y.; Kirschen, D.S. Stochastic Multistage Coplanning of Transmission Expansion and Energy Storage. IEEE Trans. Power Syst. 2017, 32, 643–651. [Google Scholar] [CrossRef]
- Ghofrani, M.; Arabali, A.; Etezadi-Amoli, M.; Fadali, M.S. A framework for optimal placement of energy storage units within a power system with high wind penetration. IEEE Trans. Sustain. Energy 2013, 4, 434–442. [Google Scholar] [CrossRef]
- Soares, A.; Perez, R.; Morais, W.; Binato, S. Addressing the Time-Varying Dynamic Probabilistic Reserve Sizing Method on Generation and Transmission Investment Planning Decisions. arXiv 2019, arXiv:1910.00454. [Google Scholar]
- Poncelet, K.; Delarue, E.; Duerinck, J.; Six, D.; D’haeseleer, W. The Importance of Integrating the Variability of Renewables in Long-Term Energy Planning Models. TME Working Paper—Energy and Environment. 2014, pp. 1–18. Available online: https://www.mech.kuleuven.be/en/tme/research/energy_environment/Pdf/wp-importance.pdf (accessed on 1 September 2021).
- International Renewable Energy Agency. Planning for the Renewable Future: Long-Term Modelling and Tools to Expand Variable Renewable Power in Emerging Economies. 2017. Available online: https://www.irena.org/publications/2017/Jan/Planning-for-the-renewable-future-Long-term-modelling-and-tools-to-expand-variable-renewable-power (accessed on 1 September 2021).
- Pineda, S.; Morales, J.M. Chronological time-period clustering for optimal capacity expansion planning with storage. IEEE Trans. Power Syst. 2018, 33, 7162–7170. [Google Scholar] [CrossRef]
- Rockafellar, R.T.; Uryasev, S. Optimization of Conditional Value-at-Risk. The Magazine of the Fine Arts, 2 January 1999; 1–26. [Google Scholar]
- Noakes, D.J.; McLeod, A.I.; Hipel, K.W. Forecasting monthly riverflow time series. Int. J. Forecast. 1985, 1, 179–190. [Google Scholar] [CrossRef]
- Dias, J.A.; Machado, G.; Soares, A.; Garcia, J.D. Modeling Multiscale Variable Renewable Energy and Inflow Scenarios in Very Large Regions with Nonparametric Bayesian Networks. arXiv 2020, arXiv:2003.04855. [Google Scholar]


| Technology | Existing Installed Capacity (GW) |
|---|---|
| Hydro | 119.0 |
| Biomass | 18.2 |
| Wind | 28.5 |
| Solar | 9.7 |
| Diesel | 0.0 |
| Nuclear | 3.4 |
| Natural Gas | 27.2 |
| Fuel Oil | 1.2 |
| Coal | 3.4 |
| Technology | CAPEX (USD/kW) | OPEX (USD/kW·Year) |
|---|---|---|
| Wind | 1385 | 28 |
| Solar | 1108 | 14 |
| Biomass | 1108 | 25 |
| Open-cycle gas turbine | 720 | 75 |
| Close-cycle gas turbine (pre-salt) | 831 | 47 |
| Close-cycle gas turbine (LNG) | 942 | 47 |
| Candidate | Gas Price 1 (USD/MMBtu) | Heat Rate (MMBtu/MWh) | Operating Cost 2 (USD/MWh) | Flexibility |
|---|---|---|---|---|
| Open-cycle gas turbine | 12.60 | 8.50 | 138.50 | Flexible |
| Combined-cycle gas turbine (pre-salt) | 3.00 | 6.00 | 25.05 | Baseload |
| Combined-cycle gas turbine (LNG) | 6.80 3 | 6.00 | 54.22 | Flexible |
| Technology | Capacity MW | De-rating Factor for Firm Capacity % Available Capacity |
|---|---|---|
| Wind | 100 | 45% |
| Solar | 100 | 29% |
| Biomass | 100 | 55% |
| Open-cycle gas turbine | 200 | 95% |
| Close-cycle gas turbine (pre-salt) | 500 | 95% |
| Close-cycle gas turbine (LNG) | 500 | 95% |
Publisher’s Note: MDPI stays neutral with regard to jurisdictional claims in published maps and institutional affiliations. |
© 2021 by the authors. Licensee MDPI, Basel, Switzerland. This article is an open access article distributed under the terms and conditions of the Creative Commons Attribution (CC BY) license (https://creativecommons.org/licenses/by/4.0/).
Share and Cite
Nazaré, F.; Barroso, L.; Bezerra, B. A Probabilistic and Value-Based Planning Approach to Assess the Competitiveness between Gas-Fired and Renewables in Hydro-Dominated Systems: A Brazilian Case Study. Energies 2021, 14, 7281. https://doi.org/10.3390/en14217281
Nazaré F, Barroso L, Bezerra B. A Probabilistic and Value-Based Planning Approach to Assess the Competitiveness between Gas-Fired and Renewables in Hydro-Dominated Systems: A Brazilian Case Study. Energies. 2021; 14(21):7281. https://doi.org/10.3390/en14217281
Chicago/Turabian StyleNazaré, Felipe, Luiz Barroso, and Bernardo Bezerra. 2021. "A Probabilistic and Value-Based Planning Approach to Assess the Competitiveness between Gas-Fired and Renewables in Hydro-Dominated Systems: A Brazilian Case Study" Energies 14, no. 21: 7281. https://doi.org/10.3390/en14217281