Article

Preparing the Ecuador’s Power Sector to Enable a Large-Scale Electric Land Transport

1
Renewable and Sustainable Energy Systems, Technical University of Munich, Lichtenbergstr. 4a, 85748 Garching bei München, Germany
2
Departamento de Ingeniería Mecánica, Escuela Politécnica Nacional, Ladrón de Guevara E11-253, Quito 170525, Ecuador
3
Department of Mechanical Engineering, Universidad San Francisco de Quito, Diego de Robles y Vía Interoceánica, Campus Cumbayá, Quito 170901, Ecuador
4
b4Future, Guangüiltagua N37-266, Quito 170528, Ecuador
*
Author to whom correspondence should be addressed.
Département Sciences Pour L’ingénieur, Université de Perpignan, École Doctorale 305, 52 Avenue Paul Alduy, 66100 Perpignan, France.
Energies 2021, 14(18), 5728; https://doi.org/10.3390/en14185728
Submission received: 19 July 2021 / Revised: 31 August 2021 / Accepted: 6 September 2021 / Published: 11 September 2021
(This article belongs to the Special Issue Energy Planning)

Abstract

:
The Ecuador’s expansion plans for the power sector promote the exploitation of hydro power potential, natural gas and a small share of alternative renewable energies. In 2019, electricity generation reached 76.3% from hydroelectric power, 21.9% from thermal plants and 1.8% from other renewable resources. Although the power energy mix is mainly based on renewable technologies, the total energy demand is still dependent on fossil fuels, which is the case of the transport sector that alone accounted for 50% of the total primary energy consumed in the country. This paper analyzes the pathway to develop a clean and diversified electricity mix, covering the demand of three specific development levels of electric transportation. The linear optimization model (urbs) and the Ecuador Land Use and Energy Netwrok Analysis (ELENA) are used to optimize the expansion of the power system in the period from 2020 to 2050. Results show that reaching an electricity mix 100% based on renewable energies is possible and still cover a highly electrified transport that includes 47.8% of land passenger, and 5.9% of land freight transport. Therefore, the electrification of this sector is a viable alternative for the country to rely on its own energy resources, while reinforcing its future climate change mitigation commitments.

1. Introduction

To prevent the worst climatic events, all countries of the world must contribute to the reduction of greenhouse gases (GHG) emissions as was agreed on the Paris Conference in 2015. The Paris Agreement set the goal of keeping the global warming well below 2 °C above pre-industrial levels and even more ambitious to 1.5 °C until the end of this century. To accomplish this, national efforts and pledges are established and published in the so-called National Determined Contributions (NDCs). The emissions gap for 2030-defined as the difference between global total GHG emissions from least-cost scenarios that keep global warming to 2 °C, 1.8 °C, or 1.5 °C, and the estimated global total GHG emissions resulting from a full implementation of the NDCs shows that current unconditional NDCs falls short 15 GtCO 2 e q by 2030 compared with the 2 °C scenario, and by about 32 GtCO 2 e q compared with the 1.5 °C scenario. Despite the emissions reduction by about 7% in 2020 compared with 2019 due to the COVID-19 outbreak, the GHG atmospheric concentration continues to rise, which means that the pandemic offered only a short-term reduction with negligible effect by 2030 unless countries pursue a strong post-pandemic recovery process, including a long term deep decarbonization towards net-zero GHG emissions [1].
The transport sector is a major contributor to GHG emissions, as it was responsible for 23% of global energy-related CO 2 emissions in 2014, 72% of which were produced by road transport as was reported by the 5th IPCC Assessment Report [2]. Additionally, it is the fastest-growing sector in terms of emissions and the least diversified energy end-use sector, consuming 65% of global oil in 2018 [3,4]; however, only 8 of the 47 revised NDC submissions for the period 2020–2025 include specific emissions targets for the transport sector [5].
Some of the decarbonization indicators proposed by the IPCC mitigation pathways are: (i) reduction of the carbon intensity of electricity generation, and (ii) increase the electrification rate in final energy consumption sectors. These pillars are strategic for the energy transition in the land transport sector. Even though in several developing countries there is a significant share of renewable energy for electricity generation, the use of electricity in the transport sector is still minimal [6,7,8]. This is especially true in the Latin American and Caribbean (LAC) region where the stock of battery electric vehicles (BEV) in 2020 represented less than 1% of its global fleet, where Mexico, Brazil and Chile stand out [8]. The LAC region is experiencing the highest growth in car ownership in the world—more than twice the global average of 27% [7]. On the other hand, LAC has the world’s highest per capita bus use and also leads in the implementation of bus rapid transit, with systems present in 54 cities as of 2019 [7]. In LAC there are 2000 electric buses in 2020, this is less than 1% of the region’s fleet. The city of Santiago (Chile) has the largest number of electric buses in the region, followed by Bogotá (Colombia) [6]. In addition, there are specific pilot projects that have implemented small fleets of institutional electric vehicles or taxis, and free electric chargers in shopping centers or parks in the main cities of the region [7,8,9].
Following the broad trends of rapid urbanization and increase of private car share in Latin-American countries [10], Ecuador has witnessed a growth of 161% of road transport vehicles (including freight vehicles) between 2008 to 2018 [11]. According to the most recent official national GHG inventory (2012), this sector contributed with 21% of total national emissions [12], and has historically been the most energy-consuming sector in Ecuador. In 2019, it represented almost 50% of the 94 million barrels of oil equivalent (BOE) of the total energy consumed in the country. The road transport is by far the most used mode of transport, accounting for almost 95% of the sectorial energy consumption. In the same year, the use of electricity in the transport sector accounted for 0.02% of final energy consumption [13], which is explained by the operation of a trolley BRT system in Quito. There is much expectation for the massive penetration of electric buses in compliance with the Energy Efficiency Law, which mandates that all new urban and inter-municipal buses from 2025 will be electric [14]. Rail transport is virtually nonexistent, and due to the size of the country (283,560 km 2 ) air transport is not a viable option for local freight. Heavy freight and passenger vehicles consumed 47% and 27% of the land transport energy demand respectively [13]. In the same year, it consumed 83% of the diesel and 76% of gasoline required in the country; moreover, in the last decade (2009–2019), the consumption of diesel and gasoline in the transport sector has increased in 74% and 119% respectively [13]. Although these data show the weight of the transport sector on the energy consumption and GHG emissions of the country, it has been disregarded in energy projections and plans, while there are no specific commitments in the NDC [15]. Understanding the implications of the future large-scale development of land electric transportation in Ecuador is a challenge that has been little explored [16].
According to the Ecuadorian Electrification Master Plan (PME), the deployment of hydropower will be the priority to supply the future electricity demand, complemented with natural gas for the dry season; whereas the solar, wind, biomass and geothermal deployment will continue at minimal levels [17]. In 2019, the electricity generation reached 76.3% from hydropower, 21.9% from thermal plants (diesel, natural gas, heavy oil), and 1.8% from solar, wind, and biomass resources. In the last ten years (2009–2019), the hydropower installed capacity increased from 2.1 GW to 5.1 GW, whereas, the installed capacity of other renewable energy technologies just increased from 109 MW to 193 MW in the same period [13]. However, this strategy does not take fully into account the vulnerability to climate change due to the possible high or low hydropower availability scenarios [18,19,20,21,22,23,24].
At global scale, there are several academic studies discussing the impacts of stringent decarbonization scenarios with large participation of electric land transport [25,26,27]. There are less studies focusing on developing countries. For example for LAC region, Gils et al. [28] studied the feasibility of a 100% renewable energy power system in Brazil through sector coupling and regional development; Sauer et al. [29] analyzed the strengths and opportunities of developing in Bolivia and Paraguay a large industry of electric vehicles with Li-ion battery by taking advantage of the mineral potential and the availability of hydroelectricity of both countries, respectively; Meza et al. [30] discussed about the transformation of the Nicaraguan energy mix towards 100% renewable to support the electric mobility development; Lallana et al. [31] presented the required transformation of the productive matrix in Argentina to achieve decarbonization goals with large share of electric vehicles; and, finally, Godínez-Zamora et al. [32] assessed decarbonization scenarios and electrification of the transport sector in Costa Rica. The development of electric transportation in developing countries should also analyze the reliability in the operation of the whole transport system [33], innovation to develop smart urban electric transport systems based in electric car sharing [34], participation of citizens to guarantee governance and transparency [35,36], conditions to attract foreign direct investments and its macro-economic impacts in terms of job creation and participation of local industries [37,38,39], and other Political Economy related topics [40,41].
From the literature review, we did not identify scientific publications that analyse the impact on the operation of the Ecuadorian national interconnected power system (SNI) due to a large development of electric land transportation. Although there are few publications presenting analysis of the long-term expansion of the energy system in Ecuador [16,17,18] and its economic and social impacts [42], there are no scientific publications where detailed power system operating criteria is considered for the calculation of the long-term expansion of the national power system in scenarios with large use of electric mobility. This work helps fill this gap in two ways: (i) it analyses long-term scenarios of massive participation of electric vehicles in Ecuador; (ii) the modelling framework considers detailed power system operating criteria, which are considered for the calculation of the long-term expansion of the national power system. This without counting on the soft-link with an integrated model of the entire energy sector that provides final energy demands for the transportation sector.
In line with the IPCC report on Mitigation Pathways Compatible with 1.5 °C, in this study we adopted a systemic approach for analyzing the inter-dependencies between end-use sectors and energy-supply [3]. In this sense, an electrified, low-emission transport sector could be achieved only if structural changes are applied to the energy matrix at a proper pace, balancing the introduction of renewable energy technologies and the phasing out of fossil-based power generation. Therefore, we analyze three scenarios with different degrees of electrification in the transport sector by 2050, which adds to the electricity demand of the other sectors. Additionally, we also included technology-focused measures (energy efficiency and fuel switching), as well as structural changes on the transport activity; the former contributes to the reduction of CO 2 emissions, while the latter to the reduction of energy consumption [3].
Although Ecuador contributes with a minimal part of the global GHG emissions, it cannot remain on the side-lines of the economic, technological and social opportunities that arise from sustainable and low carbon strategies for a post-pandemic and post-extractivist future [43,44]. This study seeks to understand to what extent and under what conditions renewable energy can suply electricity demand until 2050 in a context of transport decarbonization in Ecuador, and, at the same time, how they can complement each other to generate reliable and affordable electricity.
The document is structured as follows: Section 2 details the methods including the description of ELENA and urbs models, a presentation of the three analyzed scenarios, the detailed modeling of the Ecuadorian power sector using urbs, and finally, the model validation. Section 3 presents the results and discussion about the expansion of the power system by 2050 for the three scenarios and provides recommendations for future research works. Section 4 contains the main conclusions of this work. Finally, Section 5 presents the future works lied to the results.

2. Methods

2.1. Modeling Tools: urbs And Elena

2.1.1. Linear Optimization Model for Distributed Energy Systems (urbs)

The Ecuadorian power system was modelled using urbs, which is an open-source linear optimization-modeling framework for capacity expansion and unit commitment analyses developed by the Chair of Renewable and Sustainable Energy Systems at Technical University of Munich (ENS-TUM). It minimizes the annual energy system costs, including all investment costs by their annualized depreciation, as well as the operational and environmental costs. Furthermore, it allows the integration of multiple input and output commodities resulting in detailed representations of the energy conversion processes. urbs has a high temporal resolution (8760 h per year) that allows the visualization of the chronological behavior of supply and demand. This model ensures that the required demand is covered by the input commodities and technological processes at every time step. Energy and power capacities are expanded independently; however, a linear dependence between them is integrated [45,46,47]. The urbs toolchain is presented in Figure 1.

2.1.2. Ecuador Land Use and Energy Network Analysis Model (Elena)

The Ecuador Land Use and Energy Network Analysis (ELENA) model is an application of the MESSAGE platform [49] for Ecuador [16]. ELENA model assesses the expansion of the energy and land occupancy systems, and its greenhouse gases (GHG) emissions evolution up to 2050. It is a partial equilibrium, integrated, perfect foresight, linear programming optimization model. The objective function is the total cost of the energy-land system expansion up to 2050. The analysis period is 2015 to 2050 (8 steps), the year has 60 time steps (monthly with 5-periods daily). The model considers three geographical regions in Ecuador: Coast, Andes and Amazon. To model the energy sector, ELENA considers the whole energy conversion chain, from primary energy to useful energy in five economic sectors, including transport [16]. For the land occupancy system, it calculates the land use changes according to the food demand and deforestation/reforestation scenarios up to 2050. Useful energy, food demands and deforestation/reforestation scenarios are exogenously calculated. The model includes a wide variety of technologies, each with its capital cost, O&M cost, efficiency, lifetime and other operational information. ELENA was developed during the Deep Decarbonization Pathways in Latin America and the Caribbean (DDP-LAC) project [9], with the support of the Cenergia Lab from the Federal University of Rio de Janeiro (COPPE/UFRJ) [50]. A detailed description of the model structure, mathematical approach and its data base is available in [16].

2.1.3. urbs and Elena Interaction

The ELENA and the urbs models are soft linked. In the present work the integrated assessment model ELENA was used to evaluate several scenarios with different commitment levels for decarbonization of the energy matrix of Ecuador. Each scenario was supported with a narrative that include not only environmental and technological restrictions but also behavioural changes from the demand perspective. urbs uses the transport final energy demand calculated with ELENA as input for computing the expansion of the power system until 2050. On the one hand, the scenario with no restrictions (minimal cost scenario) developed in [16] was used as input for the least cost scenario (LC) in the urbs model. On the other hand, the scenario with a stringent emission cap to maintain the country development in the path of 1.5 °C above pre-industrial levels determined by the IPCC (deep decarbonization scenario), presented in [16] was used to build the moderate (Mod) and the deep decarbonization pathway (DDP) scenarios. To ensure that the scenarios are compatible with an emission reduction trend of 1.5 °C, the ELENA model uses as constraint a carbon budget calculated with the COFFEE model. The methodological details for this calculation can be found in [16]. The three scenarios will be described in the next section. A scheme showing the interaction between the models is depicted in Figure 2.

2.2. Scenarios Definition

The scenarios used in this work are based on the National Energy Forecast [51], which assesses the Ecuadorian energy development until 2050 following a set of policies described in the Ecuadorian Master Electricity Plan (PME), the National Energy Agenda and the National Plan of Energy Efficiency (PLANEE). The set of premises used are presented in Table 1.
First, the National Energy Agenda proposes to use the hydropower potential to make it the main electricity source with at least 70% of the total power generation by 2040 [52]. Second, following that direction, the PME has planned by 2027 to incorporate 360 MW from hydropower, 410 MW of PV, wind, and geothermal projects, and 187 MW of combined cycle power plants [17]. Finally, the National Plan of Energy Efficiency (PLANEE) introduces a number of actions to improve energy consumption by incorporating energy efficiency measures in the energy supply and demand sectors. The detailed description of these measures can be found in [53].

2.2.1. Least Cost Scenario (LC)

From the demand side, the premise that characterized the LC scenario is the small change on the electricity consumption behavior in the residential, industrial, commercial, and transport sectors compared the base year 2019. The energy efficiency policies detailed in the PLANEE are not considered. Regarding to the transport sector, it presents an increase in the private mobility participation, no changes in the non-motorized share, and a minimal electrification share. In the supply side, the expansion plan proposed by the PME until 2027 is not considered. The objective of this scenario is looking for the minimum cost power system expansion that satisfies the future electricity demand.

2.2.2. Moderate Scenario (Mod)

The Mod scenario considers the same demand in the residential, industrial, and commercial sector as in the LC scenario; however, it includes the development of basic industries such refineries, shipbuilding, petrochemicals, and metallurgy (iron and steel) as a new electricity demand sector [54]. The transport sector presents significant reductions in the private mobility, and an increase in the non-motorized mobility share compared with the LC scenario. Moreover, the energy sources for the land transport are diesel, gasoline, natural gas, and electricity. In the supply side, this scenario is in line with the current energy policies for the power system expansion considered in the PME by 2027. It follows the same path for the expansion power system until 2050 with big participation of hydropower complemented with natural gas, and small participation of non conventional renewable technologies.

2.2.3. Deep Decarbonization Pathways Scenario (DDP)

The DDP scenario considers a bigger electrification rate in the consumer sectors compared with the LC and Mod scenarios due to the inclusion of the energy efficiency policies detailed in the PLANEE. The private, and public mobility shares, and therefore the energy consumption of the transport sector are the same in the Mod and DDP scenarios, nevertheless, natural gas is no longer a fuel option for transport, and it is replaced with electricity. In the supply side, this scenario gives the opportunity to deploy other renewable technologies through the natural gas constraint. The DDP scenario looks for the diversification of a clean energy mix, and a high rate of electrification in the transport sector.

2.3. Modeling the Ecuadorian Power Sector with urbs and ELENA

2.3.1. Model Structure

urbs consists of several model entities, such as commodities, processes, transmission, and storage. This work considers as commodities the fluctuating natural resources such solar radiation, wind velocity, and basins’ flow rate, each of them with its own set of hourly time series of 8760 time steps. On the other hand, natural gas, diesel, heavy oil, biogas, geothermic, and electricity are considered as stock commodities (not fluctuating in time). Additionally, urbs needs the conversion processes which in the Ecuadorian case are hydropower plants, thermal plants, PV systems, wind farms, geothermal plants, biogas, and bagasse plants, whereas water reservoirs represent the stored commodity. This model considers Ecuador as one node, so we do not take into account the internal transmission lines.
The model needs the following inputs: (i) Total usable area for each specified site; (ii) Energy resources that includes renewable (solar, wind, geothermal, biomass, and biogas) and non-renewable (heavy oil, diesel, and natural gas) resources, as well as the imported electricity and transaction prices; (iii) Technical specifications of each type of power plant such as the installed and the maximum capacities, lifetime, minimum load fraction, maximal power gradient, investment costs, fixed and variable costs; (iv) Electricity demand represented by a set of time series for each analyzed year; and (v) Scenarios described in Section 2.2. The outputs include (i) Database and plots of the power system profile with one hour resolution; (ii) Total installed capacity for every studied year; (iii) Costs of the system during the analyzed period of time; (iv) Detailed data of commodities consumption on each time step. The urbs model scheme for the Ecuadorian power system used in this work appears in Figure 3.

2.3.2. Supply Side Modeling

The time period 2019–2050 is simulated as a cascade set-up using the years 2019, 2030, 2040 and 2050. The input data are updated for each simulated year, in this way, the evolution of the Ecuadorian power system for the whole time period is projected. The capacity expansion by technology, the addition of transmission capacity, the integration of storage technologies, the overall generated clean energy, and the total system costs for the representative years are simulated under the three different scenarios.
To start modeling the Ecuadorian power sector, we select 2019 as the base year. The actual electricity delivered to the Interconnected National System (SNI) in this year came from 76.3% of hydroenergy, 21.9% of thermal power generation based on diesel, natural gas, and heavy oil, and 1.8% of renewable resources like biomass, solar, wind, and biogas. Total installed capacity reached 8512 MW, mostly hydropower plants located in the Highlands and in the Amazon region, while thermal plants are mainly located in the Amazon and Coast regions (see Figure 4) [55,56]. For the other modelled years in the Mod, and DDP scenarios, we use the power plant portfolio detailed in the PME by 2027 (see Table 2), and the feasible areas for wind parks and PV systems shown in Figure 5, whereas for the LC scenario the expansion of the power system follows the least cost criteria used by the model.
The urbs model also requires economic data for every technology specified. Figure 6 shows the fluctuation of natural resources such as solar radiation, and wind velocity which are used as time series of availability factors obtained from the online tool Renewables.ninja developed by Pfenninger and Staffell [58]. The availability factors for hydropower plants are based on the average flow rates in the reservoirs of the Ecuadorian hydropower plants.

2.3.3. Demand Side Modeling

In the base year 2019, the residential, industrial, commercial, public lighting, and construction sectors consumed together 21.91 TWh of electricity. In Ecuador, these sectors are known as public service demand; the non-public service demand, mostly represented by oil companies (3.78 TWh consumption), is not considered as demand sector in this work [13]. As urbs needs an exogenous energy demand to be satisfied through the optimization process, we used the transport demand delivered by ELENA, which uses as input the passenger-kilometer (pkm) and ton-kilometer (tkm) data. The details of the transport demand projection are shown in Section 2.3.4, whereas the electricity demand of the other sectors is taken from the National Energy Forecast [51].

2.3.4. Transport

For modeling the transport sector, 2015 is the selected base year. The information for characterizing the vehicle fleet is available in the Statistical Yearbook of Transportation [62]. The total energy consumed by land passengers transport was 79.54 PJ (63.3 PJ of gasoline, and 16.24 PJ of diesel), and the consumption of the freight transport was 82.33 PJ (100% diesel). The activity level of the sector could be represented with the amount of energy and fuels consumed available from [13,63]. Some of the characteristics of the freight and passenger transport are presented in Table 3 and Table 4 respectively.
For the base year, passengers demand is the sum of all the vehicles multiplied by the year-average distance travelled for vehicle type multiplied by the average occupancy rate. The calculation for freight demand is similar, replacing the occupancy rate by the year-average load transported. To calculate the future pkm demand, a projection for the population [64] is used as driver, while the tkm demand is forecasted using the GDP as driver, both are presented in Table 5.
These main drivers are the same for the different scenarios, but the narratives considered for the scenarios are different. In the Mod and DDP scenarios, a reduction of the individual transport is considered in favour of public mass transport modes, whilst the actual growing tendency of private cars is maintained for the LC scenario. Table 3, Table 4 and Table 5 were the inputs for the transport demand projection calculated and shown in [16], which is used as exogenous demand in the present work.
Table 6 shows the energy consumption in PJ for the passengers land transport sector for the analyzed years. The LC scenario shows consistently the biggest energy demand for the analyzed period. Gasoline was the predominant consumed fuel with almost 85 PJ that represents 72.5% of the total energy consumption, far followed by diesel and natural gas with 14.2% and 12.5% respectively. Electricity demand specified for this scenario just represented 0.8% of the total energy consumption for passenger transportation by 2050. In the Mod scenario, the natural gas consumption reached 9.63 PJ, followed by gasoline with 8.9 PJ and diesel with 7.84 PJ. These three fuels represented 82.3%, and electricity 17.7% of the total energy consumption by 2050. For the DDP scenario, natural gas was not considered as fuel for transportation, since it was replaced by electricity. It represented 47.8% of the total energy consumed for passenger land transport by 2050, followed by gasoline and diesel with 27.8% and 24.5% respectively.
Table 7 refers to the freight land transport demand in PJ. Electricity and diesel are the energy sources used in the three scenarios, with no participation neither natural gas nor gasoline. In the LC scenario, diesel represented almost 100% of the total energy consumed by freight land transport by 2050. For the Mod and DDP scenarios there is a small participation of electricity as energy source for the freight transport with 5.9% of the total energy required, the remaining 94.1% corresponds to diesel.
Considering the electricity consumption in Table 6 and Table 7, the total electricity demand of the land transport sector for the LC, Mod, and DDP scenarios are shown in Table 8. The ELENA results presented in Table 8 are added to the electricity demand from the other consumption sectors for each scenario.
Figure 7 shows the total electricity demand used as external input for urbs, from 2020 to 2050. Land transport has a notorious participation in the electricity consumed in Mod and DDP scenarios with 6.3% and 8% respectively by 2050 compared with the 0.4% in the LC. The Mod and DDP scenarios present a marked increase in electricity consumption due to the participation of the so-called basic industries and higher levels of electrification in the residential, industrial, commercial and transport sectors.

2.4. Model Validation

In 2019, the electricity generated by the Ecuadorian power system reached 31.72 TWh [55]. The installed capacity of this year, shown in Table 2, was modelled in urbs and the cost-optimal operation of the system, i.e., how much electricity is generated with each technology at every time step. In this section, there is a comparison between the electricity generation simulation (Base 2019) and the official data from ARCONEL (see Figure 8).
The electricity generation in the urbs model reaches 29.99 TWh, and properly represents the participation of the different technologies compared with the real data. In both mixes, hydropower has the biggest participation in the total power generation with 76.1% and 75.8% in ARCONEL and Base 2019, respectively. Thermal technologies run with heavy oil, diesel, and natural gas, in both mixes, account for 22% of the generation. Power generation from renewable resources (solar, wind, biomass, and biogas) represents 1.8% according to ARCONEL and 2% according to Base 2019. A relative error of 5.4% is observed for the total generation in the urbs model.

3. Results and Discussion

3.1. Analysis of the Transport Sector Energy Demand

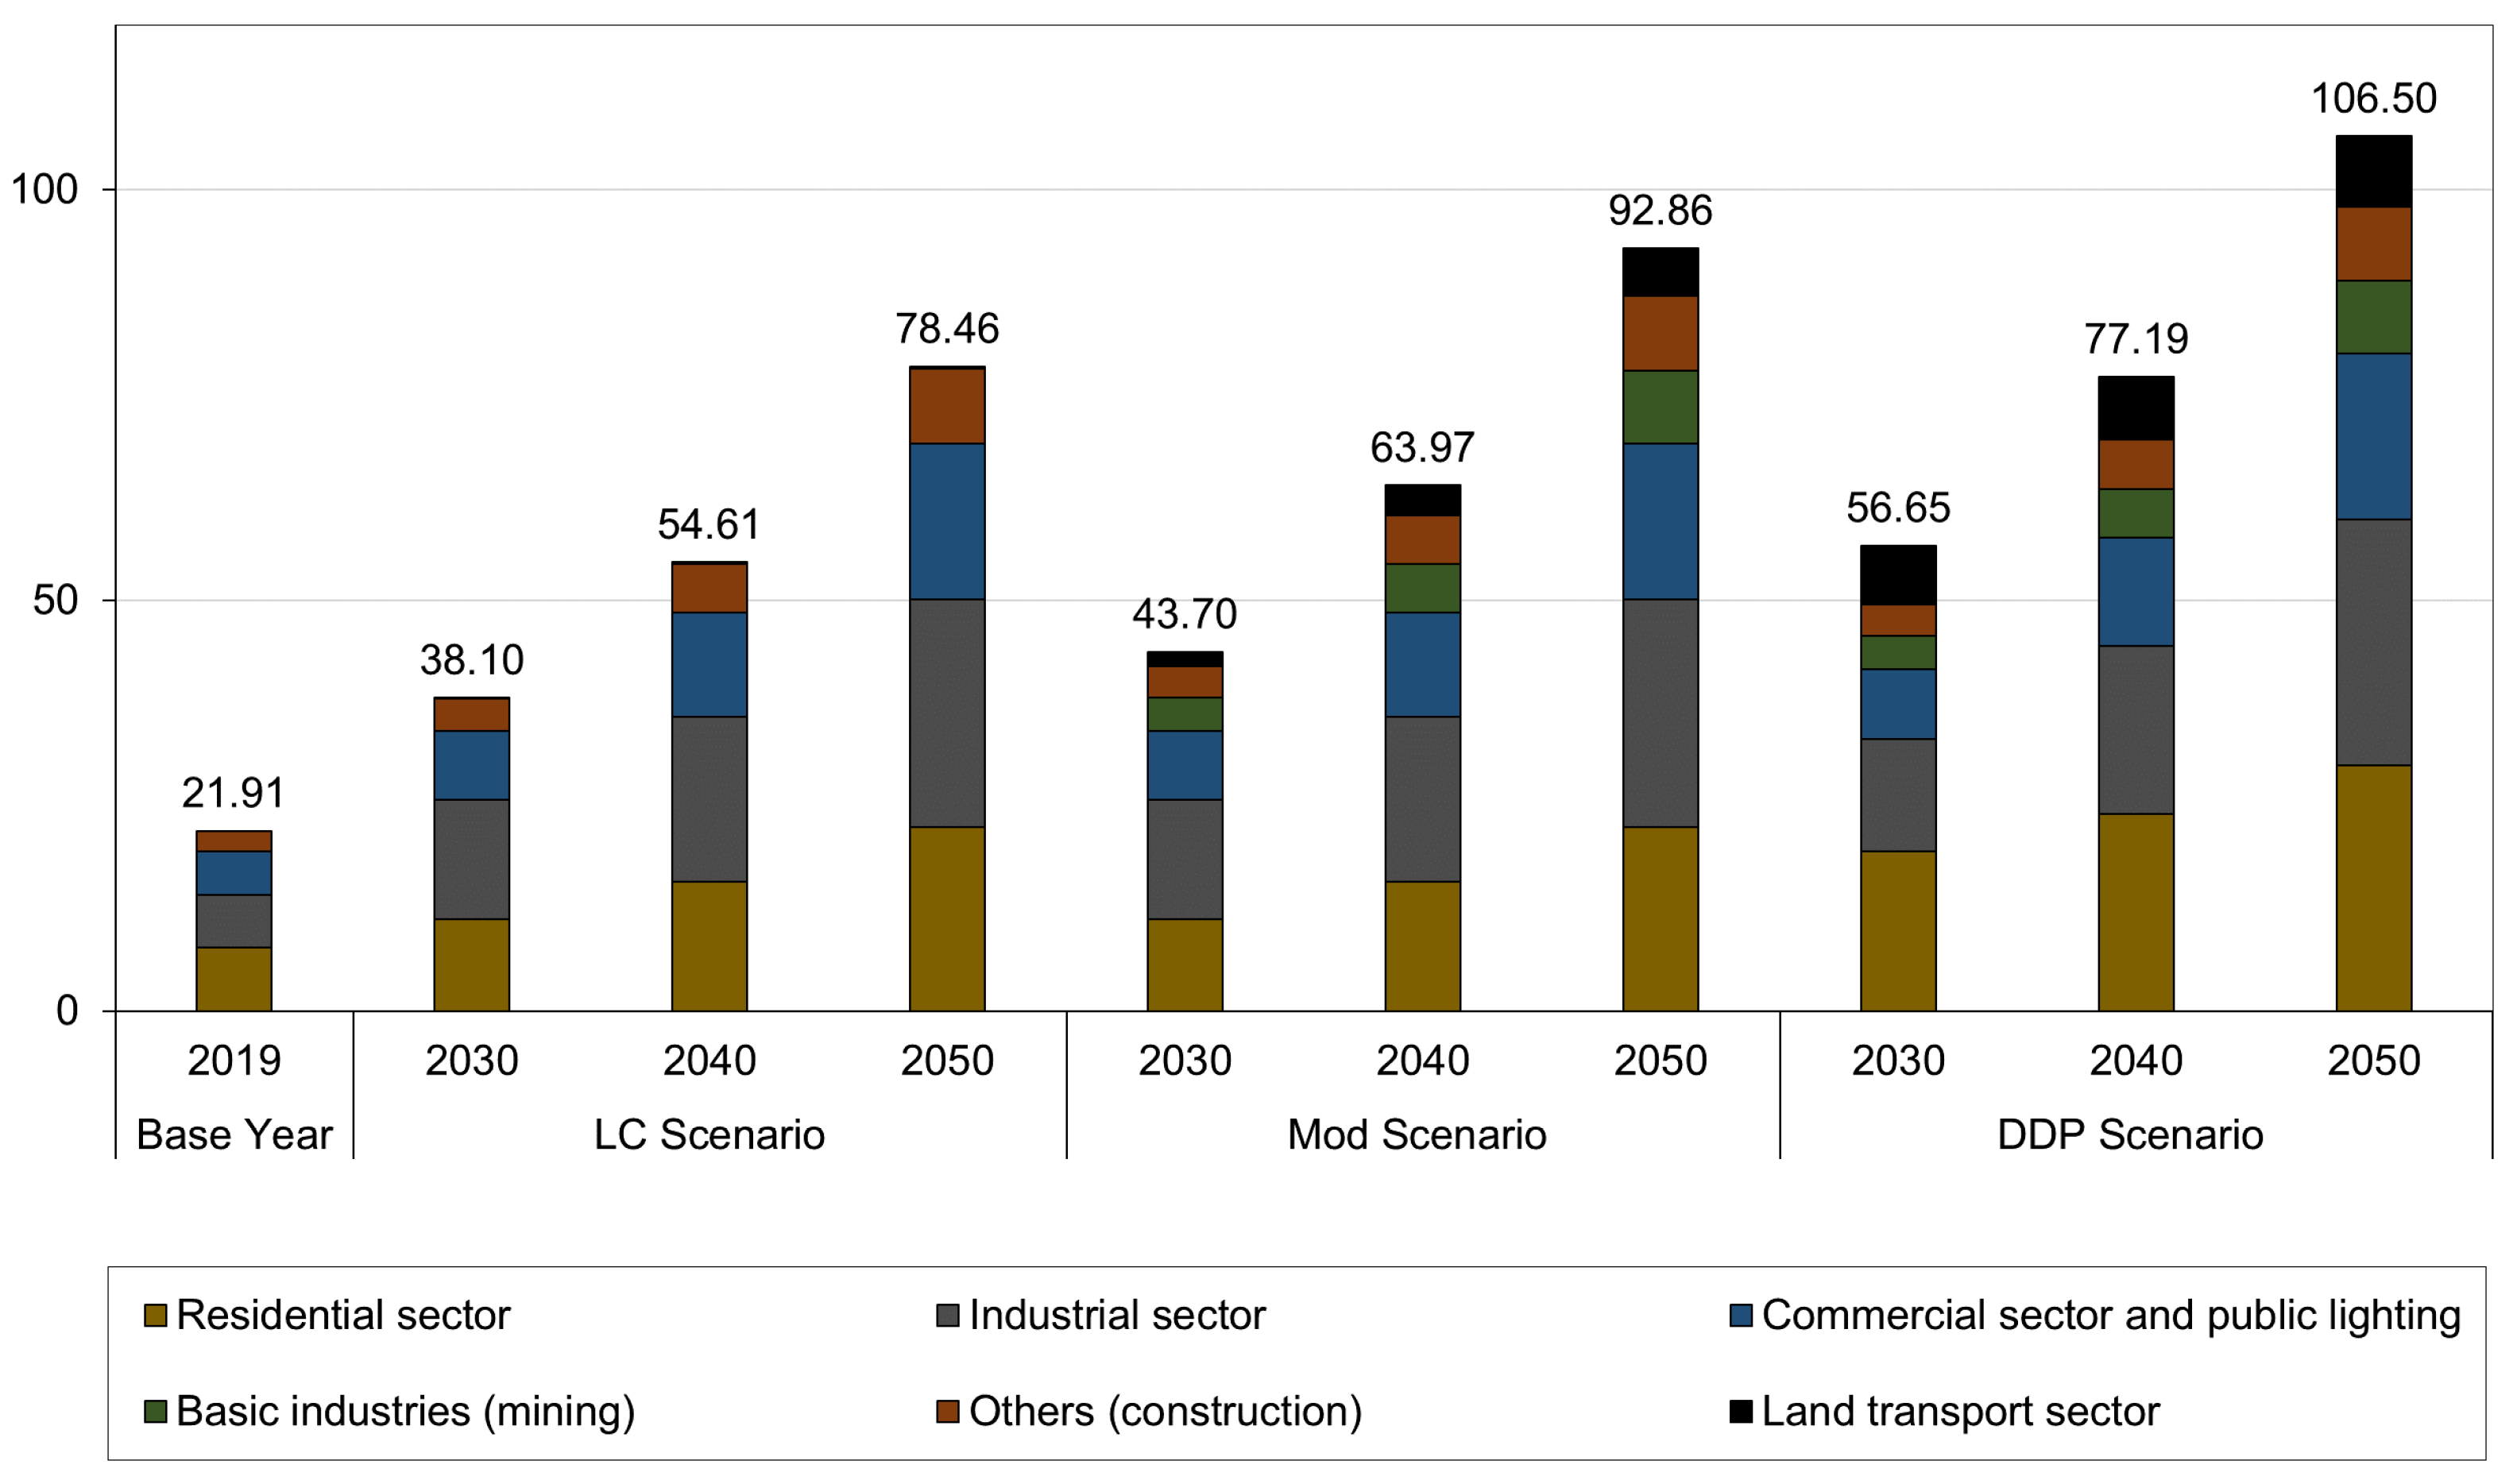
The LC scenario shows a low electrification rate in the land transport sector, reaching only 0.30 TWh by 2050. It follows the current consumption behavior with a big participation of fossil fuels. In the Mod scenario, the electrification of the transport sector reaches 5.86 TWh by 2050, compared with the 0.011 TWh in 2019, but still contains an important share of natural gas as fuel for transport vehicles. The DDP scenario presents an electricity consumption of 8.54 TWh by 2050, which is 2.68 TWh more than the Mod scenario for the same year, with the particularity that natural gas used in the Mod scenario is totally replaced by electricity. Besides the increase of the electrification rate in the Mod and the DDP scenarios, these consider a substantial reduction in the land transport energy demand from 116.92 PJ in the LC scenario to 32.06 PJ by 2050 in the Mod and DDP scenarios (please refer to Table 6).
The results show that electrification of the land passengers transport sector at the levels proposed for each scenario is indeed possible. However, a high electrification of this sector by non-conventional renewable energies is only possible if at the same time final energy demand is reduced, as is the case in the Mod and DDP scenarios. The LC scenario depicts the trend growth of transport, derived from the expected increase in GDP and population, but without considering any measures to restrict the use of private motor vehicles and increase energy efficiency, so that its final consumption is more than three times the demand of the Mod and DDP scenarios. The electrification of the whole LC energy demand for land passengers transport (116.92 PJ) implies that renewable energies would have to be massively deployed and should include battery-based storage systems, which would increase investment costs even above the costs of the other scenarios. Analyzing the electrification of a constantly growing land passengers transport as the only measure of decarbonization was not the scope of this study.
In addition, electricity represents a small part of the total final energy consumption of land freight transport. This is because there are no credible assumptions to consider that electric trucks could enter the Ecuadorian market in the coming decades on a large scale. However, it is observed that in the Mod scenario, the total electricity consumption of land freight transport in 2050 is three times higher than the electricity consumption of passenger transport; while their consumption in the DDP scenario are almost equal, so the contribution of the freight land transport to the electricity demand and its impact on the energy mix cannot be disregarded (see Table 6 and Table 7).

3.2. Installed Capacity and Electricity Generation

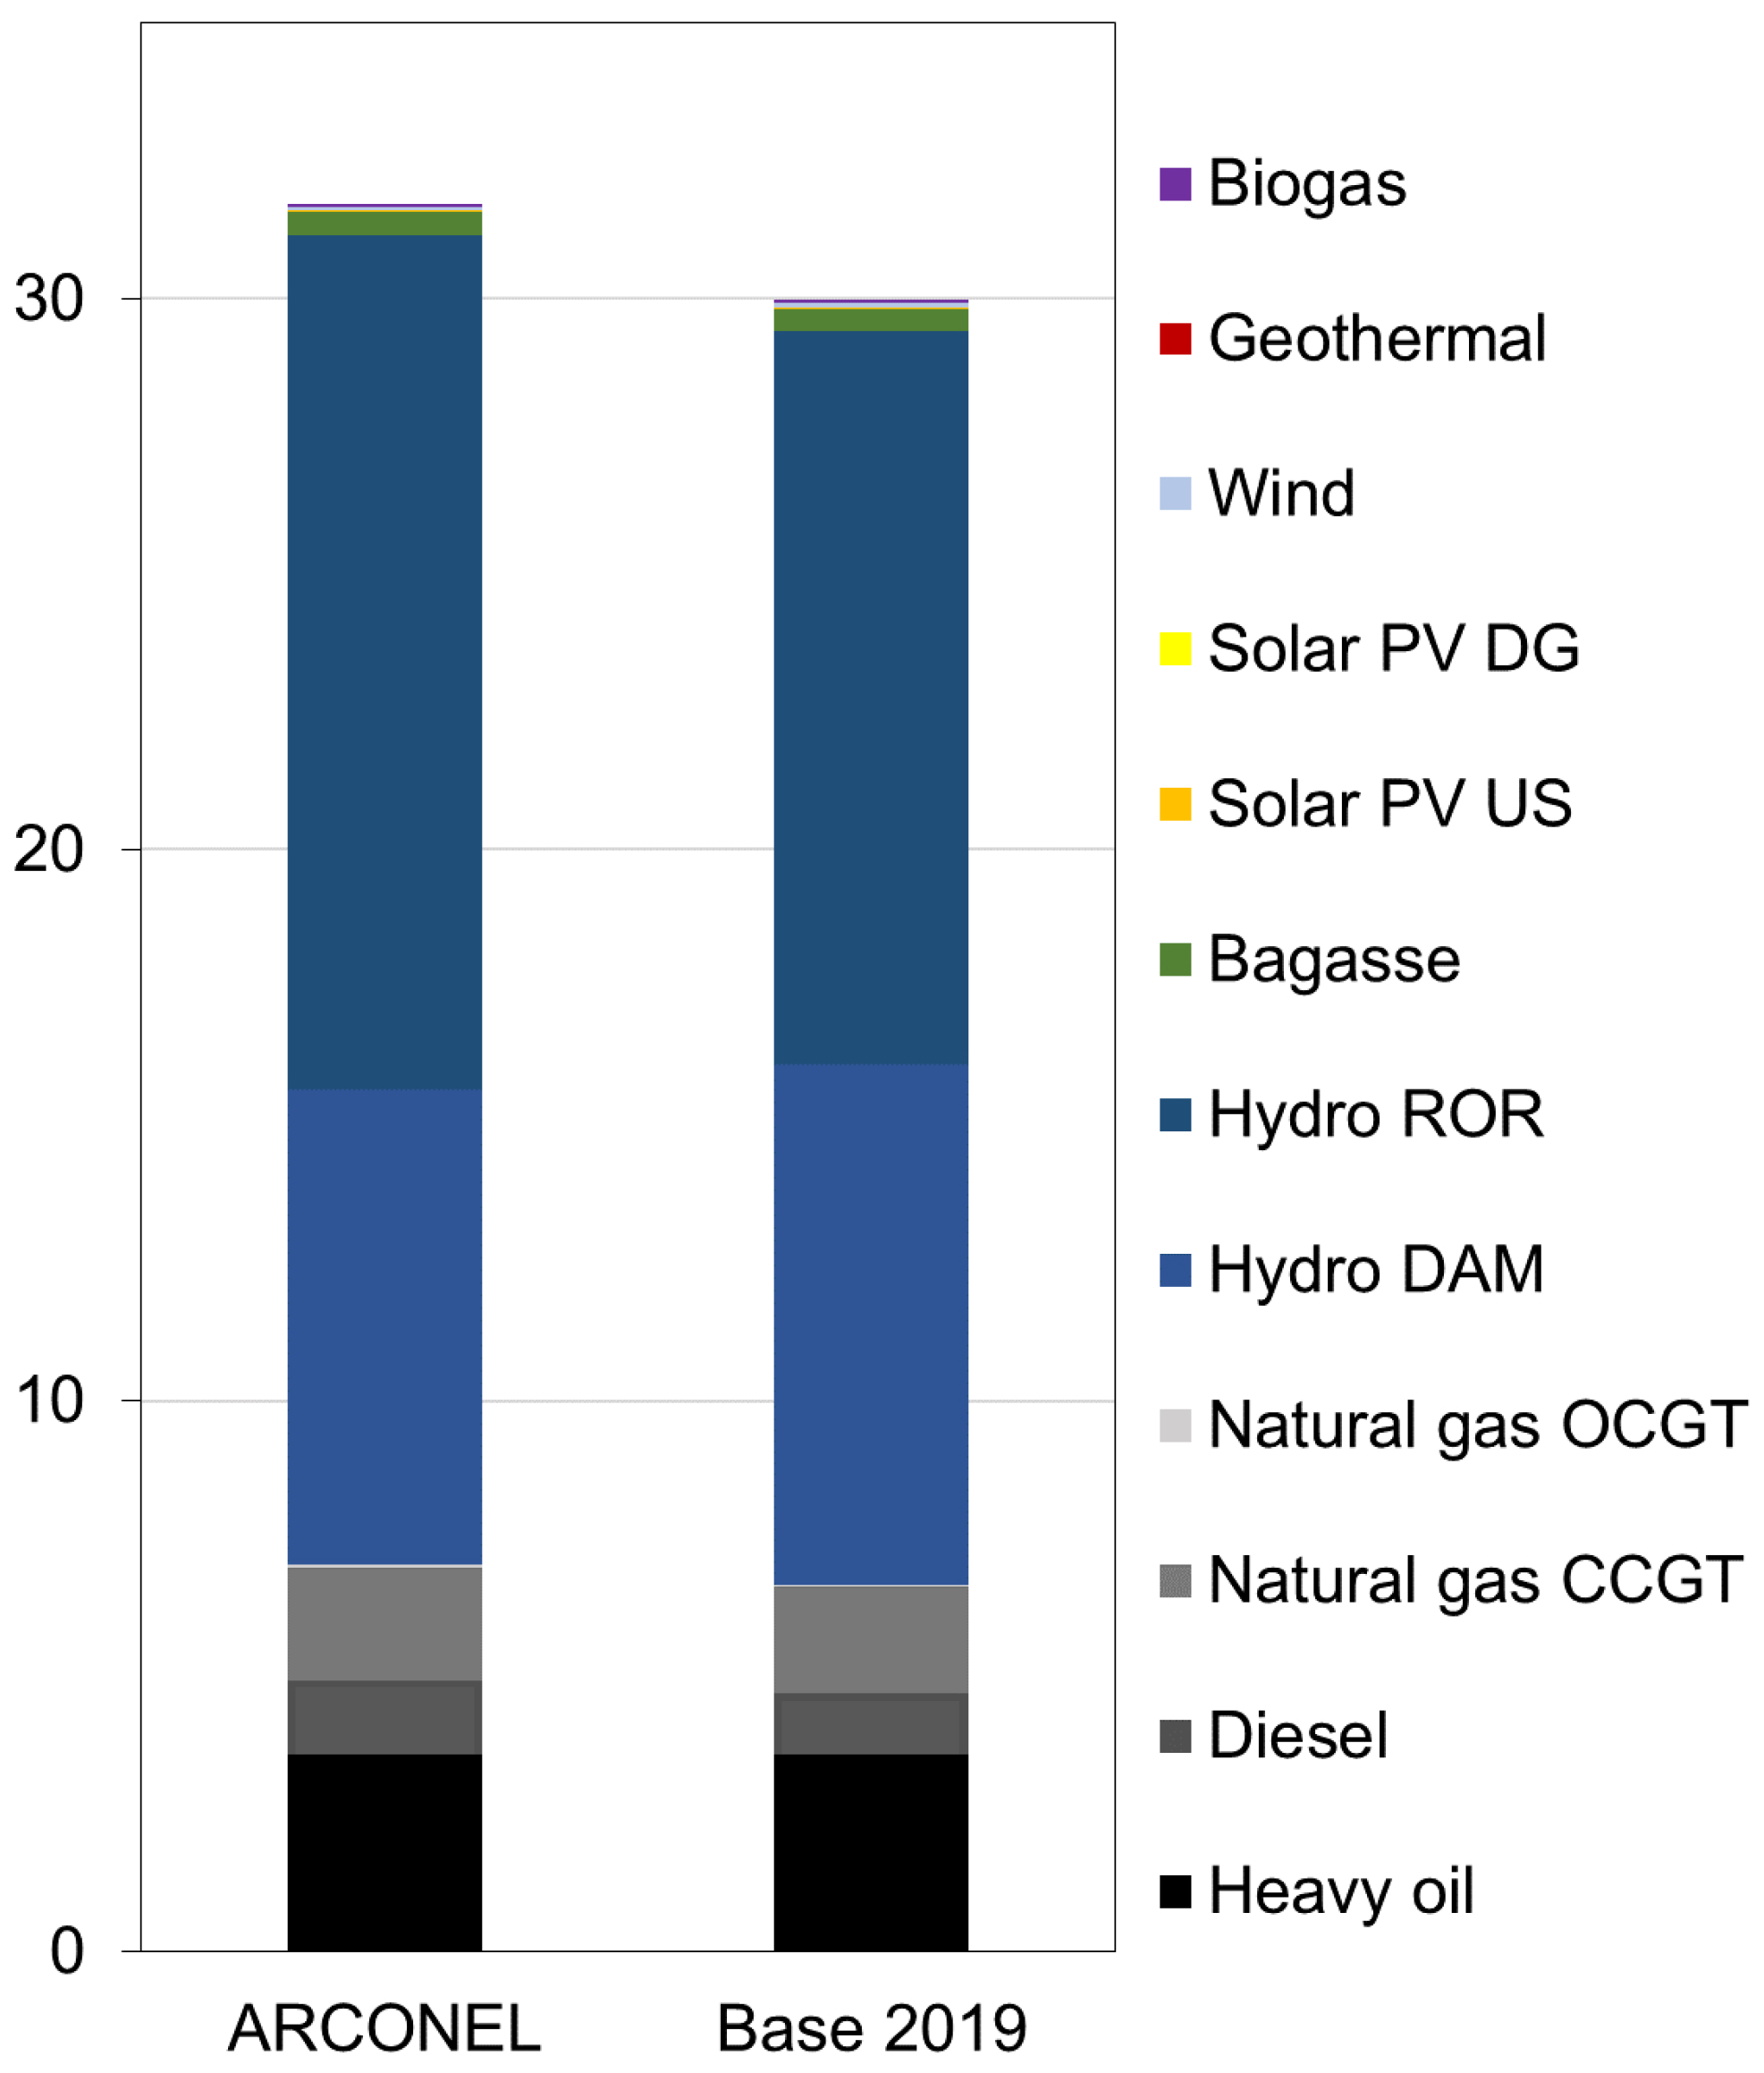
Electricity generation in Ecuador is already highly renewable, with more than 85% generated by hydropower plants; however, the deep electrification of the transport sector is still a challenge, not fully considered in the Ecuadorian energy policies or GHG emission reduction measures.
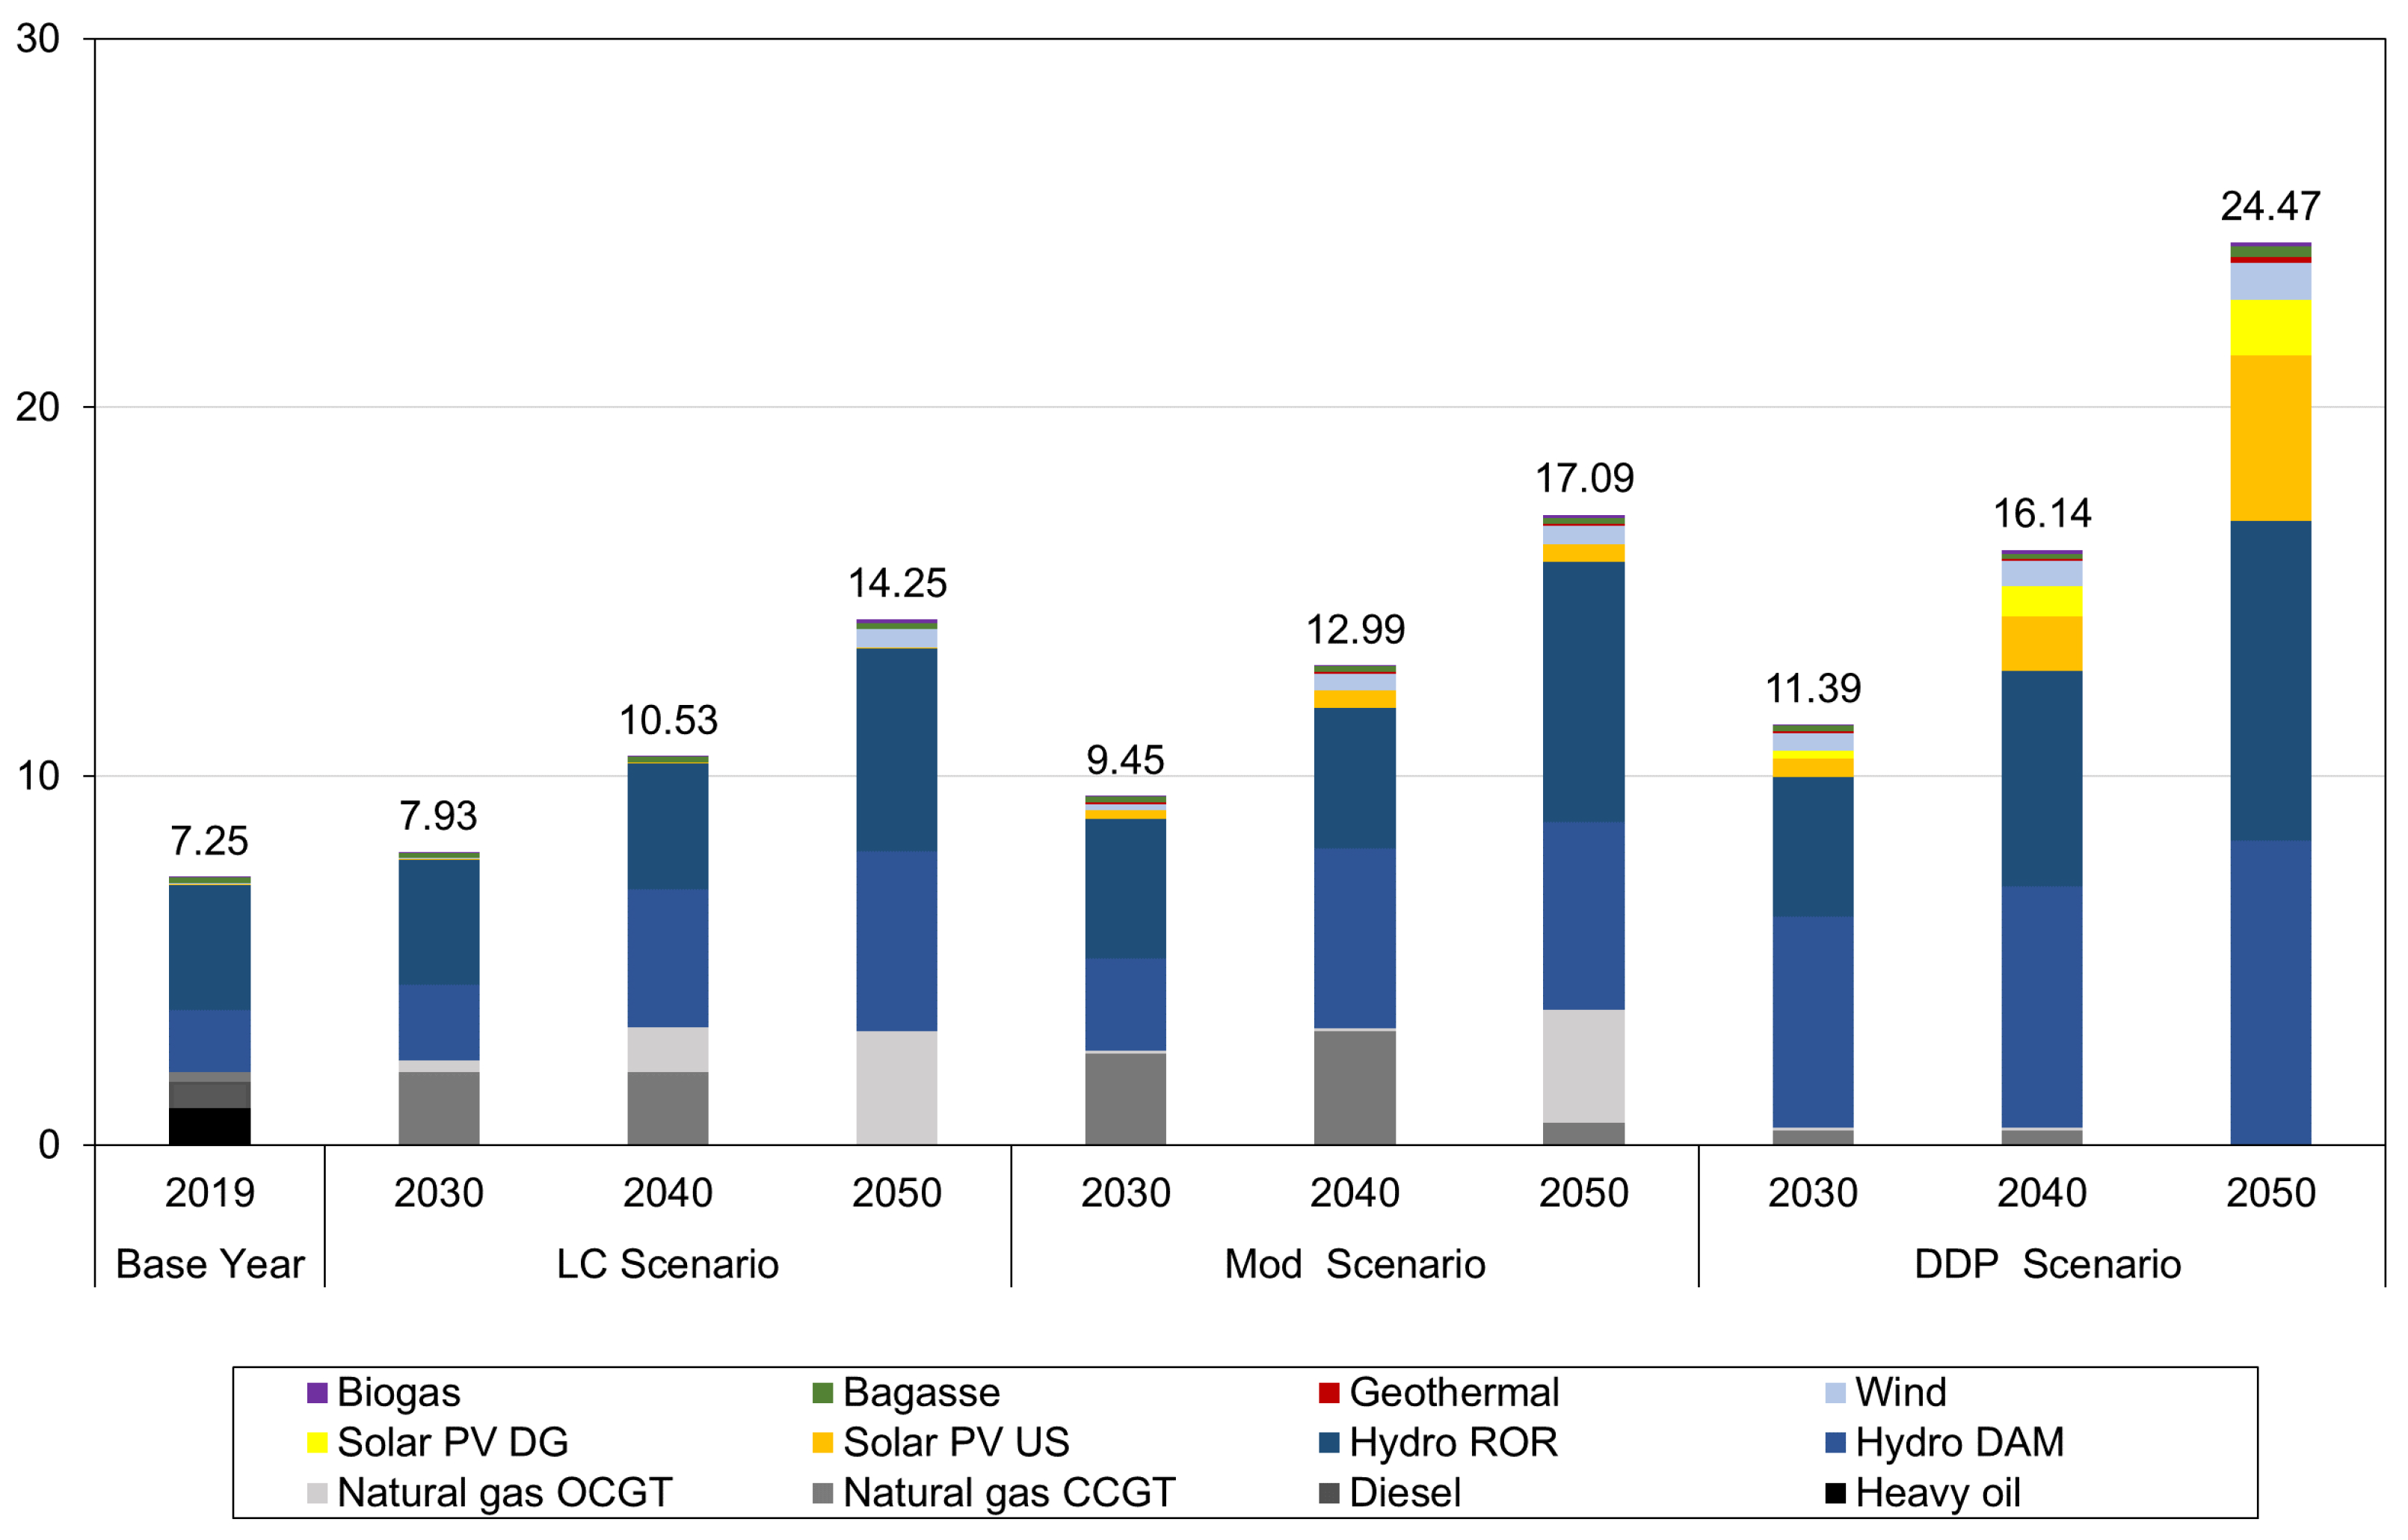
The installed capacity, presented in Figure 9, shows that for the three scenarios, hydropower continues as the least cost clean technology; complemented in the LC and Mod scenarios with natural gas, and in the DDP scenario with a mix of other renewable technologies. In the LC scenario, the installed capacity grows from 7.93 GW by 2030 to 14.25 GW by 2050. During the studied period, natural gas is used to complement hydropower generation, with minimal participation of other renewable technologies. By 2050, hydropower reaches 10.4 GW of installed capacity, followed by 3.08 GW of natural gas, other fuels such diesel and heavy oil are no longer used by 2030, and the deployment of renewables such as solar, wind, geothermal, biomass, and biogas is minimal reaching in total 0.77 GW.
In the Mod scenario, as the demand increases, the installed capacity also grows from 9.45 GW by 2030 to 17.09 GW by 2050. Natural gas complements hydropower during the whole analyzed period, and the participation of other renewables increases compared with the LC scenario. By 2050, hydropower has an installed capacity of 12.14 GW, followed by 3.66 GW of natural gas. Other non-conventional renewables reach 1.29 GW, which is in line with current national policies for the power system expansion stated in the Ecuadorian Master Electricity Plan.
The deployment of renewable energies, especially solar energy, in the DDP scenario replaces the expansion of natural gas power plants since 2030 and phases them out by 2050. PV-US technology reaches 4.5 GW, PV-DG 1.50 GW, wind farms 1 GW, bagasse 0.3 GW, geothermal 0.15 GW, and biogas 0.1 GW, all together represent 30.86% of the total installed capacity in the Ecuadorian power system; hydropower has the remaining 69.14%. In this scenario, by 2030 the energy mix reaches 95.94% based on renewable energies, 97.13% by 2040, and 100% by 2050.
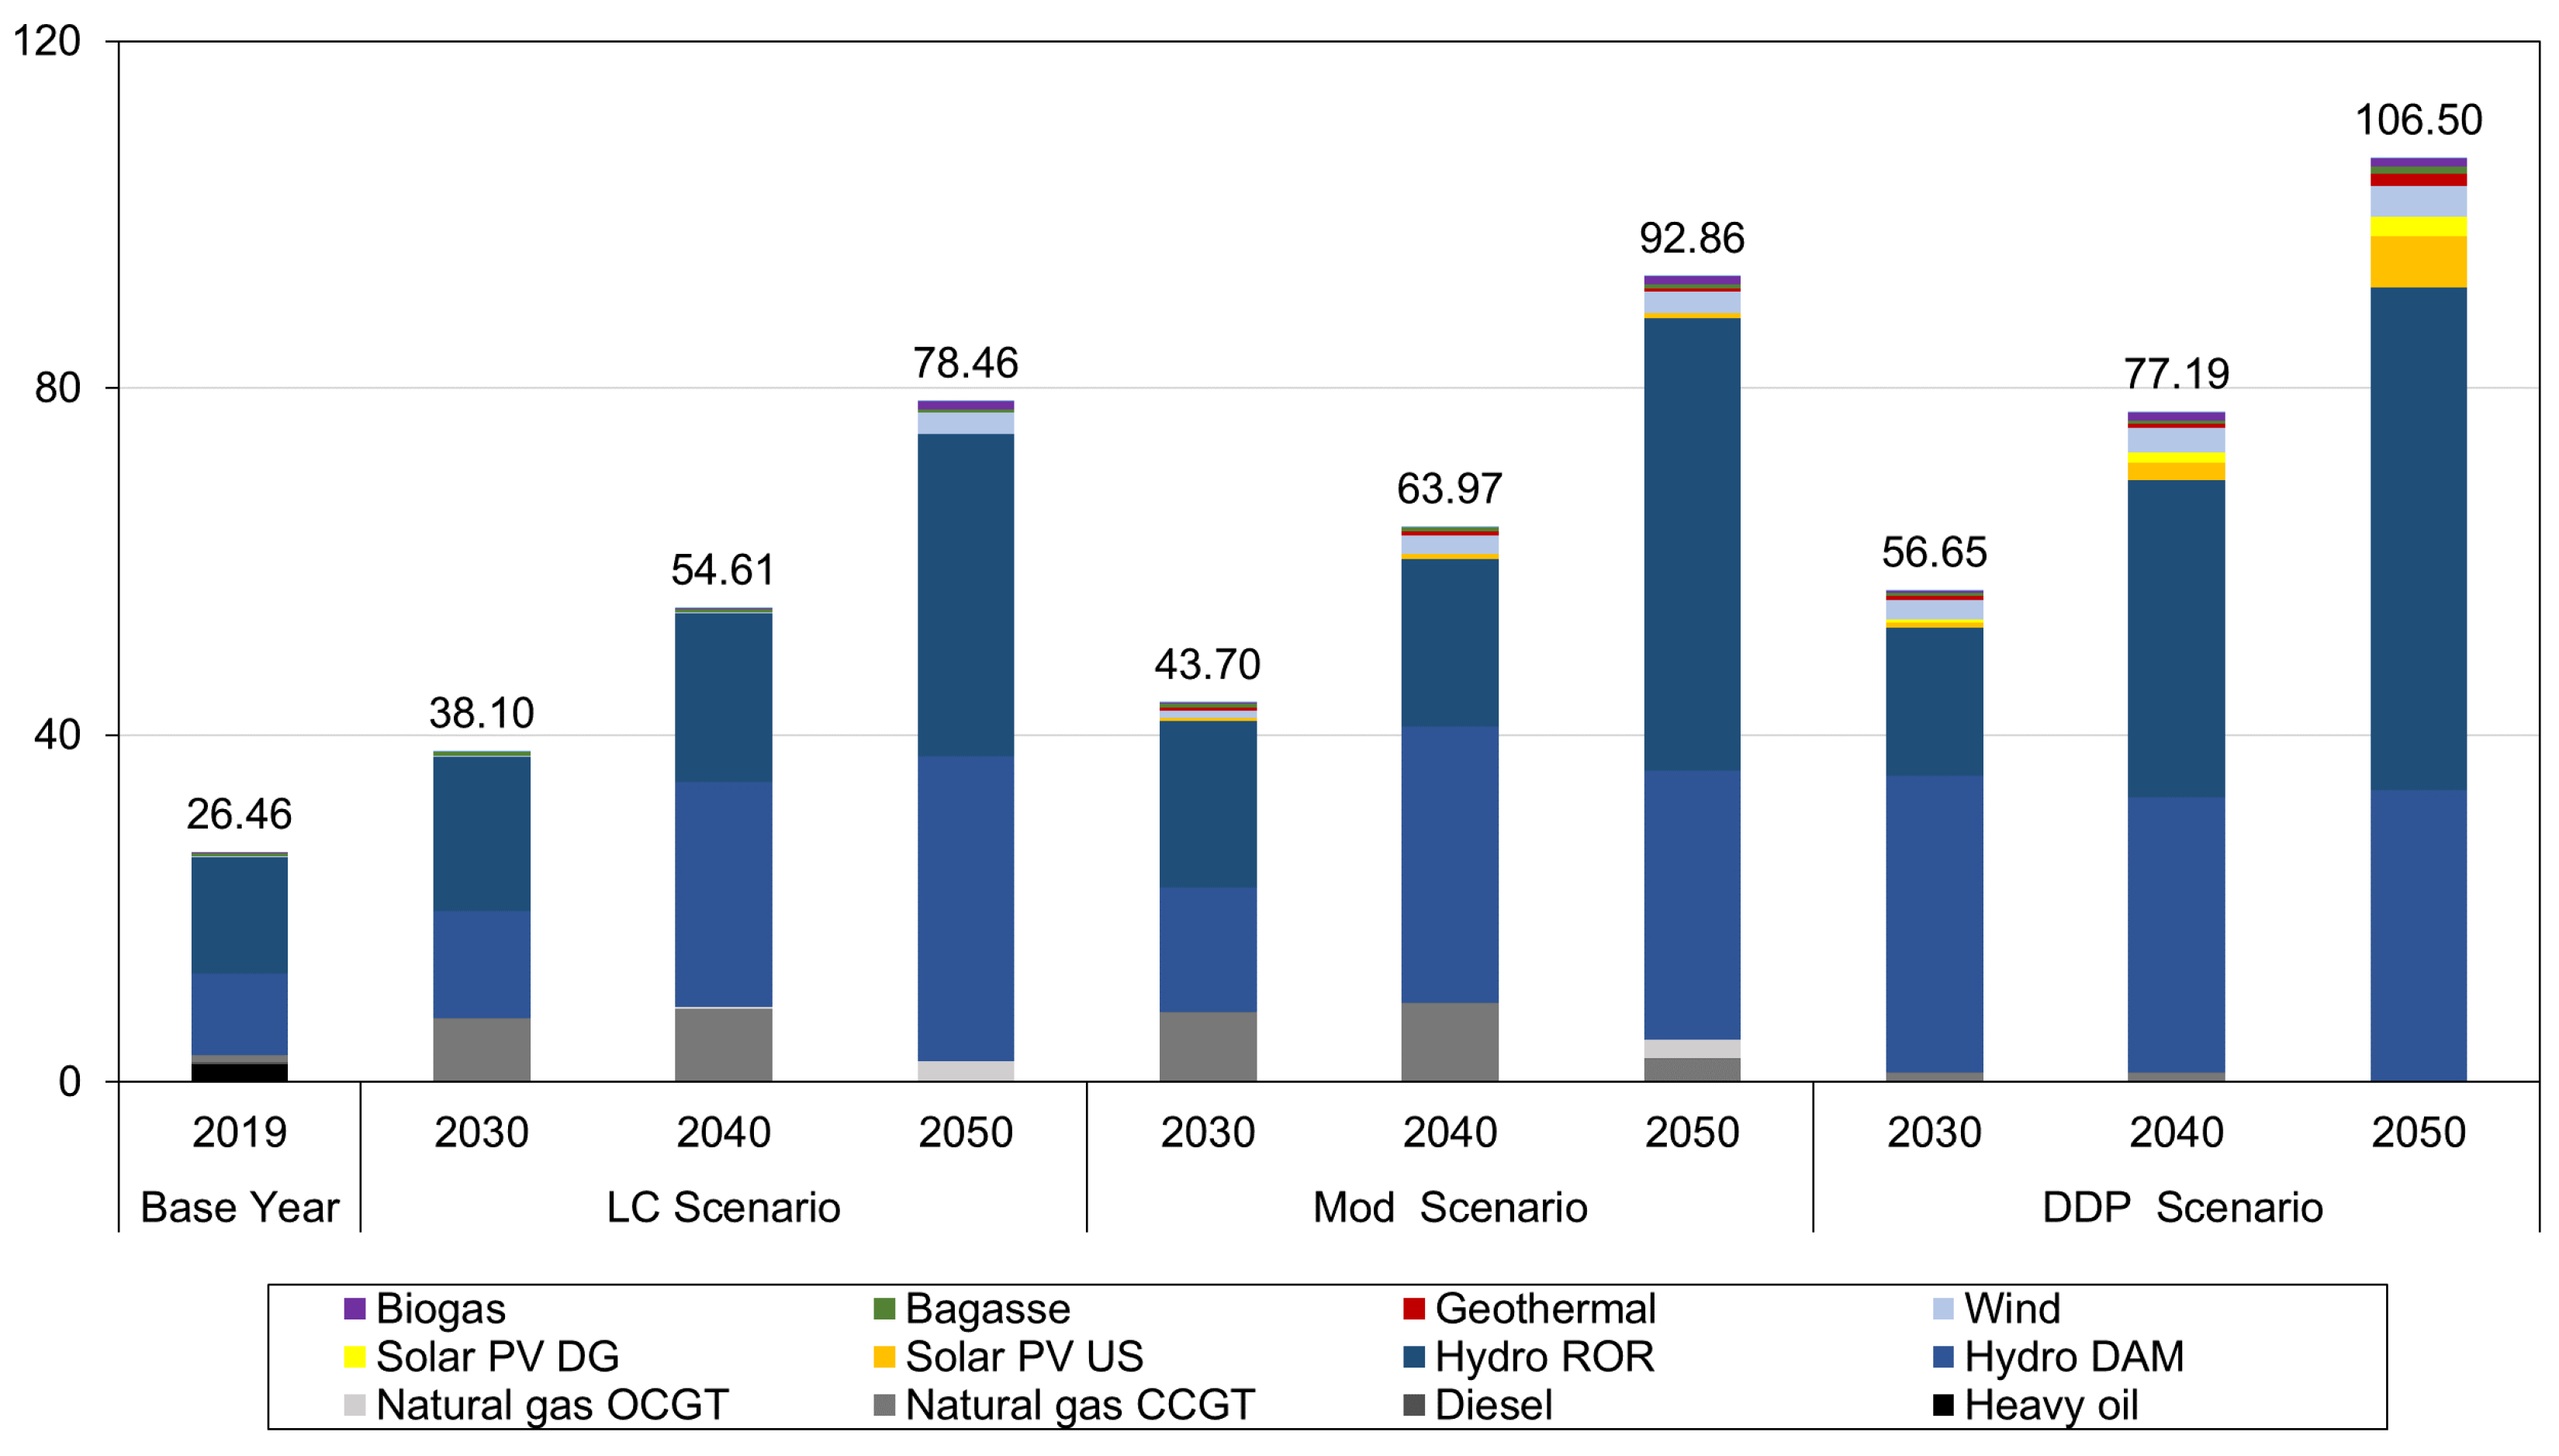
Figure 10 shows that for the LC scenario, hydropower reaches more than 70% of the total generation, which is a goal stated in the National Energy Agenda [52] (78.95% by 2030, 82.96% by 2040, and 92.11% by 2050). Natural gas decreases its participation from 19.42% by 2030 to 3.12% by 2050. As the deployment of other renewable energies (solar, wind, bagasse, geothermal, and biogas) is minimal, it contributes with a small participation into the mix reaching 4.77% of the total generation by 2050.
The Mod scenario also presents a high participation of hydropower into the energy mix. It represents 76.84% by 2030, 79.82% by 2040, and 89.52% by 2050 of the total electricity generation. Besides, the natural gas participation decreases from 18.39% in 2030, 14.34% in 2040, and 5.3% in 2050. The power generation from other renewable technologies reaches 5.17% of the total generation by 2050. This scenario presents a power mix mostly based on renewable resources during the whole period (81.61% by 2030, 85.66% by 2040, and 94.69% by 2050), but fossil fuels such natural gas still has a participation into the supply mix, and at the same time is used as fuel in the passenger land transport (please refer to Table 6).
The results for the DDP scenario show that, by 2050, is possible to reach a high electrification rate in the passengers land transport (47.8%) and at least 5.87% in the freight transport (see Table 6 and Table 7), while the power mix is completely based on renewable resources. In 2050, the electricity generation matrix is composed of 85.98% hydropower, 7.65% solar, 3.40% wind, 1.24% geothermal, 0.86% bagasse, and 0.82% biogas. A 100% renewable mix is possible with the limitation of natural gas usage that allows the deployment of alternative renewable technologies.
Although the scope of this study was not the calculation of the GHG emission reductions, the need for a deep decarbonization of the transport sector is framed within the context of climate change mitigation. In this sense, all scenarios can be seen, at first glance, as clean due to the large share of hydropower in the present and projected future. However, in order to reduce GHG emissions through electrification, both supply-side and demand-side measures must be implemented. This is remarked in the case of the LC scenario, in which the electricity demand maintains the same behavior as today, therefore, the energy mix is mainly based on hydropower, but the transport sector remains highly dependent on fossil fuels. This reliance on hydropower is also seen in the other scenarios, as it is the most stable low-emission technology. Despite Ecuador’s vast water resources and experience with hydropower plants, relying so heavily on a single technology can pose disadvantages. First, it has been demonstrated that water reservoirs can emit significant amounts of GHGs, especially in flooded tropical soils, as is the case of Ecuador [65]. Secondly, available studies show the vulnerability of hydroelectric projects to climate change in Ecuador, as water availability (high or low water scenarios) can induce a variation in electricity generation of between 29% and 86% [18], thus causing a significant risk of electricity shortages for demand sectors. Finally, large hydropower plants can be seen as a form of the classical extractivism model that encourage the exploitation of enormous quantities of natural resources causing socio-environmental conflicts, that have been well reported throughout Latin America [66,67,68,69].
In order to understand how an electrified transport sector in combination with other electricity demand sectors can be reliably supplied through renewable national resources, we analyzed in detail the DDP scenario. It contains the greatest effort in terms of diversifying demand sectors, achieving high levels of electrification in each of them. With this regard, the results obtained for this scenario fulfill the two selected decarbonization indicators of the IPCC mitigation pathways: the reduction in the carbon intensity of electricity, and the increase in the share of final energy provided by electricity. Note that this scenario could be reached only if technology-focused measures (energy efficiency and fuel switching), as well as structural changes to avoid or shift transport activity are implemented at the same time, which were integrated in the premises of this scenario (Table 1). For ease, Figure 11 shows just the load curves for the DDP scenario.
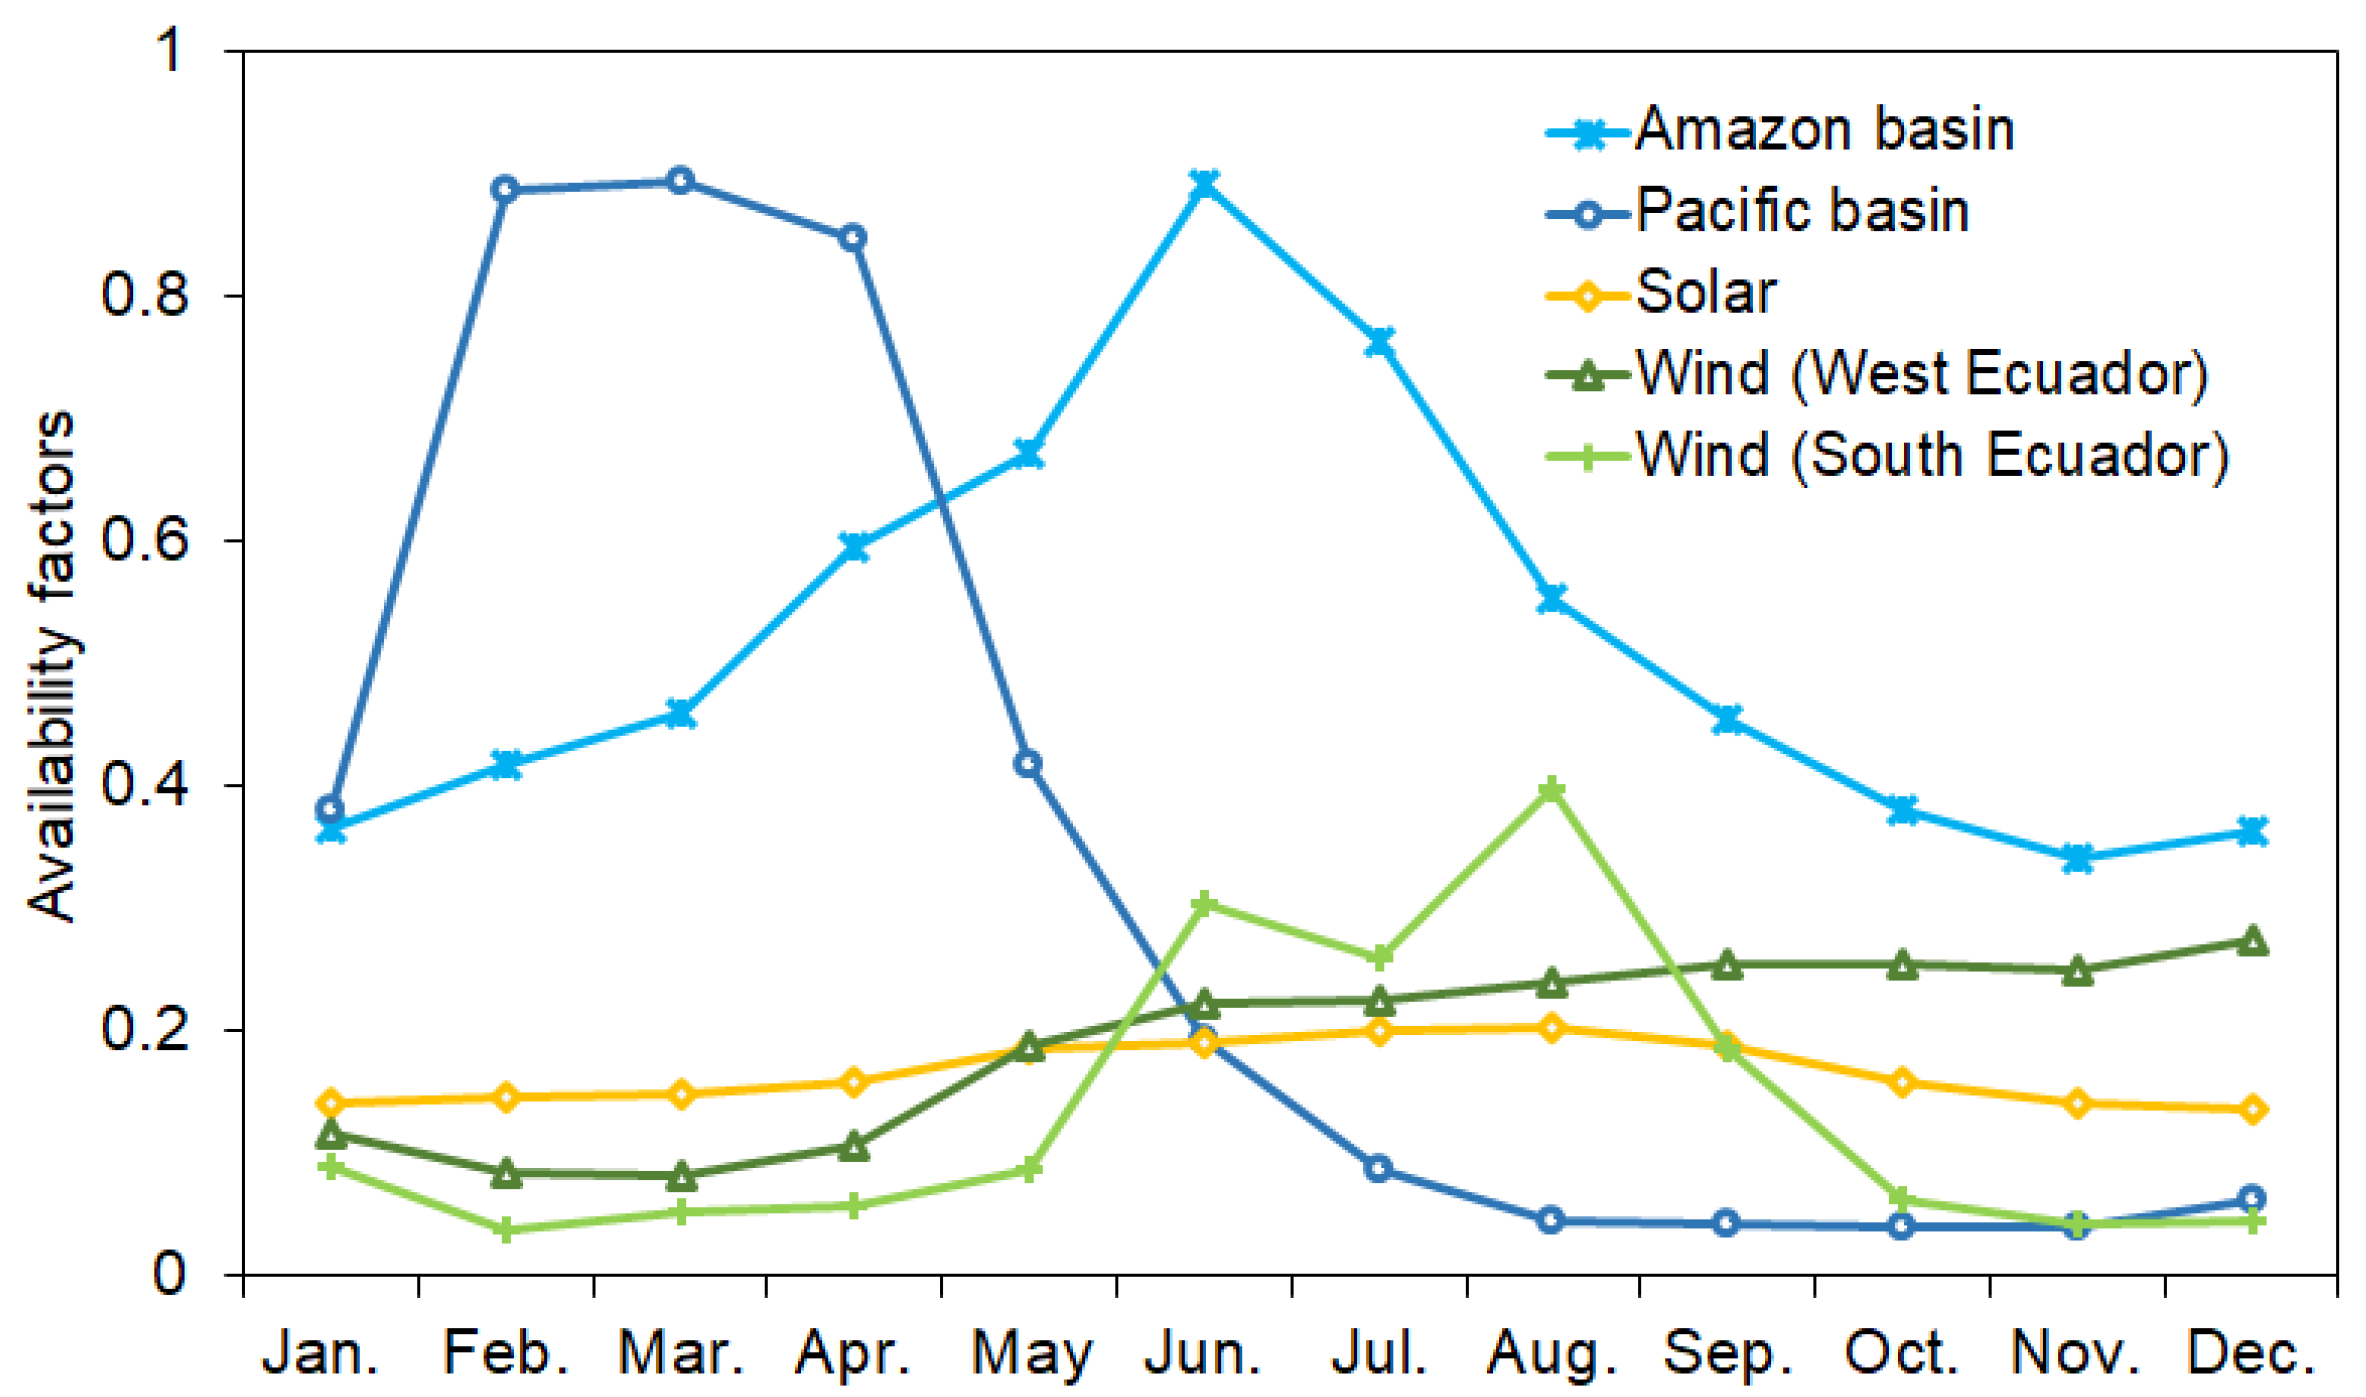
The load curves show that the diversification of natural resources for electricity generation makes it possible to use each resource according to its hourly availability. During the day (from 06:00 to 18:00), solar energy contributes to the energy mix, while water is stored in reservoirs for its usage at peak hours (from 19:00 to 22:00). All renewable technologies in combination are able to supply the whole demand without the necessity of fossil fuels; nevertheless, possible high energy peaks during the dry season (October to March) could require importing electricity from neighbour countries Colombia and Peru. An electrical interconnection network with these countries already exists, but this could lead to a delocalization of GHG emissions. It must be said that these three countries share the same time zone and would have similar peak demand times, thus is probable that the electricity purchased from these countries comes from non-renewable sources.
From 1:00 to 8:00 there is a valley in the electricity demand curve. This low consumption time slot could become, through the implementation of a low electricity tariff, an ideal period for recharging the batteries of electric vehicles. This kind of incentive would increase the appeal of this vehicles and ensure that an increasing fleet does not represent an extra load during peak time. Nowadays in Ecuador, electricity subsidies are determined according with the overall consumption level, switching to a time-based cost of electricity can also reduce the consumption at peak time which is one of the major concerns from the generation side. This kind of electricity price analysis should be considered as a topic for future research.

3.3. Costs of The System

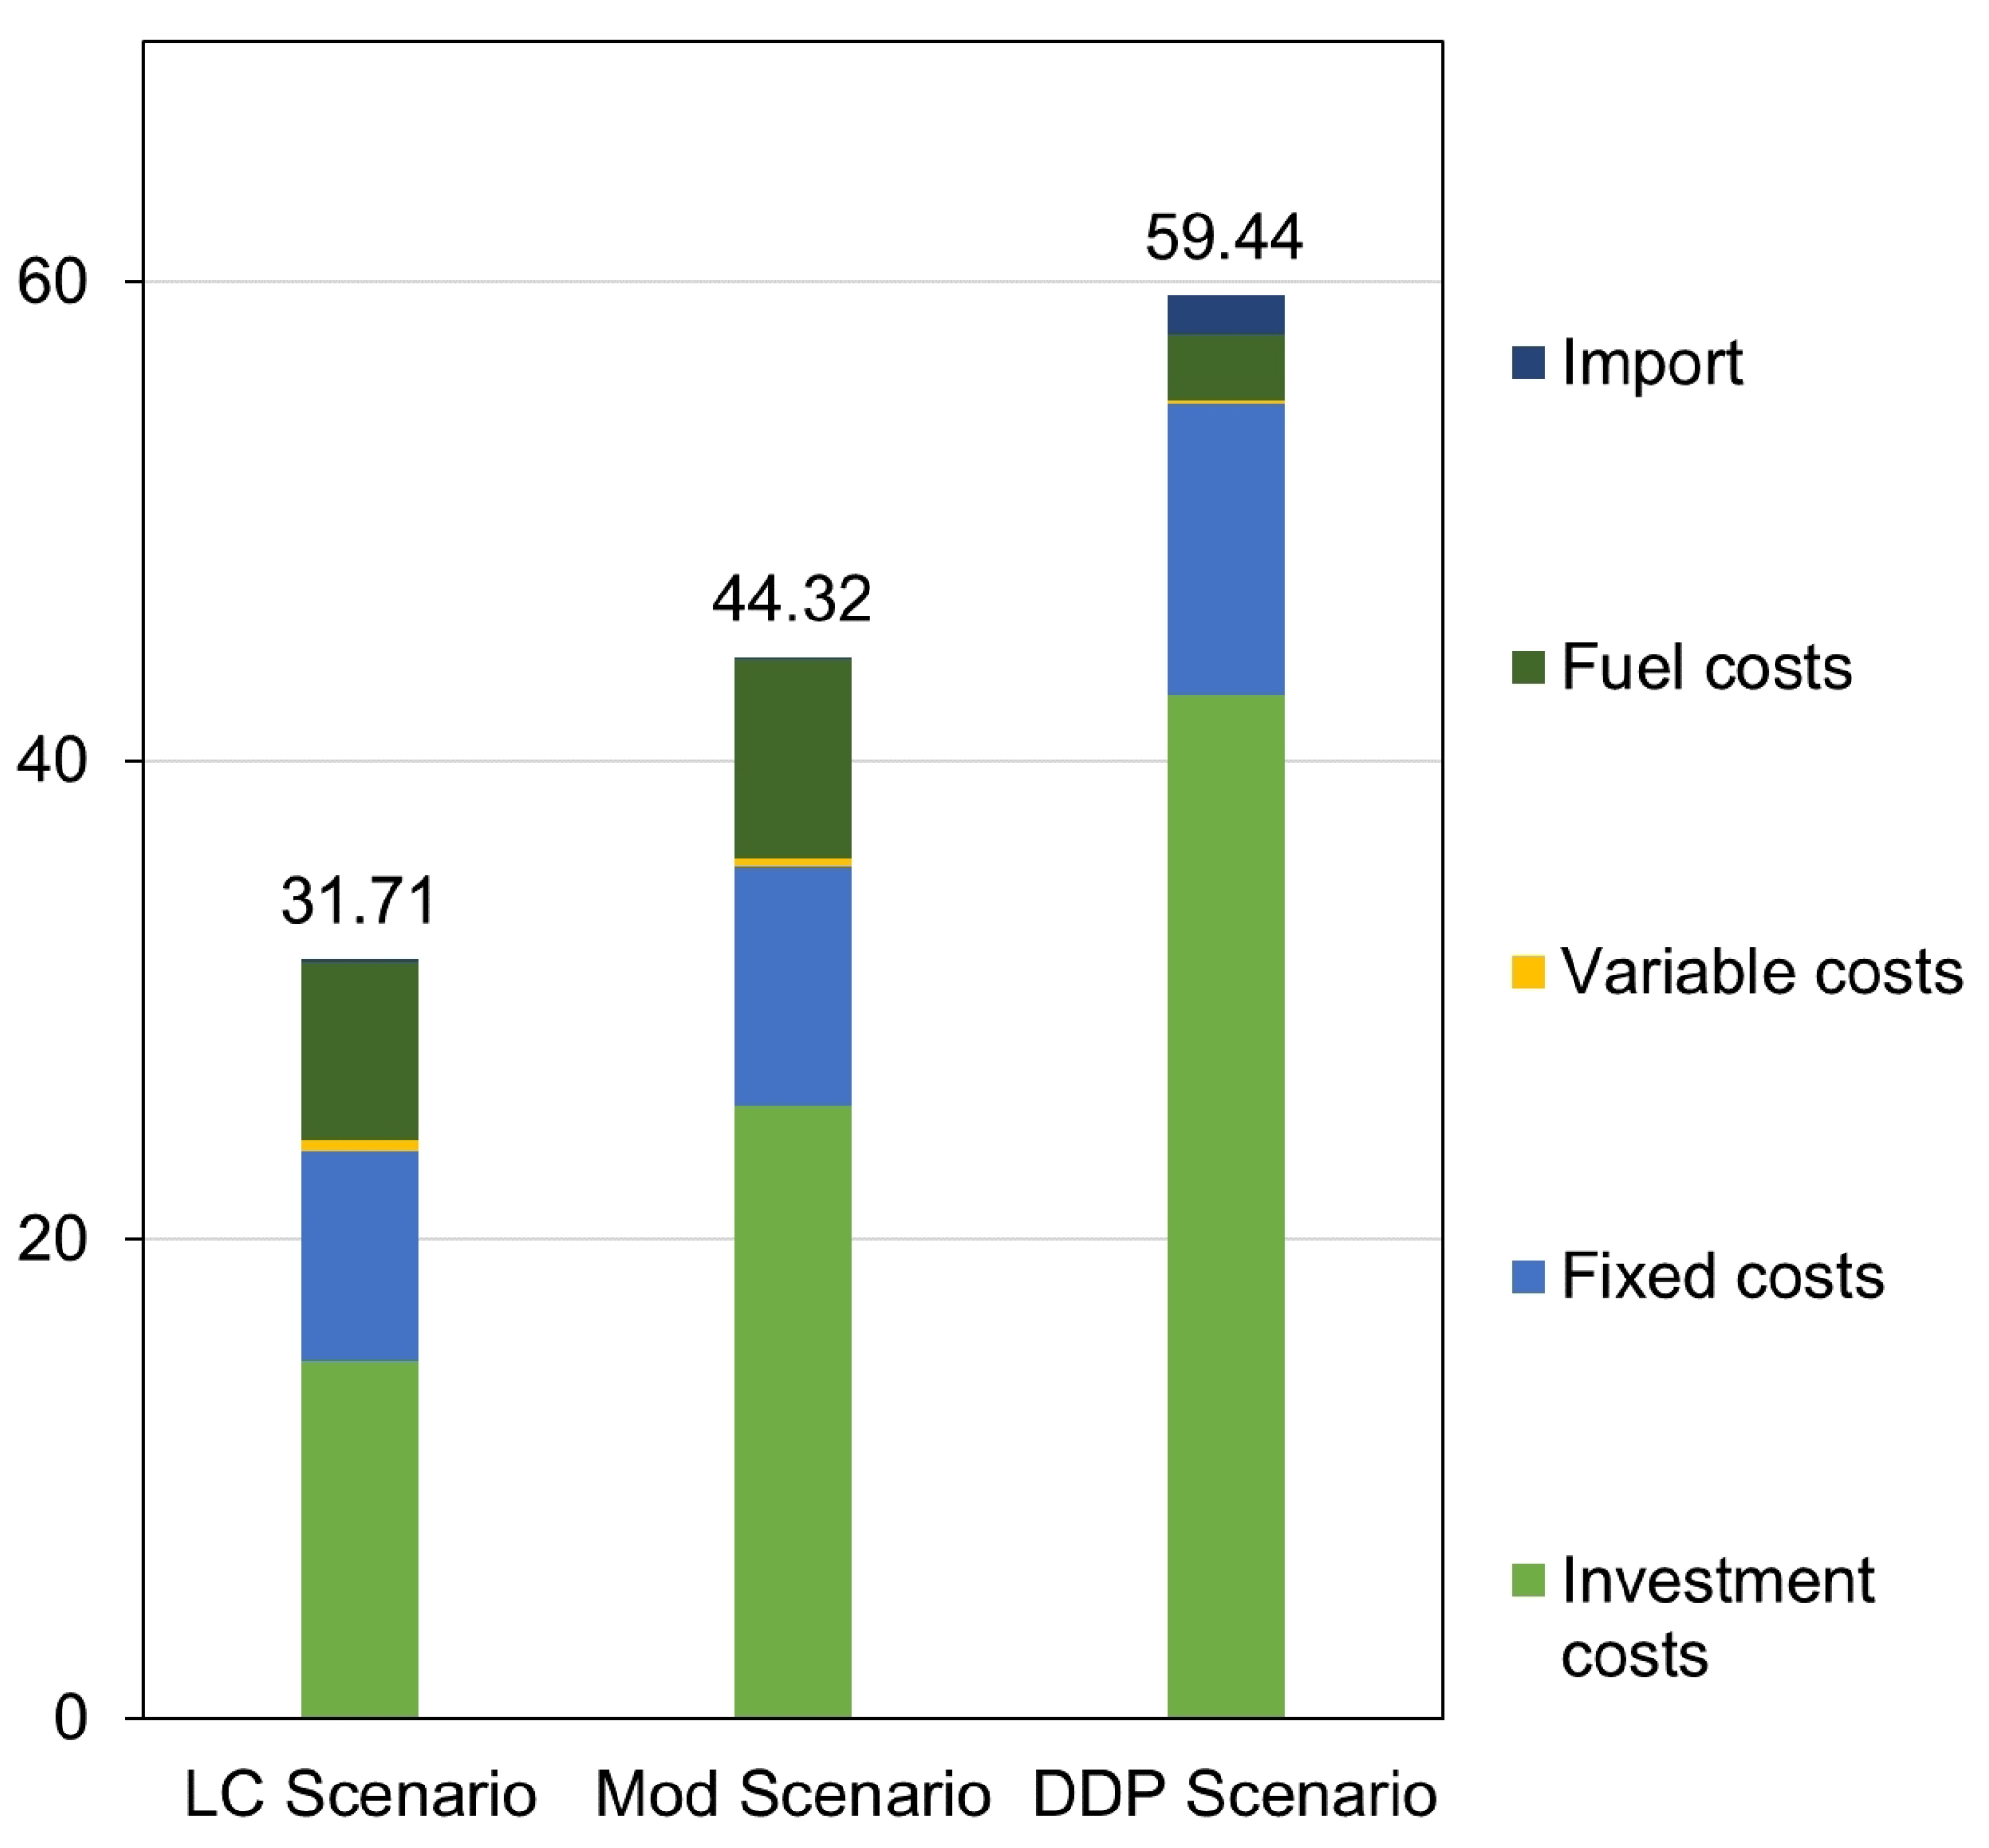
The total costs of the system during the whole period vary among the three scenarios. For the LC scenario the total cost reaches USD 31.71 billion, whose investment component (USD 14.88 billion) is the highest, representing 47% of the total, followed by fixed costs (USD 8.83 billion), the fuel costs (USD 7.48 billion), variable costs (USD 0.41 billion), and import costs (USD 0.12 billion), which represent the import of electricity that is still needed in this scenario.
As the installed capacity increases for the Mod scenario, also the cost of the system (USD 44.32 billion) which is 1.4 times higher than the LC because of the increased deployment of alternative renewable technologies. This leads to a 58% share of the investment costs with respect to the whole system costs (USD 25.58 billion). As this scenario still has thermal electricity generation with natural gas, the costs for the fuel represents almost 19% (USD 8.30 billion), while the fixed costs reaches 22.54% (USD 9.99 billion), the variable costs depicts 0.77% (USD 0.34 billion), and the costs for electricity imports represents 0.24% (USD 0.10 billion).
The DDP scenario requires the strongest effort in terms of total costs (USD 59.44 billion), which are 1.9 and 1.3 times bigger than the LC and Mod scenarios, respectively. It is clear that the investment costs represent by far the largest component of the total system costs due to the new renewable technologies. The fixed costs (USD 12.15 billion) are higher than the fuel costs (USD 2.73 billion) due to the 100% renewable energy mix by 2050. There are still fuel costs in this scenario due to the presence of thermal electricity generation until 2040 that is then completely replaced by renewable technologies. The variable costs are USD 0.13 billion, and the import of electricity costs reaches USD 1.65 billion. All these results can be seen in the Figure 12.
Given that the three scenarios depict different installed capacities, a cost comparison can be misleading. It is important to remember that the DDP scenario is purposely designed to show an important national economic growth coupled with behavioral changes in the demand side and a strong effort to reach a totally renewable energy mix. This is the reason why DDP represents the highest cost, as it reflects the effort of a change towards sustainability in both demand and supply sides of the energy system. In contrast, the LC scenario represents the trend growth without major changes in both energy demand and supply. It reflects factors as techno-economic characteristics of the technological components, the infrastructure at the system level, and the institutional characteristics that favor one technology and act as barriers for others, and therefore promote technological lock-ins [70]. This is the Ecuadorian case, which shows a trend trajectory of deployment of the cheapest and most mature energy technologies (hydropower and thermal generation) as can be seen in the national energy policies and plans that consider only a small participation of alternative renewable generation technologies, even though in the future these are expected to become cheaper [71].
The cost of a fully renewable electricity matrix for Ecuador has to be analyzed also under the perspective that the country’s oil era is likely coming to an end within the next decade or, according to the most optimistic estimates, within the next two decades [72]. If the country is no longer an oil producer but its technological dependency on this product continues, his energy and transport sectors will be vulnerable to the fluctuating oil market. A planned and gradual transition from fossil fuels to a clean energy mix would be less costly than a forced adoption of new technologies that could result in many stranded assets, so the depletion of oil reserves is an important factor to consider in the energy planning.
In this context, a most comprehensive cost analysis should be taken into account that can serve as inputs for policy and planning recommendations. Although this is not the objective of this work, some insights in this direction can be mentioned. First the presented cost analysis does not take into account the economic costs such as environmental and social ones. Many authors show the impact and related social costs of big energy projects, that can lead to several social issues even to the movement or disappearing of entire communities [44,66,67,68,69], with associated governmental costs needed to supply people with new houses, infrastructure, employment and so on. Most of the time these are not considered because are hidden behind the side effects of an infrastructure project and are not visualized as costs. Moreover, the environmental costs are also disregarded in most cases, especially because of the difficulty of assigning a cost to environmental degradation, and a weak consideration of the impacts of environmental services loss on other activities located in the places where the big energy projects are built, such as agriculture, tourism, and cultural values for people and communities, as is widely the case in Ecuador [73]. For coping with this, a multi criteria analysis can be used to visualize and take into consideration the social, environmental, technological, and political aspects of the energy projects, especially those of big scale, that help to redefine the energy portfolios and reflect the potential advantages of a more diversified and non-centralized energy mix. This is a field of further research to improve our analysis of the Ecuadorian energy mix transition.

4. Conclusions

This study analyzes whether a diversified and clean electricity mix can supply the demand of a highly electrified transport sector without neglecting the demand of other consumption sectors. The second inherent research question is how renewable energy technologies can be integrated to supply this demand taking into account technical and cost criteria of each type of technology. This work adds new information to previous studies on the decarbonization of the Ecuadorian demand sectors, as here we visualize different levels of electrification of the transport sector, and analyze the energy supply in the context of current national plans and also potential measures.
High electrification of passengers land transport can be achieved with the renewable resources available in the country, while a significant portion of land freight transport can also be electrified. For this, Ecuador could reject the use of fossil fuels, due to its vast renewable resources, especially water, however, the disadvantages of over dependence on this resource should be avoided through holistic energy planning, seeking for the best balance between available resources and technologies.
This work demonstrates that clean electrification of demand sectors, especially land transport is a viable alternative for the country to reinforce its future climate change mitigation goals. Finally, the results show that the deployment of renewable technologies has high costs in terms of investment, maintenance and operation, however, this should be seen as the cost of a necessary transition towards a sustainable, low-emission energy supply and demand, which can deliver large potential benefits to the national economy.

5. Future Work

Some refinements to the methodology could be proposed for future work. They include improving the characterisation of the fleet and its use to better understand the end uses of energy in the transport sector. Also, it is suggested to incorporate the hydrogen industrial chain into the modelling, which in long term could play an important role in the decarbonisation of the transport sector. More, a detailed modelling of large-scale energy storage technologies is suggested. These refinements should give tools to suggest energetic policies to encourage a sustainable and just energy transition, especially in developing countries. Such policies could include the implementation of differentiated electricity tariffs depending on the time of day, and policies related to mobility efficiency where mass rather than individual transport is prioritised. Finally, in order to further elaborate on the effects that transport electrification may have in developing countries such as Ecuador, the formulation of decarbonisation scenarios should include social, environmental, macroeconomic, governance and economic policy criteria. A green solution in the energy sector must foster sustainable development and reduce economic inequalities.

Author Contributions

Conceptualization, J.C.G., D.V., R.S., F.O. and T.H.; methodology, J.C.G., D.V. and R.S.; software, J.C.G. and D.V.; validation, J.C.G. and D.V.; formal analysis, J.C.G., D.V. and C.V.; investigation, J.C.G. and D.V.; resources, J.C.G., D.V. and R.S.; data curation, J.C.G. and D.V.; writing—original draft preparation, J.C.G., D.V. and R.S.; writing—review and editing, C.V. and J.C.G.; visualization, J.C.G. and D.V.; supervision, R.S. and T.H.; project administration, J.C.G.; funding acquisition, Bayerisches Hochschulzentrum für Lateinamerika (BAYLAT). All authors have read and agreed to the published version of the manuscript.

Funding

This research was funded by Bayerisches Hochschulzentrum für Lateinamerika (BAYLAT).

Institutional Review Board Statement

Not applicable.

Informed Consent Statement

Not applicable.

Data Availability Statement

No new data were created or analyzed in this study. Data sharing is not applicable to this article.

Acknowledgments

Gratitude to the Ecuadorian Secretariat of Higher Education, Science, Technology and Innovation (SENESCYT) for providing monetary support to Janeth Carolina Godoy for her doctoral studies at the ENS-TUM. Special thanks to the b4future team for their support during this work and their valuable inputs about initiatives for sustainable development for Ecuador. The author, Daniel Villamar, would like to thank the FSPI-Doctoral Schools Project of the French Embassy in Ecuador, financed by the Ministry of Europe and Foreign Affairs.

Conflicts of Interest

The authors declare no conflict of interest.

References

  1. United Nations Environment Programme. Emissions Gap Report 2020; UNEP Publications: Nairobi, Kenya, 2020. [Google Scholar]
  2. Sims, R.; Schaeffer, R.; Creutzig, F.; Cruz-Núñez, X.; D’Agosto, M.; Dimitriu, D.; Figueroa Meza, M.; Fulton, L.; Kobayashi, S.; Lah, O.; et al. Transport. In Climate Change 2014: Mitigation of Climate Change. Working Group III Contribution to the IPCC Fifth Assessment Report; Edenhofer, O., Pichs-Madruga, R., Sokona, Y., Farahani, E., Kadner, S., Seyboth, K., Adler, A., Baum, I., Brunner, S., Eickemeier, P., et al., Eds.; Cambridge University Press: Cambridge, UK; New York, NY, USA, 2015; pp. 599–670. [Google Scholar]
  3. Rogelj, J.; Shindell, D.; Jiang, K.; Fifita, S.; Forster, P.; Ginzburg, V.; Handa, C.; Kheshgi, H.; Kobayashi, S.; Kriegler, E.; et al. Mitigation Pathways Compatible with 1.5 °C in the Context of Sustainable Development. In Special Report on Global Warming of 1.5 °C; Masson-Delmotte, V., Zhai, P., Pörtner, H.-O., Roberts, D., Skea, J., Shukla, P.R., Pirani, A., Moufouma-Okia, W., Péan, C., Pidcock, R., et al., Eds.; IPCC: Geneva, Switzerland, 2018; pp. 93–174. [Google Scholar]
  4. IEA. World Oil Final Consumption by Sector. 2018. Available online: https://www.iea.org/data-and-statistics/charts/world-oil-final-consumption-by-sector-2018 (accessed on 5 August 2021).
  5. Changing Transport. Facilitating Climate Actions in Mobility. Available online: https://www.changing-transport.org/updated-ndcs-transport/ (accessed on 5 July 2021).
  6. REN21. Renewables 2021 Global Status Report; REN21 Secretariat: Paris, France, 2021. [Google Scholar]
  7. SLOCAT, Tracking Trends in a Time of Change: The Need for Radical Action Towards Sustainable Transport Decarbonisation, Transport and Climate Change Global Status Report. 2021. Available online: https://tcc-gsr.com (accessed on 19 August 2021).
  8. IEA. Global EV Data Explorer. Available online: https://www.iea.org/articles/global-ev-data-explorer (accessed on 24 August 2021).
  9. Bataille, C.; Waisman, H.; Briand, Y.; Svensson, J.; Vogt-Schilb, A.; Jaramillo, M.; Delgado, R.; Arguello, R.; Clarke, L.; Wild, T.; et al. Net-zero deep decarbonization pathways in Latin America: Challenges and opportunities. Energy Strategy Rev. 2020, 30, 100510. [Google Scholar] [CrossRef]
  10. UN Habitat for a Better Urban Future. Available online: https://unhabitat.org/node/142554 (accessed on 20 July 2021).
  11. Información Estadística de Transporte. Available online: https://www.ecuadorencifras.gob.ec//transporte/ (accessed on 6 July 2021).
  12. Ministerio del Ambiente. Tercera Comunicación Nacional del Ecuador sobre Cambio Climático, 1st ed.; MAE: Quito, Ecuador, 2017; ISBN 976-994-22-145-2. [Google Scholar]
  13. MERNNR. Balance Energético Nacional 2018; MERNNR: Quito, Ecuador, 2020. [Google Scholar]
  14. Asamblea Nacional de la República de Ecuador. Ley Orgánica de Eficiencia Energética; Editora Nacional: Quito, Ecuador, 2019. [Google Scholar]
  15. Ministerio del Ambiente. Primera Contribución Determinada a Nivel Nacional para el Acuerdo de París Bajo la Convención Marco de Naciones Unidas Sobre Cambio Climático; MAE: Quito, Ecuador, 2019. [Google Scholar]
  16. Villamar, D.; Soria, R.; Rochedo, P.; Szklo, A.; Imperio, M.; Carvajal, P.; Schaeffer, R. Long-term deep decarbonisation pathways for Ecuador: Insights from an integrated assessment model. Energy Strategy Rev. 2021, 35, 100637. [Google Scholar] [CrossRef]
  17. MERNNR. Plan Maestro de Electricidad 2018–2027; Ministerio de Energía y Recursos Naturales No Renovables: Quito, Ecuador, 2020. [Google Scholar]
  18. Carvajal, P.E.; Li, F.G.; Soria, R.; Cronin, J.; Anandarajah, G.; Mulugetta, Y. Large hydropower, decarbonisation and climate change uncertainty: Modelling power sector pathways for Ecuador. Energy Strategy Rev. 2019, 23, 86–99. [Google Scholar] [CrossRef]
  19. Blackshear, B.; Crocker, T.; Drucker, E.; Filoon, J.; Knelman, J.; Skiles, M. Hydropower Vulnerability and Climate Change a Framework for Modeling the Future of Global Hydroelectric Resources; Middlebury College: Middlebury, VT, USA, 2011. [Google Scholar]
  20. Gaudard, L.; Gabbi, J.; Bauder, A.; Romerio, F. Long-term Uncertainty of Hydropower Revenue Due to Climate Change and Electricity Prices. Water Resour. Manag. 2016, 30, 1325–1343. [Google Scholar] [CrossRef]
  21. Vulnerabilidad al Cambio climáTico de los Sistemas de Producción Hidroeléctrica en Centroamérica y sus Opciones de Adaptación. Available online: https://publications.iadb.org/es/publicacion/15676/vulnerabilidad-al-cambio-climatico-de-los-sistemas-de-produccion-hidroelectrica (accessed on 22 July 2021).
  22. Teotónio, C.; Fortes, P.; Roebeling, P.; Rodriguez, M.; Robaina-Alves, M. Assessing the impacts of climate change on hydropower generation and the power sector in Portugal: A partial equilibrium Approach. Renew. Sustain. Energy Rev. 2017, 74, 788–799. [Google Scholar] [CrossRef]
  23. Ruffato-Ferreira, V.; da Costa Barreto, R.; Júnior, A.; Silva, W.; de Berrêdo, D.; Sena, J.; Vasconcelos, M. A foundation for the strategic long-term planning of the renewable energy sector in Brazil: Hydroelectricity and wind energy in the face of climate change scenarios. Renew. Sustain. Energy Rev. 2017, 72, 1124–1137. [Google Scholar] [CrossRef]
  24. Understanding the Impact of Climate Change on Hydropower: The Case of Cameroon. Available online: http://hdl.handle.net/10986/18243 (accessed on 15 August 2021).
  25. IEA. Global EV Outlook 2021—Accelerating Ambitions Despite the Pandemic; IEA: Paris, France, 2021. [Google Scholar]
  26. International Renewable Energy Agency. Global Energy Transformation: A Roadmap to 2050; IRENA: Abu Dhabi, United Arab Emirates, 2019. [Google Scholar]
  27. International Energy Agency. Energy Technology Perspectives 2020; OECD Publishing: Paris, France, 2020. [Google Scholar]
  28. Gils, H.C.; Simon, S.; Soria, R. 100% Renewable Energy Supply for Brazil—The Role of Sector Coupling and Regional Development. Energies. 2017, 10, 1859. [Google Scholar] [CrossRef] [Green Version]
  29. Sauer, I.L.; Escobar, J.F.; da Silva, M.F.P.; Meza, C.G.; Centurion, C.; Goldemberg, J. Bolivia and Paraguay: A beacon for sustainable electric mobility? Renew. Sustain. Energy Rev. 2015, 51, 910–925. [Google Scholar] [CrossRef]
  30. Meza, C.G.; Amado, N.B.; Sauer, I.L. Transforming the Nicaraguan energy mix towards 100% renewable. Energy Procedia 2017, 138, 494–499. [Google Scholar] [CrossRef]
  31. Lallana, F.; Bravo, G.; Le Treut, G.; Lefèvre, J.; Nadal, G.; Di Sbroiavacca, N. Exploring deep decarbonization pathways for Argentina. Energy Strategy Rev. 2021, 36, 100670. [Google Scholar] [CrossRef]
  32. Godínez-Zamora, G.; Victor-Gallardo, L.; Angulo-Paniagua, J.; Ramos, E.; Howells, M.; Usher, W.; De León, F.; Meza, A.; Quirós-Tortós, J. Decarbonising the transport and energy sectors: Technical feasibility and socioeconomic impacts in Costa Rica. Energy Strategy Rev. 2020, 32, 100573. [Google Scholar] [CrossRef]
  33. Auhadeev, A.E.; Litvinenko, R.S.; Fandeev, V.P.; Pavlov, P.P.; Butakov, V.M.; Litvinenko, A.R. Research of reliability of urban electric transport system. E3S Web Conf. 2019, 124, 05078. [Google Scholar] [CrossRef] [Green Version]
  34. Mingrone, L.; Pignataro, G.; Roscia, M. Smart urban electric transport system: An innovative real model. In Proceedings of the 2015 International Conference on Renewable Energy Research and Applications (ICRERA), Palermo, Italy, 22–25 November 2015; pp. 1457–1462. [Google Scholar] [CrossRef]
  35. Creţan, R.; O’Brien, T. Corruption and conflagration: (In)justice and protest in Bucharest after the Colectiv fire. Urban Geogr. 2019, 41, 368–388. [Google Scholar] [CrossRef]
  36. Schaffitzel, F.; Jakob, M.; Soria, R.; Vogt-Schilb, A.; Ward, H. Can government transfers make energy subsidy reform socially acceptable? A case study on Ecuador. Energy Policy 2020, 137, 111120. [Google Scholar] [CrossRef] [Green Version]
  37. Crețan, R.; Guran-Nica, L.; Platon, D.; Turnock, D. Foreign Direct Investment and Social Risk in Romania: Progress in Less-Favoured Areas. In Foreign Direct Investment and Regional Development in East Central Europe and the Former Soviet Union; Turnock, D., Ed.; Routledge: London, UK, 2005; pp. 305–348. [Google Scholar]
  38. Saget, C.; Vogt-Schilb, A.; Luu, T. El Empleo en un Futuro de Cero Emisiones Netas en América Latina y el Caribe, 1st ed.; Banco Interamericano de Desarrollo y Organización Internacional del Trabajo: Washington, DC, USA, 2020. [Google Scholar]
  39. Pérez Urdiales, M.; Yépez-García, A.; Tolmasquim, M.; Alatorre, C.; Rasteletti, A.; Stampini, M.; Hallack, M. El Papel de la Transición Energética en la Recuperación Sostenible de América Latina y el Caribe; BID: Washington, DC, USA, 2021. [Google Scholar]
  40. Creţan, R.; Vesalon, L. The Political Economy of Hydropower in the Communist Space: Iron Gates Revisited. Tijdschr. Voor Econ. Soc. Geogr. 2017, 108, 688–701. [Google Scholar] [CrossRef]
  41. Vogt-Schilb, A.; Hallegatte, S. Climate policies and nationally determined contributions: Reconciling the needed ambition with the political economy. Wires Energy Environ. 2017, 6, e256. [Google Scholar] [CrossRef] [Green Version]
  42. Ramirez, A.D.; Boero, A.; Rivela, B.; Melendres, A.M.; Espinoza, S.; Salas, D.A. Life cycle methods to analyze the environmental sustainability of electricity generation in Ecuador: Is decarbonization the right path? Renew. Sustain. Energy Rev. 2020, 134, 110373. [Google Scholar] [CrossRef]
  43. International Atomic Energy Agency. Transitions to Low Carbon Electricity Systems: Key Economic and Investments Trends. Changing Course in a Post-Pandemic World; IAEA: Viena, Austria, 2021. [Google Scholar]
  44. Gudynas, E. Caminos para las transiciones postextractivistas. In Transiciones. Postextractivismo y Alternativas al Extractivismo en el Perú, 2nd ed.; Alayza, A., Gudynas, E., Eds.; CEPES: Lima, Peru, 2010; pp. 165–190. [Google Scholar]
  45. A Linear Optimisation Model for Distributed Energy Systems. Available online: https://github.com/tum-ens/urbs (accessed on 4 June 2021).
  46. urbs: A Linear Optimisation Model for Distributed Energy Systems—urbs 1.0.0 Documentation. Available online: https://urbs.readthedocs.io/en/latest/ (accessed on 4 June 2021).
  47. urbs’ Module Description. Available online: https://urbs.readthedocs.io/en/latest/api.html (accessed on 4 June 2021).
  48. Candas, S.; Odersky, L.; Stüber, M. urbs-open source energy system modelling framework. In Proceedings of the Open Energy Modelling Workshop, Berlin, Germany, 15–17 January 2020. [Google Scholar]
  49. MESSAGE. A Modeling Framework for Medium- to Long-Term Energy System Planning, Energy Policy Analysis, and Scenario Development. Available online: https://iiasa.ac.at/web/home/research/researchPrograms/Energy/MESSAGE.en.html (accessed on 30 March 2020).
  50. Modelling Tool, Cenergia Lab. Available online: http://www.cenergialab.coppe.ufrj.br/tools (accessed on 30 March 2020).
  51. Instituto Nacional de Eficiencia Energética y Energías Renovables. Escenarios de Prospectiva Energética Para Ecuador a 2050, 1st ed.; INER: Quito, Ecuador, 2016; ISBN 978-9942-8620-4-4. [Google Scholar]
  52. Ministerio Coordinador de Sectores Estratégicos. Agenda Nacional de Energía 2016–2040; MICSE: Quito, Ecuador, 2016. [Google Scholar]
  53. Ministerio de Electricidad y Energía Renovable. Plan Nacional de Eficiencia Energética 2016–2035, 1st ed.; Manthra Comunicación: Quito, Ecuador, 2017; ISBN 978-9942-22-148-3. [Google Scholar]
  54. Secretaría Nacional de Planificación y Desarrollo. Transformación de la Matriz Productiva, 1st ed; Ediecuatorial: Quito, Ecuador, 2012. [Google Scholar]
  55. Agencia de Regulación y Control de Electricidad. Estadística Anual y Multianual del Sector Eléctrico Ecuatoriano 2019; ARCONEL: Quito, Ecuador, 2019; ISBN 978-9942-07-946-6. [Google Scholar]
  56. CENACE. Informe Anual 2019; CENACE: Quito, Ecuador, 2019. [Google Scholar]
  57. Agencia de Regulación y Control de Electricidad. Estadística del Sector EléCtrico. Available online: https://www.regulacionelectrica.gob.ec/estadistica-del-sector-electrico/ (accessed on 8 March 2019).
  58. Renewables.ninja. Available online: https://www.renewables.ninja/ (accessed on 15 June 2021).
  59. Producción en Línea Detalle—CELEC, EP. Available online: https://generacioncsr.celec.gob.ec/graficasproduccion/ (accessed on 15 June 2021).
  60. Corporación Eléctrica del Ecuador. Available online: https://www.celec.gob.ec/ (accessed on 15 June 2021).
  61. Biblioteca Operador Nacional de Electricidad CENACE. Available online: http://www.cenace.gob.ec/biblioteca/ (accessed on 15 June 2021).
  62. INEC Anuario Estadístico de Transporte 2016. Available online: https://www.ecuadorencifras.gob.ec/documentos/web-inec/Estadisticas_Economicas/Estadistica%20de%20Transporte/2016/2016_AnuarioTransportes_%20Principales%20Resultados.pdf (accessed on 12 July 2021).
  63. Instituto Nacional de Eficiencia Energética y Energías Renovables. Manual Para el Procesamiento de Información del Balance Energético; INER: Quito, Ecuador, 2015. [Google Scholar]
  64. INEC. Proyección Poblacional Nacional 2010–2050; INEC: Quito, Ecuador, 2012. [Google Scholar]
  65. Briones, A.; Uche, J.; Martínez-Gracia, A. Accounting for GHG net reservoir emissions of hydropower in Ecuador. Renew. Energy 2017, 112, 209–221. [Google Scholar] [CrossRef] [Green Version]
  66. De Echave, J.; Diez, A.; Huber, L.; Revesz, B.; Lanata, X.; Tanaka, M. Minería y Conflicto Social, 1st ed.; Instituto de Estudios Peruanos: Lima, Peru, 2009. [Google Scholar]
  67. Bebbington, A. The new extraction: Rewriting the political ecology of the Andes? NACLA Rep. Am. 2016, 42, 12–20. [Google Scholar] [CrossRef]
  68. Acosta, A. La Maldición de la Abundancia, 1st ed.; Abya-Yala: Quito, Ecuador, 2009. [Google Scholar]
  69. Global Atlas of Environmental Justice. Available online: https://ejatlas.org/ (accessed on 15 June 2021).
  70. Del Río, P.; Unruh, G. Overcoming the lock-out of renewable energy technologies in Spain: The cases of wind and solar electricity. Renew. Sustain. Energy Rev. 2007, 11, 1498–1513. [Google Scholar] [CrossRef]
  71. IRENA. Renewable Power Generation Costs in 2019, 1st ed.; IRENA: Masdar City, United Arab Emirates, 2020; ISBN 978-92-9260-244-4. [Google Scholar]
  72. Espinoza, V.S.; Fontalvo, J.; Martí-Herrero, J.; Ramírez, P.; Capellán-Pérez, I. Future oil extraction in Ecuador using a Hubbert approach. Energy 2019, 182, 520–534. [Google Scholar] [CrossRef]
  73. Godoy, C. Desde Paute Hasta Coca Codo Sinclair 40 Años de Hidroenergía en el Ecuador: Discurso Alrededor de Cambio de Matriz Energética. Master’s Thesis, Facultad Latinoamericana de Ciencias Sociales, Quito, Ecuador, 2013. [Google Scholar]
Figure 1. urbs toolchain [48].
Energies 14 05728 g001
Figure 2. ELENA and urbs relationship in the context of this work.
Energies 14 05728 g002
Figure 3. Ecuadorian power system representation in urbs.
Energies 14 05728 g003
Figure 4. Power plants location by 2019 and by 2027 [55,56].
Energies 14 05728 g004
Figure 5. Feasible areas for wind parks with wind speed higher than 3 m/s. and for photovoltaic plants with DNI higher than 1000 kWh/m 2 [57].
Energies 14 05728 g005
Figure 6. Monthly normalized availability factors for hydropower plants in the Amazon and Pacific basins, wind parks in Western and Southern Ecuador, and photovoltaics [58,59,60,61].
Energies 14 05728 g006
Figure 7. Electricity demand per sector in TWh for the LC, Mod, and DDP scenarios.
Energies 14 05728 g007
Figure 8. Annual electricity generation in TWh according to the urbs model Base 2019 and the ARCONEL statistics of 2019.
Energies 14 05728 g008
Figure 9. Installed capacity in GW for the Ecuadorian power sector by 2019, 2030, 2040, and 2050 per scenario.
Energies 14 05728 g009
Figure 10. Power generation in TWh for the Ecuadorian power sector by 2019, 2030, 2040, and 2050 per scenario.
Energies 14 05728 g010
Figure 11. Electricity dispatch per hour in TWh during four days in October 2050 for the DDP scenario.
Energies 14 05728 g011
Figure 12. Costs of the system in USD billion for the LC, Mod, and DDP scenarios.
Energies 14 05728 g012
Table 1. Premises for the LC, Mod, and DDP scenarios.
VariableLC ScenarioMod ScenarioDDP Scenario
GDP growth4%4%4%
Changes in demand behaviorSmallMediumHigh
Basic industries as electricity consumerNoYesYes
LPG replacement by induction stoves in the residential sector0%0%3 million by 2025
Natural gas for transportationYesYesNo
Private mobility share+36%−55%−55%
Public mobility share−29%MaintainedMaintained
Rail in public transportationReaches 1%Reaches 3%Reaches 3%
Non motorized mobility shareMaintained in 1%Reaches 10%Reaches 10%
Average travel distance for cars+13%−25%−25%
Average travel distance for busesMaintained−36%−36%
Occupancy in private carsMaintained+6%+6%
Occupancy in busesMaintained+25%+25%
Power generationExpansion of the power system according to the least cost technologyExpansion of the power system following the PME guidelines by 2027. Diesel and heavy oil plants replaced by CCGTExpansion of natural gas power plants allowed until 2030 and their phase out by 2050
Sources: [16,17,51].
Table 2. Type of technology, installed capacity, and resource potential included in urbs.
ResourceTechnologyInstalled Capacity in 2019 [MW]Potential [MW]
WaterLarge DAM (>450 MW)10756975.6
Medium DAM (50–450 MW)616369.13
Large ROR (>450 MW)19871920
Medium ROR (50–450 MW)7482229.8
Small ROR (<50 MW)6531365.25
Not defined-4061
SolarPV-US2567,500
PV-DG0n.a.
WindWind park onshore16.51000
GeothermalGeothermal plants0900
BiomassBagasse plants144.3n.a.
BiogasMunicipal Solid Waste Biogas7.26n.a.
Natural gasOCGT19.42n.a.
CCGT644.18n.a.
DieselICE1216.42n.a.
Heavy oilICE1359.91n.a.
PV-US: Photovoltaic utility scale, PV-DG: Photovoltaic distributed generation, OCGT: Open cycle gas turbine, CCGT: Combined cycle gas turbine, ICE: Internal combustion engine. Sources: [17,57].
Table 3. Freight Transport Characteristics.
Fleet Categorised by SizeLDVMDVHDV
No. of vehicles ×100013818997
Average traveling distances (km)17,00027,00030,000
Average load transported (tons)0.31.88.7
Table 4. Passenger Transport Characteristics.
Road FleetCarsMotorbikesBuses
No. of vehicles ×1000129043147
Average traveling distances (km)14,200600055,000
Occupancy rate1.71.120
Table 5. Passenger and freight transport demand and drivers.
Year20152020203020402050
GDP(billion USD)71.774.686.7115.8154.5
Population(millions)16.317.519.821.823.4
Freight demand (Gtkm)35.236.642.656.975.9
Passenger demand (Gpkm)94.5101.4114.7126.3135.6
Table 6. Passengers land transport demand in PJ.
LC ScenarioMod ScenarioDDP Scenario
Source203020402050203020402050203020402050
Electricity0.430.680.951.923.975.6821.4818.6615.31
Gasoline75.2974.9784.7420.867.068.9020.867.068.90
Diesel17.3417.2816.6211.359.867.8411.359.867.84
Natural gas6.2713.4814.6119.5514.699.63---
Total99.33106.42116.9253.6935.5832.0653.6935.5832.06
Table 7. Freight land transport demand in PJ.
LC ScenarioMod ScenarioDDP Scenario
Source203020402050203020402050203020402050
Electricity0.030.060.124.188.9815.424.188.9815.42
Diesel221.1279.2348.7184.5208.5247.1184.5208.5247.1
Total221.1279.2348.8188.7217.5262.5188.7217.5262.5
Table 8. Land transport electricity demand in TWh.
LC ScenarioMod ScenarioDDP Scenario
Source203020402050203020402050203020402050
Electricity0.130.210.301.703.605.867.137.688.54
Publisher’s Note: MDPI stays neutral with regard to jurisdictional claims in published maps and institutional affiliations.

