Article

Artificial Learning Dispatch Planning for Flexible Renewable-Energy Systems

by
Ana Carolina do Amaral Burghi
1,*,
Tobias Hirsch
1 and
Robert Pitz-Paal
2
1
German Aerospace Center (DLR), Institute of Solar Research, Wankelstrasse 5, 70563 Stuttgart, Germany
2
German Aerospace Center (DLR), Institute of Solar Research, Linder Höhe, 51147 Cologne, Germany
*
Author to whom correspondence should be addressed.
Energies 2020, 13(6), 1517; https://doi.org/10.3390/en13061517
Submission received: 18 December 2019 / Revised: 23 February 2020 / Accepted: 5 March 2020 / Published: 23 March 2020
(This article belongs to the Special Issue Modeling and Control of Smart Energy Systems)

Abstract

:
Environmental and economic needs drive the increased penetration of intermittent renewable energy in electricity grids, enhancing uncertainty in the prediction of market conditions and network constraints. Thereafter, the importance of energy systems with flexible dispatch is reinforced, ensuring energy storage as an essential asset for these systems to be able to balance production and demand. In order to do so, such systems should participate in wholesale energy markets, enabling competition among all players, including conventional power plants. Consequently, an effective dispatch schedule considering market and resource uncertainties is crucial. In this context, an innovative dispatch optimization strategy for schedule planning of renewable systems with storage is presented. Based on an optimization algorithm combined with a machine-learning approach, the proposed method develops a financial optimal schedule with the incorporation of uncertainty information. Simulations performed with a concentrated solar power plant model following the proposed optimization strategy demonstrate promising financial improvement with a dynamic and intuitive dispatch planning method (up to 4% of improvement in comparison to an approach that does not consider uncertainties), emphasizing the importance of uncertainty treatment on the enhanced quality of renewable systems scheduling.

1. Introduction

The world’s accelerated energy transition is transforming the ways in which electricity is produced, transported and consumed. Environmental and economic needs push the adoption of low-carbon technologies, including the increased deployment of variable renewable energy. In spite of the benefits brought by these solutions, the high penetration of intermittent renewable energy in electricity grids increases the uncertainty in the prediction of market conditions and network constraints [1]. Consequently, the importance of systems able to meet load requirements and compensate for fluctuating resources is enhanced. This brings the role of balancing production and demand for energy systems with flexible dispatch, emphasizing energy storage as a key changer for the future of the power sector.

1.1. Energy Market Participation

Renewable-energy systems (RES) with storage are able to provide certain flexibility between collecting energy from the source and sending electric energy to the grid, bringing the significant advantage of economically meeting peak demand. Renewable plants usually operate under contractual conditions with high security on produced electricity, such as power purchase agreements or feed-in-tariffs. Contract rules are predefined and low penalties are applied for under-fulfillment of scheduled electricity. In this conventional scheme, plant operation is relatively predictable, being planned according to the hourly or seasonally fixed electricity prices. As a drawback, competition is normally only among other renewable systems and additional financial benefits brought by the wholesale energy market cannot be achieved.
However, due to their flexible dispatch, participation in the spot market is foreseen for RES with storage, enabling relevant economic benefits for such plants, as well as a cleaner electricity trading and a more stable grid. In addition, this participation would allow renewable plants not only to compete among themselves but with all the players in the market, ensuring the pathway to a highly renewable energy mix.
Aiming to take part in such markets, RES with storage need to consider different regulations to adapt their dispatch to a new market operation. Instead of following fixed prices, bids come into place: the production amount and price for a certain interval of the day are placed and regulated by the market by a least-cost optimization. Trading sessions usually define the schedule for the day-ahead, with intra-day corrections. In comparison to the traditional schemes applied to RES, production bids that are not fulfilled are strongly penalized, typically by means of financial sanctions.
Therefore, it is essential to develop an effective dispatch schedule in accordance with electricity market conditions and the available resource. Considering that RES rely on natural resources, weather forecasts need to be taken into account to accurately predict the possible amount of energy offered to the grid. Given that forecasts include uncertainties and that strong limitations and financial drawbacks are applied to changes in schedule, the dispatch planning needs to be robust and take these uncertainties into account. Therefore, the uncertainty treatment in the energy delivery schedule is essential to ensure an optimal energy dispatch, usually with high dependency on the type and accuracy of weather and price forecasts.

1.2. Existing Dispatch Strategies

The dispatch schedule concerns a plan of production for a specific period, determining the timing and rate at which electricity is generated. Hence, an intelligent dispatch planning needs to be developed taking market characteristics, weather forecasts and plant best-operational practices into consideration. There is a broad range of grid-scale energy storage technologies, such as pumped hydroelectric storage, compressed air energy storage, batteries and thermal energy storage [2]. This work focuses on a strategy that aims an optimized production schedule, considering that any renewable system with storage can provide a flexible dispatch, with common resources and market uncertainties.
Different strategies for dispatch optimization of RES with storage have been already studied. Case studies for residential and commercial photovoltaic (PV) systems developed by [3] indicated that there is a potential opportunity to use dispersed PV + battery storage to enhance grid security. Reference [4] implemented a linear programming (LP) algorithm to optimize the dispatch of a grid-connected PV + battery storage system and compared it with a simple off-peak/on-peak (charging/discharging) strategy. Results showed that significant financial improvements can be obtained when the storage is operated under an optimized strategy. A real-time demand LP routine for a PV + battery storage system was also developed by [5], leveraging solar power and load forecasts to establish a load demand target adjusted throughout the day in response to forecast error. All these cases consider strategies that function well under the traditional market scheme for renewable systems, not taking into account the uncertainties and complexity of wholesale energy markets.
Considering a utility scale perspective, concentrated solar power (CSP) plants with thermal storage allow extended production of solar electricity to periods without solar irradiation. Dispatch strategies also play an important role for such systems and research on market participation has already been performed. A mixed-integer linear programming (MILP) was developed by [6] to optimize the dispatch for the day-ahead market, assuming perfect market price and weather predictions. A robust MILP was proposed by [7] to optimize the scheduling of a hybrid CSP-fossil fuel plant, including a robustness cost parameter to consider the uncertainties of possible delivery deviations. In [8] and [9], a robust linear optimization was introduced to model the solar energy uncertainty, in combination with a stochastic model to take the market price uncertainties into account. Reference [10] proposes a mixed-integer programming model to optimize the dispatch schedule that provides a target power-generation profile, combined with a simulation model that evaluates annual plant performance. Reference [11] used dynamic programming to derive optimal CSP bidding strategies at the Spanish energy exchange, considering deterministic solar resource and price information. A heuristic approach was developed by [12] to derive a CSP plant operation schedule, used to optimize financial income while considering plant best operational practices. Simulations showed the possibility of improved financial results when compared to a solar-driven strategy, with fast dispatch planning. This latter methodology was chosen to be applied combined with the proposed approach in the case study presented later this paper due to its fast computational time and intuitive application.
These works show the benefit of dispatch optimization strategies application on the operation planning of RES with storage. In comparison to baseline dispatch strategies, such as solar driven or off-peak/on-peak, financial income and load management improvements can be reached by the presented optimization algorithms. However, in all of them, the quality of developed schedules is exclusively bounded to the quality of the forecasts used for the optimization. Apart from that, classical optimization methods, such as the widely used linear programming, are usually inflexible due to specificity of application to singular systems and to intrinsic uncertainty treatment. Also, these optimization methods are mostly based on strict deterministic rules [13], possibly producing not optimal solutions when the considered problem has to deal with several uncertainties sources, such as market price and available resource.

1.3. Machine Learning in Energy Applications

Recommended for cases that involve complex tasks, but no existing fixed equation, machine-learning techniques have been already applied in power systems. A machine learning approach for power-system security assessment has been developed by [14], which highlights that human expertise is necessary to help derive security information. A fuzzy decision tree algorithm for power systems stability assessment has been presented by [15], concluding that such an approach could be a worthwhile knowledge extraction and real-time decision technique for power-system issues. A machine-learning algorithm based on historical electrical grid data to predict the risk of failures for components and systems has been developed by [16] and presents positive results to assist New York City’s electrical grid maintenance. A review of machine-learning techniques for the prediction of wind-power generation has been undertaken by [17] and [18] has proposed an extreme learning machine-based probabilistic forecasting method for wind-power generation. Considering PV systems, [19] presents a site-specific prediction model for power generation from weather forecasts using machine learning techniques and [20] introduces an improved control strategy for a grid-connected PV system with battery in order to mitigate output power fluctuations. However, a machine learning application on the wholesale market dispatch problem for RES with storage is, to the knowledge of the authors, an innovative field.
Artificial intelligence applications to practical tasks are mostly based on constructing a model of the knowledge used by a human expert [21]. The dispatching case consists in a problematic that involves the knowledge of several experts, such as meteorologists, plant operators and market experts. Therefore, a tool that combines the knowledge from each field should bring important improvements for the dispatch planning. Apart from that, the professionals taking decision on the dispatch planning should be able to rely on scheduling tools, with greater advantage when they provide the flexibility of interaction and light comprehension. Decision-making should be performed with an interdisciplinary basis, involving weather and market aspects. Managing systems with increasing scale, complexity and infrastructures, power plant dispatchers are required to make a constant improvement of their capabilities with regard to higher professional knowledge and skills [22]. Considering that, an increase in complexity should be avoided, emerging the need for more intuitive tools and algorithms to support dispatchers’ planning decisions.
Considering state-of-the-art dispatch optimization strategies, a machine-learning approach is believed to improve schedule accuracy, being able to integrate historical data on the decision-making process. Taking the dispatch influencing parameters into account, such as electricity price, energy storage level and weather forecast, a machine-learning approach is expected to teach the system how to react differently depending on the variable situations, aiming to improve scheduling accuracy and reduce the delivery deviation while increasing financial income.
As one of the most well-known methods used for extracting classification rules from data, decision trees are a popular machine-learning technique that does not require a large number of parameters adjustments in their design [23]. Apart from comparable accuracy to other models, their main advantage is their explicit and easy-to-understand nature. The main reasoning behind the decision tree application as an artificial learner is not only due its abilities in analyzing data, but also the abilities of the human brain in interpreting and criticizing rules [24]. In addition to computational efficiency, the decision tree simple interpretation enables proper analysis of the system’s behavior, when compared to other learning techniques, such as statistical- or neural-based techniques. The change from the black-box nature of other learning methods is of significant importance for power systems engineers’ acceptance [15]. Therefore, it is also believed that such a system could be of high acceptability for renewable plant operators.
As a drawback, classical decision trees are highly unstable with respect to minor perturbations in the training data. Also, each tested input set follows one fixed rule and, therefore, has always one fixed output associated with it. In many cases, it would be interesting to have several rules related to similar input sets, leading to several output with different probabilities. Fuzzy logic brings an improvement in these aspects due to the elasticity of fuzzy sets formalism [18], and therefore a fuzzy decision tree technique can enhance the learning, already applied with success in several areas [25]. A fuzzy decision tree method is presented by [26], resulting in output with much lower variance than for standard trees, as a direct cause of the improved accuracy. A modification to combine decision trees with fuzzy representation is outlined by [23] with the intent to exploit complementary advantages of standard and fuzzy decision trees: the popularity of learning from examples and high knowledge comprehensibility of decision trees; and the ability to deal with inexact and uncertain information of fuzzy representation. The results obtained are shown to be most suitable for problems with both numerical and symbolic features, when the goal is high knowledge comprehensibility and gradually changing output. A fuzzy decision tree method applied to voltage collapse assessments has been developed by [27]. A fuzzy extension to decision trees is proposed by [28], considering the basic concepts of probability and utility theory.

1.4. Objectives of the Current Work

Dispatch optimization is not only essential for market inclusion and improved profitability of RES with storage, but also for researchers and policy-makers to better understand the performance of such systems under several weather conditions, plant operations and market scenarios.
In this context, an innovative dispatch optimization strategy for schedule planning of renewable-energy systems with storage under wholesale market participation is presented. The ALFRED (artificial learning flexible renewable energy system dispatch optimizer) algorithm is developed with the aim to develop a financial optimum schedule with the incorporation of uncertainty information. Based on expected electricity contract prices and weather forecasts, in combination with historical data, ALFRED derives a production schedule to be cleared for the day-ahead energy market. The algorithm generates an hourly power production profile for the next two days, updated every 24 h. The optimized schedule is used to control plant operational decisions, mainly related to energy storage charging and discharging. Adaptation to other horizons or update intervals is easily possible.
ALFRED’s strategy is designed to be applied for any renewable energy system with storage. The optimization algorithm can be chosen to suit a system’s characteristics, while the proposed uncertainty post-processing is applied to obtaining the final delivery schedule. As the main core of this contribution, the uncertainty post-processing is based on a fuzzy decision tree approach, including the benefits of machine-learning techniques into the dispatch problem.
In order to evaluate its functionality, a CSP plant was chosen to be simulated. As a utility-scale technology for renewable electricity generation, CSP plants concentrate solar radiation, through the use of mirrors, into heat energy in a fluid, which is then used by a power cycle to generate electricity. Efficient thermal storage is the great differential of CSP among other renewable-energy systems, allowing electricity production to large periods even when the sun is not shining. Considerable reductions in thermal generation fuel and ramping costs can be achieved by substituting variable renewable generation resources with CSP, establishing this technology as a significant RES towards renewable-dominated and minimum-cost targets [29].
This works presents a novel dispatch strategy for renewable-energy systems with storage considering uncertainty treatment in an intuitive manner, based on the application of a fuzzy decision tree. Section 2 describes ALFRED’s methodology in detail. Section 3 presents the annual results of a simulated CSP operation following the proposed scheduling plan. Finally, conclusions and outlook are discussed in Section 4.

2. Materials and Methods

ALFRED is a dispatch planning tool to be used by a renewable plant with integrated storage willing to participate in the wholesale market. It is based on a partitioned calculation between the optimization algorithm and uncertainty processing (Figure 1). Aiming at wholesale market participation with optimal financial income, the main optimization objective is to draw a schedule with electricity delivery during hours with high electricity price. As a novelty, the result of the optimization is then adjusted by the uncertainty post-processing. Considering the forecasted resource and expected electricity price as input, ALFRED derives the electricity delivery schedule for the day-ahead. As an innovative aspect, ALFRED learns from historical data in order to deal effectively with uncertainties of the dispatch problem.
This partitioned approach offers the possibility of flexible selection of the optimization algorithm. As previously presented, several approaches can be applied to optimize the dispatch, according to the characteristics of each system. Therefore, ALFRED’s strategy allows for the optimization algorithm to be selected in accordance with the renewable-energy plant under analysis, accepting the combination of several types of optimization methods and system models. The aim of this paper is not to propose a dispatch optimization algorithm, but a dispatch optimization strategy, which includes a certain optimization algorithm in combination with the uncertainty post-processing, the latest being the innovation introduced here. The uncertainty treatment, based on a machine-learning approach, can be applied for any selected optimization algorithm and includes several parameters, such as economic and seasonal aspects. The final delivery schedule considers not only the accuracy of the weather data but also market and plant characteristics, being adapted by the learning from historical data.

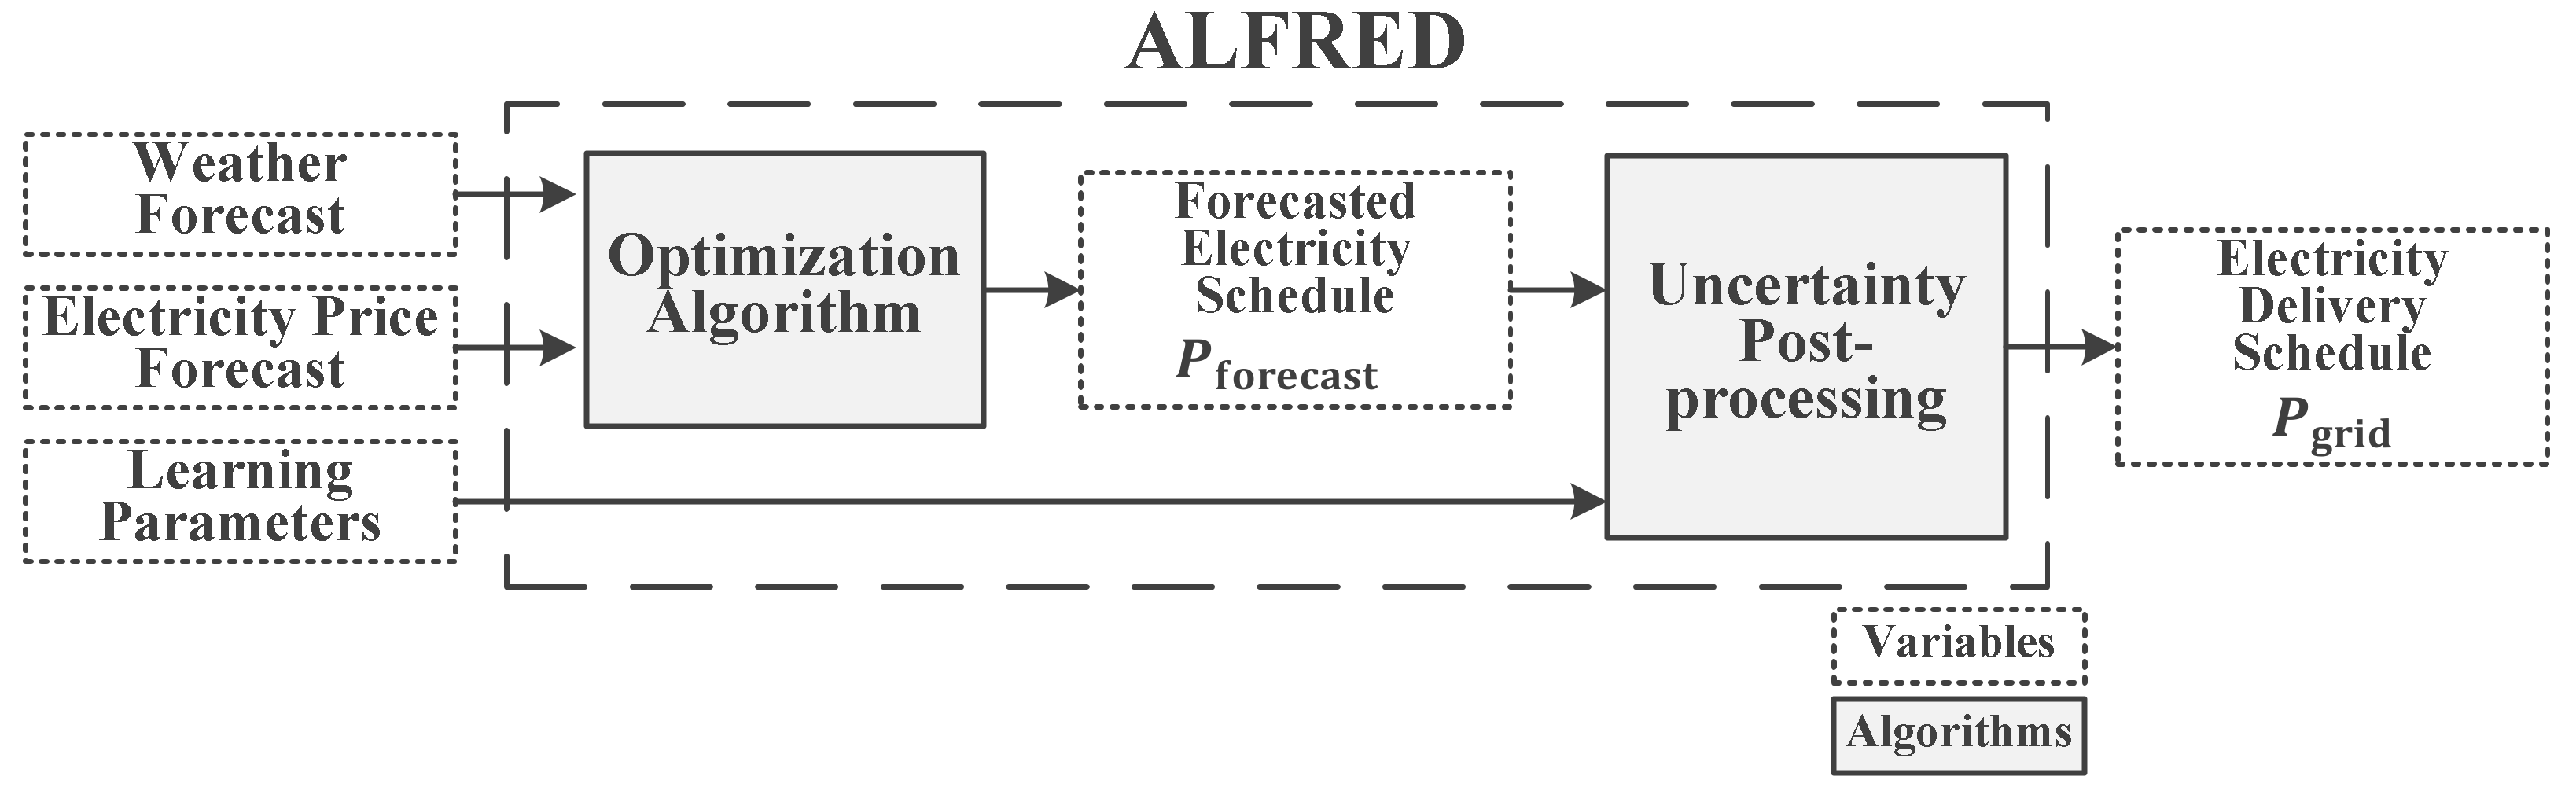
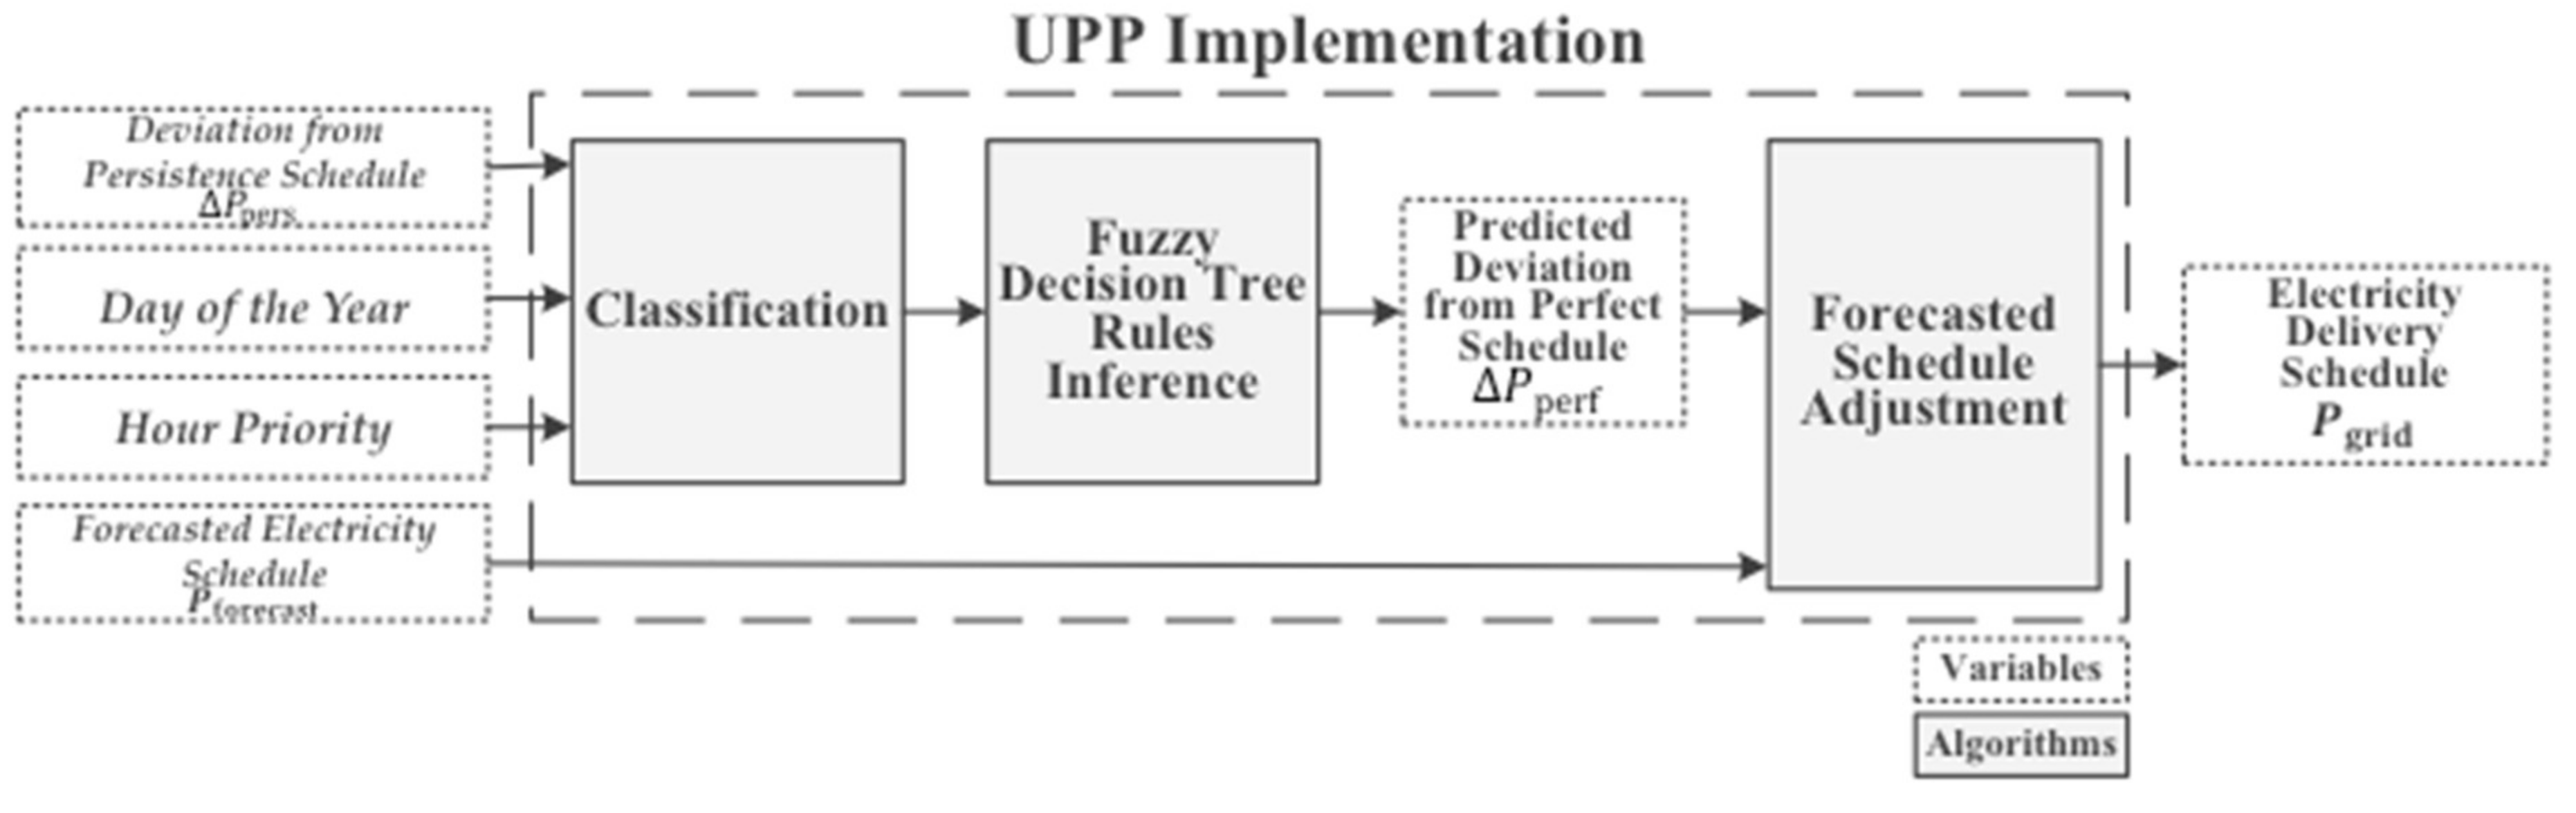
2.1. Uncertainty Post-Processing: A Machine-Learning Approach

Uncertainty post-processing (UPP) is implemented to determine a final electricity production schedule for the day ahead, based on the optimal schedule developed by the optimization algorithm in combination with the relevant influencing parameters. Aiming at more flexibility, the strategy taken should be selected individually for each situation, considering the system’s characteristics related to each decision moment. Consequently, each delivery hour is treated as a single decision problem, considering its predicted electricity price and expect amount of production. Based on a machine-learning approach, different systems’ reactions are learned according to the variable situations, with the goal to improve scheduling accuracy, reduce unfulfilled delivery and enhance financial income.
Although the dispatching problem consists in a regression case, as the amount of electricity to be produced should be defined for each hour, a classification decision tree was chosen to be applied by the UPP. A regression tree would be too complex and, therefore, not intuitive or even less accurate, as the tree rules would be developed based on all the possible values of dispatched power. An important criterion for selecting a classification procedure is not only the aim of producing an accurate classifier, but also to provide understanding into the predictive structure of the data [30]. With that, a classification tree is considered to be a best suitable method for the dispatch problem, allowing intuitive understanding for any expert willing to apply it.
With the aim of reaching an accurate optimal delivery schedule, taking uncertainties into account, the variables used by the UPP are the following:
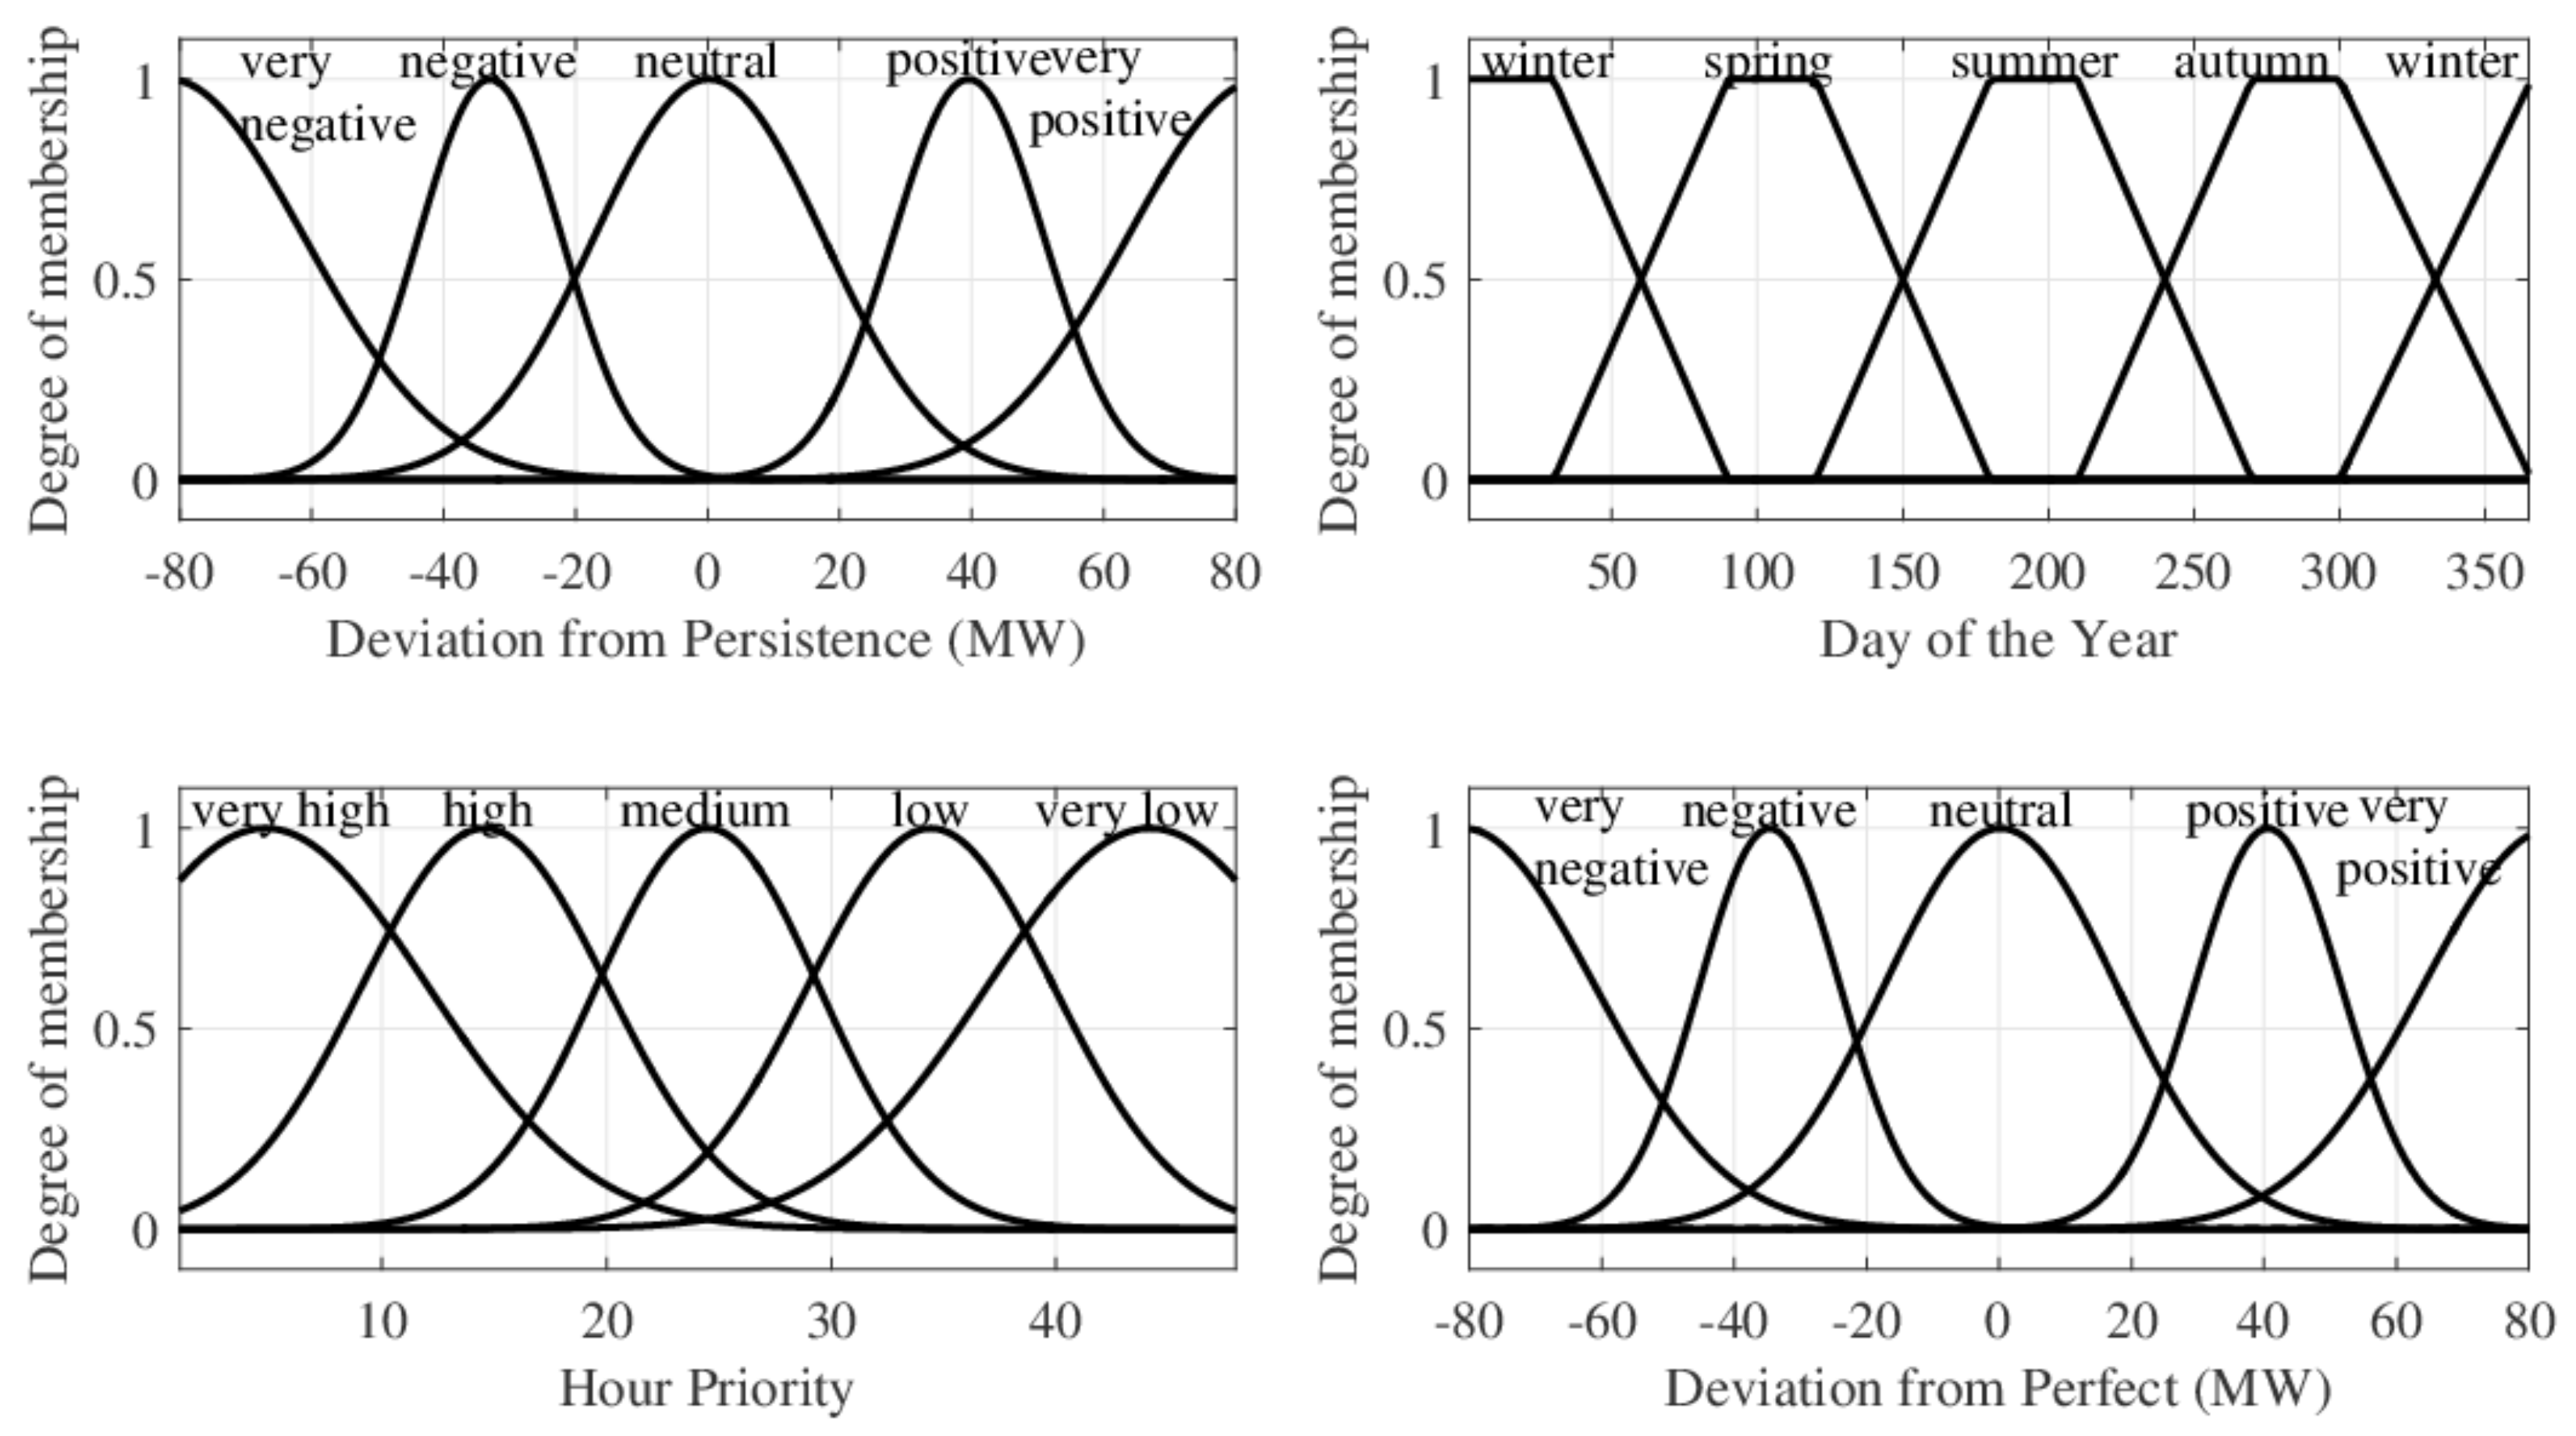
  • Deviation of forecasted electricity schedule from schedule obtained with persistence forecast. Persistence forecast is the benchmark in forecasting, used when no forecast product is available. This forecast considers the observation of the previous day as the following day’s prediction. Its performance is frequently acceptable, being considered as a challenging model to overcome. Therefore, the difference between the forecasted power schedule, obtained by the optimization algorithm, and the schedule developed based on a persistence forecast can support the decision for the following day’s scheduling, calculated as:
    Δ P pers = P forecast P pers
  • Day of the year. This parameter reflects seasonal influences on the dispatch planning, related to resource availability and price variations;
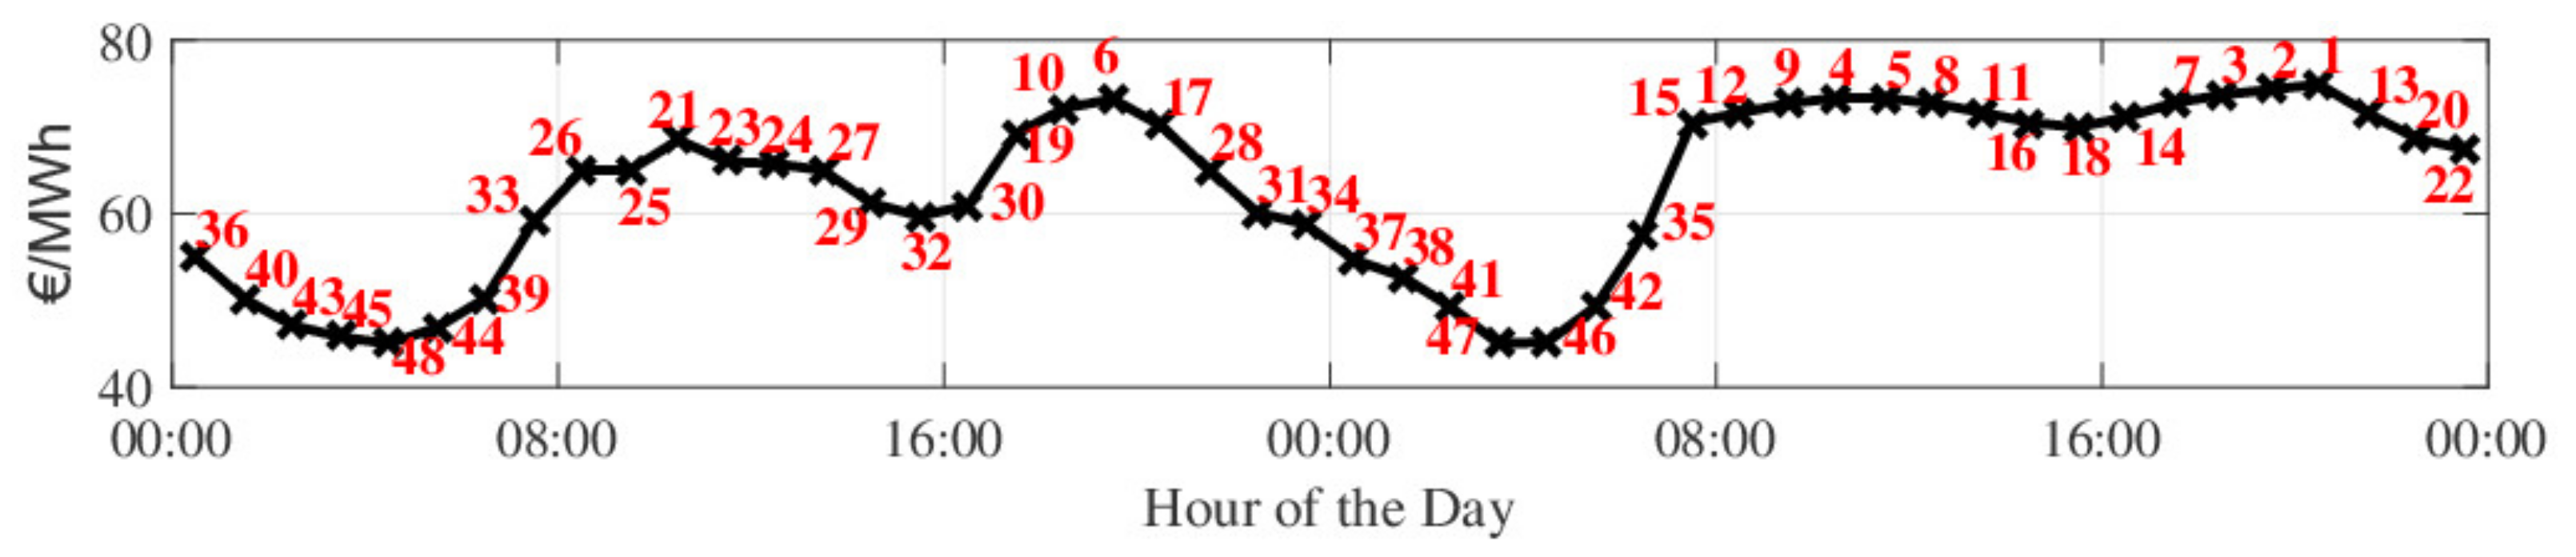
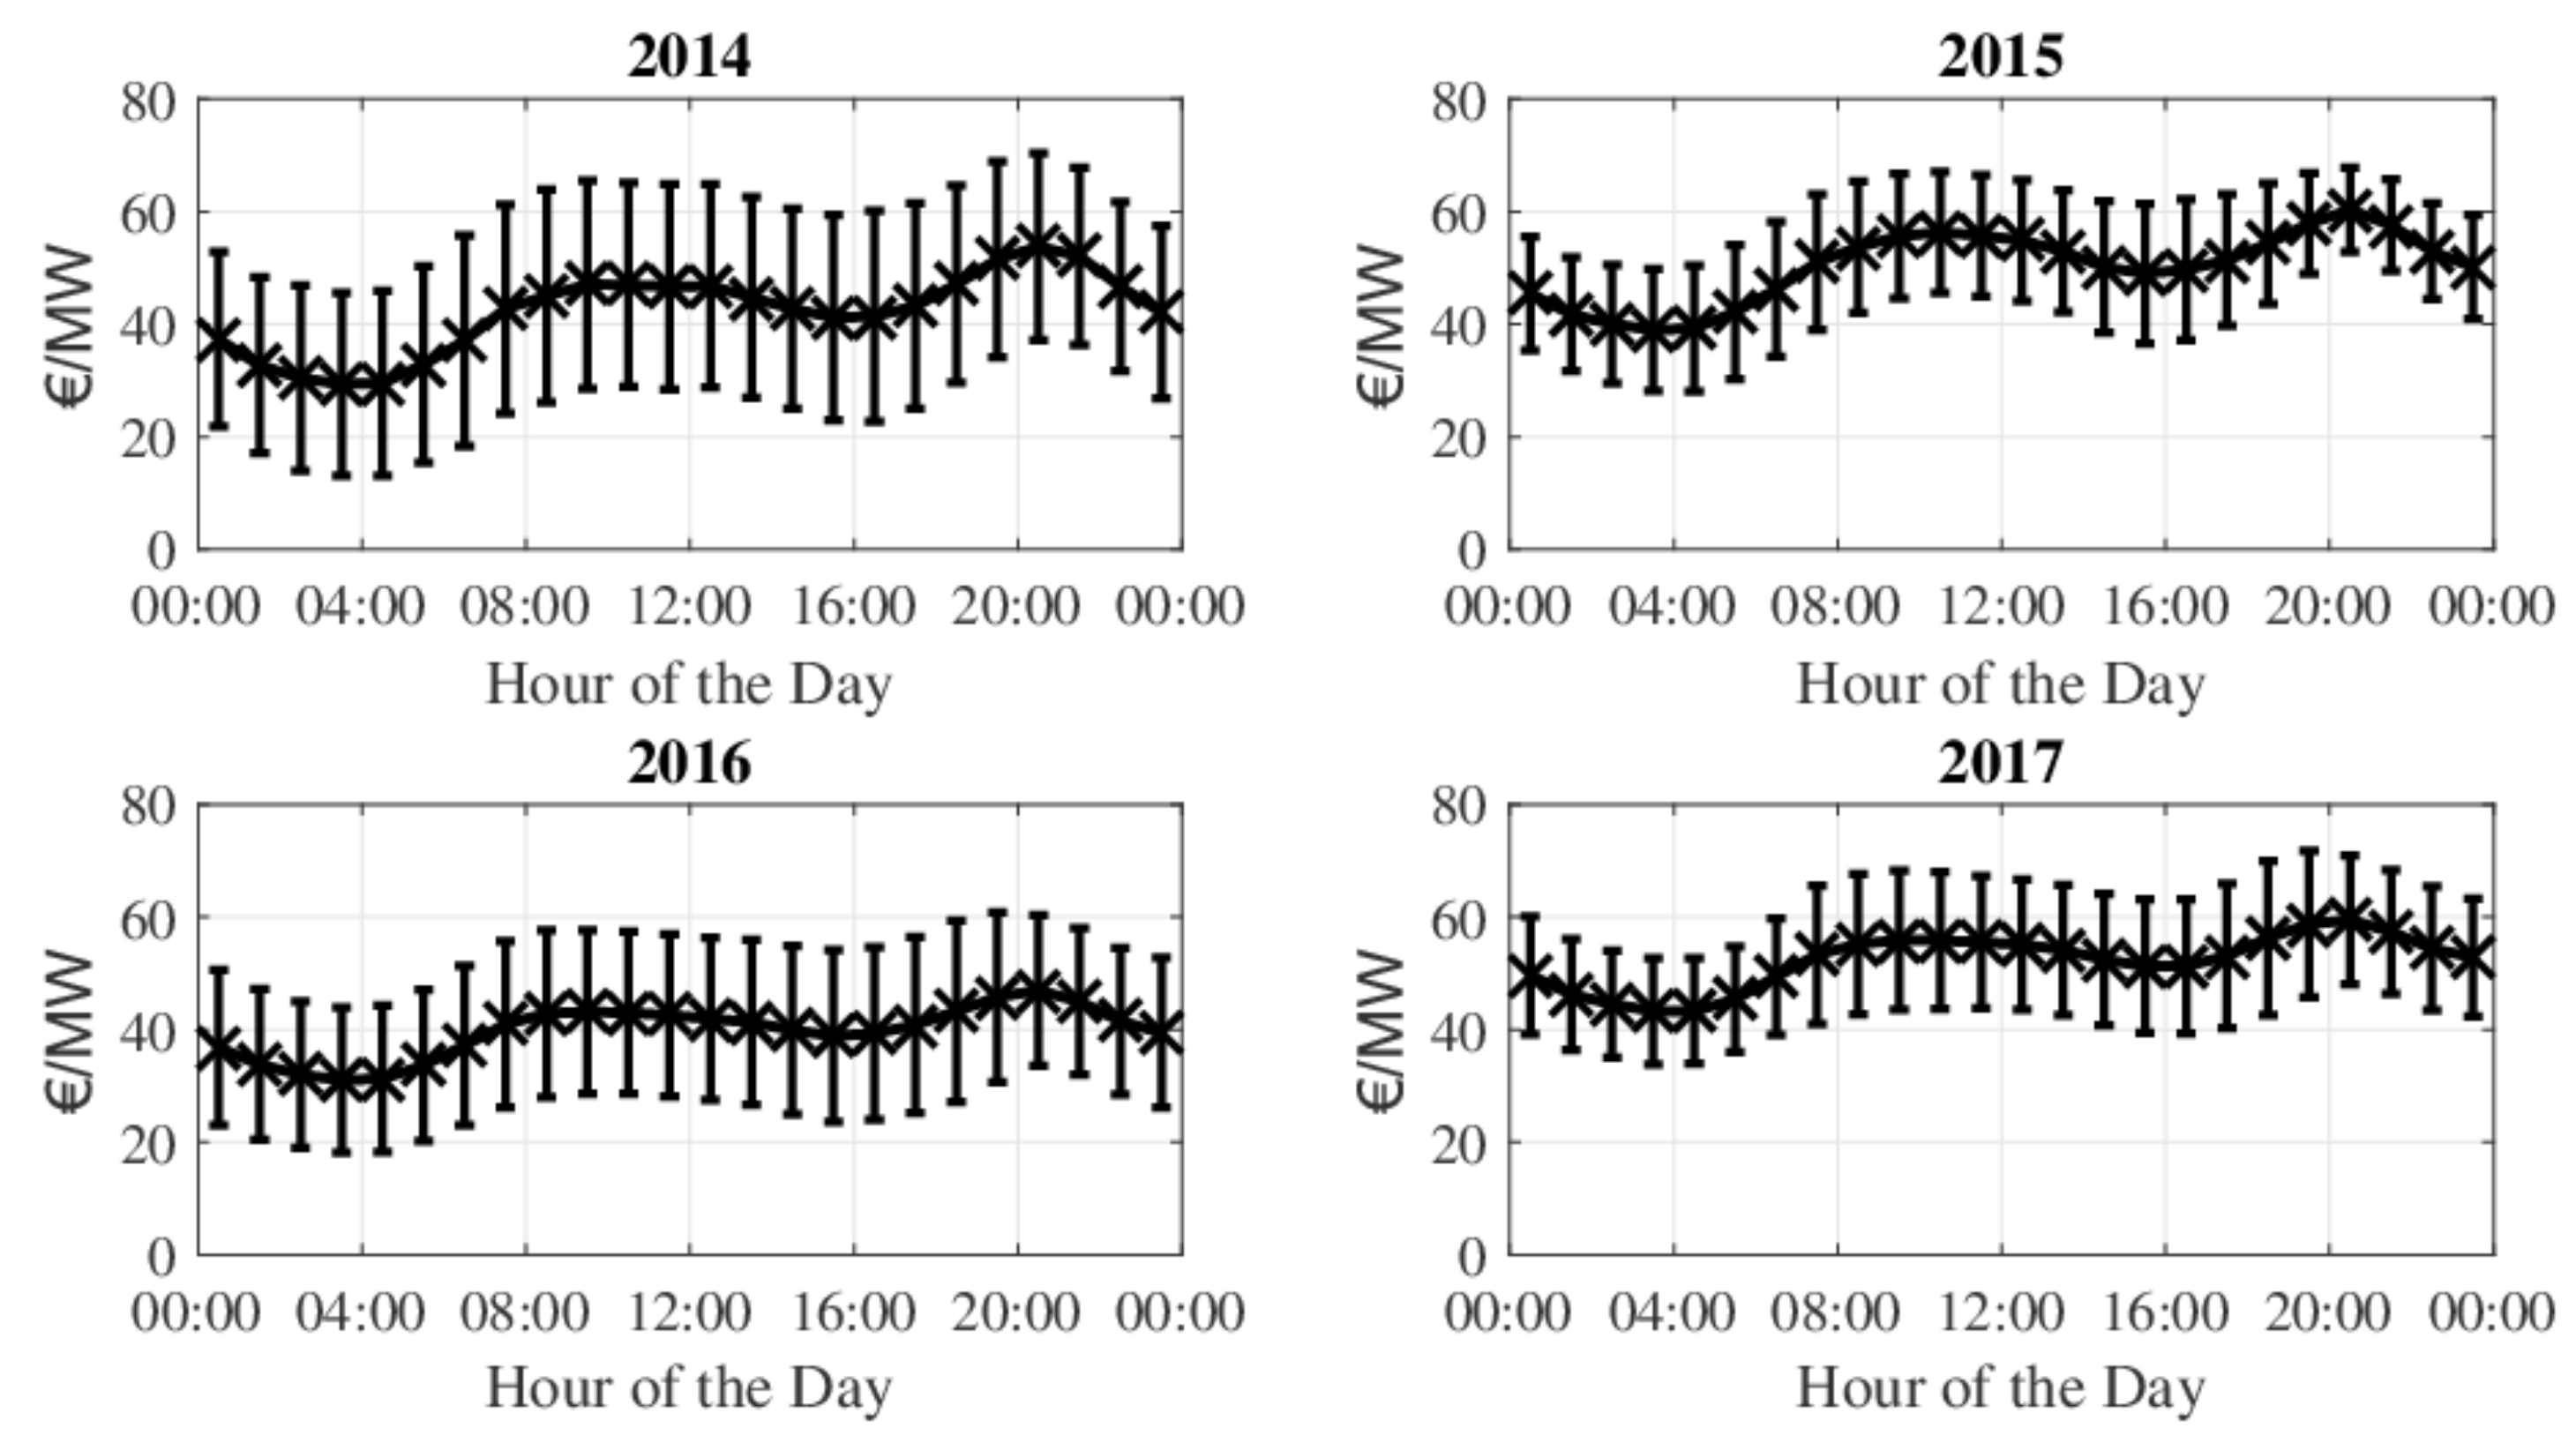
  • Scheduling hour priority according to market price. Time instants are categorized according to their price, reflecting the priority of when production is desired (Figure 2). Higher price hours have higher priority, in a decreasing order until the lowest price. For hours with same price, higher priority is given to the earlier one, as energy losses are expected to be avoided, if production occurs earlier, and the meteorological forecast is usually more accurate for prior time instants;
  • Deviation of forecasted electricity schedule from schedule obtained with perfect forecast. A perfect forecast considers the real weather observations as the prediction. A schedule based on this forecast is considered as the real optimum, with no uncertainties. Therefore, the perfect forecast delivery schedule is the objective to be reached. The difference between the forecasted power schedule, obtained by the optimization algorithm, and the schedule developed based on a perfect forecast reflects the deviation in relation to a schedule that would follow perfect weather and market predictions, calculated as:
    Δ P perf = P forecast P perf
The UPP concept includes two main phases: development and implementation. The first phase consists in the training of the post-processing algorithm: the learning system is built with historical data from the specific renewable energy system in which it is desired to be applied. The second phase consists in the application of the post-processing algorithm: the learning system is used to define a final electricity delivery schedule to be cleared by the market. Both phases are described in detail as follows. For a clearer understanding, the UPP concept is explained based on its application to a 125 MW CSP plant with 10h storage, which is the system used for the simulations presented later in the results.

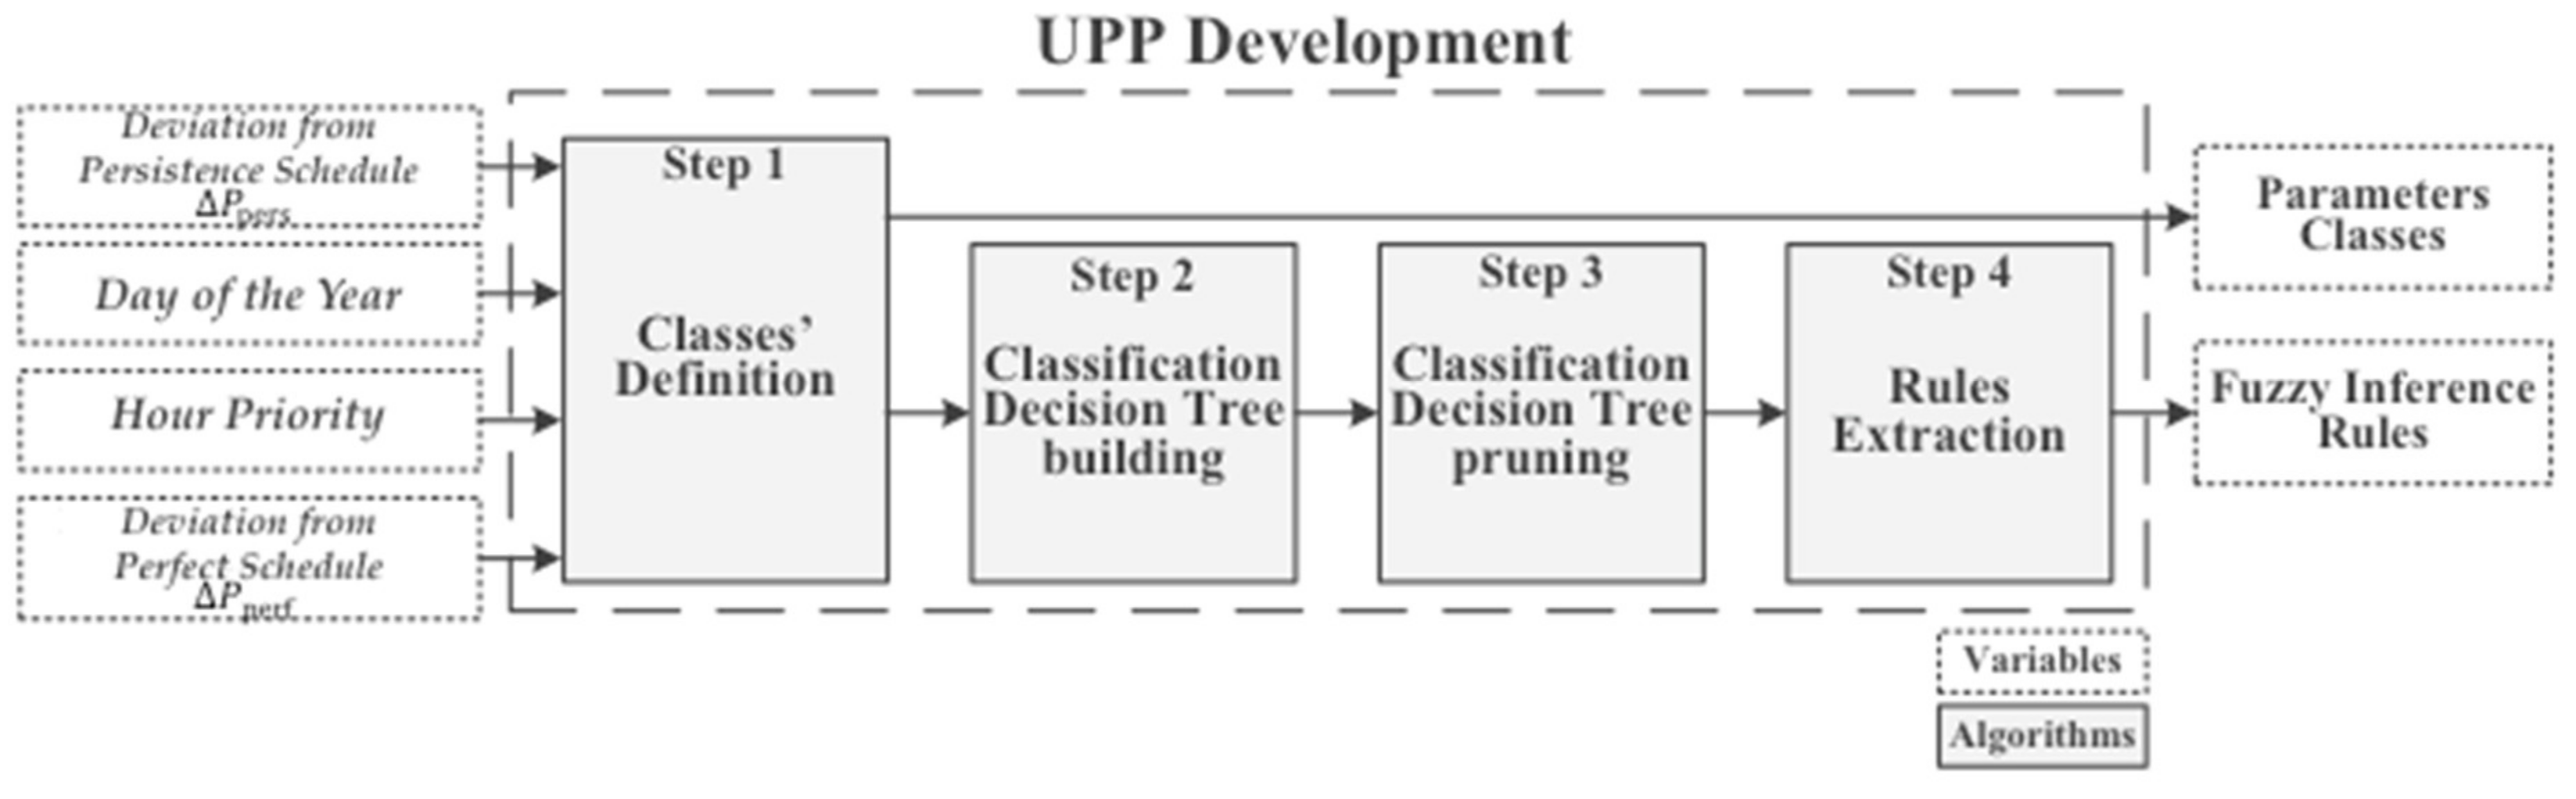
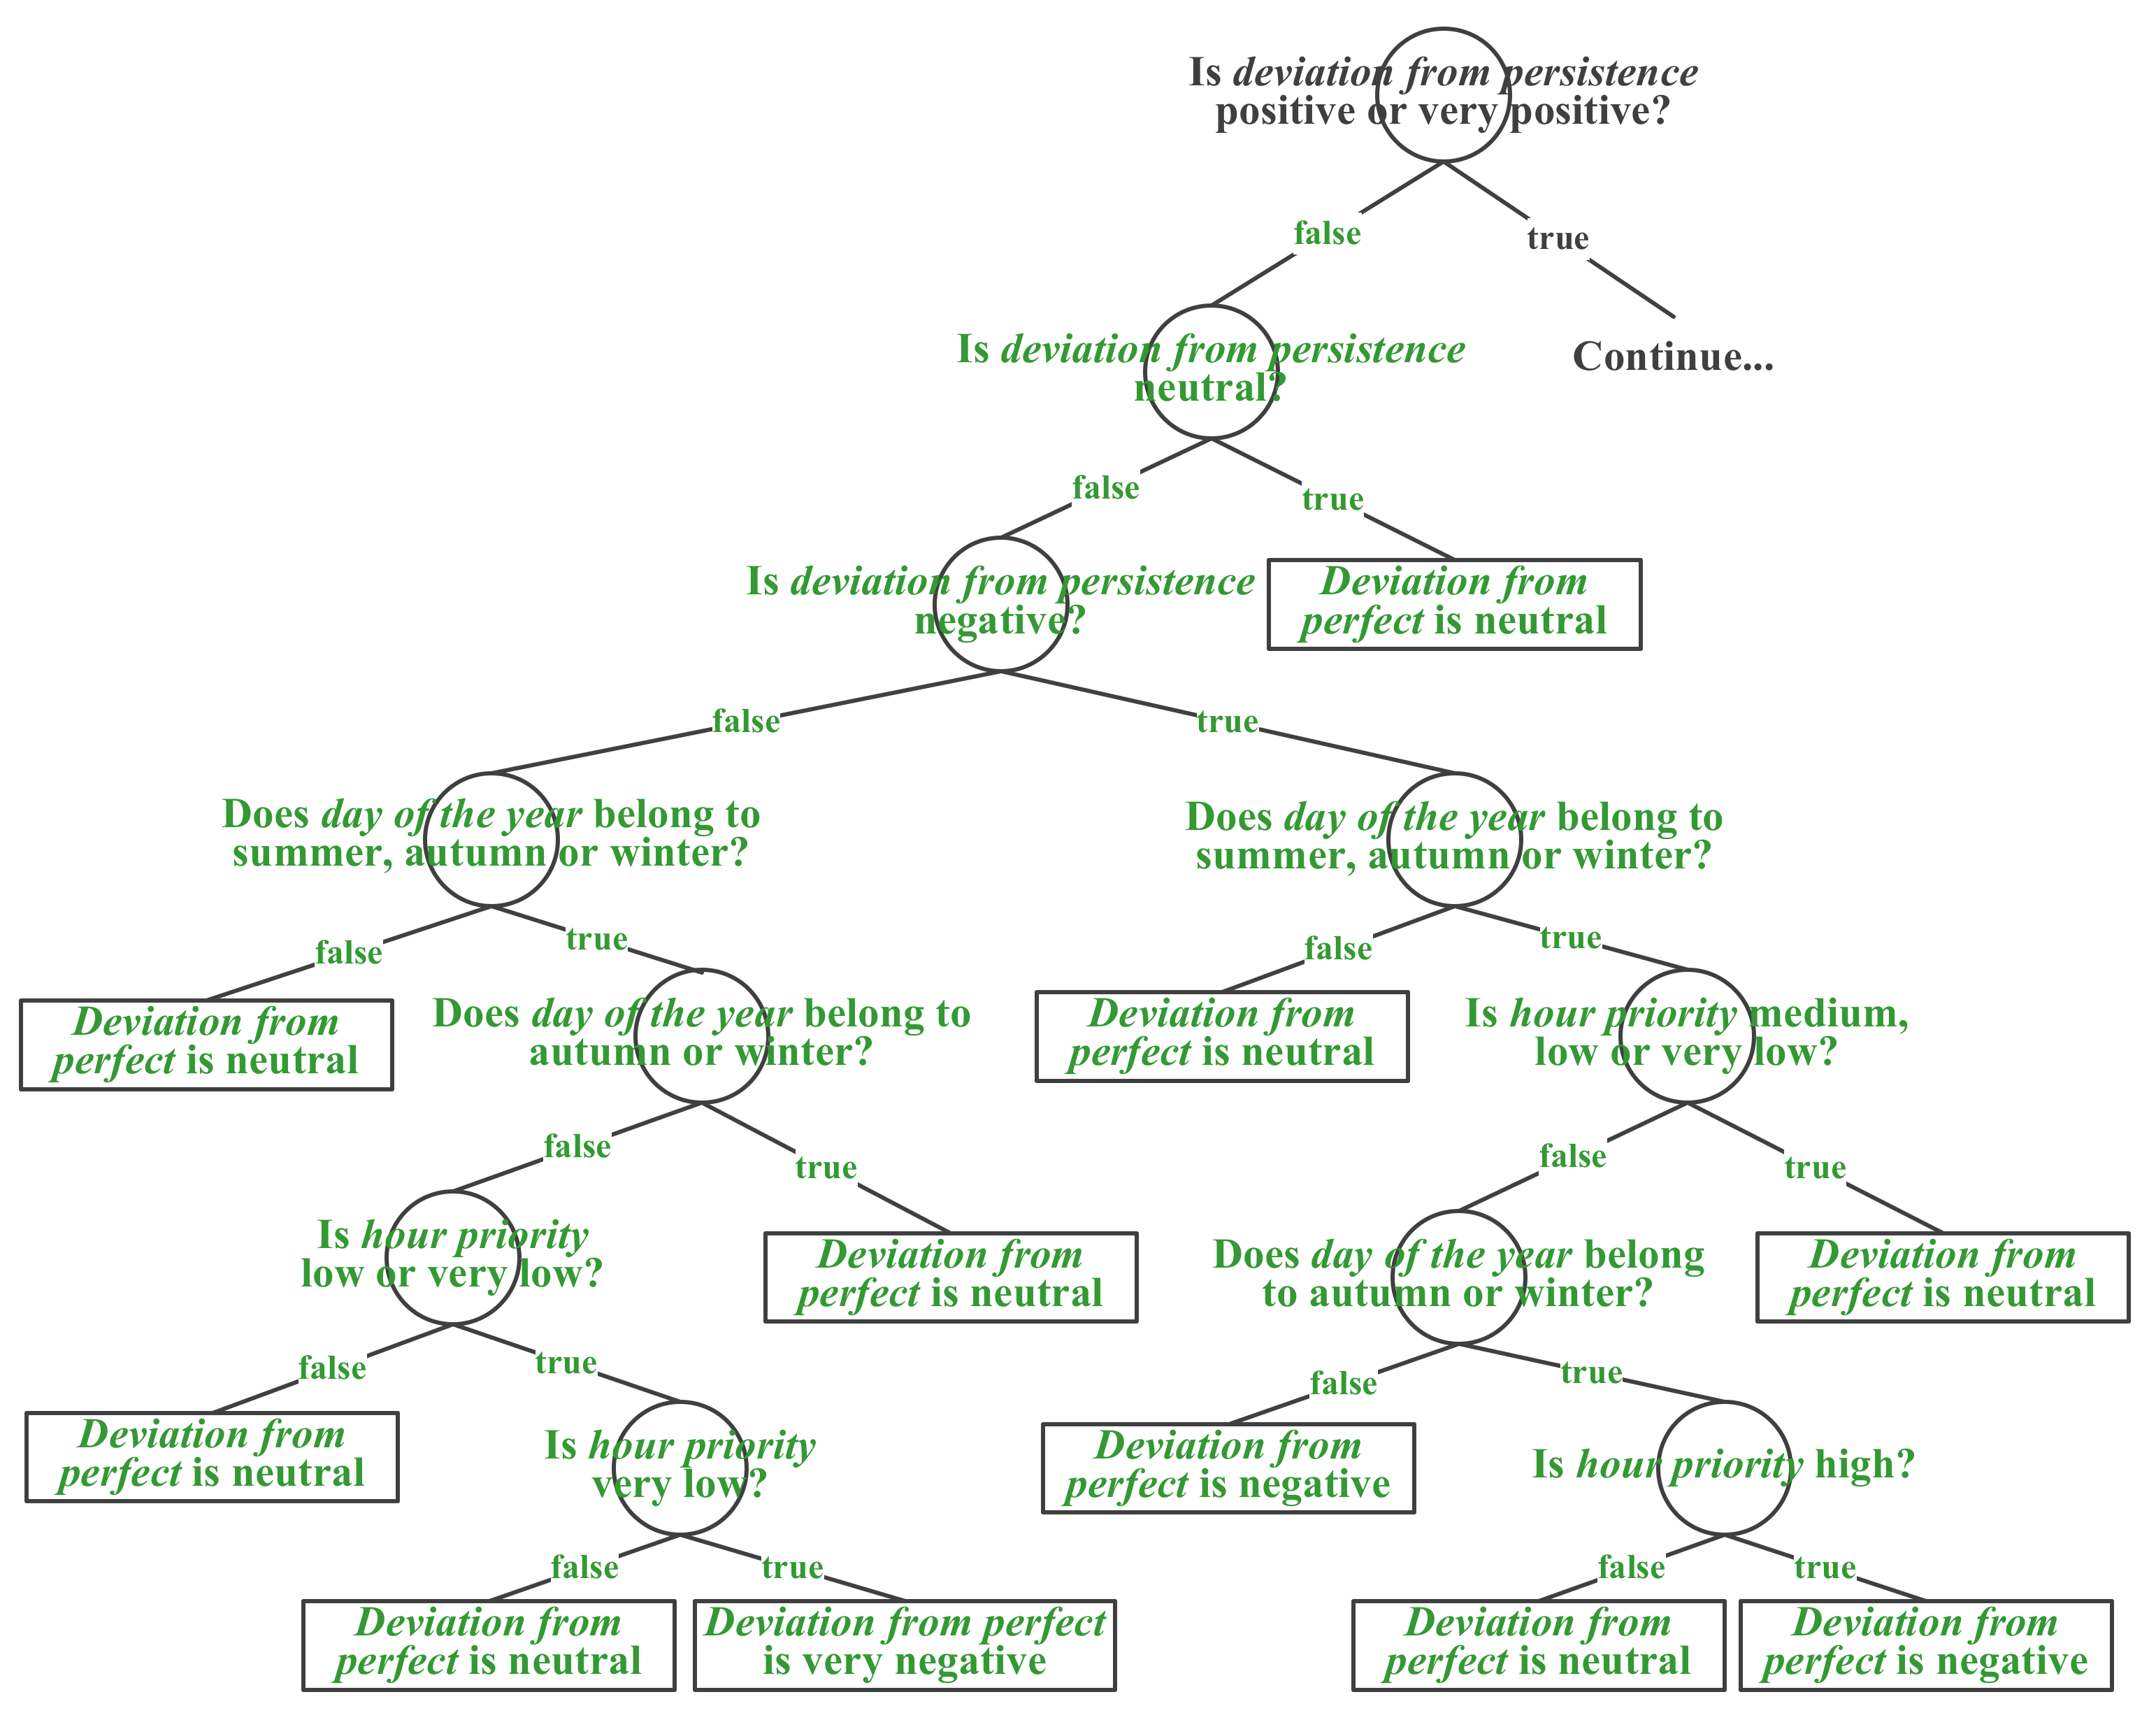
2.2. Uncertainty Post-Processing (UPP) Development: The Training Phase

The development phase of the UPP consists in the elaboration of the decision tree and the parameters classes. All the four parameters (deviation from persistence forecast, day of the year, hour priority and deviation from perfect forecast) are used as input, while the outputs of this phase are the defined parameter classes and the inference rules, extracted from the classification tree. Historical data are used to train the algorithm, consequently the classes and the tree are shaped according to the data. The UPP development is based on four steps (Figure 3), described in detail as follows.
Step 1: Classes’ definition. With the choice of using a classification tree as artificial learner, there is the need to define classes for all the parameters used in the algorithm. The unsupervised learning method of fuzzy c-means clustering was the one chosen to perform this classification. Unsupervised learning aims to reveal useful information in the form of new relationships, patterns or clusters through the data, to support the decision-making process. The fuzzy c-means clustering method is applicable to a wide variety of data analysis problems, generating fuzzy partitions for any set of numerical data. These partitions are useful to confirm known substructures or to suggest substructures in unexplored data. The aggregation criterion used to define the classes is a generalized least-squares objective function [31]. Apart from the need to create fuzzy classes, in order to later combine them with the fuzzy decision tree, fuzzy sets occur also as a natural tool to perform focused search and help discover dependencies in the data.
Considering the CSP plant application example, five classes were defined for each parameter (Figure 4). The classes of parameters deviation from persistence schedule, hour priority and deviation from perfect schedule are defined through fuzzy c-means clustering, but not of parameter day of the year. Thought to reflect seasonal variations, the classes of day of the year are previously defined as the yearly meteorological seasons, in which each season consists of three months. They are fuzzified by assigning full membership (degree = 1) for the second month of each season. This takes into account that the first and third months are still transitions between seasons, and therefore one single day can belong with different memberships to two seasons. For this last parameter, the classes are fixed independently on the used data or the system under study, while the classes defined by the clustering method vary according to the training data.
For the example case, the classes defined for both deviation parameters are very similar: varying from a negative deviation, once the forecasted schedule is lower than the one in comparison, to a positive deviation, when the forecasted schedule is higher. The classes defined for hour priority are equally balanced for high, medium and low priorities, while very high and very low classes have a wider range.
Step 2: Classification decision tree building. The decision tree is built according to the CART (Classification and Regression Trees) method developed by [30]. It operates based on a recursive partitioning approach, which subsequently divides the data into smaller portions to isolate most important variables. The definition of a subdivision criterion is essential to determine the best way to split the data. The fundamental idea is to select each split (represented by the tree node) aiming more “purity” on the data of the descendant subsets. Therefore, the Gini impurity is used as the splitting criterion, which calculates the improvement in classification from random assignments after each split. This criterion indicates how often some random data element from the data set would be incorrectly specified if it was randomly specified for a particular class. Considering the CSP plant application example, the class with higher membership degree is the one selected for each input data value to build the tree.
Step 3: Classification decision tree pruning. The used method for tree building grows a very large tree, by letting the splitting procedure continue until all terminal nodes (represented by the leaves) are either small or pure, meaning that all the node cases are in one single class. This developed tree is very complex and exact for the training data, but this does not mean that it will be the best one to deal with unseen data and make new predictions. Consequently, there is the need to reduce the tree into a more accurate and simple tree, but not simple enough not to be effective. Pruning is the process of reducing the original tree into an appropriate size. The method chosen here is the cross-validation: pruning is performed until only the root node is left (first node of the tree), and then an estimation of the misclassification cost of each subtree is calculated [30]. The final tree is the one with the lowest estimated cost.
Considering the classes previously defined for the CSP plant application, Figure 5 and Figure 6 outline the final decision tree and a part of a pruned branch, respectively. The final decision tree is simple and easily understandable, as a result of the CART method for tree building combined with the pruning process. To exemplify the pruning, the first left branch is considered. As a first decision criterion (first tree node), the deviation from persistence is analyzed. If the value under analysis is classified as positive or very positive, the evaluation continues to the right branch. If not, the left branch already reaches a decision result: the deviation from perfect is expected to be neutral. This leaf is the result of cross-validation applied to all branches outlined in Figure 6. In the unpruned tree, although many other decision criteria are taken into account, the great majority of leaves results in a neutral deviation from perfect. On the given example, only three leaves result in negative or very negative expected deviation from perfect. Therefore, by the application of the pruning method, the simplification taken for the final tree is considered to be more effective than a very detailed evaluation, with low probabilities of reaching a different result.
Step 4: Rules extraction. With the final tree selected, rules are extracted by interpreting the decision nodes. Although the rules are classical and deterministic, fuzzy inference is applied according to the previously performed fuzzy classification. The final adjustment value to be applied to the forecasted schedule is obtained by defuzzification, which is the process of producing a numeric result given the fuzzy sets and corresponding membership degrees.
Considering the final decision tree previously defined for the CSP plant application, a rule extraction example is outlined, based on the branches represented in blue in Figure 5. The rules for these branches are interpreted as follows:
Rule 1:
If deviation from persistence is very positive AND day of the year belongs to winter, THEN deviation from perfect is very positive.
Rule 2:
If deviation from persistence is very positive AND day of the year belongs to autumn or summer, THEN deviation from perfect is neutral.
After these three steps, the UPP is ready to be implemented. It is important to notice that different historical data sets will result in different classes and trees. This means that the parameters’ classes and the inference rules are adaptable, not only for different systems, as each of them has their own data, but also for growing data sets of a single system. As the amount of historical data increase along the operation time, the UPP development can be repeatedly performed once training data growth is relevant and new (and probably more accurate) classes and inference rules can be derived.

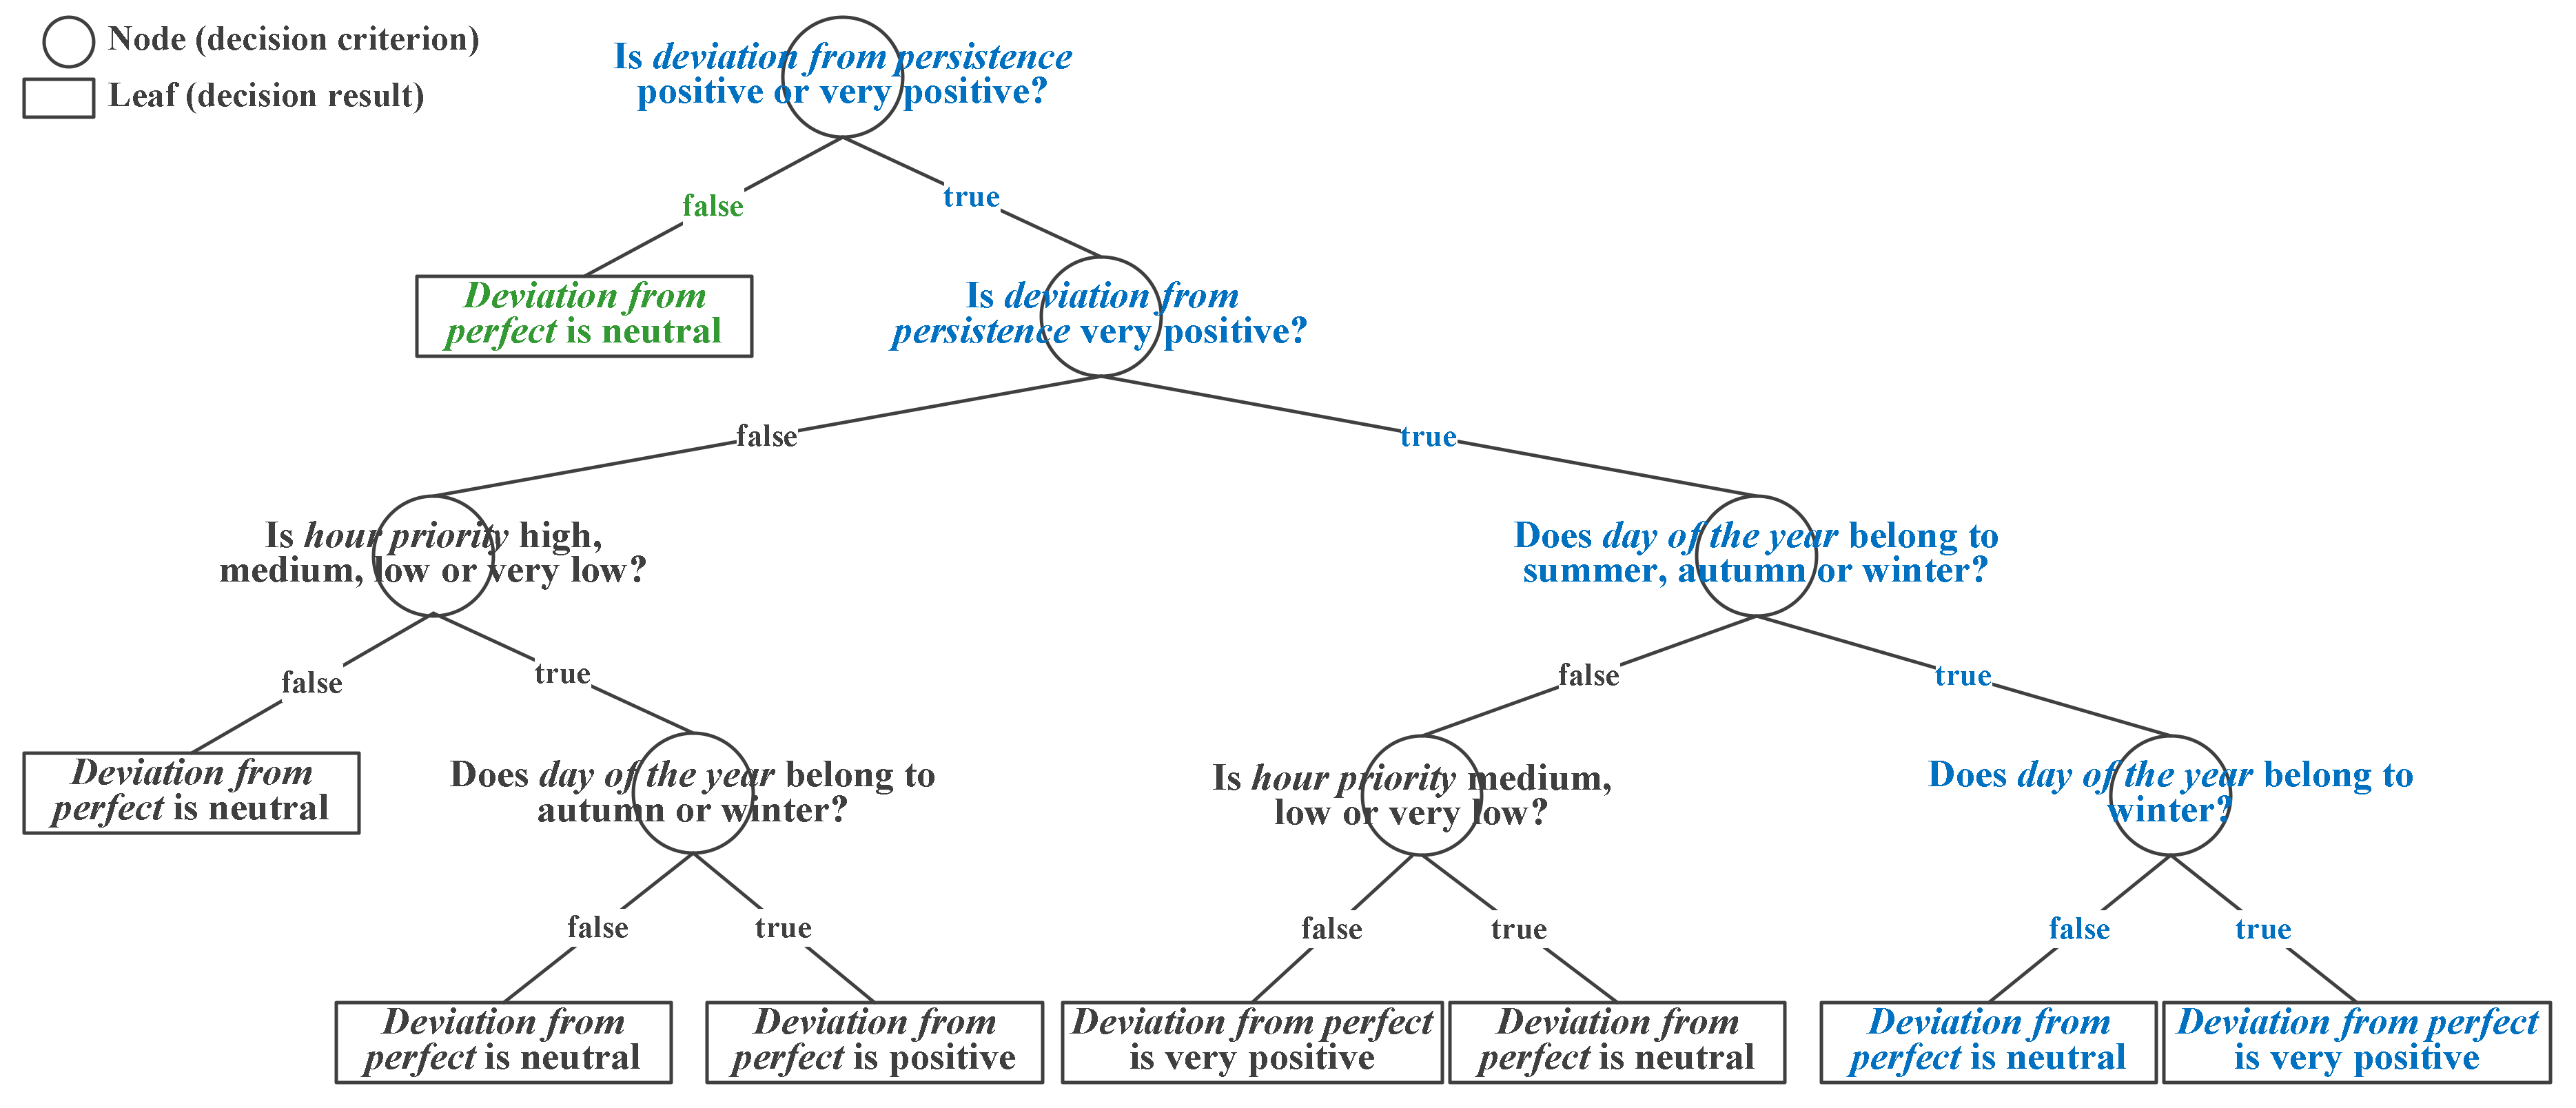
2.3. UPP Implementation: The Testing Phase

The second phase consists in the application of the post-processing algorithm, in which the learning system developed by the training phase is used to determine the final electricity delivery schedule to be cleared by the market. For this phase, deviation from persistence schedule, day of the year and hour priority are used as inputs, while the deviation from perfect schedule is the learning parameter, being the predicted value during the UPP implementation. The final electricity delivery schedule is then adjusted according to the expected deviation value, in order to be as accurate as the perfect schedule as possible. The UPP implementation can be explained in three steps (Figure 7), explained as follows.
Step 1: Classification. The input learning parameters (deviation from persistence schedule, day of the year and hour priority) are classified according to the fuzzy clusters defined during the training phase. The value of each parameter is transformed in a membership degree of a certain class, which is later used by the rules inference procedure.
Step 2: Fuzzy decision tree rules inference. By combining the rules derived from the decision tree with the fuzzy membership degrees defined by the classification, each rule can be analyzed and interpreted in a fuzzy way. The result obtained by this inference is the prediction of the difference between the forecasted electricity schedule developed by the optimizer algorithm and the expected perfect forecast schedule.
A numerical example is outlined: the input values for one specific hour are given in Table 1. According to the classification for this input set, Rules 1 and 2 previously presented are applied. Although an input value is given for hour priority, it is not considered by the analyzed rules, i.e., the priority of the hour does not influence the result for cases in which only Rules 1 and 2 apply. By classifying the given input, the following fuzzy inference is obtained, where the output membership degree follows the lowest input degree:
Rule 1:
If deviation from persistence is 80% very positive AND day of the year belongs 80% to winter, THEN deviation from perfect is 80% very positive.
Rule 2:
If deviation from persistence is 80% very positive AND day of the year belongs to 20% autumn, THEN deviation from perfect is 20% neutral.
In order to obtain a final adjustment value, a defuzzification method is applied. The centroid defuzzification is used, which returns the center of area under the output curve (Figure 8). The expected value of deviation from the perfect schedule for this example is then 43.3 MW.
Step 3: Forecasted schedule adjustment. At last, the predicted deviation derived by the rules inference is applied as an adjustment in the forecasted schedule developed by the optimizer algorithm, resulting in a final electricity delivery schedule (adjusted schedule in Figure 9), calculated as:
P grid = P forecast Δ P perf
Considering the previous numerical example and assuming that the forecasted schedule for this hour is 80 MW, the final delivery schedule would then be adjusted:
P grid = 80.0 43.3 = 36.7   MW
This procedure is repeated for each scheduling hour, giving flexibility to the decision making for each different situation, even when considering the same delivery day.
The UPP implementation is that applied at the ALFRED strategy during the operation of a renewable-energy system with storage. The presented steps are performed after the optimization algorithm, resulting in a final electricity delivery schedule developed not only based on weather and price forecasts, but also on the learning from past data.

3. Results

3.1. Simulations’ Data and Conditions

In order to evaluate the proposed dispatch planning strategy, simulations of a virtual 125 MW CSP tower plant with 10 h storage situated in Almeria, Spain, following the ALFRED schedule were carried out. The optimization algorithm selected to be applied in combination with the proposed UPP was the rule-based heuristic optimizer developed in [12], as this algorithm is suitable for CSP plants and also goes along with ALFRED’s strategy, having fast computational time and intuitive application. Its rule-based approach develops CSP energy delivery schedules with the main objective to plan a schedule that delivers electricity during times of a high electricity price. The plant model used for the simulations here also follows the description presented in [12], considering the exchange of energy between the power plant components in terms of heat flows: the energy collected from the solar field is stored in the thermal energy storage and then transformed into electricity by the power block. The simulations have been performed in MATLAB®.
The data sets’ availability consists in whole years of 2014, 2015, 2016 and 2017, in a total of 48 months of observed data together with corresponding deterministic ECMWF (European Centre for Medium-Range Weather Forecasts) weather forecasts, the latter referred as the “forecast product”. To analyze the UPP functionality, different combinations of training and testing data were considered. In all cases, the testing is based on one single year, either 2014, 2015, 2016, or 2017. For each year of testing, different setups of training data were considered: training with one year data, with two year data or with three years data. All possible combinations of training data have been evaluated as illustrated in Figure 10. Although future data cannot be used for present schedule planning in a real application, such a setup is used here to test the UPP artificial learning effectiveness for an entire year. Missing data or abnormal values have been solved by linear interpolation from previous and following time steps. Even though missing data is an important aspect under machine learning approaches, it is not a relevant issue in the data set used, as its occurrence is minimal. Apart from that, taking into account that the data time steps are from five minutes or lower, such an approximation is considered acceptable.
Both energetic and economic aspects are analyzed. The energetic indicators are the annual sum of the electricity delivered to the grid, the electricity scheduled but undelivered and the total thermal energy dumped by the solar field during the simulated year. As an economic figure, the resulting annual financial income is used. The setup assumes that the electricity is scheduled on the day-ahead market, considering schedule delivery at 12 h from the previous day and a penalty of 100% of the market price when scheduled electricity cannot be delivered. The electricity price forecast was considered certain, based on real day-ahead market price of the Iberian market in hourly resolution, see Figure 11.
Considering the same plant model, several variations of the schedule optimization were carried out:
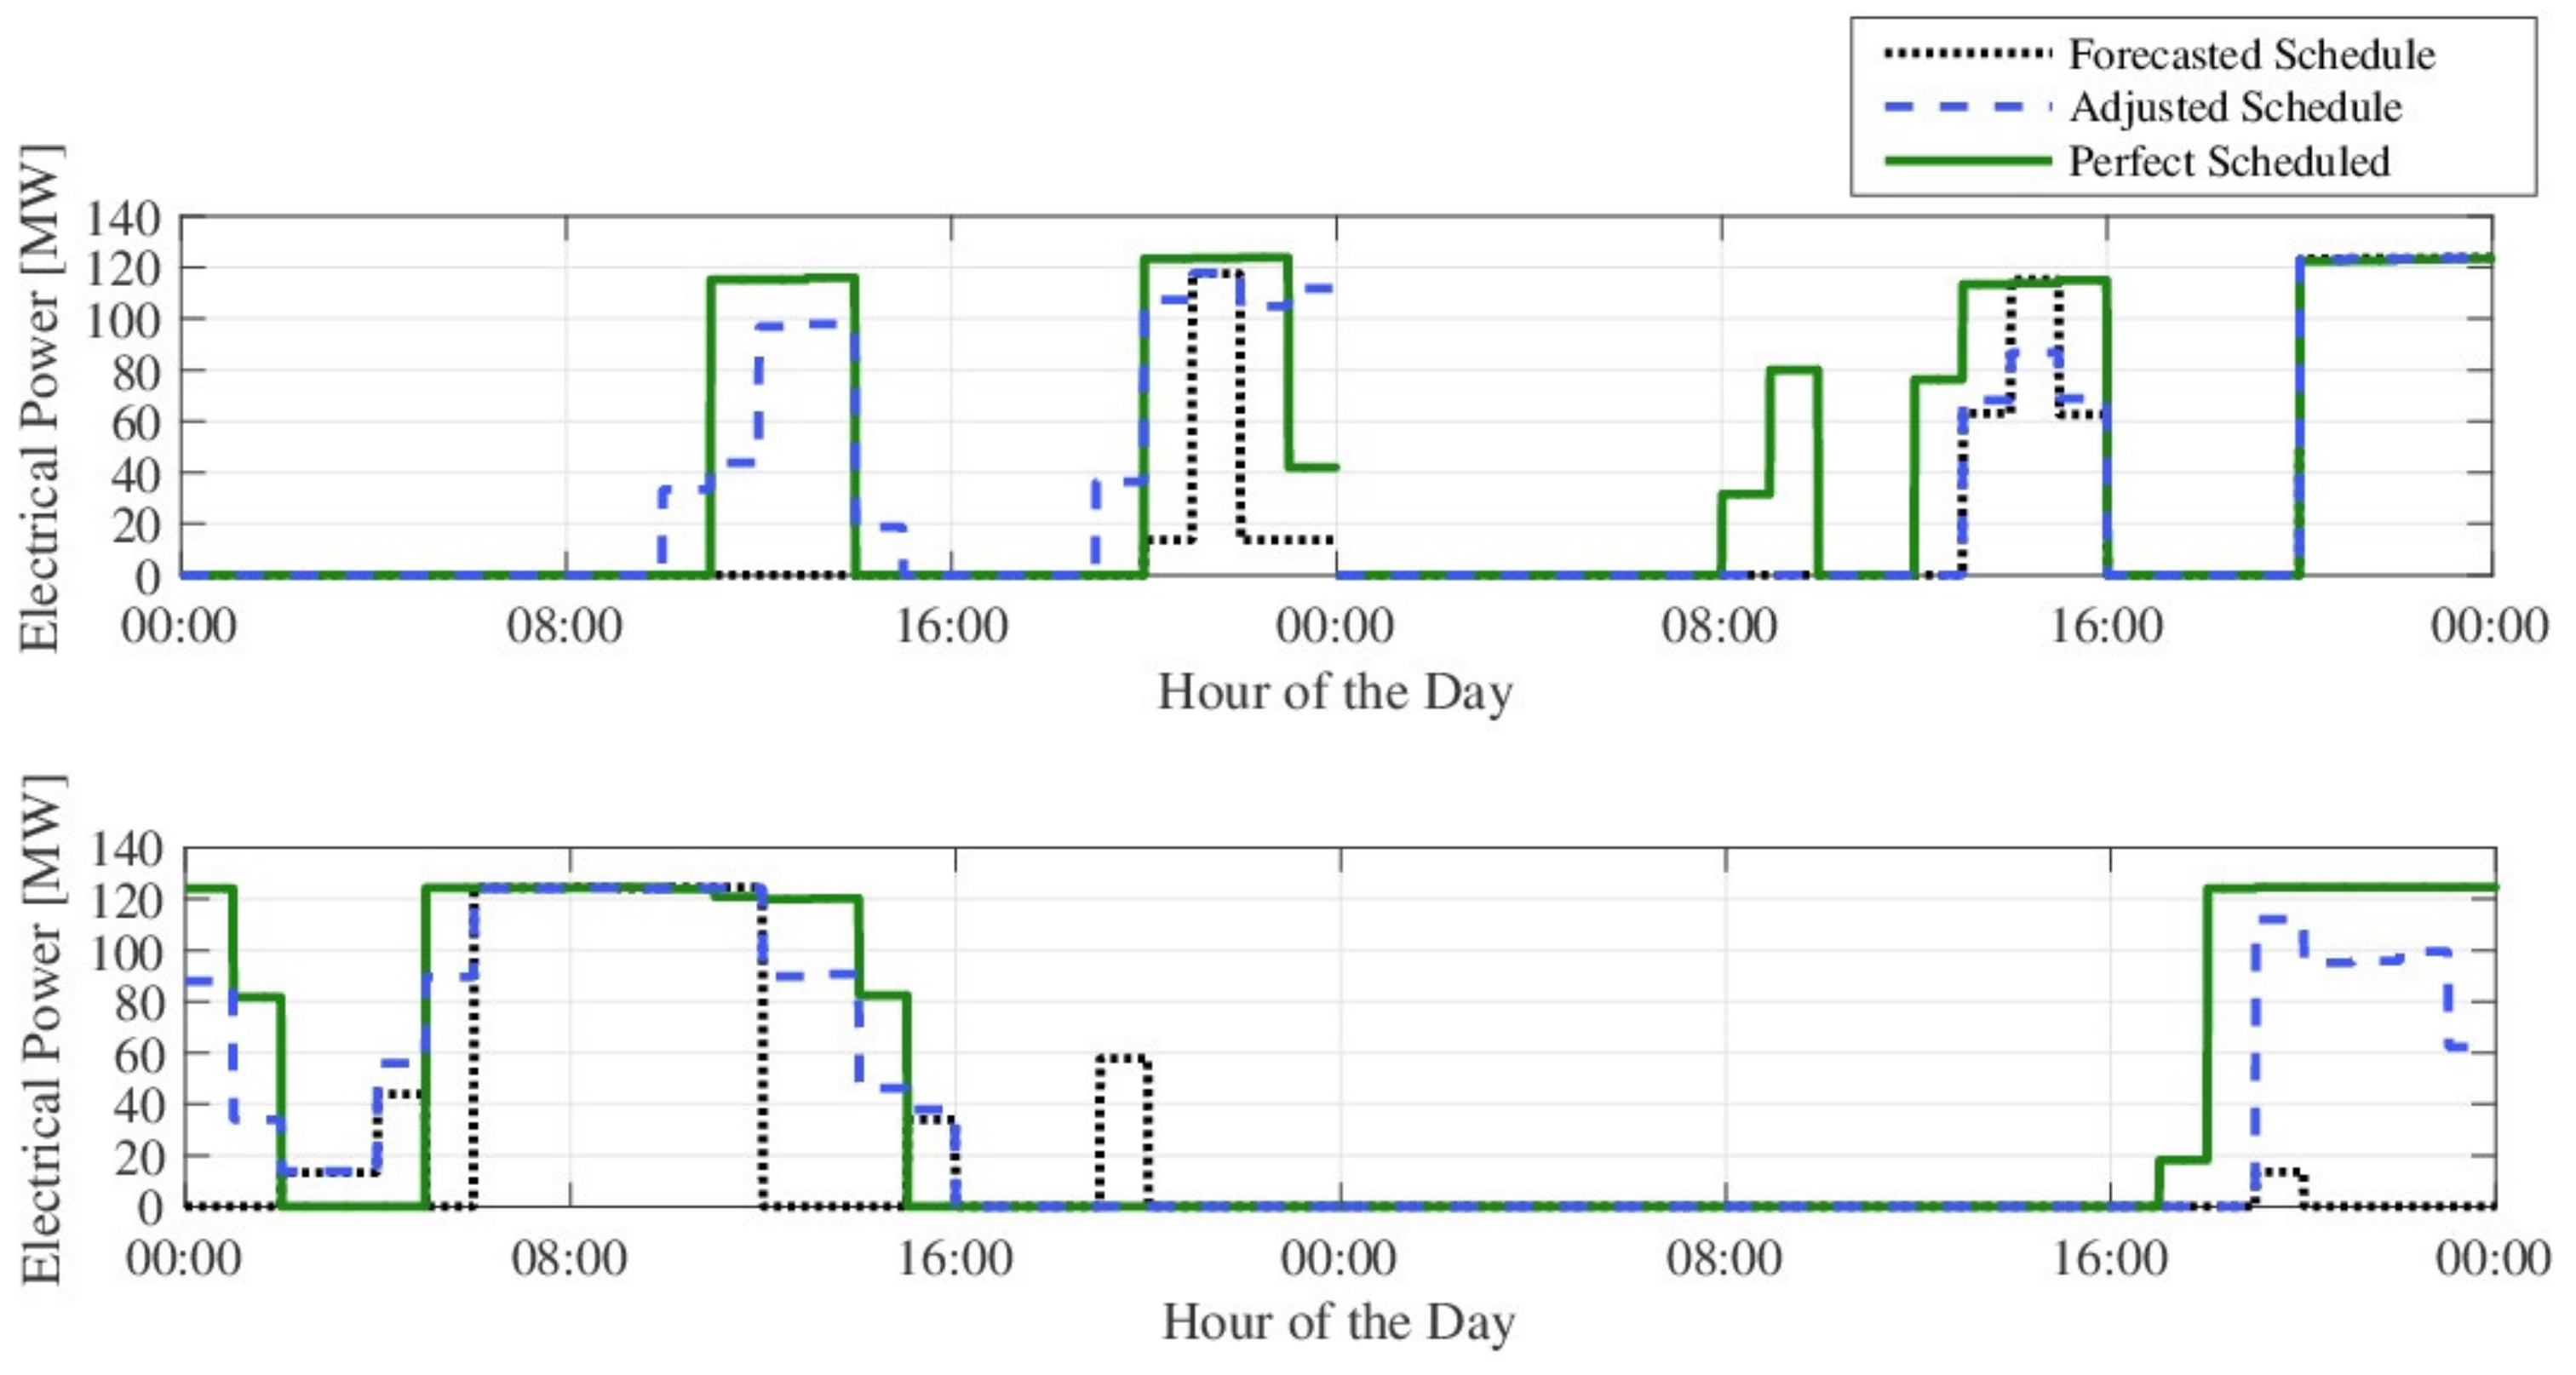
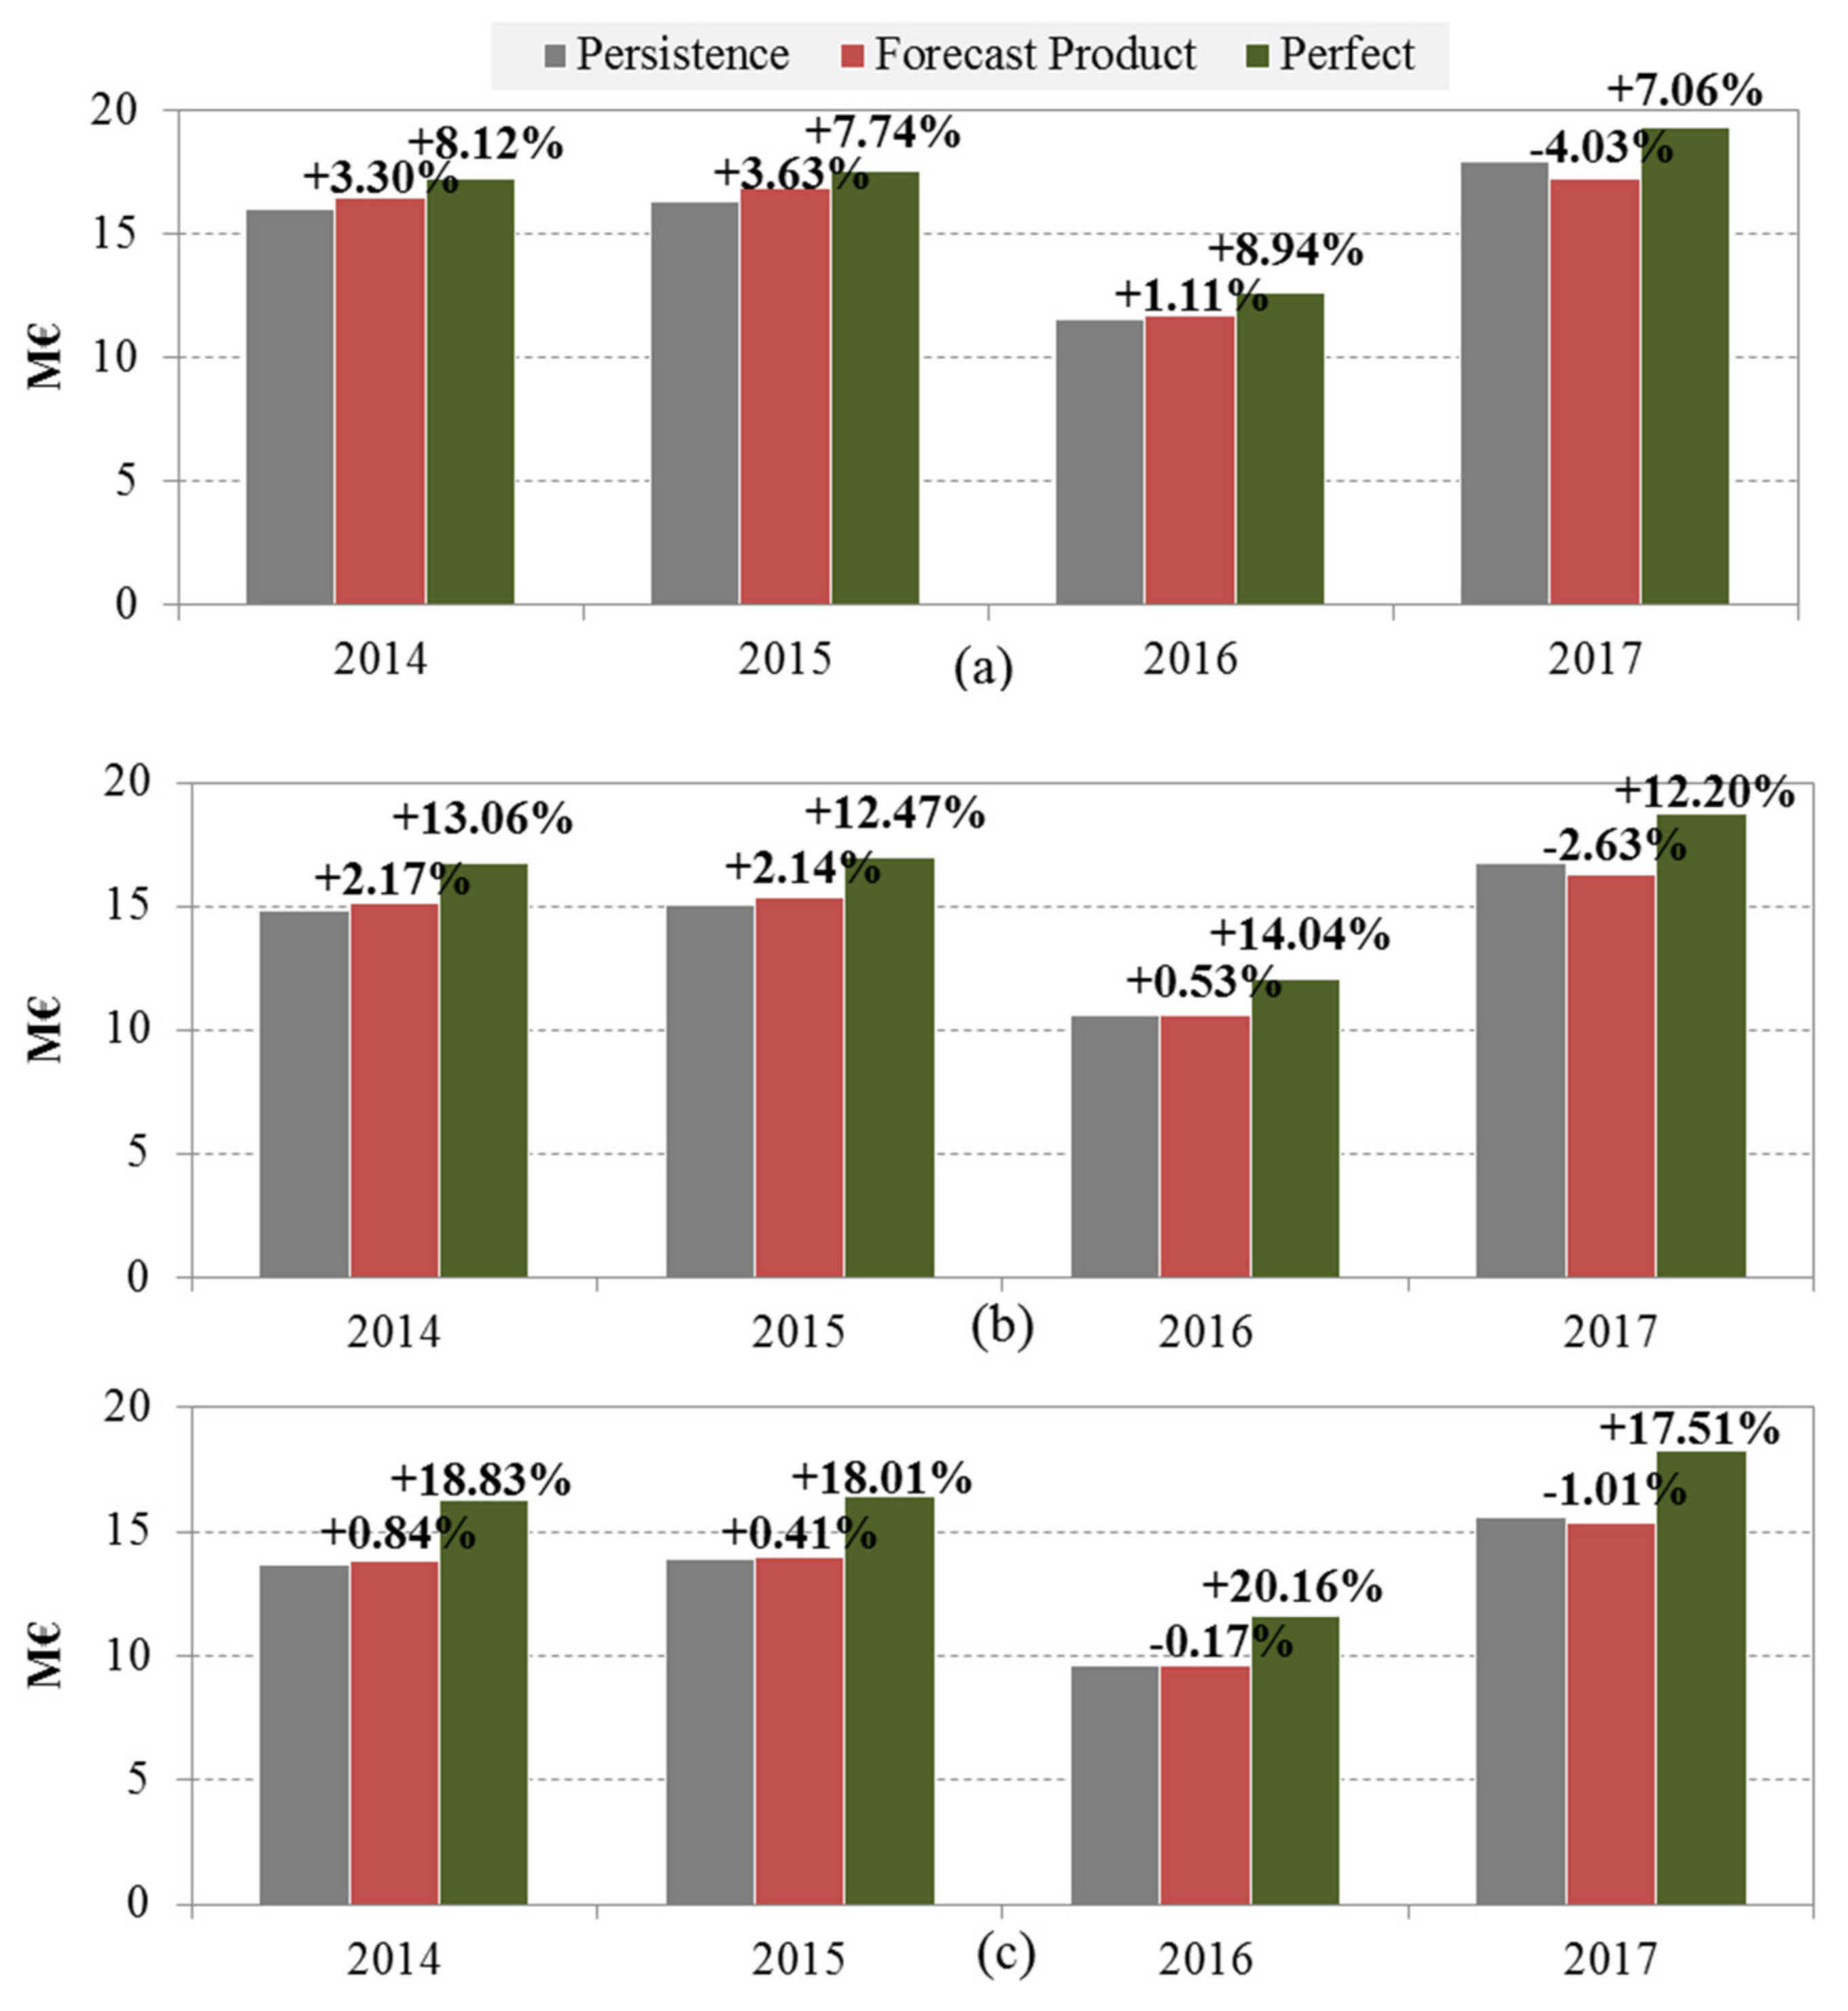
  • Persistence schedule: based on the optimization performed with the persistence weather forecast, used as benchmark for comparison;
  • Perfect schedule: based on the optimization performed with the perfect weather forecast, aiming to analyze the maximum possible benefit, when uncertainties do not play a role;
  • Forecast product schedule without uncertainty post processing (UPP) application: based only on the optimization algorithm applied with the deterministic ECMWF weather forecast, aiming to analyze an optimal schedule based on a weather forecast product, without considering the uncertainty processing;
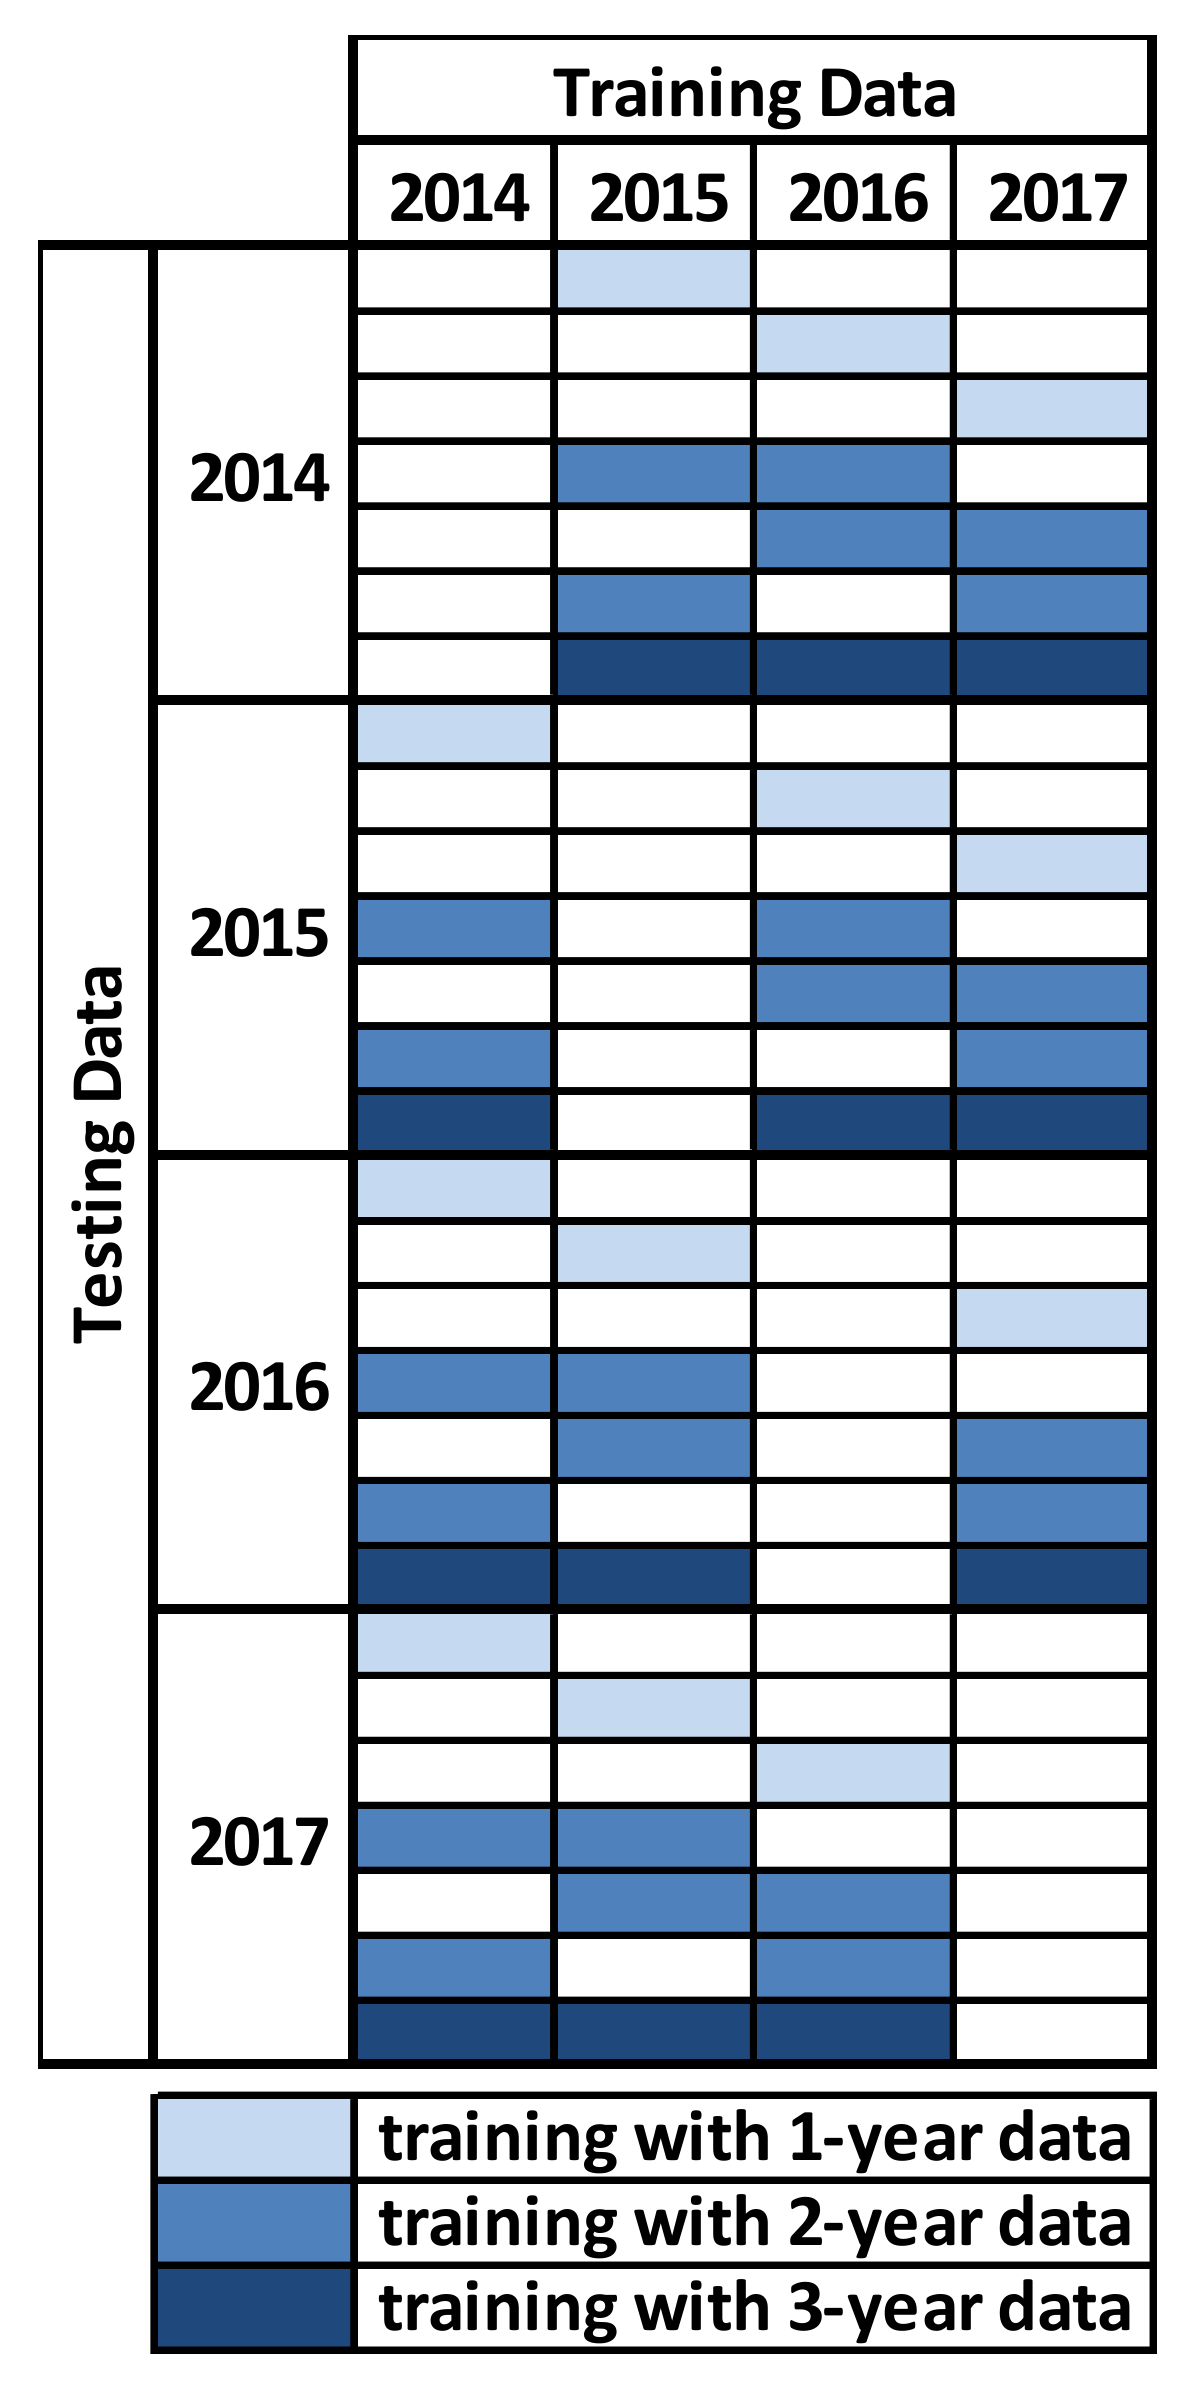
  • Forecast product schedule with UPP application: based on the complete ALFRED strategy, aiming to evaluate the effectiveness of the proposed artificial learner in combination with an optimization algorithm. This last scheduling setup was adopted several times for each simulated year, considering the different training data setups combination.
In order to assess the quality of the used weather data, the direct normal irradiation (DNI) yearly sum and the root-mean-square error (RMSE) were calculated. The RMSE is considered as one of the most important statistical metrics for the application of electricity grid management issues [33]. The values shown in Table 2 indicate that the DNI yearly sum of the forecast product is lower than that of the persistence and perfect forecast. This is observed for all simulated years, with larger difference for years 2016 and 2017. At the same time, the RMSE of the forecast product is lower than the one for persistence. The values indicate that the forecast product in general works well in reducing the error in the forecast compared to persistence. The systematic deviation in the annual sum might be reduced by an improved site-specific calibration of the meteorological forecast. Such calibration was not undertaken in the used forecast data sets.

3.2. Optimization Results without UPP Learning Application

At first, the results of using the schedule optimization without any uncertainty post-processing are discussed. Figure 12c shows the annual income of a setup with penalties of 100% on undelivered energy. The theoretical benchmark for the optimization is given by the green bars showing the results when a perfect forecast is used. The grey bars indicate the lower limit of the benchmark by using a persistence forecast which is always available at no additional costs. The difference between the annual income with persistence and perfect forecast is in the range of 17.5%. The red bars show the income when considering the forecast product. A small benefit compared to persistence is obtained in year 2014 and 2015 whereas a drop is found for years 2016 and 2017. The authors assume that the modest performance of the forecast product is linked to the systematic deviation of the forecast product compared to observed measurements.
Figure 12a,b show results for a modified penalty of 0% and 50%, respectively. In general, the results with persistence forecast as well as forecast product become closer to the prefect forecast result as the penalties are decreased. This is expected since any unfulfilled schedule is less penalized. The overall income in all configurations is increased as fewer penalties are paid. The increased results for the perfect forecast, in comparison to the simulation considering 100% penalty, demonstrate the impact of the plant model used for scheduling, which does not perfectly represent the real plant. The model used for optimization is based on 5-minute time steps and some simplifying assumptions in the consideration of the transient effects. The real plant model is operated on 1 minute time step and considers more details of the plant. Even under perfect forecasting conditions, scheduled production is not met during some hours of the year due to the systematic deviations between the optimizer plant model and real plant model.
In general, the performance of the forecast product compared to persistence improves when penalties are reduced. Considering that unfulfilled schedule is less penalized, deviations on delivery have reduced impact in the overall income. The forecast product presents a lower RMSE than the persistence forecast, indicating that it generally deviates less from the real weather. Accordingly, the better match in terms of RMSE becomes more relevant whereas the systematic error has less impact.
In summary, the results without using the uncertainty post-processing method show that the benefit of replacing the persistence forecast with the distinct meteorological forecast product is less pronounced than expected. This observation cannot be generalized since a systematic deviation of the forecast product compared to measured data was identified. It is expected that a site-specific calibration will improve the RMSE and in consequence also leads to higher financial revenues. Such a calibrated forecast product was not available for this study.

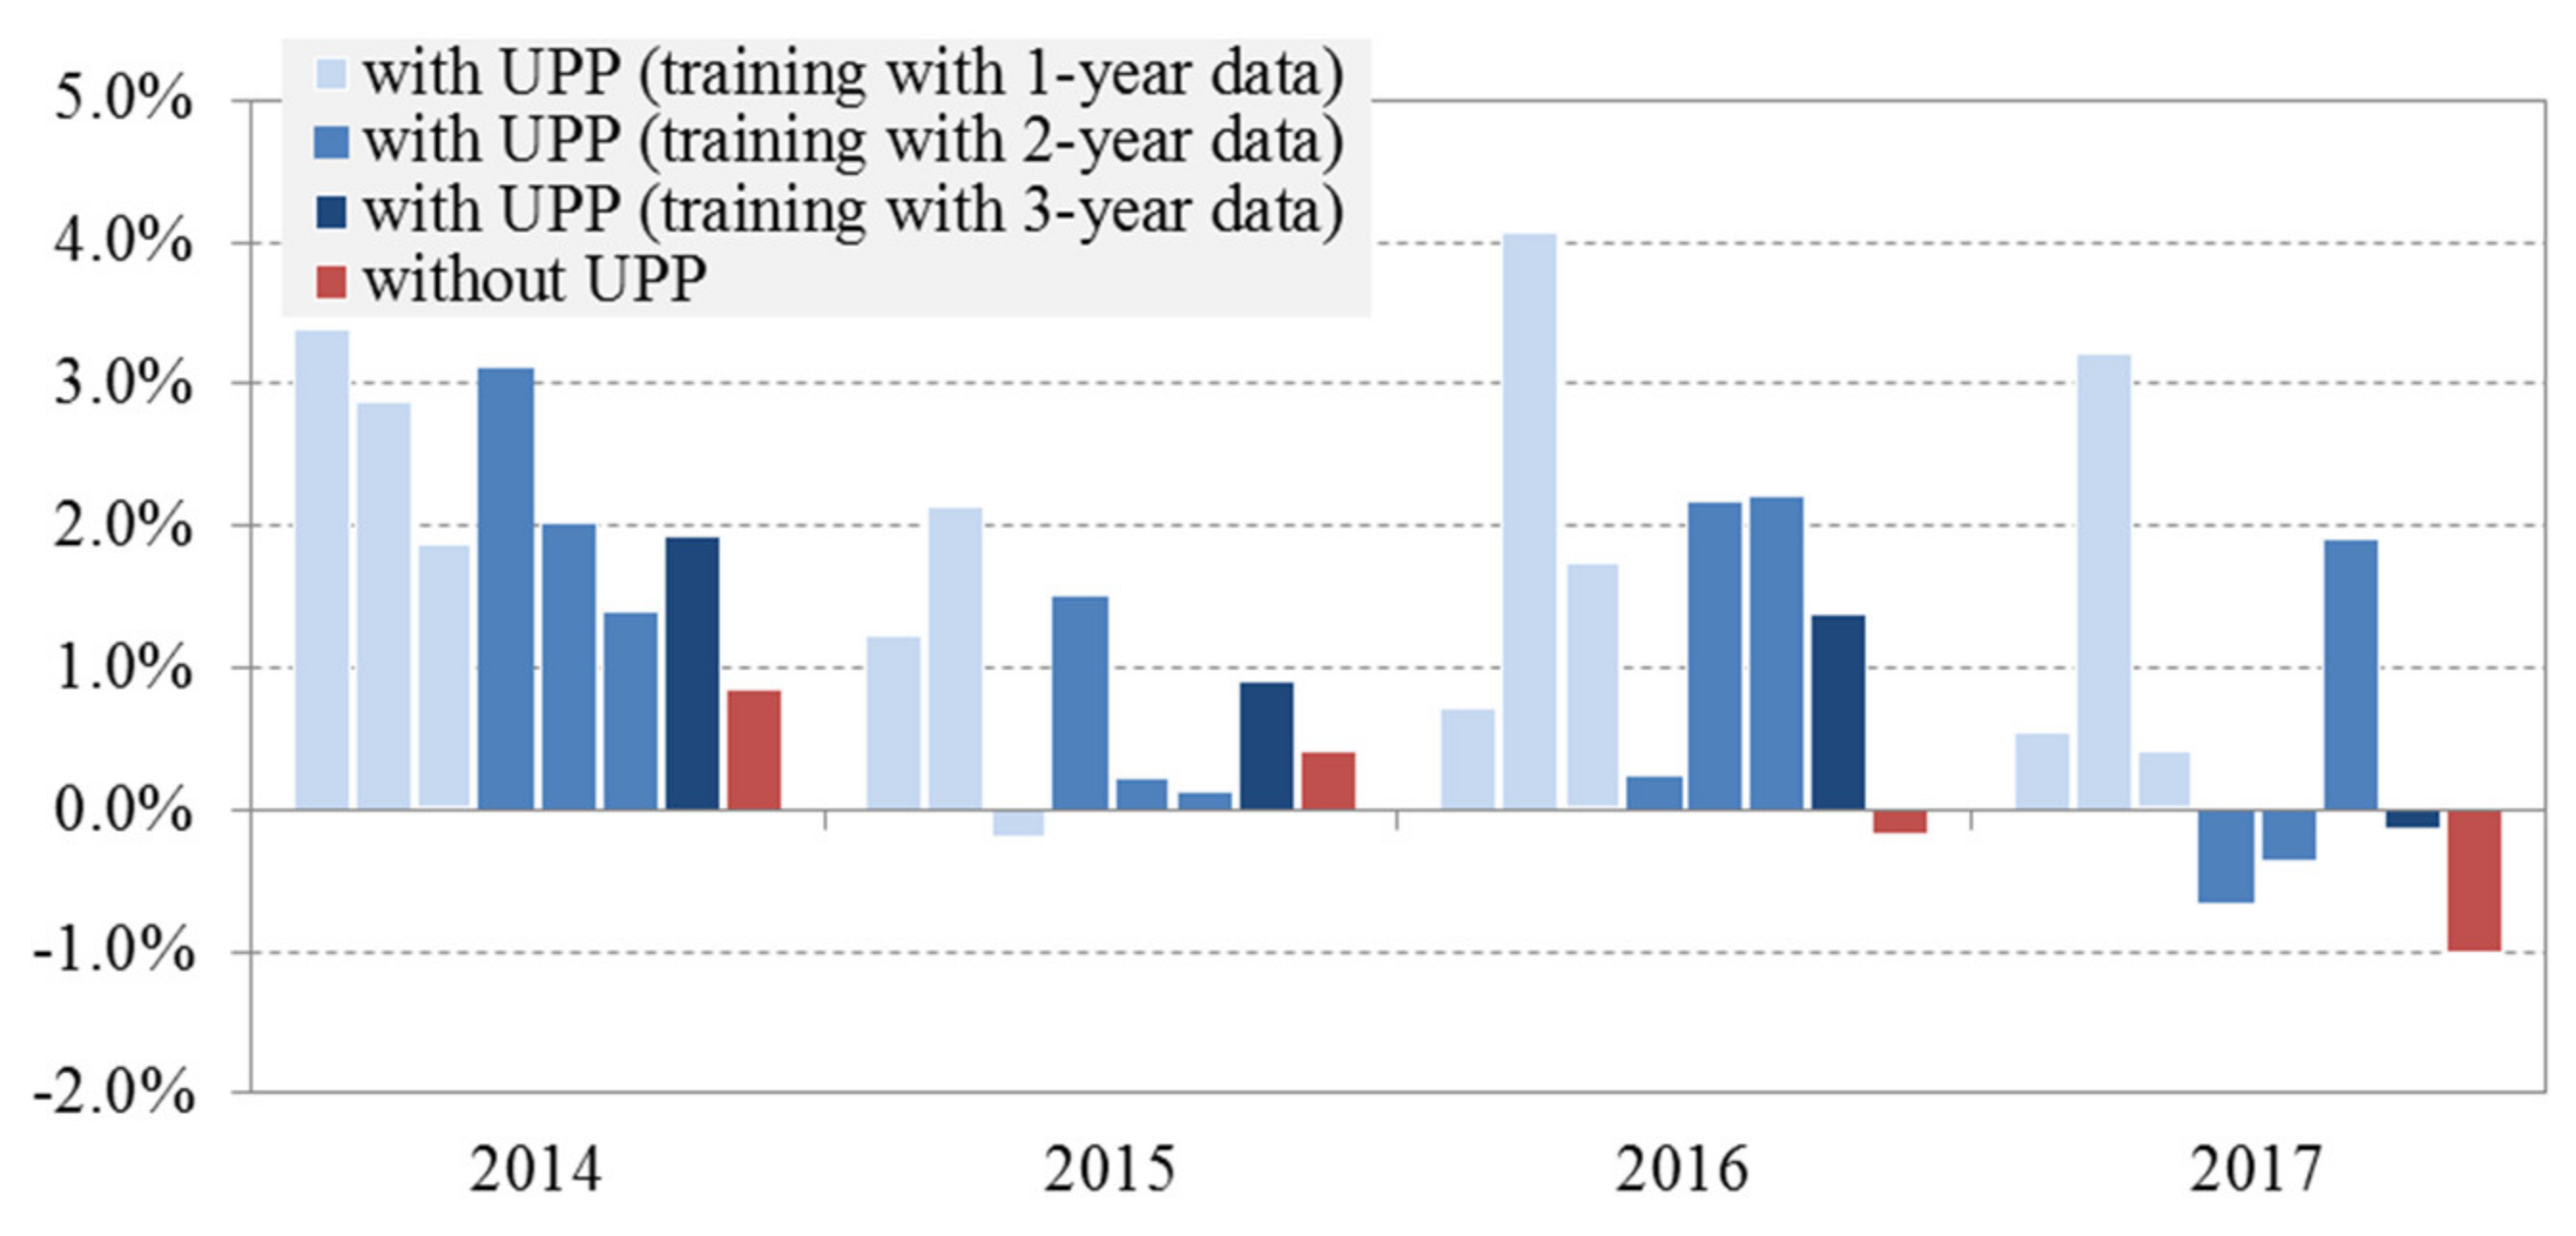
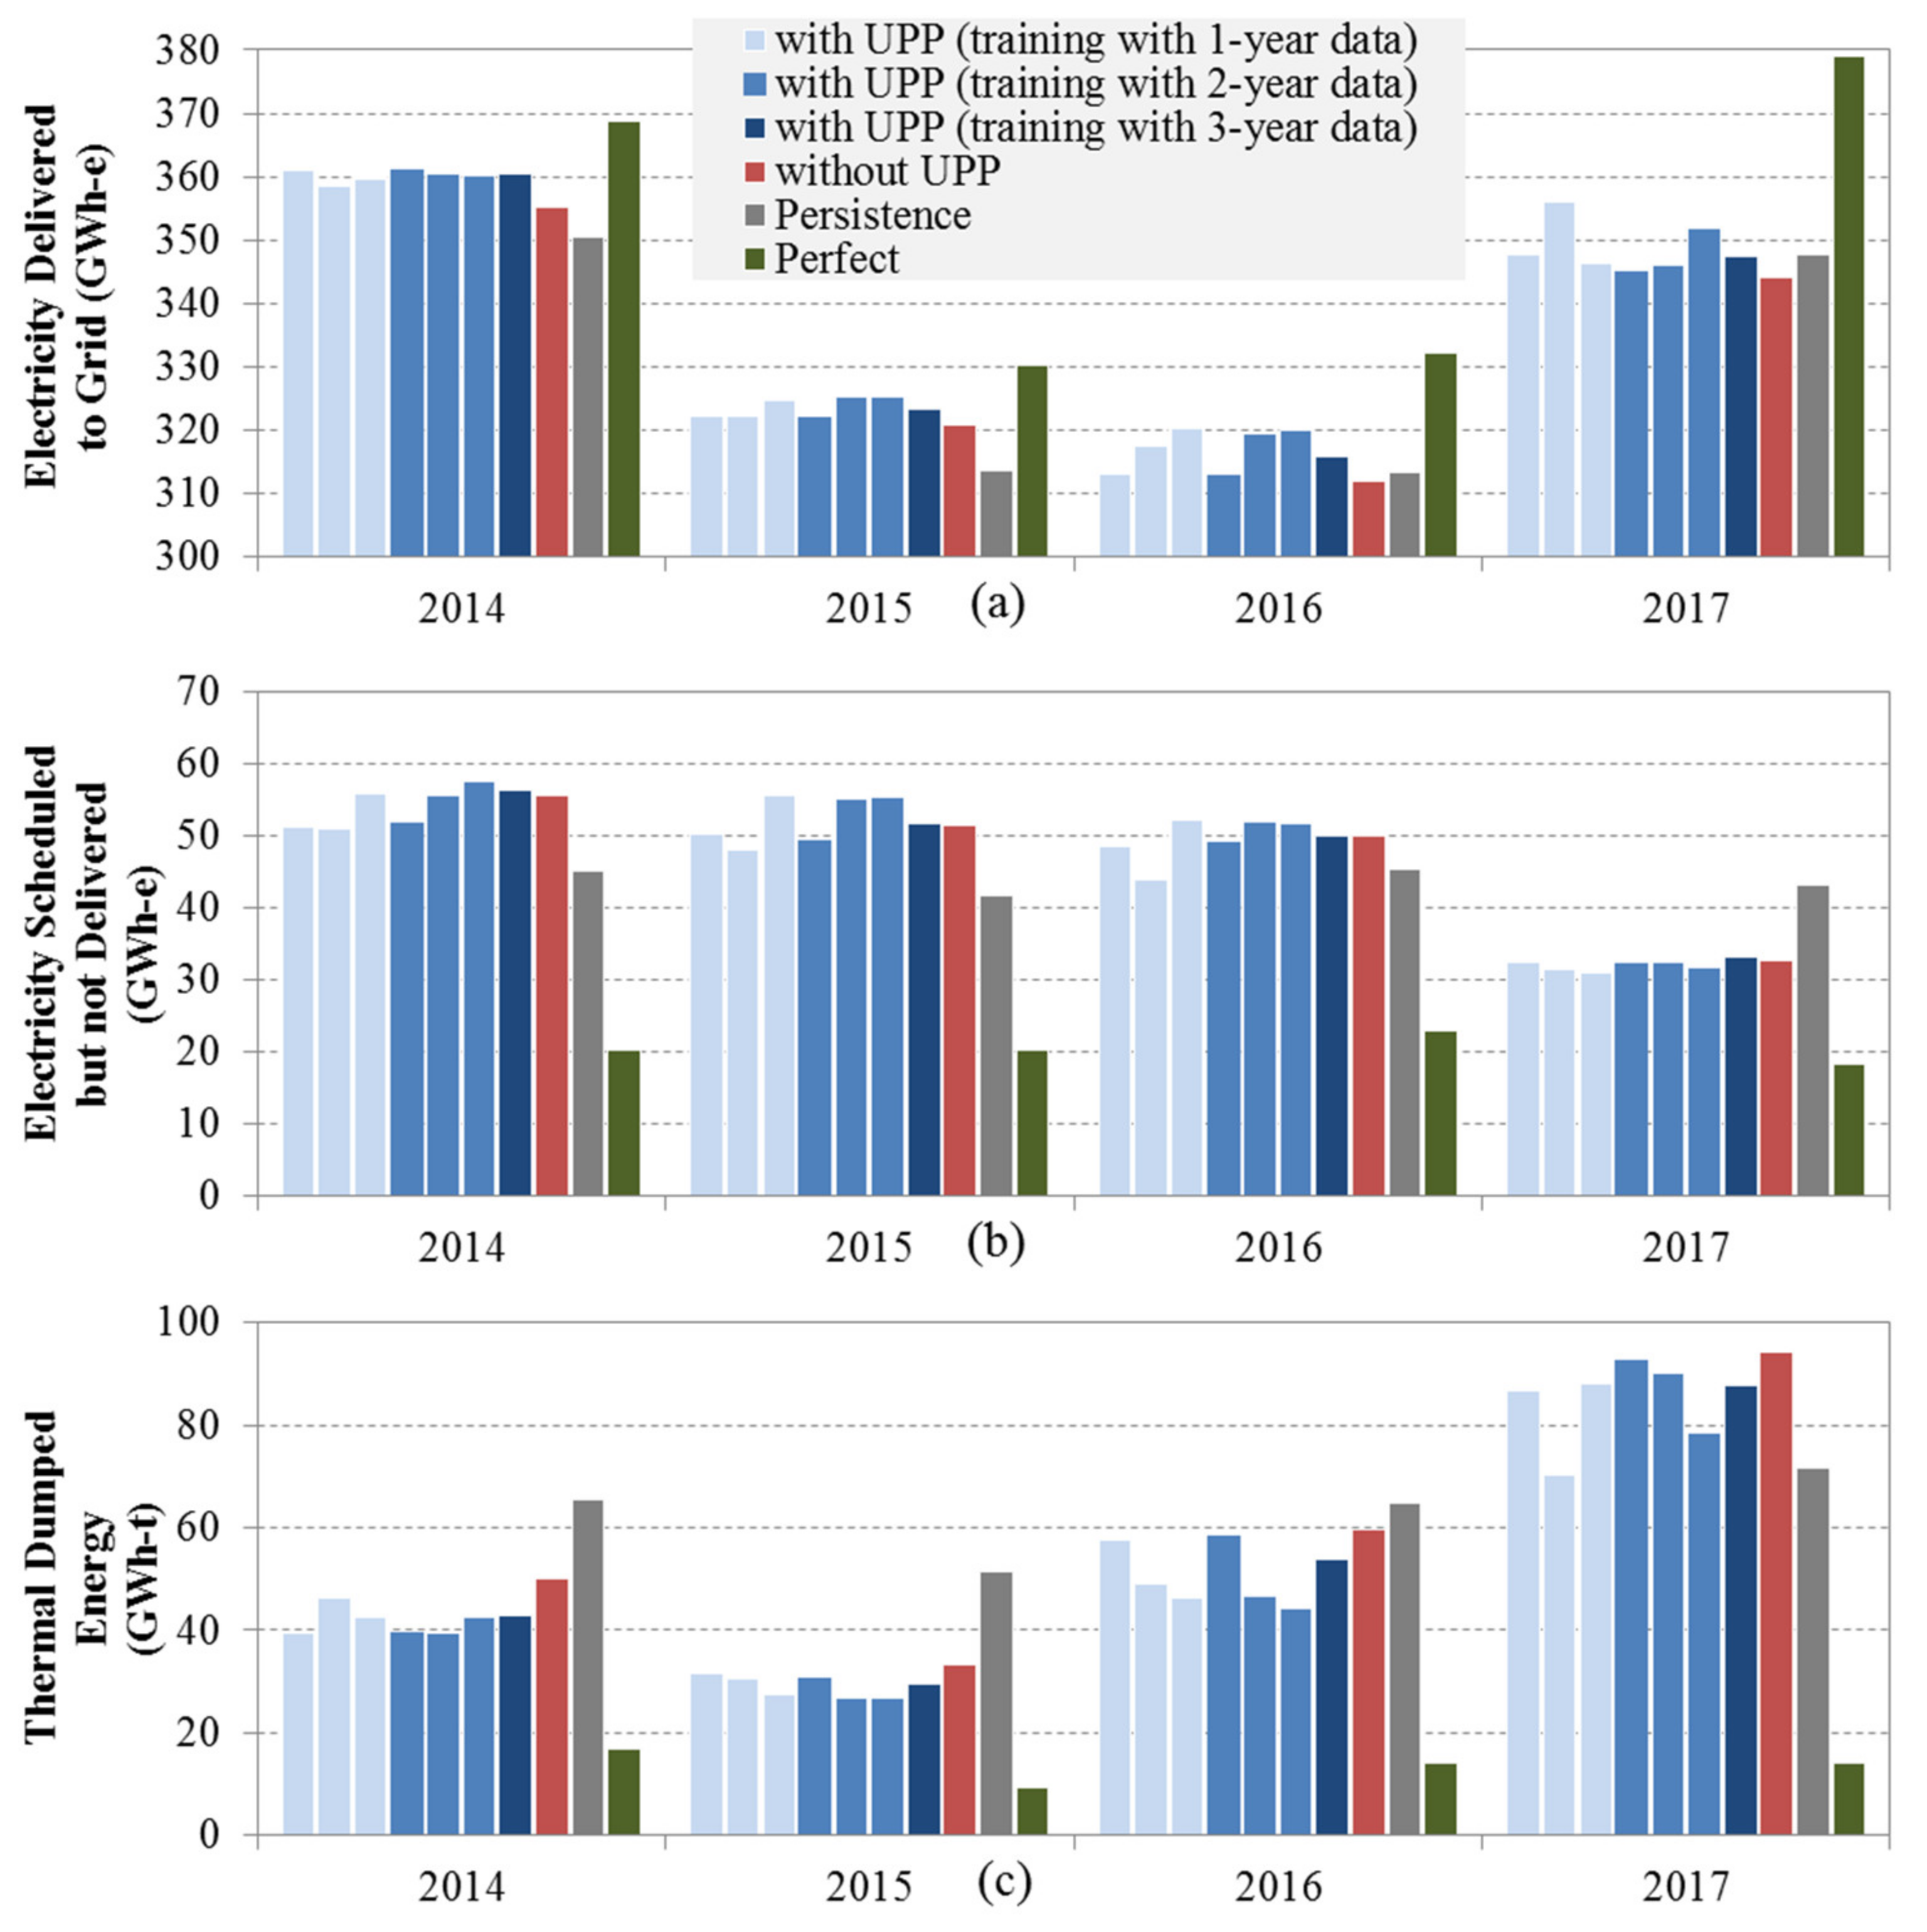
3.3. Optimization Results with UPP Learning Application

In the following, the results obtained by the full application of ALFRED’s strategy are discussed. Figure 13 shows in red results of the schedule optimization without any uncertainty treatment, while in blue results obtained with the proposed uncertainty post-processing application are outlined. The different tones of blue represent the results of the full application of the ALFRED strategy considering the different training data set variations, with the forecast product applied to the simulated year as test data set, as explained in Figure 10. The values given represent the improvement rate in the annual financial income taking the persistence case as the reference.
The results show that by applying the full ALFRED strategy with the forecast product as input, different rates of improvement are obtained depending on the year simulated and the data used for the UPP training. Significant improvement rate increase is observed even in cases with only one year of training data. With testing year 2017, for example, the second case with one-year training results in the best overall improvement compared to all other simulated cases for the same test year. At the same time, also underperformance is observed for one-year training sets. For testing year 2015, a specific case of one-year training results in the worst overall improvement compared to the other cases for the same test year.
Compared to the optimization-only approach all cases with UPP using 2014, 2016, or 2017 as test data result in an increase of financial income, independently on the setup used as training data. Even though this increase is seen in different dimensions, the treatment of uncertainties always resulted in benefits. For the testing year 2015, one training setup with 1-year data and two training setups with 2-year data fail to increase the performance. This demonstrates that an improvement is not a priori guaranteed when using the UPP learning system. However, higher financial results were achieved for most of the analyzed cases.
Particular focus can be given to the fact that the different training data setups result in a variety of improvement rates. Although highest individual performance is observed when using 1 year training data, the spread of results is also highest for the single year training sets. Learning results can be associated to how much the training data is related to that used for testing. Nonetheless, in a real implementation it is not possible to identify which past data is more suitable for improving future situations. Therefore, the more data used for the training, the more robust the learning and, consequently, the results. The 3-year training data setups illustrate that an increase in the improvement rate is obtained for all the simulated years. Special attention can be given to the 2016 simulation: the improvement rate is increased from –0.17% to 1.38% by applying the UPP. This shows that the UPP artificial learner applied by ALFRED can provide benefits even for forecasts that originally underperformed persistence.
In the following, the energetic indicators are analyzed: Figure 14a presents the annual sums of the electricity delivered to the grid, Figure 14b shows the electricity scheduled but undelivered and Figure 14c outlines the total thermal energy dumped by the solar field during the simulated year. Just as in the previous figures, red bars are used for results of the schedule optimization without any uncertainty treatment, blue bars show results obtained with the proposed uncertainty post-processing application, grey bars represent the persistence case and green bars the perfect case.
For all simulated years, the perfect schedule has highest amount of electricity delivered, lowest amount of electricity undelivered and lowest thermal energy dumped by the solar field. As expected, an ideal weather forecast brings not only economic benefits but also better utilization of solar energy, represented by a significant decrease in dumping and undelivered electricity.
Taking the persistence case for comparison, scheduling with the forecast product delivers more energy to the grid and decreases the amount of energy dumped. At the same time, the values of energy scheduled but not delivered are higher. This is seen for all simulated years, with exception of 2017. The better match in terms of RMSE indicates that the forecast product generally deviates less from the real weather. In energetic terms, this seems to have an impact in a better resource management, with less energy being dumped and, therefore, more electricity being produced. However, the systematic error appears to become relevant, once considering the rise in electricity scheduled but not delivered. Nevertheless, cases using the forecast product mostly over-performed persistence financially.
In order to analyze the proposed uncertainty post-processing in energetic terms, the simulations with the forecast product with and without UPP application are outlined. Cases considering UPP application with 3-year training data showed robust financial results, presenting greater energy delivered than simulations with the same forecast without UPP application. This occurs for all simulated years. Similar values of energy scheduled but not delivered are obtained for the same simulated year with or without UPP application. Regarding the thermal energy dumped by the solar field, the UPP application reduces this value independently on the training data set up for all simulated years, when compared to the optimization-only approach.
Overall, this energetic analysis shows that economic improvement is achieved through a greater amount of energy delivery, combined with a decrease of energy dumped. At the same time, the amount of energy undelivered remains quite similar, even if more electricity is delivered to the grid and, therefore, more electricity had been scheduled. Hence, for the simulated cases, financial improvement is not only related to fewer deviations on the promised schedule, but also to the development of an energy-improved and more realistic delivery plan.
For the chosen market price profile, simulations assure the benefit of ALFRED as a dispatch scheduling tool, bringing improvements even for forecasts that underperform persistence. The scenario following the ALFRED strategy develops a dispatch plan closer to market interests, reflecting financial enhanced energy management. Different weather forecast products, when used as input to ALFRED, are expected to bring economic benefits within the range given by persistence and perfect schedules. Improvements are related not only to weather forecast quality, but also to the historical data used for UPP training.

4. Discussion and Conclusions

An innovative dispatch optimization strategy is presented to enable renewable-energy systems with storage to participate in the wholesale electricity market. ALFRED applies an optimization algorithm in combination with a machine-learning approach in order to reach an optimal delivery schedule, considering uncertainties in the weather forecast. Compared to previous publications applied to a similar problem, such as [12], the work presented here expands the schedule planning with the consideration of the intrinsic uncertainties of electricity dispatching. Although employed for a CSP tower system in this contribution, the developed approach is applicable to other renewable-energy systems with storage.
Considering the annual simulation results, the proposed approach mostly increases financial income with a weather forecast product when compared to a persistence schedule, while minimizing energy dumping. This shows that not only is an intelligent method relevant for the dispatch planning, but also that improved results can be obtained with suitable weather forecasts. Taking into account the same market rules are applied for the data set period used in the simulations and current days, the presented results are consistent with an actual application.
The analyses also show that ALFRED performs a beneficial economic energy management with effective inclusion of uncertainties. Compared to an optimization-only algorithm, ALFRED improves revenues even when using the same weather input. By assimilating knowledge from past data, an enhanced scheduling is achieved, independently of the amount of data used for the learning. ALFRED acquires knowledge about the influence of uncertainties and makes use of it in order to achieve a more accurate schedule and, therefore, higher revenues. This enables the quality of schedules to be not exclusively bounded to weather forecasts quality, as it can improved by the learning.
The advantages of the proposed intelligent dispatch planning are not only economic, but also related to its flexibility. By allowing the combination of several types of optimization methods and system models, ALFRED is flexible to be applied for different renewable-energy systems and market scenarios. Even if deterministic price and weather forecasts are used for the presented application, there is the possibility of dealing with other types of forecasts, such as probabilistic ones. The system’s design and learning are adaptable for such input. In addition, its performance is expected to improve along with time, as more data for the UPP learning process become available. Apart from that, the ALFRED strategy allows intuitive understanding of the schedule design methodology, expected to be of high acceptability among plant operators.
Despite the fact that ALFRED succeeds in including weather uncertainties, electricity price uncertainties have not been considered in the dispatching strategy, neither on the simulations performed. As in reality such aspects can be important for the scheduling decision-making and can influence the results, the inclusion of price uncertainties is a relevant aspect for further improvement. Apart from that, further analysis comparing the presented strategy with other machine-learning methods can provide interesting results for the discussion.
The insertion of renewable plants in wholesale electricity markets depend on an effective and transparent dispatch planning able to generate improved revenues. Accordingly, the combination of energy storage with the developed strategy brings high flexibility to renewable systems, enabling their participation in such markets and establishing the pathway to a clean future energy scenario.

Author Contributions

Conceptualization, A.C.d.A.B. and T.H.; methodology, A.C.d.A.B.; software, A.C.d.A.B.; validation, A.C.d.A.B.; writing-original draft preparation, A.C.d.A.B.; writing-review & editing, A.C.d.A.B. and T.H.; supervision, T.H. and R.P.-P. All authors have read and agreed to the published version of the manuscript.

Funding

This work was supported by the “DLR-DAAD Research Fellowships” programme implemented by the DLR and the German Academic Exchange Service (DAAD).

Conflicts of Interest

The authors declare no conflict of interest.

Nomenclature

  P forecast   Forecasted electrical power schedule based on optimization algorithm
  P grid   Final scheduled electrical power to be delivered to grid
  P perf   Scheduled electrical power based on perfect forecast
  P pers   Scheduled electrical power based on persistence forecast
  Δ P perf   Deviation from forecasted schedule to perfect schedule
  Δ P perf   Deviation from forecasted schedule to perfect schedule

References

  1. IRENA. Adapting Market Design to High Shares of Variable Renewable Energy; International Renewable Energy Agency: Abu Dhabi, United Arab Emirates, 2017. [Google Scholar]
  2. Castillo, A.; Gayme, D.F. Grid-scale energy storage applications in renewable energy integration: A survey. Energy Convers. Manag. 2014, 87, 885–894. [Google Scholar] [CrossRef]
  3. Hoff, T.E.; Perez, R.; Margolis, R.M. Maximizing the value of customer-sited PV systems using storage and controls. Sol. Energy 2007, 81, 940–945. [Google Scholar] [CrossRef]
  4. Nottrott, A.; Kleissl, J.; Washom, B. Storage dispatch optimization for grid-connected combined photovoltaic-battery storage systems. IEEE Power Energy Soc. Gen. Meet. 2012, 1–7. [Google Scholar]
  5. Hanna, R.; Kleissl, J.; Nottrott, A.; Ferry, M. Energy dispatch schedule optimization for demand charge reduction using a photovoltaic-battery storage system with solar forecasting. Sol. Energy 2014, 103, 269–287. [Google Scholar] [CrossRef]
  6. Vasallo, M.J.; Bravo, J.M. A novel two-model based approach for optimal scheduling in CSP plants. Sol. Energy 2016, 126, 73–92. [Google Scholar] [CrossRef]
  7. Pousinho, H.M.I.; Contreras, J.; Pinson, P.; Mendes, V. Robust optimisation for self-scheduling and bidding strategies of hybrid CSP–fossil power plants. Int. J. Electr. Power Energy Syst. 2015, 67, 639–650. [Google Scholar] [CrossRef]
  8. Dominguez, R.; Baringo, L.; Conejo, A.J. Optimal offering strategy for a concentrating solar power plant. Appl. Energy 2012, 98, 316–325. [Google Scholar] [CrossRef]
  9. He, G.; Chen, Q.; Kang, C.; Xia, Q. Optimal Offering Strategy for Concentrating Solar Power Plants in Joint Energy, Reserve and Regulation Markets. IEEE Trans. Sustain. Energy 2016, 7, 1245–1254. [Google Scholar] [CrossRef]
  10. Wagner, M.J.; Newman, A.; Hamilton, W.T.; Braun, R. Optimized dispatch in a first-principles concentrating solar power production model. Appl. Energy 2017, 203, 959–971. [Google Scholar] [CrossRef]
  11. Wittmann, M.; Eck, M.; Pitz-Paal, R.; Muller-Steinhagen, H. Methodology for optimized operation strategies of solar thermal power plants with integrated heat storage. Sol. Energy 2011, 85, 653–659. [Google Scholar] [CrossRef]
  12. Burghi, A.C.D.A.; Hirsch, T.; Pitz-Paal, R. FRED: The Flexible Renewable Energy System Dispatch Optimizer. J. Sol. Energy Eng. 2019, 141, 051009. [Google Scholar] [CrossRef]
  13. Maringer, D.G. Heuristic Optimization. In Portfolio Management with Heuristic Optimization; Springer Science and Business Media LLC: New York, NY, USA, 2006; Volume 8, pp. 38–76. [Google Scholar]
  14. Wehenkel, L. Machine learning approaches to power-system security assessment. IEEE Expert 1997, 12, 60–72. [Google Scholar] [CrossRef] [Green Version]
  15. Boyen, X.P.; Wehenkel, L. Fuzzy Decision Tree Induction for Power System Security Assessment; Elsevier BV: Amsterdam, The Netherlands, 1995; Volume 28, pp. 299–304. [Google Scholar]
  16. Rudin, C.; Waltz, D.; Anderson, R.N.; Boulanger, A.; Salleb-Aouissi, A.; Chow, M.; Dutta, H.; Gross, P.N.; Huang, B.; Ierome, S.; et al. Machine Learning for the New York City Power Grid. IEEE Trans. Pattern Anal. Mach. Intell. 2011, 34, 328–345. [Google Scholar] [CrossRef] [PubMed] [Green Version]
  17. Negnevitsky, M.; Mandal, P.; Srivastava, A.K. Machine Learning Applications for Load, Price and Wind Power Prediction in Power Systems. In Proceedings of the 2009 15th International Conference on Intelligent System Applications to Power Systems; Institute of Electrical and Electronics Engineers (IEEE): Piscataway, NJ, USA, 2009; pp. 1–6. [Google Scholar]
  18. Wan, C.; Xu, Z.; Pinson, P.; Dong, Z.Y.; Wong, K.P. Probabilistic Forecasting of Wind Power Generation Using Extreme Learning Machine. IEEE Trans. Power Syst. 2013, 29, 1033–1044. [Google Scholar] [CrossRef] [Green Version]
  19. Sharma, N.; Sharma, P.; Irwin, D.; Shenoy, P. Predicting solar generation from weather forecasts using machine learning. In Proceedings of the 2011 IEEE International Conference on Smart Grid Communications (SmartGridComm); Institute of Electrical and Electronics Engineers (IEEE): Piscataway, NJ, USA, 2011; pp. 528–533. [Google Scholar]
  20. Daud, M.Z.; Mohamed, A.; Hannan, M. An improved control method of battery energy storage system for hourly dispatch of photovoltaic power sources. Energy Convers. Manag. 2013, 73, 256–270. [Google Scholar] [CrossRef]
  21. Quinlan, J.R. C4.5 Programs for Machine Learning; Morgan Kaufmann Publisher, Inc.: San Mateo, CA, USA, 1993. [Google Scholar]
  22. Zhang, J.J.; Wang, F.-Y.; Wang, Q.; Hao, D.; Yang, X.; Gao, W.; Zhao, X.; Zhang, Y. Parallel dispatch: A new paradigm of electrical power system dispatch. IEEE/CAA J. Autom. Sin. 2017, 5, 311–319. [Google Scholar] [CrossRef]
  23. Janikow, C. Fuzzy decision trees: Issues and methods. IEEE Trans. Syst. Man Cybern. Part B 1998, 28, 1–14. [Google Scholar] [CrossRef] [Green Version]
  24. Ahmadi, E.; Javadi, H.; Khansefid, A.; Asadi, A.; Ebadzadeh, M.M.; Timmerman, D. Fuzzy decision tree learning for preoperative classification of adnexal masses. In Proceedings of the International Conference on Health Informatics, Rome, Italy, 26–29 January 2011; pp. 364–375. [Google Scholar]
  25. Wehenkel, L.A. Automatic Learning Techniques in Power Systems; Springer Science and Business Media LLC: New York, NY, USA, 1998; pp. 140–144. [Google Scholar]
  26. Olaru, C.; Wehenkel, L. A complete fuzzy decision tree technique. Fuzzy Sets Syst. 2003, 138, 221–254. [Google Scholar] [CrossRef] [Green Version]
  27. Lo, K.; Abidin, H.I.H.Z. The fuzzy decision tree application to a power system problem. COMPEL Int. J. Comput. Math. Electr. Electron. Eng. 2004, 23, 436–451. [Google Scholar] [CrossRef]
  28. Adamo, J. Fuzzy decision trees. Fuzzy Sets Syst. 1980, 4, 207–219. [Google Scholar] [CrossRef]
  29. Du, E.; Du, E.; Hodge, B.-M.; Kang, C.; Kroposki, B.; Xia, Q. Economic justification of concentrating solar power in high renewable energy penetrated power systems. Appl. Energy 2018, 222, 649–661. [Google Scholar] [CrossRef]
  30. Gordon, A.D.; Breiman, L.; Friedman, J.H.; Olshen, R.A.; Stone, C.J. Classification and Regression Trees; Taylor & Francis: Thames, Oxfordshire, UK, 1984. [Google Scholar]
  31. Bezdek, J.C.; Ehrlich, R.; Full, W. FCM: The fuzzy c-means clustering algorithm. Comput. Geosci. 1984, 10, 191–203. [Google Scholar] [CrossRef]
  32. OMIE. Resultados del Mercado. 2018. Available online: http://www.omie.es/ (accessed on 1 April 2018).
  33. Schroedter-Homscheidt, M.; Benedetti, A.; Killius, N. Verification of ECMWF and ECMWF/MACC’s global and direct irradiance forecasts with respect to solar electricity production forecasts. Meteorol. Z. 2016, 26, 1–19. [Google Scholar] [CrossRef]
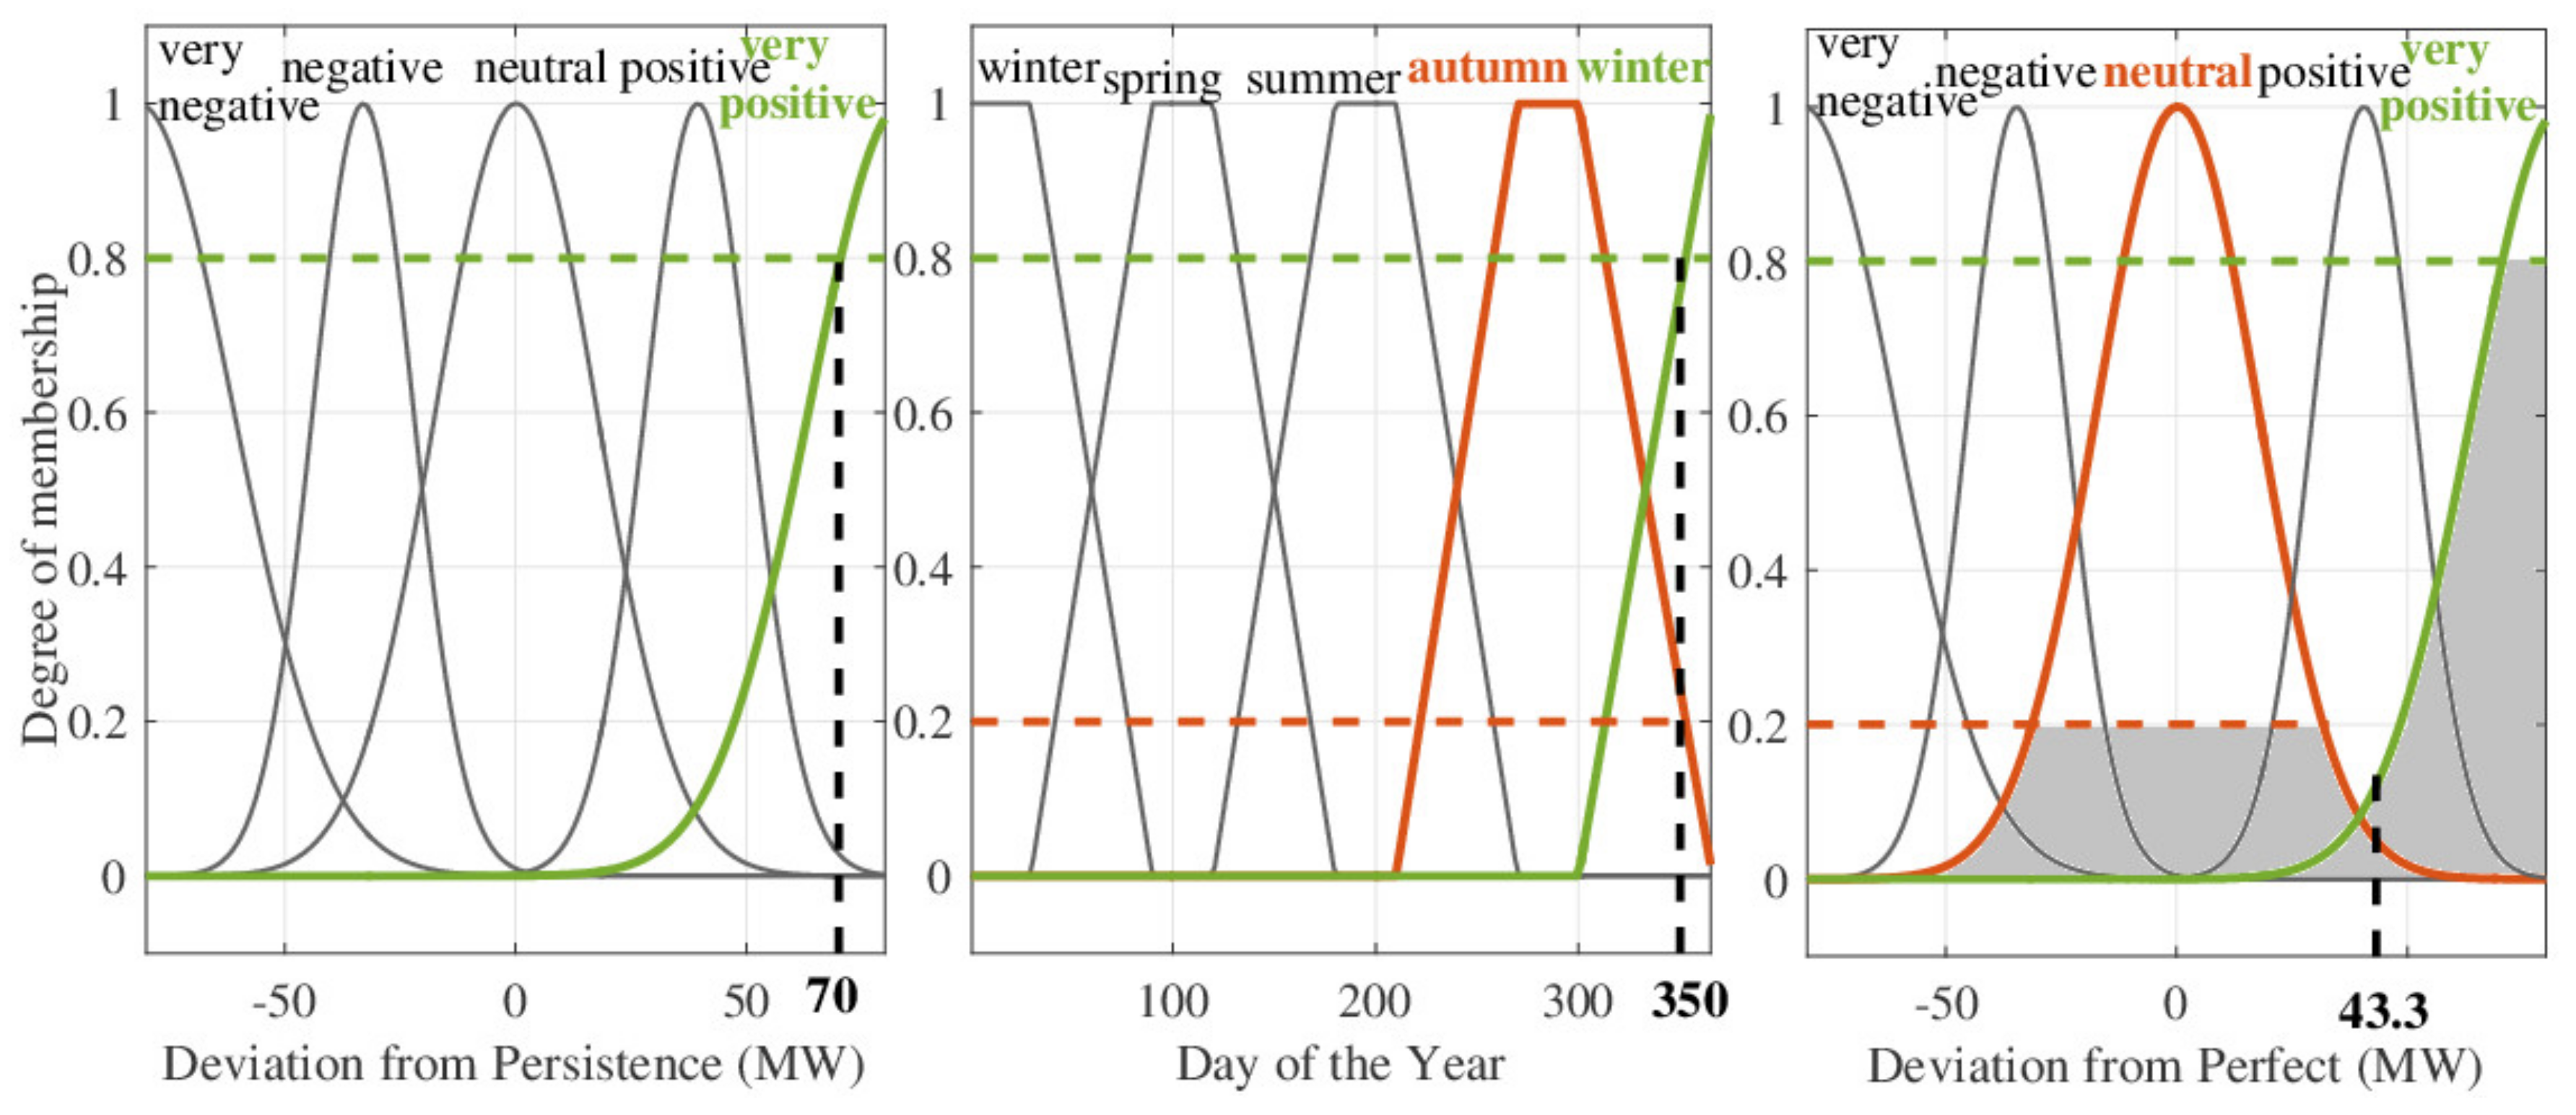
Figure 1. ALFRED (artificial learning flexible renewable energy system dispatch optimizer) dispatch planning tool scheme: partitioned strategy of optimization and uncertainty treatment.
Energies 13 01517 g001
Figure 2. Electricity price profile for two days, with red labels of hourly prioritization.
Energies 13 01517 g002
Figure 3. Uncertainty post-processing (UPP) development scheme.
Energies 13 01517 g003
Figure 4. Classes’ definition for the concentrated solar power (CSP) plant example case. The classes of deviation from persistence, hour priority and deviation from perfect are determined by unsupervised learning, while the ones of day of the year are predetermined, based on the meteorological seasons.
Energies 13 01517 g004
Figure 5. Final decision tree for the CSP plant application. In green, the branch used as an example for the pruning process, outlined in Figure 6. In blue, the branches used as example for the rules extraction explanation.
Energies 13 01517 g005
Figure 6. Part of a pruned branch of the decision tree for the CSP plant application. The final branch is represented in green in Figure 5.
Energies 13 01517 g006
Figure 7. Uncertainty post-processing (UPP) implementation scheme.
Energies 13 01517 g007
Figure 8. Fuzzy classification and inference procedure for the given numerical example.
Energies 13 01517 g008
Figure 9. Forecasted, adjusted and perfect schedule for some example days.
Energies 13 01517 g009
Figure 10. Data setups used for the simulations, considering different training data (from 1 to 3 years in several combinations) for each one-year simulation, represented as the testing data.
Energies 13 01517 g010
Figure 11. Mean hourly Spanish market price with standard deviation for the years 2014 to 2017 [32].
Energies 13 01517 g011
Figure 12. Annual financial income based on the optimized dispatching strategy without the UPP application, considering 0% (a), 50% (b) and 100% (c) penalty of the market price when scheduled electricity is not delivered. Persistence, perfect and product forecasts are considered as input. The rate of improvement with reference to the persistence forecast case is plotted.
Energies 13 01517 g012
Figure 13. Annual financial income improvement rate in comparison to the persistence case for the simulated years with the forecast product as input. Red bars refer to the data presented also in red in Figure 12c. The optimized dispatching strategy is applied with and without the UPP, taking different training data sets into account, as explained in Figure 10.
Energies 13 01517 g013
Figure 14. Total annual electricity delivered to the grid (a), scheduled but not delivered (b) and thermal dumped energy (c) for the simulated years with optimized approach.
Energies 13 01517 g014
Table 1. Input values used for the rules extraction example.
Input ParameterValueClassification
Deviation from persistence70 MW0.8 very positive
Day of the year3500.8 winter
0.2 autumn
Hour priority100.7 very high
0.7 high
Table 2. Weather data direct normal irradiation (DNI) yearly sum and root-mean-square error (RMSE).
Simulated YearDNIPersistence ForecastForecast ProductPerfect Forecast
2014Yearly Sum (kWh/m2)
RMSE
2397.04
296.11
2244.52
215.84
2399.49
0
2015Yearly Sum (kWh/m2)
RMSE
2220.50
296.57
2123.09
219.10
2218.04
0
2016Yearly Sum (kWh/m2)
RMSE
2220.50
289.28
2026.67
207.48
2223.38
0
2017Yearly Sum (kWh/m2)
RMSE
2391.92
356.84
2095.52
269.26
2387.87
0

