Article

Artificial Learning Dispatch Planning with Probabilistic Forecasts: Using Uncertainties as an Asset

by
Ana Carolina do Amaral Burghi
1,*,
Tobias Hirsch
1 and
Robert Pitz-Paal
2
1
Institute of Solar Research, German Aerospace Center (DLR), Wankelstrasse 5, 70563 Stuttgart, Germany
2
Institute of Solar Research, German Aerospace Center (DLR), Linder Höhe, 51147 Cologne, Germany
*
Author to whom correspondence should be addressed.
Energies 2020, 13(3), 616; https://doi.org/10.3390/en13030616
Submission received: 18 December 2019 / Revised: 21 January 2020 / Accepted: 21 January 2020 / Published: 1 February 2020
(This article belongs to the Special Issue Modeling and Control of Smart Energy Systems)

Abstract

:
Weather forecast uncertainty is a key element for energy market volatility. By intelligently considering uncertainties on the schedule development, renewable energy systems with storage could improve dispatching accuracy, and therefore, effectively participate in electricity wholesale markets. Deterministic forecasts have been traditionally used to support dispatch planning, representing reduced or no uncertainty information about the future weather. Aiming at better representing the uncertainties involved, probabilistic forecasts have been developed to increase forecasting accuracy. For the dispatch planning, this can highly influence the development of a more precise schedule. This work extends a dispatch planning method to the use of probabilistic weather forecasts. The underlying method used a schedule optimizer coupled to a post-processing machine learning algorithm. This machine learning algorithm was adapted to include probabilistic forecasts, considering their additional information on uncertainties. This post-processing applied a calibration of the planned schedule considering the knowledge about uncertainties obtained from similar past situations. Simulations performed with a concentrated solar power plant model following the proposed strategy demonstrated promising financial improvement and relevant potential in dealing with uncertainties. Results especially show that information included in probabilistic forecasts can increase financial revenues up to 15% (in comparison to a persistence solar driven approach) if processed in a suitable way.

1. Introduction

Driven by environmental and energy security needs, the global energy transition emphasizes the consideration of renewable energy. As a result, power systems need to integrate large amounts of variable generation resources, such as photovoltaics (PV) and wind without storage. Combined with this large-scale integration, their random nature poses great challenges to energy system operators [1].
In order to predict the possible amount of energy that can be sent to the grid, weather prediction is necessary. This requires information about the wind or solar radiation, for example, depending on the system under operation. These weather variables are usually intermittent, consequently leading to uncertainty in the electricity supply. Several efforts are being made to improve power prediction and, therefore, guarantee energy security and increase potential revenues of renewable systems. PV power output prediction models based on artificial learning were developed e.g., by [2] and [3], in order to learn the underlying relationships between meteorological information and actual power outputs. The relationship between sky appearance and the future PV power output using deep learning has been proposed by [4]. A long-term recurrent convolutional network using temporal and spatial weather data was developed by [5] to predict PV production in the 24-h and 48-h forecast horizons. A deep learning-based ensemble approach was proposed by [6] for probabilistic wind power forecasting.
All these studies consider renewable systems whose production is pre-defined by the weather situation. Thus, the primary focus is to get the best possible weather forecast and the dispatch problem is mostly a renewable production prediction problem that results in a dispatch problem for other producers (mostly not renewable) able to increase or decrease their production to meet the load demand. With the ambitions targets for renewable energy production, there is an increasing urge of renewable systems participating in electricity markets in the same manner as conventional energy producers [7]. Consequently, the need for flexible producers flourishes, highly important for the compensation of fluctuating resources and with the significant advantage of economically meeting peak demand. Dispatch planning methods for flexible power prediction for such flexible units are required. The important difference to the above-mentioned approaches is that the dispatch plan does not only depend on the weather forecast for the specific hour but also on energy amounts accumulated e.g., in a storage unit. By this, the dispatch schedule depends more on the demand than on the weather. Compared to conventional, fossil fired power plants, where the fuel is in principle available all the time, renewable producers with storage have a restriction by the amount of energy currently stored. The paper deals with this kind of dispatch problem for a solar thermal electricity producer with integrated large storage (about 10 full load hours) and full participation in the day-ahead market.
Considering storage as a key for the future of the power sector [8], renewable energy systems (RES) with integrated storage are able to provide certain flexibility between collecting energy from the source and sending electricity to the grid. With that, their participation in the spot market could enable relevant economic benefits for such systems, as well as a cleaner electricity trading and a more stable grid. Usually, in such markets, production bids of the amount and price for a certain interval of the day are placed, and the market regulates it by a least cost optimization. In order to participate in wholesale markets, an optimized and accurate dispatch schedule is necessary. This schedule consists on a plan of production for a specific period, determining the timing and rate at which electricity is generated.
Different dispatch optimization strategies have been applied to many types of RES with storage, e.g., Ref. [9] linearly optimized the dispatch of a grid-connected PV + battery storage system that financially over performed a simple off-peak/on-peak (charging/discharging) strategy, and Ref. [10] that implemented a real-time demand linear programming routine for a PV + battery storage system, leveraging solar power and load forecasts to establish a load demand target adjusted throughout the day in response to forecast error. Although positive results are shown under the traditional market scheme for renewable systems, such approaches do not take into account the uncertainties and complexity of wholesale energy markets.

1.1. Flexible Dispatch Planning Existing Solutions and Challenges

Aiming to take part in wholesale markets, RES with storage need to adapt their dispatch to a new market operation. Instead of the usual contractual conditions with high security on produced electricity, such as power purchase agreements or feed-in-tariffs, the operation consists on the production bidding for a certain interval of the day. The schedule of amount and price of electricity produced is usually defined in trading sessions for the day-ahead, with intra-day corrections. Differences between contracted and actual energy production suffer higher penalties in comparison to the traditional schemes. Therefore, forecasts’ accuracy is an important issue [11].
Considering that RES rely on natural resources and that their forecasts include uncertainties, the dispatch planning needs to be robust and take these uncertainties into account. Nonetheless, they still represent a challenge for the users. The atmosphere’s variable nature impacts the output from renewable power producers and also influences the load variability that must be balanced by the power system [12].
Anyway, by considering weather and price forecasts, the dispatch of RES plants with storage can be economically optimized, according to a spot market driven operation. By using observed data, simulations of the real operation can be performed, considering the production schedule based on forecasts and enabling then the evaluation of such schedules. Research on such a market operation was performed, especially considering concentrated solar power (CSP) systems.
Dispatch strategies play an important role for CSP with thermal storage, as they allow extended production of solar electricity to periods without solar irradiation. A mixed-integer linear programming (MILP) for a CSP day-ahead operation was modelled by [13], assuming perfect market price and weather predictions. MILP scheduling approaches were also used by [14], providing an optimized target power generation profile for a CSP tower system in combination with a simulation model that evaluates annual plant performance, and by [15] for a hybrid CSP-fossil fuel plant schedule optimization, including a robustness cost parameter to consider the uncertainties of possible delivery deviations. A robust linear optimization was also introduced by [16,17] to model the solar energy uncertainty, considering a stochastic model to include market prices uncertainties. A dynamic programming CSP bidding strategy was developed by [18] and a heuristic approach for a day-ahead operation was proposed by [19], both considering certain solar resources and price information. An optimum scheduling strategy with incorporation of uncertainty information was suggested by [20], deriving a day-ahead dispatch plan that is calibrated by a machine learning algorithm. This approach combines several relevant parameters with historical data and builds knowledge on dealing with uncertainties based on past events.
In comparison to base-line dispatch strategies, such as solar driven or off-peak/on-peak, these presented optimization algorithms show possible improvement in financial income and load management. While most of these works have the schedule quality exclusively dependent on forecasts quality, only some consider the uncertainties influence on the dispatching plan. Still, all of them are based on strict deterministic rules, considering fixed relationships among states and events, without taking the weather’s random variation into account. In such models, a given input always produces the same output, possibly resulting in sub-optimal solutions, as in reality, deterministic-type forecasts present low, or even null, information about the uncertainties involved.
Uncertainty in weather forecast and power production is a key element of volatility in the market and a driver for competition, playing a role in security constraints and risk management [21]. By intelligently considering uncertainties on the schedule development, a reasonable balance between risk, profit, and energy security is expected to be fulfilled.

1.2. Weather Forecasts: Predicting RES Resource

Traditionally, weather estimation is obtained by numerical weather predictions (NWP), based on a numerical integration of the hydrodynamic equations governing atmospheric motions. According to the current state of the atmosphere, these models propagate information forwards to produce a forecast for future weather. The state of the atmosphere is then described by the spatial distribution of wind, temperature, and other weather variables [11]. Although numerical models have been considered to be the best forecasting approach for the next one to five days [22], they are bound to have an error, due to factors such as the different temporal and spatial scales involved, the insufficient knowledge of the current state of the atmosphere, and the complex non-linearity of the problem [23]. The classical NWP always leads to the same final state given identical initial conditions. Hence, the result of such a model is a deterministic weather forecast product, which is a unique profile of the future weather condition. Such a result represents reduced or no information on the uncertainty of the future weather profile.
As chance is not involved in any future state of the traditional deterministic method, the scientific community has been working on improvements to produce more accurate forecasts [24]. Important advances have been achieved in the presentation of uncertainty information to system operators, enabling additional trust in the forecasts. Under these advances, ensemble and probabilistic forecasting methods are highlighted, being increasingly used due to their ability to better characterize most likely situations, represent potential extreme scenarios, apart from providing an effective a way to quantify uncertainties [12]. While the reference deterministic forecast generates a single-value forecast for every time step in the forecasting horizon, probabilistic forecasts generate a set of values, quantifying the uncertainty in a prediction. Therefore, probabilistic forecasts are essential to support a most probable optimal decision.
Probabilistic forecasts are generated by ensemble prediction systems (EPS), which take the atmosphere’s non-linear behavior into account in a probabilistic way. Such a system generates multiple forecasts considering slightly different but equally probable initial conditions or numerical parametrizations, with the aim to characterize the uncertainty of the prediction [25]. It estimates the time evolution of the probability density function, which specifies the probability of a given variable falling within a particular range of values, being viewed as an ensemble of individual selected atmospheric states. The final result is a set of possible future profiles, each of them with the same physical possibility to happen. Each scenario can be evaluated individually or collectively, to assess extreme situations, establish confidence intervals, or define the likelihood of different cases [12].
Apart from weather and climate prediction, the solution of other critical problems of science and society have been supported by the use of probabilistic forecasts, such as seismic hazard prediction, financial risk management, election outcome prediction, demographic and epidemiological projection, health care management, and predictive and preventative medicine [26].
Probabilistic weather forecasts have been developed with the objective to better represent the uncertainties involved and therefore to increase forecasting accuracy. For dispatch planning, this can highly influence developing a more precise schedule. However, the use of such forecasts for dispatch purposes is still limited. The incorporation of probabilistic information into decision-making and energy management processes is one of the major obstacles to the widespread adoption of such forecasts [12]. Apart from facing cultural acceptance barriers, tools have been usually developed to accept only deterministic forecasts as input, depriving the extraction of full value from probabilistic forecasts [27]. An adaptation to a probabilistic input could be complicated, or in some cases, not even possible. There is a general resistance to change due to current practices, costs, education, and limited resources [21]. Also, the uncertainty information given by probabilistic forecasts has to be interpreted and processed, meaning that these tools would need also new means for dealing with extra information. Apart from a knowledge deficit about how to use such forecasts, assessment on their value for dispatching purposes is still lacking. Currently there is not a direct link between forecast performance metrics and the value provided for a power system [27].
In any case, additional information on future prediction uncertainty is potentially valuable for the system operator as well as market participants. Several research and development efforts are being driven by the need to evaluate forecasts for energy purposes. By simulating the operation of a wind farm with day-ahead clearing and real-time markets for energy and operating reserves, Zhou et al. [28] found that probabilistic forecasts can contribute to improve the performance of the power system, both in terms of cost and reliability. Results showed that the use of dynamic operating reserves derived from probabilistic forecasts gave better performance than fixed reserve requirements, as their levels are better aligned with wind power forecast uncertainty. Gonzalez-Aparicio and Zucker [29] quantified the wind power forecasting uncertainty given by probabilistic forecasts used by a transmission operating system, assessing their influence on the power market prices, and therefore the impact on the power system actor decisions. Relying on probabilistic power profiles forecasts of demand and generation, Appino et al. [30] proposed a framework to ensure dispatch schedule security feasibility. The simulations based on real household production and consumption data present achievable performance improvements. Arriagada et al. [31] modelled the probability distributions of system marginal price, thermal (fuel based), solar, and wind power generation. The model was applied to a case study of the Northern Chilean electrical system and showed to be helpful for multi decision-making regarding renewable energy market effects.
These works examine energy systems problems and propose solutions based on probabilistic forecasting. However, none of these examines the participation of a RES with storage in the wholesale market in particular. Such systems could potentially benefit from the incorporation of forecast uncertainty into their decision-making. Overall, improved forecasting and corresponding decision support tools are key solutions to enable a clean, reliable, and cost-efficient grid driven by renewable resources [32]. Just as important as improving their underlying accuracy, a crucial issue is to integrate probabilistic forecasts into dispatch operations to obtain their full value.

1.3. Objectives of the Current Work

The hurdle of planning an accurate schedule is to know how to tackle the natural imprecision of forecasting future situations. Uncertainty treatment is then crucial to ensure an optimal dispatch, usually with high dependency on forecasts’ accuracy. While deterministic forecasts are mostly used for the dispatch planning, probabilistic forecasts contain richer uncertainty information, bringing advantages to dealing with forecast inaccuracy, and therefore, potentially reaching a more precise schedule.
This work extends the suggested post-processing method developed by [20] to the use of probabilistic forecasts. Designed to be applied for a renewable energy system with storage, the ALFRED (artificial learning flexible renewable energy system dispatch optimizer) method presented in [20] financially optimizes the dispatch schedule for a day-ahead operation, considering weather and electricity price forecasts as input. It allows a flexible choice of the optimization algorithm for dispatch planning, in combination with an innovative uncertainty post-processing algorithm. Combining the knowledge obtained with historical data in order to deal with uncertainties, ALFRED includes the benefits of machine learning techniques into the dispatch problem. It performs a calibration on the suggested dispatch plan in order to achieve a schedule closer to a perfect operation, considering similar situations learned from the past. However, it is still limited to the use of deterministic forecasts.
Hence, the contribution of this work is to broaden the possibilities of the uncertainty treatment proposed by [20], including the valuable information of uncertainties brought by probabilistic weather forecasts. For that, ALFRED’s strategy had to be adapted, considering new means of operation and decision-making. ALFRED’s probabilistic approach considers all ensemble members into the calculations, with the aim to learn the most probable optimal decision among all the given possibilities.
The analysis of this probabilistic extension is here simulated with a CSP system. CSP plants are a utility scale technology for renewable electricity generation that concentrates solar radiation through the use of mirrors, into heat energy in a fluid, which is then used by a power cycle to generate electricity. Compared to other renewable energy systems, CSP systems have the systematic benefit of efficient thermal storage, allowing electricity production to large periods even when the sun is not shining. The substitution of variable renewable generation resources with CSP can bring considerable reductions in thermal generation fuel and ramping costs, establishing this technology as a significant RES towards renewable-dominated and minimum-cost targets [33].
This work presents a novel dispatch strategy for renewable energy systems with storage considering probabilistic forecasts. Section 2 describes ALFRED’s methodology in detail, explaining the original deterministic approach and the extension to probabilistic weather input. Section 3 presents the annual results of a simulated CSP operation following the proposed scheduling plan. Finally, conclusions and outlook are discussed in Section 4.

2. Materials and Methods

ALFRED’s strategy has been developed to be applied for any renewable energy system with storage and allows flexible choice of the optimization algorithm. The proposed uncertainty post-processing is applied to obtain the final delivery schedule. This post-processing algorithm is based on a fuzzy decision tree approach, including the benefits of machine learning techniques into the dispatch problem.
Machine learning applications to practical tasks are mostly based on constructing a model of the knowledge used by a human expert [34]. The dispatching case consists of a problematic that involves the knowledge of several experts, such as meteorologists, plant operators, and market experts. Therefore, a tool that combines the knowledge from each field in an intelligent way should bring important improvements for dispatch planning. In this context, a fuzzy decision tree was the chosen machine learning methodology, allowing intuitive understanding of the calculations and decision-making process. Fuzzy logic is combined with the decision tree, aiming for a more flexible and accurate method.
Here, the extension of the uncertainty post-processing algorithm for a probabilistic approach is explained. For that, the deterministic ALFRED schedule planning is firstly highlighted, followed by a detailed explanation of the probabilistic extension.

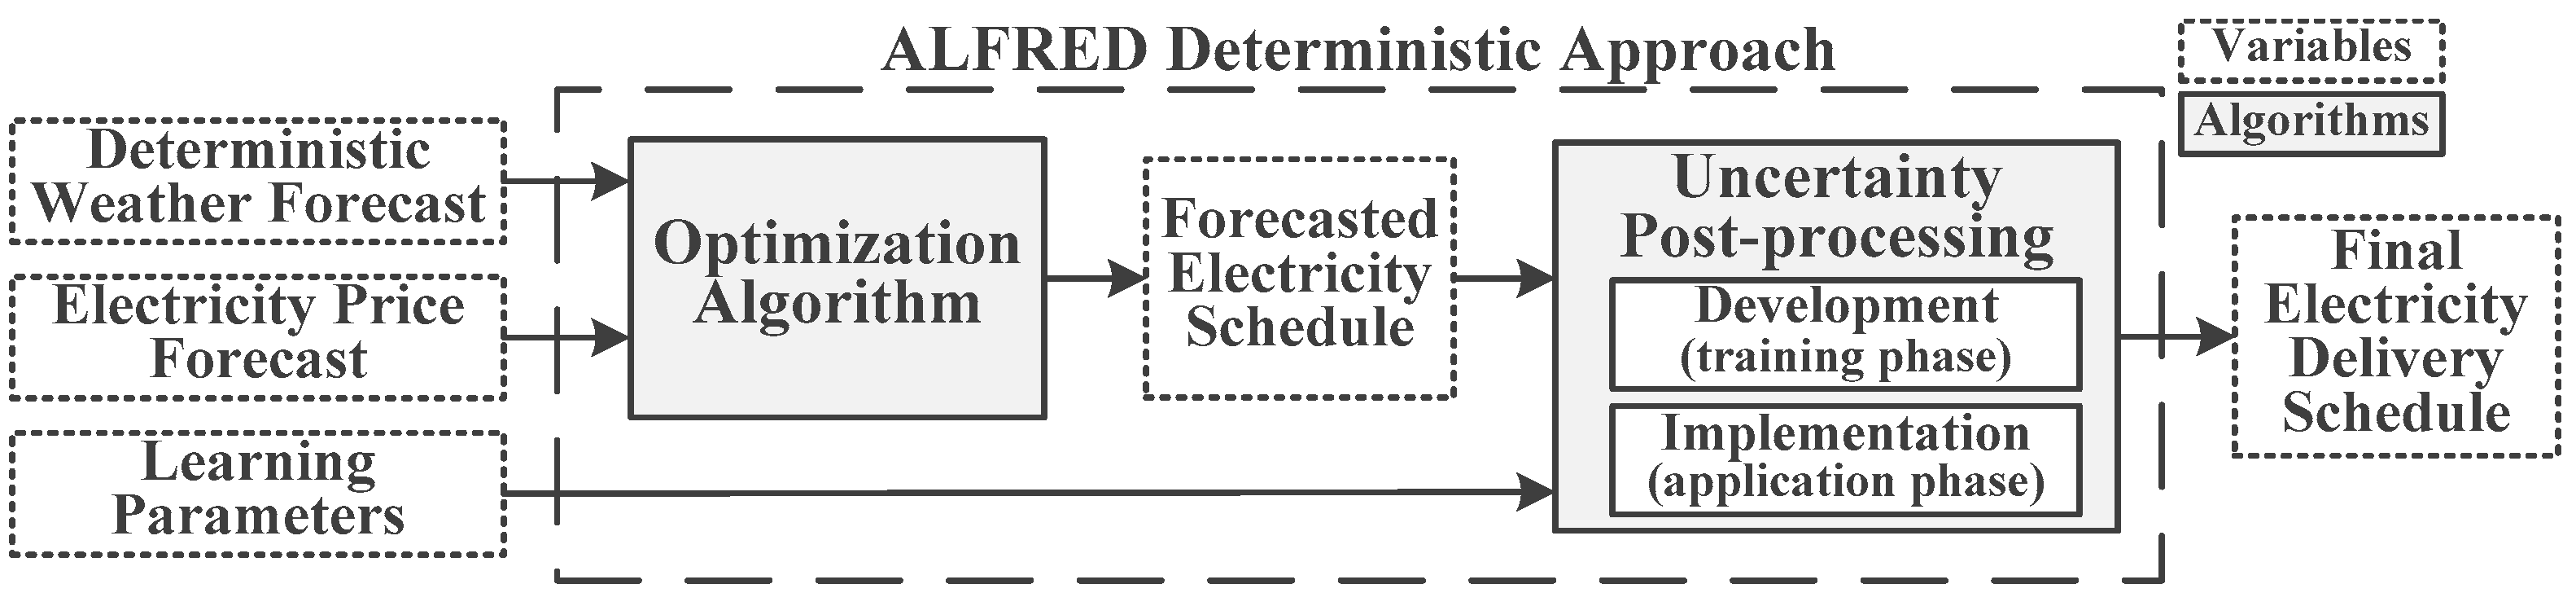
2.1. ALFRED Schedule Planning Based on a Deterministic Forecast

Presented by the authors in [20], ALFRED is a dispatch planning strategy that supports renewable plants with integrated storage to participate in wholesale markets. Initially designed to accept deterministic forecasts, ALFRED derives the electricity delivery schedule for the day-ahead. The reasoning and detailed explanation of the calculations performed by ALFRED’s deterministic approach are out of the scope of this paper. Here, only a general introduction of its main characteristics and findings is outlined, as a basis for the extension presented later on.
Similarly to existing approaches, ALFRED develops a financial optimum schedule based on electricity prices and weather forecasts. Its novel contribution is the incorporation of uncertainty treatment. For that, a partitioned calculation between the optimization algorithm and the uncertainty processing is performed, aiming to draw a schedule with electricity delivery during hours with high electricity price.
Although deterministic forecasts do not present uncertainty information, in reality, uncertainty exists and can be learned once considering similar situations that happened in the past. Accordingly, the schedule resulting from the optimization algorithm is calibrated by the uncertainty post-processing (UPP), based on the learning from historical data. The learning is applied with the aim to reach a schedule closer to a perfect operation, considered as the real optimum, when no uncertainties come into place. Figure 1 shows a scheme of the deterministic approach of the ALFRED strategy.
It is essential to select relevant learning parameters to be considered in the process, being suitable for the calculations and related to the problematic, but also with great potential to increase the quality of the learning. The reasoning behind these parameter selections are their relation to the uncertainty involved in predicting an optimal schedule, as well as their influence on the schedule development and on the consequences of committing to the proposed dispatch plan. Considering the values presented by the learning parameters on the past, their relation to a perfect operation can be assimilated, and then performed as a calibration during the development of a new schedule in a real operation.
The UPP algorithm is based on a fuzzy decision tree approach. Two main phases are involved in its application: development and implementation. The first phase consists in the training of the algorithm: the learning system is designed with historical data from the specific system in which it is desired to be applied. The second phase consists in the application of the algorithm: the learning system is used to define a final electricity delivery schedule to be cleared by the market. The UPP implementation is applied during the operation of a renewable energy system with storage, to be performed as a calibration after the optimization algorithm.
Considering the characteristics of fuzzy decision-trees, ALFRED’s strategy allows intuitive understanding of the decision-making methodology, expected to be of high acceptability among plant operators. The uncertainty treatment enables an automatic decision pattern to be generated and applied according to different conditions, performing an adjustment to the final delivery schedule. While some existing approaches consider uncertainty as a single parameter, with stochastic or chance constraints, ALFRED combines several relevant parameters with historical data, building knowledge on dealing with uncertainties based on past events. The suggested final electricity delivery schedule is then not designed purely based on forecasts, but also enhanced with the learning from past data. Figure 2 outlines an example of the deterministic application of the ALFRED strategy.
The analyses carried out in [20] show that ALFRED performs a beneficial economic energy management with effective treatment of uncertainties. Compared to a dispatch optimization without uncertainty treatment, ALFRED was proven to increase revenues when using the same weather input. Also, the knowledge assimilation from past data was demonstrated to enhance the scheduling independently on the amount of data used for the learning. The results presented in [20] show that ALFRED’s strategy achieves a more accurate schedule, and therefore, higher revenues.
By acquiring knowledge about uncertainties’ influence on weather forecasts, the quality of schedules developed by ALFRED are not exclusively dependent to forecasts quality, as it can be improved by the learning. Its performance is expected to improve once considering probabilistic forecasts, as more information about weather uncertainties becomes available for the learning process.

2.2. ALFRED Schedule Planning Based on a Probabilistic Forecast

The partitioned approach applied by ALFRED of optimum calculation with a post-process for the uncertainty treatment brings the possibility of dealing with other types of forecasts, such as probabilistic ones. In this work, an extension for the ALFRED strategy is proposed, by including the use of probabilistic forecasts into the schedule planning (Figure 3).
The aim of this paper is not to propose a dispatch optimization algorithm, but to enhance the capabilities of an existing dispatch strategy, which includes a certain optimization algorithm (aiming for revenue maximization) in combination with the ALFRED uncertainty post-processing. The uncertainty treatment can be applied for any selected optimization algorithm and is here extended to a probabilistic approach, without losing the applicability for deterministic forecasts.
Considering that, ALFRED’s upgraded framework runs the optimization algorithm deterministically for each available weather scenario, i.e., only once, if the forecast type is deterministic, or once for every scenario, if the forecast type is probabilistic. The main output of the optimization algorithm is the optimal forecasted electricity delivery schedule, in the deterministic case, or several schedules, in the probabilistic case. Subsequently, uncertainties are taken into account: the forecasted electricity schedule is the input for the uncertainty post-processing (UPP), which adjusts and defines a final electricity delivery schedule. In case a probabilistic weather forecast is used, the UPP uses all the forecasted schedules deterministically derived from the optimization algorithm as input. Its objective is to make a selection of a final optimum electricity delivery schedule. In other words, the result of the optimization is a range of possible power schedules, and the uncertainty post-processing is able to generate a single delivery schedule taking into account the energy market characteristics and uncertainties involved.
The reasoning behind the UPP probabilistic approach, the implemented adaptations on the learning system and the methodology for selecting a final schedule are described in the following sections. The uncertainty information brought by probabilistic forecasts can be used as an asset to improve dispatch planning. In order to do so, uncertainty information should be assessed during hours when scheduling is desired, as levels of chance or risk should be analyzed during instants with high electricity prices. By considering the optimized schedules, the proposed probabilistic UPP takes this into account: the weather forecast ensemble brings diverse scenarios of future weather, which are then transformed into distinct electricity schedules. By this process, the uncertainty information of the weather forecast is translated into uncertainty information of the electricity schedule. This is interesting and relevant since for the scheduling application it is not primarily relevant to know the uncertainty of the weather but to understand the resulting uncertainty in the production schedule. In general, this leads to shifting the uncertainty from the hours when the resource is available to hours when energy production is desired. Although the uncertainty is derived from the weather forecasts, ALFRED’s strategy changes the uncertainty paradigm to energy aspects. By doing so, the final schedule selection can be based on several influencing parameters, not only considering the possible amount of energy available, but also market characteristics related to the specific moments when scheduling is desired.
Figure 4 exemplifies this principle, outlining an ensemble of forecasted schedules developed by the optimization algorithm. During price peaks, all the schedules tend to plan the same power value for delivery, meaning that the amount of energy considered “certain” is similarly scheduled by all scenarios (e.g., at 20:00 of the first day and from 18:00 to 20:00 of the second day). This “certain” amount can either be related to initial energy in storage or to the minimum forecasted resource, expected to be available for all the scenarios. The energy that is uncertain to be produced, due to the different possible resource values, is then diversely scheduled by the scenarios during other hours of high price.
By shifting the uncertainty to hours when energy production is desired, more possibilities of evaluating a final dispatching value arise. ALFRED treats each delivery hour as a single decision problem, aiming for more flexible decision-making and consideration of the system’s characteristics related to each moment. Hence, according to the parameters involved and the variable risk related to different situations, decision-making under uncertainty can be performed as a combination of factors, considering not only the possible electricity to be scheduled, but also the ensemble variation and the market conditions.
As an example, similar distribution was noticed from 15:00 until 17:00 and at the end of the second day in Figure 4. Even though the set of choices were alike, the situations in which the decision-making has to be performed were not. The first differing parameter to be pointed out is the market price. Apart from that, other relevant variables and their relation to historical situations can differ, and therefore, lead to different decisions about the value to be finally scheduled.
These principles have been taken into account in order to extend the ALFRED approach to a probabilistic case. The details of the methodology are presented in the following.
The main adaptation of the ALFRED strategy in order to accept probabilistic forecasts is performed in the uncertainty post-processing (UPP) algorithm. It treats each delivery hour as a single decision-problem. Accordingly, in a probabilistic approach, each forecasted electricity schedule designed by the optimization algorithm is calibrated individually at each hour. Considering i = 1, 2, …, z and z as the total amount of generated schedules, and the time variable t j , where j = 1, 2, …, n and n as the time horizon of the schedule optimization, the variable P i forecast ( t j ) represent the forecasted electricity delivery value given by the optimization algorithm using forecast i. This is the value to be calibrated by the post-processing algorithm. At first, the approach of treating each time step as a different decision problem can be considered physically contradictory. However, by taking decisions based on the benefit/risk of each decision moment, a more pertinent decision can be taken. Also, by calibrating the schedule to be closer to the perfect one, the UPP corrects the schedule to a more real one, which considers energy conservation laws.
The probabilistic UPP algorithm is based on a fuzzy decision tree and involves the two phases (development and implementation) in its application. A new learning parameter set was implemented for the probabilistic approach. Therefore, the training phase and the application phase had to be adapted. In the following, the main differences implemented for the probabilistic approach are explained. The original approach for deterministic forecasts is only given by its rough ideas since the focus of this paper is on the adaptations to handle probabilistic forecasts.

2.2.1. Learning Parameter Inclusion

Aiming to consider the full value of probabilistic forecasts, the set of learning parameters was enriched. Table 1 outlines the variables used by the UPP, considering the original deterministic set with one additional variable for the probabilistic approach. The power difference between the forecasted power schedule under analysis ( P i forecast ) and the mean of all the possible schedules ( P mean ) was added to the set. This parameter ( Δ P i mean ) describes the position of the forecasted schedule under analysis in relation to the probabilistic set of schedules. A positive value indicates that the scheduled energy in this hour is higher than the average of all ensembles. As an example, the schedule under analysis in Figure 5b was equal to the ensemble mean at 8:00, but underperformed the mean significantly at 16:00. This enables the learning to contemplate the relation of a single scenario among the ensemble: the system tries to learn from historic data if the specific schedule tends to be over or under the mean value. For the deterministic case, this value is always zero, as the mean is equal to the single schedule, and therefore it does not influence the learning in a deterministic application.
The new parameter Δ P i mean together with the other learning parameters were used to train the learning system with past situations. This gives an improved understanding of the schedule’s deviation from the perfect schedule. Figure 5 presents a graphical explanation of all the learning variables, showing the schedule under analysis, perfect and persistence schedules (Figure 5a), the forecasted schedules ensemble (Figure 5b), and the hour priority according to the electricity price (Figure 5c).

2.2.2. Adaptation of UPP Development

The development phase consisted in the creation of the decision tree and the parameters classes based on a historical data set (also called training set). A scheme of this phase is presented in Figure 6. The procedure applied for the probabilistic approach was the same as the original deterministic one. The only new implementation was the inclusion of the extra learning parameter Δ P i mean as an input.
The parameters’ classes are defined in the Classes’ Definition step: by fuzzy c-means clustering method for the parameters deviation from ensemble mean, deviation from persistence schedule, hour priority and deviation from perfect schedule, while the classes of day of the year are previously defined as the yearly meteorological seasons, in which each season consists of three months. Figure 7 shows an example of the defined classes for the five parameters. As the learning system is based on a fuzzy approach, all the classes are represented in a fuzzy way, considering that each data point presents a degree of membership for one or more classes, varying from 0 (if the data point does not belong to the class) to 1 (if the data point fully belongs to the class).
The Classification Decision Tree Building step designed the decision tree according to the CART (Classification and Regression Tree) method developed by [35]. It operates based on a recursive partitioning approach, which subsequently divides the data into smaller portions to isolate most important variables. Considering the training data set, each data point is classified according to the previously defined clusters in order to build the tree, selecting each split (represented by the tree node) aiming for more “purity” of the data from the descendant subsets. The goal is to build a tree that provides as result the deviation from perfect schedule, considering the other four parameters as a basis for reaching a value for this selected parameter.
The tree building initially results in a very large tree, which is very complex and exact for the training data. However, this does not mean that it will be the best to deal with unseen data and make new predictions. More robust results can be achieved if the tree is reduced to a more accurate and condensed one. The Classification Decision Tree Pruning step reduces the original tree into an appropriate size, by cross-validation.
Figure 8 outlines an example of such a decision tree. Considering the classes previously defined in Figure 7, a branch which has been pruned is shown in green. Aiming for a light understanding of the pruning process, not all branches of the built tree are shown, describing with “…” the omitted branches. In this example, as a first decision criterion (first tree node), deviation from ensemble mean was analyzed. If the value under analysis is classified as positive or very positive, the evaluation continues to the right branch. Then, following the branch for the case that all other decision criteria are defined as false, a decision result is reached: deviation from perfect is expected to be neutral. This leaf is the result of cross-validation applied to all branches outlined in the detail in green. In the unpruned tree, although two other decision criteria are taken into account, the majority of leaves result in a neutral deviation from perfect. In the given example, only one leaf resulted in positive expected deviation from perfect. Therefore, by the application of the pruning method, the simplification taken for this final branch is considered to be more effective than the more detailed evaluation, with low probabilities of reaching a different result.
The last step of UPP development consists of Rules Extraction, which extract rules from the developed tree by interpreting the decision nodes. A rule extraction example is outlined, based on the branches represented in Figure 8. Rules 1, 2, and 3 result in the green, blue, and orange leaves, respectively, and are interpreted as the following:
Rule 1
If deviation from ensemble mean is positive AND deviation from persistence is very negative AND day of the year belongs to spring or winter AND hour priority is high or very high, THEN deviation from perfect is neutral.
Rule 2
If deviation from ensemble mean is positive AND deviation from persistence is positive, THEN deviation from perfect is positive.
Rule 3
If deviation from ensemble mean is very positive AND deviation from persistence is very positive, THEN deviation from perfect is very positive.
Notice that in order to reach a result, not all parameters have to be taken into account. Rule 1 expresses a branch in which all the four input parameters are considered, however, the branches translated in rules 2 and 3 already reach a leaf only by the analysis of two input parameter classes. Moreover, the parameter deviation from ensemble mean comes as the top node of the example tree. This means that this newly introduced parameter for the ensemble forecasts is assigned high relevance for the classification of new data. The fact that this parameter appears as the top node indicates the value of information brought by the probabilistic sets. With the rules extracted as shown, the UPP with the new probabilistic functionality is ready to be implemented.

2.2.3. Adaptation of UPP Implementation

UPP implementation applies the learning system developed by the training phase to determine the final electricity delivery schedule. A scheme of the implementation phase is presented in Figure 9. The parameters deviation from ensemble mean, deviation from persistence schedule, day of the year and hour priority are used as input from the current forecast, while the deviation from perfect schedule is the resulting output of the learning system. This deviation evaluated for each schedule of the ensemble is then used to adjust the corresponding electricity delivery schedules, aiming to reach schedules as close as possible to the perfect schedule.
As several possible schedules are developed by the optimization algorithm in the probabilistic case, the learning system is applied for every single schedule. Therefore, the result of the learning system is not yet one single final schedule, but still the same quantity of schedules as weather forecast ensemble members. In order to decide on a final schedule, an additional step was implemented in the probabilistic approach.
In the probabilistic implementation, the first three calculation steps (Classification, Fuzzy Decision Tree Rules Inference, and Forecasted Schedules Adjustment) were performed in the same manner as in the deterministic approach. In the Classification step, the input learning parameters were classified according to the fuzzy clusters defined during the training phase. Membership degrees for the defined class were assigned for each parameter. These values were then analyzed in combination with the rules derived from the decision tree, in the Fuzzy Decision Tree Rules Inference step. The rules were analyzed and interpreted in a fuzzy way, resulting in the prediction of the difference between the forecasted electricity schedule developed by the optimizer algorithm and the expected perfect forecast schedule (the detailed explanation of rules inference and deffuzification is explained in [20]). In the probabilistic case, this predicted deviation is obtained for each available scenario. This value derived by the rules inference is applied as an adjustment for each forecasted schedule, by the Forecasted Schedules Adjustment step. Considering i = 1, 2, …, z and z as the total amount of generated schedules, and the time variable t j , where j = 1, 2, …, n and n as the time horizon of the schedule optimization, the following calculation is applied:
P i adjusted ( t j ) = P i forecasted ( t j ) Δ P i perf ( t j ) .
This adjustment performs a calibration of the forecasted schedules, with the expected effect that the selection of a final schedule is then made under a smaller range of variation. Figure 10 shows an example of two-day schedules with and without the UPP adjustment. At Figure 10a, the forecasted probabilistic schedules resulting from the optimization algorithm are outlined, bringing several possibilities of delivery planning which differ quite significantly from a perfect operation. In Figure 10b, the same probabilistic schedules set are shown, but now with the adjustment applied by the UPP. The calibration performed had a positive impact on the range of choices, bringing all of the schedules closer to a delivery plan based on a perfect forecast.
At last, the Final Schedule Selection is applied, selecting for each hour of the dispatching horizon the ensemble member with minimum expected deviation from perfect, aiming for a dispatching plan as close as possible to the real optimum. Figure 10b outlines in red the final delivery schedule for the example case. The final schedule is then defined as:
P grid ( t j ) = P c adjusted ( t j ) ,   where   c = argmin ( Δ P i perf ( t j ) ) .

3. Results

3.1. Simulations’ Data and Conditions

In order to evaluate the proposed probabilistic dispatch planning strategy, simulations of a virtual 125 MW CSP tower plant with 10 h storage situated in Badajoz, Spain, following the ALFRED schedule were carried out. Just as in [20], the optimization algorithm selected to be applied in combination with the proposed UPP was the heuristic optimizer developed in [19], as this algorithm is suitable for CSP plants and also goes along with ALFRED’s strategy, having fast computational time and intuitive application. This optimizer uses a rule-based approach to develop CSP energy delivery schedules, with the main objective to plan a schedule that delivers electricity during times of high electricity price. The plant model used for the simulations was also described in [19]. The exchange of energy between the power plant components is represented in terms of heat flows: the energy collected from the solar field is stored in the thermal energy storage and then transformed into electricity by the power block. The simulations have been performed in MATLAB®.
Deterministic and probabilistic weather forecasts from the European Centre for Medium-Range Weather Forecasts (ECMWF), without a specific local calibration, and observed weather data from a weather station from AEMET (the Spanish State Meteorological Agency) were used. With data sets availability from May 2015 to May 2018, the two full years (2016 and 2017) were selected as testing periods, in which ALFRED is applied for the real operation simulation. The other months are then used for the UPP training. Although in a real application, future data cannot be used as learning support for present schedule planning (e.g., using 2018 data as training for 2017 operation), the setups used here aim to test ALFRED’s learning effectiveness for an entire year. Apart from that, it considered that the exact year used in the training was not relevant, but the seasonal influences were intrinsic in all of them. Table 2 outlines the weather input data sets used for the simulation. These data sets are referred in this section as the “forecast products”. Missing data or abnormal values were solved by linear interpolation from the previous and following time steps.
For the analysis of ALFRED’s application in combination with weather forecast quality, perfect and persistence weather forecast sets were considered. The simulation using perfect forecast aimed to analyze the theoretical maximum benefit, outlining a dispatch under precisely known conditions. Alternatively, the simulation using persistence forecast intended to analyze the minimum expected benefit, considering the cases when no weather forecast product was available.
Table 3 outlines the data direct normal irradiation (DNI) yearly sum and the root-mean-square error (RMSE), in order to assess the quality of the used weather data. The RMSE is considered as one of the most important statistical metrics for the application of electricity grid management issues [36] since it provides a measure for the deviation between forecast and real weather evaluated on a time step basis. A similar yearly sum could be caused by a real good weather forecast matching the real weather in each forecasted hour. The persistence case is a good example that shows that a yearly sum not necessarily means that the forecast on a daily basis is good.
The DNI yearly sum value of the deterministic set was slightly higher than the one of persistence and perfect forecast for 2016, but slightly lower for 2017. At the same time, the RMSE of the deterministic products was much lower than the one for persistence, indicating that the deterministic forecast generally deviated less from the real weather than the persistence forecast. It can be expected that deterministic weather products in general work well in reducing the forecast error compared to persistence. Similar annual sums indicated that one would not even expect large systematic deviations.
Considering the probabilistic products, the DNI yearly sum of the ensemble mean of all sets was much higher than the one of the persistence and perfect forecast. This is an artefact originating in the way the ensembles are generated. While positive deviations were only capped when exceeding unphysically high DNI values, a systematic capping was applied for hours where the value fell below zero. This led to the situation that a number of ensembles having positive values shifted the mean towards a positive value. The data showed that such situations often occur during low DNI periods. However, the RMSE values are much lower than the one for persistence, reflecting that on average, the mean did not deviate significantly from the observed weather. Even though expressive systematic deviations were observed, the mean of the probabilistic ensemble worked well in reducing the error in the forecast compared to persistence.
Taking into consideration only the result for the ensemble mean as given in Table 3, we would not expect a significant benefit for the dispatching. The valuable information comes from not using the mean, but the whole set of ensembles. The DNI yearly sum and the RMSE for each ensemble scenario are calculated and shown in Figure 11. The main idea of using probabilistic sets was to possibly improve the forecast by selecting the most appropriate ensemble member. The DNI yearly sum of each scenario (in Figure 11b) presents a range of around 1500 kWh/m2 for both simulated years. Considering the RMSE of each scenario (in Figure 11a), most values were still lower than the persistence one.
For the results analysis, both energetic and economic aspects were evaluated. The energetic indicators are annual sum of the electricity delivered to the grid, the electricity scheduled but undelivered, and the total thermal energy dumped by the solar field during the simulated year. As an economic figure, the annual financial income was calculated. The setup assumed that the electricity was scheduled on the day-ahead market, considering a schedule delivery at 12:00 from the previous day and a penalty of 100% of the market price when scheduled electricity cannot be delivered.
The electricity price forecast was considered certain, based on real day-ahead market price of the Iberian market in hourly resolution, see Figure 12. Although, the current Spanish day-ahead price profile (in terms of average and variation) is not sufficient to economically operate a CSP plant in a competitive basis, this market operation is expected for such plants in the future. Apart from the reduction in CSP investment costs [37,38], wholesale price volatility will increase with larger shares of variable renewables [39], with an increase in market peak prices and plant operational benefits [40]. Accordingly, this study did not consider the final price as relevant, but focused on scheduling the best production given the price signal. The decision here was to use real price signals and to not consider any levelized cost of electricity (LCOE) calculations that might lead to the conclusion that the plant is not economically feasible in the wholesale market today.
In order to analyze ALFRED as a dispatch planning method able to deal with deterministic and probabilistic forecasts, simulations of the same plant following two other scheduling strategies were used for comparison: an enhanced solar driven strategy and an optimization-only strategy.
As a dispatching benchmark, the enhanced solar driven strategy considers electricity production whenever there is solar field output, additionally scheduling the available stored energy during higher prices hours. As a commonly applied strategy for CSP dispatch operation, the comparison to this approach brings general information on the benefits of a more elaborated dispatching strategy, including a more comprehensive optimization algorithm and uncertainties treatment.
The optimization-only strategy comparison aims to evaluate the benefits of applying the suggested learning method, and therefore, analyze the advantages of treating uncertainties. For that, ALFRED’s strategy was divided and the results of its complete application (optimization algorithm + uncertainty post-processing) were compared to the application of the optimization algorithm alone.
On the application of the enhanced solar driven and optimization-only strategies with probabilistic weather forecasts, the mean value of the ensembles was suggested as a delivery schedule, since ensemble selection done by ALFRED wass not activated.

3.2. General Analysis of Simulation Results

At first, annual financial income results were analyzed, as seen in Figure 13. The grey bars show the annual revenue obtained by the enhanced solar driven approach, light blue bars indicate the income when following an optimization-only approach and dark blue bars express financial values for the complete ALFRED strategy, considering the optimization algorithm with the uncertainty post-processing. The lines show the improvement rate relative to the enhanced solar driven approach with the persistence forecast as input (i.e., the relative deviation to the most left grey bar). This rate aims to analyze each case with the overall benchmark in means of scheduling strategy and weather forecasting.
Results show that even if no weather forecast product is available, the sole application of a more comprehensive optimization algorithm can bring great economic improvements. The use of a persistence forecast as input to the optimization showed an income of 7.18% and 4.52% higher than the persistence solar driven case, for 2016 and 2017, respectively. Also, for both years, the optimized persistence approach brought higher income than an enhanced solar driven approach with any of the forecasts’ products. Hence, the application of a more comprehensive optimization algorithm becomes more relevant, whereas the use of forecast products with a simpler scheduling approach gets less impact.
Results using the perfect forecast showed an increase in annual income of 17.68% in 2016 and 14.88% in 2017, considering the enhanced solar driven approach, and of 30.45% in 2016 and 26.02% in 2017, considering the optimization-only approach. This reveals the potential improvement once weather uncertainties are eliminated in the dispatch planning. Apart from that, the application of a more comprehensive optimization algorithm increased the annual income maximum value, expanding the possibilities of financial improvement. This was expected since the applied optimization helps to shift production into higher price hours, while the enhanced strategy only considers some elementary rules.
By analyzing the enhanced solar driven approach, improvements on the range of −0.11% to 2.63% were obtained by the weather forecast products. While the deterministic sets showed a greater improvement rate, the probabilistic sets brought very small benefits or even lower revenues than the persistence solar driven case, with improvement rates of 0.54% for 2016 and −0.11% for 2017. By analyzing the optimization-only approach, improvements on the range of 0.26% to 11.16% were obtained by the forecast products in comparison to the persistence solar driven case. This showed that revenue improvement is not only dependent on forecast type, but also on the dispatching strategy applied. The deterministic set showed the greatest improvement rates for both simulated years, while significantly lower values were obtained by the probabilistic sets. So far, the expectation of increased performance when using probabilistic schedules seems not to be realized.
For both these dispatching approaches, results were highly dependent on the quality of the forecast. The DNI aspects presented in Table 3 showed significant differences in DNI yearly sum of the probabilistic sets in comparison to the perfect forecast. Also, low RMSE values were observed. This showed that the better match in terms of RMSE seems to be less relevant for an enhanced solar driven or optimization-only approach, whereas the systematic error gets greater impact. Even though revenue improvement was obtained with an optimization-only application in comparison to an enhanced solar driven strategy, the single application of an optimized schedule planning does not guarantee bringing significant economic benefits with probabilistic sets.
Once the proposed UPP adjustment was applied, annual income improvement was obtained for most sets, in comparison to the optimization-only approach. The only exception was the 2017 deterministic set which presented a very small decrease, with an improvement rate of 8.50% for the optimization-only case and of 8.43% for the ALFRED case. While a slight increase occured for the 2016 deterministic set, expressive rise was observed for the probabilistic sets, with greatest improvement rates for both simulated years: 15.02% in 2016 and 12.50% in 2017. Among the weather products, the probabilistic sets presented the lowest annual income with the enhanced solar driven approach, while the highest values were achieved with ALFRED (optimization + UPP calibration). This indicated the great potential of considering more information about uncertainties in order to reduce forecasts errors. Considering the DNI aspects presented in Table 3, the better match in terms of RMSE seems to be more relevant for an approach that treats uncertainties. Also, ALFRED’s application with the probabilistic products led to results close to a perfect solar driven operation. These results showed that ALFRED succeeds in reducing the systematic deviation impact of the weather forecast, by effectively treating the uncertainties.
Energy indicators results are presented in Figure 14. Annual sums of electricity delivered to the grid, electricity scheduled but not delivered and thermal energy dumped by the solar field are shown.
For both simulated years and dispatching approaches, the perfect schedule had the mostly lowest amount of electricity undelivered and lowest thermal energy dumped by the solar field. As expected, an ideal weather forecast brings not only economic benefits but also better utilization of solar energy, represented by a significant decrease in dumping and undelivered electricity.
Considering the total electricity delivered to the grid, the optimization-only application resulted in an increase in this value for all cases, when comparing to the enhanced solar driven approach. The UPP calibration strategy generally reduced the value of total electricity delivered in comparison to the optimization-only approach. However, an increase in financial income was obtained for almost all data sets. As an example, the 2017 probabilistic set presents slight decreased in energy delivered with the application of ALFRED, while its financial income was significantly improved, with an improvement rate value of 12.50%. Also, once applying the enhanced solar driven approach, the perfect case did not show the highest electricity delivered to the grid, even though the highest revenues were achieved. Accordingly, financial improvement was not directly related to more energy delivered, but to enhanced planning, considering financial goals and weather uncertainties.
With the optimization-only approach, the highest values of undelivered energy were achieved by forecast sets with a high difference of DNI yearly sum in comparison to the perfect forecast. Even though the RMSE of the forecast products was lower than the one of persistence, their amount of undelivered energy mostly overcame the benchmark. This showed the impact of systematic deviation in cases when uncertainty is not treated. Considering the UPP calibration, the amount of energy undelivered was significantly reduced when compared to the other dispatching approaches. Accordingly, the ALFRED strategy was proven to lower the impact of uncertainties, by decreasing the deviation on delivery.
Regarding the energy dumped by the solar field, the application of the optimization algorithm alone generally decreased this value when compared to the enhanced solar driven strategy. At the same time, the UPP calibration strategy resulted in an increase in energy dumped for all simulated data sets, when compared to the optimization-only. Considering the enhanced solar driven strategy for comparison, a reduction of dumped energy with the UPP calibration was observed for the deterministic cases for both simulated years, while an increase happened for the probabilistic data sets. Nevertheless, an increase in financial income occured for all the cases. Also, ALFRED results presented lower dumping values than the persistence cases. Hence, for a greater use of the available resources, the use of forecast products was proved to be more relevant than using a persistence prediction.
Generally, economic improvement was reached by ALFRED deterministic and probabilistic approaches in comparison to enhanced solar driven and optimization-only approaches, even though diverse trends in energy indicators were obtained for each case. As foreseen, weather forecast accuracy proved to be important in order to reach a more accurate schedule, as shown by the perfect cases results. Besides, relevant potential was shown by an advanced scheduling strategy that considers financial goals and is able to deal with weather uncertainties, especially once more information on uncertainties are available, such as included in the probabilistic sets.

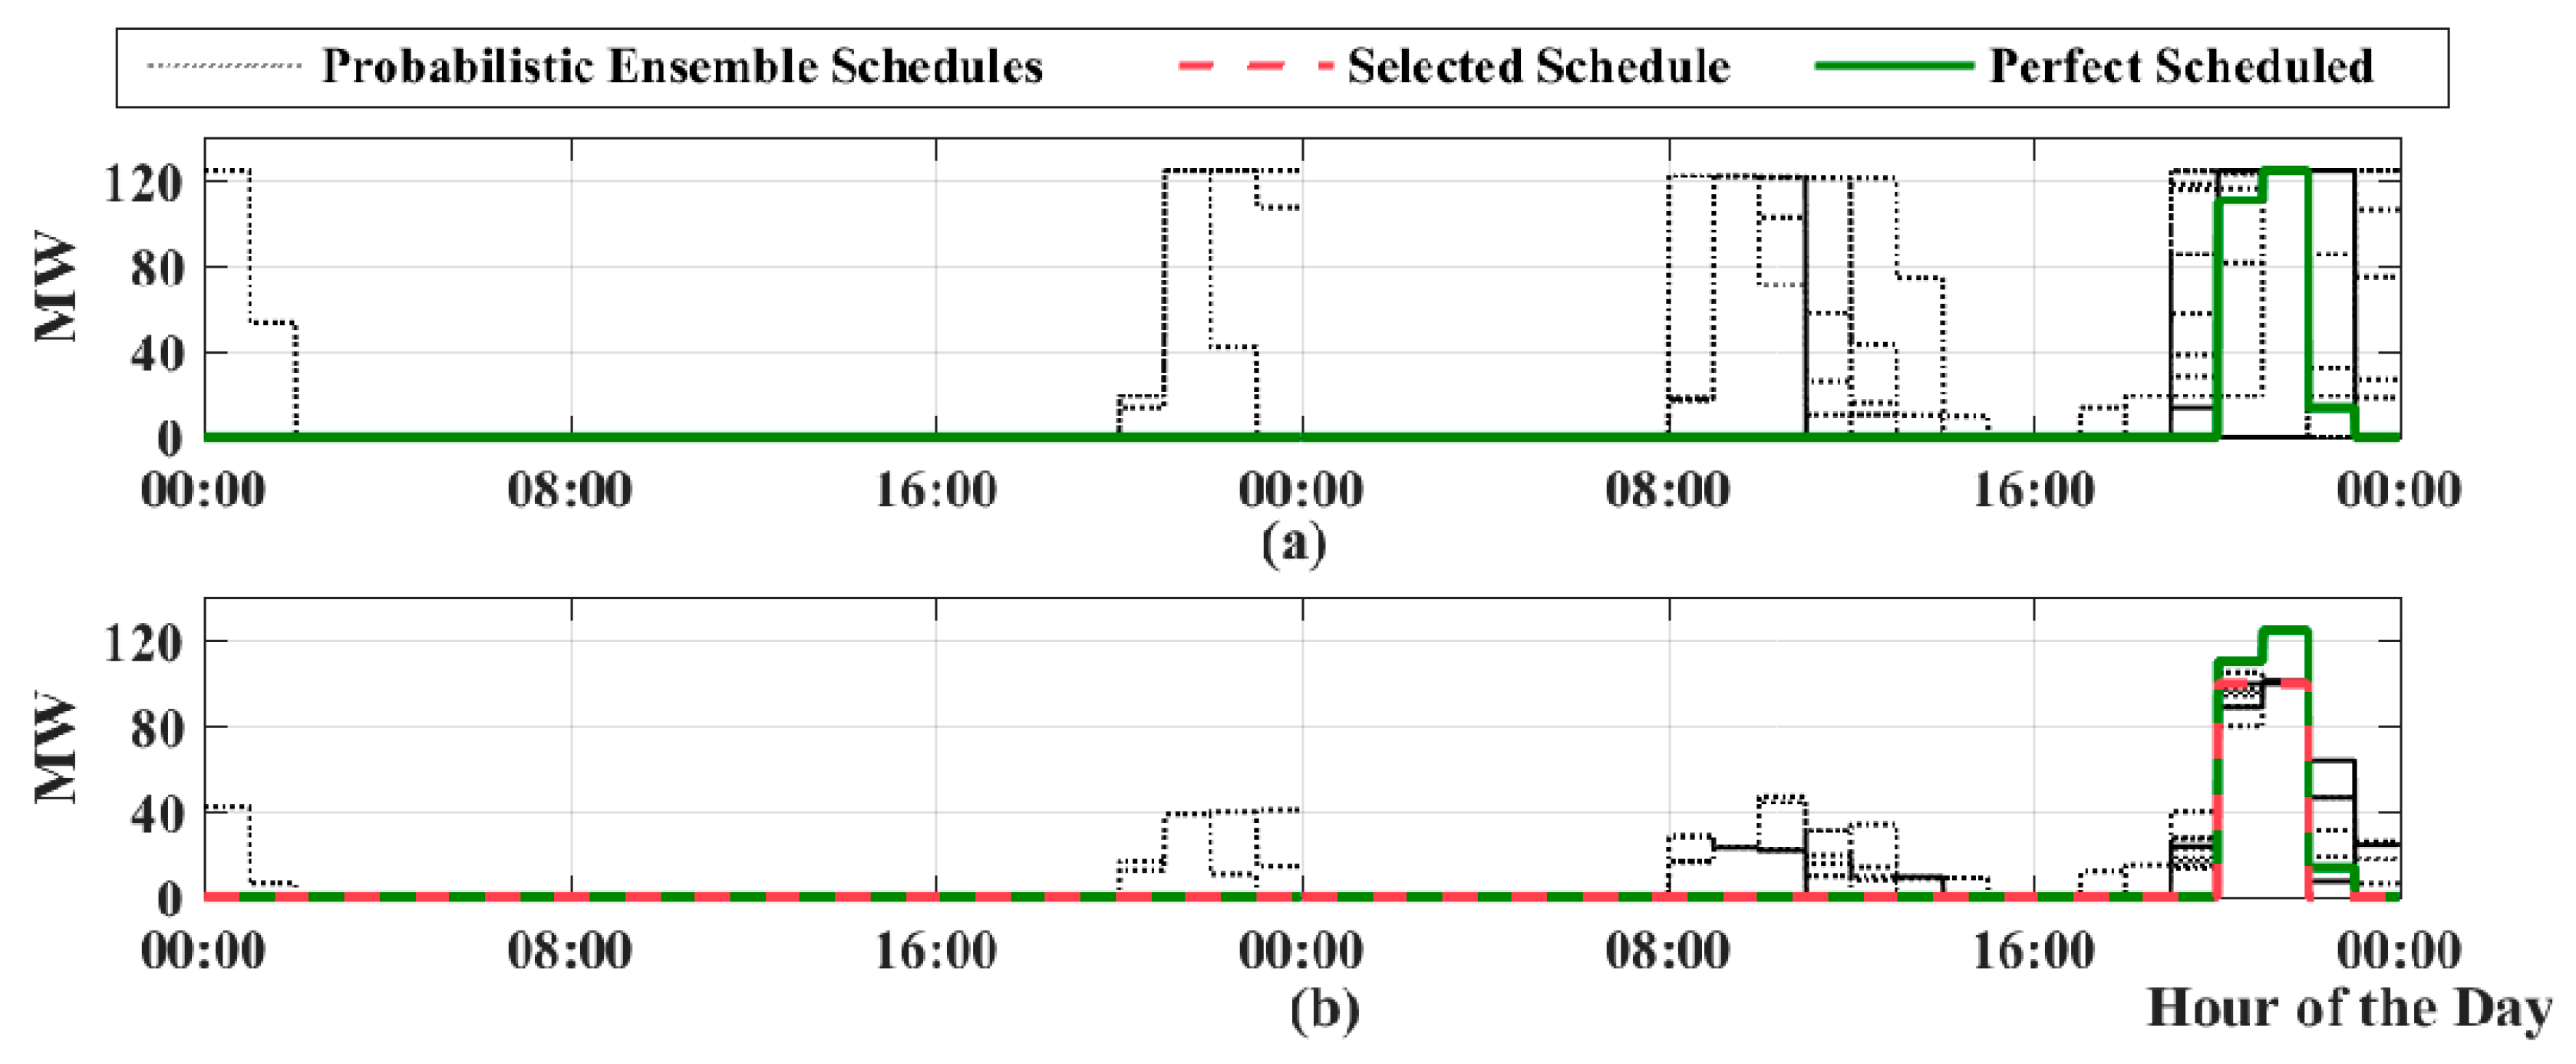
3.3. Detailed Analysis of Probabilistic Dispatch Planning

For a better understanding of the learning effect applied by the UPP adjustment and the performance of ALFRED probabilistic selection, the annual revenue improvement rates of each scenario of the probabilistic cases are outlined in Figure 15. Results are shown considering the same scenario as the selected dispatch schedule throughout the entire simulated year. Here, the optimization-only persistence case was used as basis for comparison (most left light blue bar in Figure 13). Results related to the probabilistic sets are shown in green and the deterministic sets in red. While improvement rates for each scenario are outlined for the optimization-only and calibrated ensemble cases, a straight line represents the values of the deterministic sets and ALFRED probabilistic final schedule, as these refer to one single schedule. The 2017 deterministic set presents similar values for the optimization-only and calibrated strategies (3.80% and 3.74%, respectively), and therefore are overlapped in Figure 15b.
By the application of the optimization-only approach, around half of the scenarios show negative improvement rate values, reflecting a lower income than the benchmark (optimization-only persistence case). This means that the operation of the entire year following one of these schedules would result in the given annual yield difference. Scenarios with negative values were, on average, worse than the persistence case. The results with the optimized but not calibrated schedules show that a majority of the ensemble resulted in a worse performance (e.g., scenarios 25 to 50 of the 2017 probabilistic set—Figure 15b), whereas only a few show slight improvements (e.g., scenarios 5 to 25 of the 2017 probabilistic set—Figure 15b). This confirms that the application of the optimization algorithm alone does not guarantee financial improvements in comparison to the benchmark. Also, most of them have much lower values than the deterministic set results. Without treating the uncertainties, results are dependent on the quality of weather forecast product.
Considering the UPP adjustment application, the improvement rate for almost all scenarios was significantly enhanced, when compared to the optimization-only. Even if just a slight increase was obtained for some scenarios (e.g., scenarios 10 to 20 of the 2016 probabilistic set—Figure 15a), drastic rise for most scenarios occured. As an example, scenarios 40 to 50 of the 2016 probabilistic set (Figure 15a) had an improvement rate lower than −10% with the optimization-only approach, which were increased to positive values by the UPP adjustment. Accordingly, even for cases in which the incomes were extremely lower than the persistence case, the adjustment performed by the UPP was able to deliver better results than this benchmark. This indicates that the UPP succeeded on learning with past data, and based on that, applying a calibration on the schedule that decreases the financial impact of systematic and stochastic errors.
Overall, the UPP adjustment application led to a homogenization of the ensemble, when compared to the optimization-only, increasing the mean improvement rate while reducing the results range for each ensemble. Taking the 2017 probabilistic set as an example, the scenarios range went from a minimum of −27.60% and maximum of 5.65% with optimization-only to a minimum of 0.60% and maximum of 7.62% with UPP adjustment (Figure 15b). With that, the adjustment performed by the UPP developed improved possibilities to be considered for the decision-making.
In any case, a final decision needs to be taken. Even though the UPP adjustment brings an enhanced set of scheduling options, the best one is desired. A wrong decision could lead to a benefit of 0.60%, instead of 7.62%, as outlined by the previous example. Considering that, besides the importance of the adjustment, the strategy taken for the selection is very relevant for a final decision. Results show that the ALFRED probabilistic selection strategy increased the annual financial revenue for both simulated years: the probabilistic final schedule improvement rate outperformed the optimization-only strategy and most of the calibrated scenarios, being also superior than the ensemble mean and the deterministic calibrated values. Consequently, the proposed ALFRED selection proved to be a well-suited decision-making strategy even if moderate forecasts are available. Once more, results indicated that the UPP succeeded on learning with past data and on selecting a schedule that decreased the financial impact of forecasting errors.

4. Discussion and Conclusions

An innovative dispatch optimization strategy with special consideration of weather forecast uncertainty is presented. As an original feature compared to existing dispatching solutions, it allowed the using of probabilistic forecasts—and their information regarding uncertainties—to support renewable energy systems with storage to participate in the wholesale electricity market. The ALFRED methodology, presented by the authors in [20] and initially developed for a deterministic forecast input, was enhanced here to an approach that uses probabilistic forecasts as input. ALFRED applies an optimization algorithm in combination with a machine learning method that calibrates uncertainties and performs a selection of a final delivery schedule. Though employed for a CSP tower system in this contribution, the developed approach is applicable to other renewable energy systems with storage.
Energetic and financial analyses were performed considering the annual simulation of a CSP plant following the ALFRED scheduling methodology using either deterministic or probabilistic input data sets. The performance of the improved scheduling algorithm was compared to an operation of the same plant following an enhanced solar-driven and an optimization-only dispatch planning. Considering that the same market rules were applied for the data set period used in the simulations and current days, the presented results were consistent for an actual application.
By means of annual simulations, the value of treating the uncertainties was demonstrated. Financial improvements reached by using the enhanced solar driven and the optimization only algorithm strongly depend on the quality of the weather forecast product. The proposed learning algorithm overcame this drawback. It was effective independent of the weather forecast type used. This was shown by simulation using deterministic and probabilistic forecasts. The developed uncertainty post-processing algorithm developed a scheduling result that is related to the uncertainty information and the historical data considered in the calculations. By assimilating this knowledge, an enhanced scheduling was achieved. Overall, the learning algorithm applied as uncertainty post-processing improved the optimization results by reducing the impact of weather forecast uncertainty. The simulation results with uncertainty processing showed improvements in financial revenues when compared to the cases in which uncertainty was not considered. The performance of the algorithm is expected (but not shown) to improve along with time, as more data for the UPP learning process become available. The introduced selection of a final schedule from the ensemble of production schedules was proven to be a well-suited decision-making strategy, as simulations with the final selected schedule outperformed most of the scenarios with UPP adjustment only.
Several weather forecast products were used as input data. The probabilistic forecast sets showed the best financial performance as soon as the ALFRED UPP was applied, outperforming the deterministic sets from the same source. The obtained results showed that the ensemble cases in most cases performed better than the deterministic cases after ALFRED was applied. The presented analysis indicates that a systematic benefit for the scheduling optimization resulted from the additional information provided by the ensemble forecasts. At the same time it shows, that the intrinsic benefit of the ensemble can only be leveraged if appropriate schedule planning algorithms, like the one presented in this work, is used.
In conclusion, the ALFRED probabilistic approach was proven to be a beneficial scheduling strategy able to outperform traditional planning methods and optimization-only algorithms. Nevertheless, considering that only one forecasting source and location were evaluated in this work, further studies based on detailed weather forecasts should be conducted to strengthen this finding.
Even though ALFRED succeeded on including weather uncertainties, electricity price uncertainties are not considered in the schedule planning or on the simulations performed. In reality, such aspects can be important for dispatch decision-making, and can influence the results. Hence, the inclusion of price uncertainties is a relevant aspect for further improvement.
Accurate dispatch planning methods with capabilities of bringing improved revenues are essential for the insertion of renewable plants in wholesale electricity markets. The flexibility brought by energy storage in combination with the enhanced tool enable the participation of renewable systems, such as CSP plants, in such markets, contributing to a future energy scenario with a high renewable mix.

Author Contributions

Conceptualization, A.C.d.A.B. and T.H.; methodology, A.C.d.A.B.; software, A.C.d.A.B.; validation, A.C.d.A.B.; writing-original draft preparation, A.C.d.A.B.; writing-review & editing, A.C.d.A.B. and T.H.; supervision, T.H. and R.P.-P. All authors have read and agreed to the published version of the manuscript.

Funding

This work was supported by the ‘‘DLR-DAAD Research Fellowships” programme implemented by the DLR and the German Academic Exchange Service (DAAD).

Conflicts of Interest

The authors declare no conflicts of interest.

Nomenclature

P grid Final scheduled electrical power to be delivered to grid
P mean Mean value of scheduled electrical power ensemble in the probabilistic case
P pers Scheduled electrical power based on persistence forecast
P perf Scheduled electrical power based on perfect forecast
P i forecast Forecasted electrical power schedules based on optimization algorithm, where i = 1, 2, …, z and z is the total amount of generated schedules
P i adjusted Adjusted electrical power schedules by the uncertainty-post processing algorithm, where i = 1, 2, …, z and z is the total amount of generated schedules
Δ P i mean Deviation from forecasted schedule to ensemble mean, where i = 1, 2, …, z and z is the total amount of generated schedules
Δ P i pers Deviation from forecasted schedule to persistence schedule, where i = 1, 2, …, z and z is the total amount of generated schedules
Δ P i perf Deviation from forecasted schedule to perfect schedule, where i = 1, 2, …, z and z is the total amount of generated schedules

References

  1. Reddy, S.S. Optimal power flow with renewable energy resources including storage. Electr. Eng. 2017, 99, 685–695. [Google Scholar] [CrossRef]
  2. Lee, D.; Kim, K. Recurrent Neural Network-Based Hourly Prediction of Photovoltaic Power Output Using Meteorological Information. Energies 2019, 12, 215. [Google Scholar] [CrossRef] [Green Version]
  3. Abdel-Nasser, M.; Mahmoud, K. Accurate photovoltaic power forecasting models using deep LSTM-RNN. Neural Comput. Appl. 2019, 31, 2727–2740. [Google Scholar] [CrossRef]
  4. Zhang, J.; Verschaex, R.; Nobuhara, S.; Lalonde, J. Deep Photovoltaic Nowcasting. Sol. Energy 2018, 176, 267–276. [Google Scholar] [CrossRef] [Green Version]
  5. Mathe, J.; Miolane, N.; Sebastien, N.; Lequeux, J. PVNet: A LRCN Architecture for Spatio-Temporal Photovoltaic Power Forecasting from Numerical Weather Prediction. arXiv Preprint 2019, arXiv:1902.01453. [Google Scholar]
  6. Wang, H.; Li, G.; Wang, G.; Peng, J.; Jiang, H.; Liu, Y. Deep learning based ensemble approach for probabilistic wind power forecasting. Appl. Energy 2017, 188, 56–70. [Google Scholar]
  7. Zugno, M.; Jonsson, T.; Pinson, P. Trading wind energy on the basis of probabilistic forecasts both of wind generation and of market quantities. Wind Energy 2013, 16, 909–926. [Google Scholar] [CrossRef] [Green Version]
  8. IRENA. Adapting Market Design to High Shares of Variable Renewable Energy; International Renewable Energy Agency: Abu Dhabi, United Arab Emirates, 2017. [Google Scholar]
  9. Nottrott, A.; Kleissl, J.; Washom, B. Storage dispatch optimization for grid-connected combined photovoltaic-battery storage systems. In Proceedings of the IEEE Power and Energy Society General Meeting, San Diego, CA, USA, 22–26 July 2012. [Google Scholar]
  10. Hanna, R.; Kleissl, J.; Nottrott, A.; Ferry, M. Energy dispatch schedule optimization for demand charge reduction using a photovoltaic-battery storage system with solar forecasting. Sol. Energy 2014, 103, 269–287. [Google Scholar] [CrossRef]
  11. Kraas, B.; Schroedter-Homscheidt, M.; Madlener, R. Economic merits of a state-of-the-art concentrating solar power forecasting system for participation in the Spanish electricity market. Sol. Energy 2013, 93, 244–255. [Google Scholar] [CrossRef]
  12. Orwig, K.; Ahlstrom, M.; Banunarayanan, V.; Sharp, J.; Wilczak, J.; Freedman, J.; Haupt, S.; Cline, J.; Bartholomy, O.; Hamann, H.; et al. Recent trends in variable generation forecasting and its value to the power system. IEEE Trans. Sustain. Energy 2015, 6, 924–933. [Google Scholar] [CrossRef]
  13. Vasallo, J.M.; Bravo, M.J. A novel two-model based approach for optimal scheduling in CSP plants. Sol. Energy 2016, 126, 73–92. [Google Scholar] [CrossRef]
  14. Wagner, M.J.; Newman, A.M.; Hamilton, W.T.; Braun, R.J. Optimized dispatch in a first-principles concentrating solar power production model. Appl. Energy 2017, 959–971. [Google Scholar] [CrossRef]
  15. Pousinho, H.M.; Contreras, J.; Pinson, P.; Mendes, V.M.F. Robust optimization for self-scheduling and bidding strategies of hybrid CSP-fossil power plants. Electr. Power Energy Syst. 2015, 67, 639–650. [Google Scholar] [CrossRef]
  16. Dominguez, R.; Baringo, L.; Conejo, A. Optimal offering strategy for a concentrating solar power plant. Appl. Energy 2012, 98, 3297–3318. [Google Scholar] [CrossRef]
  17. He, G.; Chen, Q.; Kang, C.; Xia, Q. Optimal Offering Strategy for Concentrating Solar Power Plants in Joint Energy Reserve and Regulation Markets. IEEE Trans. Sustain. Energy 2016, 7, 1245–1254. [Google Scholar] [CrossRef]
  18. Wittmann, M.; Eck, M.; Pitz-Paal, R.; Müller-Steinhagen, H. Methodology for optimized operation strategies of solar thermal power plants with integrated heat storage. Sol. Energy 2011, 85, 653–659. [Google Scholar] [CrossRef]
  19. do Amaral, A.C.; Burghi, H.; Tobias, P.; Robert, P. FRED: The Flexible Renewable Energy System Dispatch Optimizer. J. Sol. Energy Eng. 2019, 141. [Google Scholar] [CrossRef]
  20. do Amaral Burghi, A.C.; Hirsch, T.; Pitz-Paal, R. Artificial Learning Dispatch Planning for Flexible Renewable Energy Systems. Energies. submitted for publication.
  21. Möhrlen, C.; Bessa, R.J.; Barthod, M.; Goretti, G.; Siefert, M. Use of Forecast Uncertainties in the Power Sector: State-of-the-Art of Business Practices. In Proceedings of the 15th International Workshop on Large-Scale Integration of Wind Power into Power Systems as well as on Transmission Networks for Offshore Wind Power Plants, Energynautics, Vienna, Austria, 15–17 November 2016. [Google Scholar]
  22. Perez, R.; Kivalov, S.; Schlemmer, J.; Hemker, K., Jr.; Renne, D.; Hoff, T.E. Validation of short and medium term operational solar radiation forecasts in the US. Sol. Energy 2010, 84, 2161–2172. [Google Scholar] [CrossRef]
  23. CENER. Post-Processing for Deterministic and Probabilistic Weather Forecasting in Probabilistic Weather Forecasting; H2020-PreFlexMS project 2015: Madrid, Spain, 2015. [Google Scholar]
  24. Tracton, M.S.; Kalnay, E. Operational ensemble forecasting prediction at the National Meteorological Centre: Practical aspects. Weather 1993, 8, 379–398. [Google Scholar]
  25. Leith, C.E. Theoretical skill of Monte Carlo forecast. Mon. Weather Rev. 1974, 102, 409–418. [Google Scholar] [CrossRef] [Green Version]
  26. Gneiting, T.; Katzfuss, M. Probabilistic Forecasting. Annu. Rev. Stat. Its Appl. 2014, 125–151. [Google Scholar] [CrossRef]
  27. Tuohy, A.; Zack, J.; Haupt, S.E.; Sharp, J.; Ahlstrom, M.; Dise, S.; Grimit, E.; Mohrlen, C.; Lange, M.; Casado, M.G.; et al. Solar forecasting: Methods challenges and performance. IEEE Power Energy Mag. 2015, 13, 50–59. [Google Scholar] [CrossRef]
  28. Zhou, Z.; Botterud, A.; Wang, J.; Bessa, R.J.; Keko, H.; Sumaili, J.; Miranda, V. Application of probabilsitic wind power forecasting in electricity markets. Wind Energy 2013, 16, 321–338. [Google Scholar] [CrossRef]
  29. Gonzalez-Aparicio, I.; Zucker, A. Impact of wind power uncertainty forecasting on the market integration of wind energy in Spain. Appl. Energy 2015, 159, 334–349. [Google Scholar] [CrossRef]
  30. Appino, R.R.; Ordiano, J.A.G.; Mikut, R.; Faulwasser, T.; Hagenmeyer, V. On the use of probabilistic forecasts in scheduling of renewable energy sources coupled to storages. Appl. Energy 2018, 210, 1207–1218. [Google Scholar] [CrossRef]
  31. Arriagada, E.; Lopez, E.; Lopez, M.; Blasco-Gimenez, R.; Roa, C.; Poloujadoff, M. A probabilistic economic dispatch model and methodology considering renewable energy, demand and generator uncertainties. Electr. Power Syst. Res. 2015, 121, 325–332. [Google Scholar] [CrossRef]
  32. Botterud, A. Chapter 10—Forecasting Renewable Energy for Grid Operations. In Renewable Energy Integration (Second Edition)-Practical Management of Variability, Uncertainty, and Flexibility in Power Grids; Academic Press: Cambridge, MA, USA, 2017; pp. 133–143. [Google Scholar]
  33. Du, E.; Zhang, N.; Hodge, B.-M.; Kang, C.; Kroposki, B. Economic justification of concentrating solar power in high renewable energy penetrated power systems. Appl. Energy 2018, 649–661. [Google Scholar] [CrossRef]
  34. Quinlan, J.R. C4.5 Programs for Machine Learning; Morgan Kaufmann Publisher, Inc.: San Mateo, CA, USA, 1993. [Google Scholar]
  35. Breiman, L.; Friedman, J.; Stone, C.J.; Olshen, R.A. Classification and Regression Trees; Taylor & Francis: Abingdon, UK, 1984. [Google Scholar]
  36. Schroedter-Homscheidt, M.; Benedetti, A.; Killius, N. Verification of ECMWF and ECMWF/MACC’s global and direct irradiance forecasts with respect to solar electricity production forecasts. Meteorol. Z. 2016, 26, 119. [Google Scholar] [CrossRef]
  37. Kost, C.; Shammugam, S.; Jülch, V.; Huyen-Tran, N.; Schlegl, T. Levelized Cost of Electricity Renewable Energy Technologies. Fraunhofer Inst. Sol. Energy Syst. 2018. [Google Scholar]
  38. IRENA. Renewable Power Generation Costs in 2017; International Renewable Energy Agency: Abu Dhabi, United Arab Emirates, 2018. [Google Scholar]
  39. IEA. Re-Powering Markets: Market Design and Regulation During the Transition to Low-Carbon Power Systems; OECD/IEA: Paris, France, 2016. [Google Scholar]
  40. Eichman, J.; Denholm, P.; Jorgenson, J. Operational Benefits of Meeting California’s Energy Storage Targets; National Renewable Energy Laboratory (NREL): Golden, CO, USA, 2015.
  41. OMIE. Resultados del Mercado. 2018. Available online: http://www.omie.es/ (accessed on 30 April 2018).
Figure 1. Artificial learning flexible renewable energy system dispatch (ALFRED) deterministic dispatch planning tool: a partitioned approach of an optimization algorithm with the machine learning uncertainty post-processing (which includes a development and an implementation phase).
Energies 13 00616 g001
Figure 2. ALFRED deterministic application results: forecasted schedule (optimization algorithm result), adjusted schedule (post-processing result/final schedule), and perfect electricity schedule for two example days [20].
Energies 13 00616 g002
Figure 3. ALFRED probabilistic dispatch planning tool. The aspects in which adaptations are implemented for this approach are highlighted in green.
Energies 13 00616 g003
Figure 4. Financial profile (a), resource probabilistic forecast (b)—direct normal irradiation, which is the relevant resource for CSP systems—and forecasted (optimized) electricity delivery schedules (c) for two example days.
Energies 13 00616 g004
Figure 5. Learning parameters explanatory graph: perfect and persistence schedules (a); probabilistic ensemble of possible schedules, ensemble mean and a schedule under analysis (b); expected price and, in red, hour priority (c).
Energies 13 00616 g005
Figure 6. Uncertainty post-processing development scheme, with the adaptations of the probabilistic approach highlighted in green.
Energies 13 00616 g006
Figure 7. Example of classes’ definition for the parameters deviation from ensemble mean (a), deviation from persistence (b), day of the year (c), hour priority (d) and deviation from perfect (e).
Energies 13 00616 g007
Figure 8. Some branches of an example decision tree. The leaf, in green, is the result of the pruning process and the pruned branches are outlined in detail.
Energies 13 00616 g008
Figure 9. Uncertainty post-processing implementation scheme, with the adaptations of the probabilistic approach highlighted in green.
Energies 13 00616 g009
Figure 10. Perfect schedule and forecasted probabilistic schedules without calibration (a) and with calibration applied by the uncertainty post-processing, highlighting the selected schedule in red (b).
Energies 13 00616 g010
Figure 11. Root mean square error (a) and yearly sum of the direct normal irradiation (b) of each scenario from the probabilistic sets. Scenarios are sorted from minimum to maximum DNI values.
Energies 13 00616 g011
Figure 12. Mean hourly Spanish day-ahead market price with standard deviation for 2015 (a), 2016 (b), 2017 (c), and 2018 (d) [41].
Energies 13 00616 g012
Figure 13. Annual simulated results of financial income for 2016 (a) and 2017 (b), and improvement rates in comparison to the enhanced solar driven persistence case for each input set.
Energies 13 00616 g013
Figure 14. Total electricity delivered to the grid for 2016 (a) and 2017 (b), total electricity scheduled but not delivered for 2016 (c) and 2017 (d) and total thermal energy dumped by the solar field for 2016 (e) and 2017 (f), considering different dispatching strategies.
Energies 13 00616 g014
Figure 15. Financial income improvement rates in comparison to optimization-only persistence case for each scenario of the simulated cases for 2016 (a) and 2017 (b). Scenarios are sorted from minimum to maximum DNI values. The deterministic and probabilistic calibrated final schedule cases consist of a single-schedule scenario and are represented with a straight line.
Energies 13 00616 g015
Table 1. Description of UPP learning variables for the deterministic and probabilistic approaches.
VariableDescriptionCalculationDeterministic ApproachProbabilistic Approach
Deviation from ensemble meanThe power difference between the forecasted schedule under analysis and the mean of the all the possible schedules. Δ P i mean = P i forecast P mean Not usedUsed
Deviation from persistence scheduleThe power difference between the forecasted schedule and the schedule developed based on a persistence forecast (the benchmark in forecasting, used when no forecast product is available—it considers that the day tomorrow will be exactly like today). Δ P i pers = P i forecast P pers UsedUsed
Day of the yearThe number of the day among the year.UsedUsed
Hour priorityThe priority of the hour under analysis according to its market price. Higher price hours have higher priority, in a decreasing order until the lowest price. For hours with same price, higher priority is given to the earlier one, as energy losses are expected to be avoided if production occurs earlier, and the meteorological forecast is usually more accurate for prior time instants.UsedUsed
Deviation from perfect scheduleThe power difference between the forecasted schedule and the schedule developed based on a perfect forecast (ideal forecast that considers weather observations as the prediction). Δ P i perf = P i forecast P perf UsedUsed
Table 2. Data sets used for the ALFRED application analysis.
Data Set DenominationWeather Forecast TypeData Used for TestingData Used for Training
det 2016deterministic2016 (January–December)2015 (May–December), 2017 (January–December), 2018 (January–May)
det 2017deterministic2017 (January–December)2015 (May–December), 2016 (January–December), 2018 (January–May)
eps 2016probabilistic2016 (January–December)2015 (May–December), 2017 (January–December), 2018 (January–May)
eps 2017probabilistic2017 (January–December)2015 (May–December), 2016 (January–December), 2018 (January–May)
Table 3. Badajoz data direct normal irradiation (DNI) yearly sum and root-mean-square error (RMSE).
Data Set DenominationDNI
Yearly Sum (kWh/m2)RMSE
Persistence 20162030.15231.48
det 20162093.65162.53
eps 2016 (ensemble mean)2287.09158.32
Perfect 20162032.500
Persistence 20172171.37213.80
det 20172159.04152.66
eps 2017 (ensemble mean)2404.19152.60
Perfect 20172172.250

