Article

Optimum Renewable Energy Investment Planning in Terms of Current Deficit: Turkey Model

1
Department of Economics, Karamanoglu Mehmetbey University, 70100 Karaman, Turkey
2
Department of Mathematics, Karamanoglu Mehmetbey University, 70100 Karaman, Turkey
3
Department of Economics, Selcuk University, 42130 Konya, Turkey
4
Selcuk University, Institute of Social Sciences, Department of Economics, 42130 Konya Turkey
*
Author to whom correspondence should be addressed.
Energies 2020, 13(6), 1509; https://doi.org/10.3390/en13061509
Submission received: 3 March 2020 / Revised: 19 March 2020 / Accepted: 20 March 2020 / Published: 22 March 2020
(This article belongs to the Section A: Sustainable Energy)

Abstract

:
In this study, a methodology was suggested for wind and solar energy investment plans through linear optimization model for the countries with an energy-based current deficit problem. The originality of the study is that it is a renewable energy investment model based on the functioning of the balance of payments for current deficit reduction, which has not previously been encountered in the literature. While creating the model, without causing external economic imbalance, certain parameters were taken into consideration such as profit transfers for the foreign direct investments, interest payments for the domestic investments, import rates for the wind and solar energy systems, energy electric power production values, electric power load balance, electricity transmission infrastructure, CO2 emission, future electric power demand projection, and import source rates in the electric power production. It was proven that the model, for the 2019–2030 period in Turkey, not only is an opportunity for decreasing the current deficit but also ensures reaching the CO2 emission reduction target. Additionally, through the investments in wind and solar energy, it was calculated that fossil-based electric power production will decrease by 80%, and a CO2 reduction will be provided, which is equivalent of 100 million tonnes GWh natural gas. As a more general result, an optimization model was created which provides a solution for countries coping with energy-based current deficit in economic terms, energy-based air pollution in environmental terms, and renewable energy technology insufficiency.

1. Introduction

Dornbusch and Fischer [1] reported that it was a threshold value if the current deficit is 4% of the GDP (Gross Domestic Product), Freund [2] reported it to be a threshold value if it is 5% of the GDP, and numerous economists stated that if this percentage is exceeded it is an early warning signal for a crisis. Additionally, in studies conducted on determinants of exchange rate crises, it was reported that if the current deficit /GDP rate is 2.67%, it increases the possibility of crisis by 6.34% [3]. According to Labonte [4], high current deficit rates are the most important indicators of financial and currency crises in developing countries such as Mexico, Turkey, Brazil, Argentina, and East Asian countries [4] (p. 6). In accordance with this warning, the recent Trade War based on the current deficit of the USA is stated by many economists as the canary in the mine for the world economy. The cause of the trade wars is the high rates of current deficit emerging from the high rates of foreign trade deficit in countries such as the USA, China, Mexico, and Canada to the rest of the world [5]. It is stated by the USA government as well, that this current deficit weakens the growth of the USA economy and decreases employment. Therefore, economy authorities of the USA suggest that increasing the custom duties will decrease the current deficit [6]. Considering that the current deficit is a problem even for the USA’s economy, which is the alchemist converting the paper into gold, it can be concluded that current deficit is a more important problem for other, small economies. It was firstly mentioned in “The Wealth of Nations” (Smith 1776) that decreasing the current deficit rates by increasing the customs duties, thus preventing the trade, would decrease the GDP growth and welfare level of the world [7] (p. 15). However, when the “1929 Great Depression” emerged, the economy’s authorities considered decreasing the current deficit rates by increasing the customs duties, thus reducing the productions being imported from other economies. Increasing customs duties based on this consideration had a negative impact on the world welfare level and GDP growth instead of being a solution for the economic problems [8]. In recent years, overlooking the experiences of the past, politicians have been attempting to resort to increase the customs walls, which was started particularly by the USA government, or to impoverish the neighbors. In an empirical study conducted by Li et al. [9], it was concluded that increasing the customs duties in accordance with trade wars reduces the world GDP and welfare, reaching the same general result with Adam Smith 250 years later. Having said that, a high rate of current deficit is accepted as a factor increasing the possibility of the currency crisis of economies and solutions are sought for reducing the current deficit rates [10,11,12].
It is an important issue for the economies to develop a method for reduction of current deficit without bringing a customs barrier and, as a result, without damaging the global welfare. Therefore, our research study brings forth an alternative method for the economies with energy-based current deficit problems in order to reduce the current deficit in the long term without increasing the customs duties. The method, in general, determines the sectors causing the current deficit by examining the import and export systems of the economies. Focusing on the determined sectors, it is aimed at deciding policies based on mathematical models for reduction of current deficit. In our study, the most important cause of current deficit in Turkey was determined to be energy sector, and we focused on decreasing the imported fossil resources for electric power production. It was determined that renewable energy resources (RES) are cost-effective instead of imported fossil fuels.
In the 2006–2017 period, the current deficit/GDP ratio was 5.22% annually in Turkey, while the same ratio minus net energy import was approximately 0.63% per year. For the above-mentioned 12-year period, Turkey executed 443 billion dollars’ worth of net energy with 505 billion dollars of current deficit. In the financing of the current deficit, which is mainly due to energy import (88%), the external economic balance was restabilized by capital inflows like “other investments” worth 240 billion dollars, “portfolio investments” worth 142 billion dollars, and “foreign direct investments (FDI)” worth 142 billion dollars [13,14]. The foreign exchange gained through capital inflow is being spent for the imported fossil-based energy in the current period, while the foreign exchange liability emerging from this case creates an unsustainable foreign exchange requirement for the future period such as FDI profit transfer and credit instalment repayment. Additionally, the widening gap between foreign exchange assets and liabilities creates the threat of foreign currency crisis. This threat, which caused an accumulation of foreign exchange liabilities arising from current deficits of previous periods, and an additional speculative attack caused a net 32 billion dollars’ worth of capital outflow from the Turkish economy in 2018. As a result of this outflow, the nominal exchange rate of dollar/TL, which was 3.80 on 8 March, 2018, reached a value of 6.89 on 14 August, 2018, with an 81% increase [13], emerging as a currency crisis. One of the most important causes of this currency crisis is spending the foreign exchange obtained from capital inflow for the fossil-based energy import, which only creates environmental pollution and debt at the end of the current period, instead of renewable energy (RE) investments.
In the 2006–2017 period before the currency crisis, Turkey executed 443 billion dollars’ worth of net energy import, only 149 billion dollars (30%) of which was used for the fossil-based electric power production [13,14,15]. Although having a high potential of wind and solar energy, Turkey could not benefit from these energy resources, and could only watch the advent of the currency crisis. While importing the fossil-based resources, Turkey was only using 13% of its 49 GW installed wind power potential and only 1.3% of its 254 GW installed solar power potential as of the end of the year 2017 [16,17]. In order not to face another currency crisis, Turkey should decrease its dependency on imported energy, and it is essential to resort to RES in the energy policy of Turkey in order to provide national resources-based energy production with a low cost.
Annual electricity sale prices of the Turkey Electric Trading and Contracting Corporation (TETAŞ) fluctuated between 45–105 $/MWh in a 12-year period (2006–2017), and the average price was 75 $/MWh [18] (pp. 20-21). As a result of decreasing RE power even below the prices of fossil-based electric power production, Power Purchase Agreement (PPA) auctions were implemented for electric power production based on wind and photovoltaic devices (PV). Within the context of the FDI, the participation of consortiums which have the RE system production technology was ensured. For PV solar energy electric power production in 2017, an auction was held with a 69.9 $/MWh purchase guarantee for 1 GW capacity. Additionally, within the specifications of the agreement, the winning consortium was obliged to ensure at least 65% domestic PV panel production with an annual 500 MW capacity. As per the wind energy, a 1 GW RES auction was made for 34.8 $/MWh in 2017. The investment of a 65% domestic wind turbine factory was also added into the specifications [19].
The optimization model of the RE investments for reducing the current deficit is not just a solution for the economy of Turkey. It is a model that can be used for many countries with a current deficit problem and with intensive energy import rates such as the USA, UK, Mexico, South Africa, Australia, Poland, and Argentina according to the data of International Money Fund [20]. For the method suggested in the study, the parameters such as domestic production rates of wind and solar energy systems, energy production values, electric power load balance, future energy demand development, production potential of energy resources, current deficit structures of countries, greenhouse gas emission reduction targets, and energy transmission infrastructure can vary across the countries. However, through this RES investment optimization model, this study aimed to suggest a solution methodology for all countries.
In the next section, the analytical models used in the literature are examined concerning the RE energy, solar and wind systems, and current deficit. In the third section, the objective function and constraints are indicated, examining the logical framework in creating the coefficients and parameters of the variables. In the fourth section, assessments are discussed about the model analysis and results. In the last section, the results obtained in the research study and further studies are evaluated for developing the suggested model and dissemination of the applications.

2. Literature

Concerning an energy-based decrease in current deficit, no optimization model has been encountered in the literature modelling wind and PV solar energy investment planning. Previous studies in the literature can be classified into two groups. The first group of studies analyze the relationship between current deficit and energy-based import through econometric models, which demonstrate that the motive behind the current deficit is fossil resources and price shocks in these resources. The second group of studies are optimization studies about resource planning with minimum cost (Optimal Energy Allocation Model: OEAM) and RES enlargement of economies in terms of electric power production for meeting the electricity demand of the next period.

2.1. Literature About the Energy-Based Current Deficit Problem

In their studies conducted in different years about Turkey, Yanar and Kerimoğlu [21] and Uysal et al. [22] determined a long-term relationship among the energy consumption, current deficit, and economic growth through the Johansen cointegration analysis. Additionally, through the vector error correction (VEC) model, they concluded that as the growth increases the energy consumption will increase as well, which will have an increasing influence on the current deficit. Soydal et al. [23] and Özsoy and Dinç [24] reported that it is necessary to decrease the energy import in order to decrease the foreign trade deficit, and for the balance of payments to follow a positive trend; thus, they suggested that various RE potentials existing in our country should be revealed such as wind, solar, geothermal, bio-energy, and hydroelectric and should be utilized at higher levels. Using the data of the 1996–2012 period, Göçer [25] analyzed the motives behind the current accounts deficit and finance quality in Turkey through the Vector Autoregression (VAR) model, and analyzed the sustainability through Johansen and VEC methods. As the conclusion of this analysis and for the period that was analyzed, it was determined that 37% of the current deficit was due to energy import, 26% of it was emerging from the foreign trade deficit, 24% was due to foreign debt interest payments, while 7% was due to FDI profit transfers, and 6% was because of portfolio investments. Doğan [26] mentioned that, among the energy resources, due to the heavy use of oil and natural gas particularly for the production of electric power, caused a radical increase in the import of energy after the year 2003, which is an important factor in foreign-dependency in energy. As a conclusion of electric power production with these imported resources, the foreign-dependency in energy increased and, naturally, the current accounts deficit increased as well. Bayrak and Esen [27] reported that Turkey failed to increase the energy production rate equal to the increase in the energy consumption, and this caused an important problem like the energy deficit. It was asserted that increasing energy deficit and foreign-dependency in Turkey leads to deficits in current accounts, destabilizes the macroeconomic equilibrium, and causes the economy to become more fragile against external shocks.
Karabulut and Ayşe [28] examined the current accounts deficit, which seems to be a problem of developing countries but also a problem for many powerful economies like the USA. Using the VEC method in their analysis, which enables the examination of both short- and long-term relations, they determined that, as a result of increasing oil prices, the current deficit increases as well. In a study conducted by Huntingto [29], the relationship was statistically examined between the current deficit and the crude oil trade. It was demonstrated that an increase in oil import under certain conditions is an important factor creating a current deficit for countries. Vaona [30] examined the relations between the RE production and import dynamics for 26 countries in terms of import equation. As the conclusion, it was determined that an increase in the use of RE decreases the rate of increase in the import. Moreover, it was also assessed that the use of RE contributes not only to the sustainability, but also to a decrease the foreign debts, a decrease the detrimental effects of fossil and nuclear energy resources on health and environmental issues, and a decrease in foreign dependency. Van and Roger [31] examined the impacts of energy-based shocks on economy between 1700–2010 via the VAR model. As the conclusion of the investigation, it was determined that the use of RES should be encouraged in order to decrease the impacts of these energy-based shocks.
Econometric studies, in general, revealed that energy demand increases in line with growth, and that it is the energy import that causes the current deficit problems of the fossil-resource poor countries. However, these studies just determined the existing status, and they did not develop policies of strategies based on solutions for decreasing the current deficit. Although it is suggested in some studies to increase the use of RE, the export, and the investments in the R&D, no mathematical solution model is provided. In brief, for the economies experiencing a current deficit problem due to energy import, there is no study at a sufficient level that provides a solution about how to substitute the imported energy and about under which circumstances the wind and PV solar energy can be a solution for a current deficit problem.

2.2. The Literature of Optimization in Terms of RES Planning

The optimization models in the literature initiated with the basic formulation of linear optimization model, which was developed by George Dantzig in 1947 [32]. Since this date, different models have been suggested for different complex problems, and it has been attempted to develop new models and solutions.
Generally, a classification is made in optimization models based on the structural differences of the equations in the system, which are comprised of objective function and constraints. According to this classification, these are Linear Programming (LP), Non-Linear Programming (NLP), Mix Integer Linear Programming (MILP) and Multi-Objective Programming (MOP). For the analysis of the developed optimization models, certain methods are being used that give precise results such as simplex, lagrangian multipliers, dynamic programming, and branch bound algorithms [33]. Metaheuristics models are used such as Artificial Neural Networks (ANN), Genetic Algorithm (GA), Particle Swarm Optimization (PSO), Simulated Annealing (SA), Ant Colony Optimization (ACO) and hybrid models that do not guarantee to give precise results based on the complexity and data size of the developed models [34]. RE optimization models are developed for the minimization of objectives such as total energy system cost, LCOE, environmental pollution, minimum withholding, energy loss amount, CO2 emissions and maximization of objectives such as total energy production, system reliability, profit, total revenues, and enlargement of RE use. The main constraints used in the RE optimization models are investment budget, demand/load balance, 100% RE, CO2 emissions, energy costs, transmission and distribution infrastructure, energy storage, area of utilization, and energy potential [35]. The complexity of the RE optimization models are based on objective and constraint variety, mathematical differences among the decision variables, and the numbers of variables and equities. The creation of software is increasingly continuing, developing various solutions for these model variations. Müller et al. [36] compared the functional structures, usage characteristics, and analysis methods of the software models developed for energy planning in European countries. They examined 47 different energy optimization planning software programs used across Europe. Ringkjøb et al. [37] conducted a thorough investigation of 75 modelling software programs that are used for the analysis of current energy and electricity systems. It was observed that 45 out of these mentioned 75 software tools included LP, MILP, NLP, MOP, and heuristic optimization tool.
Kumbaroğlu et al. [38] developed a methodology for a planning model, which integrates the learning curve information for RE production technologies and a dynamic programming formulation that involves a real option analysis for the Turkish electricity supply industry. The model repetitively evaluates a group of investment alternatives on a yearly basis; thus, it considers that the flexibility of the delay of an irreversible investment spending might deeply influence the dispersion potential of RE production technologies. As the conclusion of the model, it was demonstrated that technological learning, electricity market incentives, and liberalization of energy market are important factors. Alagöz et al. [39] developed their 2017–2030 PV solar energy investment plan through LP model for the reduction of current deficit in Turkey. The objective of the developed optimization model was to maximize the reduction of energy-based fossil import, and as per the constraints, they created the optimization model considering constraints such as electricity demand of the next period, capital for the investments, the cost of imported RES system due to technological insufficiency, current account balance, total solar energy potential, and solar energy installed power objective. The developed model was analyzed in the General Algebraic Modelling System (GAMS) programming language. As the result of the analysis, it was calculated that PV solar energy investments would decrease the imported fossil-based electric energy, thus reducing the current deficit below 4%.
Dudhani et al. [40] added the RE preference to the model for the optimization of the electricity generation based on energy resources. The suggested model is an LP-based energy resource distribution model. In the analysis of the model, it was demonstrated that the RES was quite compatible with the interconnecting system in order to meet the peak load demand of the produced power. Iniyan et al. [41] employed an optimization with the ANN in order to meet the electric energy generation of India between 2010–2020 through RES (wind, hydro, biomass etc.) instead of fossil-based electric power production. In the objective function, it aimed to meet the next period’s electricity demand through the minimum electricity price by means of maximum RE usage. As the constraints of the model, electricity demand, energy resources potential, resource efficiency, emission reduction, and carbon tax were used as fuzzy constraints. As the optimal result of the model, they concluded that, as of 2020, the electricity generation based on fossil resources would be reduced by 32% through RES. Rizzo and Giancarlo [42] presented a solution via LP for the CO2 emission reduction by considering the efficiency and costs of the optimal energy resources. For the heating, hot water, and electric energy needs, the model was analyzed through criteria such as thermal collector, solar energy panel, fossil resources, energy savings, investment costs, annual energy saving, and CO2 emissions. The suggested LP model was demonstrated to be appropriate for the sustainable energy action plan implementations at micro level. Mourmouris and Potolias [43] conducted an analysis for the Thassos island of Greece through an MOP model detailing the use of RES (wind, solar, biomass etc.) for energy and heat production. The objective of the study was to determine the optimal level of RES to be produced in the region and to determine the optimal energy mix. The results proved that, regionally, the increasing power demand would be met through systems combining wind, biomass, and PV energies. Pereira et al. [44] focused on the generation expansion problem (GEP) and on the distribution of an increasing portion of electricity generation of RES through interconnecting systems. The analysis of different electricity scenarios for a combined hydrothermal wind energy system was analyzed through the MILP model. The results, costs, and expected impacts for the CO2 emissions were evaluated for a 10-year planning period, and a group of optimal scenarios were analyzed. It was proven that the efficiency of the system increased through particularly wind energy.
Gulagi et al. [45] created a power system plan through the LP model for a 100% RE-based 2030 projection for different energy scenarios in Eastern Asia. The model was analyzed by the simulation method for the minimum cost objective. The basic objective was to evaluate the advantages of a grand transmission network combining North-eastern Asia and South-western Asia. In the countries where the network connections were implemented, the total annual costs and the Levelized cost of electricity (LCOE) for the energy sector decreased by 8%. In line with the scenario, it was determined that the system could decrease the annual total cost by 0.4–0.7%.
Amrutha et al. [46], for the potential use of the RES in India, analyzed the efficiency of RE policies such as Renewable Purchase Obligation (RPO) and Renewable Energy Certificates (REC) mechanisms. The objective was to minimize the total cost of an effective match established between supply and hourly demand by appropriately modelling the RPO and REC policy interventions for a 1-year period. The model was developed as a low-carbon electricity planning tool to manage the RPO targets and the total electricity demand, which is not met, as well as ideally meeting the dynamic electricity demand and RPO targets. According to the analysis of the model, which was developed based on the MILP, even though the electricity system did not have a REC policy, it was demonstrated that it makes towards a sustainable RE future.
In the study conducted by Liu et al. [47], an optimization model was suggested, which would provide the transmission of electricity produced from the RES that are concentrated on certain different locations in China, within two scenarios, and it was analyzed through a heuristic optimization method. The first scenario aims at gradually increasing the heterogeneity of wind and solar energy in different locations, and to minimize the production costs independent from the match between the production and demand. The aim of the second scenario is to optimize the balance between low-cost production and the high utility value of energy. In both cases, 100% RE use was aimed in the 2050 projection of the Chinese interconnection electricity network. Models were developed for each region based on an 8-year high precision hourly time series, wind and solar energy production, and electricity demand. In the study, it was demonstrated that, compared to the homogeneously distributed basic designs of RE capacities, a heterogeneous network not only decreases the capital investments but also reduces the reserve capacities provided from the thermal units.
In a study conducted by Zhang et al. [48], it was attempted to determine the optimum level of the maximum rate of capacity utilization of the wind and solar energy resources for the Beijing, Tianjin, and Hebei region. The developed model was analyzed through a simulation software named “Energy PLAN” which makes energy planning according to the resources. Simulation software compares the impacts of energy resource planning strategies according to energy, environment, and economic factors based on various energy resources. As the conclusion of the comparison, it was demonstrated that wind and solar energy can meet more than 30% of the total energy need.
In another study conducted by Chen et al. [49], several important issues like RES integration, operating reserve, free energy market, reaction of demand, and carbon pricing were included into the GEP problem. They provided a methodological framework to handle with a systematically approach involving an optimization under the conditions of energy system engineering, energy with a complicated structure, economic and environmental problems, superstructure-based model, MILP, MOP, and uncertainty. The model is in a multi-objective structure with economic and environmental factor objectives and it was analyzed through the GAMS language. As the result of the analysis, it was demonstrated that, depending on the constraints, RES proved an effective planning solution in terms of GEP.
In another study conducted by Henao et al. [50], an optimization model was developed considering the production competition based on costs between traditional technologies (hydro and thermal) and alternative RES (PV solar and wind). The model aims at minimizing the system costs, CO2 emissions, and the number of power cuts due to drought. The model was analyzed through two methods known as Implicit Stochastic Optimisation (ISO) and Robust Optimization (RO). As the conclusion of the analysis, it was demonstrated that the RES should replace all kinds of fossil-based technologies due to economic and environmental reasons.
Zappa et al. [51] developed their model with seven scenarios that can be compared to the basic scenario for the 2050 European energy system, considering the different levels of future demand and technology utility on a 100% RES basis. The developed scenario models were analyzed through the PLEXOS (North Adelaide, Australia) program, which brings the MILP solution for the RES integration and system adequacy and which has been used in numerous studies. Within the framework of European 100% RES scenarios, while an optimization of production technologies portfolio with the lowest costs were employed, it was also ensured that the GEP met constraints such as transmission infrastructure investments, GHG reduction, and estimated hourly load values. As the conclusion of the study, even if the wind and PV solar capacity is in the optimum locations, it was demonstrated that the total cost of 100% RES would be at least 30% higher than another energy resources portfolio including low-energy consumption.
Thang and Hien [52] presented a 10-year planning framework via MILP for an assessment of the productivity of a micro grid connection of RES in the optimum micro networks. In the analysis of the model, the GAMS programming language was used. The objective was to minimize the life-cycle cost of the system, which is comprised of the investment and operating costs of RES, the energy purchased from the electricity network, emission tax costs, and equipment renewal costs or residual value. The load uncertainties, electrical prices, wind speed, and solar radiation were considered, and subsequently, a combinable model was developed to group these. Lastly, in order to verify the efficiency of the suggested model, and to demonstrate the efficiency of the RES that will be implemented to the practical micro-grid, simulations were applied for a micro grid connected to the test network. Within the framework of the multi-scenario planning suggested with the objective function and constraints, the duration of the installed RES was optimally determined as well as the optimal numbers of the modules, their nominal power and technologies. RES enlargement in the micro grid system proved to be important in reducing both the LCOE and emission. Additionally, in case of a power cut in the system, the microgrid reliability was also developed since RES loads energy into the system as an auxiliary power.
In another study conducted by Handayani et al. [53], the 2025 and 2050 RE visions of Indonesia were considered and the long-term capacity enlargement in the Java–Bali region electric system was analyzed. Technological learning, electric energy production diversity, electric prices, and CO2 reduction impacts were included into the analysis within the framework of enlargement of RES utility in the electric energy production. Integrating the technological learning processes to the LEAP software programs, which ensures the simulation and optimization of the energy systems, the analysis was shaped for the models developed within the scenarios. The results of the analysis demonstrated that the total costs of the electricity generation for the long term RE target within the medium and high technological learning speeds were 4–10% less compared to the scenarios that disregarded the technological learning. Moreover, the RE targets scenario was the option with the least cost, and it provided 25% more CO2 reduction compared to the CO2 targeting scenarios.
A research study conducted by Aghahosseini et al. [54] attempted to provide an optimization of the LCOE prices for 100% RES based on various scenarios, as well as an evaluation of the advantages of an interconnecting energy system for the USA. In all the scenarios considered, it was demonstrated in the results of the optimization that the existing RE (predominantly wind and solar energy) was sufficient to meet the complete electricity demand of the USA for the year 2030. It was determined that 100% RES would create an energy system that is cost-effective and reliable with the widespread use of the wind and solar energy resources in the USA through a transmission network and within the framework of the energy storage system.
In the RES optimization literature, the studies attempted to gain originality through various modifications such as model structure diversification with objective function and constraints, changing the region that the model was applied to, and changing the solution method. In our study, for the reduction of current deficit based-on the relations of balance of payments, the originality of the RE energy investment optimization was ensured through constraints such as technology transfer, ensuring external economic balance, and capital need for the investments.

3. Materials and Methods

The performance criterion (objective function) for the system in the optimization problems is defined as z = f (x) and it is aimed by the decision variables to find the x values that will maximize this criterion. Our objective function is to determine the annual wind and PV solar energy investments, which is defined in the model as “x”, that will highly contribute to reduction of current deficit clearly between 2019–2030.
The objective function logic of the model concerning the wind and PV solar investment planning of 2019–2030 to reduce the current deficit in Turkey is given in Figure 1. The model was developed based on the installation of 1 GW wind and PV solar energy as the decision variables.
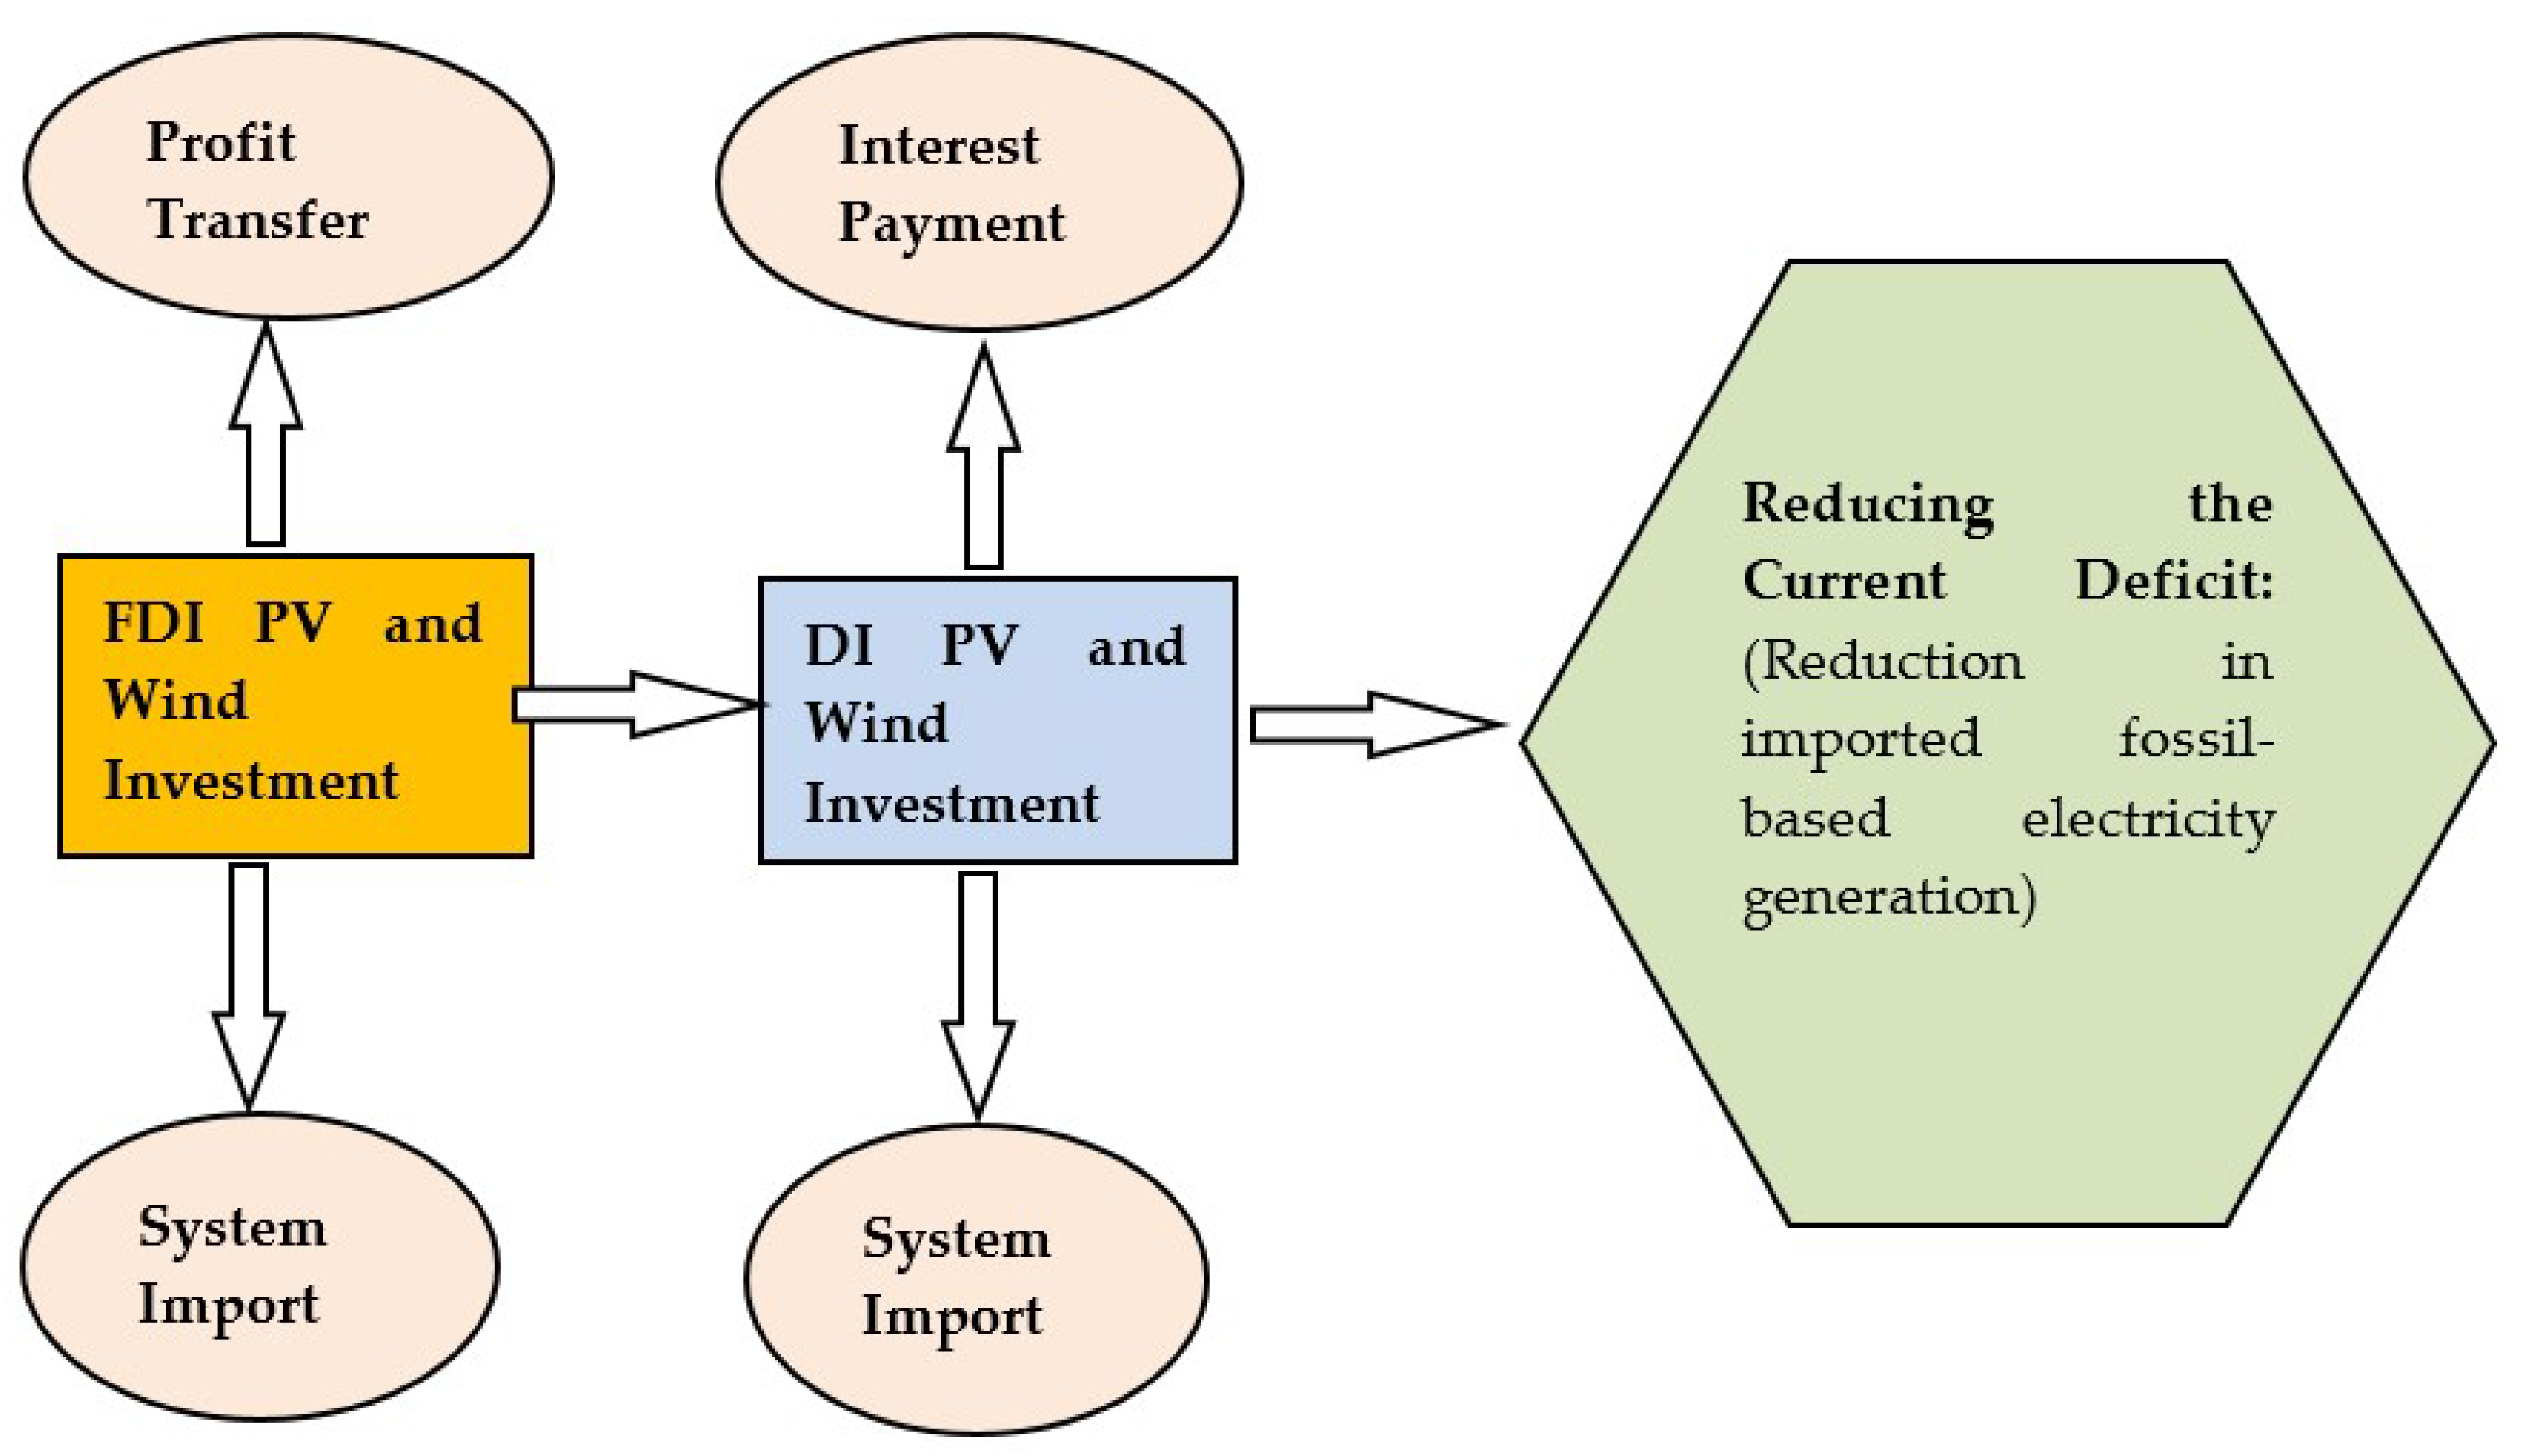
  • Xi1: FDI PV installation in the i. year, Xi2: domestic investments (DI) PV installation in the i. year
  • Xi3: FDI wind installation in the i. year, Xi4: DI wind installation in the i. year
In the model, electric power production will be employed through wind and PV solar energy investments; thus, energy import will be decreased, and net contribution maximization will be applied to the current deficit of Turkey. For this purpose, the model variables (wind and PV solar energy investments) should meet the constraints since the resources are limited. These constraints are a balance of payment, wind and PV solar targets of the ministry of energy, energy load capacity, 2030 carbon emission reduction target, FDI annual inflow, meeting the electric power production increase, import-based electricity generation capacity, infrastructure, and wind and solar energy total potential capacity.
The coefficients calculated according to the objective functions of the model and based on the resources about the constraint equities are given in Table 1.
In the minimization models with linear programming, the lower the variable coefficients of the objective function, the maximum benefiting solutions the algorithms will create from these resources (such as wind and PV LCOE prices) [32]. The literature is generally comprised of optimization models aiming at energy resource distribution that will meet the energy needs of the countries with minimum costs. As is seen from the data, although the objective function of the optimization models is not to minimize the LCOE since the wind and PV solar energy prices are lower than the LCOE prices of other resources, within the scope of the maximum RES enlargement objective of the model, it will produce values close to the optimum LCOE price. However, it should be naturally under the conditions that there are constraints such as energy load balance, intermittent energy, and uninterrupted energy mixture.

3.1. Objective Function

While forming the objective function of the optimization model, the relation is based between the records and accounts of Turkey’s balance of payments. Thus, the annual investment plans to be created will produce the optimum result that will not unbalance the existing current deficit. To explain the mathematical model below, while the wind and solar energy investments decrease the current deficit by being used instead of the imported fossil-based electricity generation for the 25-year period, the import of the RE systems in the year of investment, the FDI profit transfer during the operating period, and the interest repayments of DI investments increases the current deficit. In the maximization of the objective, the maximization is ensured concerning the reduction of foreign currency amount paid for the imported, fossil-based electricity generation through the RE-based investments of Turkey in the 2019–2030 period. The investment period was accepted as 2019–2030 in the objective function since the official data in the model parameters of Turkey predicated on the year 2030. The model was shaped according to the 25-year useful life of the wind and PV investments [61].
That both wind and solar energy investments are within the context of DI will provide higher contribution in total to the current deficit reduction. However, in a study on the currency crisis (balance of payments crisis) conducted by Frankel and Rose [62], it was empirically demonstrated that the foreign currency inflowing from abroad for the FDI investments finance the current deficit and it is a more appropriate choice for the currency crises compared to the portfolio investments (hot money) and other investments (credits). Additionally, it was reported that the most important determinants of the transnational technology overspill effects were the FDI’s [63,64]. This fact demonstrated that the FDI investments were the required variables of the objective function of the model. Considering the data of the previous periods in Turkey, it was calculated that the FDI profit transfers were, annually, 7% of the total investments [39]. Another important point was that the contribution of the wind energy investments to the reduction of current deficit was higher compared to that of the PV solar energy. However, some other requirements were also included into the objective function such as “electric load balance” due to the decreasing electrical efficiency of the seasonal and daily wind energy, and “PV solar investments” since the wind energy potential of Turkey is lower compared to the PV solar energy.
It was demonstrated that 1 GW investment of PV solar energy provides a current deficit reduction annually ranging between 120–210 million dollars, on average 170 million dollars [39]. In line with the same calculation, the wind energy provides a reduction in imported energy annually costing between 188–328 million dollars which is, on average, 270 million dollars. These differences emerge from the price fluctuations of the imported energy resources, capacity changes of the energy power plants, and annual seasonal differences of the electricity generation. This is the objective function Equation (1) according to the above explanations:
Energies 13 01509 i001
Z = (Reduction in the fossil-based import owing to the electricity generated through 1 GW PV and wind energy) – (annual FDI profit transfer for investments of 1 GW) – (annual instalment of the credit used for DI investments of 1 GW).
Making agreements with a purchase guarantee in the electricity investments of the private sector, Turkey binds the investments to be made by the FDIs and DIs to the contracts of concession within the context of Public Private Partnership (PPP). It was reported that the energy investments within the context of PPP are contracts with an electricity purchasing guarantee in foreign currency, and in this regard, credits were used in foreign currency for the 75% of the project cost with an annual average of 6% interest [39] (p. 875). While calculating the annual interest and principal repayment, the parameters for 10 years, 6% interest rate, and the credit for the 75% of the total cost were taken into consideration.
For the investment period, since the wind and PV system import is included in the current balance constraint (the condition that it should be positive for each investment year) of the model, it is not included into the objective function.

3.2. Constraints

After developing the objective function of the model, the resource constraints were determined that would be the maximum value of this objective function. Intervariable relations and coefficients of these resource constraints are given in Table 1. As per some of the right side coefficients, they were used in the GAMS model after providing references. Thus, it was mathematically explained which variable values that comprise the objective function should meet the conditions. The constraints developed in this regard are as follows.
Current Deficit Balance Constraint: For an economy, being unable to balance the current deficit with financial account causes currency crises in the country [65]. The currency crises might not only trigger other financial and public crises, but also might cause cumulative 5–7% shrinkage in the GDPs of the economies [66] (p. 79). And this, in turn, causes shrinkage in the economy by decreasing the electricity demand which is the two-way determinant of the growth [67]. Therefore, it is obvious and necessary that the annual cash flows of the wind and PV solar energy investments in context of FDI and DI should be designed so as to protect the external balance of the Turkish economy. This constraint ensures that the investment (foreign currency) amount that inflows in a year from outside world for the FDI wind and PV solar investments to Turkey should be equal or higher than the capital that outflows from the Turkish economy in a year due to the import needed for the total investments in that year. This is because if this constraint does not exist, all investments in the model will be directed towards the DI since the coefficient of the DI investments in the objective function is higher compared to that of the FDI. This direction in real life has some disadvantages; firstly, the foreign currency needs in Turkey will be provided only through credits, which will make it difficult to find sufficient and cost efficient foreign capital. Second, within the context of the DIs, the 75% of the project cost will inflow to the country in the balance of payments; however, almost all this amount will outflow as the cost of the imported system. Thus, the repayments of the credits will start in a short period, around 10 years, and it will take a long time to have the expected impact to reduce the current deficit. Lastly, the RE technology overspill effect that would be provided by the FDI will be unsuccessful. For economics, the FDI investments are accepted as the keys for the local economies to ensure technology overspill effect from the outside world [63,64]. Owing to the FDI technology overspill effect, the Ministry of Energy and Natural Resources (MENR) explicitly included into the contracts of the 1 GW wind and PV solar PPA auctions that the wind and PV solar energy system producers are participating in the auction as FDI and that the production should be employed domestically at a certain rate. Thus, the FDIs support the wind and solar PV panel production technology transfer to our country and their production in Turkey.
This constraint is stated annually as “(FDI capital inflow to the country for RE investments)- (total RE system import cost outflow from this capital) ≥ (capital outflow as the import price of RE investments as a part of DI)”
( 0.3 x i 1 + 0.48 x i 3 ) ( 0.7 x i 2 + 0.72 x i 4 ) 0 i = 1 , 2 , 3 , 4
MENR included in the contracts of the 1 GW wind and PV solar PPA auctions that the wind and PV solar energy system production should be employed domestically at a certain rate. In this regard, the current account balance coefficients are changed based on the anticipation that the adequacy rates of the domestic wind and PV solar energy systems will change as of 2023 in these auctions.
( 0.7 x i 1 + 0.78 x i 3 ) ( 0.3 x i 2 + 0.42 x i 4 ) 0   i = 5 , 6 , 7 , 12
This constraint helps the current deficit to gradually decrease by repeating each year.
FDI Inflow Constraint: Scarce capital is accepted as the most important production factor for realization of the tenders. The investments are classified as FDI and DI in the 2019–2030 wind and PV solar investment planning model. However, the investment conditions of the DIs were formed on the FDI-dependency condition through the Equations (2) and (3). Nevertheless, the capital inflow of the economy, as is stated in its classical definition, is obviously going to be at a higher value in terms of FDI. This value for the Turkish economy in a 12-year (2006–2017) period was around 10 billion dollars on average [13].
1 x i 1 + 1.2 x i 3 10           i = 1 , 2 , 3 , 12                            
An investment of wind and PV worth maximum of 10 billion dollars can be made for each “i” year in terms of FDI.
MENR Wind and PV Installed Power Target and Potential Constraint: Through this constraint, it was aimed at preventing the wind and PV solar investments in the 2019–2030 period from falling behind the wind (WTi) and PV solar (PVTi) energy investment targets determined in line with the Turkey RE investment strategy targets [57]. As per net investment targets, they are repeated each year by deducting the capacity before the planning period from the target capacity.
i = 1 n ( x i 1 + x i 2 ) N e t P V T i ,                       i = 1 n ( x i 3 + x i 4 ) N e t W T i i = 1 , 2 , 3 , 12    
Additionally, the prevention of exceeding the potential of Turkey in usable wind (WP) and PV solar (PVP) is ensured through the following constraint.
The constraint of Turkey total potential capacity in PV solar and wind energy investment;
i = 1 n ( x i 1 + x i 2 ) P V P ,                 i = 1 n ( x i 3 + x i 4 ) W P i = 1 , 2 , 3 ,   12    
Import-Based Electricity Generation (IBEG) constraint: a low electricity demand estimation projection was developed by the MENR for the 2018–2030 period in Turkey [68]. Using this data estimate, the estimated import-based electricity generation values (IBEG) was calculated based on the past data for the 2019–2030 period.
i = 1 n ( 1.6 x i 1 + 1.6 x i 2 + 2.5 x i 3 + 2.5 x i 4 ) I B E G i           i = 1 , 2 , 3 , 12
Equation (7) guarantees that the electric power produced through total wind and PV solar energy investments will not exceed the import-based energy generation (IBEG) needs during the planning phase. In other words, while RE investments replace the fossil resources, a balance is established between non import-based electricity generation and enlarged RE electricity generation.
Load balance and infrastructure constraint of wind and PV solar energy electricity generation: a balanced distribution of wind and PV solar energy investments in the 12-year period is necessary in order to ensure both the electricity load balance and the renewal of transmission infrastructure through new investments extending to years. Therefore, that wind and PV solar energy resources and electricity generation build the capacity together provides a cost-efficiency advantage. Moreover, the wind speed is low particularly in the summer month, when the sunlight is at its most powerful. In the winter months, when there is less solar energy, the speed of wind is high. Efficient energy generation in the wind and solar energy systems varies in different periods of the day and year [69]. Therefore, it is vital for a real investment plan to include a constraint that will balance the wind and PV solar energy generation values.
Concerning the load-balance constraint, intra-day, 24-h energy generation estimation values were calculated based on the 2012 hourly energy generation real data set, which was obtained from four power plants installed in Turkey. By analyzing the wind in a day according to the data (24-h data), it was determined that the wind electricity generation value decreased by approximately 25% between 10 am–3 pm [70]. Therefore, for a balanced electricity supply, a condition was added into the constraint requiring that the cumulative PV solar energy generation capacity should not be lower than 25% of the cumulative wind energy generation capacity.
i = 1 n 0.25 ( 2.5 x i 3 + 2.5 x i 4 ) i = 1 n ( 1.6 x i 1 + 1.6 x i 2 ) , i = 1 , 2 , 3 , 12
Moreover, concerning the Equation (8), since the PV solar energy can only be produced in the sunlight, the PV solar energy capacity should be limited as well. An important objective of this constraint is to keep the level of the PV solar investments inactive.
i = 1 n ( 1.6 x i 1 + 1.6 x i 2 ) 0.3 ( A E D i )                                           i = 1 , 2 , 3 , 12
Since the solar energy is only produced in the daytime, a constraint was determined that it should not exceed 30% of the annual electricity demand (AED) in total (considering the average 7.5 h in a 24-h day).
Another constraint is that the wind and PV solar energy investments should be extended to years in a balanced way for spreading over years the electricity transmission infrastructure needs and for restoring the transmission lines. This necessitates that the annual wind and PV solar energy investments should not exceed the 10% capacity, which is the maximum production increase in the 2006–2017 period.
( 1.6 x i 1 + 1.6 x i 2 + 2.5 x i 3 + 2.5 x i 4 ) 0.1 ( A E D i )                             i = 1 , 2 , 3 , 12    
The Constraint Meeting the Estimated Import-Based Electricity Demand Increases (EIBEDI) through wind and PV solar energy investments: this is the constraint determined by the MENR about meeting the estimated import-based electricity demand increases between the years 2019–2030 at least through the wind and PV solar energy investments. In other words, it provides a gradual transition to use of wind and solar energy investments instead of fossil-based electricity generation in the coming years.
( 1.6 x i 1 + 1.6 x i 2 + 2.5 x i 3 + 2.5 x i 3 ) E I B E D I i                 i = 1 , 2 , 3 ,   ...12
The data here guarantee that the estimated electricity demand increase in the 2018–2030 of MENR will be met from the wind and PV solar energy electricity annual production capacity of that year.
Carbon emission reduction target constraint: within the framework of the Paris Accord, of which Turkey is also a party, a commitment was made for the prevention of 246 million tonnes of GHG emission until the year 2030. It was reported that 27% of GHG in Turkey was emerging from electricity generation [71]. It is understood from the data that the commitment for the year 2030 is 246 million tonnes in accordance with the GHG reduction stated in the contract, and that 27% of this amount (66.42 million tonnes) is emerging from electricity generation. Considering the fact that, for the 2006–2017 period, the proportion of imported fossil energy to the total electricity generation was 60% on average, it is necessary to reduce an amount of 39.852 (∼ 40) million tonnes of fossil-based electricity generation by the year 2030.
i = 1 n ( 0.8 x i 1 + 0.8 x i 2 + 1.25 x i 3 + 1.25 x i 4 ) 40                             i = 1 , 2 , 3 , 12    
The natural gas carbon emission factor for Turkey was accepted as 499 tonnes/GWh [59]. Based on this figure, it was calculated as 1.25 million tonnes for 1 GW wind energy, and 0.8 million tonnes for the same amount of PV solar energy. In this regard, it is necessary to reach the 2030 targets by replacing the wind and PV solar energy investments with the electricity to be produced through natural gas.
Constraint of being positive: this is the maximum income that will be obtained by closing the current deficit between 2019 and 2030 through decision variables. Therefore, it is necessary for the wind and PV solar energy investments to be non-negative.
x i 1 , x i 2 , x i 3 , x i 4 0       X   ϵ   R n    

3.3. Assumptions and Limitation of the Model

It is inevitable to develop some assumptions for converting the pieces of information from different specialties in economics such as balance of payments, wind and solar energy electricity generation, and GHG reduction into mathematical statements. These assumptions:
  • Concerning the wind and PV solar energy, there will be no change in parameters such as annual productivity loss, technological enhancements in the future, reductions in the cost, and seasonal production increases/decreases;
  • In the next 12 years, the dollar-based increases and decreases of the imported resources, which influence the current deficit, will be the same with that of the last 12 years;
  • For the political stabilization, there will be no constraint preventing the FDIs;
  • The estimated energy demand increases are going to take place as estimated; and
  • The necessary infrastructure investments for the wind and PV solar energy will be employed by the MENR.
In addition to these assumptions of our model, the limitations are: firstly, wind energy and solar energy sources are intermittent energy sources. However, maximum and minimum intra-day electricity demands must be met continuously and reliably. In order to meet this demand with intense RE source, either a substitute fossil-sourced production capacity or an RE energy storage system can be added to the model. Although the Equations (8)–(10) in our model are intended to balance this disadvantage, fluctuations in electrical production from wind and solar power due to climatic reasons can interrupt the reliability of the electrical system and meeting the highest intra-day electricity demand. Secondly, imported fossil-sourced power generation plants can be installed in the most suitable place for electrical transmission infrastructure; on the other hand, for wind and solar power, additional transmission infrastructure investments are required. Regarding this limitation of our model, it is evaluated that, based on the price reduction in the PV LCOE by 73% in the 2010–2017 [61] period and the PPA auction price reduction from $85/MWh in 2012 to $35/MWh in 2020 due to wind energy, this extra infrastructure cost can be balanced for future periods. Thirdly, due to the fact that FDI RE investments are not implemented at the desired level due to global economic risks, the occurrence of the disruptions in the transfer of RE technology is another limitation of the model. The final limitation of the model is the presence of uncertainties in the politic and economic conditions to meet the need for large physical space required for the RE investments. Despite all these limitations, the results of our model are thought to be feasible and realistic considering the contributions of our model such as RE, which is an infinite and clean energy source, to reducing environmental pollution, ensuring external economic balance, creating a new employment and production sector through the transfer of FDI technology within the scope of the internal economic balance, and increasing competition in international trade due to the decreases in electricity prices.

4. Results and Discussion

In our model, the objective function and constraint equities are linear. The model was developed through the GAMS (Fairfax, VA, USA) software and analyzed in this program. The developed LP model was analyzed through the GAMS 24.7.4 modeling language. The objective function was analyzed in 0.18 sec through the model CPLEX solver, which was comprised of 98 constraints and 48 variables. In the results, as summarized in Table 2, the optimum value of the objective function was determined at 124.365 GW installed power and 131.673 billion dollars’ worth investment concerning wind and PV solar energy in the next 12 years.
According to the results, through their useful life of 25 years, the RE investments provide a net 466.422 billion dollars’ worth of reduction in the current deficit based on electricity generation. Within the limits of the model constraints, by installing a total of 36.541 GW wind capacity (wind FDI 5.092 GW and wind DI 31.449 GW) the 48 GW capacity of Turkey is completely used. As per the PV solar energy investments, an installed power capacity of 87.824 GW was reached in total (40.208 GW of the installed power with the PV FDI and 47.616 GW with the PV DI). The total 12-year PV investments meet 35% of the total solar energy potential of Turkey, which is 254 GW.
The prices emerged in the 2017 wind and PV solar PPA auctions demonstrated that wind and PV solar energy are the most economical energy resources. Considering the potential of Turkey in wind and PV solar energy, it was determined that benefiting more from wind and solar energy is a solution also in reduction of current deficit. Examining the energy balance tables of the Directorate General of Energy Affairs (DGEA) concerning the years 2006–2017, it was determined that an average 30% (annual 13 billion dollars in average) of the imported energy, as the cost, was used for electricity generation. With the analysis of the developed model, wind and PV solar investment plans of Turkey concerning the years 2019–2030 are demonstrated in Table 3. Through the model, it is anticipated that the current deficit will decrease by 18.65 billion dollars as of the year 2030.
Concerning the reduction of current deficit, which is the basic objective of the study, a 120.933 billion-dollar reduction of imported fossil resources and a net reduction of 85.885 billion dollars in the current deficit will be accomplished at the end of the 12-year period. In the same period, a foreign currency outflow of 35.048 billion dollars will take place concerning the capital and interest payments for the FDI profit transfer and DIs.
As of the year 2030, Turkey will produce 231.871 TWh energy through wind and PV solar energy investments; in other words, it will meet 80% of its estimated 289.650 TWh import-based electricity generation. Moreover, as of the year 2030, concerning the carbon emission reduction only in that particular year, a reduction in carbon emission will be achieved in Turkey equivalent to 99.442 million tonnes GWh natural gas through electricity generation, with wind and PV solar energy instead of fossil-based electricity generation.
GAMS solution sensitivity analysis of the model: the current deficit balance constraint is included in the model solution as a scarce resource (the marginal value is −0.9). In order to amplify this constraint, increasing the domestic production rates of the RE systems will enhance the objective function. Otherwise, the amplification of this constraint will cause the external economic balance to deteriorate. Another constraint as a scarce resource is the wind energy potential, and it was determined that this entire resource was used. In order to improve the objective function dependent on this constraint, it is considered that parameters such as solar energy storage system, the use of RE resources like geothermal and hydroelectric power, substitute fossil-sourced electricity generation capacity can be added to the model. The marginal values of all other constraints have been calculated as 0, so they will not make any improvement to the objective function. The $10 billion annual FDI investment constraint is not fully used (the highest annual cost $8.515 billion) but still appears to be the right constraint for economic risks. In addition, if the technology transfer planned to be employed through investments within the FDI is realized, an increase in RE investments is foreseen within context of DI, starting from the envisaged date of 2023. This indicates that technology transfer is an important constraint in terms of external economic balance. The objective function coefficients are determined by the annual average of solar and wind energy electricity generation, interest rates, and FDI profit transfers. The change in these coefficients can improve the objective function, but the improvement in coefficients will be dependent on technological progress and domestic economic developments.

5. Conclusions

As the conclusion, it was determined that 60% of the total electricity generation was provided from fossil resources between 2006 and 2017 in the model, and as the conclusion of our study, 80% of this import-based electricity will be met from wind and PV solar energy investments by the year 2030. Additionally, it was demonstrated that the wind and PV solar power plants, which met 12% of the total electricity generation in Turkey in the end of 2017, will meet 56% of the estimated total electricity demand of Turkey as of 2030. As for the current deficit of Turkey, it makes a net contribution of 466.422 billion dollars in the 25-year period. Moreover, this ensures a carbon emission reduction equivalent to 99.442 million tonnes GWh natural gas.
It was concluded that the current deficit/GDP proportion, which was 5.22% in the 2006–2017 period, will be reduced to 4% level as of late 2030. It was also determined that reducing the rate of import of the wind and PV solar energy systems was an important factor in providing the sustainability of wind and PV solar energy investments. These results demonstrated that wind and PV solar energy is an opportunity for Turkey, which has problems such as current deficit, air pollution, and insufficiency in RE technologies.
As the literature results of the study, an optimization model was developed and analyzed, which can be a reference for developing RE investment plans in countries with problems such as energy-based current deficit, fossil-based environmental pollution, and RE technologies insufficiency. Although the parameters of this developed model can differ for each different country, the development logic of the model will be a guide.
For further studies, the complexity of the existing linear model can be increased by adding some constraints and parameters such as import rate constraint of the energy investment equipment in terms of current deficit, own capital rates of the investors, cost enhancements in the PV technologies (learning curves), other RES, seasonal fluctuations of the energy resources, and their contribution to economic growth. With the increase in its complexity, it is possible that the analysis method of the model will possibly change.

Author Contributions

Conceptualization, S.Y.S. and N.Y.; methodology, M.A., S.Y.S. and N.Y.; software, T.Y.; validation, N.Y., T.Y.; formal analysis, S.Y.S., M.A. and T.Y.; investigation, S.Y.S, M.A. and T.Y.; data curation, T.Y.; writing—original draft preparation, S.Y.S., N.Y., M.A. and T.Y; writing—review and editing, S.Y.S., N.Y., M.A. and T.Y.; project administration, S.Y.S. All authors have read and agreed to the published version of the manuscript.

Funding

This research was funded by Karamanoğlu Mehmetbey University Scient14ific Research Projects, grant number 16-M-17.

Acknowledgments

This study was financially supported by Karamanoğlu Mehmetbey University Scientific Research Projects (16-M-17).

Conflicts of Interest

The authors declare no conflict of interest. The funders had no role in the design of the study; in the collection, analyses, or interpretation of data; in the writing of the manuscript, or in the decision to publish the results.

Nomenclature

Selected abbreviations
SymbolExplanation
RES Renewable Energy Sources
WWind
PVPhotovoltaic
FDIForeign Direct Investments
DIDomestic Investments
LCOELevelized Cost of Electricity
PPAPower Purchase Agreement
GHGGreenhouse Gas
MENRMinistry of Energy and Natural Resources
TCMBEVDSCentral Bank of the Republic of Turkey the Electronic Data Delivery System
TÜİKTurkish Statistical Institute
EİGMDirectorate General of Energy Affairs
TEİAŞTurkish Electricity Transmission Corporation
TETAŞTurkey Electric Trading and Contracting Corporation
Variables/Right Side Constants
SymbolUnitEquationExplanation
Xi1GW, Billion $, Twh, tonnes/GWhObjective function and all ConstraintsFDI PV installation in the i. year
Xi2DI PV installation in the i. year
Xi3FDI wind installation in thei. year,
Xi4DI wind installation in the i. year
Net PVTiGW(5)Each “i” year in terms of Net PV Installed Power Target Capacity
Net WTiGW(5)Each “i” year in terms of Net Windy Installed Power Target Capacity
PPVTGW(6)Turkey total potential capacity in PV solar energy
PWTGW(6)Turkey total potential capacity in Wind energy
IBEGTWh(7)Import-Based Electricity Generation
AEDTWh(9), (10)Annual electricity demand
EIBEDITWh(11)Estimated Import-Based Electricity Demand Increases

References

  1. Dornbusch, R.; Stanley, F. Macroeconomics; McGraw-Hill International Editions: Chicago, IL, USA, 1990. [Google Scholar]
  2. Freund, C.L. Spaghetti Regionalism; Board of Governors of the Federal Reserve System: Washington, DC, USA, 2000. [Google Scholar]
  3. Bussiere, M.; Marcel, F. Towards a New Early Warning System of Financial Crise; European Central Bank: Frankfurt, Germany, 2002. [Google Scholar]
  4. Labonte, M. Is the U.S. Current Account Deficit Sustainable? Congressional Research Service: Washington, DC, USA, 2010. [Google Scholar]
  5. Swenson, L.D.; Wing, T.W. The Politics and Economics of the U.S.-China Trade War. Asian Econ. Pap. 2019, 18, 1–28. [Google Scholar] [CrossRef]
  6. Guo, M.; Lin, L.; Liugang, S.; Miaojie, Y. The Day After Tomorrow: Evaluating the Burden of Trump’s Trade. Asian Econ. Pap. 2018, 17, 101–120. [Google Scholar] [CrossRef]
  7. Liu, G.M. ‘The apostle of free trade’: Adam Smith and the nineteenth-century American trade debates. Hist. Eur. Ideas 2018, 44, 210–213. [Google Scholar] [CrossRef]
  8. Crucini, M.J.; Kahn, J. Tariffs and aggregate economic activity: Lessons from the Great Depression. J. Monet. Econ. 1996, 38, 427–467. [Google Scholar] [CrossRef]
  9. Li, C.; Chuantian, H.; Chuangwei, L. Economic Impacts of the Possible China–US Trade War. Emerg. Mark. Financ. Trade 2018, 54, 1557–1577. [Google Scholar] [CrossRef]
  10. Bucevska, V. Currency Crises in EU Candidate Countries: An Early Warning System Approach. Panoeconomicu 2015, 62, 493–510. [Google Scholar] [CrossRef]
  11. Chernyak, O.; Vasyl, K.; Yevgen, C. The Main Triggers of the Balance of Payment Crisis in the Eastern Europe. Procedia Technol. 2013, 8, 47–50. [Google Scholar] [CrossRef] [Green Version]
  12. Licchetta, M. Common Determinants of Currency Crises: Role of External Balance Sheet Variables; Bank of England: London, UK, 2009. [Google Scholar]
  13. Türkiye Cumhuriyet Merkez Bankası Elektronik Veri Dağıtım Sistemi (TCMBEVDS). Available online: https://evds2.tcmb.gov.tr/ (accessed on 2 December 2018).
  14. Türkiye İstatistik Kurumu (TÜİK). Available online: http://www.tuik.gov.tr/PreTablo.do?alt_id=1108 (accessed on 19 February 2019).
  15. Enerji İşleri Genel Müdürlüğü (EİGM). Available online: http://www.eigm.gov.tr/tr-TR/Denge-Tablolari/Denge-Tablolari (accessed on 16 September 2016).
  16. Türkiye Elektrikİletim A.Ş. (TEİAŞ). Türkiye Elektrik Şebekesi Günlük Özet Raporu; Türkiye Elektrikİletim A.Ş. (TEİAŞ): Ankara, Turkey, 2018. [Google Scholar]
  17. Yokuş, T. Yayınlanmamış Yüksek Lisans Tezi. Enerji Kaynaklı Cari Açık: Güneş Enerjisi Yatrım Modeli İle Çözümü (2017–2030); Karamanoğlu Mehmetbey Üniversitesi Sosyal Bilimler Enstitüsü İktisat Anabilim Dalı, Temmuz: Karaman, Turkey, 2017. [Google Scholar]
  18. Türkiye Elektrik Ticaret ve Taahhüt A.Ş. (TETAŞ). 2017 Yılı Sektör Raporu; TETAŞ: Ankara, Turkey, 2018. [Google Scholar]
  19. Enerji ve Tabii Kaynaklar Bakanlığı (ETKB). Available online: http://www.enerji.gov.tr/tr-tr/bakanlik-haberleri/geste-1-milyar-dolari-asacak-yatirim-icin-ilk-adim (accessed on 10 September 2018).
  20. International Money Fund (IMF). Available online: https://www.imf.org/external/datamapper/NGDP_RPCH@WEO/OEMDC/ADVEC/WEOWORLD (accessed on 25 January 2019).
  21. Yanar, R.; Güldem, K. Türkiye’de Enerji Tüketimi, Ekonomik Büyüme Ve Cari Açık İlişkisi. Ekon. Bilimler Derg. 2011, 3, 191–201. [Google Scholar]
  22. Uysal, D.; Kubilay, Y.; Tener, T. Enerji İthalatı Cari Açık İlişkisi: Türkiye Örneği. Muş Alparslan Üniv. Sos. Bilimler Derg. 2015, 3, 63–78. [Google Scholar] [CrossRef] [Green Version]
  23. Soydal, H.; Zekeriya, M.; Murat, Ç. Makro Ekonomik Açıdan Türkiye’nin Alternatif Enerji İhtiyacının Önemi. Pamukkale Üniv. Sos. Bilimler Enst. Derg. 2012, 11, 117–137. [Google Scholar]
  24. Özsoy, C.E.; Ahmet, D. Türkiye’nin Fosil Enerji Kaynaklı Sorunlarına Düşük Karbonlu Bir Çözüm: Yeşil Ekonomi; EconWorld2016@ImperialCollege Proceedings: London, UK, 2016; pp. 1–15. [Google Scholar]
  25. Göçer, İ. Türkiye’de Cari Açığın Nedenleri, Finansman Kalitesi ve Sürdürülebilirliği: Ekonometrik Bir Analiz. Eskişehir Osman. İİBF Derg. 2013, 8, 213–242. [Google Scholar]
  26. Doğan, E. Türkiye’de Cari Açık Sorunun Yapısal Nedenleri ve Ekonomik Etkileri. Unpublished Master’s Thesis, Eskişehir Osmangazi Üniversitesi Sosyal Bilimler Enstitüsü İktisat Anabilim Dalı, Eskişehir, Turkey, 2014. [Google Scholar]
  27. Bayrak, M.; Ömer, E. Türkiye’nin Enerji Açığı Sorunu ve Çözümüne Yönelik Arayışlar. Atatürk Üniv. İktis. İdari Bilimler Derg. 2014, 28, 139–157. [Google Scholar]
  28. Karabulut, G.; Ayşe, Ç.D. Türkiye’de Cari İşlemler Açığının Büyümesini Etkileyen Faktörler. Gazi Üniv. İktis. İdari Bilimler Fak. Derg. 2006, 8, 47–63. [Google Scholar]
  29. Huntingto Hillard, G. Crude oil trade and current account deficits. Energy Econ. 2015, 50, 70–79. [Google Scholar] [CrossRef]
  30. Vaona, A. The effect of renewable energy generation on import demand. Renew. Energy 2016, 86, 354–359. [Google Scholar] [CrossRef]
  31. Van de Ven, D.J.; Roger, F. Historical Energy Price Shocks and Their Changing Effects on the Economy. Energy Econ. 2016, 62, 204–216. [Google Scholar] [CrossRef] [Green Version]
  32. Bixby, R.E. A brief history of linear and mixed-integer programming computation. Doc. Math. 2012, Extra Volume. 107–121. [Google Scholar]
  33. Taha, H.A. Operation Research: An Introduction; Pearson Education, Inc.: Hoboken, NJ, USA, 2007. [Google Scholar]
  34. Talbi, El-G. Metaheuristics: From Design to Implementation; John Wiley & Sons, Inc.: Hoboken, NJ, USA, 2009. [Google Scholar]
  35. Iqbal, M.; Azam, M.R.; Naeem, M.A.; Khwaja, S.; Anpalagan, A. Optimization classification, algorithms and tools for renewable energy: A review. Renew. Sustain. Energy Rev. 2014, 39, 640–654. [Google Scholar] [CrossRef]
  36. Müller, B.; Francesco, G.; Ludwig, H. Comprehensive representation of models for energy system analyses: Insights from the Energy Modelling Platform for Europe (EMP-E) 2017. Energy Strategy Rev. 2018, 21, 82–87. [Google Scholar] [CrossRef]
  37. Ringkjøb, H.K.; Peter, M.H.; Ida, M.S. A review of modelling tools for energy and electricity systems with large shares of variable renewables. Renew. Sustain. Energy Rev. 2018, 96, 440–459. [Google Scholar] [CrossRef]
  38. Kumbaroğlu, G.; Reinhard, M.; Mustafa, D. A real options evaluation model for the diffusion prospects of new renewable power generation technologies. Energy Econ. 2008, 30, 1882–1908. [Google Scholar] [CrossRef]
  39. Alagöz, M.; Yokuş, N.; Yokuş, T. Photovoltaic solar power plant investment optimization model for economic external balance: Model of Turkey. Energy Environ. 2018, 30, 522–541. [Google Scholar] [CrossRef]
  40. Dudhani, S.; Sinha, A.K.; Inamdar, S.S. Renewable energy sources for peak load demand management in India. Int. J. Electr. Power Energy Syst. 2006, 28, 396–400. [Google Scholar] [CrossRef]
  41. Iniyan, S.; Jebaraj, S.; Suganthi, L.; Anand, A.S. Energy Models for Renewable Energy Utilization and To Replace Fossil Fuels. Methodology 2006, 1–8. [Google Scholar]
  42. Rizzo, G.; Giancarlo, S. A Linear Programming model for the optimal assessment of Sustainable Energy Action Plans. In Proceedings of the ECOS 2012, Perugia, Italy, 26–29 June 2012. [Google Scholar]
  43. Mourmouris, J.C.; Potolias, C. A multi-criteria methodology for energy planning and developing renewable energy sources at a regional level: A case study Thassos, Greece. Energy Policy 2013, 52, 522–530. [Google Scholar] [CrossRef]
  44. Pereira, S.; Paula, F.; Vaz, A.I.F. Optimization modeling to support renewables integration in power systems. Renew. Sustain. Energy Rev. 2016, 55, 316–325. [Google Scholar] [CrossRef]
  45. Gulagi, A.; Dmitrii, B.; Mahdi, F.; Christian, B. Can Australia Power the Energy-Hungry Asia with Renewable Energy. Sustainability 2017, 9, 233. [Google Scholar] [CrossRef] [Green Version]
  46. Amrutha, A.A.; Balachandra, P.; Mathirajan, M. Model-based approach for planning renewable energy transition in a resource-constrained electricity system—A case study from India. Int. J. Energy Res. 2017, 42, 1023–1039. [Google Scholar] [CrossRef]
  47. Liu, H.; Gorm, B.A.; Martin, G. Cost-optimal design of a simplified highly renewable Chinese electricity network. Energy 2018, 147, 534–546. [Google Scholar] [CrossRef] [Green Version]
  48. Zhang, D.; Shujun, M.; Chan, C.C.; George, Y.Z. Optimization of Renewable energy penetration in Regional Energy System. Energy Procedia 2018, 152, 922–927. [Google Scholar] [CrossRef]
  49. Chen, S.; Zheng, G.; Pei, L.; Zheng, L. Advances in clean and low-carbon power generation planning. Comput. Chem. Eng. 2018, 116, 296–305. [Google Scholar] [CrossRef]
  50. Henao, F.; Yeny, R.; Juan, P.V.; Isaac, D. Optimising the insertion of renewables in the Colombian power sector. Renew. Energy 2019, 132, 81–92. [Google Scholar] [CrossRef]
  51. Zappa, W.; Martin, J.; Machteld, V.D.B. Is a 100% renewable European power system feasible by 2050? Appl. Energy 2019, 233, 1027–1050. [Google Scholar] [CrossRef]
  52. Thang, V.V.; Hien, N.T. Evaluating efficiency of renewable energy sources in planning micro-grids considering uncertainties. J. Energy Syst. 2019, 3, 14–25. [Google Scholar] [CrossRef] [Green Version]
  53. Handayani, K.; Yoram, K.; Tatiana, F. From fossil fuels to renewables: Ananalysis of long-term scenarios considering technological learning. Energy Policy 2019, 127, 134–146. [Google Scholar] [CrossRef]
  54. Aghahosseini, A.; Dmitrii, B.; Larissa, S.N.S.B.; Christian, B. Analysing the feasibility of powering the Americas with renewable energy and inter-regional grid interconnections by 2030. Renew. Sustain. Energy Rev. 2019, 105, 187–205. [Google Scholar] [CrossRef]
  55. Alagöz, M. Cari Açık ve Enerji İthali İlişkisi: Güneş Enerjisi. In Proceedings of the 4th International Symposium on Development of KOP Region, Karaman, Turkey, 21–23 October 2016. [Google Scholar]
  56. Rüzgar Enerjisi ve Etkileşim Raporu; Türkiye Rüzgar Enerji Birliği (TREB): Ankara, Turkey, 2016.
  57. Türkiye Ulusal Yenilenebilir Enerji Eylem Planı; Yenilenebilir Enerji Genel Müdürlüğü (YEGM): Ankara, Turkey, 2014.
  58. Alagöz, M.; Yokuş, T. Kamu Özel İşbirliği Yatırımları ve Dış Borç Ödeme Projeksiyonu. Ank. Üniv. SBF Derg. 2018, 73, 867–889. [Google Scholar]
  59. Ekonomi Bakanlığı (EB). Available online: http://www.ekonomi.gov.tr/portal/faces/oracle/webcenter/portalapp/pages/content/docListViewer.jspx?folder=/Contribution%20Folders/web/Yat%C4%B1r%C4%B1m/%C4%B0statistikler%20ve%20Yay%C4%B1nlar/ekler/02.Yay%C4%B1nlar/&parentPage=yatirim&_afrLoop=85593528987 (accessed on 11 December 2017).
  60. Özcan, M.; Öztürk, S. Türkiye’nin Elektrik Enerjisi Üretimi Kaynaklı Sera Gazı Emisyonunda Beklenen Değişimler ve Karbon Vergisi Uygulaması. Available online: http://www.emo.org.tr/ekler/15ed8b43a250de0_ek.pdf (accessed on 20 December 2018).
  61. Fraunhofer Institute for Solar Energy Systems ISE (Fraunhofer ISE). Levelized Cost of Electricity Renewable Energy Technologies; Fraunhofer Institute for Solar Energy Systems ISE (Fraunhofer ISE): Freiburg, Germany, 2018. [Google Scholar]
  62. Frankel, J.A.; Rose, A.K. Currency Crashes Emerging Markets: Emprical Indicators; Working Paper; National Bureau of Economic Research: Cambridge, UK, 1996. [Google Scholar]
  63. Tour, A.D.; Glachant, M.; Meniere, Y. Innovation and international technology transfer: Thecaseof the Chinese photovoltaic industry. Energy Policy 2011, 39, 761–770. [Google Scholar] [CrossRef] [Green Version]
  64. Zhang, C.; Guo, B.; Jianke, W. The different impacts of home countries characteristics in FDI on Chinese. Econ. Model. 2014, 38, 572–580. [Google Scholar] [CrossRef]
  65. Nakatani, R. Real and financial shocks, exchange rate regimes and the probability of a currency crisis. J. Policy Model. 2018, 40, 60–73. [Google Scholar] [CrossRef] [Green Version]
  66. International Monetary Fund (IMF). World Economik Outlook; International Monetary Fund (IMF): Washington, DC, USA, 1999. [Google Scholar]
  67. Atems, B.; Hotaling, C. The effect of renewable and nonrenewable electricity generation on economic growth. Energy Policy 2018, 112, 111–118. [Google Scholar] [CrossRef]
  68. Enerji ve Tabi Kaynaklar Bakanlığı (ETKB). Mavi Kitap 2016; Enerji ve Tabi Kaynaklar Bakanlığı (ETKB): Ankara, Turkey, 2017. [Google Scholar]
  69. Çakmak, Ç.; Kurban, M.; Dokur, E. Hibrit Yenilenebilir Enerji Sistemlerinin Ekonomik Analizi. Available online: http://www.emo.org.tr/ekler/887f3eaeb0a7eff_ek.pdf (accessed on 15 September 2018).
  70. Yıldız, C.; ve Şekkeli, M. Türkiye gün öncesi elektrik piyasasında rüzgar enerjisi ve pompaj depolamalı hidroelektrik santral için optimum teklif oluşturulması. Pamukkale Üniv. Mühendis. Bilimleri Derg. 2016, 22, 361–366. [Google Scholar]
  71. Çevre Ve Şehircilik Bakanlığı (CSB). Available online: http://www.csb.gov.tr/db/iklim/editordosya/PMR_MBIs%20Calistayi_12052016.pdf (accessed on 19 September 2017).
Figure 1. Visual display of the optimization model. Source: Revised from the [55].
Energies 13 01509 g001
Table 1. Coefficients About the Objective Function and Constraints.
Coefficients of the Objective Function of Constraints the ModelCoefficientReference
1 GW Wind Investment Cost (Billion $)1.20[56]
1 GW PV Investment Cost (Billion $)1.00[39]
1 GW Wind Annual Electricity Generation (TWh)2.50[57]
1 GW PV Annual Electricity Generation (TWh)1.60[57]
1 GW Wind-Investment-Based Reduction in the Import for the Electricity Generation (Billion $)0.27[14,15,57] *
1 GW PV-Investment-Based Reduction in the Import for the Electricity Generation (Billion $)0.17
1 GW Annual Profit Transfer of the Wind FDI Investment (Billion $)0.084[13] *
1 GW Annual Profit Transfer of the PV FDI Investment (Billion $)0.070
1 GW Annual Credit Instalments of the Wind DI Investments (Interest: 6%, Payback Period: 10 Years, 75% of the Credit Investment Amount) (Billion $)0.100[39,58] *
1 GW Annual Credit Instalments of the PV DI Investments (Interest: 6%, Payback Period: 10 Years, 75% of the Credit Investment Amount) (Billion $)0.083
1 GW 60% Import Rate of the Wind Investment in the 2019–2022 Period (Billion $)0.720[59] *
1 GW 70% Import Rate of the PV Investment in the 2019–2022 Period (Billion $)0.700
1 GW 35% Import Rate of the Wind Investment in the 2023–2030 Period (Billion $)0.480[19] *
1 GW 30% Import Rate of the PV Investment in the 2023–2030 Period (Billion $)0.300
1 GW CO2 Reduction of the Wind Investment (tonne/GWh)0.8[60] *
1 GW CO2 Reduction of the PV Investment (tonne/GWh)1.25
* Calculated from the data obtained from the sources.
Table 2. Model Analysis Summary.
Objective Function Optimum Solution12-Year Capacity (GW)12-Year Investment Amount (Billion$)Current Deficit Reduction Based on 25-Year Net Electricity Generation (Billion$)
Total124.365131.673466.422
PV FDI40.20840.208100.520
PV DI47.61647.616161.894
Wind FDI5.0926.110423.169
Wind DI31.44937.7388180.832
Table 3. Turkey 2019–2030 solar and wind energy optimum investment plan.
YearsSolar (GW)Wind (GW)Impacts of Investment on Current Deficit (Billion $)
FDI
  ( x i 1 )
DIFDI
( x i 3 )
DI
( x i 4 )
Reduction in the Total Import-Based Electricity GenerationFDI Profit Transfer and DI Interest RepaymentsNet Reduction in Current Deficit
20191.000 1.2861.2740.8610.3050.556
20200.947 1.2181.2071.6770.5951.082
20210.984 1.2651.2542.5240.8951.629
20221.029 1.3231.3113.4101.2102.201
20233.961 6.6025.8662.1473.719
20246.89816.095 9.7752.6307.145
20251.497 2.49510.7032.9847.719
20261.502 2.50411.6353.3408.295
20271.512 2.52012.5723.6988.875
20287.369 12.28217.1415.44211.699
2029 *4.99411.652 19.9715.66414.307
2030 *8.51519.869 24.7966.13918.657
Total40.20847.6165.09231.449120.93335.04885.885
* Between the years 2029–2030, since the 10-year interest payments are completed for the DI investments in the years 2019 and 2020, respectively, the interest repayments are not included.

