Article

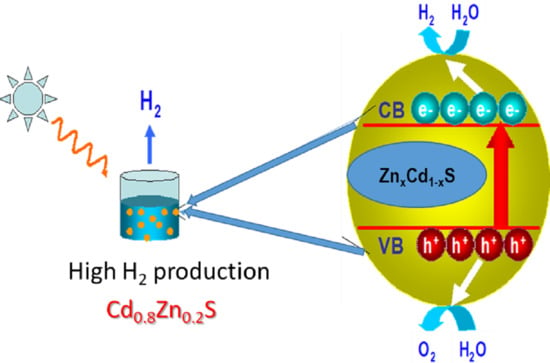
Structural, Optical and Photocatalytic Characterization of ZnxCd1−xS Solid Solutions Synthetized Using a Simple Ultrasonic Radiation Method

by
Luis Fernando Morelos Medina
1,
Rufino Nava
1,
María de los Ángeles Cuán Hernández
1,*,
Omar Said Yáñez Soria
1,
Bárbara Pawelec
2,
Rufino M. Navarro
2 and
Carlos Elías Ornelas Gutiérrez
3
1
División de Investigación y Posgrado, Facultad de Ingeniería y Facultad de Química, Universidad Autónoma de Querétaro (UAQ), Centro Universitario, Querétaro 76000, Mexico
2
Instituto de Catálisis y Petroleoquímica, CSIC, Cantoblanco, 28049 Madrid, Spain
3
Centro de Investigación en Materiales Avanzados, S.C., Cimav, Av. Miguel de Cervantes 120, Complejo Industrial Chihuahua, Chihuahua C.P. 31109, Mexico
*
Author to whom correspondence should be addressed.
Energies 2020, 13(21), 5603; https://doi.org/10.3390/en13215603
Submission received: 1 October 2020 / Revised: 20 October 2020 / Accepted: 21 October 2020 / Published: 26 October 2020
(This article belongs to the Collection Advanced Materials for Energy Conversion and Storage Devices)

Abstract

:
A simple ultrasonic radiation method was employed for the preparation of zinc and cadmium sulfide solid solution (ZnxCd1−xS; x = 0–0.25 wt.%) with the aim to investigate its efficiency for H2 production via a visible light-driven water-splitting reaction. The catalyst characterization by X-ray diffraction confirmed the formation of solid solution (ZnxCd1−xS) between CdS and ZnS phases. All catalysts exhibited hierarchical morphology (from SEM and TEM) formed by aggregated nanoparticles of ZnxCd1−xS solid solution with crystals showing mainly (111) planes of cubic CdS phase. The crystal size linearly decreased with an increase in Zn incorporation in the crystal lattice (from 4.37 nm to 3.72 nm). The ZnxCd1−xS photocatalysts showed a gradual increase in the H2 evolution, with an increase in the Zn concentration up to 0.2 wt.% making the most effective Zn0.2Cd0.8S catalyst toward H2 production. From the catalyst activity–structure correlation, it has been concluded that the twin-like CdS structure, the (111) plane and specific morphology are the main factors influencing the catalyst effectivity toward H2 production. All those factors compensated for the negative effect of an increase in band gap energy (Ebg) after ZnS incorporation into solid solution (from 2.21 eV to 2.34 eV). The effect of the catalyst morphology is discussed by comparing H2 evolution over unsupported and supported Zn0.2Cd0.8S solid solutions.

Graphical Abstract

1. Introduction

The new age of energy presents itself as a collection of alternative technologies to establish a world network of energy production by means of renewable sources [1]. Among these technologies, solar panels, wind turbines and biomass-based fuels are now technologies in use [2,3,4]. Nevertheless, in this nascent energy revolution, molecular hydrogen will play a main role in the transformation, transport and use of the renewable sources. It is known that this molecule can be produced from any renewable source and used as a fuel in thermal or electrochemical devices with higher efficiency than gasoline and other fossil fuels [5].
One method of producing hydrogen from water splitting is through electrolysis, however, the energy and monetary cost to electrically power the electrolysis system is greater than the energy obtained from burning hydrogen to generate electricity [6]. Likewise, the possibility of electrifying a system with these characteristics, by means of solar panels or some other renewable energy source, is not feasible, due to the poor conversion efficiencies and the high maintenance costs of the electrolysis cell [6].
The production of H2 from the photolysis of water is one of the current alternatives that are under development, as it is a simple and theoretically efficient way to produce hydrogen from the two most abundant resources on earth: water and solar energy. This process has been found to have an acceptable cost and low sustainable environmental impact. The photocatalytic production of hydrogen requires water and releases oxygen, while the use of hydrogen requires oxygen and releases water vapor; this means a cycle that, in principle, does not compromise the natural environment [7,8]. Since the discovery of the Honda–Fujishima [9] effect in 1972, photoelectric energy and photocatalysts have been applied to splitting water molecules and this process has been studied extensively throughout the world. Since then, many photocatalytic materials have been proposed (SrTiO3, CdS, BiVO4, ZnO, Ni2O3/Mn0.2Cd0.8S/Cu3P@Cu2S) [10,11,12,13,14], nevertheless, the feasibility for practical application has not yet been reached. Derived from the need and the current energy demand, it is necessary to develop photocatalysts with improved efficiency and a low cost of their synthesis.
Cadmium sulfide (CdS) is a direct-band n-type semiconductor material and is one of the most studied photocatalysts because of its efficiency to adsorb visible light (band gap energy of 2.4 eV) and the correct position of its energy states to produce the redox reactions involved in the production of hydrogen [15,16,17]. Numerous applications for CdS have been described in a variety of fields, such as pollutant degradation [18], solar cells [19,20], etc. It is known that the photocatalytic efficiency of the semiconductors is mainly defined by their structural (size, crystalline structure and morphology) and electronic characteristics (band gap energy (Ebg) and energy states distribution). In this sense, the semiconductor materials should be designed at nanoscale [9,10,11,12,13,14,15,16,17,18,19,20,21]. It is known that, according to the synthesis methods applied, the size, shape and morphology of the nanostructured materials can be manipulated and consequently the electronic properties can also be tuned based on the band gap engineering [2,10,11,22,23,24,25,26]. CdS can also improve its efficiency to absorb visible light by incorporating dopants into its crystalline structure as a way to modify the electronic structure, in order to enhance the photochemical processes to produce a larger amount of hydrogen per unit of time [10].
Contrary to the pure CdS, pure ZnS is non-active as photocatalyst upon visible light irradiation due to its very high band gap energy (3.21 eV) [25]. However, this situation is changed after ZnS incorporation into the crystalline network of ZnxCd1−xS solid solutions. It is generally recognized that this solid solution turns out to have better properties under visible light irradiation than its pure components [4,8,27,28]. Reported studies, in which ZnxCd1−xS solid solutions have been used [1,2,3,4], confirmed the versatility and advantages of their use as photocatalysts and emphasize the strong dependence of the photocatalytic properties on the surrounding environment. In general, the electronic properties of the nanostructures are different from bulk matter depending on their size and dimensionality. The 0, 1 and 2D nanostructures confine the electrons which dramatically impacts the density of states (DOS) distribution, generating specific electronic properties unique in semiconductor materials, such as photon absorption and emission with application in optical devices [10], variation in the concentration of electrons and holes [4,29,30] and variation of the band gap [31,32,33], among others, where CdS or ZnxCd1−xS solid solutions are an example [31,32,33,34,35,36,37,38,39,40].
Many synthetic approaches have been suggested for the preparation of group II–IV semiconductors. For example, CdS has been prepared by using different techniques such as electrodeposition [31,32], closed-space sublimation (CSS) [33], spray pyrolysis [35,36,37], screen printing, atomic layer epitaxy and Radio Frequency sputtering [34], including microwave-assisted synthesis in organic solvents [31,32,33,34,35,36,37,38]. Many of these methods require the use of toxic precursors or high temperatures which makes size control difficult. Recently, sonochemical synthesis has proven to be a useful method for generating novel materials with remarkably smaller size, which show novel physical properties [39,40]. Ultrasonic waves are intense enough to produce acoustic cavitation, which can drive chemical reactions such as oxidation, reduction, dissolution and decomposition. The formation, growth and implosive collapse of gas bubbles in a liquid result in a transient temperature as high as about 5000 K and a high pressure of about 1800 atm, followed by rapid cooling to bulk temperature, which makes the application of this method to the synthesis of CdS-based photocatalysts interesting.
Within this scenario, our objective in this work was to study the influence of the ultrasonic irradiation on the morphology and photo-optic properties of ZnxCd1−xS solid solutions. To the best of our knowledge, the preparation of ZnxCd1−xS solid solutions by the ultrasonic radiation method has not been reported to date. There are only two reports on the use this preparation method for the synthesis of CdS catalysts [41,42]. The catalysts were characterized by variety of techniques like X-ray diffraction (XRD), High-resolution transmission electron microscopy High-resolution transmission electron microscopy (HRTEM), Scanning Electron Microscopy (SEM), UV–Vis Diffuse Reflectance Spectroscopy (DRS) and Raman spectroscopy, whereas their photoeffectivity for H2 production was evaluated in the visible light-driven water-splitting reaction. The results are discussed in the context of those reported in the literature.

2. Experimental

2.1. Preparation of CdS and ZnxCd1−xS Solid Solutions

The CdS and ZnxCd1−xS solid solutions (x = 0, 0.05, 0.10, 0.15, 0.20 and 0.25 wt.% of Zn) were synthesized by coprecipitation assisted by ultrasonic radiation. This method of synthesis consists in the dissolution of the reagents in an aqueous (deionized water) medium. CdS and ZnxCd1−xS were prepared using Cd(CH3COO)2·2H2O and Zn(CH3COO)2·2H2O (Fluka, analytical grade) at room temperature using 3.3 g of Na2S·9H2O (analytical grade) as a precipitating agent. The quantity of each precursor was dissolved in 20 mL of water with constant stirring for 15 min at 40 °C. For the preparation of the photocatalysts, the C4H6O4Zn solution was added directly into the C4H6O4Cd solution, creating a homogeneous mixture. Then, the ultrasonic radiation was applied and the Na2S was added dropwise and slowly. A sonotrode was used with a frequency of 27 kHz and an intensity of 50%, then five applications of ultrasonic radiation were done in 90 s intervals. The solution was cooled for 5 min between each application to avoid overheating of the material. The same procedure was employed to obtain the pure CdS and the different ZnxCd1−xS solid solutions. Finally, the materials obtained were washed several times and dried. Subsequently, a thermal treatment was given for 18 h in a muffle at 80 °C, and the heating was slowly brought from room temperature to 80 °C.

2.2. Characterization Methods

The X-ray diffraction (XRD) patterns of the powdered samples were recorded using an Advance D8 diffractometer with a Cu Kα radiation (λ = 1.54060 Å). Volume-averaged crystallite sizes were determined by applying the Williamson–Hall method [43] because it turns out to be more accurate for compounds with low crystallinity. The surface morphology of the synthetized samples was investigated by scanning electron microscopy (SEM) using a JEOL JSM-6060 LV microscope. A micro-Raman spectrometer DRX II Thermo Scientific model was used, employing a light wavelength of 455 nm (blue laser) and a time exposure of 6 s, with an average of 16 samplings. The spectra were recorded at room temperature within the wavelength range of 50–3500 cm−1. The UV-Vis DR spectra in the 190–800 nm range of the samples were recorded at room temperature using an Ocean Optics Inc. spectrometer (Mini-DT2) provided with a diffuse reflectance accessory. The optical energy bandwidth of the different semiconductor CdS and ZnxCd1−xS systems were calculated using the Kubelka–Munk (K-M) function [44] and Tauc’s plot method [45,46,47] in which the linear part of the curve is extrapolated to find its intersection with the horizontal axis. A JEOL brand scanning electron microscope, model JSM-6390L, was used at 20 kV. The samples were coated with a thin layer of Au and then were treated in order to attach them to the metal cylindrical sample holder (copper, aluminum brass, etc.), which had been previously polished and cleaned. A high-resolution transmission electron microscope (HRTEM), model JEOL JEM-2200FS+Cs, was used to determine the phases of preferential crystalline growth of the samples, and the image analysis was performed using the discrete Fourier transform (DFT) identified by the X-ray diffraction technique. The structural analysis was performed from selected TEM areas to obtain the diffraction (SAD) patterns.

2.3. Photocatalytic Activity

The hydrogen production from aqueous solutions of Na2S and Na2SO3 over CdS and ZnxCd1−xS photocatalysts was measured under visible light irradiation in a closed quartz reaction cell designed for withdrawal of the gas samples at desired intervals. To minimize small UV emissions from the lamp, the photocatalysts were irradiated under visible light for 5 h with a 350 W Xe lamp equipped with a cutoff filter (l–420 nm). The powder samples (0.2 g) were kept in suspension under magnetic stirring in an aqueous solution (200 mL) containing 0.35 M Na2S + 0.25 M Na2SO3 as sacrificial reagents. These salts were added to suppress the photocorrosion of the sulfide-based photocatalysts. Using this mixed solution, the photocatalytic reaction should proceed as follows [48]:
  • Photocatalyst + hν → e (CB) + h+ (VB)
  • 2H2O + 2e (CB) → H2 + 2 OH
  • SO32− + H2O + 2h+ (VB) → SO42− + 2H+
  • 2S2− + 2h+ (VB) → S22−
  • S22− + SO32− → S2O32− + S2
  • SO32− + S2 + 2h+ (VB) → S2O32−
The amount of H2 evolved was determined with on-line thermal conductivity detector (TCD) gas chromatography (NaX zeolite column, nitrogen as a carrier gas). Blank experiments revealed that no hydrogen was produced without catalyst being added or light irradiation.

3. Results and Discussion

3.1. Physicochemical Characterization
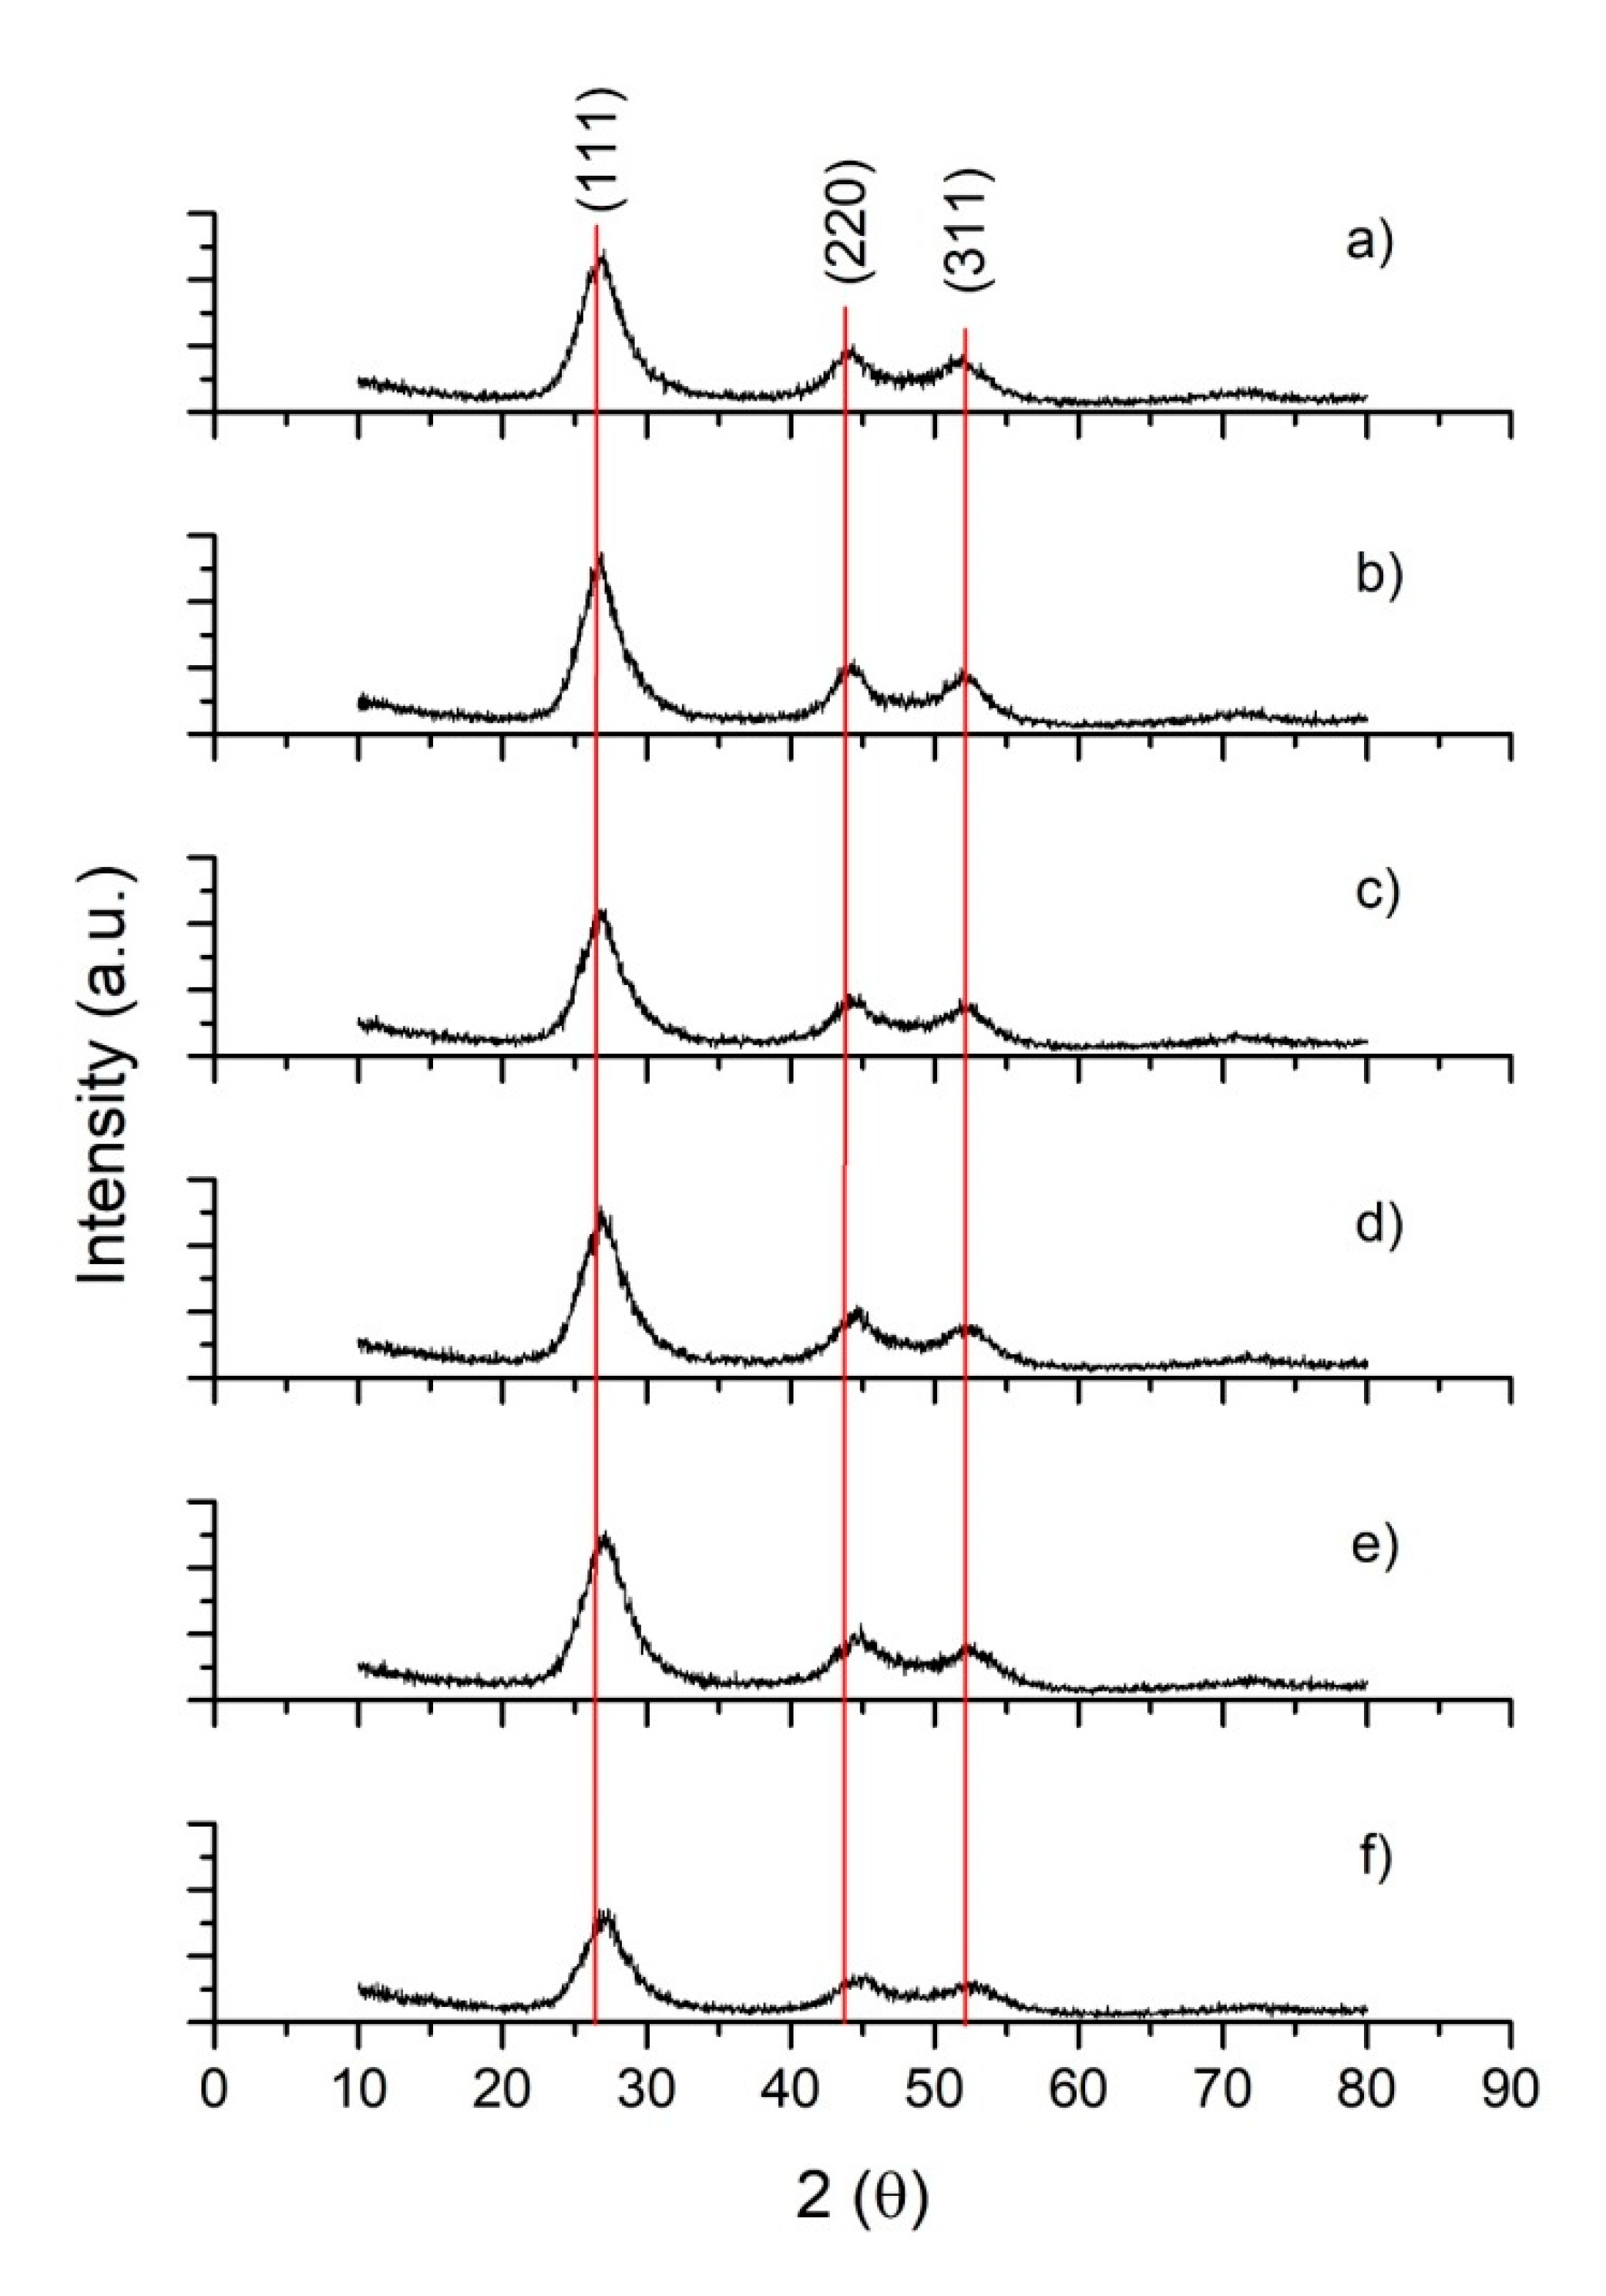
3.1.1. XRD Analysis

Figure 1 displays the XRD patterns obtained for CdS and ZnxCd1−xS samples prepared using the sonochemical-assisted method. As can be seen in Figure 1, the diffractogram lines of the pure CdS show nanoparticle-shaped patterns of low crystallinity. X-ray diffractograms of CdS have three characteristic Bragg diffractions at positions 26.45°, 43.88° and 51.97°, corresponding to the crystallographic planes (111), (220), (311) of the face-centered cubic crystalline phase (Hawleyite phase From International Centre for Diffraction Data the powder diffraction file (PDF) corresponds to 03-065-2887). It should be noted that the relation of intensities between the most pronounced reflections in the diffractogram obtained with respect to the intensities from the (PDF) 03-065-2887 does not exceed a 10% difference, which confirms the similarity between the two sets of reflections.
The XRD patterns of the prepared solid solutions of ZnxCd1−xS are very similar to that of the Hawleyite phase previously detected for the pure CdS sample, with a cubic phase centered on the faces showing prominent peaks at scattering angles (2θ) of 26.46°, 43.89° and 51.97°, which could be indexed to scattering from the (111), (220) and (311) planes, respectively. However, Bragg’s reflections, for all ZnxCd1−xS solid solutions, are constituted by wide and poorly defined peaks, indicating low crystallinity and size. The crystallite size measured by the Williamson–Hall method [43] is shown in Table 1. The calculated crystallite sizes range from 3.7 nm to 4.4 nm and they decrease as the amount of Zn increases.
On the other hand, it should be noted there is a slight shift to larger angles upon increasing the x value in the ZnxCd1−xS samples. It is known that ZnS also crystallizes in the face-centered cubic crystalline phase (PDF) 01-005-0566 [46] and therefore the peak displacements towards the diffraction angles of the ZnS seem to indicate the formation of a solid solution of ZnxCd1−xS by an insertion of Zn2+ atoms into the CdS network [47,49,50]. This can be explained in terms of the inverse relationship that exists between the real and reciprocal space of the crystalline lattice: the inter-planar distances decrease with an increase in the concentration of Zn. This fact is associated with the lattice compression of the crystalline network originated by the substitution of Cd ions by a smaller Zn ionic radius (0.97 Ǻ against 0.74 Ǻ [51]).

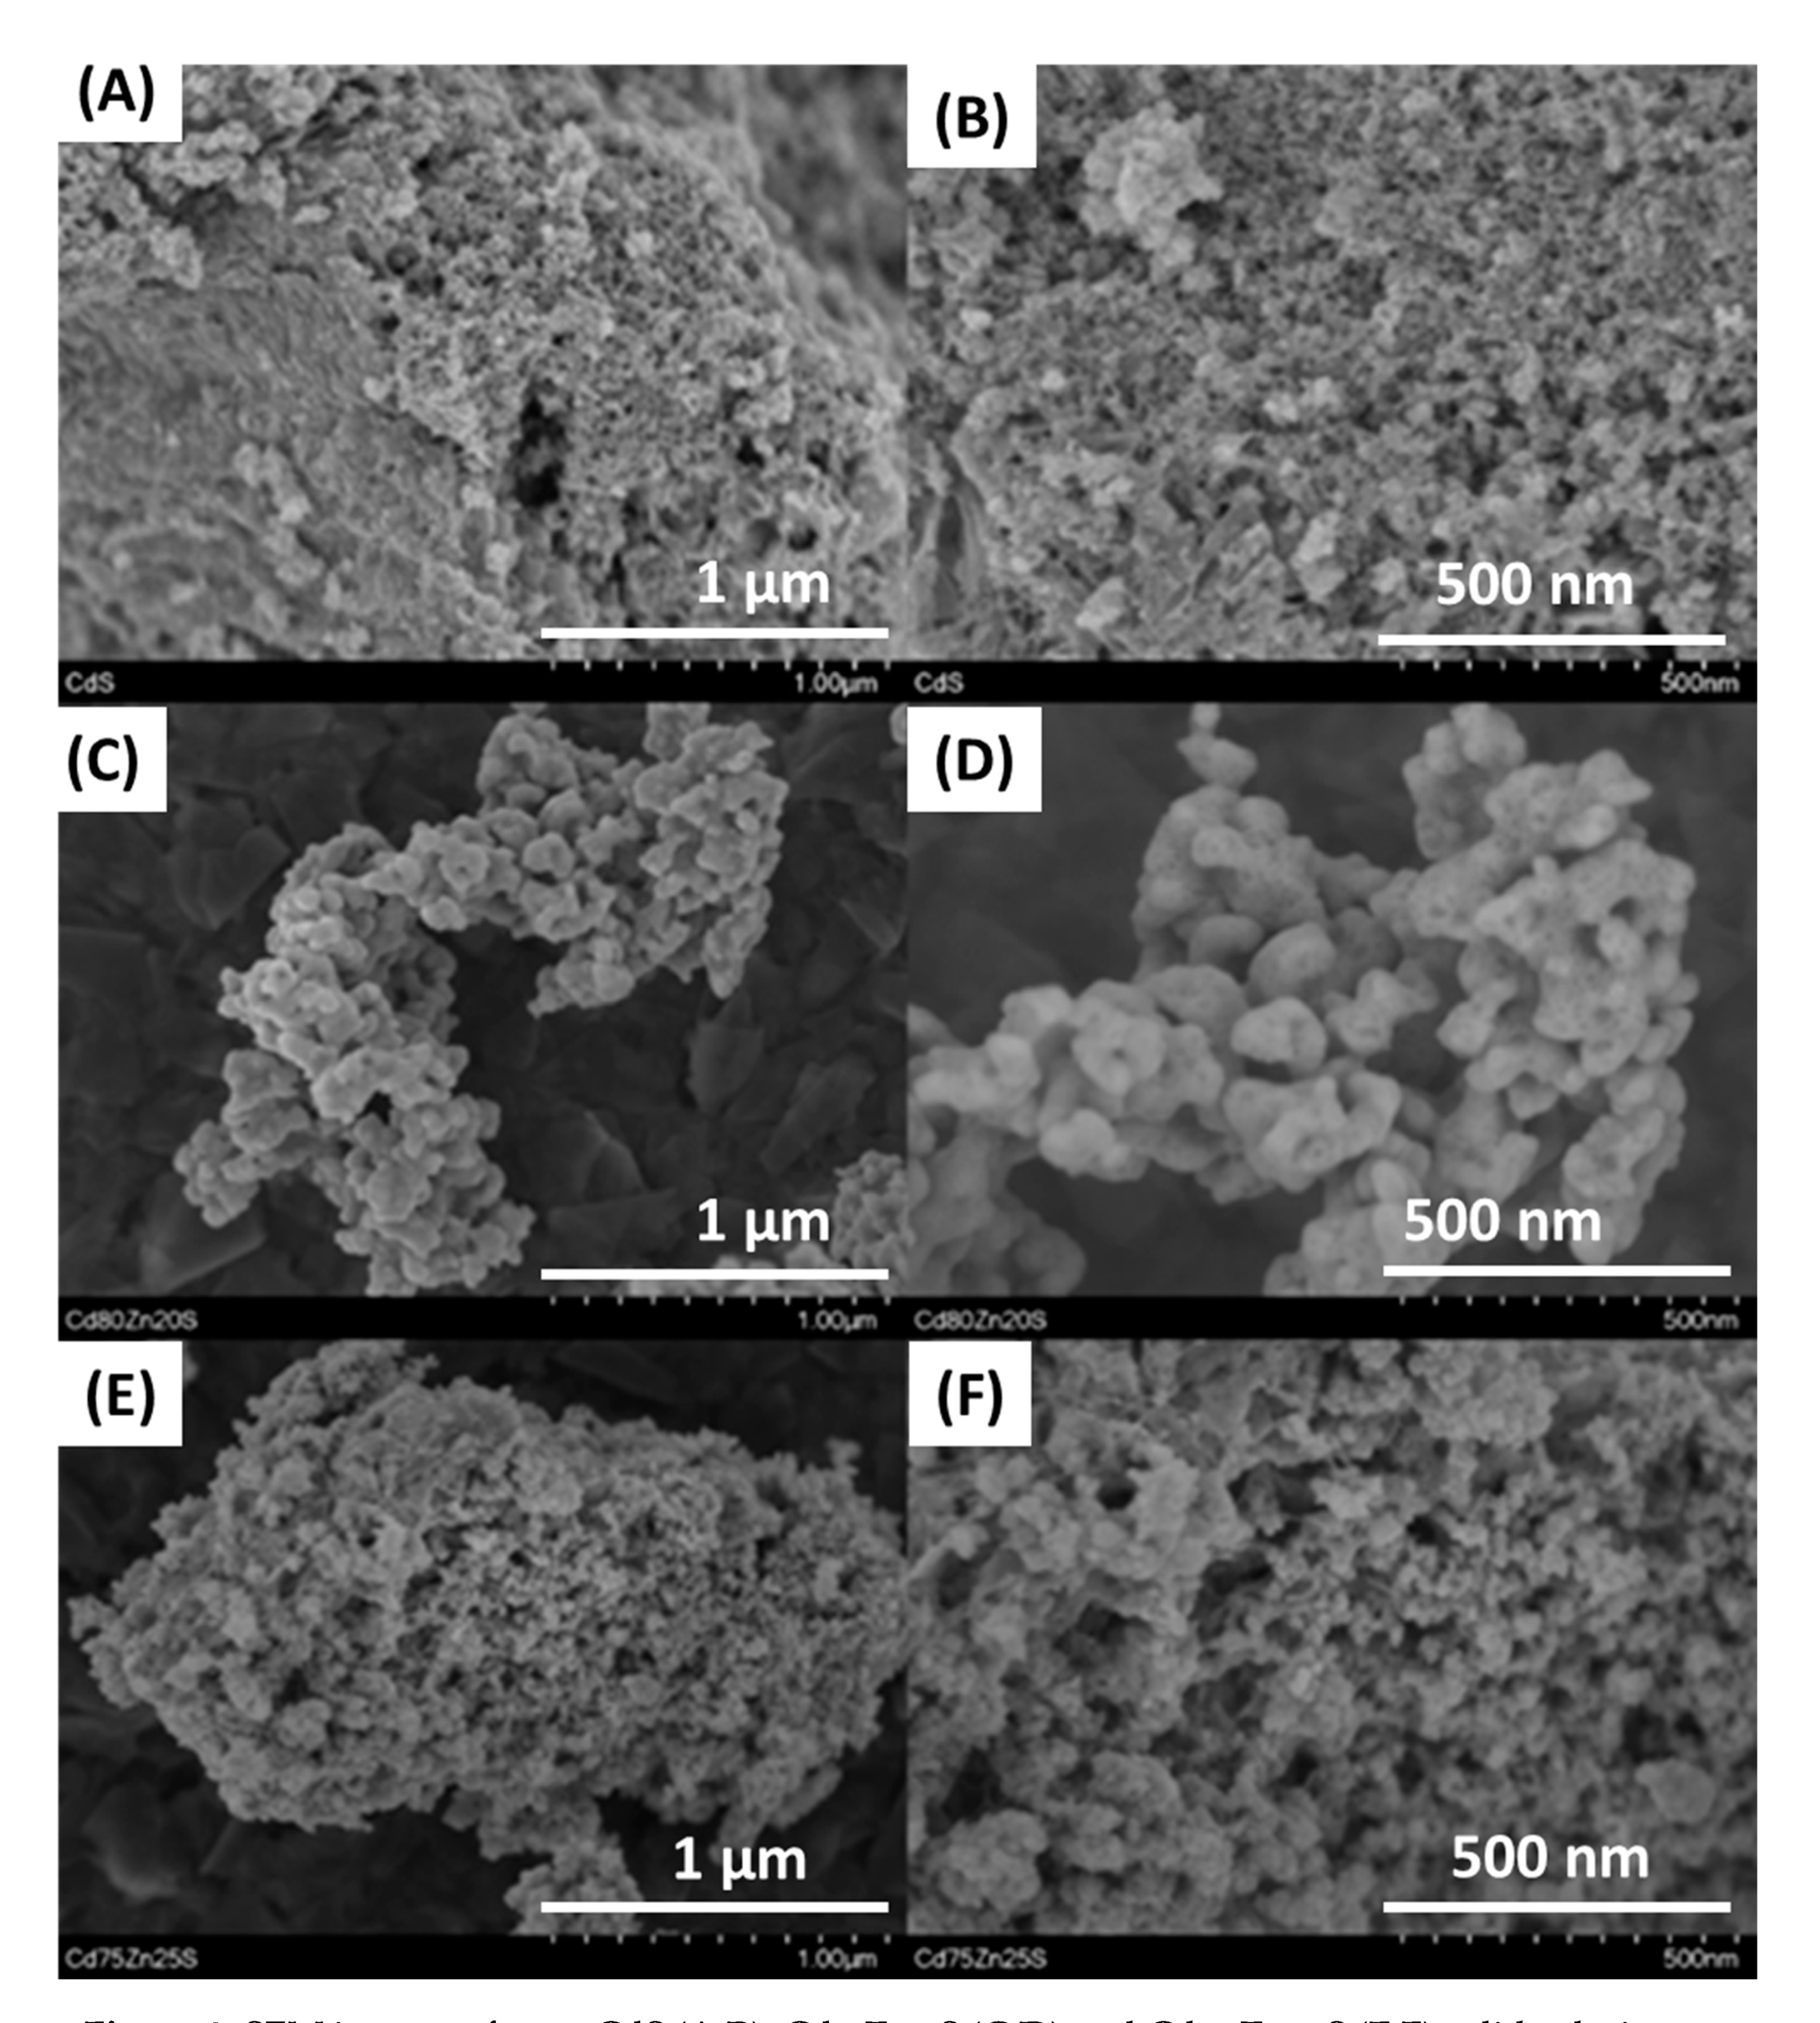
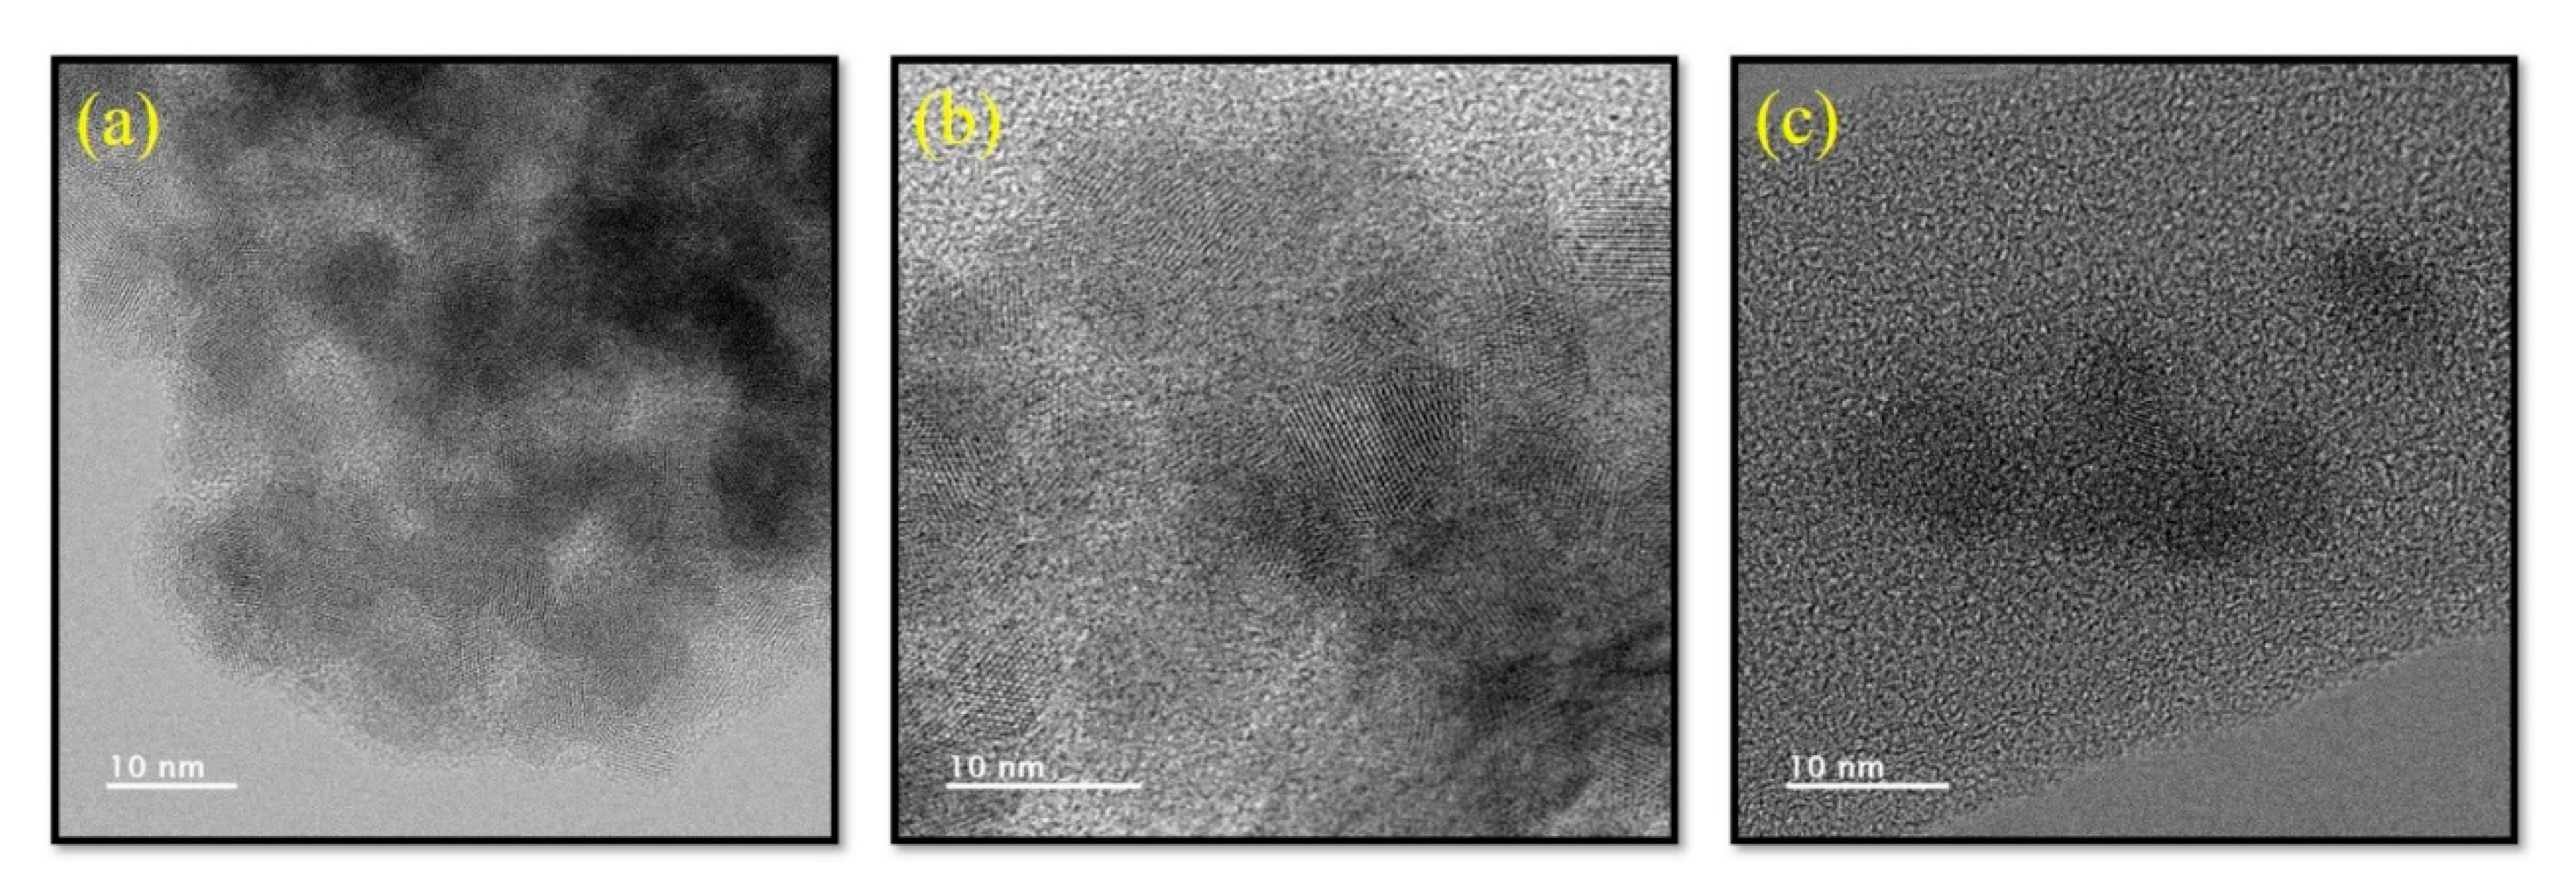
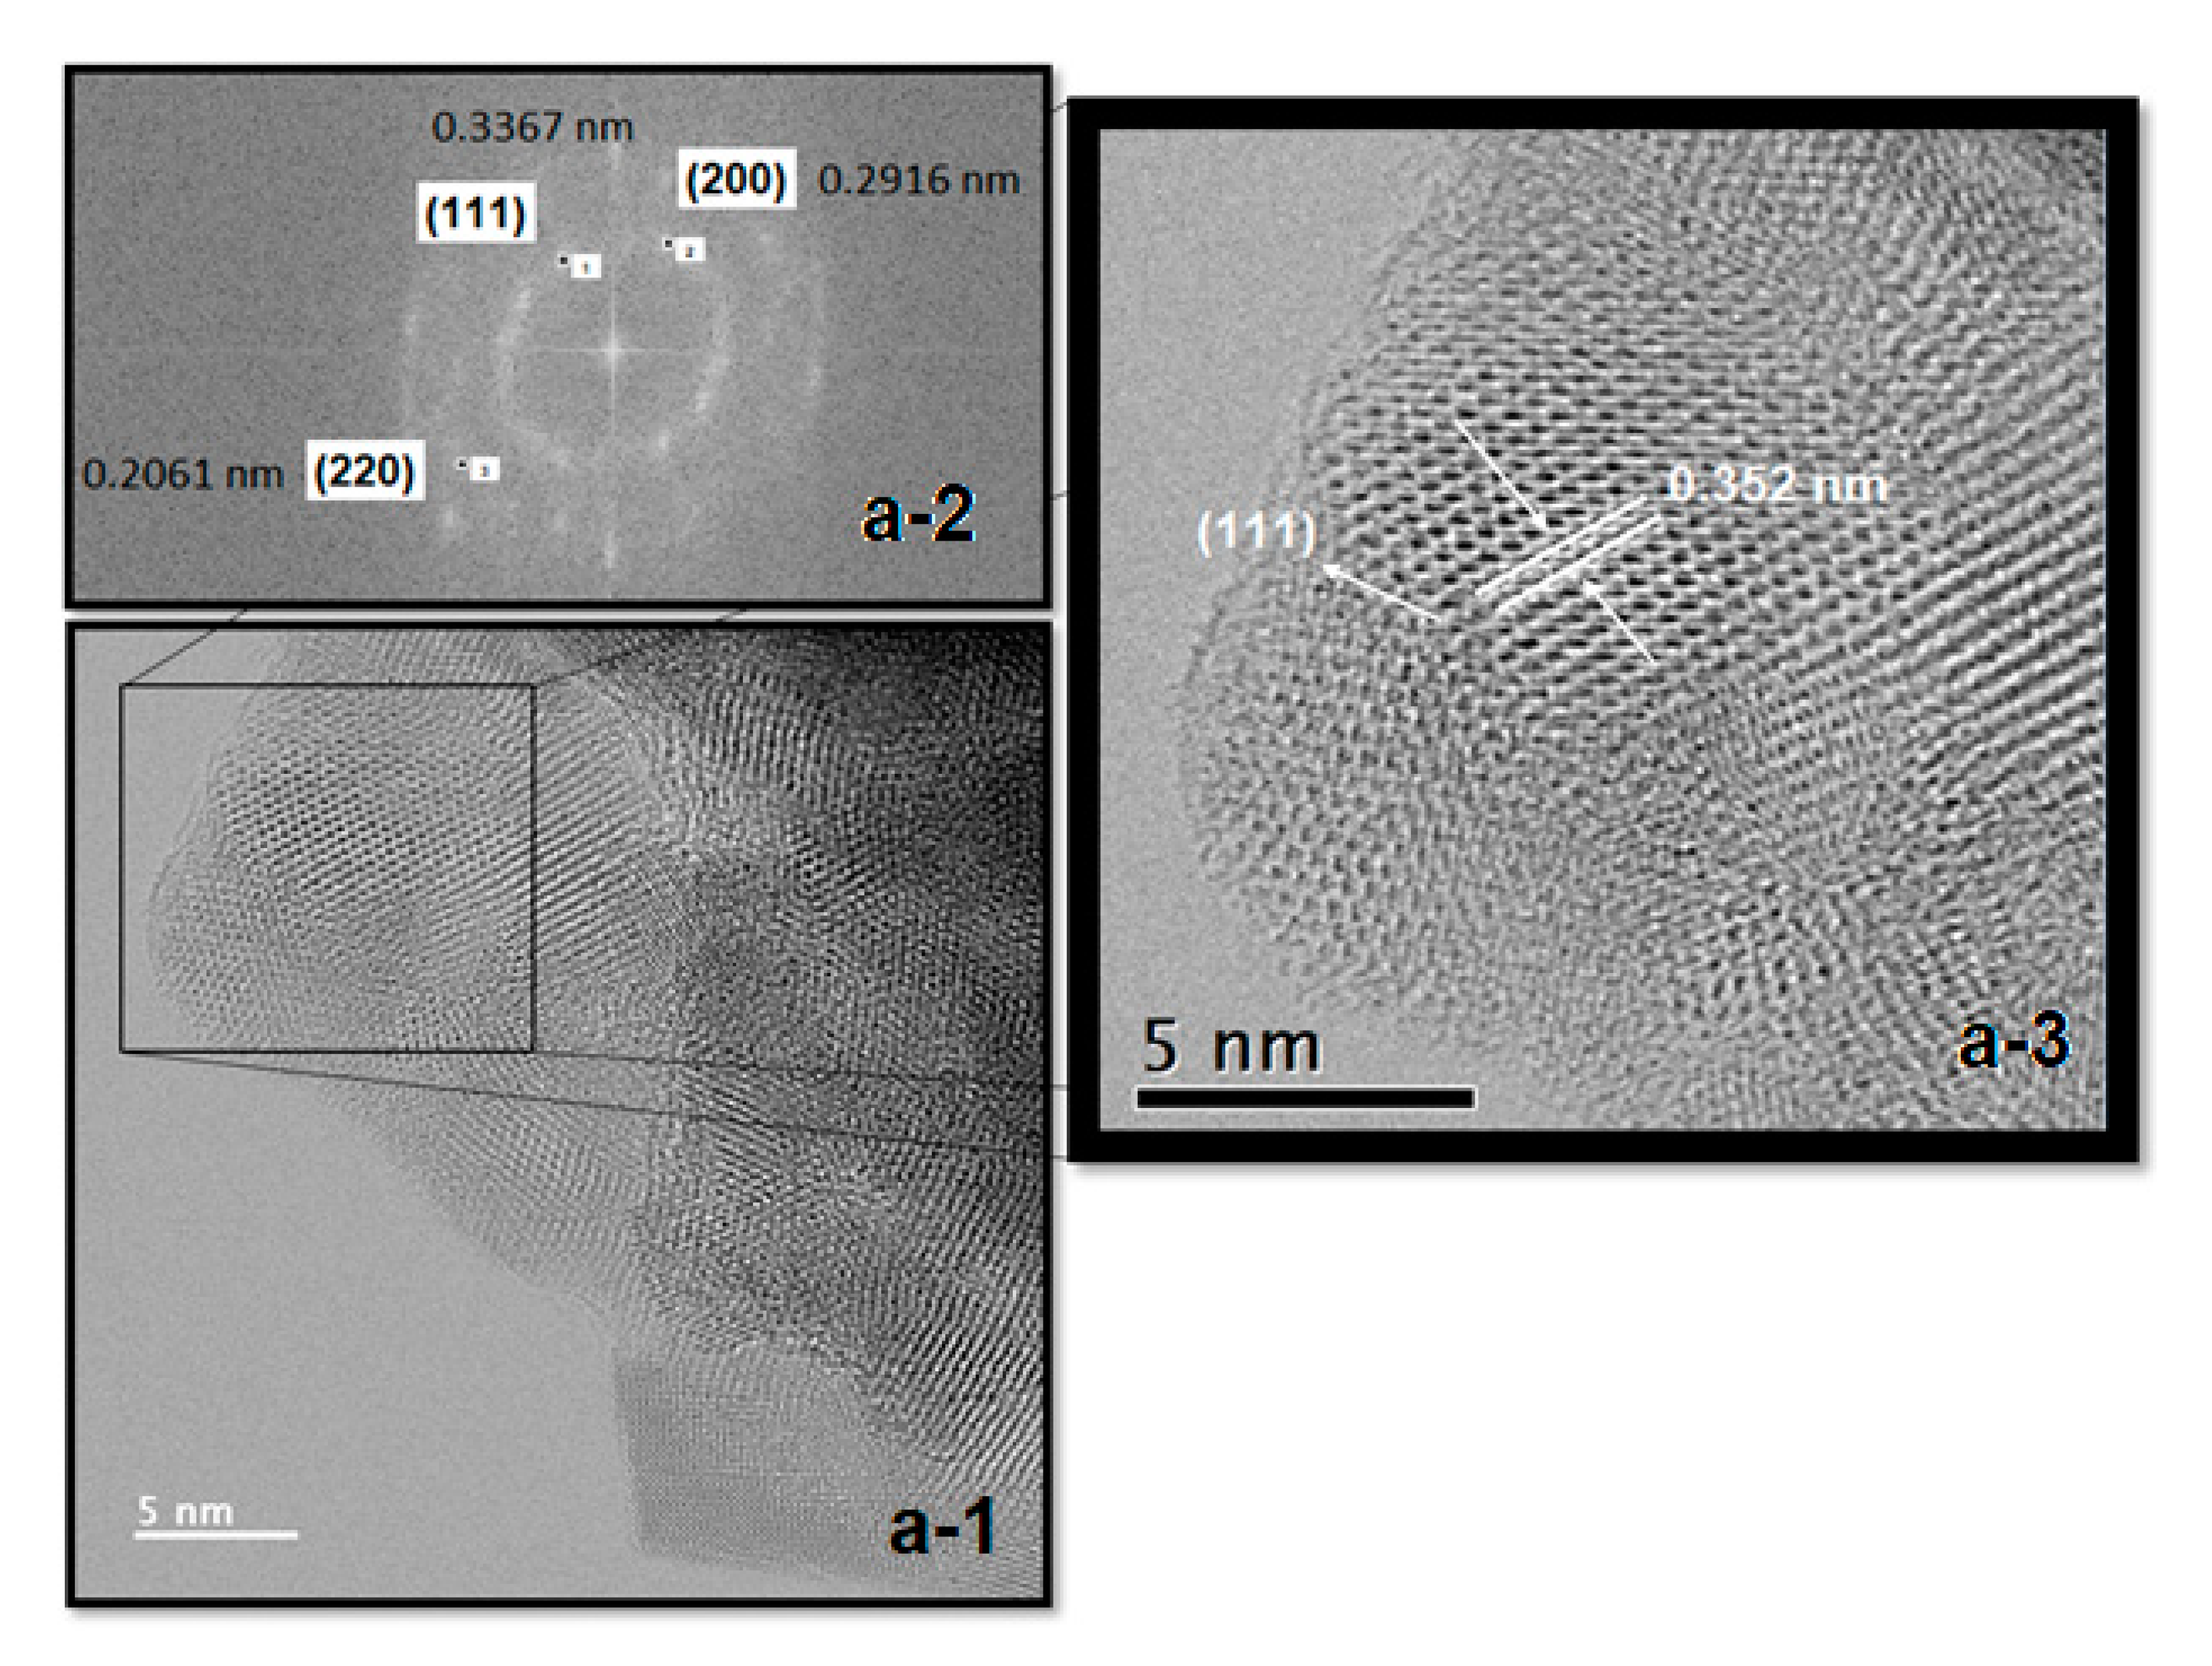
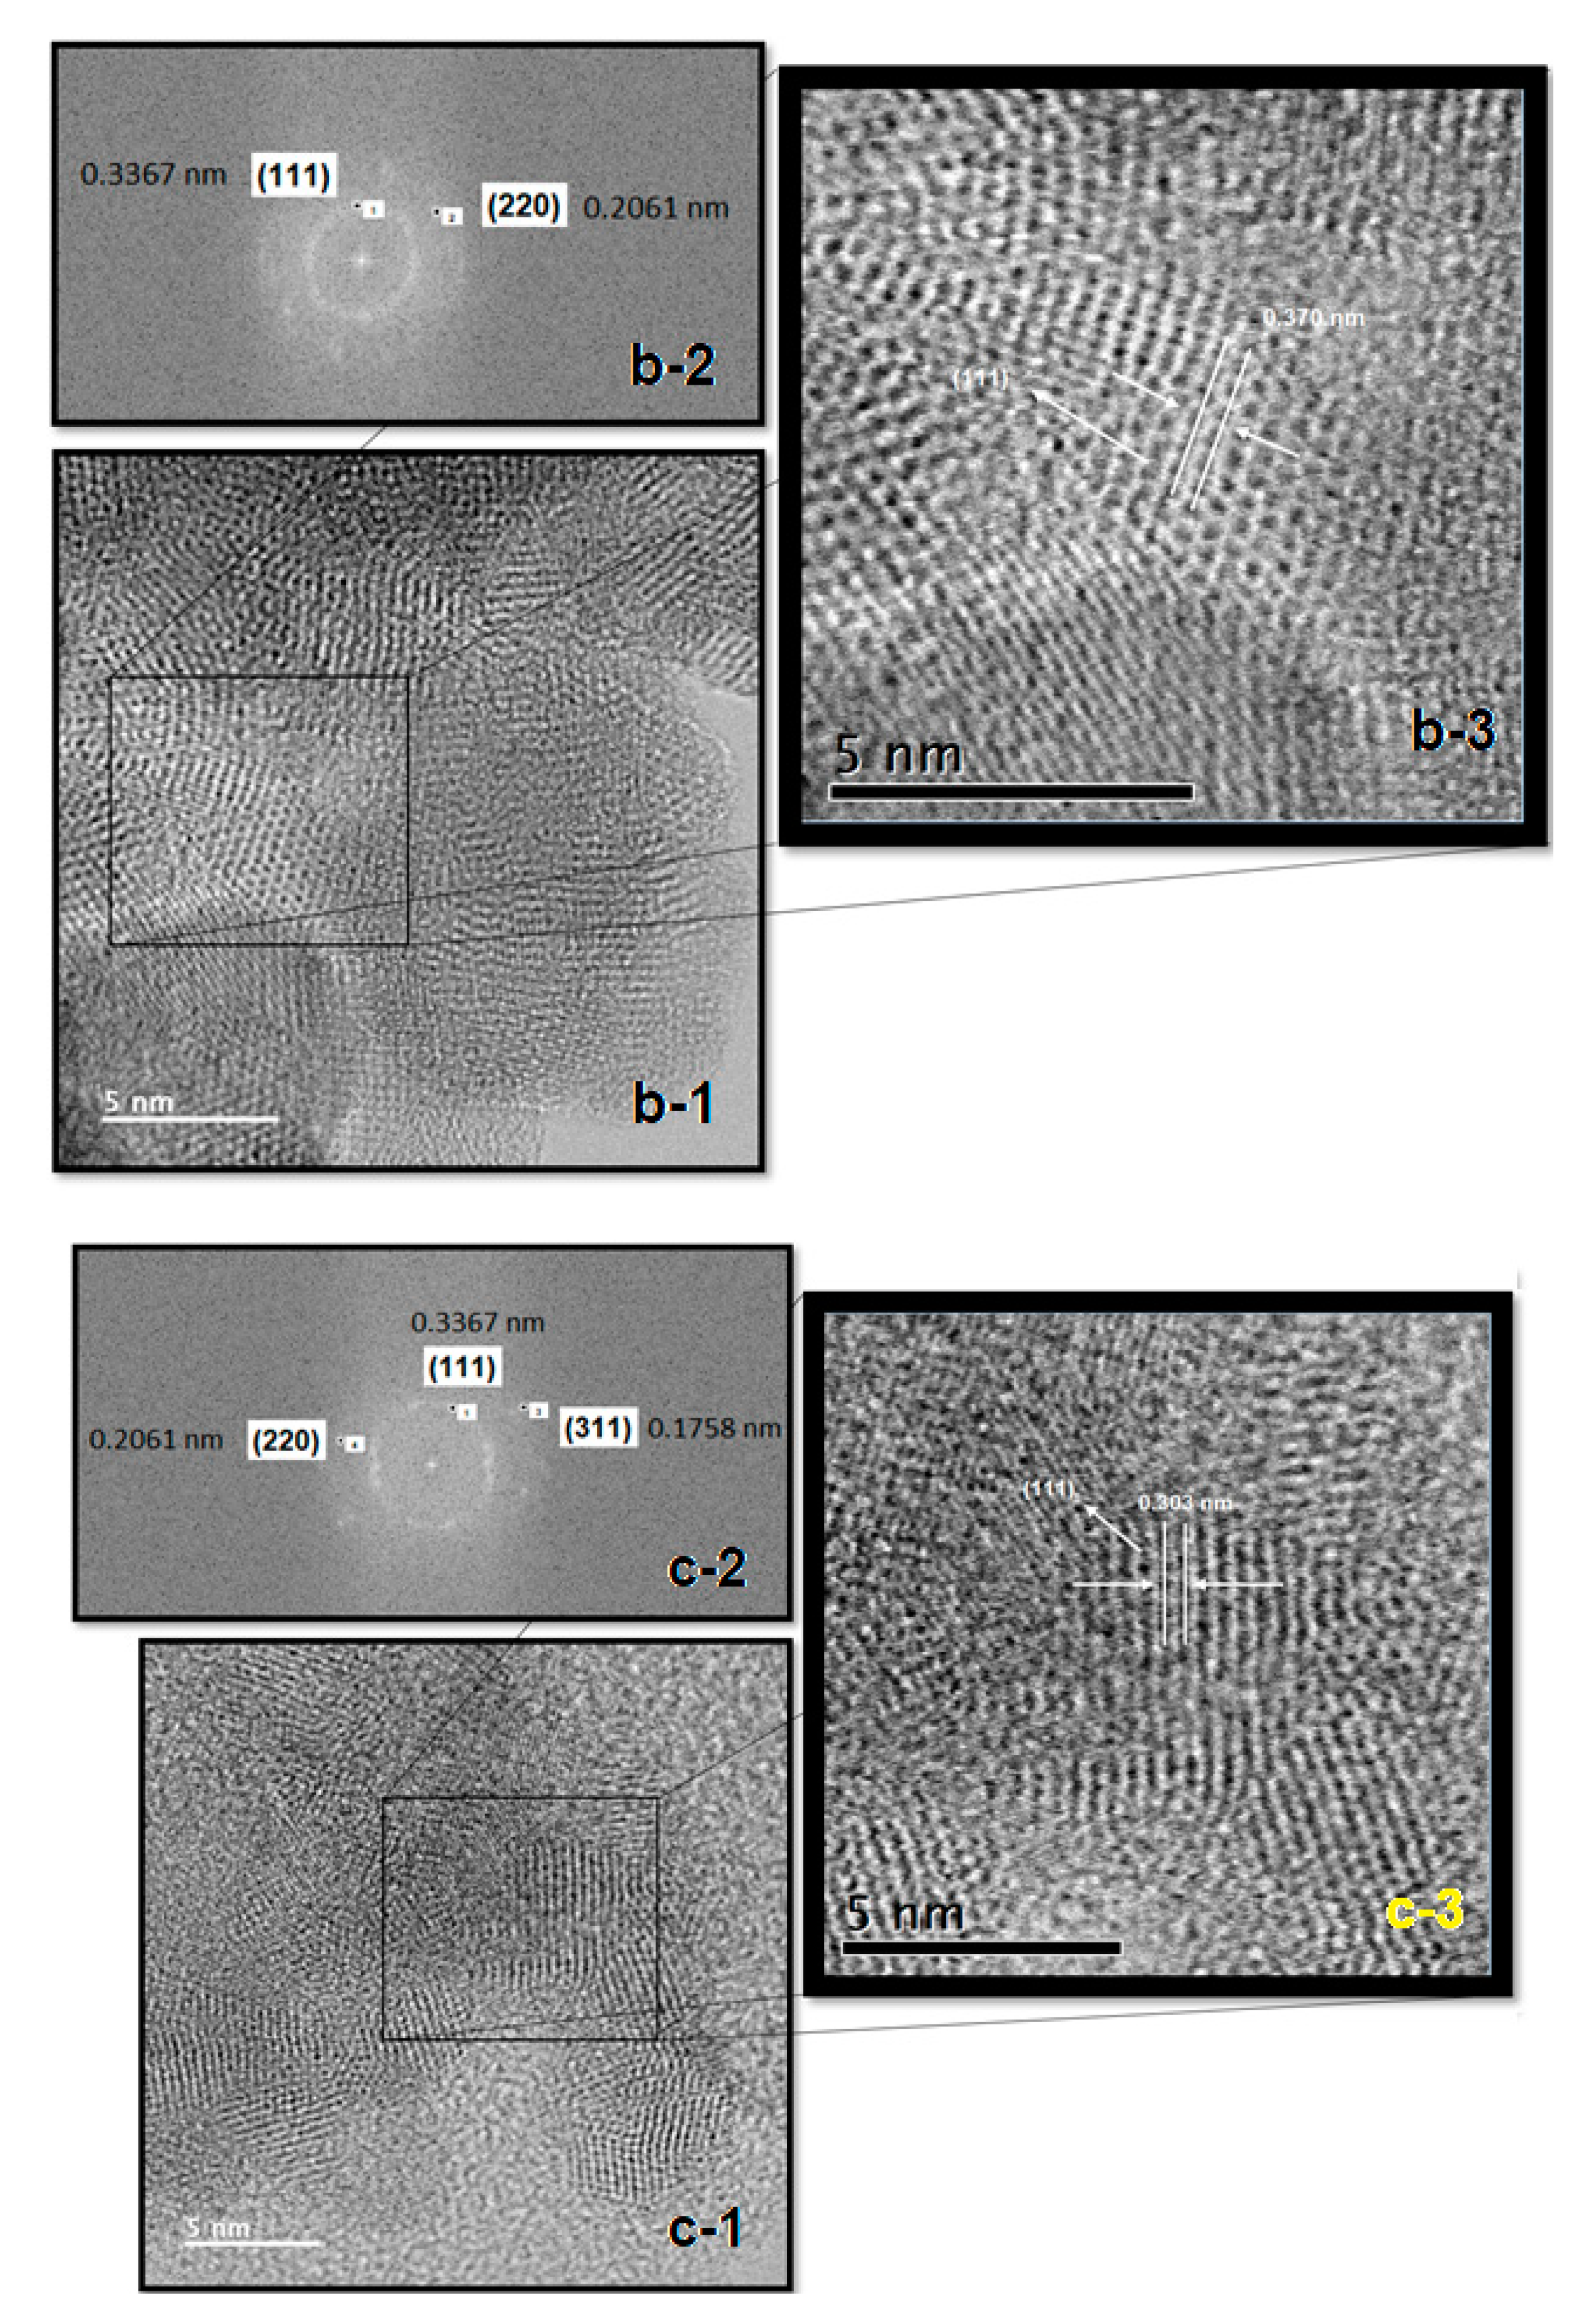
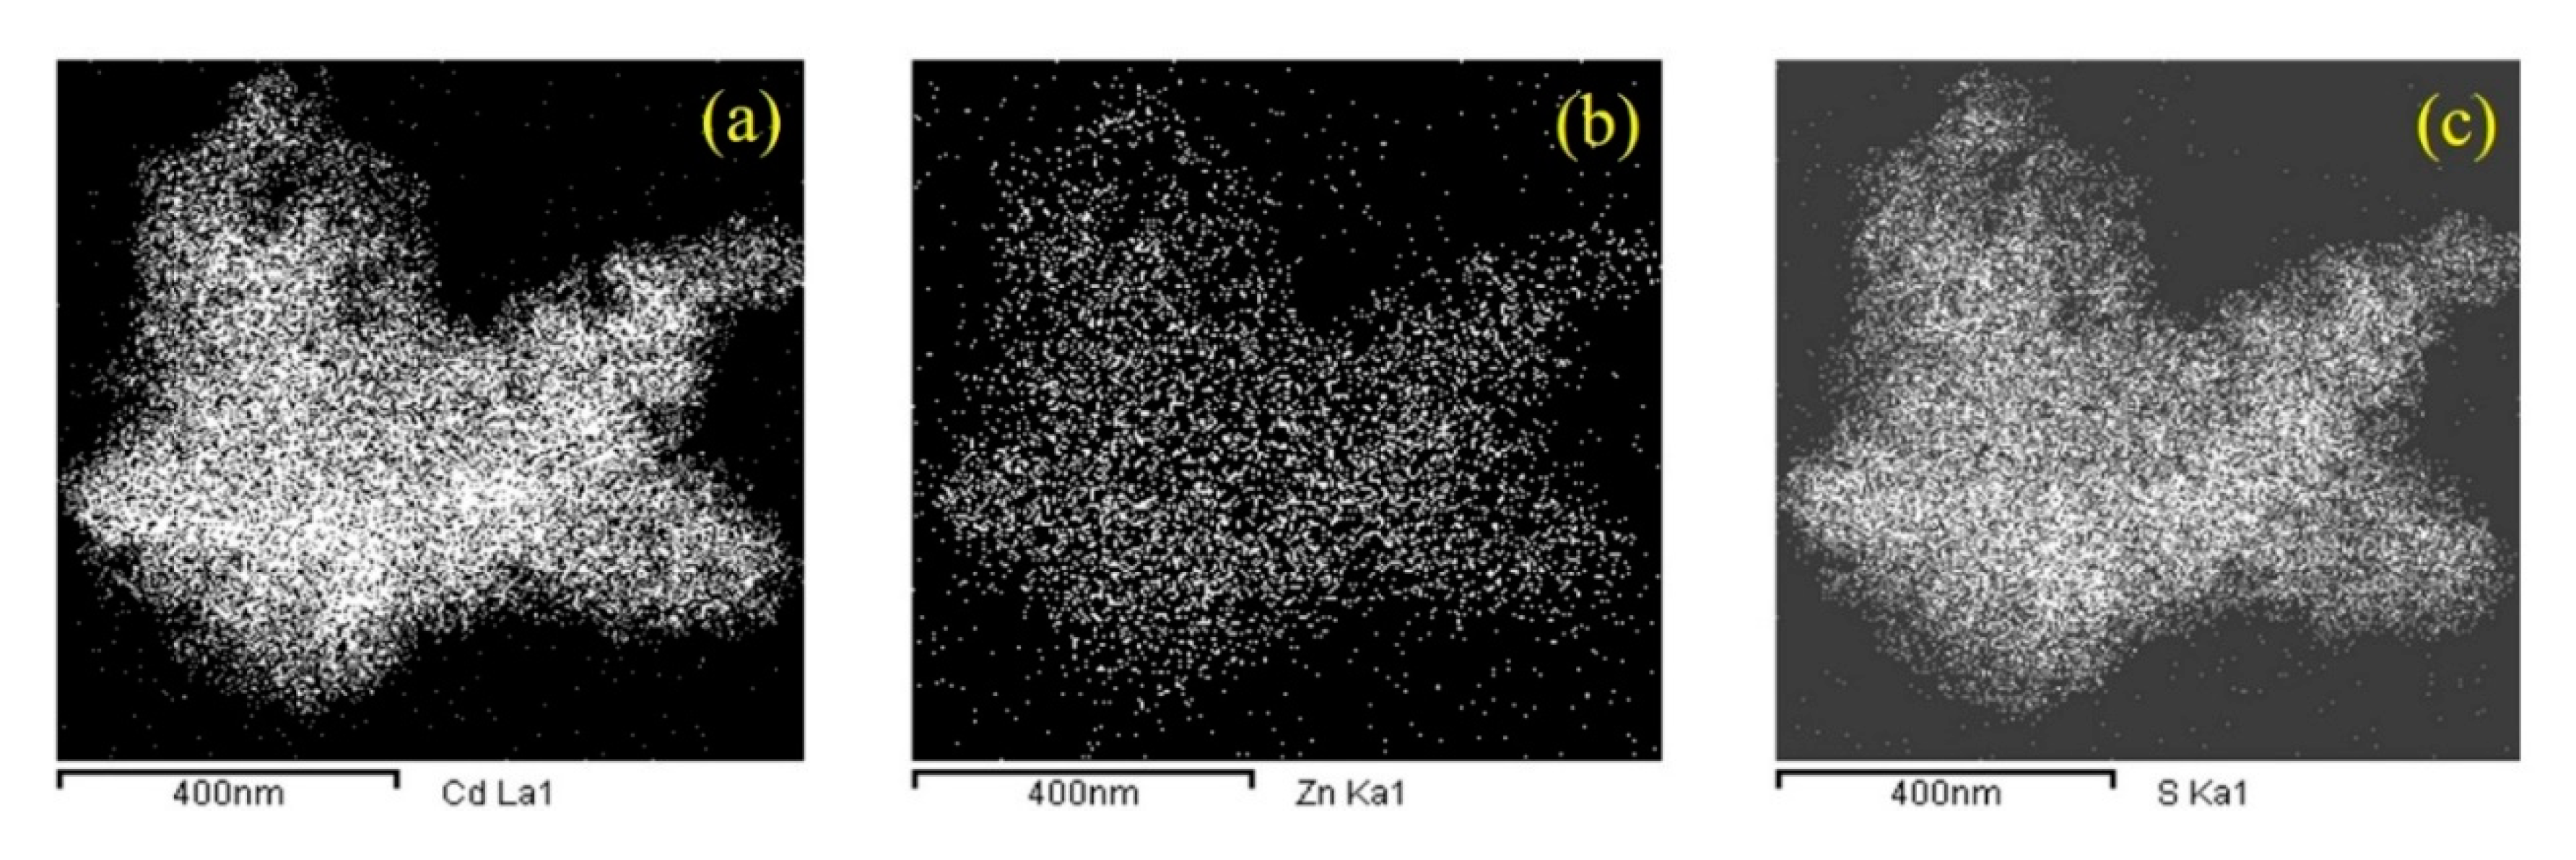
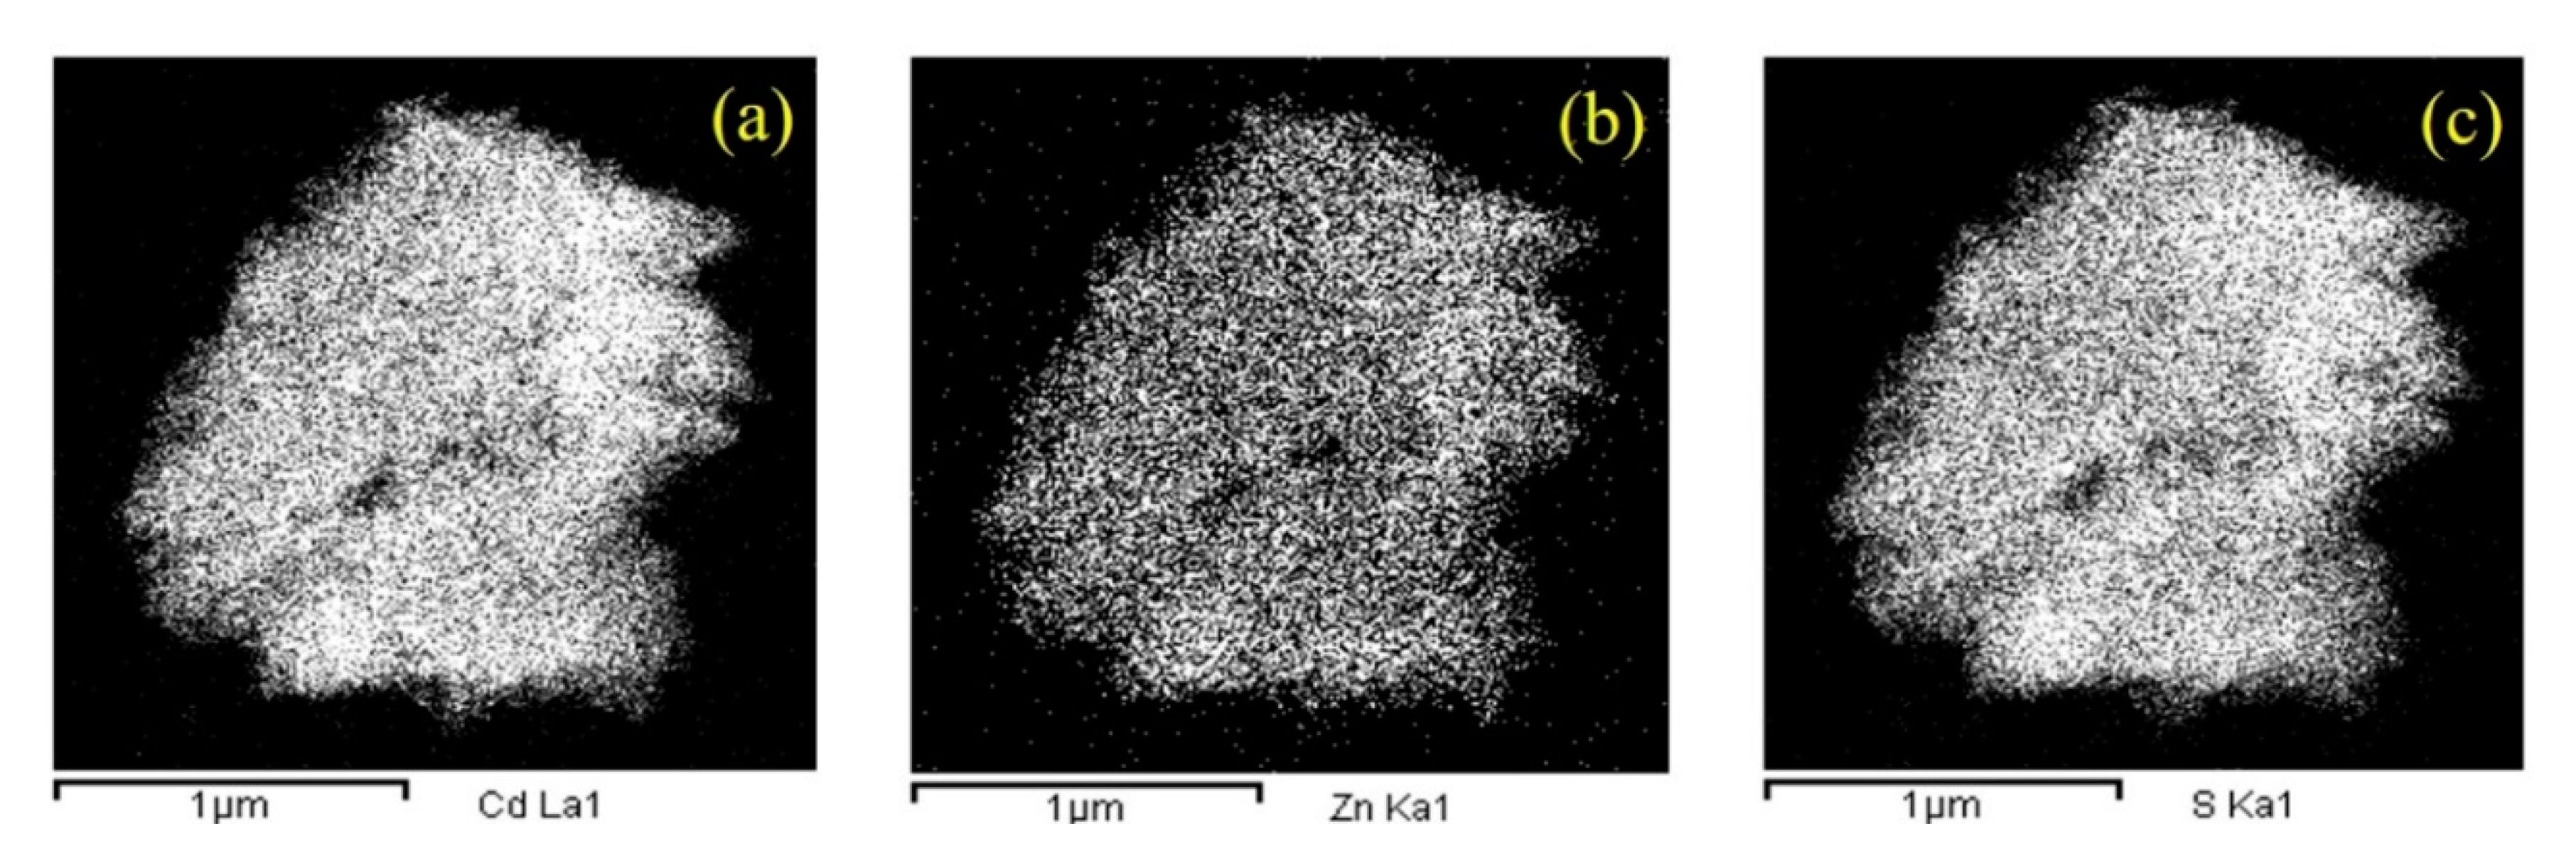
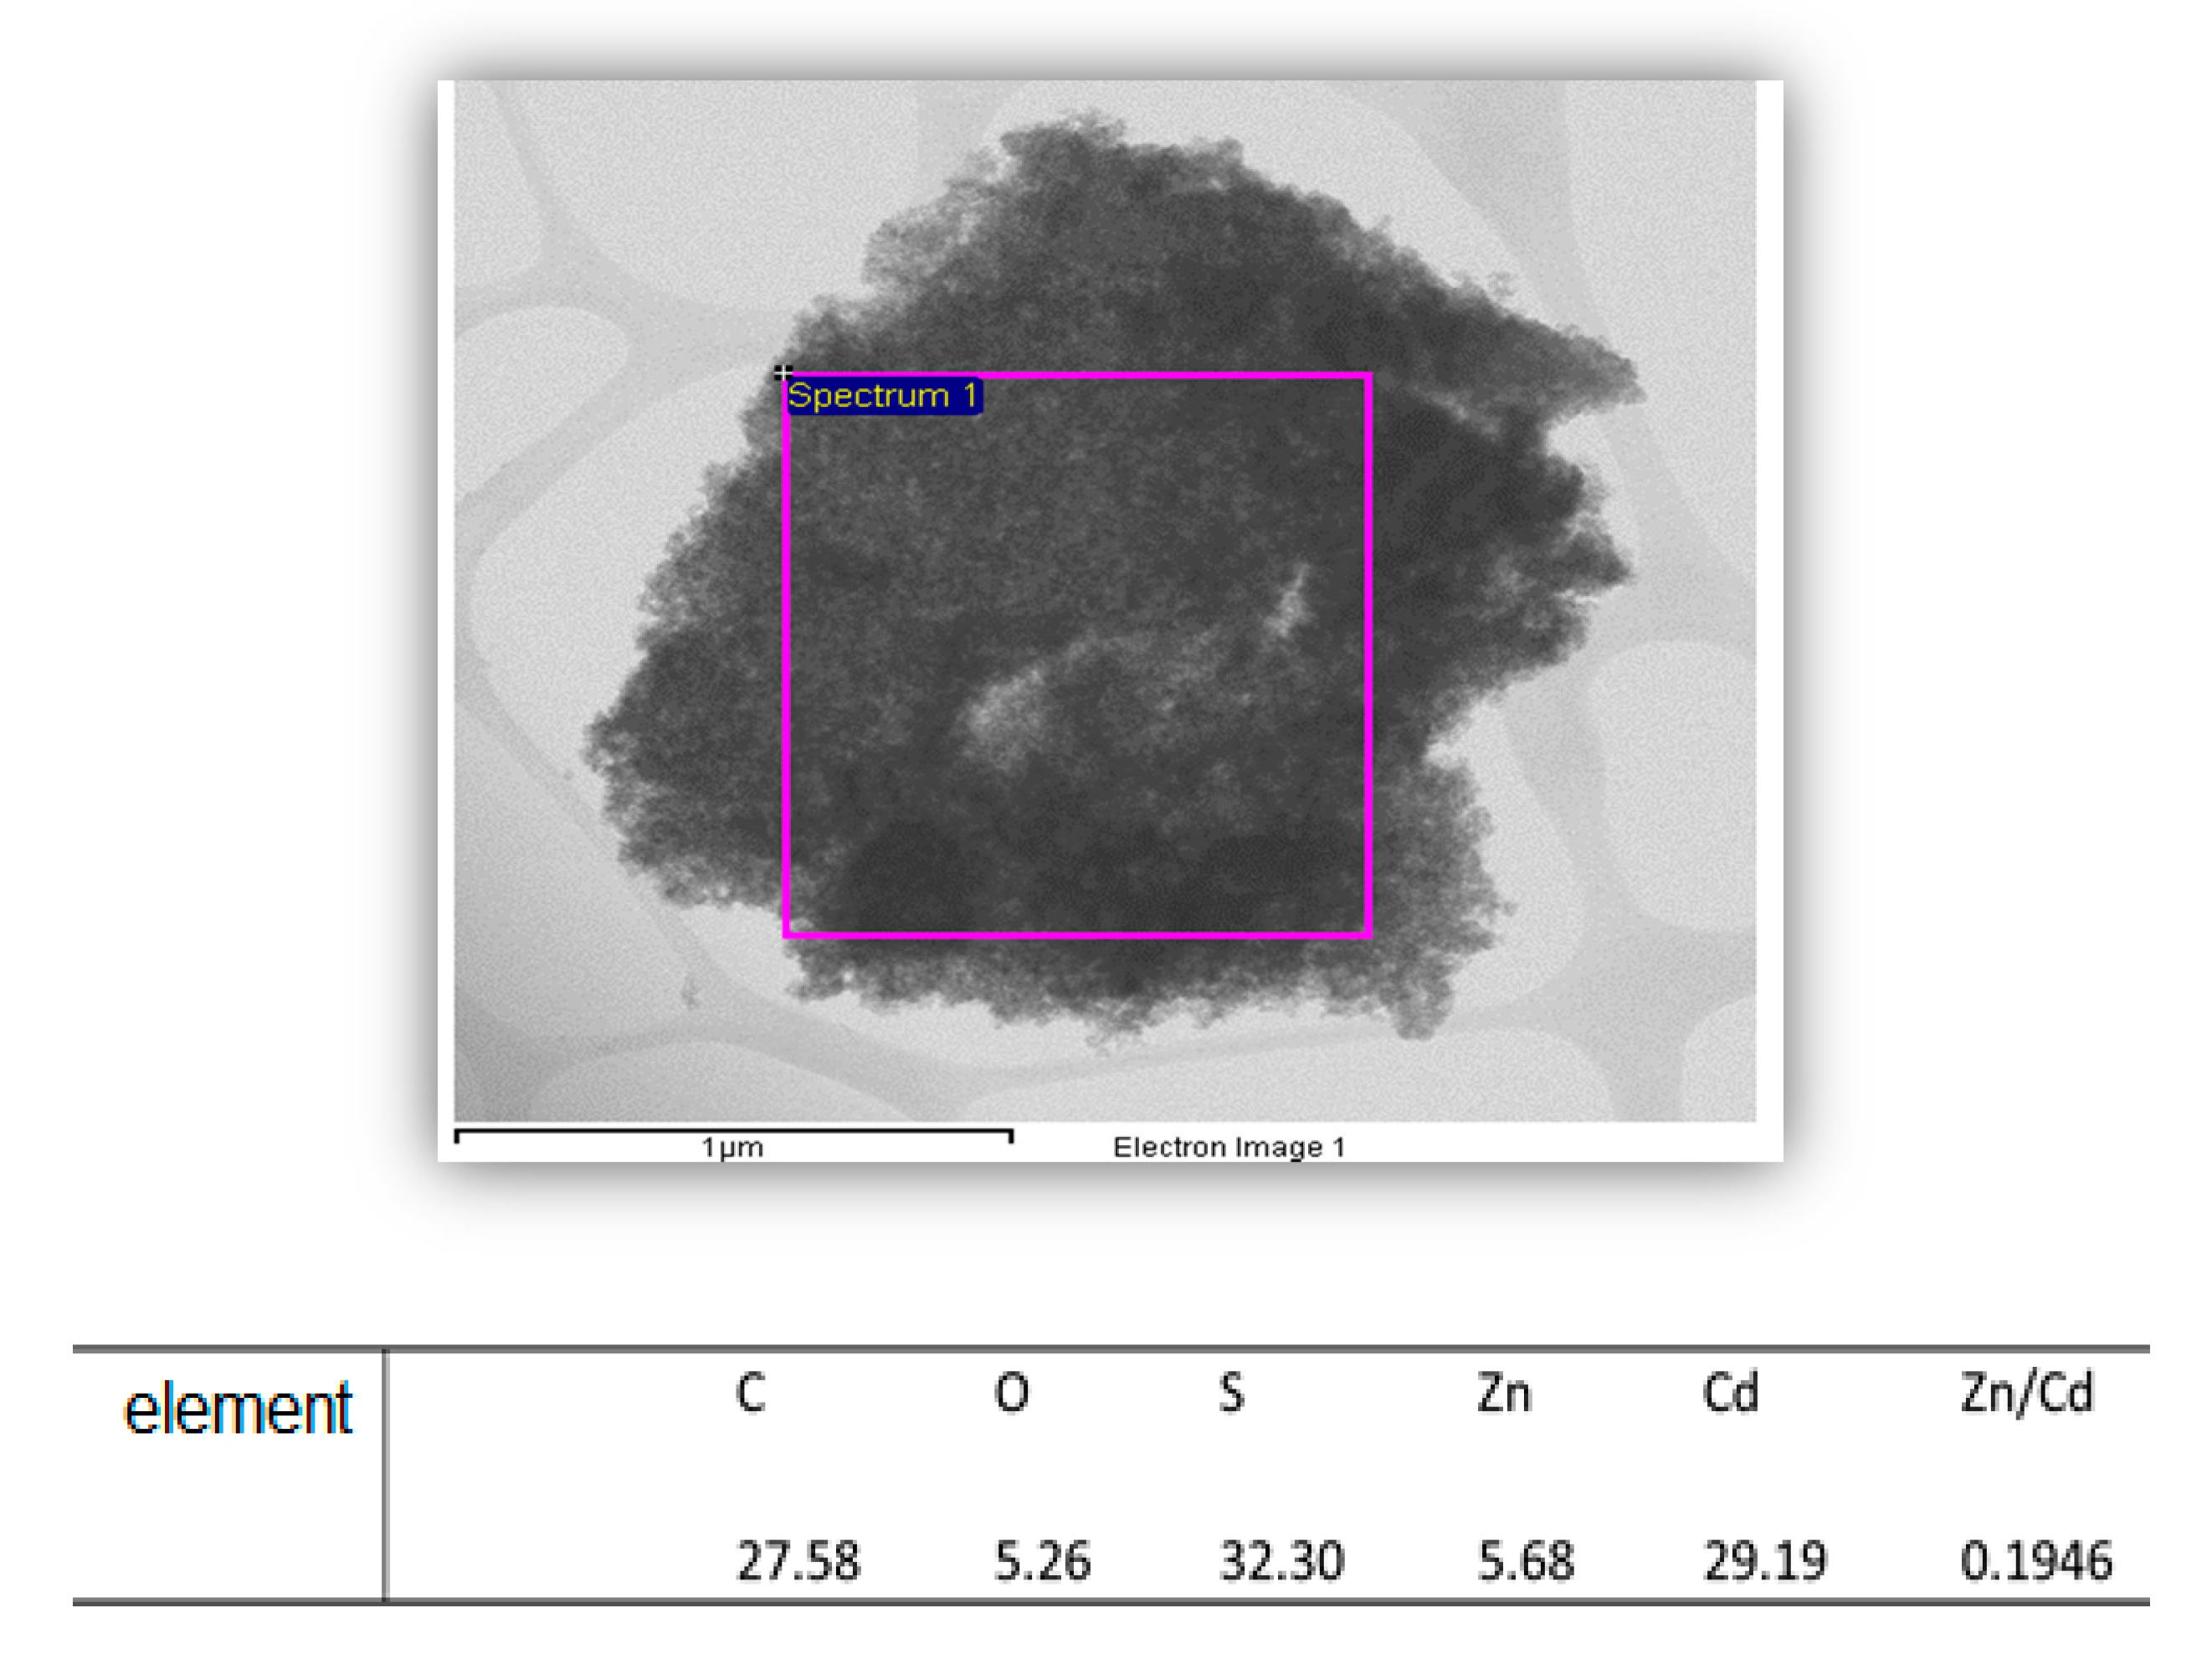
3.1.2. SEM and TEM Analysis

SEM images in Figure 2 show the morphology and surface texture corresponding to the pure CdS and Cd0.75Zn0.15S and Cd0.8Zn0.2S as representative samples of the ZnxCd1−xS solid solutions. All the samples consist of particle agglomerates with irregular morphologies that indicate macroporosity and morphology.
The catalyst morphology, interplanar spacing, shape and growth orientation of crystallites was studied by TEM and HRTEM. Figure 3 shows images corresponding to pure CdS, and Zn0.1Cd0.9.1S and Zn0.2Cd0.8S, as representative samples of the ZnxCd1−xS solid solutions. As can be seen, all samples are polycrystalline. However, small regions can be detected where the lines that mark the different atomic planes of the expected crystalline network are not clearly observed, which seems to indicate that there are regions that are amorphous. HRTEM images in Figure 4 and Figure 5 show different interatomic planes of the crystalline network formed during the growth of the synthesis of the CdS and ZnxCd1−xS samples, respectively.
To confirm the exact structure of the material, a small portion of the micrographs obtained with TEM were selected (Figure 4(a-1) and Figure 5(b-1,c-1)) and then the selected portion was processed by the DFT, obtaining the interference pattern in the reciprocal space, which chose a diffuse band in a circular shape formed by points in different positions for pure CdS (Figure 4(a-2)), Cd0.9Zn0.1S (Figure 5(b-2)) and Cd0.8Zn0.2S (Figure 5(c-2)). The first transformation confirmed the polycrystalline nature of the samples by the different orientations shown in the reciprocal space.
In a second step, two points of the circle were selected to reconstruct the lattice of the underlying crystalline structure; then, with the help of a virtual mask and a virtual filter included in the software (SAD), an inverse Fourier transform was finally executed, returning the image to its almost original appearance, but with a single orientation of planes and better definition, sharpness and contrast. As a result, the distances between the mountains and valleys of these line patterns were obtained, which can be seen in Figure 4, where all the indexes obtained (hkl) of the diffracted rings coincided well with those of the JCPDS data 01-089-0440 for the cubic phase of the CdS (Figure 4(a-3) and Figure 5(b-3,c-3)). The patterns showed that the materials consisted of randomly oriented polycrystalline material with the (111) plane being the most intense (showing a distance between lines of 3.3 nm), which is consistent with that obtained in the DRX diffraction patterns, with a more intense Bragg reflection corresponding to (111), regardless of the content of Zn in the samples, and corresponding mainly to the cubic phase. Similarly, the diameters of some crystallites were measured, which are also shown in Figure 4(a-1) and Figure 5(b-1,c-1). An almost circular shape can be observed and the size is within the average calculated by the Williamson–Hall method (Table 1), obtained with the DRX analysis.
In order to obtain a deeper analysis regarding the elemental composition and Zn distribution at an atomic scale, high-angle annular dark field (HAADF) associated with scanning transmission electron microscopy (HAASF-STEM) was carried out for the Zn0.1Cd0.9S and Zn0.2Cd0.8S samples and the results are presented in Figure 6 and Figure 7, respectively. Comparing the images presented in both figures, it is possible to observe that Zn atoms are homogeneously distributed in the solid solutions. The homogeneous distribution of Zn in the resulting solid solution was verified by the chemical composition analysis, Energy Dispersive Spectroscopy—Scanning Transmission Electron Microscope (EDS-STEM), performed on the Zn0.2Cd0.8S sample (Figure 8) that shows a Zn/Cd ratio of 0.19, very close to the theoretical value (0.20).

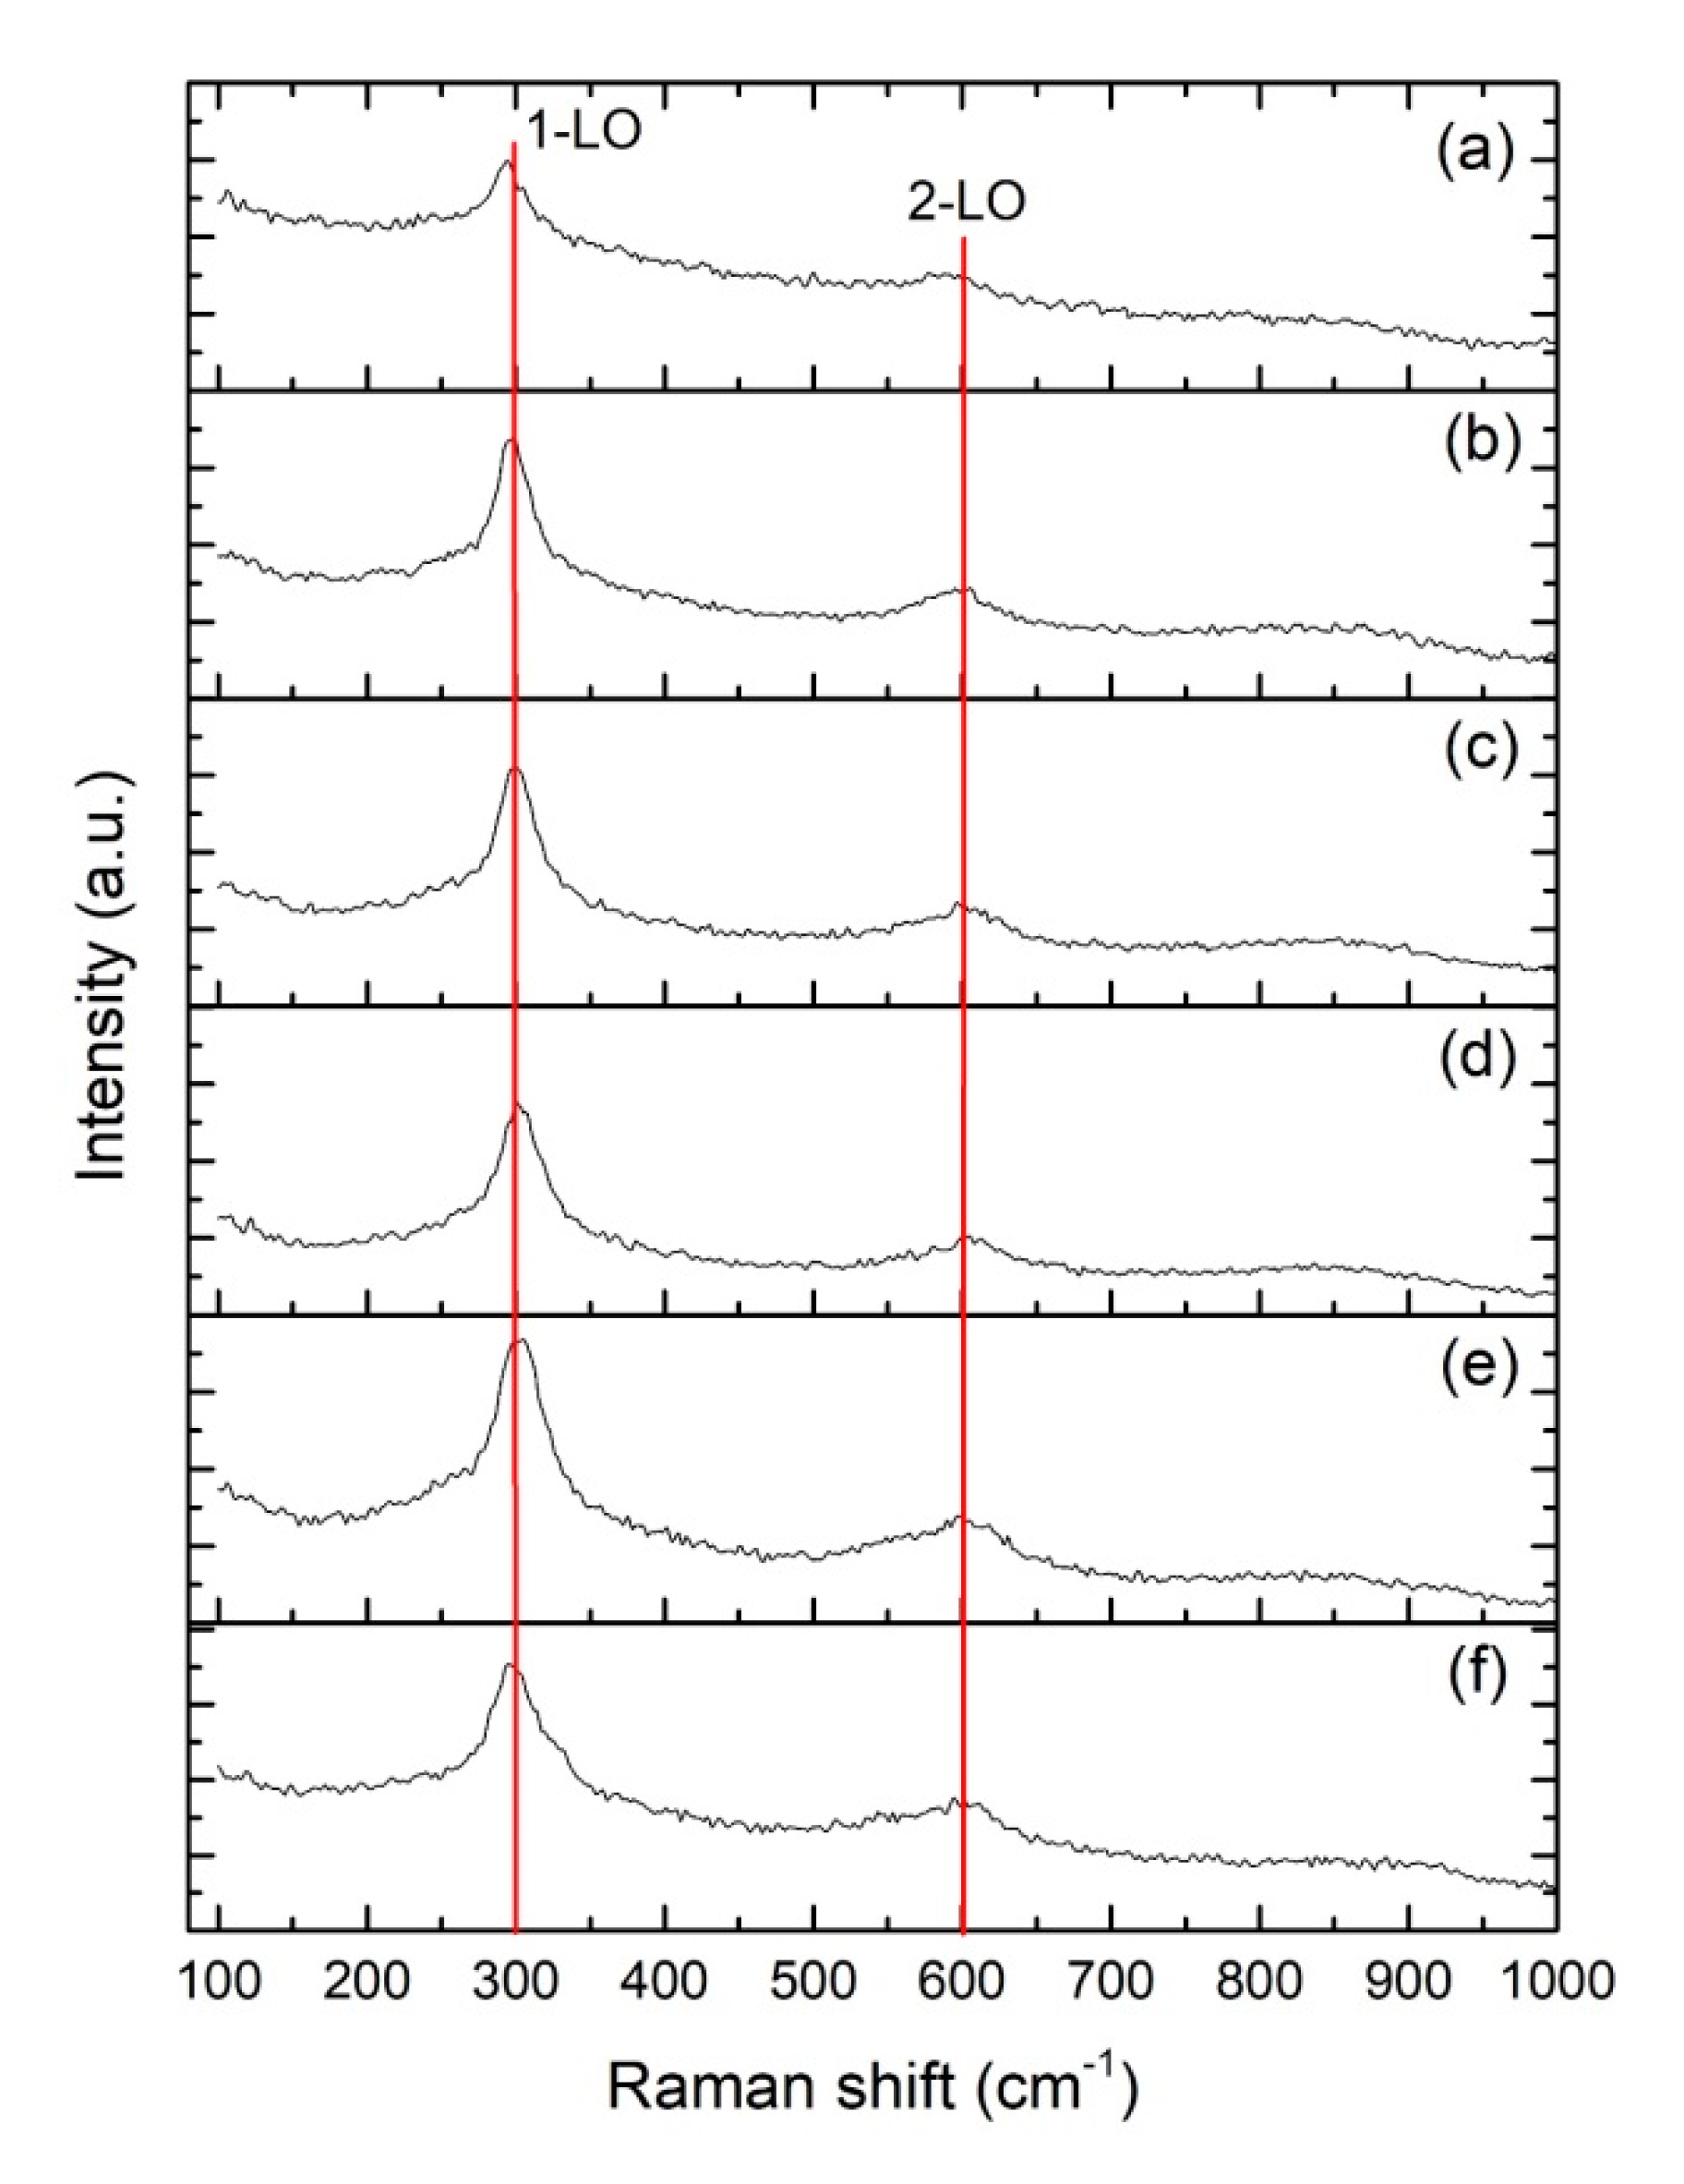
3.1.3. Raman Spectroscopy Analysis

Figure 9 shows the Raman spectra for the pure CdS and ZnxCd1−xS solid solutions. A blue laser (455 nm) was used to obtain the longitudinal vibrational modes of the crystal CdS lattice. From the set of spectra shown in Figure 9, a very prominent band around 300 cm−1 corresponds to the first longitudinal mode of optical vibration (LO) of CdS, and another less intense band around 600 cm−1 corresponds to the second 2-LO vibrational mode of cubic CdS.
The presence of segregated CdS and ZnS phases is discarded because an appreciable change in the spectra of the samples containing Zn with respect to the spectrum of pure CdS is not observed (two bands would appear at wavelengths around 345 and 690 cm−1). Only a small shift of the Raman lines to higher frequencies is observed in the profiles of the ZnxCd1−xS samples. These shifts increase as the Zn content in the ZnxCd1−xS samples increases. The energy shifts of the 1(LO) phonon mode of CdS are very sensitive to lattice strain along the c-axis and therefore the shift to higher frequencies observed in these samples corroborates that Zn is substituted in the CdS network, causing a compression of the lattice, as was previously observed by XRD. Changes in the intensities and widening of the 1-LO (first longitudinal optical) and 2-LO (second longitudinal optical) bands are observed as the Zn ratio in ZnxCd1−xS samples increases, which is consistent with what was previously reported for ZnxCd1−xS solutions in the form of films [52]. The formation of Cd-S-Zn bonding is related to the lattice compression when ZnxCd1−xS solid solutions are formed.
In Table 2, the peak position and intensity of the more representative vibrational modes are set to get a better understanding of the exciton–phonon coupling strength behavior, which is represented by the intensity ratio of 2-LO to 1-LO modes (I2LO/I1LO) of the semiconductor. This intensity ratio slightly decreases as Zn2+ concentration increases, as shown in Figure 8, which is in line with some literature surveys for other dopants like Mn+2 [53]. From Table 2, it can be observed that the intensities of 1-LO and 2-LO are the highest for the Zn0.2Cd0.8S solid solution.

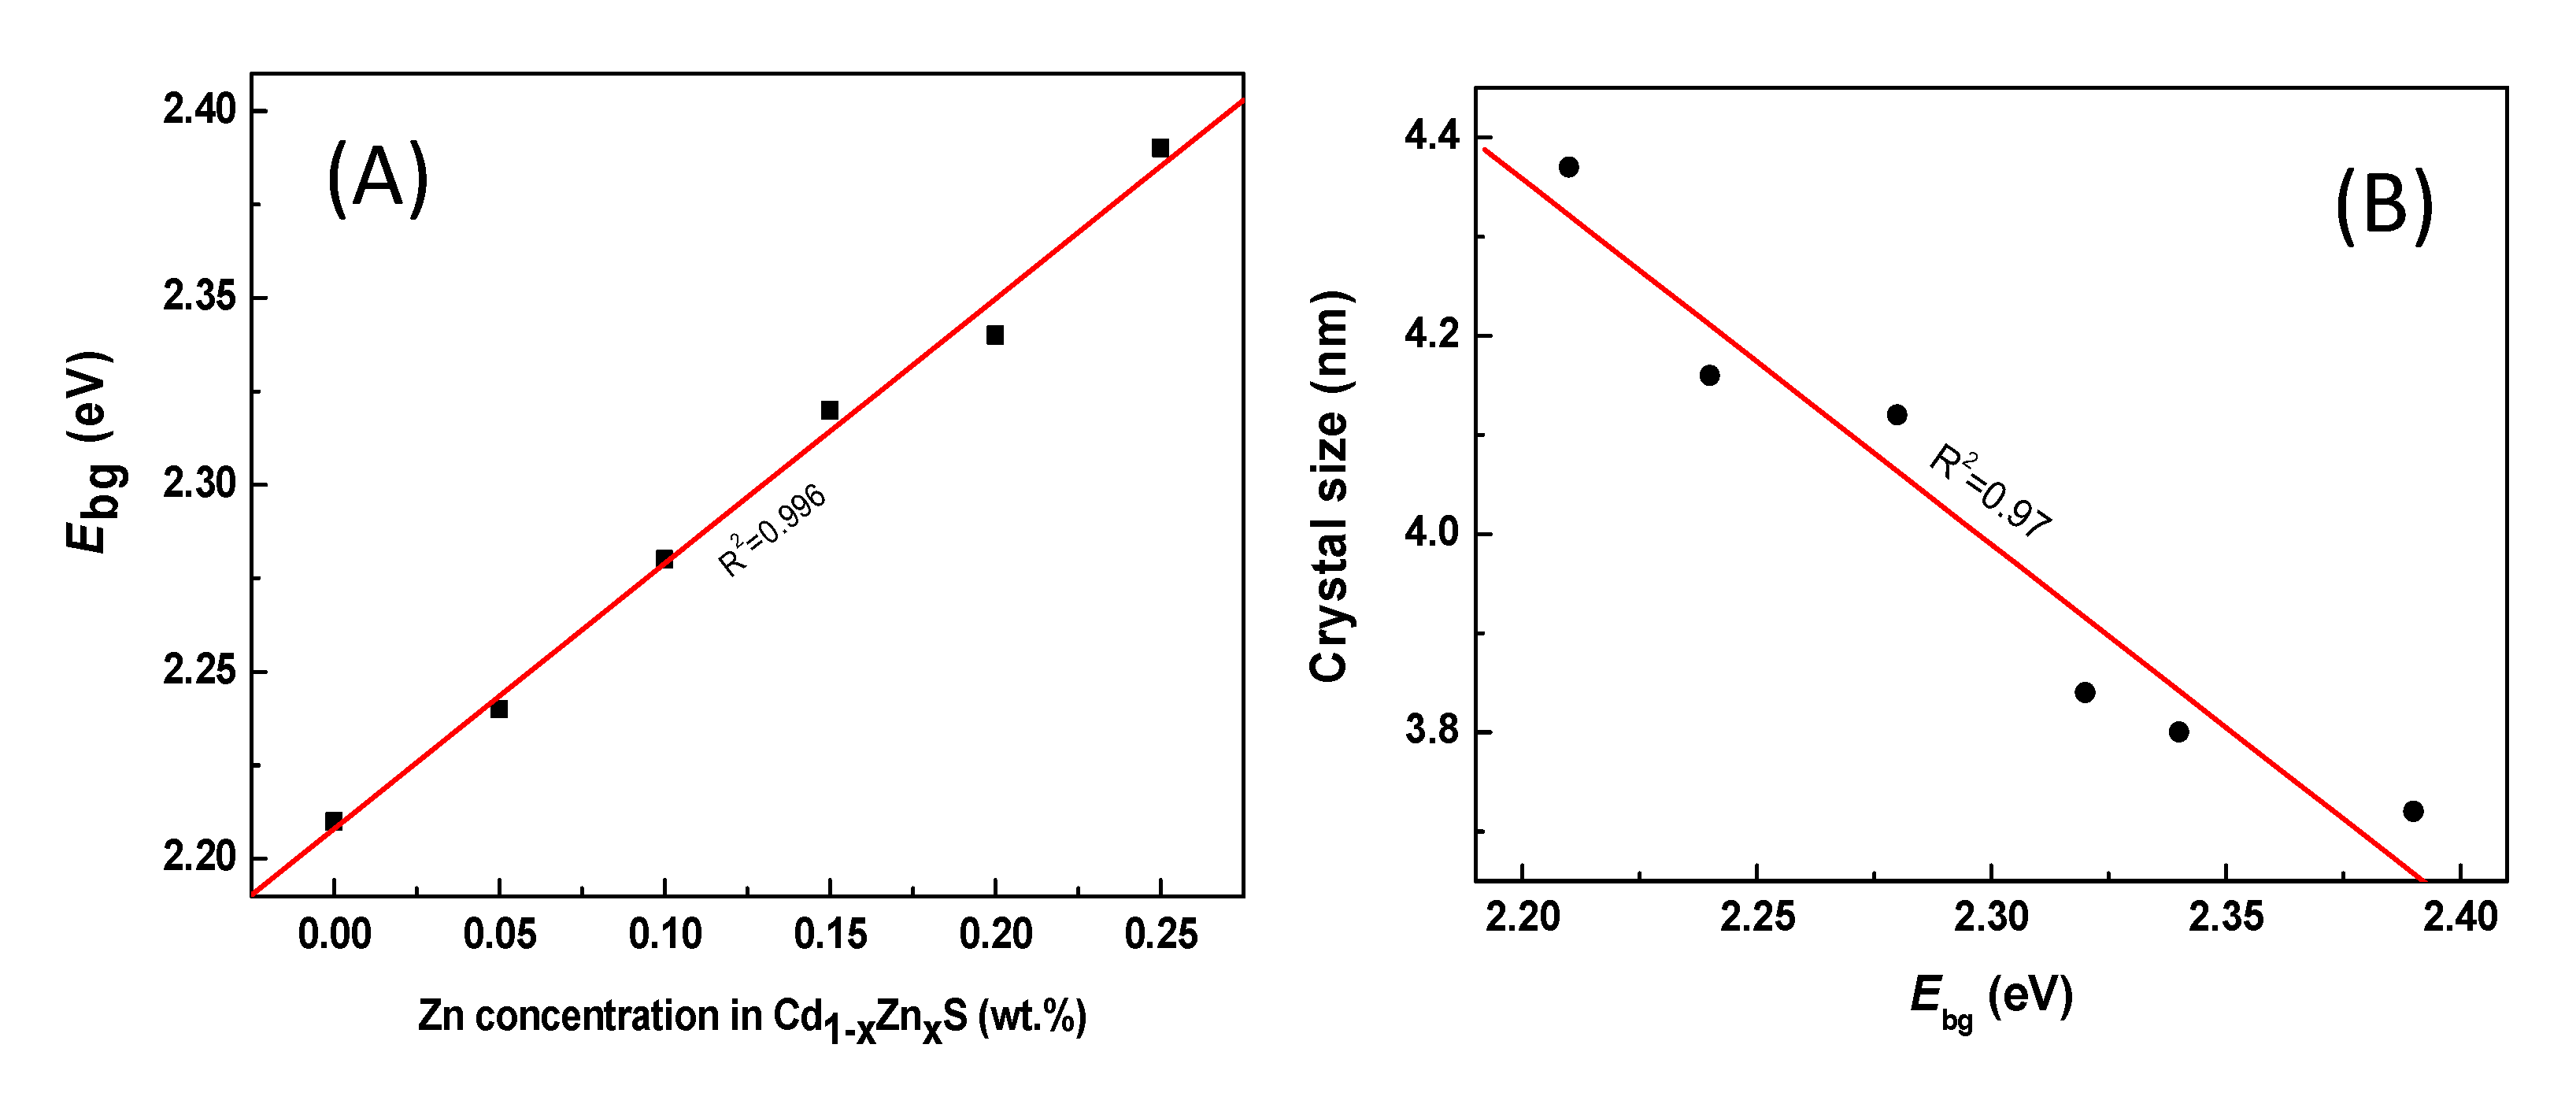
3.1.4. UV–Vis Diffuse Reflectance Spectra (UV–Vis DRS)

To obtain the electronic properties of synthesized materials, the study of UV–Vis diffuse reflectance spectroscopy was performed. The semiconductor nature of CdS and ZnS causes a response under stimulation by light in the visible region for CdS (near 600 nm) and in the range of soft or intermediate UV for ZnS (200–340 nm). All the photocatalyst samples show a similar absorption edge with differences in the absorption edge position depending on the concentration of Zn in the ZnxCd1−xS solid solution. From the UV–Vis spectra shown in Figure 10A, it is possible to observe that the absorption edges of ZnxCd1−xS photocatalysts gradually shift from 570 nm to 540 nm as the Zn concentration increases. All visible radiation found after 600 nm is reflected by the material, providing the characteristic color of these compounds, from orange to yellow (Figure 10C) which is in line with what was obtained in the UV–Vis spectra. It should be mentioned that, in the case of samples of ZnxCd1−xS and pure CdS synthesized in this work, the energy widths of the prohibited band are expected to be less than 2.4 eV (reported for CdS bulk [54]) because of the crystalline quality and the small crystallite size that promotes changes in the energy gap, as will be discussed below.
For the semiconductors, such as ZnxCd1.xS, the absorption edge is defined as the charge transition between the highest nearly filled band and the lowest nearly empty band. Their optical bands can be calculated by the following equation:
αhν = A(hν − Ebg)n
where α is the absorption coefficient, h is Planck’s constant, ν is the photon frequency, A is the probability parameter for the transition, Ebg is the optical bandgap and n = 2 for direct allowed transition, as is the case for these semiconductor solid solutions.
Figure 10B shows the (αhν)2 values versus for synthetized ZnxCd1−xS photocatalysts. The energy bandwidth (ΔEbg) of the pure CdS and ZnxCd1−xS samples, which were calculated from the slope of the Tauc’s plot, are listed in Table 1. As can be observed, the energy band gap increases linearly with an increase in the Zn concentration (Figure 11A). This quantification of the energy gap confirms the trend observed qualitatively in the spectra of Figure 10A. The observed changes in the gap of the ZnxCd1−xS solid solutions might be caused by variations in the insertion of Zn in the structure of CdS (Figure 11A), as well as by changes in the degree of order associated with the crystalline size of the material. The size of the CdS and ZnxCd1−xS solid solutions directly affect the energy band gap. For the solid solution prepared by the sonochemical method, the band gap energy increased when the crystalline size decreased. As can be seen in Figure 11B, there is a linear correlation between the ZnxCd1−xS crystal size and the band gap energies. The energy band gap of the CdS and ZnxCd1−xS solid solutions are in the 2.21–2.39 eV range. These values are much lower than those reported for the bulk CdS [55].

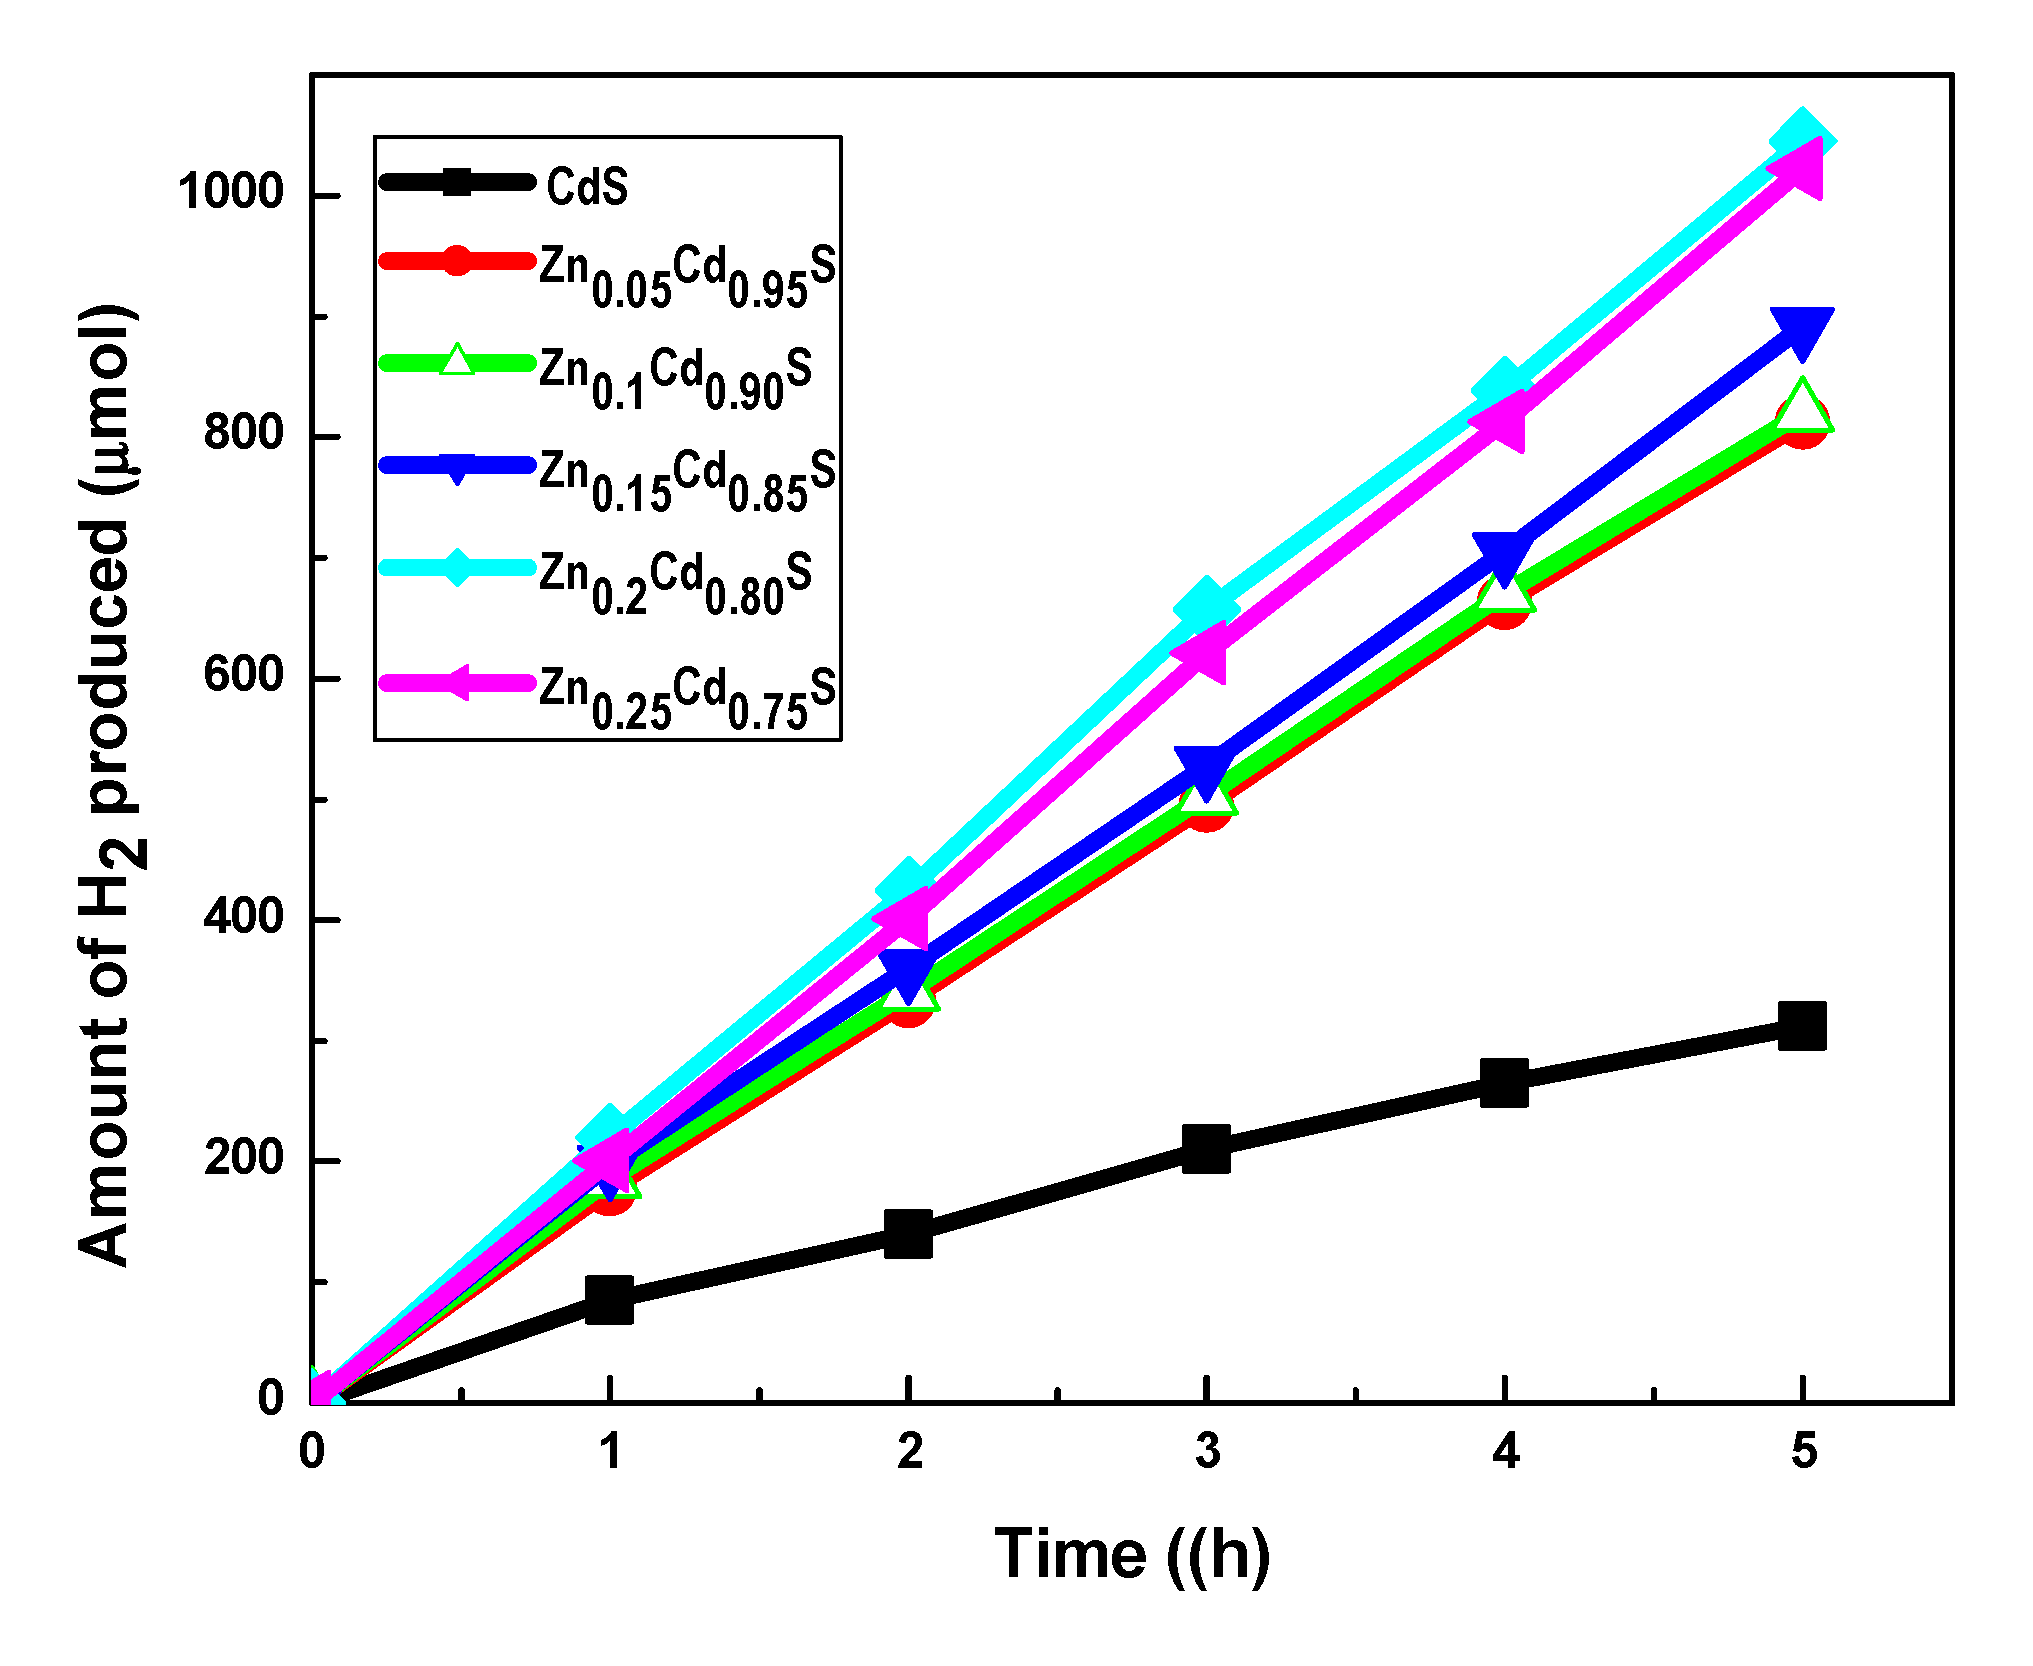
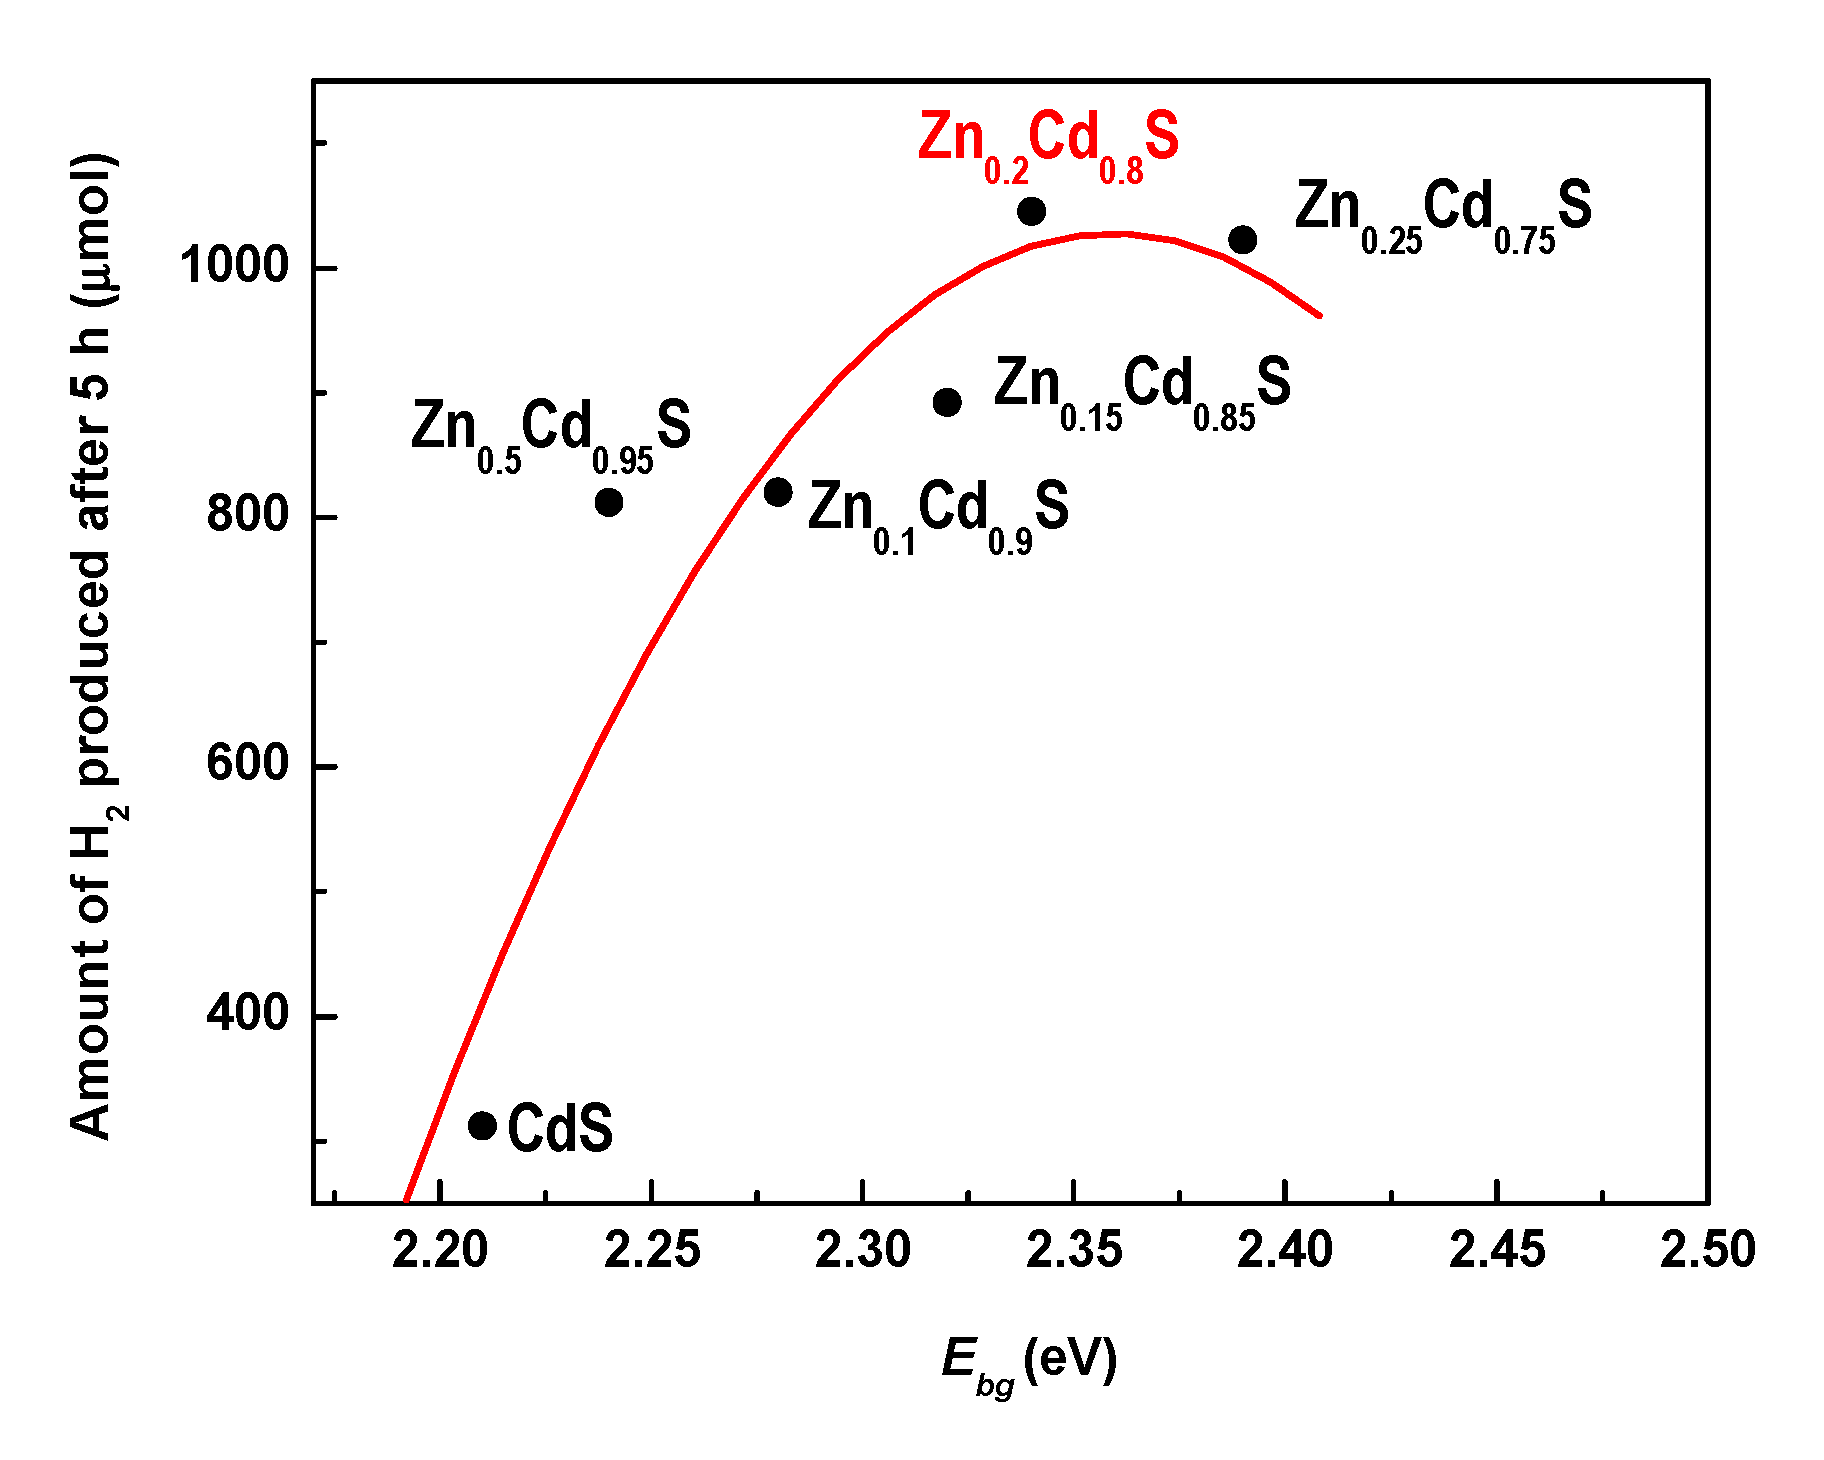
3.2. Photocatalytic Activity–Structure Correlation

The photoeficiency of the pure CdS and ZnxCd1−xS photocatalysts was evaluated in hydrogen production via a water-splitting reaction under visible light irradiation (λ = 420 nm). The reaction was carried out at room temperature in aqueous solution containing Na2SO3 and Na2S as sacrificial reagents. In the control experiments, in pure Na2S/Na2SO3 solutions, no hydrogen evolution was observed neither in the absence of visible light radiation nor photocatalysts.
The hydrogen evolution rate as a function of the irradiation time is shown in Figure 12. As can be seen, the pure CdS photocatalyst shows low photoactivity and H2 evolution increases going from CdS to Zn0.2Cd0.8S photocatalyst. The amount of hydrogen production increases as the Zn concentration in solid solutions is gradually increased from 0.05 to 0.2 wt.%. A further increase in Zn concentration (0.25), however, led to a slight reduction of hydrogen production as compared the 0.2 Zn concentration sample. A similar limitation of the Zn content (up to 0.3) in the solid solution was observed previously for the catalysts prepared by coprecipitation of CdS and ZnS from aqueous solutions of Cd2+ (Cd(CH3COO)2 2H2O) and Zn2+ (Zn(CH3COO)2·2H2O) at 298 K using Na2S as a precipitating agent [30]. In this work, the decrease in the hydrogen production going from Zn0.2Cd0.8S to Zn0.25Cd0.75S was the reason that the catalysts with the higher Zn concentration were not prepared. In addition, one might expect that an increase in Zn concentration might to lead to an undesired increase in the band gap energy, shifting the catalyst absorption capacity out of the visible light region.
As it has been mentioned, the photocatalytic performance of CdS-based semiconductors is related to their structural (size, crystalline structure and morphology) and electronic characteristics (Ebg and DOS distribution). In the case of photocatalysts based on CdS in which Zn is incorporated into the crystalline network, the electronic properties of the resulting solid solution depend on the substitution degree. The incorporation of Zn into the CdS lattice by the sonochemical-assisted method generates nanocrystals of small sizes (about 4 nm) in which the incorporation of the Zn was homogeneous, according to the results obtained by XRD (Figure 1), TEM (Figure 3 and Figure 4) and HAADF-STEM (Figure 5, Figure 6 and Figure 7). However, the properties of the ZnxCd1−xS solid solutions related to their crystalline quality determine the grain boundary effects, electronic effects related to electronic transfer and charge polarization, among others. The observed changes in the gap of the ZnxCd1−xS solid solutions might be caused by variations in the insertion of Zn in the structure of CdS (Figure 10A) as well as changes in the order degree associated with the crystalline size of the material. Indeed, a linear correlation between the ZnxCd1−xS crystal size and the band gap energies was observed in this work (see Figure 10B).
It is known that the presence of meso- and macroporosity in the photocatalysts, together with low crystallite size, facilitate the diffusion of molecules and improve the photoactivity [56]. The longitudinal modes obtained with the Raman technique (Figure 8) show that incorporation of Zn in the CdS lattice is substitutional, forming Cd-S-Zn-type bonding in the sulfide structure, with the exciton-phonon coupling strength being highest for the Zn0.2Cd0.8S sample. The TEM micrographs of the ZnxCd1−xS samples (Figure 3 and Figure 4) prepared by the sonochemical-assisted method show that the synthesized materials have more defects in the crystalline network when compared to the precipitation method [2,4,56,57] where the number of defects is quite considerable.
The correlation between the total H2 production at 5 h and the energy band gap of the pure CdS and ZnxCd1−xS solid solutions is clearly seen in Figure 13. DRS UV–Vis data strongly suggest that the observed difference in the catalyst’s activities could be mainly due to their different capacities for visible light absorption, as deduced from the changes in the band gap energy originated by incorporation of Zn into the structure of CdS. The H2 production increases linearly with an increase in the energy band gap up to 2.34 eV (Zn0.25Cd0.75S) and then decreases for the Zn0.25Cd0.75S catalyst showing the highest energy band gap among the catalysts studied (2.39 eV). For the latter catalyst, one might deduce that the visible light does not have the sufficient capacity to excite the electrons from the valence band to the conduction band of the corresponding ZnS states in the ZnxCd1−xS solid solution. The highest hydrogen evolution rate was achieved with Zn0.2Cd0.8S, which can be explained by considering the higher degree of Zn insertion in the CdS lattice of this photocatalyst.
Table 3 reveals the importance of the catalyst morphology and preparation method for the final catalyst behavior by comparison of H2 evolution of the unsupported and SBA-15(16)-supported Zn0.2Cd0.8S catalysts [4,28]. Contrary to expectations, the catalysts supported on ordered mesoporous silica materials (SBA-15 and SBA-16) exhibited a lower H2 evolution than unsupported ones tested in the same reaction conditions. This is a surprising result because it is generally recognized that the bulk photocatalysts exhibit easy carrier migration, trapping and recombination inside the bulks [58]. The enhancement of H2 production over unsupported catalysts with respect to supported ones suggests that the morphology of the bulk Zn0.2Cd0.8S catalyst allows the surface redox reaction instead of recombination inside the bulks [59]. Therefore, we conclude that the specific 3D hierarchical morphology of unsupported catalysts might contribute to their photocatalytic behavior, favoring the accessibility of the visible light to the active phase. Similarly, higher H2 evolution on Zn0.2Cd0.8S/SBA-16 with respect to Zn0.2Cd0.8/SBA-16 can also be explained as being due to their 3D and 2D structures, respectively [4,28]. In this case, the confinement of the ZnxCd1−xS nanoparticles within the 3D porous support structure might favor active phase dispersion and provide a certain degree of protection for photocatalysts by protecting them from photocorrosion and/or agglomeration [4,28]. Finally, the heterojunction formed between ZnS and CdS phases and the formation of subsurface/surface defects allows for more effective utilization of the electron/hole energy carriers. For the most optimized Zn0.2Cd0.8S solid solution, the preferential orientation of the (111) plane, optimal band gap and small crystallite size play an important role in the photocatalytic process. Finally, the presence of the sacrificial agent in the aqueous solution participated in the overall catalyst photoactivity. It has been well documented that sacrificial agents effectively prevent the photocorrosion of sulfide catalysts participating in the reaction mechanism [48]. In this sense, the recent study by Huang et al. demonstrated a significant increase in the H2 evolution rate with an increase in S2−/SO32− ion concentration in solution, suggesting that the photogenerated holes (h+) were consumed by the less stable S2− ions [60]. In other words, the differences in hole consumption by Na2S/Na2SO3 on ZnxCd1−xS solid solutions might occur and they can be derived from differences in the presence of sulfur vacancies on the surface of solid solutions affected by the concentration of Zn in the solution. Therefore, the possibility for the consumption of holes on sulfur vacancies could increase as the particle size of ZnxCd1−xS solid solutions decreases. The comparison of photoactivity with the particle size of ZnxCd1−xS solid solutions follows the expected trend and the smaller particle size of the solid solutions with a Zn content of 0.2–0.25 wt.%, which was translated into an increased hydrogen production.

4. Conclusions

The present paper describes the successful preparation of nanosized ZnxCd1−xS photocatalysts using ultrasonic radiation. The catalysts exhibited an increased amount of subsurface/surface defects due to the formation of morphology, which overcame the negative effect of an increase in the energy band gap originated by ZnS incorporation into CdS. The most optimized Zn0.2Cd0.8S solid solution was more effective toward hydrogen production via a visible light-driven water-splitting reaction than SBA-15(16)-supported ones prepared by coprecipitation. Dispersive Raman spectroscopy and XRD show that the incorporation of Zn in the network is carried out, resulting in lattice compression within the framework. The synthesis of ZnxCd1−xS photocatalysts assisted by ultrasonic radiation promotes the formation of smaller crystallite sizes compared to the coprecipitation method. The presence of Zn incorporated in the structure of the CdS significantly increases its catalytic photoactivity. Changes in the optical properties of the catalysts (band gap size), of ZnxCd1−xS nanoparticles derived from the different size and insertion of Zn in the CdS lattice play an important role in the photoactivity, with Zn0.2Cd0.8S being the most optimized one.

Author Contributions

Conceptualization, R.N. and M.d.l.Á.C.H.; data curation, O.S.Y.S., R.M.N. and C.E.O.G.; formal analysis, L.F.M.M., R.N., M.d.l.Á.C.H., O.S.Y.S., B.P., R.M.N. and C.E.O.G.; funding acquisition, R.N. and M.d.l.Á.C.H.; investigation, L.F.M.M., R.N. and M.d.l.Á.C.H.; methodology, L.F.M.M., R.N. and M.d.l.Á.C.H.; supervision, M.d.l.Á.C.H. and R.N.; writing—original draft, L.F.M.M. and M.d.l.Á.C.H.; writing—review & editing, M.d.l.Á.C.H., B.P. and R.M.N. All authors have read and agreed to the published version of the manuscript.

Funding

This research was funded by FOFI-UAQ2018 project (México) and received partial funding from Spanish Ministry of Science, Innovation and Universities (CTQ2016-76505-C3-1 project).

Acknowledgments

The author L.F. Morelos-Medina thanks the doctoral fellowship provided by CONACYT. We are very grateful to B. Flores and J. Santos for the technical helping in Raman and UV-Vis characterization. We acknowledge support of the publication fee by the CSIC Open Access Publication Support Initiative through its Unit of Information Resources for Research (URICI).

Conflicts of Interest

The authors declare no conflict of interest.

References

  1. Zhang, Y.-H.P.; Mielenz, J.R. Renewable Hydrogen Carrier—Carbohydrate: Constructing the Carbon-Neutral Carbohydrate Economy. Energies 2011, 4, 254–275. [Google Scholar] [CrossRef] [Green Version]
  2. Zhang, J.; Zhang, Q.; Wang, L.; Li, X.; Huang, W. Interface induce growth of intermediate layer for bandgap engineering insights into photoelectrochemical water splitting. Sci. Rep. 2016, 6, 27241. [Google Scholar] [CrossRef] [Green Version]
  3. Kimi, M.; Yuliati, L.; Shamsuddin, M. Photocatalytic hydrogen production under visible light over Cd0.1SnxZn0.9−2xS solid solution photocatalysts. Int. J. Hydrog. Energy 2011, 36, 9453–9461. [Google Scholar] [CrossRef]
  4. Macías-Sánchez, S.; Nava, R.; Hernández-Morales, V.; Acosta-Silva, Y.; Pawelec, B.; Al-Zahrani, S.; Navarro, R.; Fierro, J. Cd1−xZnxS supported on SBA-16 as photocatalysts for water splitting under visible light: Influence of Zn concentration. Int. J. Hydrog. Energy 2013, 38, 11799–11810. [Google Scholar] [CrossRef]
  5. Maréchal, Y. The Hydrogen Bond and the Water Molecule: The Physics and Chemistry of Water, Aqueous and Bio-Media; Elsevier Science: Amsterdam, The Netherlands, 2007; pp. 311–318. ISBN 9780444519573. [Google Scholar]
  6. Jacobsson, T.J.; Fjallstrom, V.; Edoff, M.; Edvinsson, T. Sustainable solar hydrogen production: From photoelectrochemical cells to PV-electrolyzers and back again. Energy Environ. Sci. 2014, 7, 2056–2070. [Google Scholar] [CrossRef]
  7. Kudo, A.; Miseki, Y. Heterogeneous photocatalyst materials for water splitting. Chem. Soc. Rev. 2009, 38, 253–278. [Google Scholar] [CrossRef] [PubMed]
  8. Osterloh, F.E. Inorganic Materials as Catalysts for Photochemical Splitting of Water. Chem. Mater. 2008, 20, 35–54. [Google Scholar] [CrossRef]
  9. Fujishima, A.; Honda, K. Electrochemical Photolysis of Water at a Semiconductor Electrode. Nat. Cell Biol. 1972, 238, 37–38. [Google Scholar] [CrossRef] [PubMed]
  10. Li, X.; Yu, J.; Low, J.; Fang, Y.; Xiao, J.; Chen, X. Engineering heterogeneous semiconductors for solar water splitting. J. Mater. Chem. A 2015, 3, 2485–2534. [Google Scholar] [CrossRef]
  11. Ji, L.; McDaniel, M.D.; Wang, S.; Posadas, A.B.; Li, X.; Huang, H.; Lee, J.C.; Demkov, A.A.; Bard, A.J.; Ekerdt, J.G.; et al. A silicon-based photocathode for water reduction with an epitaxial SrTiO3 protection layer and a nanostructured catalyst. Nat. Nanotechnol. 2014, 10, 84–90. [Google Scholar] [CrossRef] [PubMed]
  12. Mohamed, A.M.; Aljaber, A.S.; AlQaradawi, S.Y.; Allam, N.K. TiO2 nanotubes with ultrathin walls for enhanced water splitting. Chem. Commun. 2015, 51, 12617–12620. [Google Scholar] [CrossRef] [PubMed]
  13. Mor, G.K.; Prakasam, H.E.; Varghese, O.K.; Shankar, K.; Grimes, C.A. Vertically Oriented Ti−Fe−O Nanotube Array Films: Toward a Useful Material Architecture for Solar Spectrum Water Photoelectrolysis. Nano Lett. 2007, 7, 2356–2364. [Google Scholar] [CrossRef] [PubMed]
  14. Zhang, D.; Tang, Y.; Qiu, X.; Yin, J.; Su, C.; Pu, X. Use of synergistic effects of the co-catalyst, p-n heterojunction, and porous structure for improvement of visible-light photocatalytic H2 evolution in porous Ni2O3/Mn0.2Cd0.8S/Cu3P@Cu2S. J. Alloys Compd. 2020, 845, 155569. [Google Scholar] [CrossRef]
  15. Patidar, D.; Sharma, R.; Jain, N.; Sharma, T.P.; Saxena, N. Optical properties of CdS sintered film. Bull. Mater. Sci. 2006, 29, 21–24. [Google Scholar] [CrossRef] [Green Version]
  16. Kumar, V.; Gaur, J.K.; Sharma, M.K.; Sharma, T.P. Electrical properties of cadmium telluride screen printed films for photovoltaic application. Chalcogenide Lett. 2008, 5, 171–176. [Google Scholar]
  17. Li, Q.; Guo, B.; Yu, J.; Ran, J.; Zhang, B.; Yan, H.; Gong, J.R. Highly Efficient Visible-Light-Driven Photocatalytic Hydrogen Production of CdS-Cluster-Decorated Graphene Nanosheets. J. Am. Chem. Soc. 2011, 133, 10878–10884. [Google Scholar] [CrossRef] [PubMed]
  18. Xiang, Q.; Cheng, B.; Yu, J. Hierarchical porous CdS nanosheet-assembled flowers with enhanced visible-light photocatalytic H2-production performance. Appl. Catal. B Environ. 2013, 138-139, 299–303. [Google Scholar] [CrossRef]
  19. Navarro, R.M.; Sánchez-Sánchez, M.C.; Alvarez-Galvan, M.C.; Del Valle, F.; Fierro, J.L.G. Hydrogen production from renewable sources: Biomass and photocatalytic opportunities. Energy Environ. Sci. 2009, 2, 35–54. [Google Scholar] [CrossRef]
  20. Joishy, S.; Hebbar, D.N.; Kulkarni, S.D.; Rao, G.K.; Rajendra, B. Band structure controlled solid solution of spray deposited Cd1-x ZnxS films: Investigation on photoluminescence and photo response properties. Phys. B Condens. Matter 2020, 586, 412143. [Google Scholar] [CrossRef]
  21. Bhatt, A.N.; Verma, U.K.; Kumar, B. Temporal evolution of white light emitting CdS core and Cd1-xZnxS graded shell quantum dots fabricated using single step non-injection technique. Opt. Mater. 2019, 92, 143–149. [Google Scholar] [CrossRef]
  22. Kozlova, E.A.; Parmon, V.N. Chapter 10. Semiconductor Photocatalysts Based on Nanostructured Cd1−Zn S Solid Solutions in the Reaction of Hydrogen Evolution from Aqueous Solutions of Inorganic Electron Donors under Visible Light. Adv. Nanomater. Catal. Energy 2019, 357–391. [Google Scholar] [CrossRef]
  23. Ye, Z.; Kong, L.; Chen, F.; Chen, Z.; Lin, Y.; Liu, C. A comparative study of photocatalytic activity of ZnS photocatalyst for degradation of various dyes. Optik 2018, 164, 345–354. [Google Scholar] [CrossRef]
  24. Kozlova, E.A.; Lyulyukin, M.N.; Markovskaya, D.V.; Selishchev, D.; Cherepanova, S.V.; Kozlov, D.V. Synthesis of Cd1−xZnxS photocatalysts for gas-phase CO2 reduction under visible light. Photochem. Photobiol. Sci. 2019, 18, 871–877. [Google Scholar] [CrossRef]
  25. Xing, C.; Zhang, Y.; Yan, W.; Guo, L. Band structure-controlled solid solution of Cd1-xCd1-x ZnxSZnxS photocatalyst for hydrogen production by water splitting. Int. J. Hydrog. Energy 2006, 31, 2018–2024. [Google Scholar] [CrossRef]
  26. Macías-Sánchez, S.; Nava-Mendoza, R.; Hernández-Morales, V.; Acosta-Silva, Y.; Gómez-Herrera, L.; Pawelec, B.; Al-Zahrani, S.M.; Navarro, R.; Fierro, J.L.G. Cd1−xZnxS solid solutions supported on ordered mesoporous silica (SBA-15): Structural features and photocatalytic activity under visible light. Int. J. Hydrog. Energy 2012, 37, 9948–9958. [Google Scholar] [CrossRef]
  27. Villoria, J.A.; Navarro, R.; Al-Zahrani, S.M.; Fierro, J.L.G.; Al-Zahrani, S.M. Photocatalytic Hydrogen Production on Cd1−xZnxS Solid Solutions under Visible Light: Influence of Thermal Treatment. Ind. Eng. Chem. Res. 2010, 49, 6854–6861. [Google Scholar] [CrossRef]
  28. Del Valle, F.; Ishikawa, A.; Domen, K.; De La Mano, J.V.; Sanchez-Sanchez, M.; González, I.; Herreras, S.; Mota, N.; Rivas, M.; Álvarez-Galván, M.C. Influence of Zn concentration in the activity of Cd1−xZnxS solid solutions for water splitting under visible light. Catal. Today 2009, 143, 51–56. [Google Scholar] [CrossRef]
  29. Sasikala, G.; Dhanasekaran, R.; Subramanian, C. Electrodeposition and optical characterisation of CdS thin films on ITO-coated glass. Thin Solid Films 1997, 302, 71–76. [Google Scholar] [CrossRef]
  30. Singh, V.P. Nano-structured CdTe, CdS and TiO2 for thin film solar cell applications. Sol. Energy Mater. Sol. Cells 2004, 82, 315–330. [Google Scholar] [CrossRef]
  31. Yavuz, N.; Yuksel, S.A.; Karsli, A.; Günes, S. Inverted structure hybrid solar cells using CdS thin films. Sol. Energy Mater. Sol. Cells 2013, 116, 224–230. [Google Scholar] [CrossRef]
  32. Mahmood, W.; Shah, N.A. CdZnS thin films sublimated by closed space using mechanical mixing: A new approach. Opt. Mater. 2014, 36, 1449–1453. [Google Scholar] [CrossRef]
  33. Mooney, J.B.; Radding, S.B. Spray Pyrolysis Processing. Annu. Rev. Mater. Res. 1982, 12, 81–101. [Google Scholar] [CrossRef]
  34. Ma, Y.Y.; Bube, R.H. Properties of CdS Films Prepared by Spray Pyrolysis. J. Electrochem. Soc. 1977, 124, 1430–1435. [Google Scholar] [CrossRef]
  35. Baykul, M.; Orhan, N. Band alignment of Cd(1−x)ZnxS produced by spray pyrolysis method. Thin Solid Films 2010, 518, 1925–1928. [Google Scholar] [CrossRef]
  36. Hu, Y.; Liu, Y.; Qian, H.; Li, Z.; Chen, J. Coating Colloidal Carbon Spheres with CdS Nanoparticles: Microwave-Assisted Synthesis and Enhanced Photocatalytic Activity. Langmuir 2010, 26, 18570–18575. [Google Scholar] [CrossRef] [PubMed]
  37. Gedanken, A. Using sonochemistry for the fabrication of nanomaterials. Ultrason. Sonochem. 2004, 11, 47–55. [Google Scholar] [CrossRef] [PubMed]
  38. Suslick, K.S. Sonochemistry. Science 1990, 247, 1439–1445. [Google Scholar] [CrossRef] [PubMed]
  39. Wang, G.; Chen, W.; Liang, C.; Wang, Y.; Meng, G.; Zhang, L. Preparation and characterization of CdS nanoparticles by ultrasonic irradiation. Inorg. Chem. Commun. 2001, 4, 208–210. [Google Scholar] [CrossRef]
  40. Ghows, N.; Entezari, M. A novel method for the synthesis of CdS nanoparticles without surfactant. Ultrason. Sonochem. 2011, 18, 269–275. [Google Scholar] [CrossRef]
  41. Zak, A.K.; Majid, W.A.; Abrishami, M.E.; Yousefi, R. X-ray analysis of ZnO nanoparticles by Williamson–Hall and size–strain plot methods. Solid State Sci. 2011, 13, 251–256. [Google Scholar] [CrossRef]
  42. Kubelka, P. New Contributions to the Optics of Intensely Light-Scattering Materials Part I. J. Opt. Soc. Am. 1948, 38, 448. [Google Scholar] [CrossRef]
  43. Borja-Urby, R.; Diaz-Torres, L.A.; Garcia-Martinez, I.; Uribe, D.B.; Casillas, G.; Ponce, A.; Jose-Yacaman, M. Crystalline and narrow band gap semiconductor BaZrO3: Bi–Si synthesized by microwave–hydrothermal synthesis. Catal. Today 2015, 250, 95–101. [Google Scholar] [CrossRef]
  44. Munir, S.; Shah, S.M.; Hussain, H.; Khan, R.A. Effect of carrier concentration on the optical band gap of TiO2 nanoparticles. Mater. Des. 2016, 92, 64–72. [Google Scholar] [CrossRef]
  45. Barajas-Ledesma, E.; García-Benjume, M.; Espitia-Cabrera, I.; Ortiz-Gutiérrez, M.; Espinoza-Beltrán, F.; Mostaghimi, J.; Contreras-García, M. Determination of the band gap of TiO2–Al2O3 films as a function of processing parameters. Mater. Sci. Eng. B 2010, 174, 71–73. [Google Scholar] [CrossRef]
  46. Nayeem, A.; Yadaiah, K.; Vajralingam, G.; Mahesh, P.; Nagabhooshanam, M. Structural characterization of co-precipitated Cd1-xZnxS: Cu crystals. Int. J. Mod. Phys. B 2002, 16, 481–496. [Google Scholar] [CrossRef]
  47. Schüth, F.; Wingen, A.; Sauer, J. Oxide loaded ordered mesoporous oxides for catalytic applications. Microporous Mesoporous Mater. 2001, 44, 465–476. [Google Scholar] [CrossRef]
  48. Reber, J.F.; Meier, K. Photochemical production of hydrogen with zinc sulfide suspensions. J. Phys. Chem. 1984, 88, 5903–5913. [Google Scholar] [CrossRef]
  49. International Centre for Diffraction Data, 12 Campus Blvd, Newtown Square, PA 19073, USA, ICSD file #081925. Available online: https://www.icdd.com/ (accessed on 5 October 2020).
  50. Wang, W.; Zhu, W.; Xu, H. Monodisperse, Mesoporous ZnxCd1−xS Nanoparticles as Stable Visible-Light-Driven Photocatalysts. J. Phys. Chem. C 2008, 112, 16754–16758. [Google Scholar] [CrossRef]
  51. Environmental Chemistry. Periodic Table of Elements. Available online: https://environmentalchemistry.com/yogi/periodic/ionicradius (accessed on 15 May 2012).
  52. Ichimura, M.; Furukawa, T.; Shirai, K.; Goto, F. Raman and photoluminescence characterizations of electrochemically deposited ZnxCd1—xS layers. Mater. Lett. 1997, 33, 51–55. [Google Scholar] [CrossRef]
  53. Patel, N.H. Structural And Magnetic Properties Of Undoped And Mn Doped CdS Nanoparticles Prepared By Chemical Co-Precipitation Method. Adv. Mater. Lett. 2014, 5, 671–677. [Google Scholar] [CrossRef]
  54. Metin, H.; Sat, F.; Erat, S.; Ari, M. Cadmium Sulfide Thin Films grown by CBD: The effect of thermal annealing on the structural, electrical and optical properties. J. Optoelectron. Adv. Mater. 2008, 10, 2622. [Google Scholar]
  55. Prabhu, R.R.; Khadar, M.A. Study of optical phonon modes of CdS nanoparticles using Raman spectroscopy. Bull. Mater. Sci. 2008, 31, 511–515. [Google Scholar] [CrossRef]
  56. Navarro, R.M.; Alvarez-Galván, M.C.; De La Mano, J.A.V.; Al-Zahrani, S.M.; Fierro, J.L.G. A framework for visible-light water splitting. Energy Environ. Sci. 2010, 3, 1865–1882. [Google Scholar] [CrossRef]
  57. Ramaiah, K.S.; Pilkington, R.; Hill, A.; Tomlinson, R.; Bhatnagar, A.K. Structural and optical investigations on CdS thin films grown by chemical bath technique. Mater. Chem. Phys. 2001, 68, 22–30. [Google Scholar] [CrossRef]
  58. Sabio, E.M.; Chamousis, R.L.; Browning, N.D.; Osterloh, F.E. Photocatalytic Water Splitting with Suspended Calcium Niobium Oxides: Why Nanoscale is Better than Bulk—A Kinetic Analysis. J. Phys. Chem. C 2012, 116, 3161–3170. [Google Scholar] [CrossRef]
  59. Li, L.; Yan, J.; Wang, T.; Zhao, Z.-J.; Zhang, J.; Gong, J.; Guan, N. Sub-10 nm rutile titanium dioxide nanoparticles for efficient visible-light-driven photocatalytic hydrogen production. Nat. Commun. 2015, 6, 5881. [Google Scholar] [CrossRef]
  60. Huang, H.-B.; Fang, Z.-B.; Yu, K.; Lü, J.; Cao, R. Visible-light-driven photocatalytic H2 evolution over CdZnS nanocrystal solid solutions: Interplay of twin structures, sulfur vacancies and sacrificial agents. J. Mater. Chem. A 2020, 8, 3882–3891. [Google Scholar] [CrossRef]
Figure 1. XRD patterns of CdS (a) and ZnxCd1−xS samples: x = 0.05 (b), 0.10 (c), 0.15 (d), 0.20 (e) and 0.25 (f). Red lines correspond to the CdS (JCPDS 03-065-2887).
Energies 13 05603 g001
Figure 2. SEM images of pure CdS (A,B), Cd0.8Zn0.2S (C,D) and Cd0.75Zn0.15S (E,F) solid solutions.
Energies 13 05603 g002
Figure 3. TEM images of pure CdS (a), Cd0.9Zn0.1S (b) and (c) Cd0.8Zn0.2S solid solutions.
Energies 13 05603 g003
Figure 4. High-resolution transmission electron microscopy (HRTEM) patterns of pure CdS. (a-1) The growth patterns (randomly oriented polycrystalline material), (a-2) the selected portion shows the Fourier Transformed from a-1, and (a-3) shows the interplanar spacing between planes.
Energies 13 05603 g004
Figure 5. HRTEM patterns of Zn0.1Cd0.9S (b,c) and Zn0.2Cd0.8S solid solutions. Diameters of the crystallites (b-1), (c-1), Cd0.9Zn0.1S (b-2), Cd0.8Zn0.2S (c-2), the cubic phase of the CdS (b-3), (c-3).
Energies 13 05603 g005
Figure 6. HAADF images of Zn0.1Cd0.9S solid solution: (a) Zn atomic distribution; (b) Cd atomic distribution and (c) S atomic distribution.
Energies 13 05603 g006
Figure 7. High-angle annular dark field (HAADF) images of Zn0.2Cd0.8S solid solution: (a) Zn atomic distribution; (b) Cd atomic distribution and (c) S atomic distribution.
Energies 13 05603 g007
Figure 8. EDS-STEM for Zn0.2Cd0.8S solid solution with the elementary composition of the analyzed section.
Energies 13 05603 g008
Figure 9. Raman spectra recorded with the 455 nm laser line for pure CdS and ZnxCd1−xS solid solutions: (a) pure CdS; (b) Zn0.05Cd0.95S; (c) Zn0.1Cd0.9S; (d) Zn0.15Cd0.85; (e) Zn0.2Cd0.8S and (f) Zn0.25Cd0.75S.
Energies 13 05603 g009
Figure 10. Diffuse Reflectance (DR) UV–Vis spectra of pure CdS and ZnxCd1−xS solid solutions (A), Tauc’s plots (B) and sample colorings (C).
Energies 13 05603 g010
Figure 11. Energy band gap against Zn concentration in solution (A) and the correlation between the crystal size (from XRD) and Ebg (B).
Energies 13 05603 g011
Figure 12. H2 production as a function of time for pure CdS and ZnxCd1−xS solid solution photocatalysts (0.2 g photocatalyst: 350 W Xe lamp with a cutoff filter (λ > 420 nm), 0.25 M Na2SO3 and 0.35 M Na2S aqueous solutions).
Energies 13 05603 g012
Figure 13. H2 production during 5 h of reaction time against the energy band gap of pure CdS and ZnxCd1−xS solid solutions.
Energies 13 05603 g013
Table 1. Crystallite size (from XRD), wavelength (λ) and energy band gap estimation (ΔEbg) of pure CdS and ZnxCd1−xS solid solutions.
CatalystCrystal Size (nm)λ (nm)ΔEbg (eV)
CdS4.375702.21
Zn0.05Cd0.95S4.165642.24
Zn0.1Cd0.9S4.125582.28
Zn0.15Cd0.15S3.845492.32
Zn0.2Cd0.8S3.805462.34
Zn0.25Cd0.75S3.725412.39
Table 2. Peak position and intensity of undoped and Zn-doped CdS nanoparticles.
Sample1-LO (cm−1)Intensity I1-LO2-LO (cm−1)Intensity I2-LO
CdS294.61270.29595.12137.74
Zn0.05Cd0.95S294.87302.86598.97127.63
Zn0.1Cd0.9S300.25274.03602.56114.90
Zn0.15Cd0.15S303.84248.20606.1596.93
Zn0.2Cd0.8S305.64347.42609.74125.38
Zn0.25Cd0.75S296.10344.27603.96123.97
Table 3. Comparison of some characteristics of unsupported and supported Zn0.2Cd0.8S photocatalysts tested in water-splitting reaction in the same conditions a.
Bulk Zn0.2Cd0.8SZn0.2Cd0.8S/SBA-16Zn0.2Cd0.8S/SBA-15
ReferenceThis work[4][28]
Preparation methodSonochemical coprecipitationThermochemical coprecipitationTermochemical coprecipitation
MorphologyHierarchical 3D morphologyOrdered 3D cage structure with interconnected micro- and mesoporesHexagonal 2D array of long 1D uniform tubular channels; mesoporous structure
H2 production at 5 h [μmol]1045987972
Ebg (eV)2.342.202.23
a Reaction conditions were: Wcat. = 0.2 g, Vsolution = 200 mL, 350 W Xe, visible light irradiation time of 5 h, 0.35 M Na2S/0.25 M Na2SO3 sacrificial agents.
Publisher’s Note: MDPI stays neutral with regard to jurisdictional claims in published maps and institutional affiliations.

