1. Introduction
Recently, nanoporous membranes have received significant attention for their electrical power generation by salinity gradient energy, which is available from the difference in salt concentrations between two aqueous solutions. Nanopores in various nanoporous membranes have ion selectivity when they are filled with an aqueous solution, so that one kind of ions (i.e., cations or anions) can pass better than the other kind. For example, silica nanopores preferably pass cations and not anions, whereas alumina nanopores pass anions better than cations [
1,
2]. As shown in
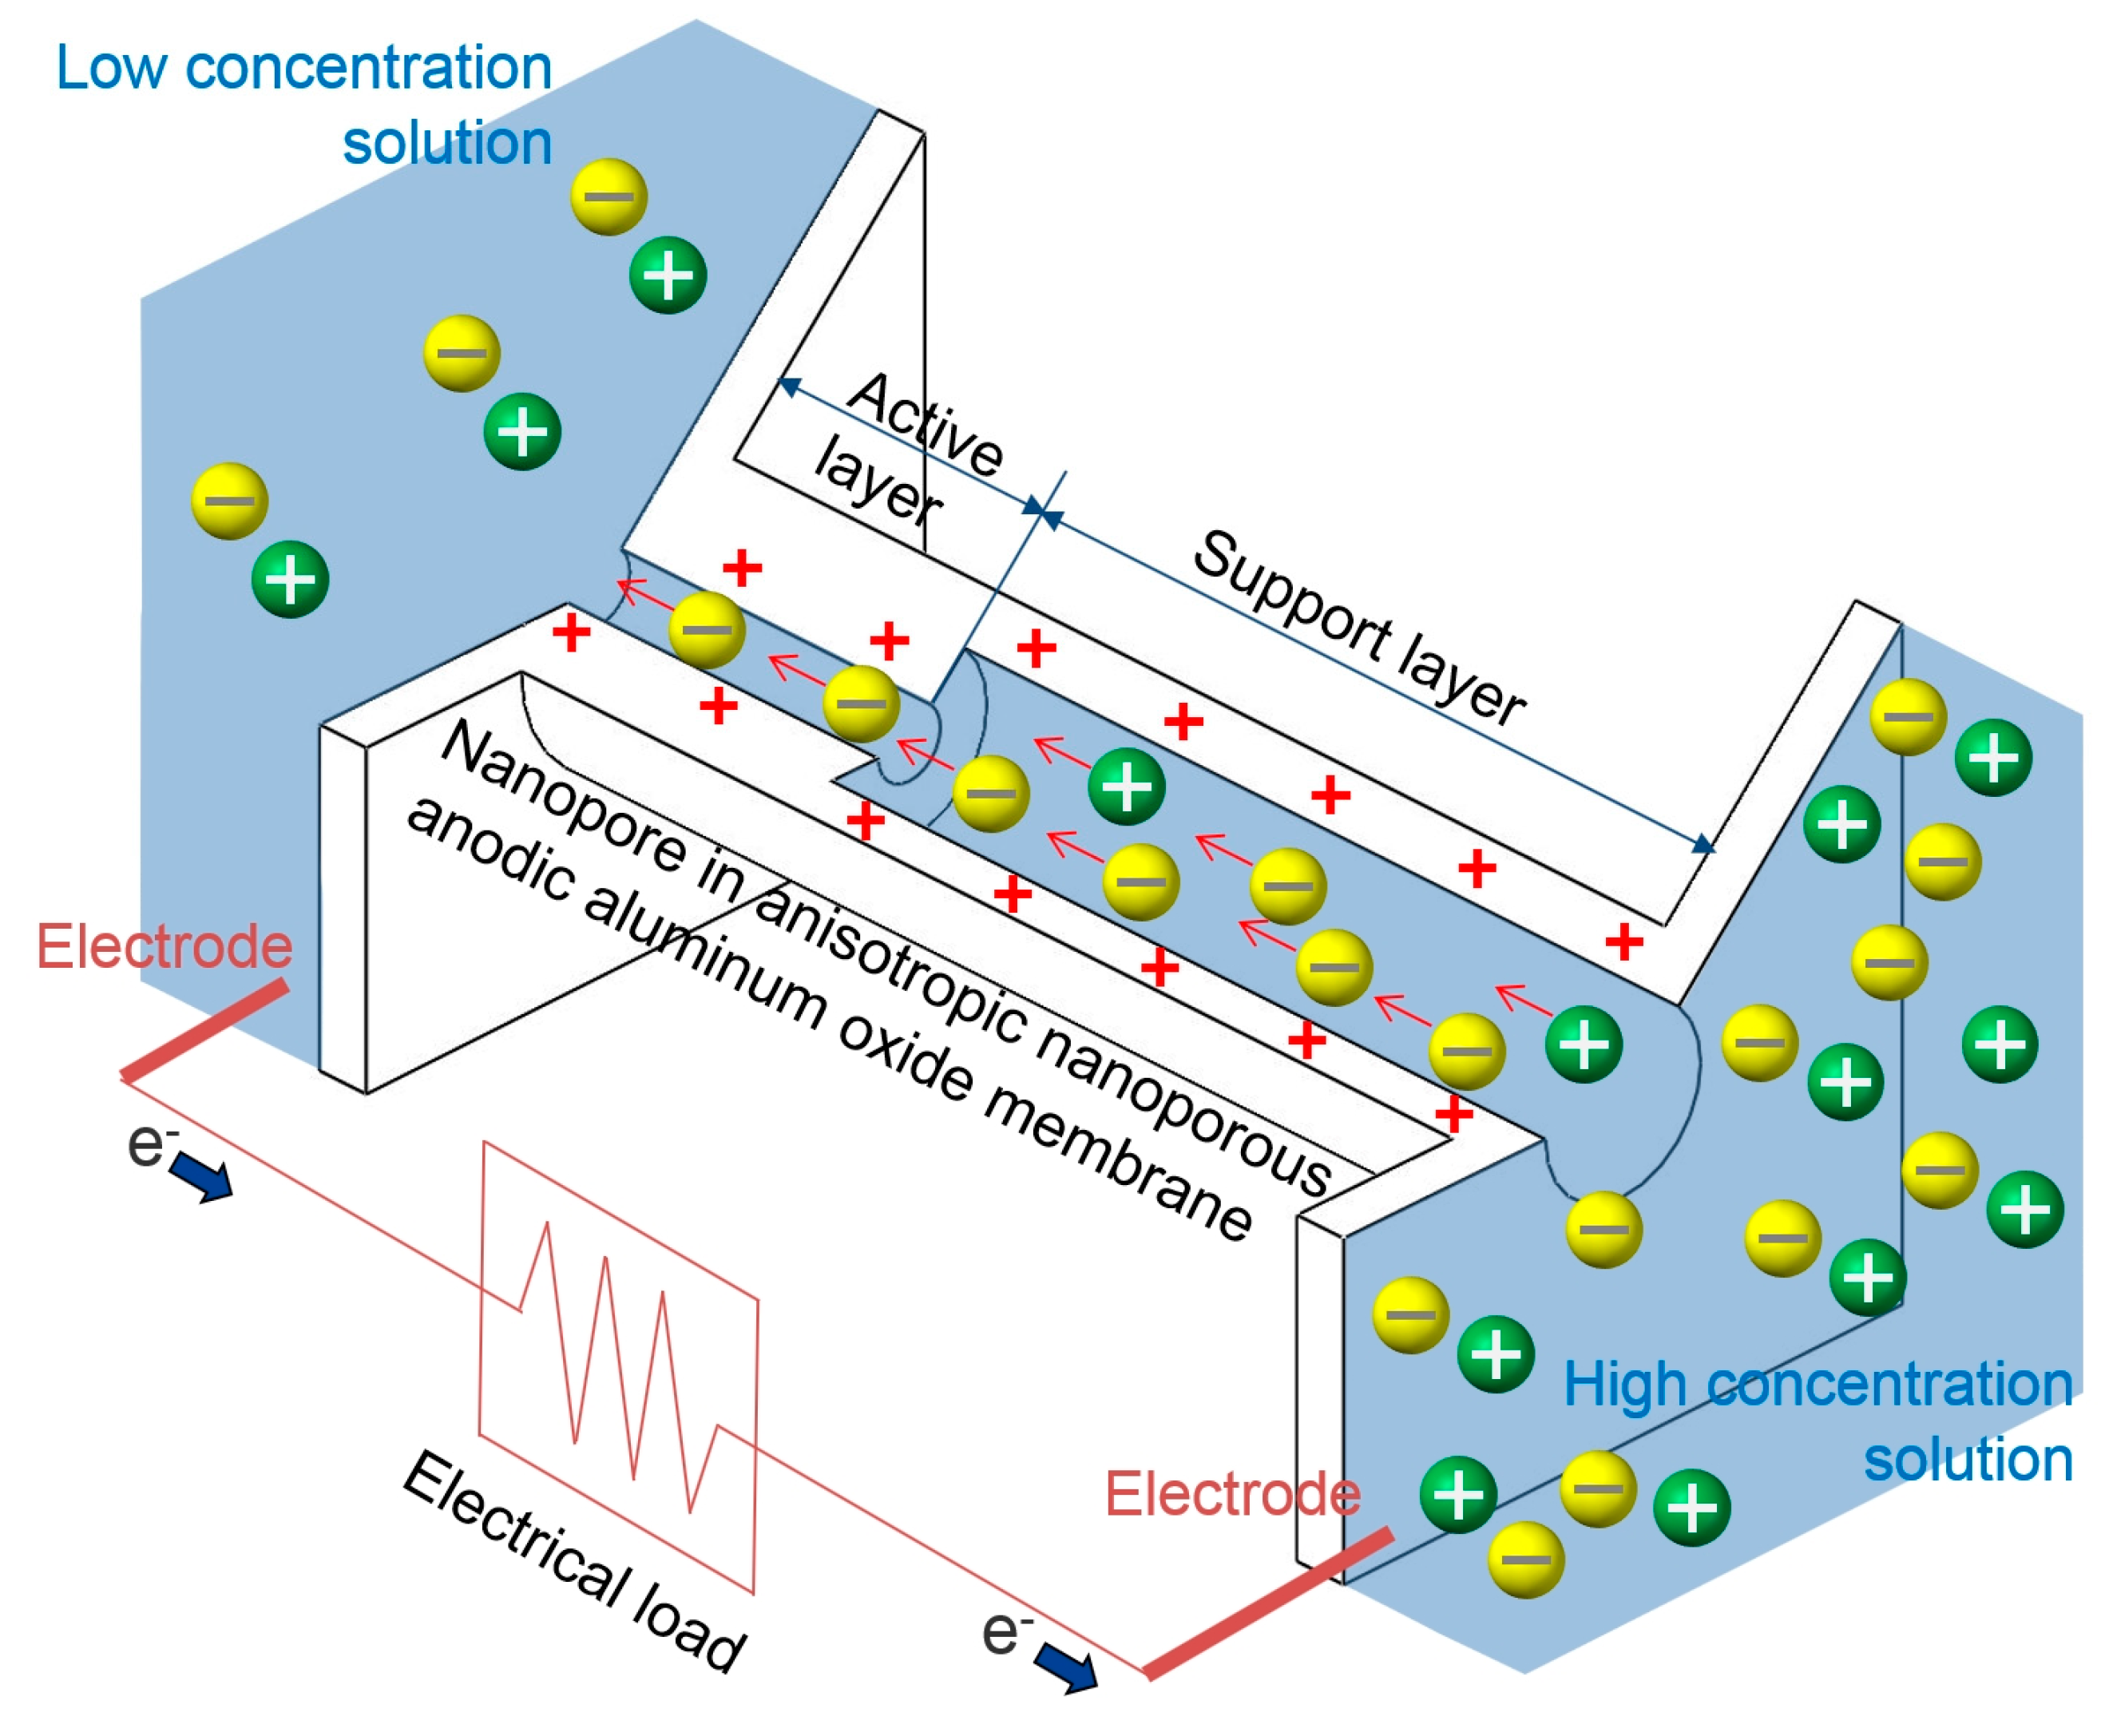
Figure 1, when the concentration of the aqueous solution on one side of a nanopore is higher than that on the other, a natural flow of cations and anions occurs. Ions move from the side with high concentration to the low concentration side by diffusion. Owing to the ion selectivity of nanopores, flow rates of cations and anions are not equal, and as a result, an electric current flows in a nanopore. Therefore, electrical power can be obtained from this electrical current by placing electrodes in solutions. This electrical power harvesting from the difference in ion concentrations by using ion-selective nanopores in nanoporous membranes is termed reverse electrodialysis.
Power generation from reverse electrodialysis is simple and does not require any moving structures. Moreover, it is environmentally friendly and allows obtaining instant power with only two solutions with different ion concentrations. Thus, reverse electrodialysis has a potential to be used as a power source for various small and disposable systems [
3,
4]. Many researchers have investigated power generation from reverse electrodialysis using a number of ion selective membranes. These studies are well summarized in the review paper by Mei and Tang [
1]. Guo et al. fabricated an ion selective polyimide membrane with a single nanopore by using ion-track-etch and conducted experimental investigation on the power generation of this membrane [
5]. They showed that about 26 pW of power could be produced from the membrane. Kim et al. fabricated silica nanochannels of various heights by a fabrication process compatible with the standard CMOS process and used those nanochannels for power generation experiments [
6]. As a result, they obtained the highest power density of 7.7 W/m
2 from the silica nanochannels. Ji et al. fabricated and investigated charged lamellar nanochannels cascaded in graphene oxide membranes for reverse electrodialysis [
7]. As a result, they obtained the highest power density of 0.77 W/m
2. Siria et al. fabricated and investigated boron nitride nanotubes for reverse electrodialysis [
8]. They showed their nanotubes have a potential to achieve the power density of 4 kW/m
2. Feng et al. investigated reverse electrodialysis in single-layer molybdenum disulfide (MoS
2) nanopores [
9]. They found their MoS
2 nanopores have a potential to reach the power density of 10
6 W/m
2.
Moreover, since the amount of energy generated by reverse electrodialysis increases in proportion to the number of nanopores, many studies have been conducted on how membranes with dense nanopores increase power production. Ouyang et al. fabricated a nanofluidic crystal packed with silica nanoparticles in a micropore and measured power generation from it [
10]. It was shown that nanofluidic crystals can achieve power generation of 1.17 nW. Choi et al. suggested and experimentally investigated a nanofluidic reverse electrodialysis platform in which crystallized nanoparticles are geometrically controlled [
11]. It was shown that their nanofluidic platform can achieve power generation of 320 pW. Kim et al. used a nanoporous anodic aluminum oxide membrane with a membrane diameter of 47 mm, membrane thickness of 60 μm, and nominal pore radius of 10 nm. Such a membrane produced 542 nW of power [
2].
Nanoporous anodic aluminum oxide membrane can be fabricated by electrochemical oxidation of an aluminum membrane [
12,
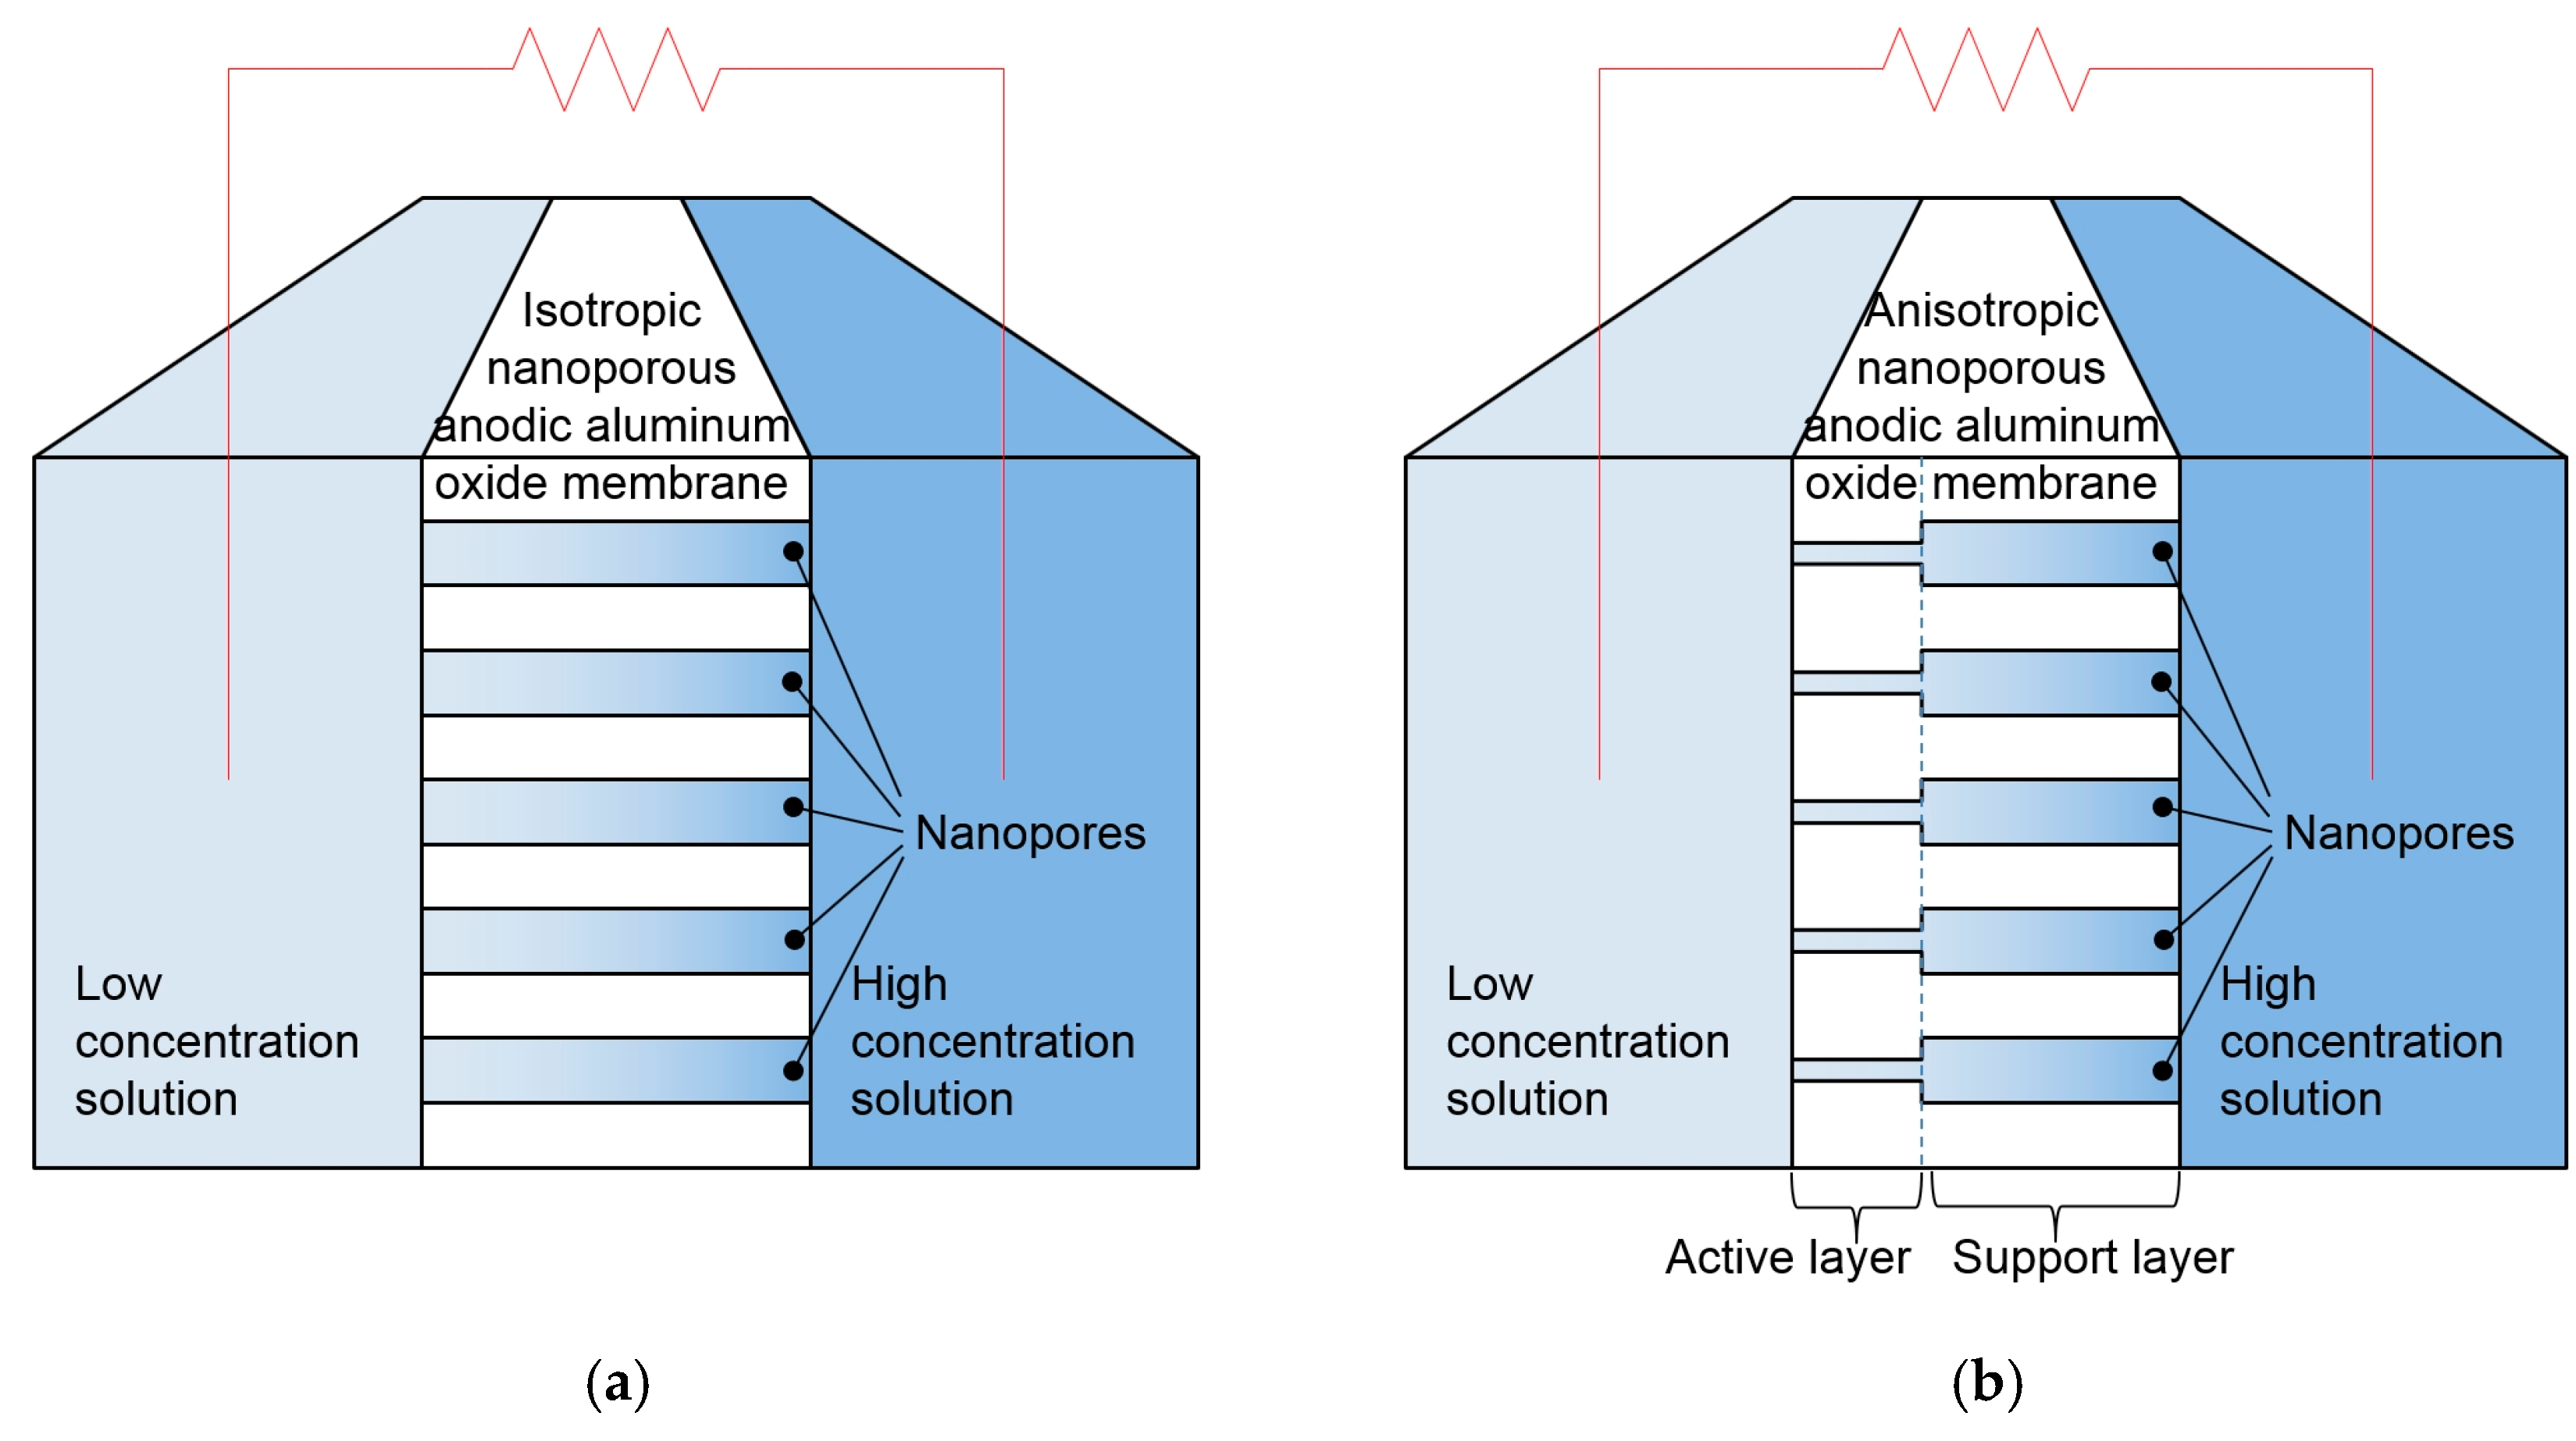
13]. It has attracted close attention because it is suitable for power generation by reverse electrodialysis. Nanoporous anodic aluminum oxide membranes are suitable for reverse electrodialysis being characterized by a highly homogeneous and dense structure with straight and parallel nanopores. Today, researchers have focused mainly on isotropic anodic aluminum oxide membranes with nanopores of a uniform diameter (
Figure 2a). However, as previous studies demonstrate [
14,
15], isotropic membranes with a small nanopore diameter exhibit excessively high electric resistance and generate a negligible amount of electric current. On the contrary, nanopores with a large diameter cause excessively low ion selectivity, equal cation and anion flow rates, and as a result, no electric current is produced. Evidently, isotropic nanoporous anodic aluminum oxide membranes have inherent limitations for power maximization.
In this study, we propose reverse electrodialysis power generation using an anisotropic anodic aluminum oxide membrane with the nanopores of two different pore diameters (
Figure 1 and
Figure 2b). In an anisotropic membrane, the active layer consists of nanopores with a small diameter, causing sufficient ion selectivity, and a very short length, causing lower electrical resistance. The support layer consists of nanopores with a large diameter, causing very low electrical resistance, and provides a structural support for the thin and fragile active layer. In short, it is expected that the anisotropic anodic aluminum oxide membrane can provide high power generation due to high ion selectivity and low resistance. Systematic studies on the anisotropic aluminum oxide membrane have not been yet conducted. Hence, a proof-of-concept experiment is required to showcase that the anisotropic anodic aluminum oxide membrane is superior to the isotropic membrane.
In this study, power generation from a concentration gradient by reverse electrodialysis in anisotropic nanoporous anodic aluminum oxide membranes was experimentally investigated. The experiments were carried out for various combinations of concentrations. The experimental results were also obtained for the isotropic membranes with the same combinations of concentrations and were compared to those for the anisotropic membranes. Experiments on the anisotropic membranes with various active layer lengths and pore diameters were conducted to reveal the effects of these engineering parameters on the power generation performance. In addition, the anisotropic membranes have directionality in installation, and the effects of the installation direction on power generation were also scrutinized.
3. Results and Discussion
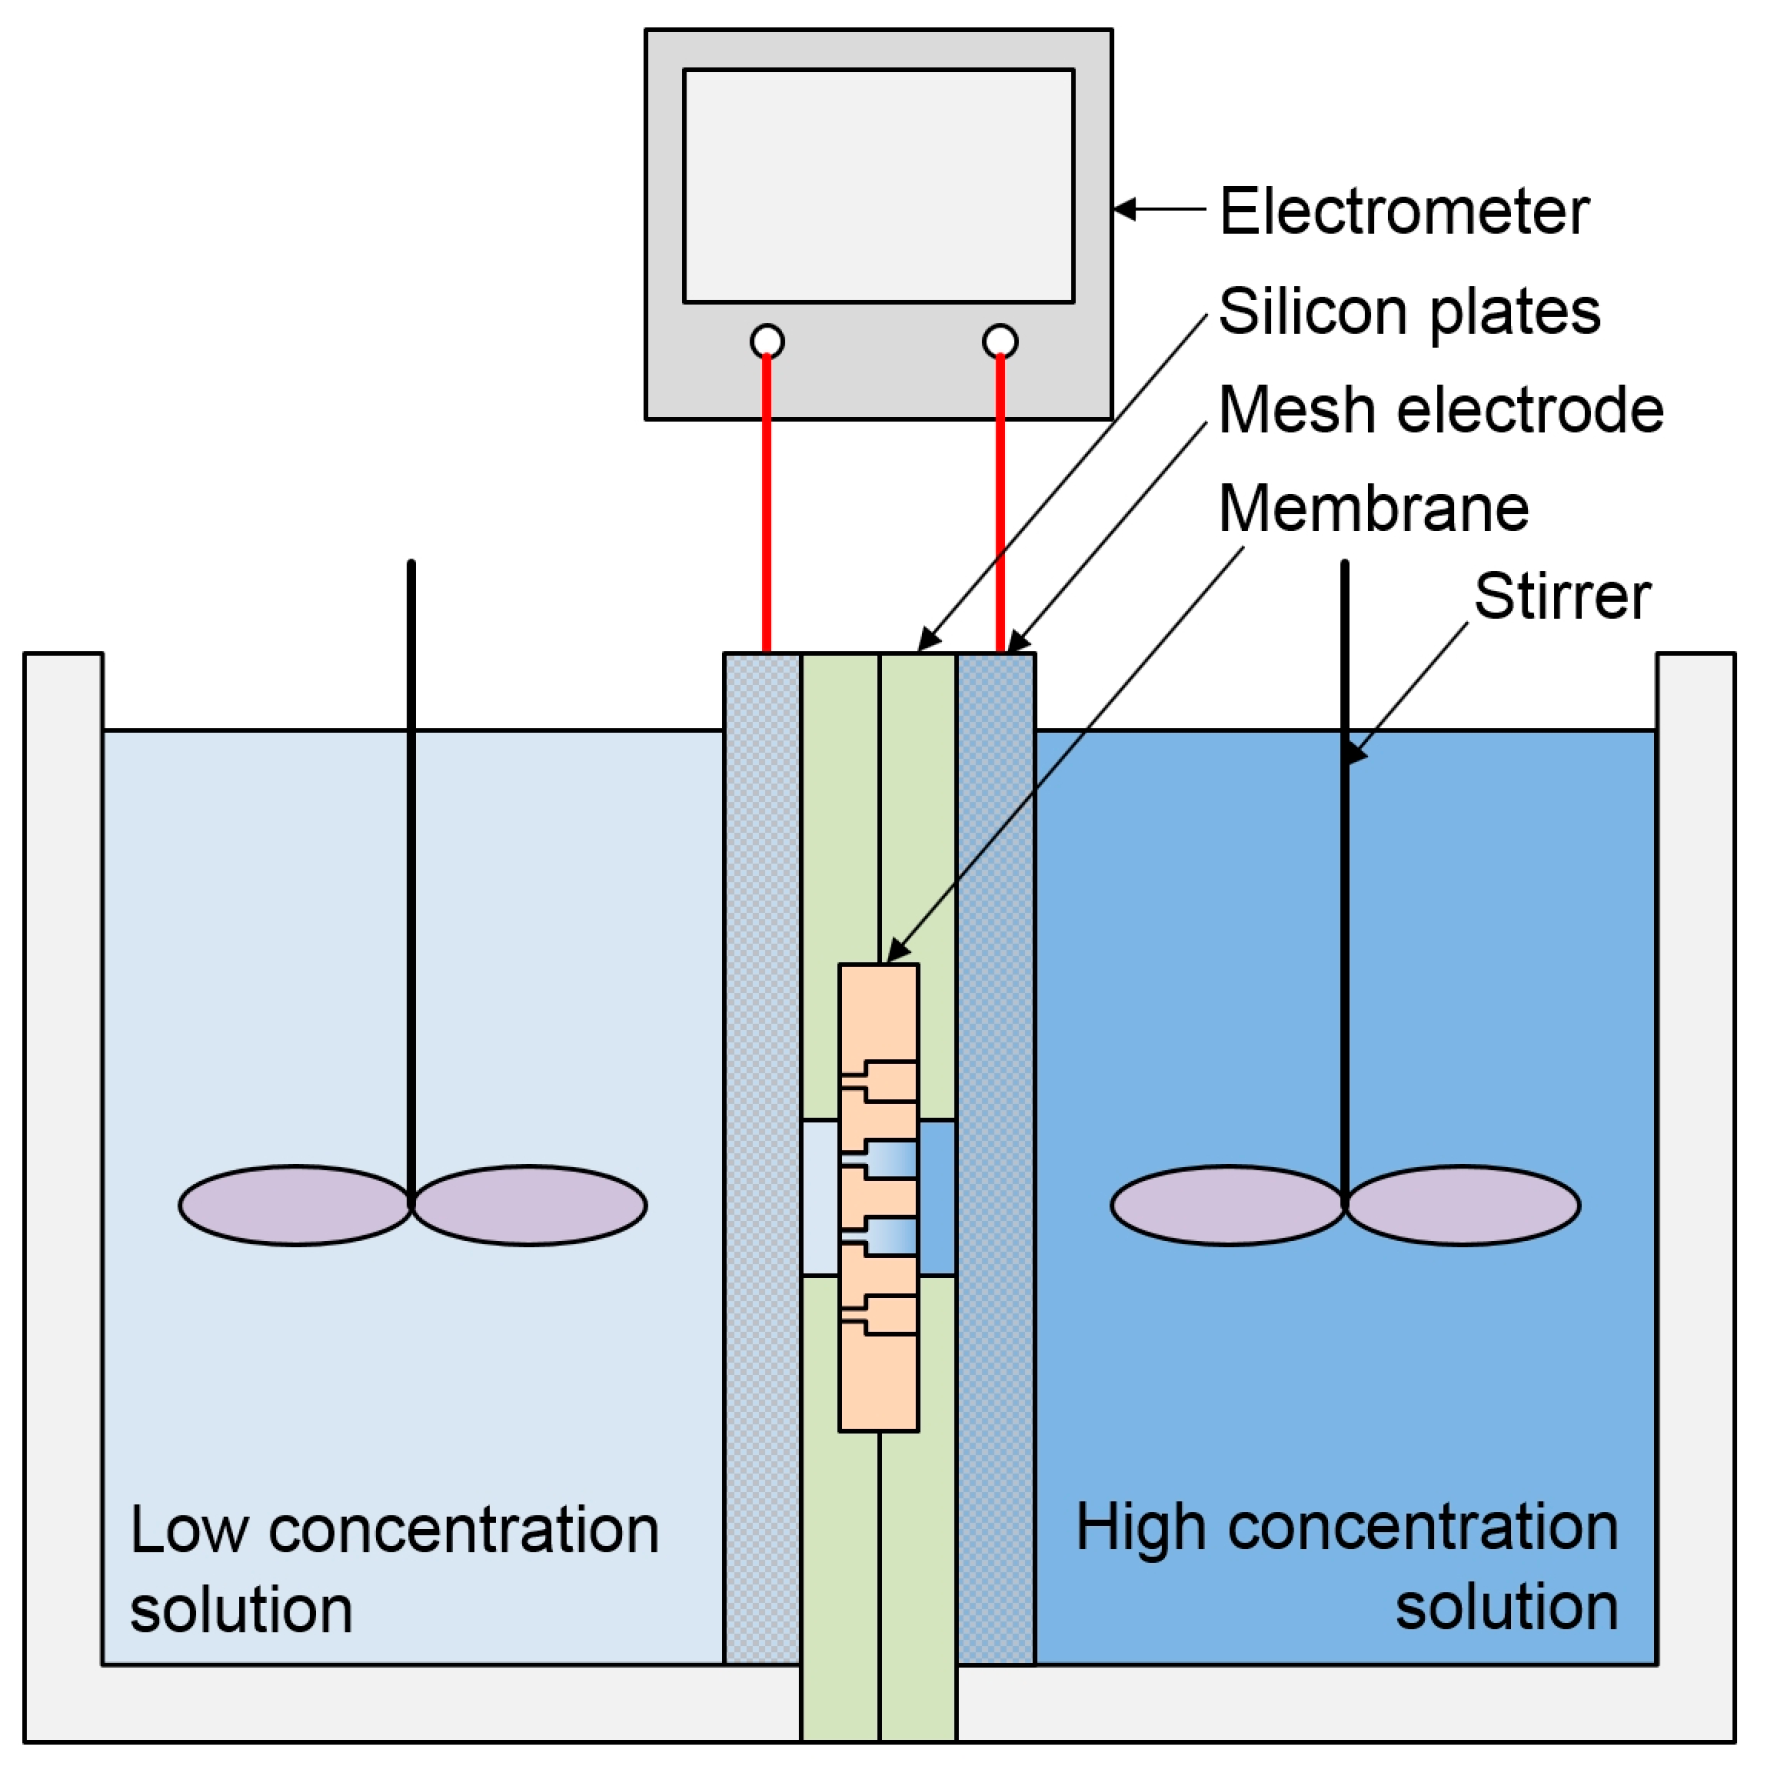
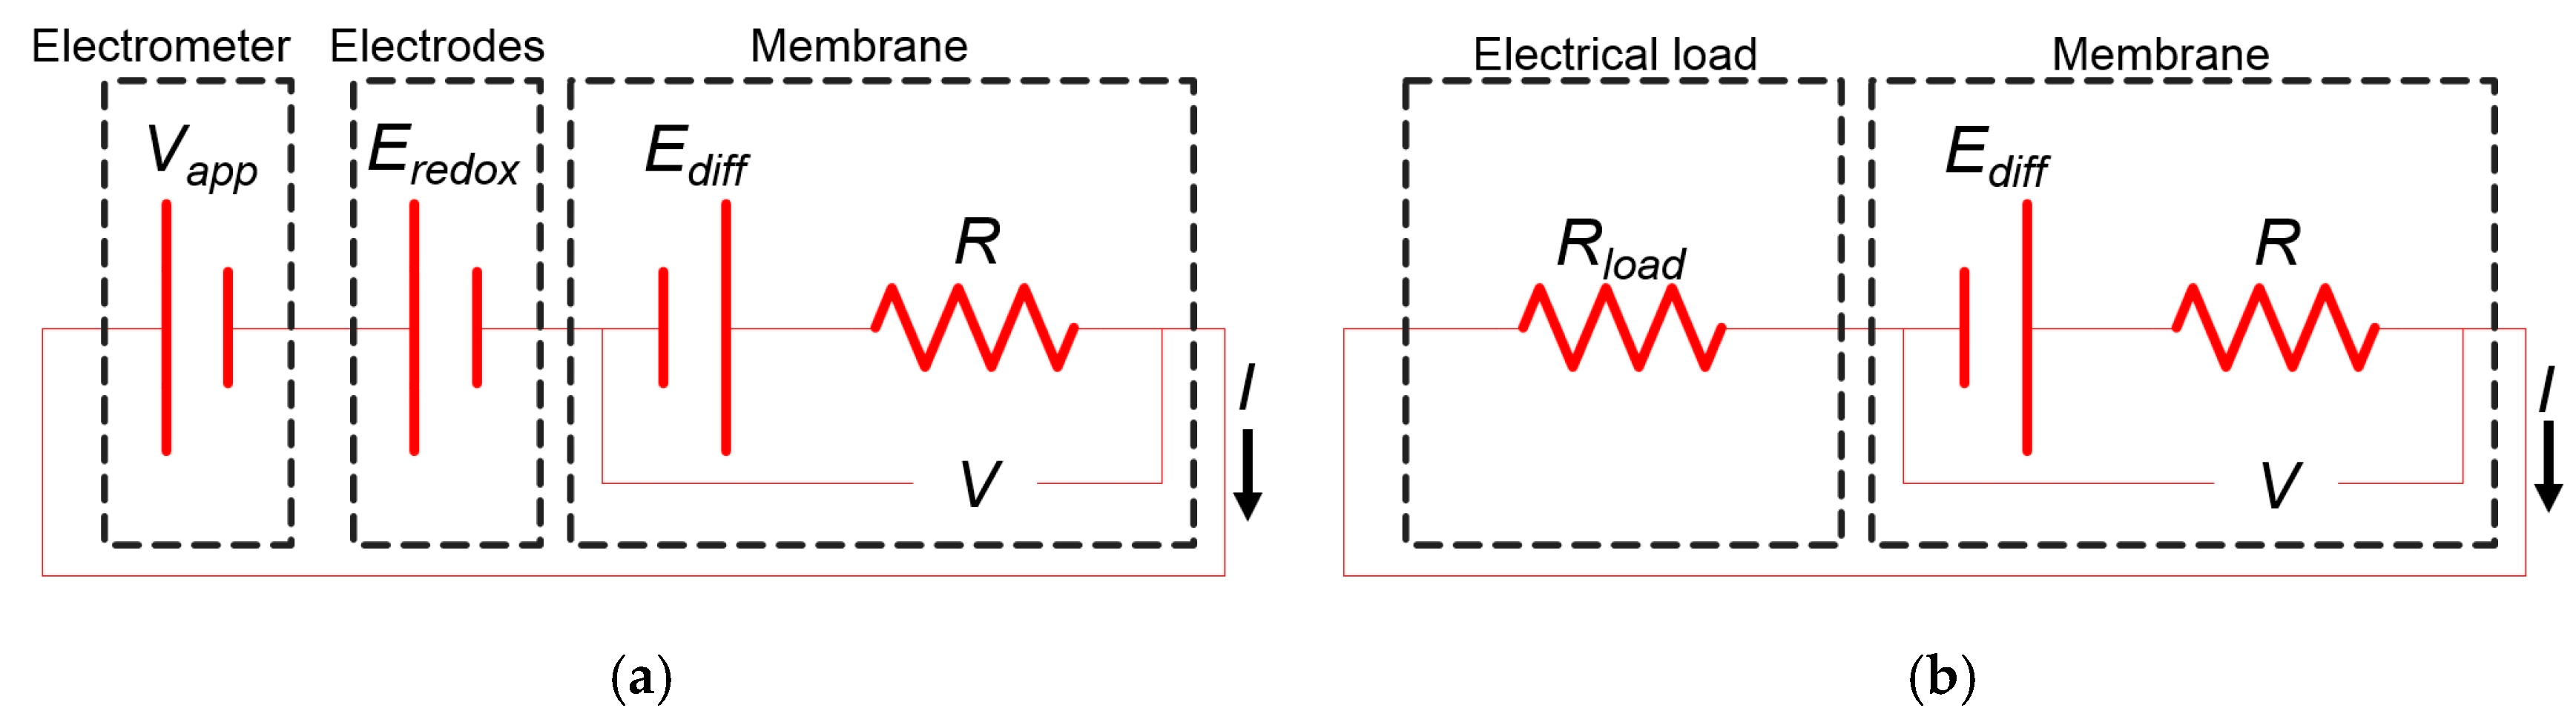
It is well known that electricity generation by reverse electrodialysis from the experimental setup can be represented by an electric circuit (
Figure 5a), and the following equation should be satisfied.
where
V is the voltage generated in the membrane,
Vapp is the applied voltage,
Ediff is the diffusion potential of the membrane,
Eredox is the voltage generated by the reactions at the electrodes due to the difference in solution concentrations between two reservoirs,
R is the electrical resistance of the membrane, and
I is the generated current. As
Figure 5 shows, the membrane, where reverse electrodialysis occurs, is equivalent to a series of connections of the electrical voltage source
Ediff and the electrical resistance
R. The value of
Eredox can be obtained from the following equation, which is well known in the field of electrochemistry:
where
R,
T,
z,
F, and
γ are the gas constant, temperature, charge number, Faraday constant, and mean activity coefficient, respectively. Thus, by using Equations (1) and (2), the voltage
V generated in the membrane can be calculated from the voltage
Vapp applied to the electrodes by the electrometer. The diffusion potential
Ediff also satisfies the following equation:
where
is the transference number for the anions and indicates the ion selectivity of the membrane. If the
value of the membrane is 1, the membrane passes only the anions and not the cations. When
equals 0.5, the membrane passes equally the cations and anions, so that no voltage is generated at the membrane, as shown in Equation (3). Therefore, the higher the
number, the greater the diffusion potential
Ediff, the voltage
V, and the generated power. Equation (3) is useful for understanding various trends of the diffusion potential.
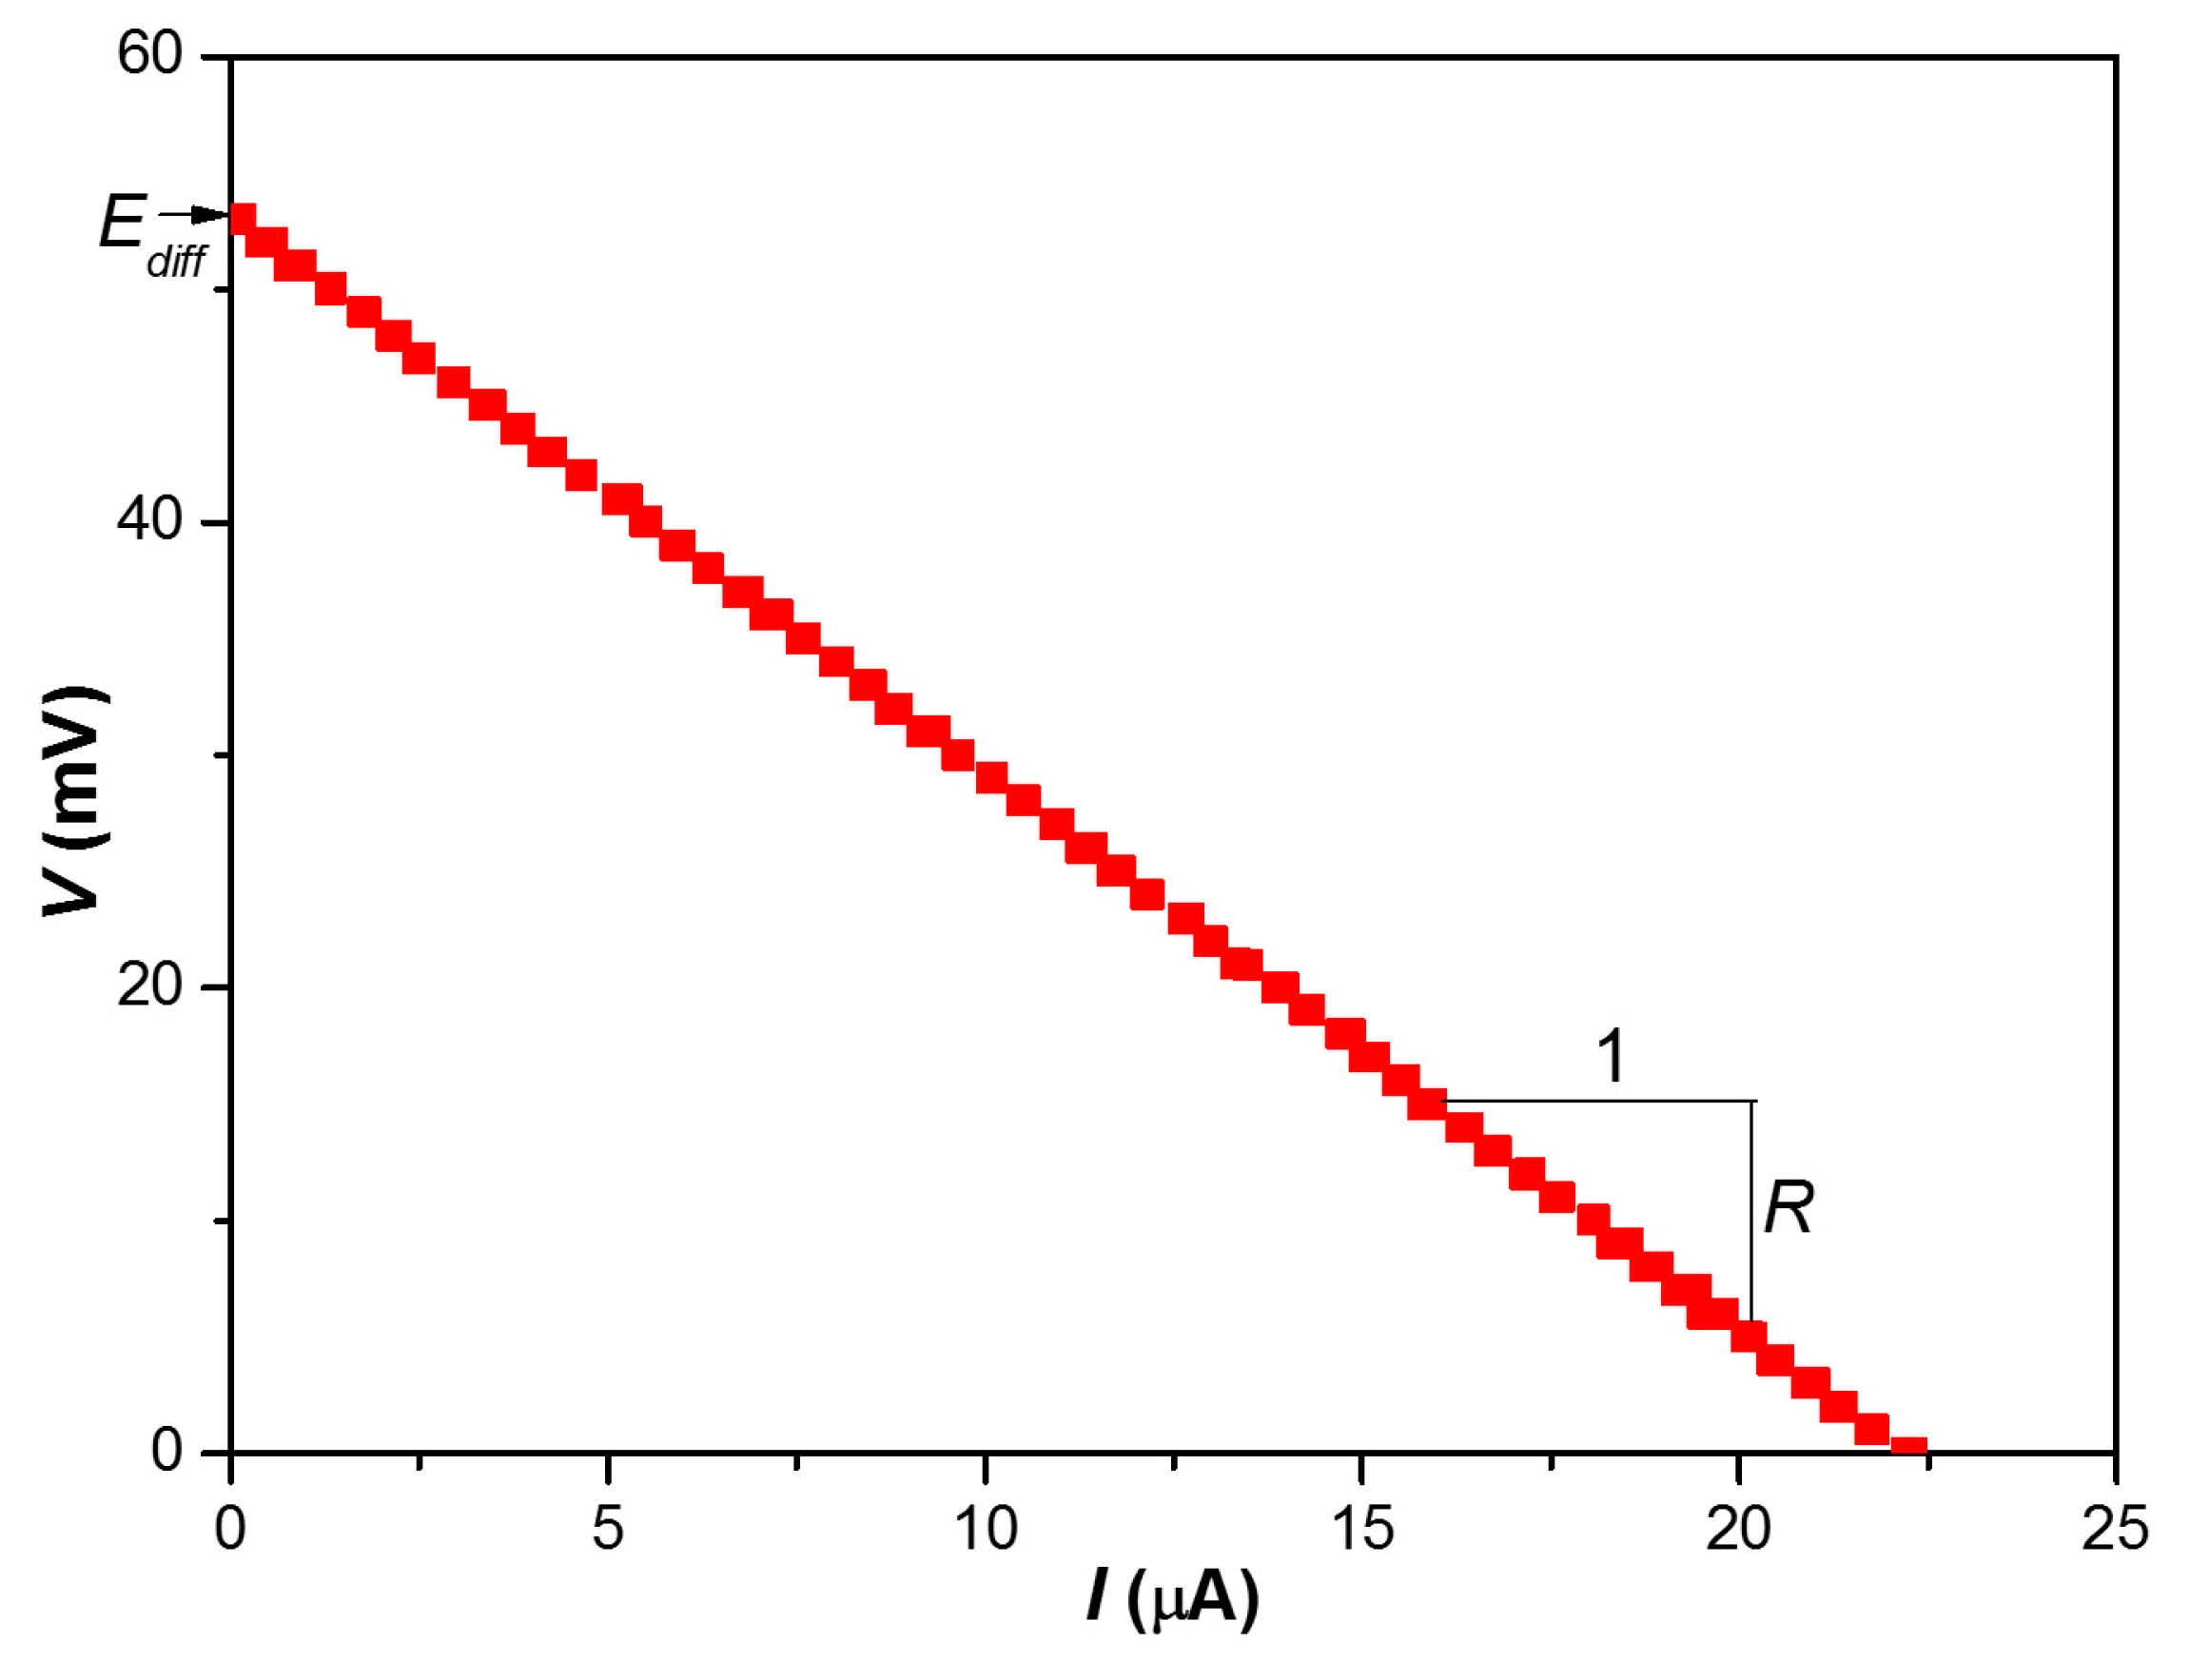
Figure 6 shows a typical voltage–current curve of the anisotropic membrane as measured in the experimental setup. As the voltage increases, the current decreases linearly. In this voltage-current curve, the diffusion potential
Ediff can be calculated by using the voltage at the point where the current equals zero. The slope of the voltage–current curve is related to the electrical resistance
R of the membrane, and the electrical resistance can be obtained from the absolute value of the slope. As depicted in
Figure 6, electrical resistance is constant regardless of the amount of the current flowing. This arises because the concentration profile inside the nanopores is almost independent of the electrical potential under small electric fields [
16,
17,
18]; electrical resistance was also constant regardless of the amount of current flowing. Therefore, the characteristics of voltage–current curve shown in
Figure 6 are similar to those presented in the previous studies.
To understand better the power generation characteristics of the membranes, the applied voltage
Vapp and the redox potential
Eredox (
Figure 5a) can be simplified by considering them equivalent to the load resistance
Rload (
Figure 5b). Then, the load resistance
Rload and power generation
P in the membrane can be determined as follows:
Figure 7 shows a typical power–resistance curve of the anisotropic membrane measured in the experimental setup. The power reaches its maximum when the load resistance is equal to membrane resistance (
Rload =
R). Maximum power generation
Pmax is calculated from Equations (1) and (4) as follows:
Therefore, Pmax increases with an increase in the diffusion potential Ediff and a decrease in the electric resistance R.
Reverse electrodialysis power generation aims to maximize power generation using the least amount of a membrane material. Therefore, the power density Pmax/A, where A is the membrane area, has to be maximized. As shown in Equation (5), the maximum power density Pmax/A increases with an increase in the diffusion potential Ediff and a decrease in the area specific membrane resistance RA.
Especially, the area specific resistance is the resistance per unit membrane area. It can be obtained by multiplying the resistance and the membrane area. Contrary to the resistance, which depends on the size of the membrane, the area specific resistance is independent to the size of the membrane. Therefore, it is considered as one of the membrane properties, and it is widely used for characterizing the electrical resistance of the membrane, as shown [
19,
20].
The main purpose of this study is to show the anisotropic membrane is superior to the isotropic membrane. Therefore, it is important to compare the power densities of the anisotropic membrane and the isotropic membrane, because the power density is the most important performance index. In addition, the power density strongly depends on the dilute solution concentration and the brine solution concentration. Therefore, it is needed to compare the power densities for various combinations of concentrations. In addition, as shown in Equation (5), the power density is the function of the diffusion potential and the area specific resistance. Therefore, for understanding various results on the power density, it is also needed to compare the diffusion potentials and the area specific resistances of the anisotropic membrane and the isotropic membrane for various combinations of concentration.
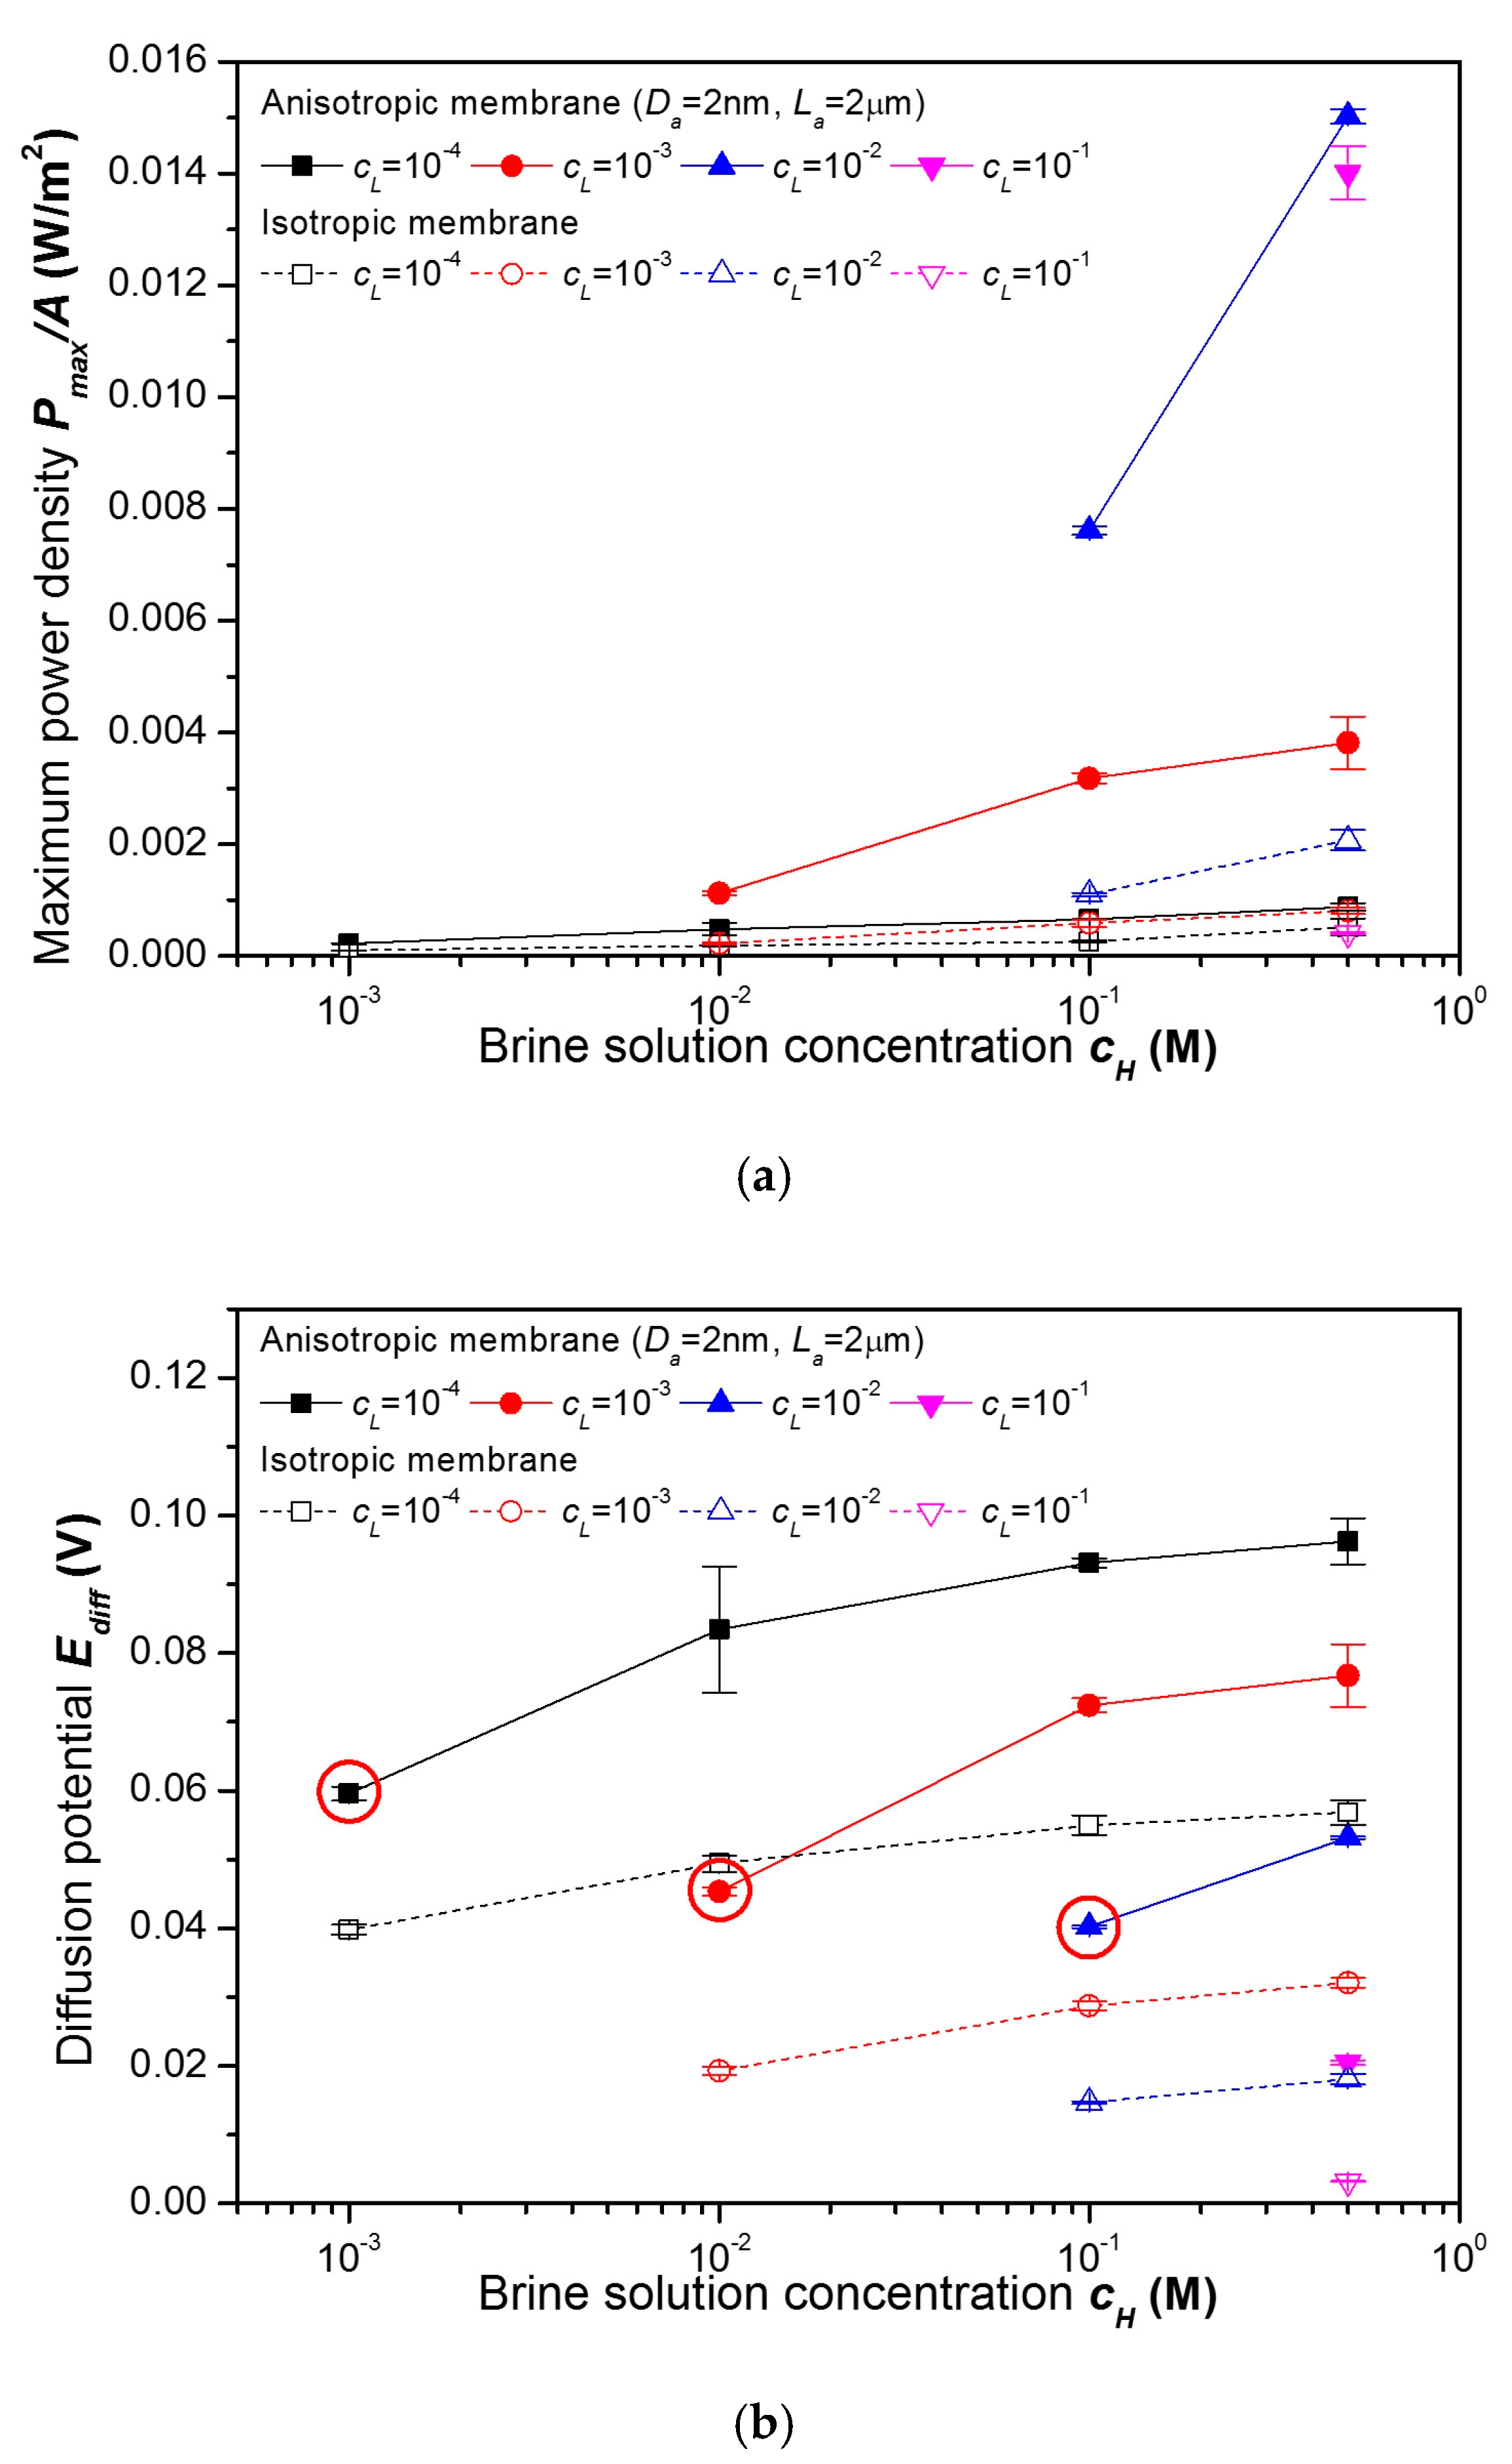
Therefore, in
Figure 8, comparisons of power densities
Pmax/A, diffusion potentials
Ediff, and area specific resistances
RA of the anisotropic membrane and the isotropic membrane for various combinations of brine solution concentrations
cH and dilute solution concentrations
cL are presented. As mentioned in the
Section 2, four kinds of anisotropic membranes were experimentally investigated. However, in
Figure 8, only the results for the anisotropic membrane with active layer pore diameter
Da of 2 nm and active layer pore length
La of 2 μm are presented, because this anisotropic membrane shows highest power density.
As shown in
Figure 8a, the highest power density that was measured from the anisotropic membrane is 15.0 mW/m
2. This value was measured when the brine solution concentration was 0.5 M, and the dilute solution concentration was 0.01 M. On the other hand, the highest power density that was measured from the isotropic membrane is 2.1 mW/m
2 at the brine solution concentration of 0.5 M and the dilute solution concentration of 0.01 M. As a result, the highest power density of the anisotropic membrane is 7.2 times higher than that of the isotropic membrane. This power density from the anisotropic membrane is also much greater than the power density of 7 mW/m
2 from another anodic aluminum oxide isotropic membrane presented in the previous study [
2]. Therefore, for reverse electrodialysis, the anisotropic membrane is much superior to the isotropic membrane.
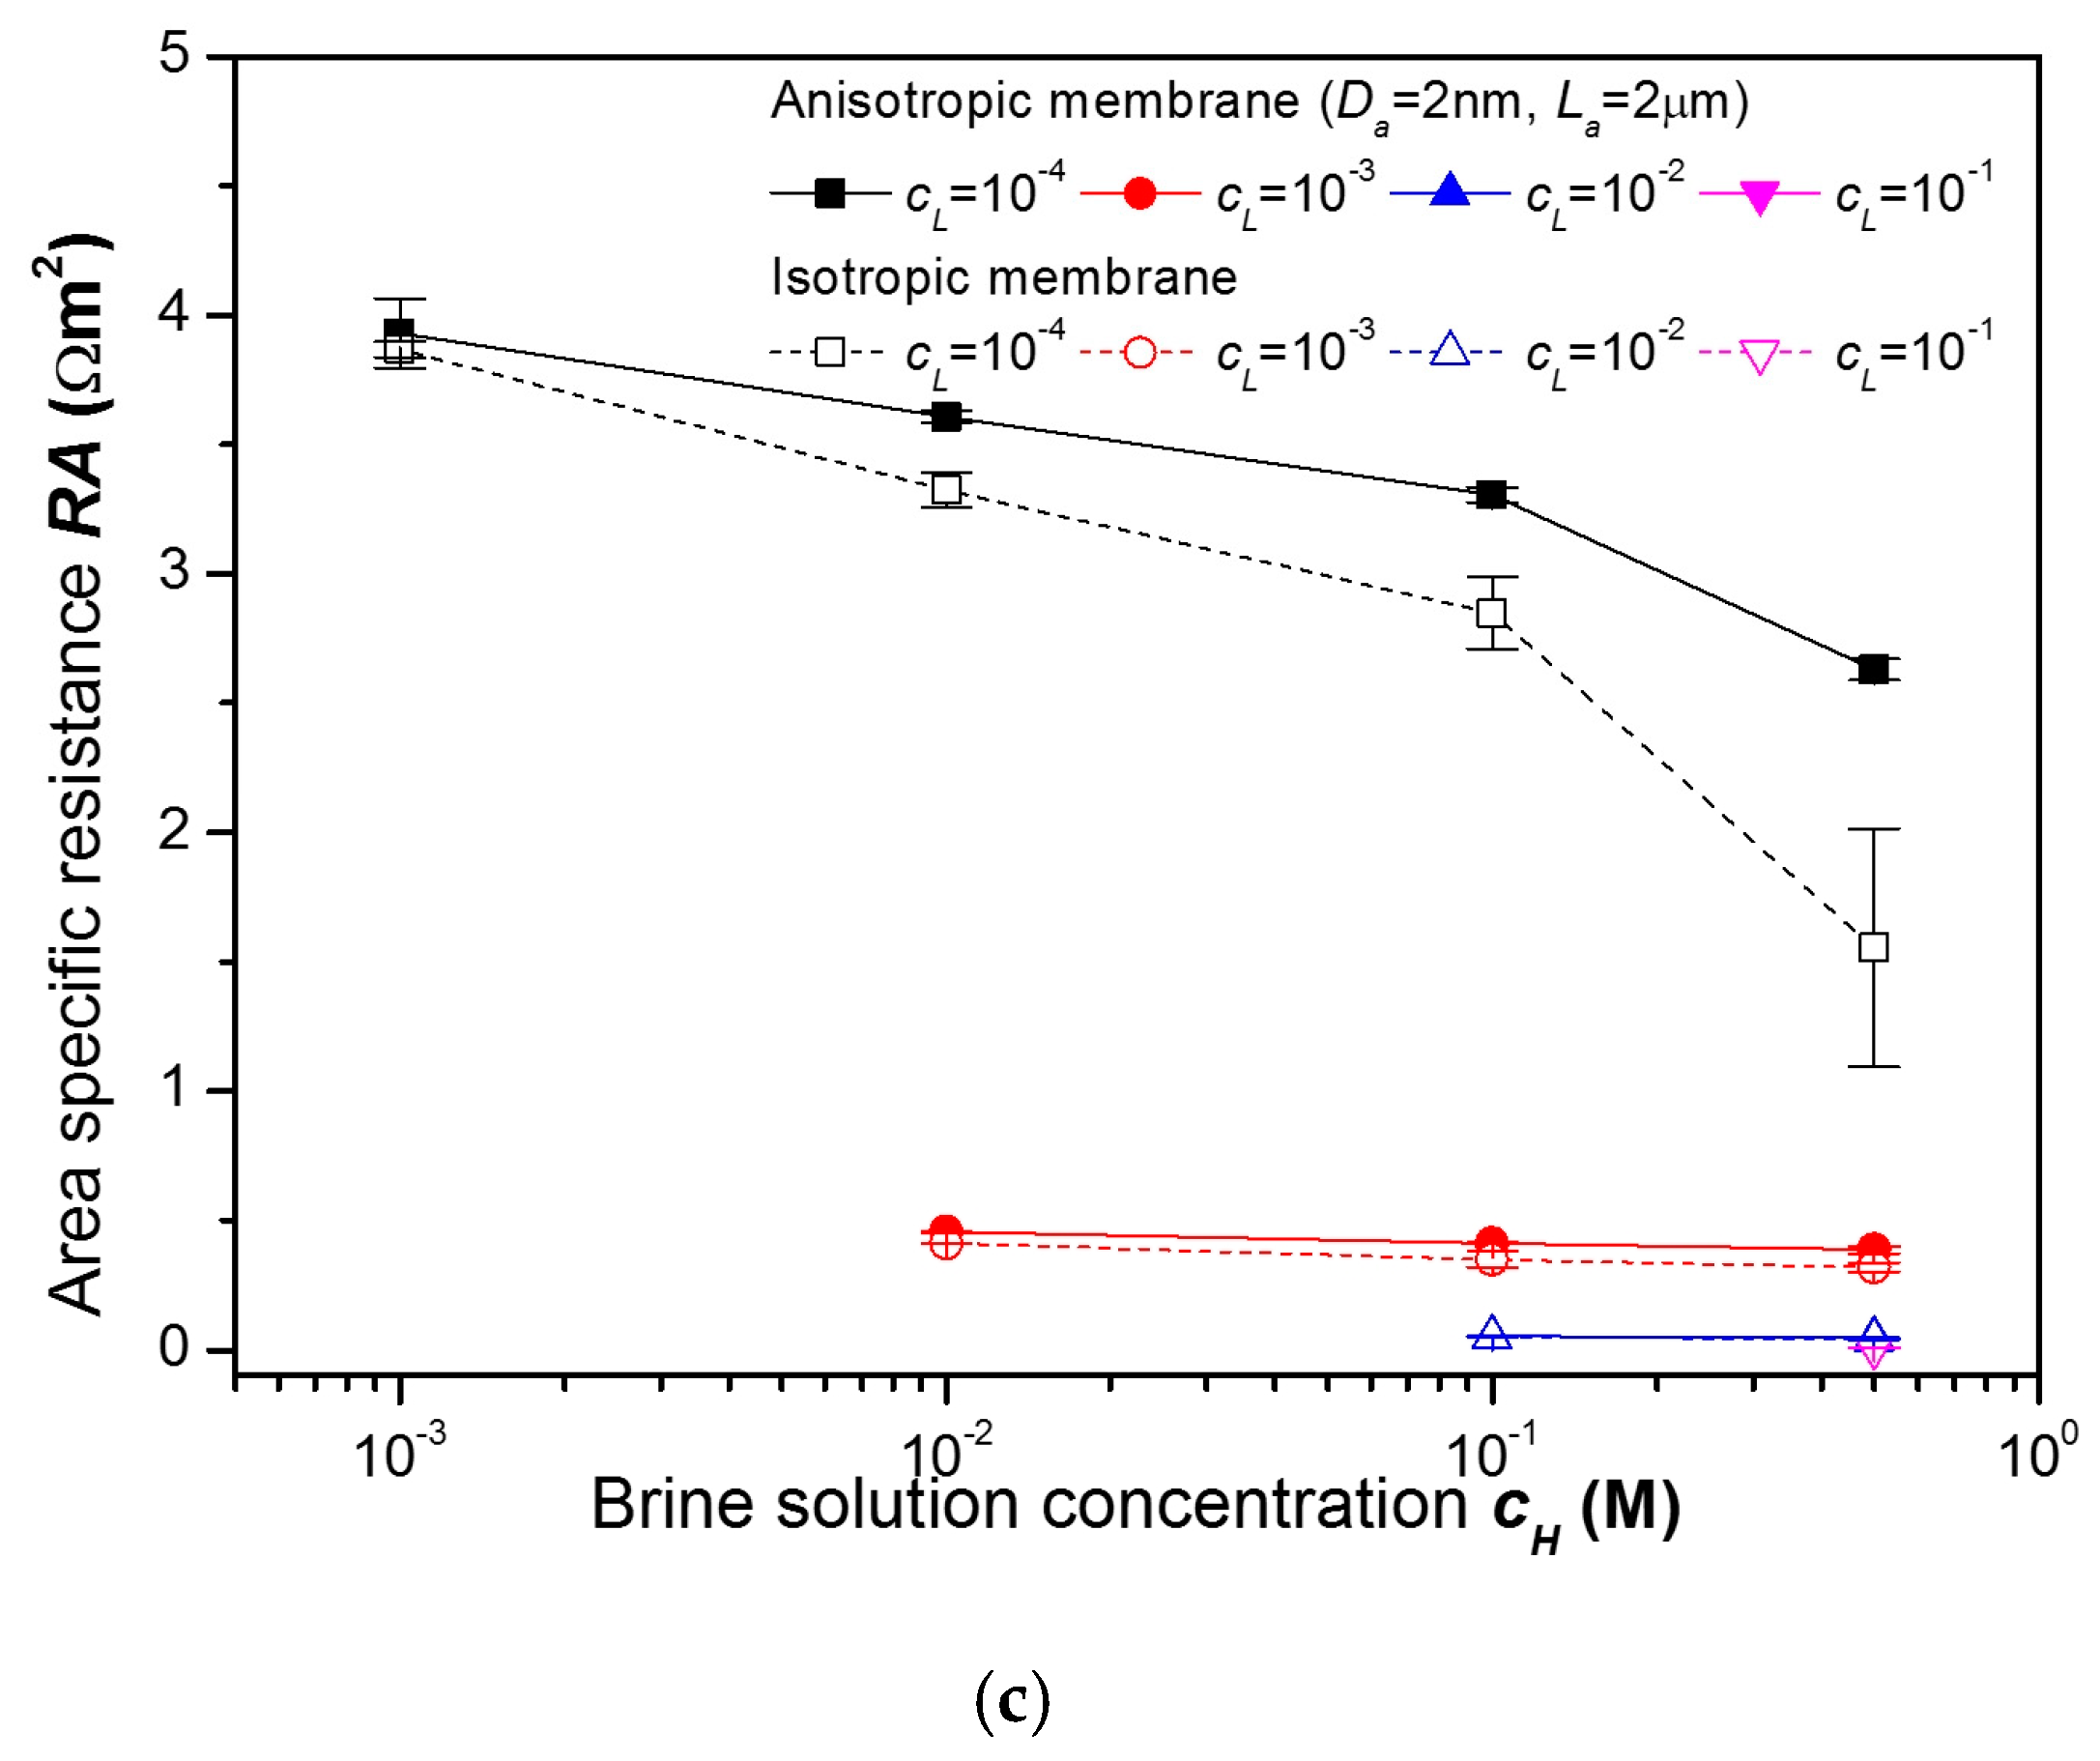
Why is there a very large difference in power densities between two membranes? As shown in
Figure 8b, at
cH of 0.5 M and
cL of 0.01 M, the diffusion potentials of the anisotropic membrane and the isotropic membrane are 53 mV and 18 mV, respectively. The presence of the active layer increases the diffusion potential by factor of 2.9. On the other hand, as shown in
Figure 8c, the area specific resistances of the anisotropic membrane and the isotropic membrane are 0.047 Ωm
2 and 0.039 Ωm
2, respectively. The presence of the active layer increases the area specific resistance by a factor of 1.2. As shown in Equation (5), the power density is proportional to the square of the diffusion potential and is inversely proportional to the area specific resistance. As a result, the positive effect of the active layer on the power density caused by an increase in the diffusion potential is much greater than the negative effect caused by increase in the area specific resistance. Therefore, the power density of the anisotropic membrane is much greater than that of the isotropic membrane.
According to Equation (3), the transference number for the anions
t can be calculated from the diffusion potential, the brine solution concentration, and the dilute solution concentrations. At
cH of 0.5 M and
cL of 0.01 M, transference numbers for the anions of the anisotropic membrane and the isotropic membrane are 0.79 and 0.60, respectively. Therefore, the ion selectivity is increased by the presence of the active layer [
6], and the transference number increases as the influence of the surface charges of the nanopore on the ion transport phenomena grows larger compared to the influence of the bulk ion concentration in the nanopore. As a result, the transfer number increases with the increase of the Dukhin number, which is used to characterize the ratio of bulk to surface charge carriers. The Dukhin number
Du of the nanopore is given as [
2]
Here, σ and D are the surface charge density and the pore diameter, respectively. As shown in Equation (6), when cH and cL are fixed, the Dukhin number increases with a decrease in the pore diameter. In the present study, the pore diameter of the active layer is much smaller than that of the support layer. As a result, Dukhin number for the active layer is much larger than that of the support layer, and the transference number of the active layer is larger than that of the support layer. Therefore, the ion selectivity is increased by the presence of the active layer.
It is worth noting that the very thin active layer with the pore length of 2 μm causes the dramatic change in the transference number from 0.60 to 0.79 at
cH of 0.5 M and
cL of 0.01 M [
15,
17], and the ion selectivity increases rapidly when the pore length is changed from 0 to several micrometers. On the other hand, the ion selectivity increases very slowly when the pore length is changed from several micrometers to several tens of micrometers [
17]; it is because the ion selectivity strongly depends of the pore length for the short nanopores where the Goldman approximation is not satisfied. On the other hand, the ion selectivity is almost independent to the pore length for the long nanopores where the Goldman approximation is satisfied. Therefore, the active layer with the pore length of several micrometers can effectively increase the ion selectivity of the membrane. As a result, the diffusion potential and the power density of the anisotropic membrane are much greater than those of the isotropic membrane, respectively.
It is also worth noting that there is only a small difference in the area specific resistances between the anisotropic membrane and the isotropic membrane at cH of 0.5 M and cL of 0.01 M. Generally, the electrical resistance of the nanopore is proportional to the pore length and is inversely proportional to the square of the pore diameter. Therefore, if the active layer length of the anisotropic membrane is equal to the support layer length, the area specific resistance of the anisotropic membrane should be much greater than that of the isotropic layer due to the presence of the active layer. In this case, the power density of the anisotropic membrane is much smaller than that of the isotropic membrane. However, in the present study, the active layer length is smaller than one-twentieth of the support layer length. In this case, the presence of the active layer does not significantly increase the area specific resistance of the anisotropic membrane. As a result, the power density of the anisotropic membrane can be much greater than that of the isotropic membrane.
In addition,
Figure 8 also indicates the following characteristics of the diffusion potential, area specific resistance, and power density for the anisotropic membrane.
- (a)
As shown in
Figure 8b, the diffusion potential increases with an increase in the brine solution concentration
cH and a decrease in the dilute solution concentration
cL. This is explained by the fact that the diffusion potential value is proportional to the logarithm of the ratio of the brine and dilute solution concentrations (Equation (3)).
- (b)
In
Figure 8b, the diffusion potentials for the same concentration ratio of 10 are marked by the red circles. In general, as the concentration increases, the ion selectivity decreases, because Dukhin number shown in Equation (6) decreases as the concentration increases. Therefore, the diffusion potential decreases with an increase in the concentration under the fixed concentration ratio (Equation (3)).
- (c)
As shown in
Figure 8c, the area specific resistance decreases with an increase in the brine and dilute solution concentrations. It is because the number densities of the cations and anions in the nanopores increases proportionately to the concentration. Since the active layer, which has higher resistance compared to the resistance of the support layer, is in contact with the dilute solution, the resistance is more affected by changes in the dilute solution concentration than in the brine solution concentration.
- (d)
As depicted in
Figure 8a, the power density under the fixed dilute solution concentration increases monotonically as the brine concentration increases. This is because the power density increases with an increase in the diffusion potential and a decrease in the area specific resistance (Equation (5)). On the other hand, under the fixed brine concentration, there is an optimal dilute solution concentration that maximizes the power density. If the dilute solution concentration is excessively high, the power density is low since the diffusion potential is negligible. If the dilute solution concentration is excessively low, the power density is low too because the area specific resistance is excessive.
The characteristics of the diffusion potential, area specific resistance, and power density for the isotropic membrane shown in
Figure 8 are similar to those for the anisotropic membranes, as mentioned previously.
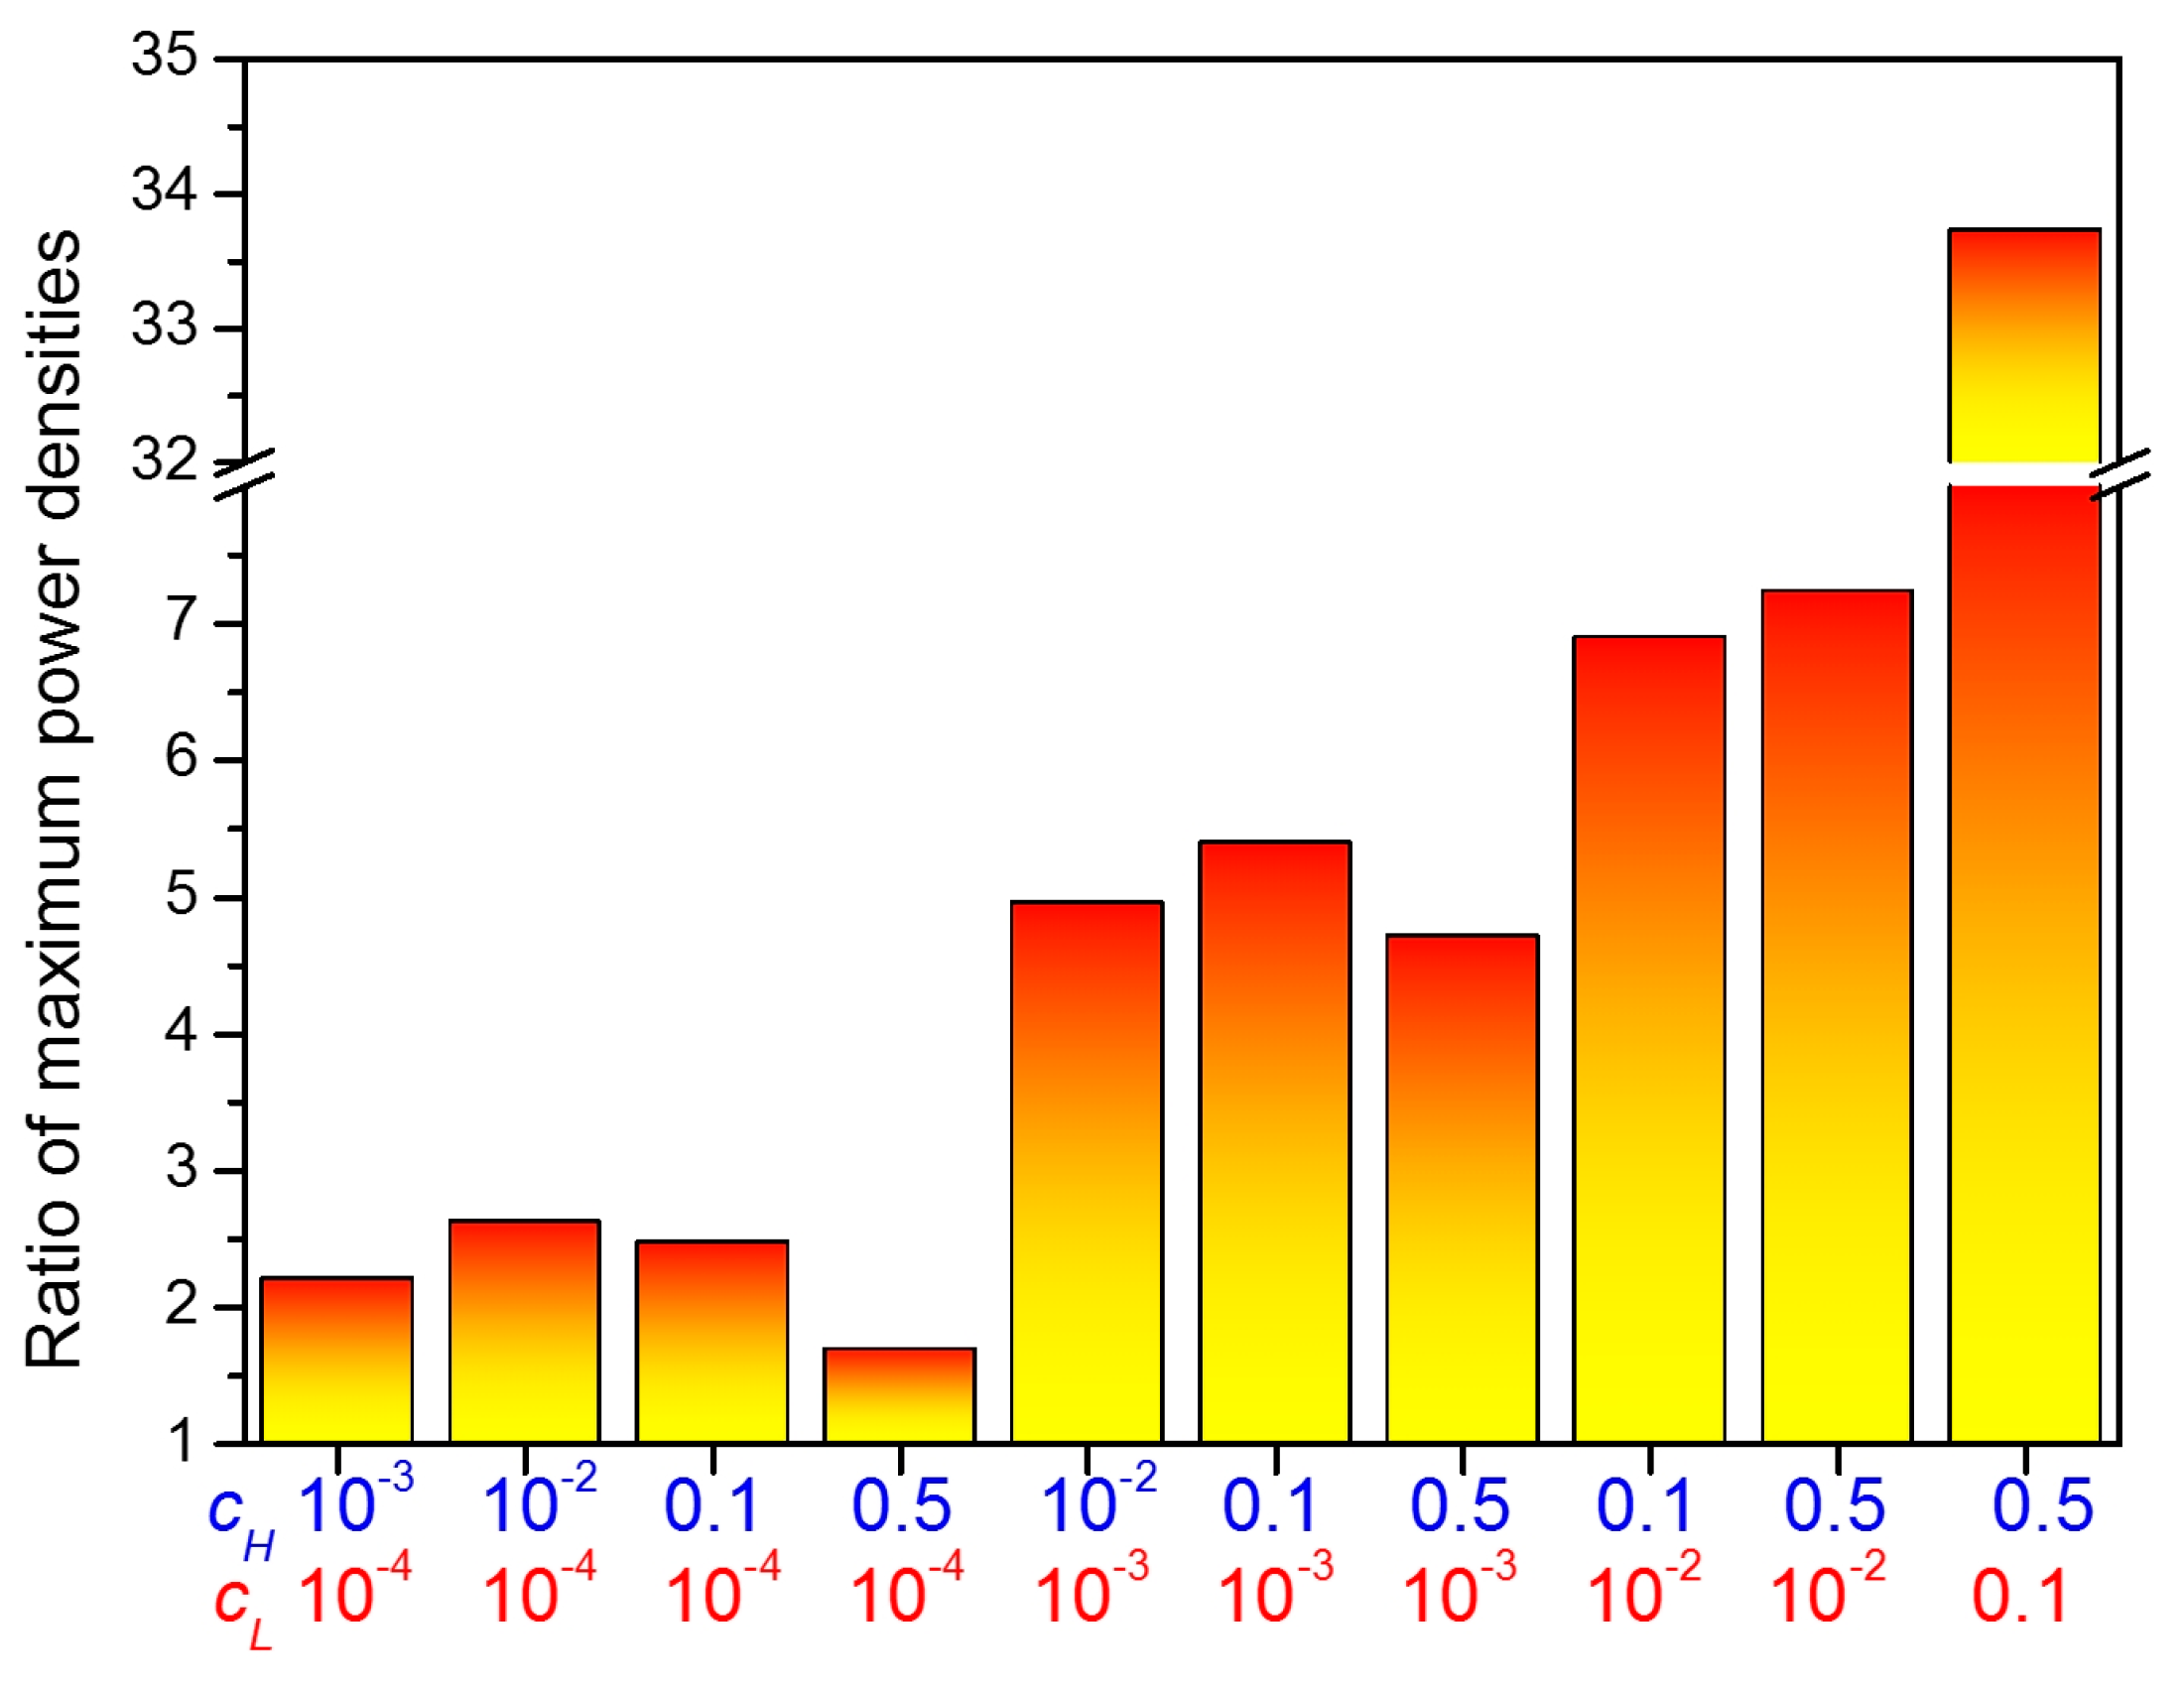
In
Figure 8a, it was found that the highest power density of the anisotropic membrane is 7.2 times higher than that of the isotropic membrane at c
H of 0.5 M and c
L of 0.01 M. However, this does not mean that the anisotropic membrane has greater power density than the isotropic membrane regardless of the brine solution concentration and the dilute solution concentration. Therefore, it is worth comparing power densities of the anisotropic membrane and the isotropic membrane for various combinations of the concentrations. To clearly compare the power densities, the ratio of the power density of the anisotropic membrane to that of the isotropic membrane was calculated for various combinations of the concentrations from the results shown in
Figure 8a and is presented in
Figure 9. As shown in the figure, the power density of the anisotropic membrane is higher than that of the isotropic membrane for all combinations of concentrations. This is mainly because the diffusion potential of the anisotropic membrane is much higher than that of the isotropic membrane regardless of the concentrations. Nonetheless, an increase in resistance due to the presence of the active layer is not significant.
So far, it was successfully shown that the anisotropic membrane is better than the isotropic membrane for reverse electrodialysis. However, to make better power generators with the anisotropic membranes, it is important to investigate the effects of engineering parameters on the power generation performance of the anisotropic membrane. Therefore, the influence of some engineering parameters on the power generation performance was tested by comparing the anisotropic membranes with two different active layer lengths and three different active layer pore diameters.
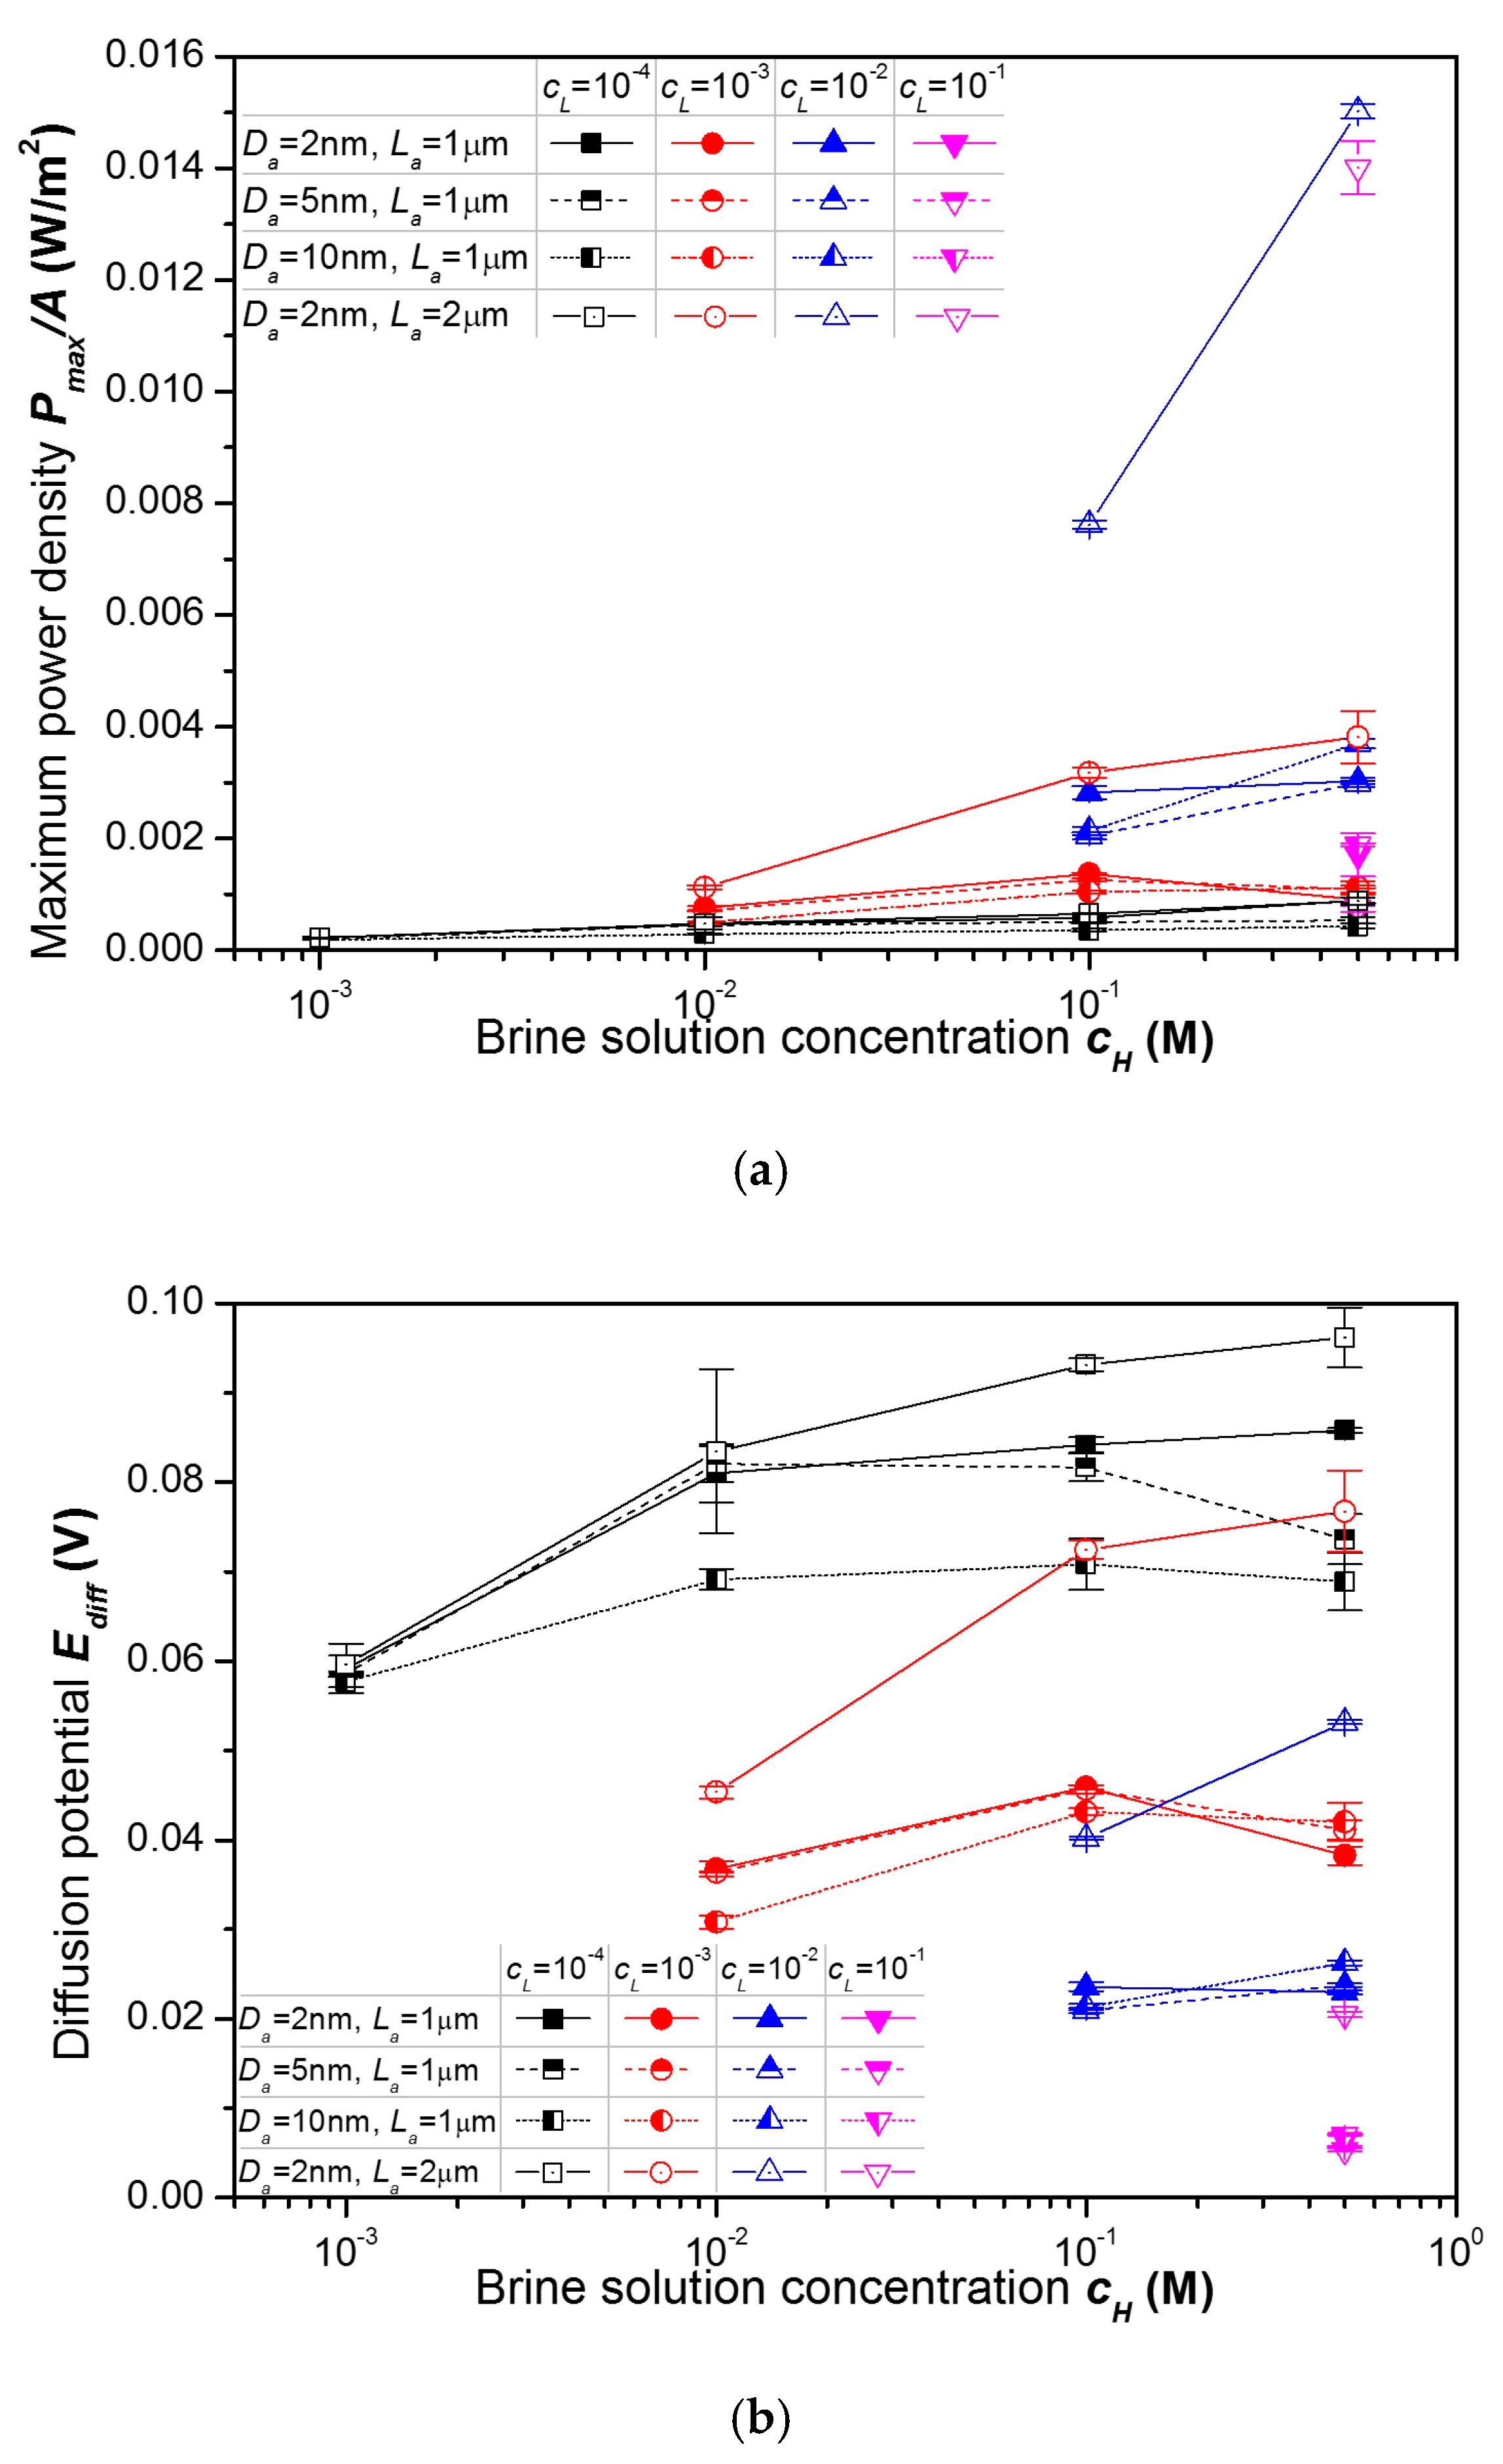
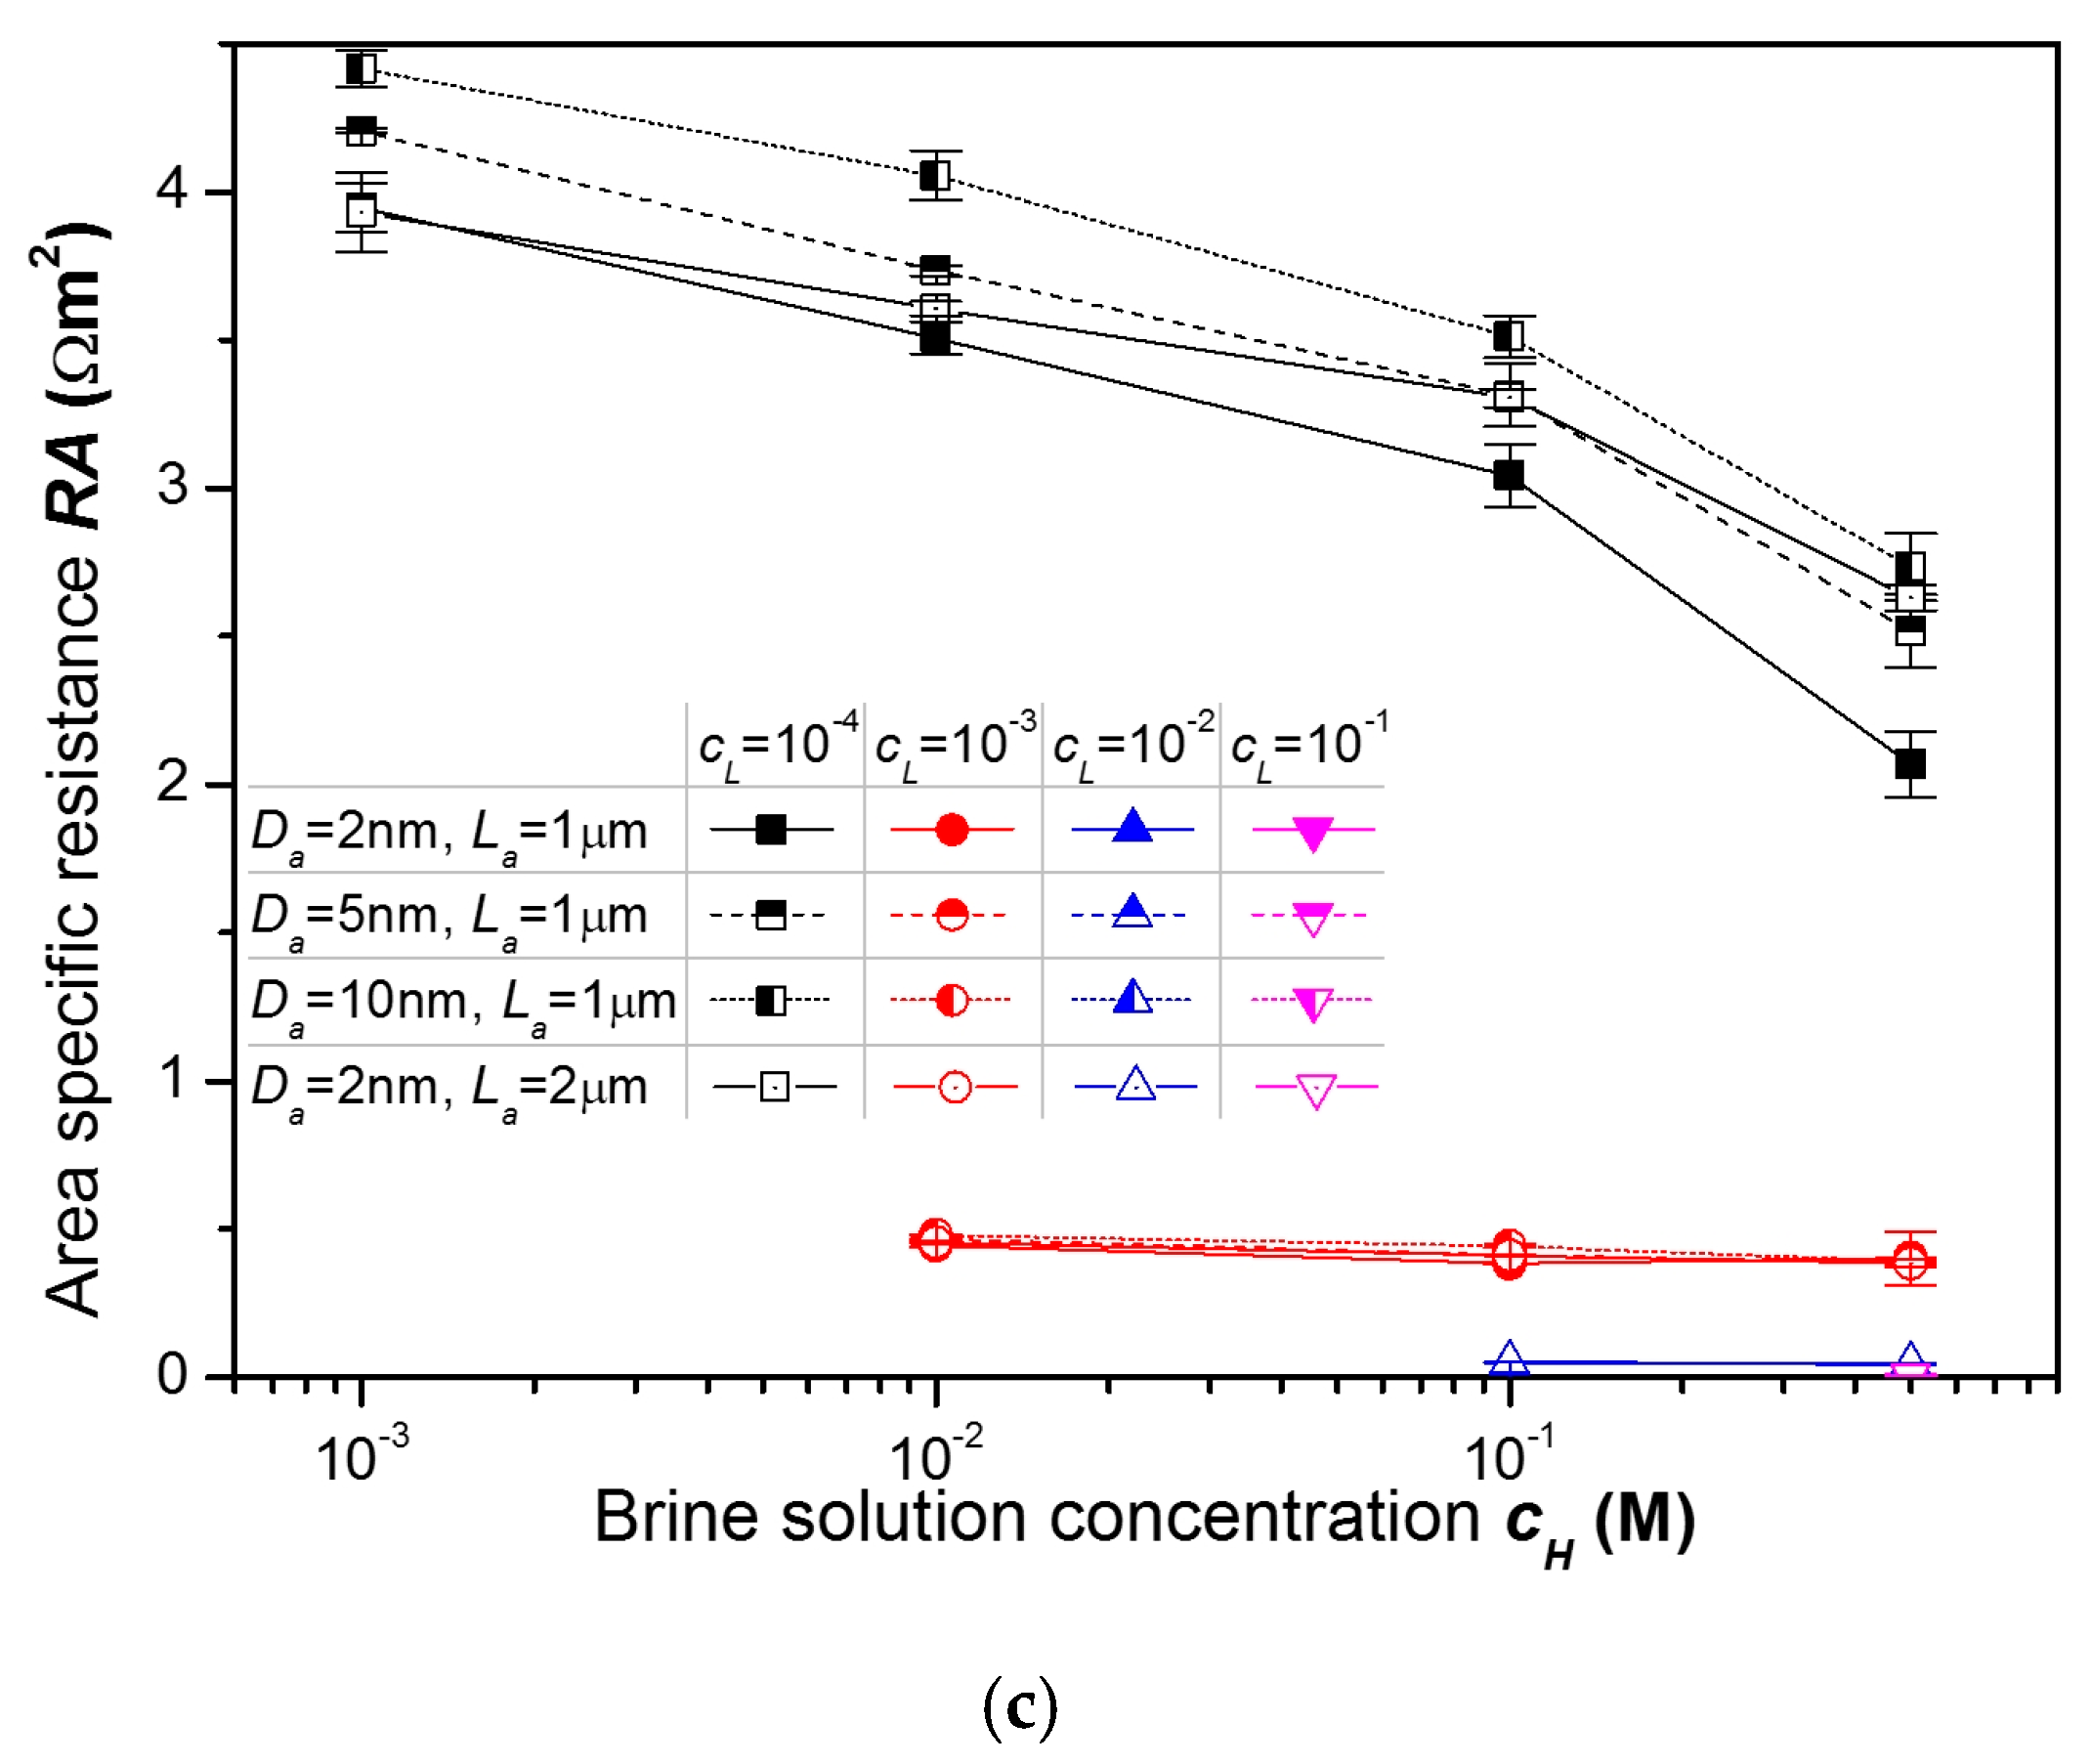
Figure 10 shows a comparison between the power densities, diffusion potentials, and area specific resistances for the anisotropic membranes with two different active layer lengths and three different active layer pore diameters. As shown in
Figure 10a, the change in the power density caused by the change in the length of the active layer is more than the change in the power density caused by the change in the nanopore diameter of the active layer. Therefore, the length of the active layer is a more important engineering parameter than the nanopore diameter of the active layer. The following facts were also recognized from
Figure 10:
- (a)
The effects of the dilute and brine solution concentrations on the power density, diffusion potential, and area specific resistance of the anisotropic membrane are similar regardless of the length of the active layer and the pore diameter the active layer.
- (b)
As shown in
Figure 10b, the longer the length of the active layer, the higher the diffusion potential. It is because the ion selectivity of the active layer increases as the active layer length increases, as explained earlier. On the other hand, the diffusion potential tends to increase with a decrease in the nanopore diameter. It is because the ion selectivity of the active layer is greater when the nanopore diameter of the active layer is smaller, due to higher Dukhin number shown in Equation (6).
- (c)
As depicted in
Figure 10c, the longer the length of the active layer with high electrical resistance, the higher the electrical resistance. On the other hand, the larger the nanopore diameter of the active layer, the larger the area specific resistance.
In the results so far, as mentioned in
Section 2 and shown in
Figure 1 and
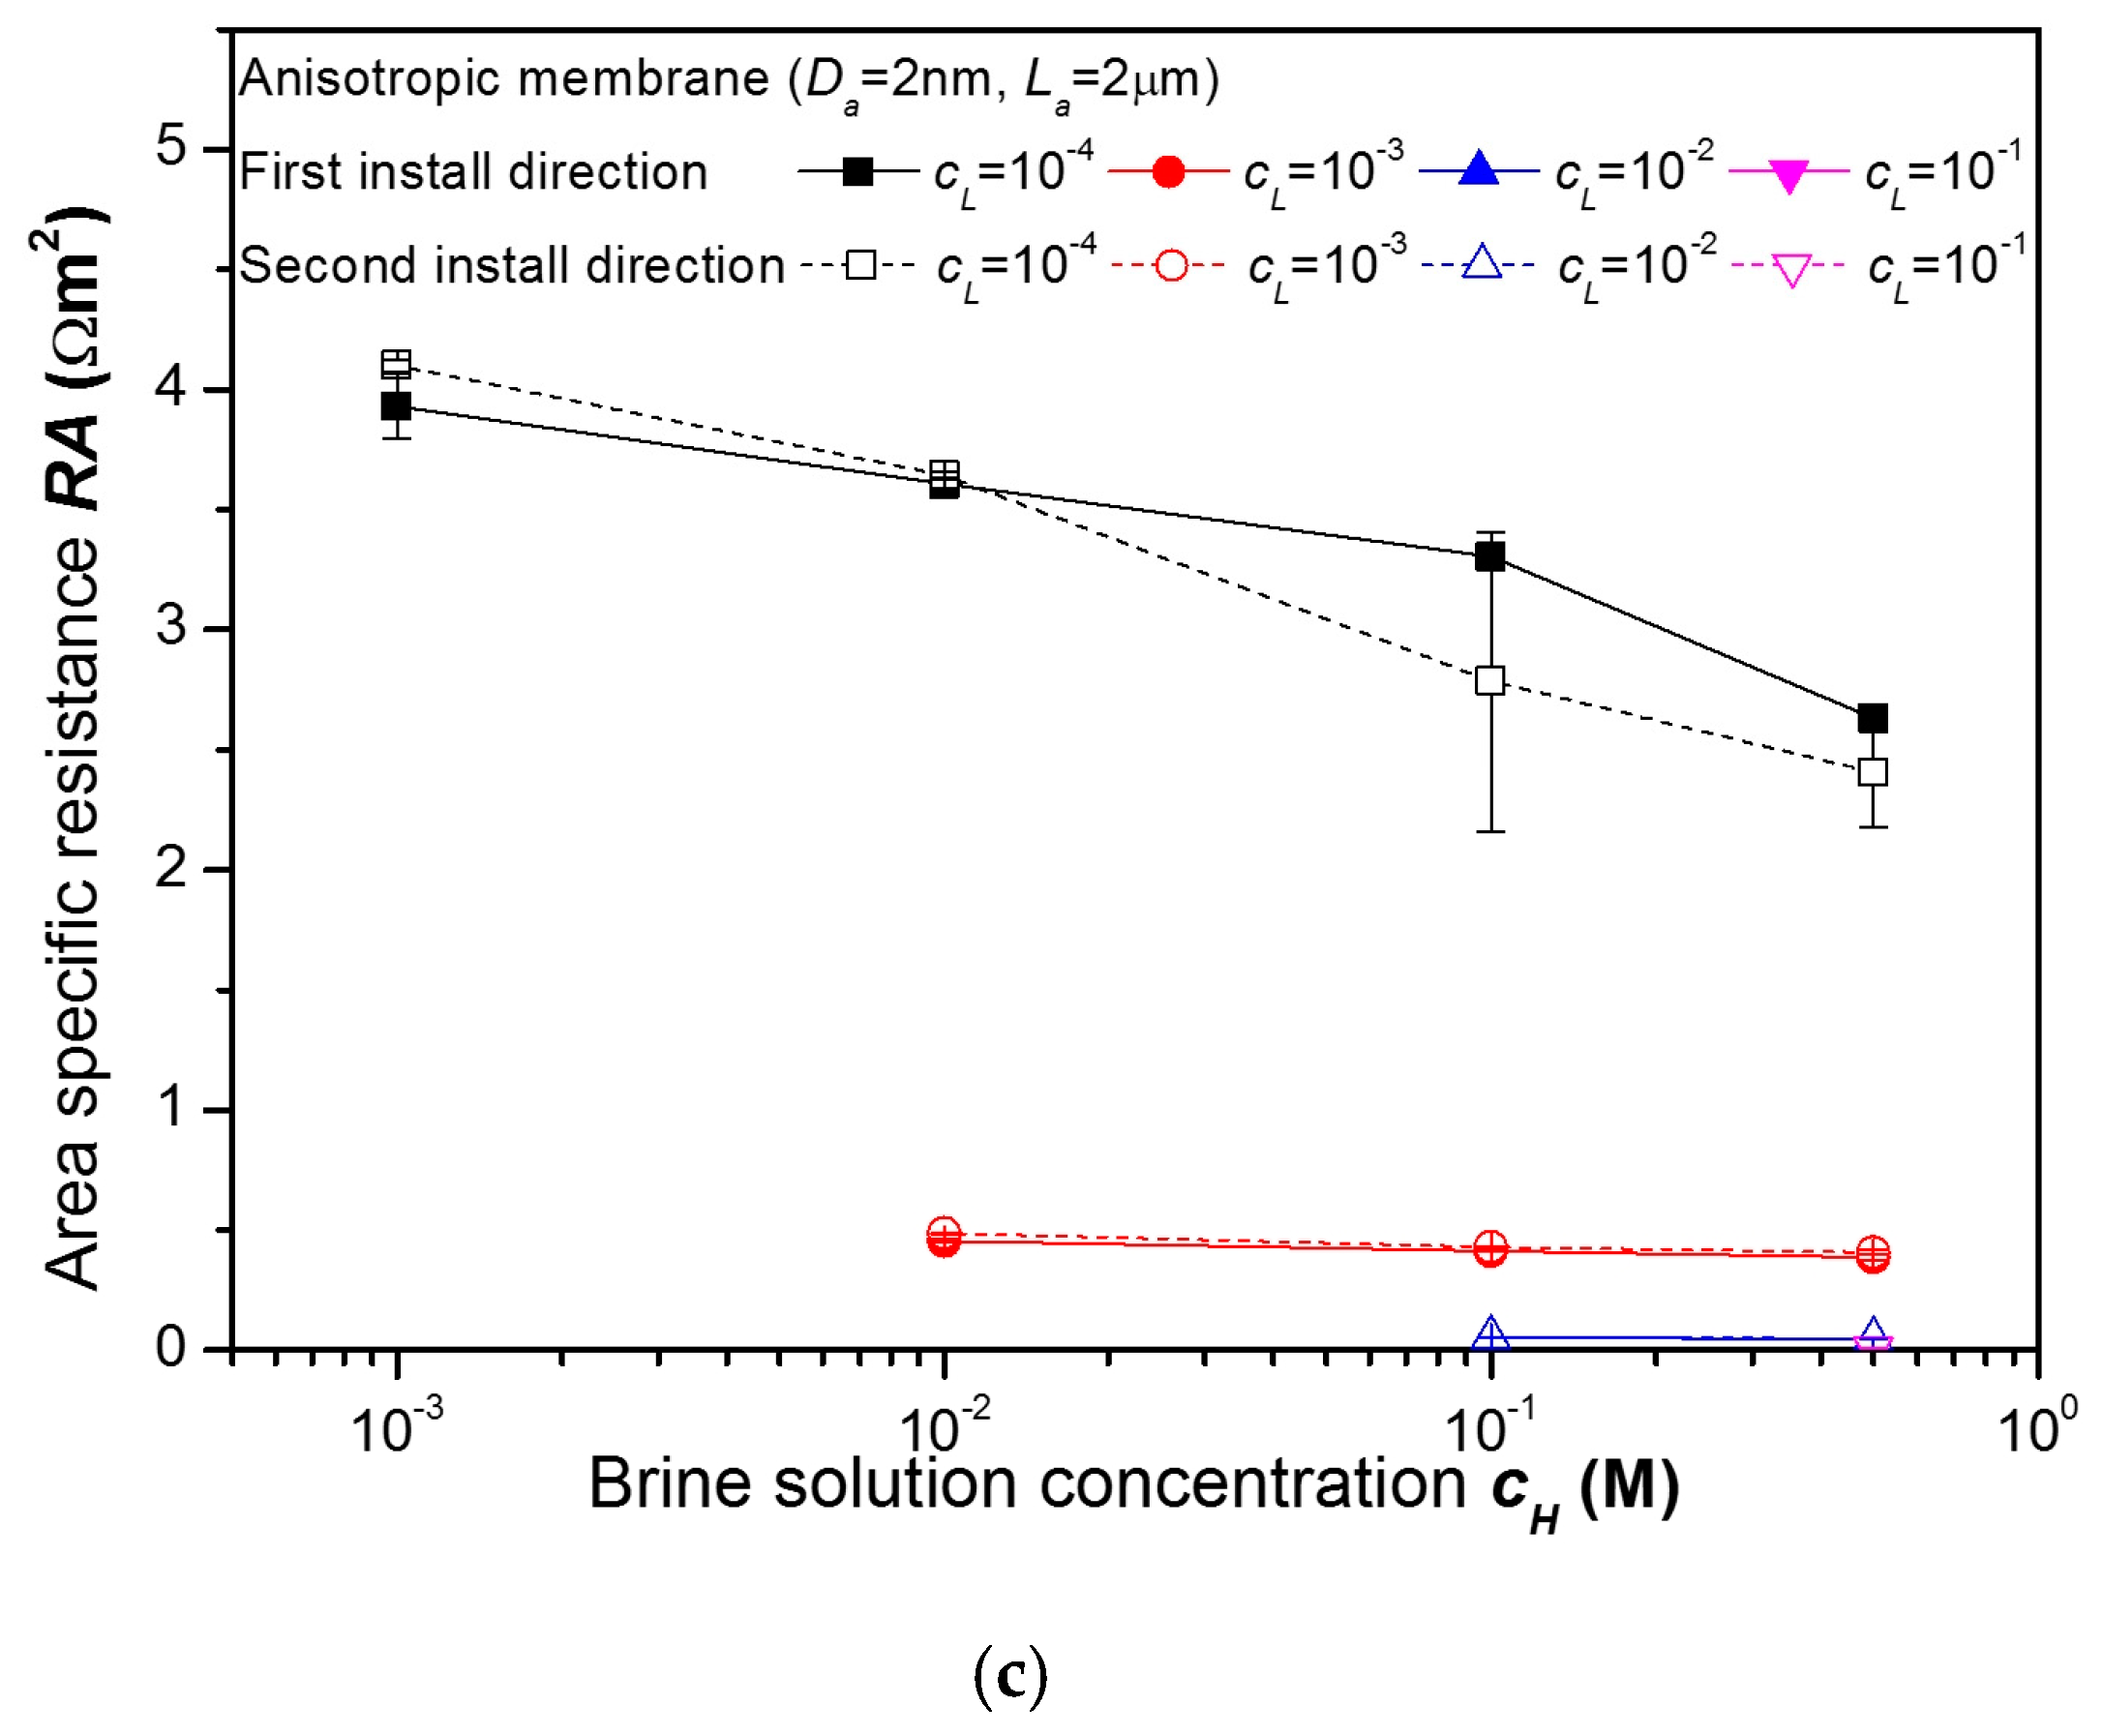
Figure 2b, a low concentration solution filled the reservoir on the active layer side of the membrane. However, with the anisotropic membrane not being symmetrical, the results depended on the installation direction. In
Figure 11, the results for the first installation direction with a low concentration solution filling the reservoir on the active layer side are compared with the results for the second installation direction with a high concentration solution filling the reservoir on the active layer side. As shown in
Figure 11, the first installation direction has a larger diffusion potential, similar area specific resistance, and a larger power density compared to the second configuration. This is mainly because the concentration of the solution in the active layer is lower when a low concentration solution filled the reservoir on the active layer side of the membrane. As a result, the Dukhin number is smaller, and the ion selectivity is greater for this case. Therefore, whenever an anisotropic membrane is used for reverse electrodialysis, a low concentration solution should be brought into contact with the active layer side of the membrane.


