Article

What’s Math Got to Do with It?: Establishing Nuanced Relations between Math Anxiety, Financial Anxiety, and Financial Literacy

Faculty of Social Sciences, School of Psychology, University of Ottawa, Ottawa, ON K1N 9A4, Canada
*
Author to whom correspondence should be addressed.
J. Risk Financial Manag. 2023, 16(4), 238; https://doi.org/10.3390/jrfm16040238
Submission received: 16 February 2023 / Revised: 30 March 2023 / Accepted: 8 April 2023 / Published: 12 April 2023
(This article belongs to the Special Issue Financial and Economic Literacy—Implications for Education)

Abstract

:
We investigate the relations between math anxiety, financial anxiety, and financial literacy while extending previous research in three ways. First, we examine the distinct subconstructs that comprise financial literacy (i.e., financial knowledge, confidence, attitudes, and behaviour). Second, we distinguish between financial knowledge items that are confounded with numeracy versus items that are not. Third, we control for trait anxiety. Using survey data from Canadian adults (N = 241), we demonstrate that math anxiety is negatively related to mathematical financial knowledge but is not related to conceptual financial knowledge, financial confidence, or financial behaviour. Financial anxiety, conversely, is negatively related to both mathematical and conceptual financial knowledge, financial confidence, and ideal financial behaviour. Our data suggest that, when considering financial literacy holistically, financial anxiety is more important than previously thought. These findings highlight the importance of distinguishing between the subconstructs that comprise financial literacy when attempting to understand individual differences that relate to financial literacy. Educators and policymakers looking to improve financial literacy would seemingly benefit from employing a targeted approach to decrease anxiety toward both math and finances.

1. Introduction

Many North American adults are not financially literate (Lusardi 2015; OECD 2016). They lack the knowledge, confidence, attitudes, and skills necessary to effectively manage their financial resources (Financial Consumer Agency of Canada 2015; OECD 2016, 2022), which can negatively impact both their individual financial well-being and the economic stability of the society in which they live (Sánchez Santos 2020). Due to its significance, many researchers have attempted to identify factors that relate to financial literacy. Both increased math anxiety (Guerrero 2020; Skagerlund et al. 2018) and financial anxiety (Archuleta et al. 2013; Grable et al. 2015; Kim et al. 2022; Medyanik 2020; Skagerlund et al. 2018) are linked to lower levels of various components of financial literacy. However, we contend that previous research has oversimplified these relations by adopting a broad definition of financial literacy, failing to consider the nuances between the subconstructs that it contains. Financial literacy is a multifaceted construct comprised of four subconstructs: financial knowledge, financial confidence, financial attitudes, and financial behaviour (Financial Consumer Agency of Canada 2015; OECD 2016). See Appendix A Table A1 for definitions of each construct (for a review, see Goyal and Kumar 2021). Based on the current literature, it is unclear whether anxiety about math or finances relates to one, multiple, or all subconstructs that comprise financial literacy.
In the present study, we build upon the contributions of Skagerlund et al. (2018), who identified numeracy (i.e., the ability to understand and apply simple numerical concepts) and math anxiety as core factors related to financial knowledge (a subconstruct of financial literacy). The authors urged future researchers to capture financial knowledge using tools less confounded with numeracy to increase the validity and reliability of these findings. We respond by making a meaningful distinction between financial knowledge items that require numeracy from those that do not (Objective 1). We further extend their work by examining the relations between anxiety (i.e., math and financial) and each component of financial literacy (i.e., financial knowledge, financial confidence, financial attitudes, and financial behaviour) independently (Objective 2). This distinction is critical for understanding the mechanisms through which these anxiety constructs relate to people’s overall financial literacy.

1.1. Financial Literacy

Being financially literate is paramount as economies shift financial responsibility from industries to individuals (Kempson et al. 2017; Lusardi 2012; Lusardi and Mitchell 2014). The onus of saving, investing, and managing money largely falls on the shoulders of ill-equipped consumers. The gravity of this situation is compounded further by the increasing complexity and availability of financial products and services, such as mortgage options, retirement plans, or credit cards (Government of Canada 2020; Lusardi 2015). It is no surprise that both researchers and policymakers consider financial literacy an imperative skill for individual financial well-being (Financial Consumer Agency of Canada 2015; Lee et al. 2020; U.S. Financial Literacy and Education Commission 2020). People who are financially literate save more money (Lusardi 2019), are more likely to prepare financially for retirement (Boisclair et al. 2017; Mustafa et al. 2023; van Rooij et al. 2011b), and are more likely to take part in financial markets (Chen et al. 2023; van Rooij et al. 2011a) with more diversified portfolios (von Gaudecker 2015). Importantly, the positive outcomes of financial literacy have a ripple effect on society more broadly, promoting financial inclusion (Grohmann et al. 2018) and contributing to economic stability (Sánchez Santos 2020).
Unfortunately, many adults are not considered financially literate based on global standards put forth by the Organisation for Economic Co-operation and Development (OECD) (OECD 2016, 2020). This is cause for concern as the cost of financial ignorance is high. Compared to people who are financially literate, people with lower levels of financial literacy engage more frequently in high-cost credit card behavior (Lusardi and Tufano 2015; Mottola 2013), are less likely to consult a financial advisor for advice (Calcagno and Monticone 2015), and, ultimately, accumulate less wealth over their lifetime (Lusardi and Mitchell 2014).
There have been attempts to rectify the issue of financial illiteracy through the implementation of financial education strategies in schools, workplaces, or other community-based organizations (Bartholomae and Fox 2021; Brugiavini et al. 2020; Cole et al. 2016; Kalwij et al. 2019; Lusardi 2003; Mandell and Klein 2009). Evidence on the efficacy of such educational interventions, however, is mixed. In a meta-analysis of 168 studies, Fernandes et al. (2014) found that interventions aimed at improving financial literacy accounted for a mere 0.1% of the variance in financial behaviours. Indeed, the authors noted that correlation studies examining the relation between financial literacy and financial behaviour reported larger effect sizes than studies implementing financial education interventions. Conversely, in a more recent meta-analysis of 76 experiments, Kaiser et al. (2022) found evidence to suggest that financial education programs had positive causal effects on both financial knowledge and downstream financial behaviour.
While this evidence is promising for the uptake of financial education strategies and improvements in financial literacy outcomes, the efficacy of such strategies and the acquisition of financial literacy, more generally, may be impacted by individual differences in cognition. For instance, Estelami and Estelami (2023) found that cognitive style moderated the relation between financial education and financial literacy. For people with analytic and intuitive cognitive styles, higher levels of financial education were associated with higher levels of financial literacy, but for people with adaptive cognitive styles, higher levels of financial education were associated with deficits in financial literacy (Estelami and Estelami 2023). More generally, researchers have identified many other individual characteristics that relate to a person’s level of financial literacy. For example, financial literacy is associated with age (de Bassa Scheresberg 2013; Finke et al. 2017; Lusardi and Mitchell 2014), education (de Bassa Scheresberg 2013; Lusardi and Mitchell 2012), and income (Lusardi and Tufano 2015). Financial literacy has also been linked to gender, such that those who identify as male tend to outperform those who identify as female on indices of financial literacy (Bucher-Koenen et al. 2017; Tinghög et al. 2021). Though there are undoubtably many factors that relate to a person’s level of financial literacy, we focus on individual differences in anxiety. Cognitive behavioural theory suggests that people’s thoughts, emotions, and behaviors are interconnected (Fenn and Byrne 2013; González-Prendes and Resko 2012). However, researchers often fail to acknowledge how emotions, such as anxiety, shape human behaviour (Friman et al. 1998). As such, we feel it prudent to examine two anxiety constructs that we expect will relate to various components of financial literacy: math anxiety and financial anxiety.

1.2. Relations between Math Anxiety and Financial Literacy

Many people feel fearful, tense, or apprehensive in situations involving numbers or computations, a phenomenon termed “math anxiety” (Ashcraft 2002; Maloney and Beilock 2012). Math anxiety is highly prevalent in North America amongst both teenagers (OECD 2013) and adults (Hart and Ganley 2019). There is an extensive body of research seeking to understand the negative academic-related consequences of math anxiety, as well as its causes and effective remediation strategies (for a review, see (Ramirez et al. 2018)). However, the literature largely ignores the importance of understanding and combating math anxiety in adulthood when people become responsible for making important financial decisions, often without much guidance.
There is ample evidence to suggest that a strong mathematical skillset is necessary to make informed financial decisions (e.g., (Gerardi et al. 2013; Lusardi 2012; OECD 2016)). Numeracy is positively related to components of financial literacy (Darriet et al. 2021), including ideal financial behaviour (for a review, see (Garcia-Retamero et al. 2019)) and financial knowledge (Lusardi 2012; Skagerlund et al. 2018), as well as financial well-being outcomes (de Bruin and Slovic 2021). Of concern is the well-established negative relation between numeracy and math anxiety (Ashcraft and Kirk 2001; Hembree 1990; Hill et al. 2016). Indeed, people who are higher in math anxiety tend to perform worse than those lower in math anxiety on assessments of numeracy (Ashcraft 2002; Hembree 1990). Math anxiety is theorized to cause lower numeracy both in the moment because of an anxiety-induced transient reduction in working memory (Ashcraft and Kirk 2001; Hunt et al. 2014) and long term because of an increased avoidance of math and math-related activities, leading to fewer opportunities to hone ones’ math skills (Daker et al. 2021; Gunderson et al. 2018; Maloney 2016).
Given the positive link between numeracy and financial literacy and the negative link between numeracy and math anxiety, it follows that people higher in math anxiety are at risk of underperforming on indices of financial literacy. Though research on this link is sparse, there is evidence supporting a negative relation between math anxiety and performance on various financial tasks. For example, Suri et al. (2013) found that consumers higher in math anxiety preferred discounts presented as dollar-off sales as opposed to percentage-off sales, even when it was to their financial detriment (Suri et al. 2013). Further, Storozuk et al. (2023) found that, when asked to choose the grocery product that represented the “better deal” (i.e., cost less per unit) between two options, participants higher in math anxiety were less likely to make the correct selection compared to those lower in math anxiety. These findings may be unsurprising given that both financial tasks required participants to use mathematical reasoning (i.e., numeracy). However, the distinction between what constitutes a mathematical task versus a financial task is unclear. These findings point to the possibility that the consequences of math anxiety extend beyond the classroom, negatively impacting performance in financial domains. Before we can draw such conclusions, more evidence is needed on how—and if— math anxiety relates to the various subconstructs that comprise financial literacy (i.e., financial knowledge, confidence, attitudes, and behaviour).

1.3. Relation between Financial Anxiety and Financial Literacy

Just as people experience anxiety about math, many people feel a sense of doubt, insecurity, or unease when thinking about financial affairs or making financial decisions, a phenomenon termed “financial anxiety” (Fünfgeld and Wang 2009). A financially anxious person may display unstable preferences, feeling regret over financial decisions either taken or not taken. Previous research has suggested financial anxiety is highly prevalent in North America, with over half (53%) of respondents to the FINRA Foundation’s 2018 National Financial Capability Study expressing feeling anxious about their finances (Lin et al. 2019). This finding is concerning, given that financial anxiety can prevent people from dealing effectively with their finances and, ultimately, impede personal economic growth. Indeed, people who are higher in financial anxiety are more likely than the overall population to borrow from themselves by making withdrawals from their retirement account (Hasler et al. 2021), max out their credit card (Sages et al. 2013), and spend more money than they earn. They are also more likely to be disinterested when presented with the opportunity to seek assistance from a professional financial counselor compared to those lower in financial anxiety (Grable et al. 2015). This is consistent with the evidence suggesting financial anxiety is associated with the tendency to avoid finance-related information (Shapiro and Burchell 2012).
In the context of financial literacy, there is evidence negatively linking financial anxiety to both financial knowledge (Gignac et al. 2023; Kim et al. 2022; Skagerlund et al. 2018) and financial confidence (Kim et al. 2022). That is, people who report being more financially anxious tend to obtain lower scores on assessments of objective and subjective financial knowledge. Though there is no research investigating the mechanisms underlying this relation, drawing from avoidance theory and the link between math anxiety and numeracy (Maloney 2016), we could speculate that this avoidance of financial information reduces people’s opportunities to hone their knowledge and skills about financial matters. It follows that individual experiences of financial anxiety should not be overlooked when considering a person’s overall financial literacy. Despite Americans citing finances as a root cause of worry (American Psychological Association 2015), empirical data on the relation between financial anxiety and financial literacy is lacking. Specifically, it remains unclear whether financial anxiety relates to the other subconstructs that comprise financial literacy (i.e., financial attitudes and behaviour).

1.4. Financial Literacy Measurement Strategies

Current measurement strategies for examining financial literacy pose a serious issue when drawing broader conclusions about financial literacy. Researchers often measure financial literacy using a set of three items devised by Lusardi and Mitchell, popularly referred to as the “Big Three” (Lusardi and Mitchell 2008).1 In line with our definition of financial literacy, we would consider the Big Three a measure of the subconstruct financial knowledge, not financial literacy in general, because the scale does not capture the other fundamental components that comprise financial literacy (i.e., financial confidence, attitudes, and behaviour). Further, when considering the relation between math anxiety and financial literacy, the use of the Big Three is not optimal, as it is heavily confounded with numeracy. Indeed, two of the three items require mathematical calculations to solve correctly. This makes it difficult to delineate the root of any relations associated with attitudes or affinity towards numbers.
This construct validity issue complicates the interpretation of studies that use the Big Three to evaluate financial literacy. For example, Skagerlund et al. (2018) identified math anxiety and financial anxiety as negatively related to “financial literacy,” arguing that a large part of financial literacy can be attributed to numeracy. Their results provide compelling evidence that a person’s ability to use and understand numbers, as well as their emotions surrounding numbers, plays an important role in financial literacy. However, given their use of the Big Three, we would argue that the authors demonstrated relations between math anxiety, financial anxiety, and financial knowledge (which we view to be a sub-construct of financial literacy), as opposed to financial literacy per se. Furthermore, the interpretation of the relation between numeracy and financial knowledge is hindered by the numerical nature of the Big Three.

2. The Present Study

In this manuscript, we build upon the contributions of Skagerlund et al. (2018), who identified numeracy, math anxiety, and financial anxiety as core factors related to financial knowledge (a subconstruct of financial literacy). While important, we cannot draw conclusions about relations to financial literacy more broadly as this work did not investigate whether math anxiety and financial anxiety relate to the other factors that comprise financial literacy (i.e., financial confidence, attitudes, and behaviour). We further contend that an important distinction can be made between financial knowledge items that require mathematical calculations versus those that do not, which may be particularly relevant in relation to math anxiety and numeracy.
Financial knowledge encompasses many concepts that do not directly involve numbers or math, such as familiarity with the different types of investment vehicles or the rules and regulations of banking (Knoll and Houts 2012). It is possible the relation between financial knowledge and math anxiety previously established by Skagerlund et al. (2018) is driven by the fact that people higher in math anxiety also tend to be lower in numeracy (Hembree 1990). Echoing Skagerlund et al. (2018), we do not question the validity of a financial knowledge measure that contains numbers and calculations, as many aspects of financial knowledge rely on a strong mathematical skillset. However, to understand the mechanisms that contribute to the acquisition of financial knowledge, we must tease apart financial knowledge items that are confounded with numeracy from items that are not.
We extend this previous research in three important ways. First, we examine the relations between anxiety (i.e., math and financial) and financial knowledge items that are mathematical versus those that are conceptual (Objective 1). Second, we explore the relations between anxiety (i.e., math and financial) and the other three components of financial literacy (i.e., financial confidence, attitudes, and behaviour) independently (Objective 2). Lastly, we control for trait anxiety in all models to confirm that the observed differences are not better explained by general anxiety (O’Leary et al. 2017).

Objectives and Hypotheses

Our first objective is to replicate the finding that financial anxiety and math anxiety are negatively related to financial knowledge. We expect people higher in financial anxiety to perform worse on a measure of financial knowledge compared to those lower in financial anxiety. We do not expect these relations to vary as a function of question type, as financial knowledge items that contain mathematical content are still inherently financial (Hypothesis 1a). Furthermore, we expect people higher in math anxiety to perform worse on a measure of financial knowledge, and we expect these relations to vary as a function of the type of financial knowledge question. That is, compared to people lower in math anxiety, we expect people higher in math anxiety to perform worse specifically on items that require numeracy (Hypothesis 1b).
Our second objective is to examine financial literacy as an entire construct. Specifically, we aim to determine whether relations exist between anxiety (i.e., math and financial) and the other three key components of financial literacy (i.e., financial confidence, attitudes, and behaviour). We expect financial anxiety to be negatively related to financial confidence (Hypothesis 2a), financial attitudes (Hypothesis 3a), and financial behaviour (Hypothesis 4a). We expect math anxiety to be negatively related to financial confidence (Hypothesis 2b) and financial behaviour (Hypothesis 4b). However, given that financial attitudes (i.e., preference for the short or long term) do not necessitate a mathematical skillset, we do not expect there to be a relation between math anxiety and financial attitudes (Hypothesis 3b).

3. Materials and Methods

3.1. Participants

We recruited Canadian residents to complete a 30-min online survey using multiple platforms: (1) Honeybee, a two-sided, online web platform that facilitates initial engagement between the researcher and the participants; (2) social media (i.e., Twitter, Facebook, and Instagram); (3) word of mouth; (4) Prolific, a forum for online recruitment tailored specifically to scientific researchers; (5) advertisements in undergraduate classrooms at a Canadian university; and (6) a participant database from a Canadian university. We offered participants a CAD 5 Amazon.ca gift card to thank them for completing the survey. Participants recruited through Prolific received GBP 3.50 (approximately CAD 6). Participation in this survey was confidential. We sent compensation to the email addresses provided by the participants and then deleted all addresses from the raw data as well as the outgoing emails from our mailbox. We are unable to link participants’ email addresses to their survey responses.
There was evidence in our data to suggest we received fraudulent responses from bots (i.e., malicious software applications programmed to complete automated tasks online) (for a review on bots, see (Storozuk et al. 2020)). For example, 75 people enrolled in our survey through Honeybee, but we received 184 responses on the survey link reserved for participants recruited through this platform. Thus, it is likely that 109 of these responses were fraudulent. Considering that invalid data have the potential to significantly alter study results at rates as low as 5% (Credé 2010), we applied a rigorous approach to data screening and cleaning based on guidelines provided by Storozuk et al. (2020). We excluded a total of 192 respondents from our sample. Please refer to Appendix B for detailed information on the exclusion procedure.
The final sample consists of 241 participants (n = 141 female), which is sufficient for the present study as correlations tend to stabilize with a sample of around 250 participants (Schönbrodt and Perugini 2013). Participants are between 18 and 69 years old (Mean = 30.83, SD = 10.38) and reported a range of educational experience: had not completed high school (0.4%), high school diploma (22.4%), college diploma (10.4%), Bachelor’s degree (49.4%), Master’s degree (14.9%), or Doctoral degree (2.5%).

3.2. Materials and Procedures

Each participant began the online survey by answering two gatekeeping items designed to be easy for humans to answer but difficult for bots (e.g., “If you were to arrange the following movies into alphabetical order, which movie title would come last?”). Participants only gained admittance to the survey if they answered both items correctly. After granting their consent to participate in the survey, participants then answered demographic items, followed by measures of anxiety, cognition, and finance in a randomized order. Lastly, participants completed a math assessment. See Appendix C for all measures. The average completion time was 26.13 min.2

3.2.1. Outcome Variables

Financial Knowledge. We measured financial knowledge using the 20-item full-form Financial Knowledge Scale (FKS) (Knoll and Houts 2012). Items cover topics on interest, inflation, time and value of money, investing, diversification of risk, housing, debt management, retirement savings, life insurance, and annuities. Items are presented as either true/false or multiple choice. Scores range from zero to 20, with higher scores indicating a better understanding of financial matters. Note that we rearranged the items, presenting conceptual items first, followed by mathematical items. Previous validation exercises supported the appropriateness of the scale, with scale scores predictive of outcomes known to be associated with financial literacy (Knoll and Houts 2012). This measure has previously demonstrated good marginal reliability (interpretation similar to alpha coefficient; 0.85). Cronbach’s alpha for the current sample was 0.82.
Financial Confidence. We measured financial confidence (also referred to as subjective financial knowledge) (Lind et al. 2020) by asking participants to rate their own financial knowledge on a scale from Very Low (1) to Very High (7). Scores range from one to seven, with higher scores indicating higher levels of confidence in their financial knowledge.
Financial Attitudes. We measured participants’ financial attitudes using the OECD’s three-item Financial Literacy Survey. This survey includes three attitude statements to gauge respondents’ attitudes toward money and planning for the future (OECD 2016). Each of the statements focuses on preferences for the short term through “living for today” and spending money (e.g., “Money is there to be spent”). Participants answered items on a five-point Likert scale ranging from Completely Agree (1) to Completely Disagree (5). Scores range from three to 15, with lower scores indicating a tendency to favour the short term and higher scores indicating a tendency to favour the long term. This measure has previously demonstrated acceptable internal consistency (α = 0.61) (OECD 2016). Cronbach’s alpha for the current sample was 0.69.
Financial Behaviour. We measured financial behaviour using the 15-item Financial Management Behaviour Scale (FMBS) (Dew and Xiao 2011). The FMBS assesses four domains of financial management behaviour: (1) savings and investments, (2) insurance, (3) cash management, and (4) credit management. Participants responded to items on a five-point Likert scale ranging from Never (1) to Always (5) or Not applicable to me.3 Scores range from 15 to 75, with higher scores indicating increased engagement in favourable financial behaviour. The FMBS has previously demonstrated good internal consistency (α = 0.81) (Dew and Xiao 2011). Cronbach’s alpha for the current sample was 0.76.

3.2.2. Variables of Interest

Financial Anxiety. We measured financial anxiety using the four-item Financial Anxiety Scale (Fünfgeld and Wang 2009). The scale contains statements such as “I am anxious about financial and money affairs” and “I get unsure by the lingo of financial experts”. Participants answered items on a five-point Likert scale ranging from Strongly disagree (1) to Strongly agree (5). Scores range from four to 20, with higher scores indicating higher levels of financial anxiety. Cronbach’s alpha for the current sample was 0.80.
Math Anxiety. We measured math anxiety using the nine-item Abbreviated Math Anxiety Scale (AMAS) (Hopko et al. 2003). Participants rated how anxious they would feel in a variety of situations (e.g., “Thinking about an upcoming math test one day before”) on a five-point Likert scale ranging from Low Anxiety (1) to High Anxiety (5). Scores range from five to 45, with higher scores indicating higher levels of math anxiety. This measure has previously demonstrated good to excellent internal consistency (α = 0.83 to 0.90) and good test-retest reliability (r = 0.83) (Hopko et al. 2003). Cronbach’s alpha for the current sample was 0.90.

3.2.3. Control Variables

Demographics. We asked participants a series of demographic questions, including age, gender, income, and education. We did not ask participants to disclose their ethnic background. As previously outlined, these demographic variables relate to financial literacy, and, as such, we controlled for these factors in all models.
General anxiety. General anxiety refers to feelings of stress, worry, or discomfort towards a wide range of experiences and situations (Spielberger et al. 1982). Though general anxiety is moderately correlated with math anxiety (r = 0.44) (Hart and Ganley 2019) and with financial anxiety (r = 0.39) (Shapiro and Burchell 2012), these anxiety constructs are widely considered to be distinct from each other (Ashcraft and Ridley 2005; Dowker et al. 2016; Hart and Ganley 2019; Hembree 1990; Shapiro and Burchell 2012).
We measured trait anxiety using the 20-item trait subscale of the State-Trait Anxiety Inventory (STAI-T) (Spielberger et al. 1982). Participants answered items on a four-point Likert scale ranging from Not at all (1) to Very much so (4). The questionnaire included positive (e.g., “I am a steady person”) and negative (e.g., “I worry too much over something that really doesn’t matter”) items, with positive items being reversed, scored, and combined with the negative items. Scores range from 20 to 80, with higher scores indicating higher levels of trait anxiety. This measure has previously demonstrated good internal consistency (α= 0.78) and good test-retest reliability (r = 0.85) (Vitasari et al. 2011). Cronbach’s alpha for the current sample was 0.94.
Numeracy. We measured numeracy using the 10-item Brief Mathematics Assessment 3 (BMA-3) (Steiner and Ashcraft 2012). Participants completed arithmetic (whole numbers and fractions) and algebra computation procedures that did not require a calculator. For example, one question asked participants to write 0.025 as a fraction in the lowest terms. Although there are 10 items, one item is a two-part question. Thus, scores range from zero to 11, with higher scores indicating higher numeracy. This measure has previously demonstrated good internal consistency (α = 0.69) and correlates (r = 0.66) with the commonly used Wide Range Achievement Test 4 (WRAT4) (Steiner and Ashcraft 2012). Cronbach’s alpha for the current sample was 0.68.

4. Results

We conducted all analyses using IBM SPSS Statistics for Macintosh Version 28.0 (IBM Corp 2021). See Table 1 for the zero-order correlations and the descriptive information for all variables.

4.1. Missing Data Analysis

Not all participants completed every measure. As such, we have noted the sample size for each analysis. Occasionally, some participants did not respond to an item on a scale (<1.3%). To confirm that data were missing completely at random (MCAR), we performed Little’s MCAR test. Non-significant results indicate that the data was MCAR, χ2 (1350) = 1382.46, p = 0.264. Thus, to address missing data, we conducted multiple imputations with a maximum of 50 iterations. If a participant did not complete any items on a given scale, we did not impute values.

4.2. Assumption Testing

We first determined that our data met the assumptions necessary to preform multiple regression analyses. For relations to financial knowledge, there was linearity as assessed by partial regression plots and a plot of studentized residuals against the predicted values. There was the independence of residuals, as assessed by a Durbin–Watson statistic of 1.729. There was homoscedasticity, as assessed by visual inspection of a plot of studentized residuals versus unstandardized predicted values. There was no evidence of multicollinearity, as assessed by tolerance values greater than 0.1. There were no leverage values greater than 0.2 or values for Cook’s distance above 1. The assumption of normality was met, as assessed by a Q-Q plot. Based on these results, we proceeded with the analysis.

4.3. Analyses for Objective 1: Relations to Financial Knowledge

As stated above, we expect people higher in financial anxiety to perform worse (compared to people lower in financial anxiety) on both mathematical and conceptual financial knowledge items (H1a). We expect people higher in math anxiety to perform worse on an assessment of financial knowledge (compared to people lower in math anxiety) specific to items that require numeracy (H1b). To test these hypotheses, we conducted two multiple regressions to determine whether math anxiety and financial anxiety are related to mathematical and conceptual financial knowledge. In examining relations to mathematical financial knowledge, there were no outliers. In examining relations to conceptual financial knowledge, we removed two participants flagged as outliers (i.e., studentized deleted residuals greater than −3.29 standard deviations) (Tabachnick and Fidell 2013).
For each regression, Model 1 includes variables known to be related to financial literacy (i.e., age, gender, education, income, and numeracy), and Model 2 includes general anxiety (as a control), math anxiety, and financial anxiety (see Table 2). In the first regression, the dependent variable is performance on mathematical items of the FKS, and in the second regression, the dependent variable is performance on conceptual items of the FKS. We then conducted t-tests for dependent correlations to determine if math anxiety and financial anxiety are more strongly related to either financial knowledge items that are mathematical or conceptual. Note that we control for recruitment method in all reported analyses.

4.3.1. Relations to Mathematical Financial Knowledge

We first conducted a multiple regression analysis to determine whether math anxiety and financial anxiety relate to mathematical financial knowledge. The model of interest (Model 2), which included age, gender, education, income, numeracy, as well as general, math, and financial anxieties, significantly related to performance on mathematical items of the FKS, F(9, 228) = 12.707, p < 0.001, adj. R2 = 0.308. This indicates that, above and beyond the variance explained by variables known to be related to financial literacy in Model 1 (adj. R2 = 0.229), Model 2 accounted for an additional 7.9% of the variance in mathematical financial knowledge. Both math anxiety (β = −0.230, p < 0.001) and financial anxiety (β = −0.187, p = 0.005) were significantly related to mathematical financial knowledge, where higher levels of math and financial anxiety related to lower scores on mathematical items of the FKS. See Table 2 for all regression coefficients, standard errors, and confidence intervals.

4.3.2. Relations to Conceptual Financial Knowledge

We then conducted a parallel multiple regression analysis to determine whether math anxiety and financial anxiety relate to conceptual financial knowledge (see Table 2). The model of interest (Model 2) is significantly related to conceptual financial knowledge, F(9, 227) = 13.519, p < 0.001, adj. R2 = 0.323. The inclusion of anxiety constructs accounted for an additional 7.2% of the variance in performance on conceptual financial knowledge. Notably, math anxiety was not related to conceptual financial knowledge. Financial anxiety was significantly related to conceptual financial knowledge (β = −0.308, p < 0.001), whereby higher levels of financial anxiety related to lower scores on conceptual items of the FKS.

4.3.3. Strength of the Relations between Financial Anxiety and Financial Knowledge

We then conducted a t-test for comparing dependent correlations to test the hypothesis that financial anxiety does not relate more strongly to either financial knowledge that is mathematical or conceptual (H1a). A comparison of the semi-partial correlations controlling for age, gender, education, income, numeracy, general anxiety, and math anxiety demonstrated that financial anxiety relates more strongly to performance on conceptual items of the FKS (r = −0.251) compared to mathematical items (r = −0.152), t(240) = 1.69, p = 0.046. Thus, our second hypothesis was only partially supported, as financial anxiety was negatively related to both mathematical and conceptual financial knowledge (as predicted) but was more strongly related to conceptual items compared to mathematical items (counter to our prediction).
Given that math anxiety was not related to conceptual financial knowledge, we did not conduct a follow-up t-test to test the hypothesis that math anxiety relates more strongly to mathematical financial knowledge than conceptual financial knowledge. However, the absence of a relation between math anxiety and conceptual items of the FKS supports our hypothesis that math anxiety is only related to financial knowledge through items that contain mathematical content (H1b).

4.4. Analyses for Objective 2: Relations to Financial Literacy

We then conducted a series of multiple regressions to determine whether relations exist between anxiety (i.e., math and financial) and the other three subconstructs of financial literacy (i.e., financial confidence, attitudes, and behaviour). The independent variables in Model 1 included variables known to be related to financial literacy (i.e., age, gender, education, income, and numeracy), and in Model 2, we added general anxiety (as a control), math anxiety, and financial anxiety. All analyses controlled for recruitment method.

4.4.1. Relations to Financial Confidence

We conducted a multiple regression to determine whether math anxiety and financial anxiety relate to financial confidence (see Table 3). We removed one participant flagged as an outlier, and the data met all other assumptions necessary to perform a multiple regression.4 The model of interest (Model 2) was significantly related to financial confidence, F(9, 227) = 14.048, p < 0.001, adj. R2 = 0.332. The addition of anxiety constructs to the model accounted for an additional 17.8% of the variance in a person’s financial confidence. In partial support of our second hypothesis, financial anxiety was significantly related to financial confidence (H2a; β = −0.500, p < 0.001). However, we did not find a relation between math anxiety and financial confidence (H2b).

4.4.2. Relations to Financial Attitudes

We then conducted a multiple regression to determine whether math anxiety and financial anxiety relate to financial attitudes (see Table 4). We removed one participant flagged as an outlier, and the data met all other assumptions.5 The model of interest (Model 2) was significantly related to financial attitudes, F(9, 227) = 3.500, p < 0.001, adj. R2 = 0.087. The addition of anxiety constructs to the model accounted for an additional 3.5% of the variance in financial attitudes. Our third hypothesis was not supported, as financial anxiety was not related to financial attitudes (H3a). Furthermore, though we did not expect a relation between math anxiety and financial attitudes (H3b), our data demonstrated a positive link between these constructs (β = 0.218, p = 0.002). This indicates people who are more anxious about math are more likely to demonstrate long-term preferences with their money. However, it should be noted that Model 2 did not account for a large proportion of variance (only 3.5%). This result should therefore be interpreted with caution and requires further investigation.

4.4.3. Relations to Financial Behaviour

We conducted a final multiple regression to determine whether math anxiety and financial anxiety relate to financial behaviour (see Table 5). The data met all assumptions.6 The model of interest (Model 2) was significantly related to financial behaviour, F(9, 229) = 12.969, p < 0.001, adj. R2 = 0.312. The addition of anxiety constructs to the model accounted for an additional 8.7% of the variance in financial behaviour. In partial support of our fourth hypothesis, financial anxiety was significantly related to financial behaviour (H4a), β = −0.292, p < 0.001. However, we did not find a relation between math anxiety and financial behaviour (H4b).

5. Discussion

Financial literacy levels in North America have been below an acceptable standard for decades (Lusardi and Mitchell 2014; OECD 2016, 2020) but attempts to improve financial literacy through educational strategies have been unsuccessful (Cole et al. 2016; Fernandes et al. 2014; Mandell and Klein 2009). One explanation for this failure could be that educational interventions tend to focus on content knowledge and ignore the role of individual differences (e.g., Estelami and Estelami 2023). In this paper, we highlight a subset of affective factors that relate to financial literacy. To our knowledge, the relations between math anxiety, financial anxiety, and financial literacy have been studied only once before (see Skagerlund et al. 2018). Using the work of Skagerlund et al. (2018) as a departure point, we replicated the finding that math anxiety and financial anxiety are negatively related to financial knowledge while controlling variables known to be related to financial literacy (i.e., age, gender, education, and income). We extended the previous work by also controlling for general anxiety and measuring financial knowledge using a tool less infused with mathematical content, which is imperative when considering relations to both math anxiety and numeracy. Further, we moved beyond relations to financial knowledge and measured financial literacy using a nuanced approach, assessing relations to financial confidence, attitudes, and behaviour.
When considering all subconstructs that comprise financial literacy (i.e., financial knowledge, confidence, attitudes, and behaviour), our data indicates that financial anxiety is a more important factor in relation to financial literacy than previously thought (e.g., Skagerlund et al. 2018). Financial anxiety was negatively related to all components of financial literacy, apart from financial attitudes. Though financial anxiety was negatively related to both mathematical and conceptual financial knowledge, financial anxiety was more strongly related to conceptual financial knowledge. Perhaps people with higher levels of financial anxiety consider mathematical financial knowledge items as “math questions” as opposed to “finance questions”. Indeed, people who are anxious about finances are not necessarily also anxious about math. By focusing on the mathematical aspect of the question, people with financial anxiety may experience less of the negative effects associated with their anxiety when completing mathematical items compared to the conceptual items.
Our findings further support the negative relation established by Skagerlund et al. (2018) between math anxiety and financial knowledge but provide further clarity on the mechanisms through which this relation occurs. Namely, the negative relation between math anxiety and financial knowledge appears to be driven by the negative link between math anxiety and numeracy. Being anxious about math was not related to a person’s conceptual understanding of financial topics (e.g., knowing the difference between stocks and bonds) but was related to their ability to arrive at a correct response for items that required numeracy (e.g., understanding the additive nature of compound interest). This finding may seem unsurprising, given that people who are higher in math anxiety tend to perform worse on assessments of numeracy (Hembree 1990). However, until now, our empirical understanding of how math anxiety relates to financial knowledge derived from relations to a tool largely confounded with numeracy (i.e., the Big Three; Lusardi and Mitchell 2008).
One theory as to why math anxiety is negatively related to numeracy is that math anxiety co-opts important working memory resources needed to perform mathematical computations (Ashcraft and Kirk 2001; Hunt et al. 2014). Another possibility is that being anxious about math has led to a lifetime of avoiding opportunities to enhance numeracy (Maloney 2016). The correlational nature of our research does not permit us to make causal inferences about the roles numeracy or math anxiety play in the acquisition of financial knowledge. It is worth noting, however, that the negative relation between math anxiety and mathematical financial knowledge remained even when accounting for a person’s level of numeracy. This result suggests that being good at math is not enough to safeguard a person against the negative consequences of being anxious about math (in the context of a financial knowledge assessment with mathematical elements).
Furthermore, and in line with previous research (Lusardi 2012; Skagerlund et al. 2018), we found a positive relation between numeracy and both mathematical and conceptual financial knowledge. That is, people who obtained higher scores on our numeracy assessment were also more likely to obtain higher scores on the financial knowledge assessment, even if the items did not require numeracy to solve correctly. This finding suggests that having a firm understanding of, and ability to use, numbers is important when bolstering financial knowledge more broadly. This finding is consistent with the notion that efforts to improve financial knowledge may benefit by committing resources to enhance numeracy (Skagerlund et al. 2018). However, while we agree that increasing numeracy is a worthwhile endeavor, our data suggest that, with respect to financial literacy, enhancing numeracy may only yield benefits for certain subconstructs. For instance, we did not find evidence of a link between numeracy and financial confidence or financial behaviour. Enhancing numeracy would thus have little effect on a person’s confidence in their financial knowledge or their engagement in financial behaviours that would lend themselves to financial well-being.
The lack of a relation between numeracy and financial behaviour, however, is counter to the findings presented by Cole et al. (2016). The authors reported that an increase in math courses in the U.S. high school curriculum related to improvements in financial behaviours, such as greater market participation, investment income, and better credit management (Cole et al. 2016). It is possible that these specific behaviours outlined in the Cole et al. (2016) work require higher levels of numeracy compared to the financial behaviours measured in our current assessment. Just as we divided the financial knowledge assessment into mathematical versus conceptual items, the financial behaviour assessment may also benefit from separation based on numeracy. However, while it was relatively simple to distinguish between knowledge items that require numeracy from those that did not, this distinction is much less clear for financial behaviour items. For instance, it would not require numeracy for someone to maintain an emergency savings fund through automatic deductions from monthly paycheques. However, if someone made manual deposits to the savings fund based on a fluctuating income, one could argue this fund would require numeracy to maintain. The ambiguity in what constitutes a numerical financial task presents challenges, especially when attempting to delineate relations between numeracy and math anxiety. Indeed, this complication may provide one explanation as to why we also did not find a relation between math anxiety and financial behaviour. To better understand the intricacies of these relations, more research is needed on the links between specific financial behaviours, numeracy, and math anxiety.

Implications for Education

A greater understanding of the factors that underly individual differences in financial literacy is not only of theoretical importance; it is also necessary for the creation of educational strategies designed to increase financial literacy within a given population. Our results suggest that people who experience greater degrees of financial anxiety may represent a financially vulnerable population. Current educational strategies tend to focus solely on content knowledge, ignoring the affective component associated with financial literacy. Attempting a “one-size fits all” educational approach will not be successful. Rather, we must take a more holistic approach to tackling financial literacy by also addressing attitudes. Policymakers and educators looking to improve financial literacy may benefit from implementing intervention strategies aimed at lessening people’s financial anxiety.
Our data further support the push to increase financial knowledge by lessening people’s math anxiety. When creating educational interventions designed to improve financial knowledge, it is necessary to consider the distinction between mathematical and conceptual knowledge. Interventions aimed at solely targeting math anxiety would only yield benefits for people’s financial knowledge that are inherently mathematical, but these benefits likely would not translate to conceptual financial knowledge. Thus, such interventions may not be as beneficial as researchers have previously thought when looking to improve financial knowledge in its entirety (Skagerlund et al. 2018). While finding a time and place to implement remediation strategies to counter math and financial anxiety in students is made relatively easy due to compulsory math courses and the school setting, finding a time and place to counter math and financial anxiety in adults is challenging. This is especially true given that highly math-anxious adults tend to avoid math courses, making them less likely to qualify for math-dependent careers (Ahmed 2018; Daker et al. 2021; Hart and Ganley 2019). It is, therefore, imperative to integrate both content and affective factors within future financial education strategies.

6. Limitations

One strength of this work is that it spans research typically carried out within both psychology and economics. While our sample size is considered adequate within many psychology studies (e.g., (Schönbrodt and Perugini 2013; Wilson Vanvoorhis and Morgan 2007)), we acknowledge that our sample may be considered small from the perspective of an economics audience. We also acknowledge the results of this study cannot be assumed to generalize to the entire population. In this respect, these data can be considered an initial approach to understanding how these factors relate to different subsets of the population. Indeed, while we collected data on age, gender, education, and income, we did not collect data on race or ethnicity. Furthermore, in the current sample, we do not have balanced groups with respect to age or gender. The average age of the Canadian population in 2022 was 41.7 years (Statistics Canada 2022), while the average age of our sample was 30.83 years (SD = 10.38). This suggests that our sample data are positively skewed and are not representative of age demographics in Canada. Additionally, more participants in our sample identified as women (n = 141) compared to men (n = 100). It is, of course, possible that the magnitude of the reported effects may vary as a function of these demographic factors. Future investigations would do well to explore if these additional demographic factors do, indeed, have moderating effects on the reported relations between math anxiety, financial anxiety, and the subconstructs of financial literacy.

7. Conclusions

From an individual, societal, and economic perspective, enhancing financial literacy is a significant issue of our time. Our data suggest relations exist between anxiety and financial literacy, but just as financial literacy is multifaceted, these relations are also complex. Efforts to increase financial literacy would benefit from considering each subconstruct of financial literacy individually. Future directives should also consider reducing financial anxiety and math anxiety to improve the efficacy of current financial education strategies.

Author Contributions

Conceptualization, A.S. and E.A.M.; methodology, A.S. and E.A.M.; software, E.A.M.; validation, A.S. and E.A.M.; formal analysis, A.S. and E.A.M.; investigation, A.S. and E.A.M.; resources, E.A.M.; data curation, A.S. and E.A.M.; writing—original draft preparation, A.S.; writing—review and editing, A.S. and E.A.M.; visualization, A.S.; supervision, E.A.M.; project administration, E.A.M.; funding acquisition, A.S. and E.A.M. All authors have read and agreed to the published version of the manuscript.

Funding

This research has been funded by a Natural Sciences and Engineering Research Council of Canada Discovery Grant (DGECR/2018-00303) and Social Sciences and Humanities Research Council Insight Development Grant (430-2018-0329) to E.A.M and a Social Sciences and Humanities Research Council Doctoral Scholarship to A.S.

Data Availability Statement

Data will be made publicly available on the Open Science Framework upon publication.

Conflicts of Interest

The authors declare no conflict of interest. The funders had no role in the design of the study; in the collection, analyses, or interpretation of data; in the writing of the manuscript; or in the decision to publish the results.

Appendix A

Table A1. Terminology and Definitions of Key Constructs.
ConstructsTermDefinition
Parent ConstructFinancial literacyA combination of knowledge, confidence, attitudes, and behaviour necessary to achieve financial well-being (Financial Consumer Agency of Canada 2015; OECD 2016).
SubconstructFinancial knowledge“Knowledge acquired through education and/or experience specifically related to essential personal finance concepts and products” (Huston 2010, p. 307)
SubconstructFinancial confidenceA person’s subjective rating of their level of financial knowledge, also referred to as ‘subjective financial knowledge’ (Lind et al. 2020).
SubconstructFinancial attitudesAttitudes towards money and planning for the future. A person who focuses exclusively on the short term is considered to have a less financially literate attitude than someone who prefers longer-term security (OECD 2016).
SubconstructFinancial behaviourThe extent to which a person behaves in financially literate ways. For example, behaviours such as budgeting, thinking before making a purchase, paying bills on time, and saving and borrowing to make ends meet are considered financially literate behaviours (OECD 2016).
OutcomeFinancial well-being“A state of being wherein a person can fully meet current and ongoing financial obligations, can feel secure in their financial future, and is able to make choices that allow enjoyment of life” (CFPB 2015, p. 18).

Appendix B

We excluded a total of 192 respondents from our sample. We followed the screening procedure sequentially. As such, though many participants violated multiple filters, each n value represents a single participant. For example, if a participant provided an ineligible postal code, we did not screen them in subsequent filters, and thus, they are not represented in the n values of other filters. Thirteen participants failed to successfully complete the initial gatekeeping questions and did not gain access to the survey, and four participants did not consent to participate in the survey. We removed participants who provided an ineligible postal code address (n = 11) or who indicated that they were not a resident of Canada (n = 2). We removed participants who completed the survey twice (as evidenced by providing the same email address; n = 6), who completed less than 35% of the survey (n = 3), and who failed two or more of the three attention checks in our survey (n = 21) (Curran 2016). We flagged one participant as a univariate outlier on the math anxiety scale (i.e., z-score 3 standard deviations above the mean), but we opted to retain them in the sample as we did not feel it would be appropriate to remove a participant for scoring highly in the trait we are most interested in examining. We used long-string analysis to identify participants who used the same response category consecutively throughout measures that require reverse scoring (i.e., the State-Trait Anxiety Inventory; Yan 2008). We removed participants with a string of consistent responses equal to or greater than three-quarters the length of the total scale (n = 5). Though the Financial Knowledge Scale is not a reverse-coded scale, we removed people whose response behaviour reflected inattention (i.e., selecting “Option 1” consecutively) as opposed to uncertainty in their answer (i.e., selecting “I don’t know” consecutively; n = 2). We removed participants who provided the same occupation (i.e., “Web designer” and “Dog trainer”) in succession with 12 other respondents (n = 4).7 We flagged participants who provided a suspicious email address to collect compensation (i.e., followed remarkable patterns relative to other respondents in close temporal proximity; Storozuk et al. 2020) and (NO_PRINTED_FORM) who provided open-ended responses that we considered nonsensical (e.g., “Won also want to overweight, winning margin into after…”) (Chmielewski and Kucker 2020) or that appeared to be copy-and-pasted information about finances unrelated to the question8 (e.g., “Deposits of funds flexible, low yield, but the funds are safe, can also meet your capital needs”; Storozuk et al. 2020). Of these flagged participants, we further flagged those who provided the same postal code address. We removed participants who offended at least two of these bot indicators (i.e., suspicious email, suspicious open-ended responses, same postal code; n = 87). We also removed participants based solely on their suspicious open-ended responses (n = 4). We set an arbitrary cut-off for completion speed and removed participants who completed the survey in under 6.5 min (n = 12), as we designed the survey to take approximately 30 min to complete. Of the participants we retained in the sample, the fastest completion speed was 8.5 min. Finally, we removed participants who did not identify as male or female (n = 1), who did not disclose their educational experience (n = 2), and who did not disclose their income bracket (n = 15), as all analyses control for binary (i.e., male or female) gender identification, education, and income.

Appendix C

Appendix C.1. Bot Detection Questions

You need to successfully answer both questions to proceed to the study. If you are unable to do so, you will not qualify for the study and will receive no compensation.
  • If you were to arrange the following movies into alphabetical order, which movie title would come last?
    • Fantasia
    • Mulan
    • Hotel Transylvania
    • Finding Nemo
    • Little Miss Sunshine
    Correct response: Mulan
  • Please read the statement below and then type it in the box in reverse order. Please include any capitalizations in the words that have capital letters. Do not include any punctuation (e.g., periods, quotation marks, etc.) and make sure there is no space after the last word in the sentence. For example, if the sentence said “fun are trucks Red” you would type “Red trucks are fun”.
    watermelon the on slammed door The
    Correct response: The door slammed on the watermelon

Appendix C.2. Financial Knowledge Scale (Knoll and Houts 2012)

  • Suppose you had $100 in a savings account, and the interest rate was 2% per year. After 5 years, how much do you think you would have in the account if you left the money to grow: more than $102, exactly $102, or less than $102?
    • More than $102.
    • Exactly $102.
    • Less than $102.
    • I do not know.
  • Imagine that the interest rate on your savings account was 1% per year, and inflation was 2% per year. After 1 year, would you be able to buy more than, exactly the same as, or less than today with the money in this account?
    • More than today.
    • Exactly the same as today.
    • Less than today.
    • I do not know.
  • Assume a friend inherits $10,000 today, and his sibling inherits $10,000 but 3 years from now. Who is richer today because of the inheritance?
    • My friend.
    • His sibling.
    • They are equally rich.
    • I do not know.
  • If the interest rates rise, what should happen to bond prices?
    • They should rise.
    • They should fall.
    • They should stay the same.
    • I do not know.
  • Buying a company stock usually provides a safer return than a stock mutual fund.
    • True.
    • False.
    • I do not know.
  • Bonds are normally riskier than stocks.
    • True.
    • False.
    • I do not know.
  • Considering a long time period (for example, 10 or 20 years), which asset described below normally gives the highest return: savings accounts, bonds, or stocks?
    • Savings accounts.
    • Bonds.
    • Stocks.
    • I do not know.
  • Normally, which asset described below displays the highest fluctuations over time: savings accounts, bonds, or stocks?
    • Savings accounts.
    • Bonds.
    • Stocks.
    • I do not know.
  • When an investor spreads his money among different assets, does the risk of losing a lot of money increase, decrease or stay the same?
    • Increase.
    • Decrease.
    • Stay the same.
    • I do not know.
  • If you were to invest $1000 in a stock mutual fund, it would be possible to have less than $1000 when you withdraw your money.
    • True.
    • False.
    • I do not know.
  • A stock mutual fund combines the money of many investors to buy a variety of stocks.
    • True.
    • False.
    • I do not know.
  • If you buy a company’s stock …
    • You own a part of the company.
    • You have lent money to the company.
    • You are liable for the company’s debts.
    • The company will return your original investment to you with interest.
    • I do not know.
  • “Whole life” insurance has a savings feature, while “term” insurance does not.
    • True.
    • False.
    • I do not know.
  • The cash value of a life insurance policy is the amount available if you surrender your life insurance policy while you are still alive.
    • True.
    • False.
    • I do not know.
  • An annuity is a financial product that pays a lump sum when you die.
    • True.
    • False.
    • I do not know.
  • There are annual contribution limits on the amount you can save in a 401(k) plan or IRA that depend on your income. (Modified to read “There are annual contribution limits on the amount you can save in a Registered Retirement Saving Plan (RRSP) that depend on your income”.)
    • True.
    • False.
    • It depends on the type of IRA and/or 401(k) plan.
    • I do not know.
  • After 70.5 years of age, you have to withdraw at least some money from your 401(k) plan or IRA. (Modified to read “After 71 years of age, you have to withdraw at least some money from your RRSP”.)
    • True.
    • False.
    • It depends on the type of IRA and/or 401(k) plan.
    • I do not know.
  • A 15-year mortgage typically requires higher monthly payments than a 30-year mortgage, but the total interest paid over the life of the loan will be less.
    • True.
    • False.
    • I do not know.
  • Housing prices in the United States can never go down. (Modified to read “Housing prices in Canada can never go down”.)
    • True.
    • False.
    • I do not know.
  • Suppose you owe $3,000 on your credit card. You pay a minimum payment of $30 each month. At an annual percentage rate of 12% (or 1% per month), how many years would it take to eliminate your credit card debt if you made no additional new charges?
    • Less than 5 years.
    • Between 5 and 10 years.
    • Between 10 and 15 years.
    • Never; you will continue to be in debt.
    • I do not know.

Appendix C.3. Financial Attitudes Scale (OECD 2016)

Questions are answered on a five-point Likert scale (1 = completely agree; 5 = completely disagree). The attitudes score is computed as the sum of the values for the three statements and then divided by three. The attitudes score, therefore, ranges from 1 to 5, with a lower score indicative of a tendency to favour the short term and higher scores indicative of a tendency to favour the long-term.
  • I tend to live for today and let tomorrow take care of itself.
  • I find it more satisfying to spend money than to save it for the long term.
  • Money is there to be spent

Appendix C.4. The Financial Management Behaviour Scale (FMBS) (Dew and Xiao 2011)

The FMBS assesses four domains of financial management behaviour: (1) cash managementa (e.g., keeping a financial record and paying bills on time), (2) credit managementb, (3) savings and investmentsc, and (4) insuranced.
When answering the following questions, imagine how you behaved prior to the COVID-19 pandemic in Canada (i.e., prior to March 2020). In general, how often did you engage in the following activities?
1 = Never; 2 = Seldom; 3 = Sometimes; 4 = Often; 5 = Always; NA = Not applicable to me
  • Comparison shopped when purchasing a product or servicea
  • Paid all your bills on timea
  • Kept a written or electronic record of your monthly expensesa
  • Stayed within your budget or spending plana
  • Paid off your credit card balance in full each monthb
  • Maxed out the limit on one or more credit cardsb
  • Made only minimum payments on a loanb
  • Began or maintained an emergency savings fundc
  • Saved money from every paycheckc
  • Saved for a long-term goal such as a car, education, home, etc.c
  • Contributed money to a retirement accountc
  • Bought bonds, stocks, or mutual fundsc
  • Maintained or purchased an adequate health insurance policyd
  • Maintained or purchased adequate property insurance such as auto or homeowner insuranced
  • Maintained or purchased adequate life insuranced

Appendix C.5. Financial Anxiety Scale (Fünfgeld and Wang 2009)

When answering the following questions, imagine how you behaved prior to the COVID-19 pandemic in Canada (i.e., prior to March 2020). Fill in the blank with one of the response options provided. It’s _____ true about me.
1 = Not at all; 2 = Rarely; 3 = Quite; 4 = Mostly; 5= Absolutely
  • I get unsure by the lingo of financial experts.
  • I am anxious about financial and monetary affairs.
  • I tend to postpone financial decisions as long as possible.
  • After making a decision, I am anxious about whether I was right or wrong.

Appendix C.6. Abbreviated Math Anxiety Scale (Hopko et al. 2003)

Please rate each item in terms of how anxious you would feel during the event specified. Use the following scale and record your answer in the space to the left of the item:
1 = Low anxiety; 2 = Some anxiety; 3 = Moderate anxiety; 4 = Quite a bit of anxiety; 5 = High anxiety
  • Having to use the tables in the back of a math book.
  • Thinking about an upcoming math test one day before.
  • Watching a teacher work an algebraic equation on the blackboard.
  • Taking an examination in a math course.
  • Being given a homework assignment of many difficult problems which is due the next class meeting.
  • Listening to a lecture in math class.
  • Listening to another student explain a math formula.
  • Being given a “pop” quiz in a math class.
  • Starting a new chapter in a math book.

Appendix C.7. Demographics Questionnaire

Are you at least 18 years of age or older?
  • Yes
  • No
What is your age? __________
What is your gender?
  • Male
  • Female
  • You do not have an option that applies to me. I identify as _____.
What is your first language? ____________
Are you fluent in English?
  • Definitely yes
  • Probably yes
  • Might or might not be
  • Probably not
  • Definitely not
Are you a resident of Canada?
  • Yes
  • No
  • I don’t know
Please enter the first 3 digits of your postal code: ___________
What is your highest level of education completed?
  • I have not completed high school
  • High school diploma
  • College diploma
  • Bachelor’s degree
  • Master’s degree
  • Doctoral degree
  • I prefer not to answer
In the past five years, have you taken a course or program of study to increase your knowledge and understanding of the economy or financial matters?
  • Yes
  • No
  • I don’t know
  • I prefer not to answer
What is your occupation? _____________
Which of the following categories best describes your family’s annual gross income?
  • Less than CAD 15,000
  • CAD 15,000 to CAD 34,999
  • CAD 35,000 to CAD 49,999
  • CAD 50,000 to CAD 74,999
  • CAD 75,000 to CAD 99,999
  • CAD 100,000 or more
  • I prefer not to answer

Appendix C.8. State-Trait Anxiety Inventory (Trait Scale) (Spielberger et al. 1982)

A number of statements that people have used to describe themselves are given below. Read each statement and then circle the appropriate value to the right of the statement to indicate how you generally feel. There are no right or wrong answers. Do not spend too much time on any one statement but give the answer which seems to describe how you generally feel. * Reverse-scored items.
1 = Almost never; 2 = Sometimes; 3 = Often; 4 = Almost always
  • I feel pleasant *
  • I feel nervous and restless
  • I feel satisfied with myself *
  • I wish I could be as happy as others seem to be
  • I feel like a failure
  • I feel rested *
  • I am “calm, cool, and collected” *
  • I feel that difficulties are piling up so that I cannot overcome them
  • I worry too much over something that doesn’t really matter
  • I am happy *
  • I have disturbing thoughts
  • I lack self-confidence
  • I feel secure *
  • I make decisions easily *
  • I feel inadequate
  • I am content *
  • Some unimportant thought runs through my mind and bothers me
  • I take disappointments so keenly that I can’t put them out of my mind
  • I am a steady person *
  • I get in a state of tension and turmoil as I think over my recent concerns and interests

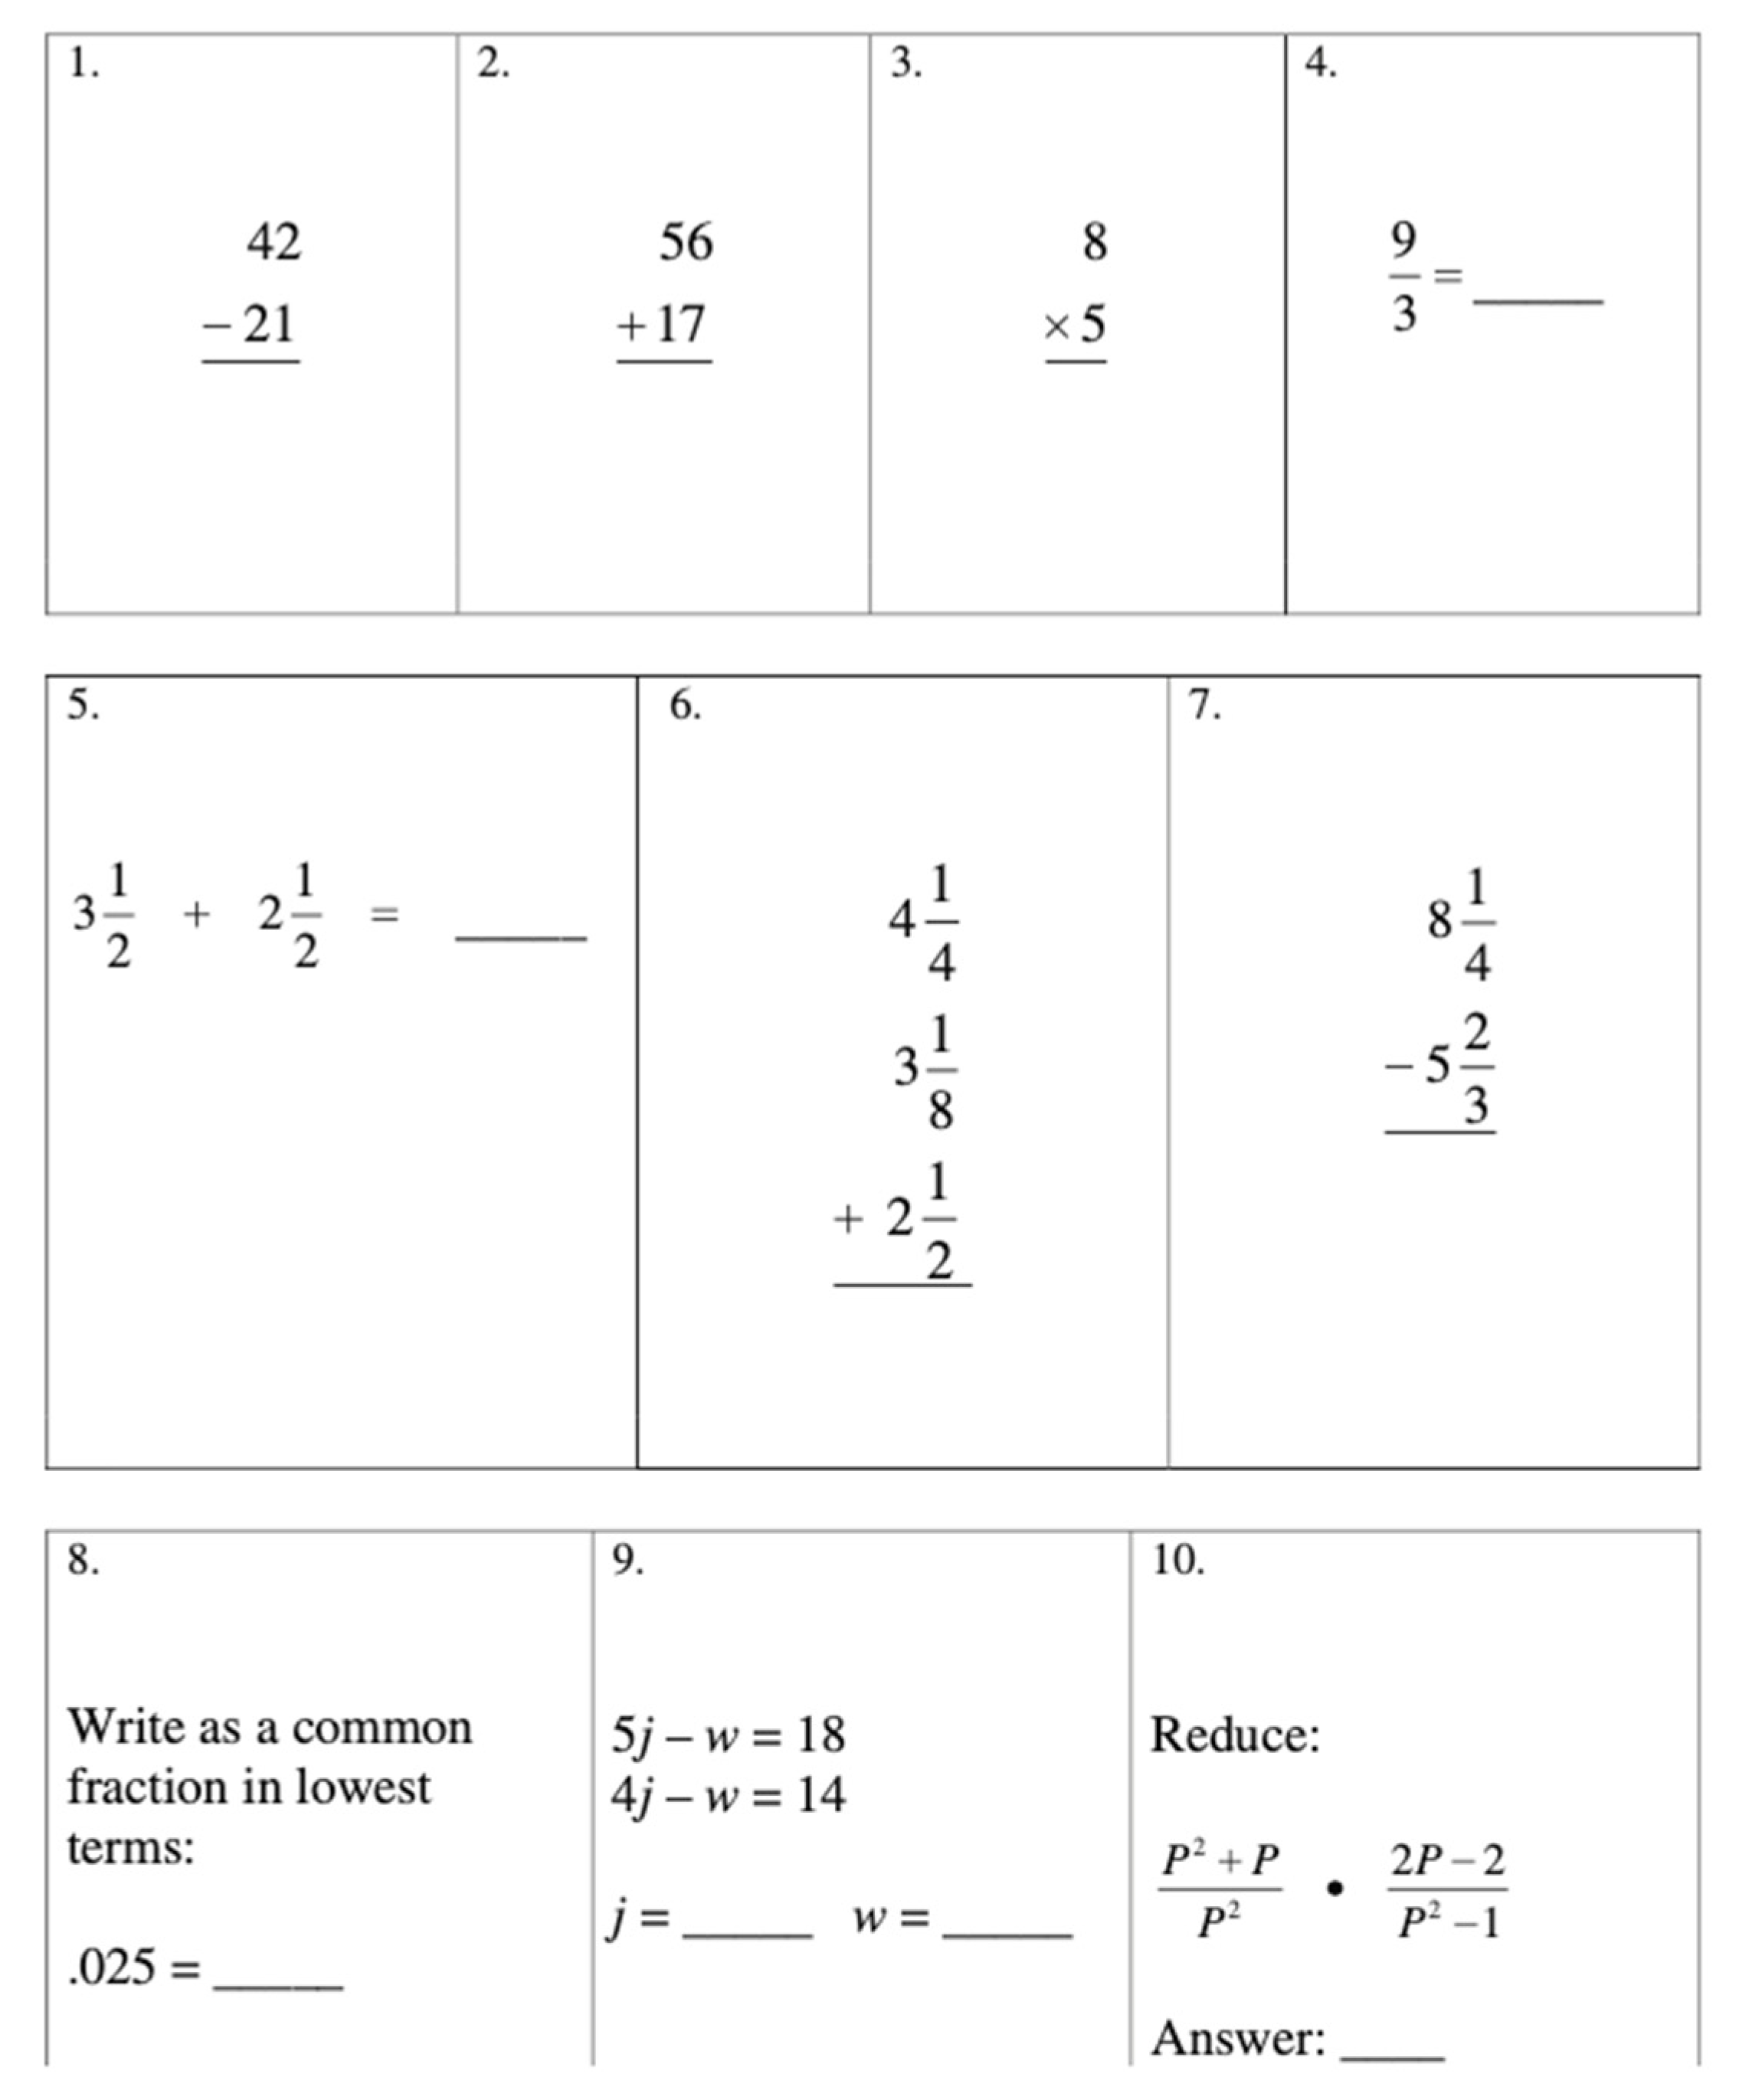
Appendix C.9. Brief Math Assessment 3 (Steiner and Ashcraft 2012)

Figure A1. Items from the BMA-3.
Jrfm 16 00238 g0a1
Correct answers:
  • 21
  • 73
  • 40
  • 3
  • 6
  • 9 7/8 or 79/8 or 9.875
  • 2 7/12 or 31/12 or 2.59 or 2.60
  • 1/40
  • j = 4, w = 2
  • 2/p

Notes

1
The Big Three items are as follows: (1) Suppose you had $100 in a savings account and the interest rate was 2 percent per year. After 5 years, how much do you think you would have in the account if you left the money to grow: more than $102, exactly $102, less than $102? (2) Imagine that the interest rate on your savings account was 1 percent per year and inflation was 2 percent per year. After 1 year, would you be able to buy more than, exactly the same as, or less than today with the money in this account? (3) Do you think that the following statement is true or false? Buying a single company stock usually provides a safer return than a stock mutual fund.
2
To capture a more accurate representation of the average completion speed, we excluded participants (n = 4) who completed the survey more than three standard deviations above the average completion time from this computation.
3
Dew and Xiao (2011) included the response item “Not applicable to me” as not all financial behaviours apply to all people. For example, it would be difficult for someone to “max out” a credit card if they do not have one. However, the authors found that some people selected “Not applicable to me” when it was inappropriate to do so. Thus, if a respondent selected “Not applicable to me” in the present study, we included a follow-up question asking them to briefly explain why they felt that item does not apply to them. In the current data, we deemed all responses of “Not applicable to me” to be appropriate. We computed weighted averages to ensure participants’ scores were not artificially deflated by questions that did not apply to them.
4
Durbin-Watson statistic of 1.896.
5
Durbin-Watson statistic of 1.985.
6
Durbin-Watson statistic of 1.884.
7
Note that these respondents also provided identical postal codes, ages, and responses to the CRT-2. We had already removed the other eight offenders for failing previous screening filters.
8
The question read as follows: “The province of Ontario has recently included financial literacy as a unique strand in the math curriculum. Advocates of this change say it is important for children to learn about finances at a young age. In 2 to 3 complete sentences, briefly describe your first experience learning how to manage your finances (e.g., at school, through a family member, etc.)”.

References

  1. Ahmed, Wondimu. 2018. Developmental trajectories of math anxiety during adolescence: Associations with STEM career choice. Journal of Adolescence 67: 158–66. [Google Scholar] [CrossRef] [PubMed]
  2. American Psychological Association. 2015. Stress in America: Paying with Our Health. Stress in America, 1–23. Available online: http://www.apa.org/news/press/releases/stress/2014/stress-report.pdf (accessed on 4 April 2022).
  3. Archuleta, Kristy L., Anita Dale, and Scott M. Spann. 2013. Financial Satisfaction, and Financial Anxiety. Journal of Financial Counseling and Planning 24: 50–62. [Google Scholar]
  4. Ashcraft, Mark H. 2002. Math anxiety: Personal, educational, and cognitive consequences. Current Directions in Psychological Science 11: 181–85. [Google Scholar] [CrossRef]
  5. Ashcraft, Mark H., and Elizabeth P. Kirk. 2001. The relations among working memory, math anxiety, and performance. Journal of Experimental Psychology: General 130: 224–37. [Google Scholar] [CrossRef] [PubMed]
  6. Ashcraft, Mark H., and Kelly S. Ridley. 2005. Math anxiety and its cognitive consequences: A tutorial review. In The Handbook of Mathematical Cognition. Edited by Jamie I. D. Campbell. New York: Psychology Press, pp. 315–27. [Google Scholar] [CrossRef]
  7. Bartholomae, Suzanne, and Jonathan J. Fox. 2021. Overview of financial education. In The Routledge Handbook of Financial Literacy. Abingdon: Routledge, pp. 173–86. [Google Scholar] [CrossRef]
  8. Boisclair, David, Annamaria Lusardi, and Pierre-Carl Michaud. 2017. Financial literacy and retirement planning in Canada. Journal of Pension Economics and Finance 16: 277–96. [Google Scholar] [CrossRef] [Green Version]
  9. Brugiavini, Agar, Danilo Cavapozzi, Mario Padula, and Yuri Pettinicchi. 2020. On the effect of financial education on financial literacy: Evidence from a sample of college students. Journal of Pension Economics and Finance 19: 344–52. [Google Scholar] [CrossRef]
  10. Bucher-Koenen, Tabea, Annamaria Lusardi, Rob Alessie, and Maarten van Rooij. 2017. How Financially Literate Are Women? An Overview and New Insights. Journal of Consumer Affairs 51: 255–83. [Google Scholar] [CrossRef]
  11. Calcagno, Riccardo, and Chiara Monticone. 2015. Financial literacy and the demand for financial advice. Journal of Banking and Finance 50: 363–80. [Google Scholar] [CrossRef]
  12. CFPB. 2015. Financial Well Being: The Goal of Financial Education; Washington, DC: Consumer Financial Protection Bureau, January, p. 48. Available online: http://files.consumerfinance.gov/f/201501_cfpb_report_financial-well-being.pdf (accessed on 1 June 2022).
  13. Chen, Haiyang, Ya Dai, and David Guo. 2023. Financial literacy as a determinant of market participation: New evidence from China using IV-GMM. International Review of Economics and Finance 84: 611–23. [Google Scholar] [CrossRef]
  14. Chmielewski, Michael, and Sarah C. Kucker. 2020. An MTurk Crisis? Shifts in Data Quality and the Impact on Study Results. Social Psychological and Personality Science 11: 464–73. [Google Scholar] [CrossRef]
  15. Cole, Shawn, Anna Paulson, and Gauri Kartini Shastry. 2016. High school curriculum and financial outcomes: The impact of mandated personal finance and mathematics courses. Journal of Human Resources 51: 656–98. [Google Scholar] [CrossRef]
  16. Credé, Marcus. 2010. Random responding as a threat to the validity of effect size estimates in correlational research. Educational and Psychological Measurement 70: 596–612. [Google Scholar] [CrossRef]
  17. Curran, Paul G. 2016. Methods for the detection of carelessly invalid responses in survey data. Journal of Experimental Social Psychology 66: 4–19. [Google Scholar] [CrossRef] [Green Version]
  18. Daker, Richard J., Sylvia U. Gattas, H. Moriah Sokolowski, Adam E. Green, and Ian M. Lyons. 2021. First-year students’ math anxiety predicts STEM avoidance and underperformance throughout university, independently of math ability. Npj Science of Learning 6: 17. [Google Scholar] [CrossRef] [PubMed]
  19. Darriet, Elisa, Marianne Guille, and Jean-Christpohe Vergnaud. 2021. Financial literacy and numeracy. In The Routledge Handbook of Financial Literacy. Abingdon: Routledge, pp. 96–109. [Google Scholar] [CrossRef]
  20. de Bassa Scheresberg, Carlo. 2013. Financial Literacy and Financial Behavior among Young Adults: Evidence and Implications. Numeracy 6: 5. [Google Scholar] [CrossRef] [Green Version]
  21. de Bruin, Wändi Bruine, and Paul Slovic. 2021. Low numeracy is associated with poor financial well-being around the world. PLoS ONE 16: e0260378. [Google Scholar] [CrossRef] [PubMed]
  22. Dew, Jeffery, and Jing Jian Xiao. 2011. The financial management behavior scale: Development and validation. Journal of Financial Counseling and Planning 22: 43–59. [Google Scholar]
  23. Dowker, Ann, Amar Sarkar, and Chung Yen Looi. 2016. Mathematics anxiety: What have we learned in 60 years? Frontiers in Psychology 7: 508. [Google Scholar] [CrossRef] [Green Version]
  24. Estelami, Hooman, and Nicole Estelami. 2023. The differential impact of cognitive style on the relationship between financial education and financial literacy. Journal of Financial Services Marketing. [Google Scholar] [CrossRef]
  25. Fenn, Kristina, and Majella Byrne. 2013. The key principles of cognitive behavioural therapy. InnovAiT: Education and Inspiration for General Practice 6: 579–85. [Google Scholar] [CrossRef]
  26. Fernandes, Daniel, John G. Lynch, and Richard G. Netemeyer. 2014. Financial literacy, financial education, and downstream financial behaviors. Management Science 60: 1861–83. [Google Scholar] [CrossRef]
  27. Financial Consumer Agency of Canada. 2015. National Strategy for Financial Literacy: Count Me in, Canada. Available online: https://www.canada.ca/content/dam/canada/financial-consumer-agency/migration/eng/financialliteracy/financialliteracycanada/strategy/documents/nationalstrategyforfinancialliteracycountmeincanada.pdf (accessed on 20 May 2020).
  28. Finke, Michael S., John S. Howe, and Sandra J. Huston. 2017. Old age and the decline in financial literacy. Management Science 63: 213–30. [Google Scholar] [CrossRef]
  29. Friman, Patrick C., Steven C. Hayes, and Kelly G. Wilson. 1998. Why Behavior Analysts Should Study Emotion: The Example of Anxiety. Journal of Applied Behavior Analysis 31: 137–56. [Google Scholar] [CrossRef] [PubMed] [Green Version]
  30. Fünfgeld, Brigitte, and Mei Wang. 2009. Attitudes and behaviour in everyday finance: Evidence from Switzerland. International Journal of Bank Marketing 27: 108–28. [Google Scholar] [CrossRef]
  31. Garcia-Retamero, Rocio, Agata Sobkow, Dafina Petrova, Dunia Garrido, and Jakub Traczyk. 2019. Numeracy and Risk Literacy: What Have We Learned so Far? The Spanish Journal of Psychology 22: E10. [Google Scholar] [CrossRef] [PubMed] [Green Version]
  32. Gerardi, Kristopher, Lorenz Goette, and Stephan Meier. 2013. Numerical ability predicts mortgage default. Proceedings of the National Academy of Sciences of the United States of America 110: 11267–71. [Google Scholar] [CrossRef] [PubMed] [Green Version]
  33. Gignac, Gilles E., Paul Gerrans, and Camilla B. Andersen. 2023. Financial literacy mediates the effect between verbal intelligence and financial anxiety. Personality and Individual Differences 203: 112025. [Google Scholar] [CrossRef]
  34. González-Prendes, A. Antonio, and Stella M. Resko. 2012. Cognitive Behavioral Theory. In Trauma: Contemporary Directions in Theory, Practice, and Research. Edited by Shoshana Ringel and Jerrold R. Brandell. Thousand Oaks: SAGE Publications Inc., pp. 14–40. [Google Scholar] [CrossRef]
  35. Government of Canada. 2020. About Financial Literacy Month; Ottawa: Financial Consumer Agency of Canada. Available online: https://www.canada.ca/en/financial-consumer-agency/campaigns/financial-literacy-month/about.html (accessed on 20 May 2020).
  36. Goyal, Kirti, and Satish Kumar. 2021. Financial literacy: A systematic review and bibliometric analysis. International Journal of Consumer Studies 45: 80–105. [Google Scholar] [CrossRef]
  37. Grable, John, Wookjae Heo, and Abed Rabbani. 2015. Financial Anxiety, Physiological Arousal, and Planning Intention. Journal of Financial Therapy 5: 1–18. [Google Scholar] [CrossRef] [Green Version]
  38. Grohmann, Antonia, Theres Klühs, and Lukas Menkhoff. 2018. Does financial literacy improve financial inclusion? Cross country evidence. World Development 111: 84–96. [Google Scholar] [CrossRef] [Green Version]
  39. Guerrero, Ernesto R. 2020. Math Anxiety and Financial Literacy among Latino Secondary Students in the United States. Ph.D. thesis, Oregon State University, Corvallis, OR, USA. Available online: https://ir.library.oregonstate.edu/concern/graduate_thesis_or_dissertations/bg257n124 (accessed on 17 January 2022).
  40. Gunderson, Elizabeth A., Daeun Park, Erin A. Maloney, Sian L. Beilock, and Susan C. Levine. 2018. Reciprocal relations among motivational frameworks, math anxiety, and math achievement in early elementary school. Journal of Cognition and Development 19: 21–46. [Google Scholar] [CrossRef]
  41. Hart, Sara Ann, and Colleen Marie Ganley. 2019. The nature of math anxiety in adults: Prevalence and correlates. Journal of Numerical Cognition 5: 122–39. [Google Scholar] [CrossRef] [Green Version]
  42. Hasler, Andrea, Annamaria Lusardi, and Olivia Valdes. 2021. Financial Anxiety and Stress among U.S. Households: New Evidence from the National Financial Capability Study and Focus Groups. (Issue April). Washington, DC: FINRA Investor Education Foundation. [Google Scholar]
  43. Hembree, Ray. 1990. The Nature, Effects, and Relief of Mathematics Anxiety. Journal for Research in Mathematics Education 21: 33–46. [Google Scholar] [CrossRef]
  44. Hill, Francesca, Irene C. Mammarella, Amy Devine, Sara Caviola, Maria Chiara Passolunghi, and Dénes Szucs. 2016. Maths anxiety in primary and secondary school students: Gender differences, developmental changes and anxiety specificity. Learning and Individual Differences 48: 45–53. [Google Scholar] [CrossRef]
  45. Hopko, Derek R., Rajan Mahadevan, Robert L. Bare, and Melissa K. Hunt. 2003. The Abbreviated Math Anxiety Scale (AMAS): Construction, validity, and reliability. Assessment 10: 178–82. [Google Scholar] [CrossRef]
  46. Hunt, Thomas E., David Clark-Carter, and David Sheffield. 2014. Math anxiety, intrusive thoughts and performance: Exploring the relation between mathematics anxiety and performance: The role of intrusive thoughts. Journal of Education, Psychology and Social Sciences 2: 69–75. [Google Scholar]
  47. Huston, Sandra J. 2010. Measuring Financial Literacy. Journal of Consumer Affairs 44: 296–316. [Google Scholar] [CrossRef]
  48. IBM Corp. 2021. IBM SPSS Statistics for Macintosh, Version 28.0. Armonk, NY: IBM Corp. [Google Scholar]
  49. Kaiser, Tim, Annamaria Lusardi, Lukas Menkhoff, and Carly Urban. 2022. Financial education affects financial knowledge and downstream behaviors. Journal of Financial Economics 145: 255–72. [Google Scholar] [CrossRef]
  50. Kalwij, Adriaan, Rob Alessie, Milena Dinkova, Gea Schonewille, Anna van der Schors, and Minou van der Werf. 2019. The Effects of Financial Education on Financial Literacy and Savings Behavior: Evidence from a Controlled Field Experiment in Dutch Primary Schools. Journal of Consumer Affairs 53: 699–730. [Google Scholar] [CrossRef] [Green Version]
  51. Kempson, Elaine, Andrea Finney, and Christian Poppe. 2017. Financial Well-Being: A Conceptual Model and Preliminary Analysis. Oslo: Consumption Research Norway–SIFO, August. [Google Scholar] [CrossRef]
  52. Kim, Kyoung Tae, Soo Hyun Cho, and Jing Jian Xiao. 2022. Is Ignorance Bliss? Use of Alternative Financial Services, Financial Knowledge, and Financial Anxiety. Journal of Family and Economic Issues. [Google Scholar] [CrossRef]
  53. Knoll, Melissa A. Z., and Carrie R. Houts. 2012. The Financial Knowledge Scale: An Application of Item Response Theory to the Assessment of Financial Literacy. Journal of Consumer Affairs 46: 381–410. [Google Scholar] [CrossRef]
  54. Lee, Jae Min, Jonghee Lee, and Kyoung Tae Kim. 2020. Consumer Financial Well-Being: Knowledge is Not Enough. Journal of Family and Economic Issues 41: 218–28. [Google Scholar] [CrossRef]
  55. Lin, Judy T., Christopher Bumcrot, Tippy Ulicny, Gary Mottola, Gerri Walsh, Robert Ganem, Christine Kieffer, and Annamaria Lusardi. 2019. The State of U.S. Financial Capability: The 2018 National Financial Capability Study. Washington, DC: FINRA Investor Education Foundation, June, pp. 1–43. Available online: https://www.usfinancialcapability.org/downloads/NFCS_2018_Report_Natl_Findings.pdf%0Ahttps://gflec.org/initiatives/national-financial-capability-study/ (accessed on 27 April 2022).
  56. Lind, Thérèse, Ali Ahmed, Kenny Skagerlund, Camilla Strömbäck, Daniel Västfjäll, and Gustav Tinghög. 2020. Competence, Confidence, and Gender: The Role of Objective and Subjective Financial Knowledge in Household Finance. Journal of Family and Economic Issues 41: 626–38. [Google Scholar] [CrossRef] [Green Version]
  57. Lusardi, Annamaria. 2003. Saving and the Effectiveness of Financial Education. In Pension Design and Structure. New Lessons from Behavioral Finance. Oxford: Oxford University Press, pp. 159–69. [Google Scholar] [CrossRef] [Green Version]
  58. Lusardi, Annamaria. 2012. Numeracy, Financial Literacy, and Financial Decision-Making. Numeracy 5. [Google Scholar] [CrossRef] [Green Version]
  59. Lusardi, Annamaria. 2015. Financial literacy: Do people know the ABCs of finance? Public Understanding of Science 24: 260–71. [Google Scholar] [CrossRef] [PubMed] [Green Version]
  60. Lusardi, Annamaria. 2019. Financial literacy and the need for financial education: Evidence and implications. Swiss Journal of Economics and Statistics 155: 1–8. [Google Scholar] [CrossRef] [Green Version]
  61. Lusardi, Annamaria, and Olivia S. Mitchell. 2008. Planning and financial literacy: How do women fare? American Economic Review 98: 413–17. [Google Scholar] [CrossRef] [Green Version]
  62. Lusardi, Annamaria, and Olivia S. Mitchell. 2012. Financial Literacy Around the World: An Overview. SSRN Electronic Journal 10: 497–508. [Google Scholar] [CrossRef] [Green Version]
  63. Lusardi, Annamaria, and Olivia S. Mitchell. 2014. The economic importance of financial literacy: Theory and evidence. Journal of Economic Literature 52: 5–44. [Google Scholar] [CrossRef] [Green Version]
  64. Lusardi, Annamaria, and Peter Tufano. 2015. Debt literacy, financial experiences, and overindebtedness. In Journal of Pension Economics and Finance 14: 332–68. [Google Scholar] [CrossRef] [Green Version]
  65. Maloney, Erin A. 2016. Math anxiety: Causes, consequences, and remediation. In Handbook of Motivation at School, 2nd ed. Edited by Kathryn R. Wentzel and David B. Miele. Abingdon: Routledge, pp. 408–23. [Google Scholar] [CrossRef]
  66. Maloney, Erin A., and Sian L. Beilock. 2012. Math anxiety: Who has it, why it develops, and how to guard against it. Trends in Cognitive Sciences 16: 404–6. [Google Scholar] [CrossRef] [PubMed]
  67. Mandell, Lewis, and Linda Schmid Klein. 2009. The Impact of Financial Literacy Education on Subsequent Financial Behavior. Financial Counseling and Planning 20: 15–25. [Google Scholar]
  68. Medyanik, Olga V. 2020. The effect of financial anxiety on the insurance behavior of Russians in the context of the 2019-nCoV Pandemic. Vestnik of Saint Petersburg University. Sociology 13: 354–73. [Google Scholar] [CrossRef]
  69. Mottola, Gary. 2013. In Our Best Interest: Women, Financial Literacy, and Credit Card Behavior. Numeracy 6: 4. [Google Scholar] [CrossRef] [Green Version]
  70. Mustafa, Wan Mashumi Wan, Md. Aminul Islam, Muhammad Asyraf, Md. Sharif Hassan, Pradip Royhan, and Shafiqur Rahman. 2023. The Effects of Financial Attitudes, Financial Literacy and Health Literacy on Sustainable Financial Retirement Planning: The Moderating Role of the Financial Advisor. Sustainability 15: 2677. [Google Scholar] [CrossRef]
  71. O’Leary, Krystle, Cheryll L. Fitzpatrick, and Darcy Hallett. 2017. Math anxiety is related to some, but not all, experiences with math. Frontiers in Psychology 8: 1–14. [Google Scholar] [CrossRef] [Green Version]
  72. OECD. 2013. PISA 2012 Results: Ready to Learn (Volume III). Berlin: OECD Publishing. [Google Scholar] [CrossRef]
  73. OECD. 2016. OECD/INFE International Survey of Adult Financial Literacy Competencies. Berlin: OECD Publishing. Available online: https://www.oecd.org/finance/oecd-infe-survey-adult-financial-literacy-competencies.htm (accessed on 18 February 2022).
  74. OECD. 2020. OECD/INFE 2020 International Survey of Adult Financial Literacy. Berlin: OECD Publishing, p. 78. Available online: www.oecd.org/financial/education/launchoftheoecdinfeglobalfinancialliteracysurveyreport.htm (accessed on 18 February 2022).
  75. OECD. 2022. OECD/INFE Toolkit for Measuring Financial Literacy and Financial Inclusion 2022. Berlin: OECD Publishing. Available online: www.oecd.org/financial/education/2022-INFE-Toolkit-Measuring-Finlit-Financial-Inclusion.pdf (accessed on 11 March 2023).
  76. Ramirez, Gerardo, Stacy T. Shaw, and Erin A. Maloney. 2018. Math Anxiety: Past Research, Promising Interventions, and a New Interpretation Framework. Educational Psychologist 53: 145–64. [Google Scholar] [CrossRef]
  77. Sages, Ronald A., Sonya L. Britt, and Julie A. Cumbie. 2013. The correlation between anxiety and money management. College Student Journal 47: 1–11. [Google Scholar]
  78. Sánchez Santos, José Manuel. 2020. The Economic and Social Value of Financial Literacy. In The Economic and Social Value of Financial Literacy. Pennsylvania: IGI Global, pp. 199–226. [Google Scholar] [CrossRef]
  79. Schönbrodt, Felix D., and Marco Perugini. 2013. At what sample size do correlations stabilize? Journal of Research in Personality 47: 609–12. [Google Scholar] [CrossRef] [Green Version]
  80. Shapiro, Gilla K., and Brendan J. Burchell. 2012. Measuring financial anxiety. Journal of Neuroscience, Psychology, and Economics 5: 92–103. [Google Scholar] [CrossRef]
  81. Skagerlund, Kenny, Thérèse Lind, Camilla Strömbäck, Gustav Tinghög, and Daniel Västfjäll. 2018. Financial literacy and the role of numeracy–How individuals’ attitude and affinity with numbers influence financial literacy. Journal of Behavioral and Experimental Economics 74: 18–25. [Google Scholar] [CrossRef]
  82. Spielberger, Charles D., Richard L. Gorsuch, Robert E. Lushene, Peter R. Vagg, and Gerard A. Jacobs. 1982. State-Trait Anxiety Inventory for Adults. Menlo Park: Mind Garden. [Google Scholar]
  83. Statistics Canada. 2022. Canada’s Population Estimates: Age and Sex, July 1, 2022. Component of Statistics Canada Catalogue No. 11-001-X. Available online: https://www150.statcan.gc.ca/n1/en/daily-quotidien/220928/dq220928c-eng.pdf?st=vtYy1NS7 (accessed on 11 March 2023).
  84. Steiner, Eric T., and Mark H. Ashcraft. 2012. Three brief assessments of math achievement. Behavior Research Methods 44: 1101–7. [Google Scholar] [CrossRef] [Green Version]
  85. Storozuk, Andie, Marilyn Ashley, Véronic Delage, and Erin A. Maloney. 2020. Got Bots? Practical Recommendations to Protect Online Survey Data from Bot Attacks. The Quantitative Methods for Psychology 16: 472–81. [Google Scholar] [CrossRef]
  86. Storozuk, Andie, Fraulein Retanal, and Erin A. Maloney. 2023. Consumers with math anxiety, a financially vulnerable group? Unpacking the negative relation between math anxiety and performance on a price comparison task. Journal of Numerical Cognition 9: 1–15. [Google Scholar] [CrossRef]
  87. Suri, Rajneesh, Kent B. Monroe, and Umit Koc. 2013. Math anxiety and its effects on consumers’ preference for price promotion formats. Journal of the Academy of Marketing Science 41: 271–82. [Google Scholar] [CrossRef]
  88. Tabachnick, Barbara G., and Linda S. Fidell. 2013. Using Multivariate Statistics, 6th ed. London: Pearson Education. [Google Scholar]
  89. Tinghög, Gustav, Ali Ahmed, Kinga Barrafrem, Thérèse Lind, Kenny Skagerlund, and Daniel Västfjäll. 2021. Gender differences in financial literacy: The role of stereotype threat. Journal of Economic Behavior and Organization 192: 405–16. [Google Scholar] [CrossRef]
  90. U.S. Financial Literacy and Education Commission. 2020. National Strategy for Financial Literacy 2020. pp. 1–22. Available online: https://home.treasury.gov/system/files/136/US-National-Strategy-Financial-Literacy-2020.pdf (accessed on 18 February 2022).
  91. van Rooij, Maarten, Annamaria Lusardi, and Rob Alessie. 2011a. Financial literacy and stock market participation. Journal of Financial Economics 101: 449–72. [Google Scholar] [CrossRef] [Green Version]
  92. van Rooij, Maarten, Annamaria Lusardi, and Rob Alessie. 2011b. Financial literacy and retirement planning in the Netherlands. Journal of Economic Psychology 32: 593–608. [Google Scholar] [CrossRef]
  93. Vitasari, Prima, Muhammad Nubli Abdul Wahab, Tutut Herawan, Ahmad Othman, and Suriya Kumar Sinnadurai. 2011. Re-test of State Trait Anxiety Inventory (STAI) among engineering students in Malaysia: Reliability and validity tests. Procedia-Social and Behavioral Sciences 15: 3843–48. [Google Scholar] [CrossRef] [Green Version]
  94. von Gaudecker, Hans Martin. 2015. How Does Household Portfolio Diversification Vary with Financial Literacy and Financial Advice? Journal of Finance 70: 489–507. [Google Scholar] [CrossRef]
  95. Wilson Vanvoorhis, Carmen R., and Betsy L. Morgan. 2007. Understanding Power and Rules of Thumb for Determining Sample Sizes. Tutorials in Quantitative Methods for Psychology 3: 43–50. [Google Scholar] [CrossRef]
  96. Yan, Ting. 2008. Nondifferentiation. In Encyclopedia of Survey Research Methodology. Edited by Paul J. Lavrakas. Newbury Park: Sage, pp. 520–21. [Google Scholar]
Table 1. Correlations and Descriptive Statistics for All Measures.
Variable1234567891011
1. Age--0.173 **−0.126−0.201 **−0.094−0.177 **0.190 **0.282 **0.193 **0.0720.262 **
2. Income --0.035−0.057−0.083−0.164 *0.272 **0.274 **0.271 **0.150 *0.383 **
3. Numeracy --0.020−0.196 **−0.0250.263 **0.175 **0.0850.1090.008
4. General Anxiety --0.358 **0.483 **−0.149 *−0.170 **−0.173 **−0.085−0.285 **
5. Math Anxiety --0.390 **−0.356 **−0.246 **−0.195 **0.080−0.149 *
6. Financial Anxiety --−0.353 **−0.406 **−0.518 **−0.103−0.406 **
7. Mathematical FK --0.562 **0.436 **0.0820.296 **
8. Conceptual FK --0.573 **0.1150.409 **
9. Financial Confidence --0.0420.441 **
10. Financial Attitudes --0.342 **
11. Financial Behaviour --
N per measure241241239241241241241241240240241
Mean30.834.287.5646.2321.4411.812.719.814.0010.3051.79
SD10.381.562.0411.387.723.551.103.421.322.6411.59
Minimum Score18132094001322
Maximum Score6961180452041671575
Possible Range18+1–60–1120–809–454–200–40–161–73–1515–75
Note. Income is measured from 1 (<CAD 15,000) to 6 (>CAD 100,000). FK = Financial knowledge. * p < 0.05. ** p < 0.01.
Table 2. Multiple Regression Assessing Factors Related to Mathematical and Conceptual Financial Knowledge.
VariableMathematical Financial Knowledge
Model 1Model 2
BSEBβ95% CI for βpBSEBβ95% CI for βp
LLULLLUL
 Constant0.1690.118 0.1540.4660.141 0.001
 Recruitment Link0.0060.0170.021−0.0930.1370.7160.0060.0160.019−0.0890.1290.723
 Age0.0040.0020.1370.0120.2550.0280.0030.0020.113−0.0090.2240.059
 Gender−0.1220.032−0.220−0.337−0.111<0.001−0.0860.032−0.156−0.271−0.0490.007
 Education0.0390.0160.1530.0180.2600.0150.0280.0150.110−0.0240.2110.071
 Income0.0420.0100.2410.1330.364<0.0010.0360.0100.2080.1050.326<0.001
 Numeracy0.3700.0860.2500.1450.375<0.0010.3070.0830.2080.1070.329<0.001
 General Anxiety 0.2090.1230.109−0.0230.2220.092
 Math Anxiety −0.3680.099−0.230−0.350−0.112<0.001
 Financial Anxiety −0.2870.102−0.187−0.315−0.0580.005
R20.229 0.308
 △R20.229 0.079
F12.72 <0.00112.71 <0.001
Conceptual Financial Knowledge
 Constant0.2260.090 0.0120.3910.109 <0.001
 Recruitment Link0.0010.0130.005−0.1070.1180.9280.0020.0120.010−0.0970.1170.857
 Age0.0050.0010.2360.1120.350<0.0010.0040.0010.2170.0970.326<0.001
 Gender−0.0970.025−0.228−0.340−0.117<0.001−0.0700.024−0.164−0.274−0.0560.004
 Education0.0410.0120.2090.0780.3180.0010.0330.0120.1700.0410.2750.005
 Income0.0270.0080.1970.0860.3150.0010.0210.0080.1520.0460.2660.007
 Numeracy0.1950.0650.1730.0640.2900.0030.1780.0630.1570.0520.2710.005
 General Anxiety 0.2150.0950.1450.0140.2610.025
 Math Anxiety −0.0900.075−0.073−0.1910.0440.230
 Financial Anxiety −0.3630.078−0.308−0.430−0.176<0.001
R20.251 0.323
 △R20.251 0.072
F14.17 <0.00113.52 <0.001
Note. Mathematical N = 238; conceptual N = 237; model = “Enter” method in SPSS Statistics; B = unstandardized regression coefficient; SEB = standard error of the coefficient; β = standardized coefficients; CI = confidence interval for standardized coefficients; LL = lower limit; UL = upper limit; △R2 = adjusted R2 change; gender 1 = male, 2 = female. Education is measured from 1 (I have not completed high school) to 6 (Doctoral degree). Income is measured from 1 (<CAD 15,000) to 6 (>CAD 100,000).
Table 3. Multiple Regression Assessing Factors Related to Financial Confidence.
VariableFinancial Confidence
Model 1Model 2
BSEBβ95% CI for βpBSEBβ95% CI for βp
LLULLLUL
 Constant3.0360.591 <0.0014.8460.663 <0.001
 Recruitment Link−0.0880.084−0.063−0.1880.0580.297−0.0880.075−0.063−0.1750.0440.242
 Age0.0170.0080.1380.0100.2700.0350.0120.0070.094−0.0220.2120.112
 Gender−0.6420.162−0.243−0.364−0.122<0.001−0.3520.149−0.133−0.244−0.0220.019
 Education0.1310.0790.108−0.0210.2370.1010.0460.0720.038−0.0800.1560.524
 Income0.2070.0520.2480.1270.373<0.0010.1570.0460.1880.0790.3000.001
 Numeracy0.4860.4340.069−0.0530.1940.2640.4760.3930.067−0.0430.1810.228
 General Anxiety 0.9700.5810.106−0.0190.2290.096
 Math Anxiety 0.0770.4610.010−0.1100.1300.867
 Financial Anxiety −3.6570.481−0.500−0.630−0.371<0.001
R20.154 0.332
R20.154 0.178
F8.18 <0.00114.05 <0.001
Note. N = 237; model = “Enter” method in SPSS Statistics; B = unstandardized regression coefficient; SEB = standard error of the coefficient; β = standardized coefficients; CI = confidence interval for standardized coefficients; LL = lower limit; UL = upper limit; △R2 = adjusted R2 change; gender 1 = male, 2 = female. Education is measured from 1 (I have not completed high school) to 6 (Doctoral degree). Income is measured from 1 (<CAD 15,000) to 6 (>CAD 100,000).
Table 4. Multiple Regression Assessing Factors Related to Financial Attitudes.
VariableFinancial Attitudes
Model 1Model 2
BSEBβ95% CI for βpBSEBβ95% CI for βp
LLULLLUL
 Constant0.3910.083 <0.0010.4110.103 <0.001
 Recruitment Link0.0070.0120.038−0.0900.1660.5580.0070.0120.037−0.0890.1630.560
 Age−0.0000.001−0.005−0.1420.1290.9460.0000.001−0.018−0.1550.1140.793
 Gender0.0240.0230.068−0.0630.1910.2980.0290.0230.082−0.0510.2070.216
 Education0.0280.0110.1750.0320.3020.0120.0260.0110.1610.0160.2870.022
 Income0.0130.0070.114−0.0120.2450.0830.0120.0070.110−0.0150.2400.092
 Numeracy0.1270.0610.1340.0100.2690.0390.1690.0610.1790.0550.3160.006
 General Anxiety −0.1270.090−0.104−0.2480.0380.162
 Math Anxiety 0.2200.0720.2180.0760.3520.002
 Financial Anxiety −0.1190.074−0.122−0.2700.0280.113
R20.052 0.087
R20.052 0.035
F3.18 0.0053.50 <0.001
Note. N = 237; model = “Enter” method in SPSS Statistics; B = unstandardized regression coefficient; SEB = standard error of the coefficient; β = standardized coefficients; CI = confidence interval for standardized coefficients; LL = lower limit; UL = upper limit; △R2 = adjusted R2 change; gender 1 = male, 2 = female. Education is measured from 1 (I have not completed high school) to 6 (Doctoral degree). Income is measured from 1 (<CAD 15,000) to 6 (>CAD 100,000).
Table 5. Multiple Regression Assessing Factors Related to Financial Behaviour.
VariableFinancial Behaviour
Model 1Model 2
BSEBβ95% CI for βpBSEBβ95% CI for βp
LLULLLUL
 Constant0.3810.063 <0.0010.5770.074 <0.001
 Recruitment Link0.0140.0090.093−0.0210.2120.1080.0130.0080.087−0.0200.2000.110
 Age0.0020.0010.121−0.0040.2440.0540.0010.0010.078−0.0420.1940.192
 Gender−0.0040.017−0.013−0.1310.0990.8300.0200.0170.068−0.0480.1770.235
 Education0.0340.0080.2500.1210.368<0.0010.0250.0080.1860.0580.2960.002
 Income0.0290.0050.3110.1990.435<0.0010.0260.0050.2760.1700.394<0.001
 Numeracy0.0030.0460.004−0.1100.1250.9450.0140.0440.018−0.0900.1360.744
 General Anxiety −0.0950.065−0.094−0.2210.0280.145
 Math Anxiety 0.0440.0520.051−0.0710.1710.402
 Financial Anxiety −0.2380.054−0.292−0.424−0.163<0.001
R20.225 0.312
R20.225 0.087
F12.52 <0.00112.97 <0.001
Note. N = 239; model = “Enter” method in SPSS Statistics; B = unstandardized regression coefficient; SEB = standard error of the coefficient; β = standardized coefficients; CI = confidence interval for standardized coefficients; LL = lower limit; UL = upper limit; △R2 = adjusted R2 change; gender 1 = male, 2 = female. Education is measured from 1 (I have not completed high school) to 6 (Doctoral degree). Income is measured from 1 (<CAD 15,000) to 6 (>CAD 100,000).
Disclaimer/Publisher’s Note: The statements, opinions and data contained in all publications are solely those of the individual author(s) and contributor(s) and not of MDPI and/or the editor(s). MDPI and/or the editor(s) disclaim responsibility for any injury to people or property resulting from any ideas, methods, instructions or products referred to in the content.

