Article

Enhancing Financial Market Analysis and Prediction with Emotion Corpora and News Co-Occurrence Network

Department of Computer Science and Engineering, University of Colorado Denver, Denver, CO 80204, USA
*
Author to whom correspondence should be addressed.
J. Risk Financial Manag. 2023, 16(4), 226; https://doi.org/10.3390/jrfm16040226
Submission received: 20 February 2023 / Revised: 23 March 2023 / Accepted: 26 March 2023 / Published: 4 April 2023
(This article belongs to the Special Issue Neural Networks for Financial Derivatives)

Abstract

:
This study employs an improved natural language processing algorithm to analyze over 500,000 financial news articles from sixteen major sources across 12 sectors, with the top 10 companies in each sector. The analysis identifies shifting economic activity based on emotional news sentiment and develops a news co-occurrence network to show relationships between companies even across sectors. This study created an improved corpus and algorithm to identify emotions in financial news. The improved method identified 18 additional emotions beyond what was previously analyzed. The researchers labeled financial terms from Investopedia to validate the categorization performance of the new method. Using the improved algorithm, we analyzed how emotions in financial news relate to market movement of pairs of companies. We found a moderate correlation (above 60%) between emotion sentiment and market movement. To validate this finding, we further checked the correlation coefficients between sentiment alone, and found that consumer discretionary, consumer staples, financials, industrials, and technology sectors showed similar trends. Our findings suggest that emotional sentiment analysis provide valuable insights for financial market analysis and prediction. The technical analysis framework developed in this study can be integrated into a larger investment strategy, enabling organizations to identify potential opportunities and develop informed strategies. The insights derived from the co-occurrence model may be leveraged by companies to strengthen their risk management functions, making it an asset within a comprehensive investment strategy.

1. Introduction

Financial market analysis covers a wide range of topics, including asset pricing, market efficiency, and financial market anomalies. One important aspect of this field is risk management, which focuses on addressing uncertainties arising from financial markets; one aspect of that uncertainty is market sentiment impact (Shapiro et al. 2020). Karen Horcher defines financial risk management as the process of identifying, assessing, and controlling financial risks that may impact an organization’s ability to achieve its financial objectives. This includes identifying risks related to credit, market, liquidity, operational, and other areas, and developing strategies and techniques to mitigate those risks (Horcher 2011). The resulting emotional analysis of financial news and co-occurrence network promise to provide another dimension to help in financial market analysis and enable investors to gain a better understanding of how the market is likely to react. By analyzing the emotional content of news articles, organizations can gain insights into potential risks and opportunities and develop strategies to mitigate or capitalize on them.
Changes in key economic indicators have historically provided a reliable guide to recognizing the business cycle’s four distinct phases—early, mid, late, and recession. Our approach seeks to identify the shifting market movements within a sector, providing a framework for making asset allocation decisions according to the probability that assets may outperform or underperform based on the emotional factors of financial news articles. This approach may be incorporated into an asset allocation framework to take advantage of financial news media impact on performance that may deviate from longer-term asset returns.
Economic researchers (Ibbotson and Kaplan 2000) state that economic factors influence asset prices; however, there is still research required to determine the best way to incorporate additional factors such as the emotional impact of financial news into asset allocation approaches. The impact of the pandemic entered the US into a contraction after peak cycle that was not influenced by other economic factors. We believe that with a disciplined approach we can better predict the emotional news correlation to sector volatility and better analyze the underlying factors and trends across various time horizons using both news sources and sector data sources.
In this paper, we present a body of research across two stages. In phase 1, we collect a large set of financial news articles leveraging named entity recognition (concepts) to identify news articles with the specific companies representing the top 10 across each of the main 12 sectors by holdings resulting in 516,973 news articles to analyze for the period from 1 January 2019 to 1 January 2021. We modify the text2emotion library (Gupta et al. 2021) to include a larger corpus by incorporating the National Research Council Lexicon financial glossary and modify to expand from 5 emotions (text2emotion: happy, angry, sad, surprise, and fear) to include the 8 main emotions (NRC lexicon: anger, fear, anticipation, trust, surprise, sadness, joy, and disgust) and incorporate emotional mixing with 22 emotions providing categorization of 30 distinct emotions.
In phase 2, we conduct sector analysis over the same time-period. We calculate percent change in sector price as compared to the previous day to identify more moderate market movement events (1% is noted as a normal) as noted by Ed Easterling, Crestmont Research, “The average daily swing over more than forty years has been approximately 1.4%.” (Easterling 2022). We leverage this daily percent change across each sector to look for significant events that we define any market movements ±2% across 1 January 2019 through 1 January 2021, which brings total articles processed down to 111,175. We then leverage the new emotion classification algorithm with named entity recognition based on unique Wikipedia concepts (e.g., http://en.wikipedia.org/wiki/COMPANYNAME (accessed on 24 April 2022) Table A1) to identify specific companies using news articles to create a co-occurrence network based on the companies appearing in the news, in the same day, with the same emotional classification of the articles.
Sentiment polarity analysis has been leveraged in recent research for predicting stock market prices (Lu et al. 2021), correlation with financial news (Wan et al. 2021), as well as recent news co-occurrence approaches (Tang et al. 2019) finding a statistically significant association between media sentiment and abnormal market return. We continue this research and expand it to look deeper into the emotional sentiment as a stronger correlation approach than polarity can provide on its own. Although there are many approaches to leveraging emotional analysis of tweets, there has not been research on applying them to financial news (Aslam et al. 2022; Ramírez-Sáyago 2020). The popular tool in the researcher’s toolkit is Text2Emotion. However, we require a much larger corpus that incorporates financial terms and the leading NRC Emotion Lexicons from the National Research Council to create a more robust corpus for this analysis that leverages the eight emotions from Plutchik’s research. Plutchik suggests that people experience eight core or primary emotions (joy and sadness, trust and loathing, fear and anger, surprise, and anticipation). The eight primary emotions can then be combined into twenty-four primary, secondary, and tertiary dyads defined as feelings composed of two emotions representing a significant amount of overall emotion. Further aligning to this more recent emotional research around Plutchik’s emotional wheel (original basis of the NRC lexicons) and incorporating what these lexicons ignore, i.e., the three dyads of emotion that look at the mixture of prevalent emotions (e.g., joy + trust indicative of the feeling of love), adding 24 additional emotional classifications to the annotation algorithm.
We agree with Wan in the articulation of the complexity of financial analysis across business cycles, macroeconomics, and sectors. “Complexity and inter-dependencies have been the defining features of most modern financial markets: a myriad of ever-changing interactions between market participants, financial assets and relations with broader macroeconomic factors have all contributed to intricate market dynamics.” (Wan et al. 2021). We further expand this research to allow us to study the dynamics of emotion and expand the target companies across a larger set of sectors that better represent the significant 12 sectors of the economy and relate those to more significant market corrections of 2%. Our hypothesis is “there is a stronger correlation between companies that share the same emotion on the same day representing a stronger correlation than simple sentiment polarity can provide.”.
The primary contributions of this paper are (1) the introduction of an improved language corpus (19,430 terms compared to original 8666 terms), (2) financial phrases with the ability to incorporate multi-word phrases, and (3) expanding from 5 to an expanded 30 emotions. In the labeling of Investopedia terms and phrases dictionary, we compared how the article would have been interpreted by Text2Emotion Corpus with the addition of the NRC dataset bringing the understood vocabulary from 8666 to 13,470 with newly aligned Plunkett emotions and mixed emotions finding improved categorization of the emotion.
The secondary contribution of this paper is an efficient way to create co-occurrence news networks based on the improved emotional library where we find moderate correlation between sectors based on emotion over sentiment polarity alone (created with companies in those sectors that show up in the news in the same day with the same emotion).
This paper is organized around Section 2: related work, Section 3: methods and materials for emotional annotation algorithm improvements and development of the financial news co-occurrence network, concluding in Section 4 with notable results in the emotional annotation algorithm improvements and findings related to relationships between companies and their sectors based on the emotional annotation of financial news articles.

2. Related Work

Sentiment analysis as a research area has been an active and important field most highly attributed to the use of social platforms. Microsoft, as part of their communication compliance platform, leverages machine learning to detect different types of emotion such as harassment to minimize communication risk by helping companies detect, capture and act on messages deemed inappropriate (Mazzolli et al. 2023).
In “Tweet Emotion Dynamics: Emotion Word Usage in Tweets from US and Canada” (Vishnubhotla and Mohammad 2022), the authors look at twitter data as one of the most influential forums for social, political, and health discourse. Developing a (TED) metric to capture patterns of emotion associated with tweets over time, the authors leverage the NRC lexicon (valence, arousal, and dominance) to determine emotion associations. These are numerical scores, where a valence score of ≥0.67 represents positive or polar terms to determine the emotion association of the words in tweets. The authors note that similar analysis could be carried out using the NRC emotion Lexicon to perform categorical and dimensional analysis of emotions. We take this inspiration to leverage the NRC emotion lexicon and further expand emotions from five to eight and incorporating the larger expanded Plutchik’s research representing 30 distinct emotions and including a financial glossary to support financial news research.
In “Emotion in Twitter communication and stock prices of firms: the impact of Covid-19 pandemic” (Dhar and Bose 2020), the authors leverage TextBlob and Text2Emotion to leverage polarity (positive and negative) and emotional analysis from the Text2Emotion embedded lexicon. We expand on this paper to include financial terminology and multi-word identification to better analyze financial articles. Our approach looks to leverage this larger corpus to then scrape all terminology from Investopedia financial terms (6253) to create a financial lexicon to incorporate into the corpus. As financial phrases tend to be multi-word, we also needed to add lookahead logic to look for financial phrases in the calculation of the emotional category.
In “Sentiment correlation in financial news networks and associated market movements” (Wan et al. 2021), authors Wan et al. leverage sentiment analysis and new co-occurrence (companies appearing in news) to build the graph model used in the analysis. We expand on this idea to leverage our new emotional algorithm so that companies that appear on the news on the same day with the same emotion whose sector had a more significant market correction (±2%). Weights are added to the edges based on the number of unique emotions are shared across different days (two companies share joy on day 1 and anger on day 2) representing a much stronger correlation between those edges. This results in an efficient way to create co-occurrence news networks based on the improved emotional categorization that polarity alone is unable to do.

3. Materials and Methods

In this section, we briefly describe the workflow commonly used by analysts when conducting risk assessment and financial analysis leveraging time series information. Researchers have focused on applying time series analysis to market performance. When significant negative events occur that could impact a company’s operations, the stock price tends to decrease. Essentially, the stock price serves as a barometer of the market’s confidence in a company’s future performance. Time series analysis can be used in risk management to identify, model, and forecast changes in financial market variables over time. This includes modeling the volatility of financial returns, predicting future market trends and movements, and identifying potential risk factors that may impact financial outcomes (El-Qadi et al. 2022; Huang 2016). Our methodology is based on adding additional risk factors, which is the news emotion sentiment, to create a co-occurrence news network of companies that share emotional sentiment on the same day to improve accuracy. In this research, we used a natural language processing library we improved to leverage the EmoLex lexicon (https://saifmohammad.com/WebPages/NRC-Emotion-Lexicon.htm (accessed on 24 April 2022)), domain-specific phrases, and mixed emotion analysis to improve the categorization of news articles, providing a more accurate in-day correlation between companies. Substantial materials were reviewed including macroeconomic, sector data, and a very large, queried news dataset tied to the companies in the sectors being analyzed to serve as the basis to create graph of companies that share emotional sentiment.
We first briefly outline our steps of data collections and our algorithms developed to analyze time series sector data, and the correlation to emotional sentiment in financial news articles. We then provide a more detailed description in Section 3.1 and Section 3.2.
1. Data collection: The first step was to collect the necessary data, including financial market data for the sector of interest and financial news articles related to that sector. The data were obtained from the federal reserve and economic data (FRED) for macroeconomic data and from finance.yahoo.com for sector-related information, financial news was obtained across several financial news sources, standard news sources, and international (“nasdaq.com”, “barrons.com”, “thestreet.com”, “investing.com”, “forbes.com”, “wash-ingtonpost.com”, “nytimes.com”, “reuters.com”, “foxnews.com”, “bloomberg.com”, “ya-hoo.com”, “cnn.com”, “wsj.com”, “cnbc.com”, “marketwatch.com”, “bbc.com”).
2. Data cleaning and preprocessing: The next step was to clean and preprocess the data using pandas, a Python data analysis library. This involved removing duplicates, missing values, and irrelevant data. The data were then transformed into a format suitable for analysis, such as a time series dataset and percentage of change from one day to next.
3. Sentiment analysis: To analyze the emotional sentiment of the financial news articles, sentiment analysis algorithms were used. These algorithms use natural language processing techniques to identify and extract sentiment-related information and emotional information from the text. We leveraged the Natural Language Toolkit (NLTK) SentimentAnalyzer (Bird et al. 2009) for sentiment score and modified the Text2Emotion (Gupta et al. 2021) to include the EmoLex lexicon and expanded finance vocabulary using SentimentAnalyzer to adjust for sentence content in the calculation of emotion.
4. Correlation analysis: Once the emotions were obtained for each article, the next step as to correlate them with the time series sector data for the financial sector and company data. This can was performed by using pandas and statistical analysis techniques to create a co-occurrence graph based on the same emotion for companies in the news with the emotion categorization algorithm. This graph, based on number of articles with the same emotion, creates greater strengths between the companies and highlights notable pairs of companies. We used correlation coefficients on sector sentiment to see how closely the sectors matched up with the movement of the companies and found similar trends.
5. Visualization and interpretation: Finally, the results were visualized and interpreted to gain insights into the relationship between emotional sentiment in financial news articles and the behavior of the financial market. This can help investors make informed decisions and predict market trends.
First, we presented the improved emotional annotation algorithm expanding the vocabulary, expanding categorization, and incorporating a financial glossary (domain-specific corpus). We then covered the development of the news co-occurrence network by downloading financial news and market financial data and analyzing those articles across market events categorized by the emotional annotation algorithm. We used this approach to find relationships between companies and their sectors based on daily emotional annotation occurring during market events.

3.1. Emotional Annotation Algorithm

To be able to analyze the financial news, we needed an algorithm that included financial terms, an improved language corpus with additional words, the ability to incorporate multi-word phrases, and an expanded emotional dialect (30 emotions). The original algorithm had five primary emotions, whereas the NRC dataset included eight based on Plutchik’s model, requiring us to normalize the Text2Emotion embedded corpus. We also expanded to include the addition of 22 mixed emotions and improvements to leverage sentiment to emphasize the calculation. Logical Model 1 shows the high-level improvements to the original Text2Emotion algorithm from 5 to 8 emotions, expanded corpus, and sentiment improvements. Logical Model 2 shows leveraging the new logical model 1 to annotate the domain specific knowledge to then expand domain specific knowledge into the corpus to include phrases and further expanding emotion annotation with the remaining 22 emotions.
Jrfm 16 00226 i001
  • Logical Model 1—Improving the emotional algorithm.
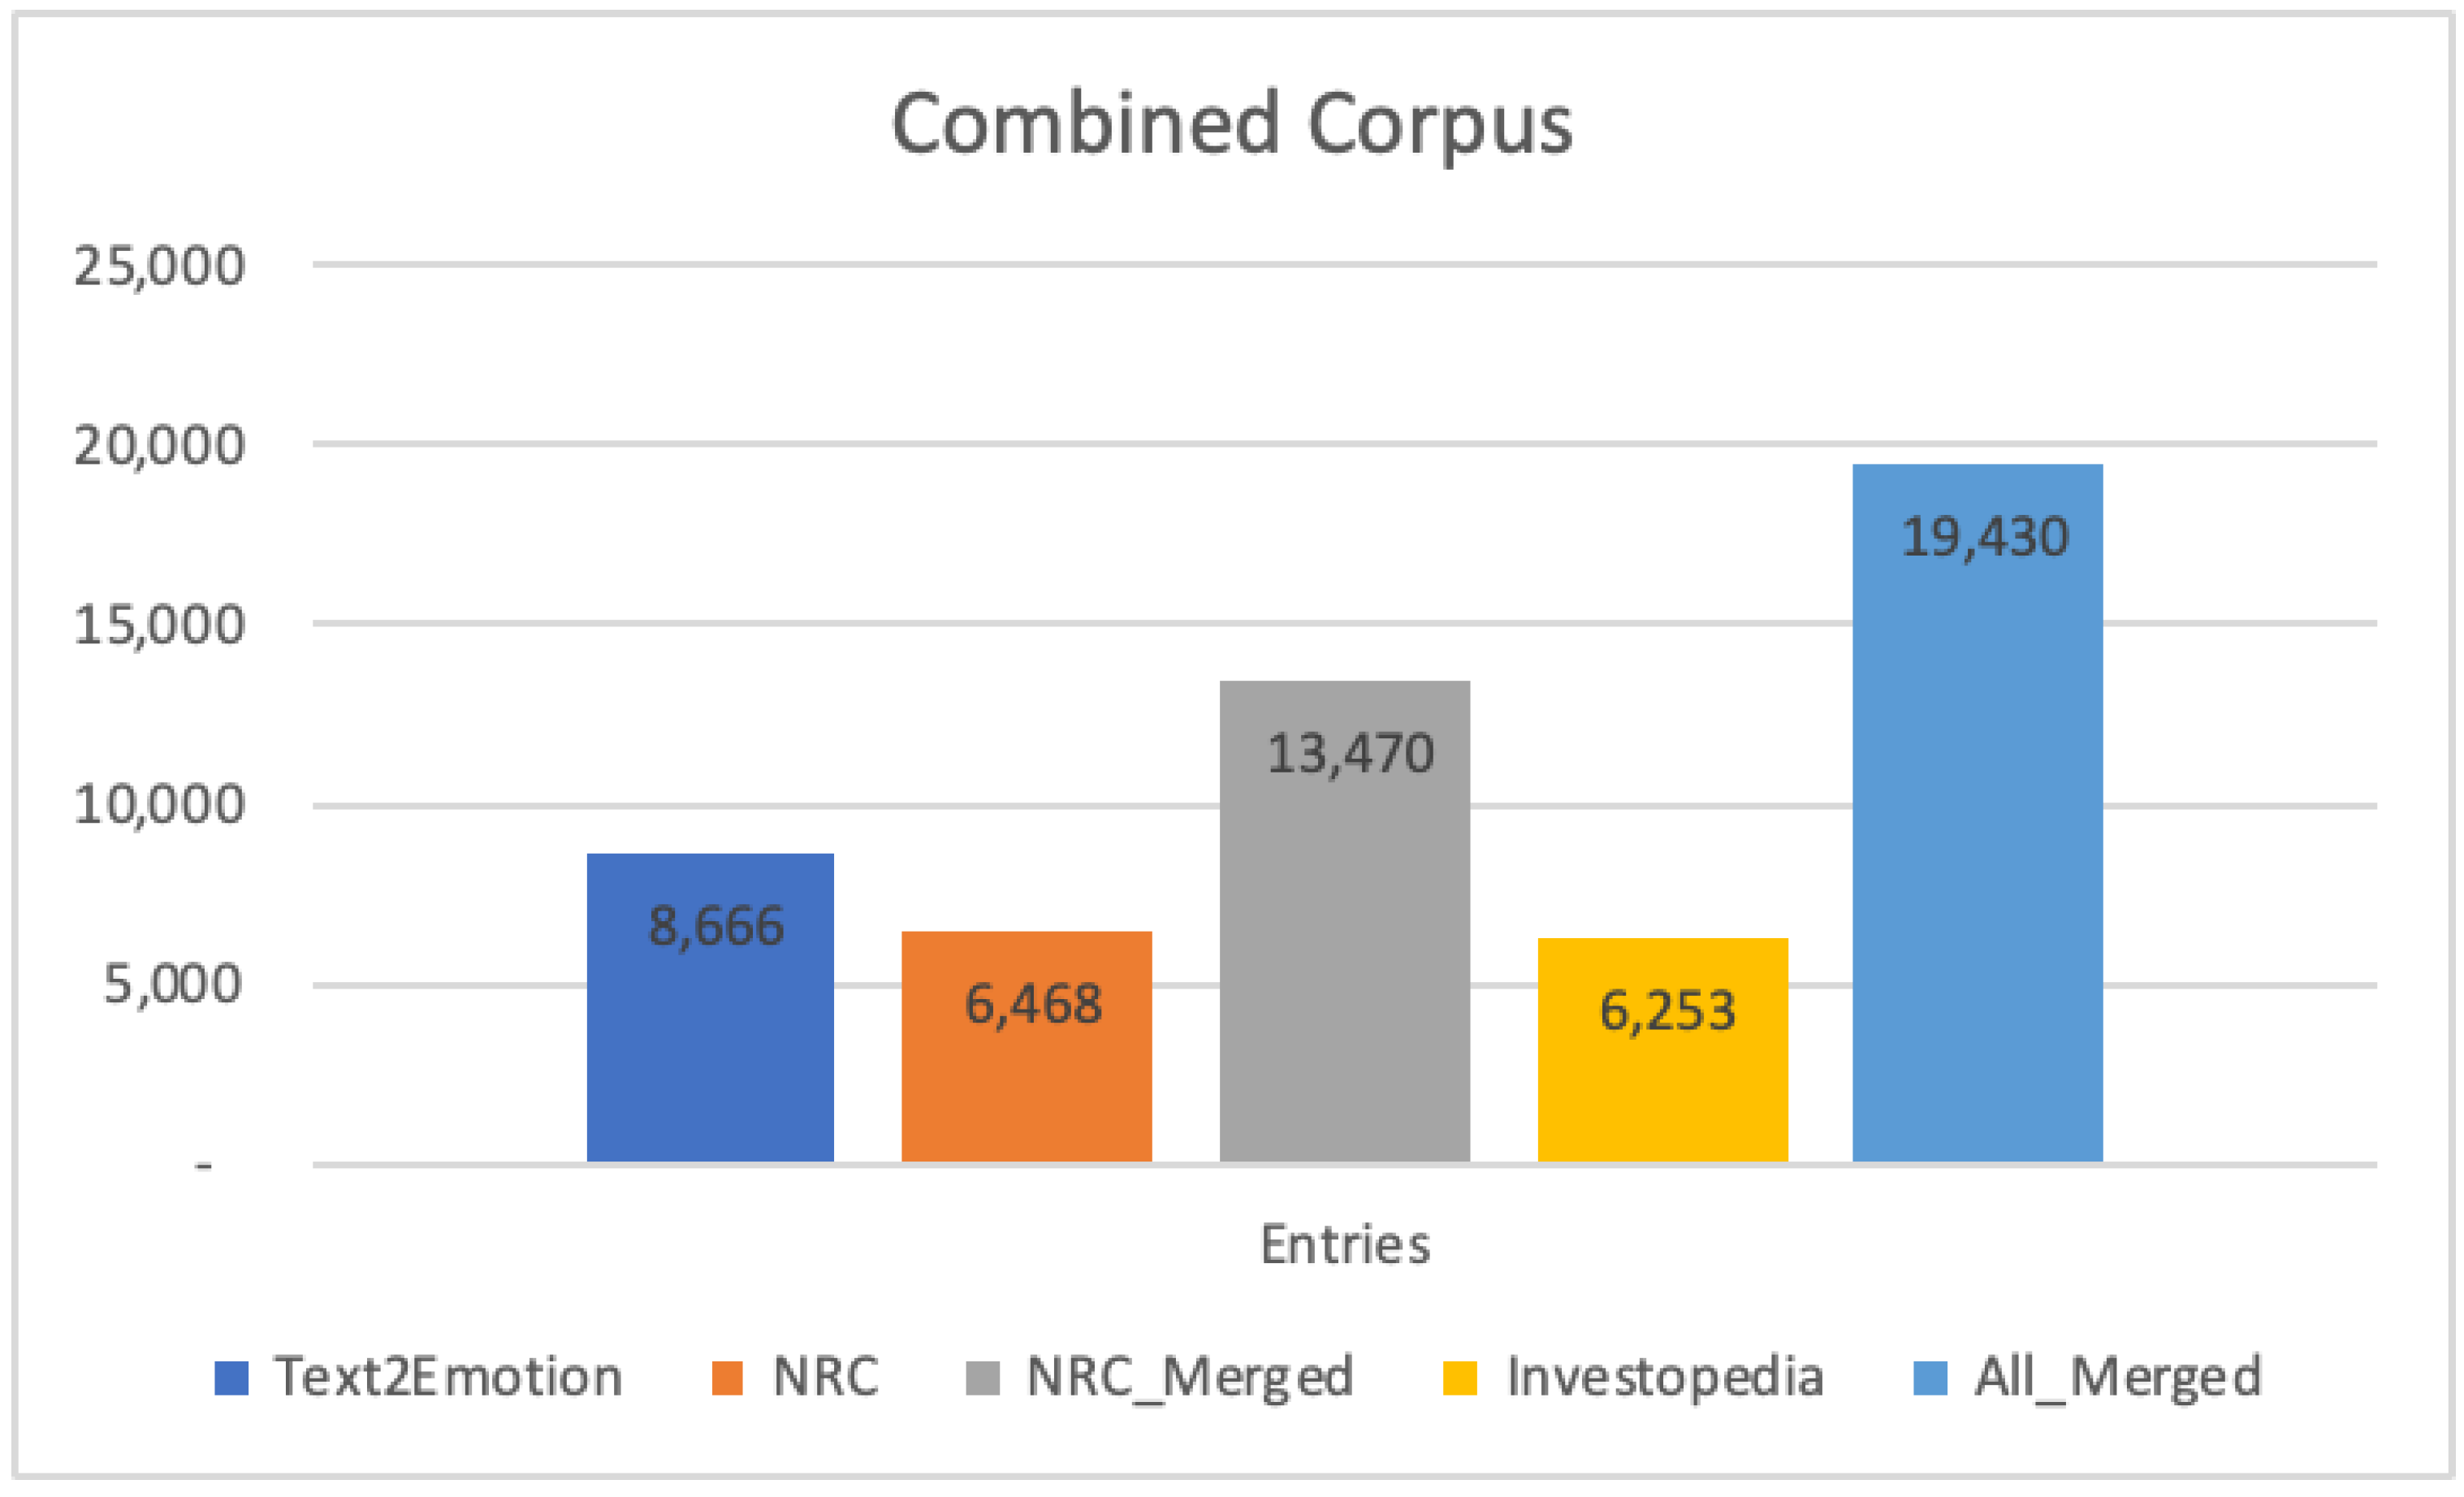
  • Corpus Datasets
The Text2Emotion with normalized emotions to match the NRC dataset, the addition of the NRC Emotion Lexicon dataset and the addition of domain specific (financial phrases) glossary were merged into a final corpus to process the financial news articles.
The NRC Emotion Lexicon is a list of words and their associations with eight emotions based on the Plutchik (2001) model (anger, fear, anticipation, trust, surprise, sadness, joy, and disgust) and two sentiments (negative and positive). The annotations were manually conducted using Amazon’s Mechanical Turk, a crowdsourcing marketplace with 6466 words.
EmoLex was chosen as the dataset for emotional analysis for several reasons. Firstly, it includes a comprehensive list of words with their emotional values, providing a solid foundation for sentiment analysis. Secondly, the words in the EmoLex dataset are annotated based on Plutchik’s Wheel of Emotions, which provides a rich, multidimensional approach to understanding emotions beyond just positive and negative. This allows for a more nuanced understanding of emotions, which is particularly useful in financial analysis, where the difference between mild concern and deep-seated anxiety can have significant implications for investment decisions. Finally, EmoLex has been widely used and validated in academic research and industry, which increases its credibility and reliability. Overall, the EmoLex dataset is a valuable tool for emotional analysis in various fields, including finance, marketing, and social sciences. Leveraging this improved corpus to then translate financial phrases allows unique financial phrases to be incorporated into a more accurate analysis.
This library contained an embedded corpus that was externalized and represented 8666 words.
This library was compatible with 5 different emotion categories, happy, angry, sad, surprise, and fear; these emotions were normalized to the Plunkett emotion model so that the following words were mapped to the standard emotional term in the Plutchik emotional wheel (happy -> joy, angry -> anger, sad -> sadness, surprise -> surprise, and fear -> fear).
In our Algorithm1: “get_emotion” that built the dictionary of emotions, we made several enhancements:
  • We added sentiment checks leveraging the Natural Language Toolkit (NLTK) (Bird et al. 2009), which uses certain rules to incorporate the impact of surrounding text on perceived sentiment to slightly adjust those emotions that aligns to sentiment. The algorithm, called VADER (valence aware dictionary and sentiment reasoner) (Hutto and Gilbert 2014), is a lexicon-based sentiment analysis tool that uses a rule-based approach to determine the sentiment of a piece of text. It uses a combination of sentiment lexicons, grammatical rules, and syntactical patterns to assign a sentiment score to the text. The formula for calculating the sentiment score using VADER can be represented as:
    Sentiment score = (WPS ∗ Valence) + (SPS ∗ Intensity) + EmoticonScore
  • As shown in the algorithm, additional data cleansing (Table 1) was also added to the Text2Emotion library to support better matching of terms, leveraging lemmatization over stemming a more modern approach and leveraging NLTKs updated stop words vocabulary all with the intent of achieving better term matching with the larger corpus.
  • In analyzing articles, we found that using just the standard aggregate of individual words affect results in some articles being classified incorrectly. This led to the intuition of making just slight adjustments based on the overall article sentiment. If we find a positive sentiment and the emotion is positive (trust, surprise, joy, or anticipation) then the calculation of the word (how much that word contributes to the overall emotion) is slightly adjusted by an extra 0.5. The negative sentiment similarly adjusts the negative emotions (fear, anger, sadness, or disgust). This basically provides an emphasis on the emotion based on polarity of the overall article being analyzed. We tried larger values (adjusting by 1) and smaller values (adjusting by 0.25) that showed little difference before arriving at 0.5. This adjustment created stronger separation of emotions.
This intuition was used to adjust the previous Text2Emotion algorithm by adding to the emotion value by +0.5 as:
Emotion vector = ∑(emo ∈ emotions_list) emotions[emo] = emotions[emo] + 1
if sentiment == ‘positive’:
        if emo in [‘trust’, ‘surprise’, ‘joy’, ‘anticipation’]:
                                        emotions[emo] += 0.5 
elif sentiment == ‘negative’:
        if emo in [‘fear’, ‘anger’, ‘sadness’, ‘disgust’]:
                                        emotions[emo] += 0.5
The result vector is normalized so all emotions for the sentence are normalized to 100% as:
Normalize emotion vector = ∑(i∈emotions) emotion_values[i] = round(emotions[i]/∑k∈emotions emotions[k], 2)
These are then leveraged within the updated algorithm (get_emotion) to return the emotion vector for the articles.
Algorithm 1 Obtain the emotion vector for the news article
Algorithm: get_emotion
Input: News Article
Output: Dictionary ‘emotions’
1. Calculate Sentiment score for the article
2. Clean input (remove stopwords, lemmatization, remove shortcuts, expand contradiction)
3. Create word to emotions lexicon of financial phrases and NRC EmoLex and Text2Emotion word to emotion mappings and store the data in the dictionary ‘data’
4. Initialize an Emotion vector ‘emotions’ with keys “fear”, “anger”, “trust”, “surprise”, “sadness”, “disgust”, “joy”, and “anticipation”, all set to 0
5. For each word in the ‘Article’, do the following:
 a. Update Emotion vectors based on emotion in word to emotion lexicon.
6. Normalize emotion vector
7. Return ‘emotion vector’
The merged values of Text2Emotion corpora and NRC resulted in a combined corpora of 13,470 with overlap of 1664 words where the emotions were merged between the two sets. This new merged corpus and improved library was then used to process financial phrases from Investopedia.
Jrfm 16 00226 i002
  • Logical Model 2—Improved Emotion algorithm with financial phrases
To expand the lexicon to include financial phrases we crawled the financial terms from the Investopedia glossary and pulled down the articles that describe the financials terms and ran that through the Text2Emotion+NRC merged corpora to generate a new financial phrase corpus, representing 6253 financial terms. The financial terms are in some cases multi-word phrases (e.g., accelerated depreciation); as such, we needed to update the library to also support phrases incorporating a look-ahead vector based on the first work and looking forward in the sentence for multiword phrase matching. When the single word is not found we also look ahead to see if the phrase from start word exists so that phrases can also be leveraged in this case financial terms.
The new algorithm, Algorithm2 “get_mixed_emotion”, described next, was then capable of matching financial phrases based on the financial phrase corpora. Furthermore, we adapted to incorporate the emotional mixing (Plutchik 2001) (including 22 new emotions). When the top two emotions represent 50% of the emotional calculation and the two emotions are within 15%, then the mixed emotion is returned based on Table 2 (e.g., joy + trust -> love) and the “get_mixed_emotion” algorithm.
Algorithm 2 Obtain the top emotion or mixed emotion from Plutchik emotion mixing
Algorithm: get_mixed_emotion
Input: News Article
Output: Top Emotion (or Mixed Emotion)
1. Call get_emotion to get normalized vector of emotions for the article
2. Sort ‘emotions’ vector by descending value
3. If the sum of the top two values is greater than 0.5 and the difference between the values of the top two emotions is within 0.15, do the following:
 Return the emotion from Table 2
4. Otherwise, return the top emotion from the vector

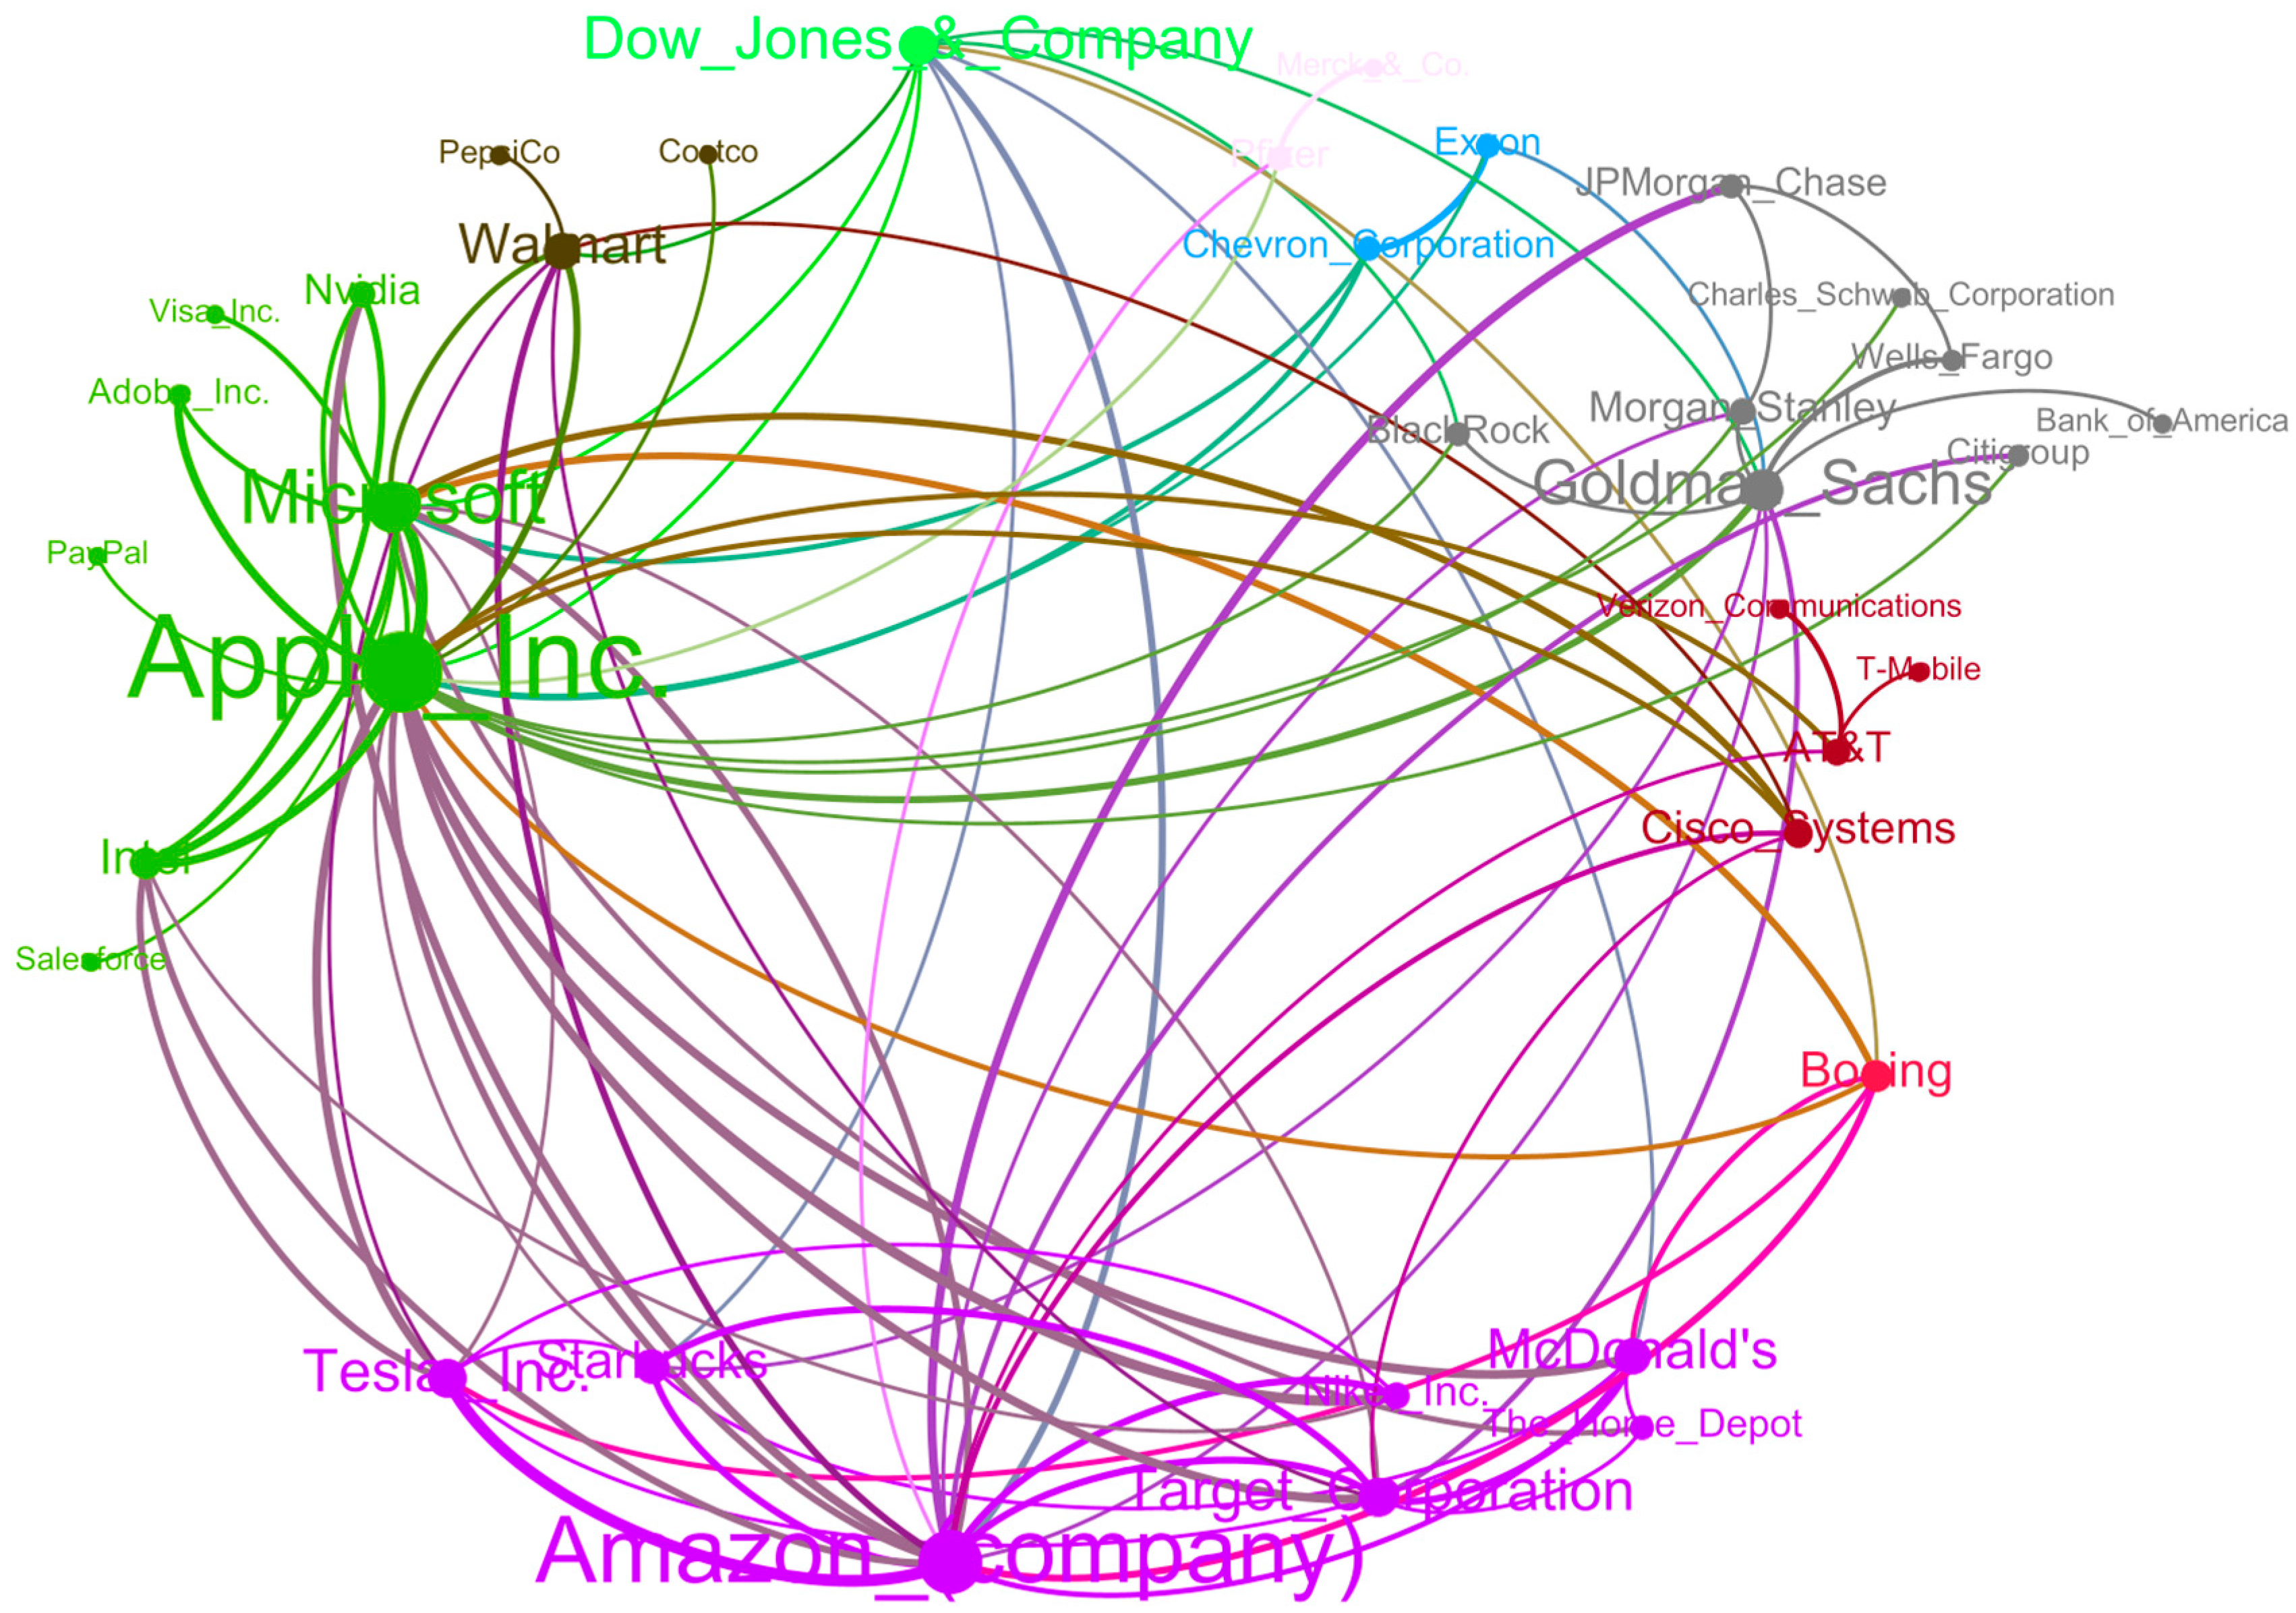
3.2. News Co-Occurrence Network

Macroeconomic indicators with their respective data sources and timeframes were pulled from the Federal Reserve. These include crude oil (1986–2021), inflation (2003–2021), CPI (1947–2021), trade-weighted dollar index (2006–2021), real gross domestic product (1947–2021), unemployment (1948–2021), and recession data (1854–2021). Each indicator has a specific measurement and provides insight into various aspects of the US economy, such as inflation, consumer buying habits, GDP, and business cycles. The data can be used to analyze the performance of different sectors and asset classes over time. The following are the sectors and indicators of exchange-traded funds (ETFs) in the study: energy, gold miners, materials, industrials, consumer discretionary, consumer staples, health care, financials, technology, telecommunication, utilities, real estate, and the S&P 500.
Articles (Table 3) were downloaded for each of the top 10 companies in each sector from 16 top financial news sources including conservative, liberal, and international. Each article was processed to capture concept (name of the company) through its Wikipedia reference (Table A1) to ensure exact match on company, sentiment and post processed to add in the top emotion based on the new emotion algorithm library we updated as part of this research. Together, a new dataset was created containing the sector, date, percent_change, and sentiment_daily across all sectors (all_news_sentiments.csv).
Leveraging a data analysis library ‘pandas’, we created a new dataset to store date, sector, price, and percentage change from the previous day. This data was merged with the news for that sector and average daily sentiment for that sector. This allowed for the analysis of market movements ±2% across 1 January 2019 through 1 January 2021.
News articles were analyzed and merged into a final dataset that included the date, sector, company, percentage change from previous day, and sentiment daily mean for further analysis.
We then conducted standard correlation coefficients analysis on sector time series information (using sentiment alone) to validate if the generated co-occurrence network described next shows the same market reaction (looking at relations > 0.55). The goal is to see if the significant pairs of companies from the news network moved together (up or down) in market.
Jrfm 16 00226 i003
  • Logical Model 3—Generating sentiment across all companies and sectors.
Jrfm 16 00226 i004
  • Logical Model 4—Financial news co-occurrence graph
To create the financial news co-occurrence network, see Algorithm3 described next, we used the combined dataset that was postprocessed in the final dataset. If the same company pair was found with the same emotion, that emotion was tracked for that company pair. The weight of the edge was then the sum of all emotions for that company pair up to an upper bound of 27 (which represents the number of unique emotions discovered through all the news articles). Edges were only created with weights > 5.
Algorithm 3 Create the co-occurrence new network for company pairs
Algorithm: Co-occurrence Network Construction
Input: Dataset including date, company, and emotion for each news article for that day
Output: Co-occurrence graph network constructed from the emotion data (pair of companies that share the same emotion on the same day)
1. Generate Edges
foreach emotion in emotions:
 group = from dataset get companies with the same emotion by date (group by date, emotion)
 for each row in group
  Set edges = Get all combination of companies with the same emotion
  Foreach edge in edges
   If edge not in hash set edge to empty {}
   edge_hash[edge][emo] = if first time emotion seen for edge, initialize to zero
   edge_hash[edge][emo] += 1
2. Generate Nodes with all Companies Names
Graph.add_nodes_from(list of companies)
3. Keep edge weights greater than 5
Foreach key in edges
 If weight > 5
  Graph.Add(key)

4. Results and Discussion

We found that by expanding the vocabulary to include (4804) additional terms and adding support for financial phrases allows for improved analysis of financial news articles. The new corpus increased the original library by 224%, greatly expanding the available vocabulary with 6253 financial terms and phrases to a new combined corpus of 19,430 terms (Figure 1). These (10,764) additional terms provide a significant improved vocabulary including the ability to recognize financial phrases. This same approach could be augmented to any domain where a glossary is available for domain-specific analysis.
In the labeling of Investopedia terms and phrases dictionary we compared how the article would have been interpreted by Text2Emotion corpus with the addition of the NRC dataset bringing the understood vocabulary from 8666 to 13,470 with new aligned Plunkett emotions and mixed emotions. Terms were considered equal using the normalized mechanism (happy -> joy, angry -> anger, sad -> sadness, surprise -> surprise, and fear -> fear). The NRC dataset added in the missing emotions (trust, anticipation, and disgust). In analyzing financial articles, 5702 articles resulted in the same emotion as compared to the original algorithm. The new algorithm for 551 articles uncovered different emotions not found by the original algorithm. When the two top emotions represented over 50% of the emotional state, both emotions were included in the corpus (e.g., sadness and fear noted below).
We then examined the differences, looking at the differences found for happy (joy in the normalized model). The improved algorithm found the following differences.
  • Trust (vs. happy)—Twelve financial phrases differ (consumer goods, finance charge, Fortune 100, Fortune 500, free carrier, income elasticity of demand, inferior goods, legal tender, normal good, orange book, virtual good, Westpac consumer confidence index); from a reader’s perspective, the articles do not read happy, these read as the definition of financial terms.
  • Surprise (vs. happy)—Three financial phrases differ (Giffen good, one-time charge, volatility smile); from a reader’s perspective, the articles do read more surprise (Giffen good being a condition that does not follow standard economic theory, one-time charges being a surprise to many, and volatility smile being a change in volatility as a surprise in economic movement)
  • Sadness, fear (vs. happy) (representing mixed emotion despair)—One financial phrase differs (tax evasion); the reader would also concur that this does not represent happy and is more appropriately defined as despair.
  • Anticipation (vs. happy)—Two financial phrases differ (public good, rival good); these articles do read more anticipation in positive outcomes (a public good being a commodity or service provided without profit).
The financial dictionary contained phrases, so it was necessary to adjust the algorithm to also incorporate phrases where the original Text2Emotion was limited to single words. The algorithm needed to do a partial key search based on current word and then look forward into sentence for phrase (e.g., acceleration clause).
For example, the following summary “The full impact of the arbitration has now been accounted for. The dispute relates to the years 2019 and 2020 and does not affect companies’ positive long-term business outlook and guidance” was found as fear in the original algorithm and in the new algorithm the mixed emotion was submission (combination of trust and fear), providing a more accurate emotional tone of the article. To account for the impact of extreme news we included mainstream financial sources (Forbes, Bloomberg), conservative (fox), liberal (msn), and international news sources (BBC); however, further analysis on impact of more extreme news on the results should be analyzed with specific consumers of those news sources.
Leveraging the improved Text2Emotion algorithm and processed against all the financial news data, we found 23 unique emotions across the possible 30 (8 primary, 22 mixed emotions). With fear, submission, trust, despair, surprise, anxiety, joy, awe, anticipation, and sadness representing the majority (Figure 2).
The first step in understanding the data is looking at the correlation. Figure 3 shows sentiment by sector (Table 3) and percentage change from the previous day where the percentage change is a change of ±2%.
Using the sentiment data along those events where the sectors moved more than ±2% on the previous day, we looked for any correlations between the sentiments and noted that aggregated sentiment for those sectors show moderate correlation between consumer discretionary, consumer staples, financials, industrials, and technology (as noted in Table 4).
In Figure 4 below, we analyze the constructed co-occurrence news graph data for weights greater or equal to 10 and a node degree of 10 (meaning that many different edges connecting different pair). Just as we noted in sentiment correlation, we see that technology, consumer discretionary, consumer staples, and financials correlate between the companies in those sectors. Notable edges across sectors (not within the same sector) are shown in Table 5 below. These specific pairs outside of the same sector were chosen to see the influence of emotional categorization of financial news and their corresponding market movements.
Considering the notable pairs in Table 5 and the significant market events of ±2% or greater, we look to see if they move together in the market. What we see is moderate correlation (above 60%) across sectors which aligns to the co-occurrence news network despite lower correlation when taken against daily market price alone in Table 6 below as highlighted. As an observation, we see when looking at the pairs (Amazon–JPMorgan, Amazon–Citigroup, Boeing–Microsoft, and Boeing–Amazon) on significant market days there is a moderate correlation of events based on the co-occurrence graph created through the annotation of articles. We found that above 60% of the market events confirmed this moderate correlation of events. The results show more accurate and effective analysis of market sentiment, investor behavior, and promise of improved financial risk management.

5. Conclusions

This article presents two key contributions. Firstly, an improved language corpus was introduced that includes financial phrases and terms to enable more accurate and in-depth analysis of financial news articles. This improved corpus incorporates emotional mixing, resulting in 30 distinct emotions compared to the original five, which will improve data analysis for researchers leveraging Text2Emotion to categorize articles based on emotional analysis. The finding is that the improved algorithm for emotional analysis of financial news articles has identified differences in emotional content compared to the original Text2Emotion model. Specifically, this study found that 12 financial phrases related to trust, 3 related to surprise, 1 related to mixed emotion despair, and 2 related to anticipation had significant differences in emotional content compared to the original emotion of happiness. The improved algorithm allows for a more nuanced analysis of financial news articles and provides researchers with a better understanding of the emotional impact of financial terms and phrases. This can lead to more accurate and effective analysis of market sentiment, investor behavior, and financial risk management.
Secondly, an efficient method for creating co-occurrence networks based on emotional classification was proposed, which identified connections between companies within and across sectors based on financial news emotional analysis. This study found that, on significant market days, there was moderate correlation of events based on the co-occurrence graph for notable pairs such as Amazon–JPMorgan, Amazon–Citigroup, Boeing–Microsoft, and Boeing–Amazon. Specifically, the study found above 60% of the market moves together in these pairs, which aligns with the co-occurrence news network despite lower correlation when taken against daily market price alone. This suggests that the co-occurrence graph created using the annotation of articles could be useful for predicting market movements of notable pairs of companies.
This is an important signal for driving better temporal prediction based on the impact of financial news and investor sentiment. Future research will include additional signals such as futures and international money movement, as well as a shorter rolling window for financial emotional analysis to create the co-occurrence graph. This will better align with quarterly financial reporting and produce stronger market event correlation. By combining the co-occurrence network with time-series analysis and additional market signals, a better understanding of macro forces as they relate to market events can be gained. It is important to note that this study has limitations, and further research is needed to investigate the categorization of emotions over binary polarity and the impact of co-occurrence over different and shorter time frames. Furthermore, emotions in text are analyzed using aggregate data from US and European news articles, recognizing the complexity of emotions (ethical considerations) the findings should not be used to determine the emotional state of writers or readers.

Author Contributions

Conceptualization, S.M. and G.A.; methodology, S.M.; software, S.M.; validation, S.M. and G.A.; formal analysis, S.M.; investigation, S.M.; resources, S.M.; data curation, S.M.; writing—original draft preparation, S.M.; writing—review and editing, G.A.; visualization, S.M.; supervision, G.A. All authors have read and agreed to the published version of the manuscript.

Funding

This research received no external funding.

Data Availability Statement

The data presented in this study are available on request from the corresponding author. The data are not publicly available due to the NRC Word–Emotion Association Lexicon only being available to research and educational institutions.

Conflicts of Interest

The authors declare no conflict of interest.

Appendix A

Ethical Considerations

Emotions are complex; Microsoft recently deprecated their emotional analysis of faces due to the immense variability in how humans’ express emotions. There are several ethical considerations to consider in NLP analysis of emotions in text.
  • The lexicons and corpus provide a mathematical representation of the aggregate emotional tone of a body of text; it should not then follow that the reader experiences the impact as noted; we draw correlation because articles hold the same language and tone and therefore are similar.
  • The analysis and observation drawn in this paper are based on aggregate news articles across multiple sources in the US and Europe and we do not draw any conclusions based on individuals’ perception of a particular news source or any one individual’s emotional experience to a news article.
  • In this body of work, although conveying information about the perceived emotional representation of an article, accurately determining the emotional state of the writer or even the reader would require additional information and as such should not be used to represent the true emotional state of the writer or reader.
  • We do not recommend using this analysis to draw inferences about an individual or even an individual news source, unless 1. it is exercised with caution, 2. the news and individuals consent to the analysis, and 3. an expert in psychology or clinical study is included.

Appendix B

Below are the specific concepts queried against the aggregated new sources; these represent the top 10 companies in each sector based on the percent of holding that company represents in the sector.
Table A1. Top 10 company holdings for sectors.
SectorCompany
EnergyExxon,
Chevron Corporation,
Conoco,
EOG Resources,
Schlumberger,
Marathon Petroleum,
Pioneer Natural Resources,
Phillips 66,
Kinder Morgan,
Williams Companies
GoldNewmont Mining Corporation,
Barrick Gold,
Franco-Nevada,
Wheaton Precious Metals Corporation,
Newcrest Mining,
Agnico Eagle Mines Limited,
Kirkland Lake Gold,
Northern Star Resources,
Kinross Gold,
Gold Fields
MaterialsThe Linde Group,
Sherwin-Williams,
Air Products & Chemicals,
Freeport-McMoRan,
Ecolab,
Newmont,
DuPont,
Dow Jones & Company,
PPG Industries,
International Flavors & Fragrances
IndustrialsUnitedHealth Group,
Goldman Sachs,
The Home Depot,
Microsoft,
Salesforce,
McDonald’s,
Honeywell,
Visa Inc.,
Amgen,
Boeing
Consumer discretionaryAmazon (company),
Tesla, Inc.,
The Home Depot,
Nike, Inc.,
McDonald’s,
Lowe’s,
Starbucks,
Target Corporation,
Booking Holdings,
TJX Companies
Consumer staplesProcter & Gamble,
The Coca-Cola Company,
PepsiCo,
Walmart,
Costco,
Philip Morris International,
Mondelez International,
Altria,
Estée Lauder Companies,
Colgate-Palmolive
HealthcareJohnson & Johnson,
UnitedHealth Group,
Pfizer,
Abbott Laboratories,
AbbVie Inc.,
Thermo Fisher Scientific,
Merck & Co.,
Eli Lilly and Company,
Danaher Corporation,
Medtronic
financialsBerkshire Hathaway,
JPMorgan Chase,
Bank of America,
Wells Fargo,
Citigroup,
Morgan Stanley,
Goldman Sachs,
BlackRock,
Charles Schwab Corporation,
American Express
TechnologyApple Inc.,
Microsoft,
Nvidia,
Visa Inc.,
PayPal,
Mastercard,
Adobe Inc.,
Intel,
Salesforce,
Cisco Systems
TelecommunicationsCisco Systems,
Verizon Communications,
Garmin,
Motorola Solutions,
Arista Networks,
AT&T,
T-Mobile,
Lumen Technologies,
F5 Networks,
Liberty Global
UtilitiesNextEra Energy,
Duke Energy,
Southern Company,
Dominion Energy,
Exelon,
American Electric Power,
Sempra Energy,
Xcel Energy,
American Water Works,
Public Service Enterprise Group
Real EstateRealty Income Corporation,
American Tower,
Prologis,
Crown Castle International Corp.,
Equinix,
Public Storage,
Digital Realty,
Simon Property Group,
SBA Communications,
Welltower

References

  1. Aslam, Naila, Furqan Rustam, Ernesto Lee, Patrick Bernard Washington, and Imran Ashraf. 2022. Sentiment analysis and emotion detection on cryptocurrency related tweets using ensemble LSTM-GRU model. IEEE Access 10: 39313–24. [Google Scholar] [CrossRef]
  2. Bird, Steven, Ewan Klein, and Edward Loper. 2009. Natural Language Processing with Python. Sebastopol: O’Reilly Media Inc. [Google Scholar]
  3. Dhar, Suparna, and Indranil Bose. 2020. Emotions in Twitter communication and stock prices of firms: The impact of Covid-19 pandemic. Decision 47: 385–99. [Google Scholar] [CrossRef]
  4. 2022. Volatility in Perspective [PDF Document]. Available online: https://www.crestmontresearch.com/docs/Stock-Volatility-Perspective.pdf (accessed on 11 October 2022).
  5. El-Qadi, Ayoub, Maria Trocan, Thomas Frossard, and Natalia Díaz-Rodríguez. 2022. Credit Risk Scoring Forecasting Using a Time Series Approach. Physical Sciences Forum 5: 16. [Google Scholar] [CrossRef]
  6. Gupta, Aman, Amey Band, Shivam Sharma, and Karan Bilakhiya. 2021. text2emotion-library [Computer Software]. Available online: https://github.com/aman2656/text2emotion-library (accessed on 24 April 2022).
  7. Horcher, Karen A. 2011. Essentials of Financial Risk Management. New York: John Wiley & Sons. [Google Scholar]
  8. Huang, Martin. 2016. Time Series Analysis for Risk Management in Finance: A Review. Available online: http://www.columbia.edu/~mh2078/QRM/TimeSeries_RiskManagement.pdf (accessed on 6 March 2023).
  9. Hutto, Clayton, and Eric Gilbert. 2014. VADER: A parsimonious rule-based model for sentiment analysis of social media text. Paper presented at the Eighth International Conference on Weblogs and Social Media (ICWSM-14), Ann Arbor, MI, USA, June 1–4. [Google Scholar]
  10. Ibbotson, Roger G., and Paul D. Kaplan. 2000. Does asset allocation policy explain 40, 90, or 100 percent of performance? Financial Analysts Journal 56: 26–33. [Google Scholar] [CrossRef] [Green Version]
  11. Lu, Shan, Chenhui Liu, and Zhensong Chen. 2021. Predicting stock market crisis via market indicators and mixed frequency investor sentiments. Expert Systems with Applications 186: 115844. [Google Scholar] [CrossRef]
  12. Mazzolli, R., L. Cusick, L. Marcolin, and J. Saperstein. 2023. Learn about Communication Compliance. Microsoft. Available online: https://learn.microsoft.com/en-us/microsoft-365/compliance/communication-compliance?view=o365-worldwide (accessed on 9 January 2023).
  13. Plutchik, Robert. 2001. The Nature of Emotions: Human emotions have deep evolutionary roots, a fact that may explain their complexity and provide tools for clinical practice. American Scientist 89: 344–50. [Google Scholar] [CrossRef]
  14. Ramírez-Sáyago, Ernesto. 2020. Sentiment Analysis from Twitter Data Regarding the COVID-19 Pandemic. Available online: https://www.researchgate.net/publication/346453096_Sentiment_Analysis_from_Twitter_Data_Regarding_the_COVID-19_Pandemic (accessed on 3 August 2022).
  15. Shapiro, Adam Hale, Moritz Sudhof, and Daniel Wilson. 2020. Measuring News Sentiment. Federal Reserve Bank of San Francisco, Working Paper Series, (01-49). Available online: https://www.frbsf.org/economic-research/publications/working-papers/2017/01/ (accessed on 12 October 2022).
  16. Tang, Yi, Yilu Zhou, and Marshall Hong. 2019. News Co-Occurrences, Stock Return Correlations, and Portfolio Construction Implications. Journal of Risk and Financial Management 12: 45. [Google Scholar] [CrossRef] [Green Version]
  17. Vishnubhotla, Krishnapriya, and Saif M. Mohammad. 2022. Tweet emotion dynamics: Emotion word usage in tweets from US and Canada. arXiv arXiv:2204.04862. Available online: https://arxiv.org/abs/2204.04862 (accessed on 3 August 2022).
  18. Wan, Xingchen, Jie Yang, Slavi Marinov, Jan-Peter Calliess, Stefan Zohren, and Xiaowen Dong. 2021. Sentiment correlation in financial news networks and associated market movements. Scientific Reports 11: 3062. [Google Scholar] [CrossRef] [PubMed]
Figure 1. Expanded corpus.
Jrfm 16 00226 g001
Figure 2. 23 emotions (fear, submission, trust, despair, anxiety, surprise, awe, joy, anticipation, sadness).
Jrfm 16 00226 g002
Figure 3. Daily Sentiment for each sector.
Jrfm 16 00226 g003
Figure 4. News co-occurrence graph.
Jrfm 16 00226 g004
Table 1. Data cleansing.
Data CleansingActionDescription
standardize_accented_chars AddedStandardize accent characters
expand_contractions UpgradedExpand language contractions
removing_not KeptNo changes
lemmatization UpgradedChanged from stemming to lemmatization
removing_stopwords UpgradedUpgraded to NLTK to remove stopwords
removing_shortcuts KeptRemoved emojis and shortcuts
Table 2. Plutchik emotion mixing.
Mixed EmotionTop 2 EmotionsMixed EmotionTop 2 Emotions
LoveJoy + trustRemorseSadness + disgust
GuiltJoy + fearEnvySadness + anger
DelightJoy + surprisePessimismSadness + anticipation
SubmissionTrust + fearContemptDisgust + anger
CuriosityTrust + surpriseCynicismDisgust + anticipation
SentimentalityTrust + sadnessMorbidityDisgust + joy
AweFear + surpriseAggressionAnger + anticipation
DespairFear + sadnessPrideAnger + joy
ShameFear + disgustDominanceAnger + trust
DisappointmentSurprise + sadnessOptimismAnticipation + joy
UnbeliefSurprise + disgustHopeAnticipation + trust
OutrageSurprise + angerAnxietyAnticipation + fear
Table 3. Sectors and Articles.
ETFSectorCompaniesArticles
XLEEnergyTop 10 by holdings8671
GDXGold minersTop 10 by holdings1514
XLBMaterialsTop 10 by holdings25,526
DIAIndustrialsTop 10 by holdings78,215
XLYConsumer discretionaryTop 10 by holdings129,685
XLPConsumer staplesTop 10 by holdings36,753
XLVHealth careTop 10 by holdings28,607
XLFFinancialsTop 10 by holdings71,310
XLKTechnologyTop 10 by holdings109,429
IYZTelecommunicationTop 10 by holdings22,499
XLUUtilitiesTop 10 by holdings2874
VNQReal estateTop 10 by holdings1890
516,973 articles
Table 4. Correlation between sectors.
SectorCorrelationCorrelationCorrelationCorrelationCorrelation
Cons. disc.10.550.610.580.56
Cons. stap.0.5510.50.380.44
Financials0.610.510.630.56
Industrials0.580.380.6310.57
Technology0.560.440.560.571
Cons. disc.Cons. stap.FinancialsIndustrialsTechnology
Table 5. Notable company pairs across sectors.
Company Pair 1Company Pair 2
Target (consumer discretionary)Apple (technology)
Tesla (consumer discretionary)Apple (technology)
Amazon (consumer discretionary)Nvidia (technology)
Amazon (consumer discretionary)JP Morgan (financials)
Walmart (consumer staples)Apple (technology)
McDonalds (consumer discretionary)Apple (technology)
Goldman Sachs (financials)Target (consumer discretionary)
Amazon (consumer discretionary)Citigroup (financials)
Boeing (industrials)Microsoft (technology)
Boeing (industrials)Amazon (consumer discretionary)
Table 6. Notable pairs moving together compared to price only correlation.
Company PairMove TogetherTime Series Correlation (Daily Price)
Target–Apple68% (194/284)0.95
Tesla–Apple66% (190/284)0.94
Amazon–Nvidia76% (218/284)0.97
Amazon–JPMorgan60% (172/284)−0.23
Walmart–Apple62% (177/284)0.92
McDonald’s–Apple61% (174/284)0.47
Goldman Sachs–Apple68% (194/284)0.38
Amazon–Citigroup62% (178/284)−0.54
Boeing–Microsoft63% (179/284)−0.73
Boeing–Amazon60% (172/284)−0.67
Disclaimer/Publisher’s Note: The statements, opinions and data contained in all publications are solely those of the individual author(s) and contributor(s) and not of MDPI and/or the editor(s). MDPI and/or the editor(s) disclaim responsibility for any injury to people or property resulting from any ideas, methods, instructions or products referred to in the content.

