Article

Does the Size of the Business Still Matter, or Is Profitability under New Management, by Order of the COVID-19?

Department of Economics, Faculty of Operation and Economics of Transport and Communications, University of Zilina, Univerzitna 1, 010 26 Zilina, Slovakia
*
Author to whom correspondence should be addressed.
J. Risk Financial Manag. 2023, 16(4), 219; https://doi.org/10.3390/jrfm16040219
Submission received: 30 January 2023 / Revised: 23 March 2023 / Accepted: 29 March 2023 / Published: 31 March 2023
(This article belongs to the Section Business and Entrepreneurship)

Abstract

:
Businesses should come up with a strategy, plans, and goals so that their total assets can make a profit during the transformation process. Utilizing various features of a property can generate this income. This comparison provides evidence of profitability. During the global economic downturn, a number of businesses encountered issues that caused their payment situations and profitability to deteriorate. The goal of this article is to ascertain whether particular profitability indicators also revealed the pandemic-related global crisis, particularly in the Visegrad Group countries. This analysis was conducted based on categories of business size. Specifically, 8671 enterprises were analyzed. The evaluation of indicators revealed whether there was a significant change in a negative direction, a significant change in a positive direction, or no significant change. It was possible to make a clear diagram of the companies that took part in the study and to figure out the median values in order to compare the results of the chosen profitability indicators. Correspondence analysis was conducted so that conclusions could be more accurate. According to the findings of this study, indicators of ROA, ROE, and ROS did not change significantly across enterprise size categories in the years preceding, during, and after the pandemic. Since the government regulations of the V4 countries had a significant impact on these businesses, the change was most obvious in the case of small businesses within the ROS indicator. The added value of the article is derived from its analysis of selected profitability indicators in the largest group of Central European nations and its relevance.

1. Introduction

Business profit and its stable development are key performance indicators (Kliestik et al. 2022). According to the general theory of profitability, better indicators and higher satisfaction of the company employees lead to a higher return on the initial investment of property, capital, or other business components in the form of profit (Visser et al. 2022). However, these measurements and assessments are only conducted at the corporate level, which can often make the real business environment look different. Even though the company achieves positive profitability values, there may be a problem if it compares itself to other companies in its industry or across the country that can achieve much better results. A high level of investment in innovation lays the foundation for economic stability during COVID-19 (Didenko et al. 2022). After the COVID-19 era, the competition became even tougher, so it is important to keep an eye not only on your own company but also on the competition in general (Aydogmus et al. 2022). It is also more challenging to obtain optimal outcomes, especially for business entities in different country classifications; for instance, there are different criteria for companies operating in developed versus developing countries (Almashhadani 2021). This “gap” is even larger if we consider companies with varying numbers of board members (Alabdullah et al. 2021), the company’s history (i.e., age and size) (Mahmood et al. 2019), and the country’s GDP growth rate (Kaya 2015). Other things, such as the government and its rules or the corporate culture itself, also affect how profitable a business is as a whole (Akhmadi and Januarsi 2021).
Different study results—in particular, how popular the profitability solution is in different parts of the world—led to the creation of this scientific article on the conditions in Central Europe. Thus, the goal of this article was to ascertain whether particular profitability indicators also revealed the pandemic-related global crisis, particularly in the Visegrad Group countries. Visegrad Four was chosen because it is the largest grouping of Central European countries. A cultural and political alliance of Hungary, Poland, Czech Republic, and Slovakia is known collectively as the Visegrad Group, or V4 (Ghani et al. 2022). This study was also influenced by the research findings of Hassan (2022), who solved the issue of profitability using a variety of mathematical and statistical techniques. The contribution of this study, compared with previous studies, is a comprehensive individual assessment of all categories of business according to the size of the V4 region. The investigation is based on robust samples, and it looks at the issue of enterprise size categories and how profitability indicators changed before, during, and after the pandemic. The novelty also comes from the applied methodology.
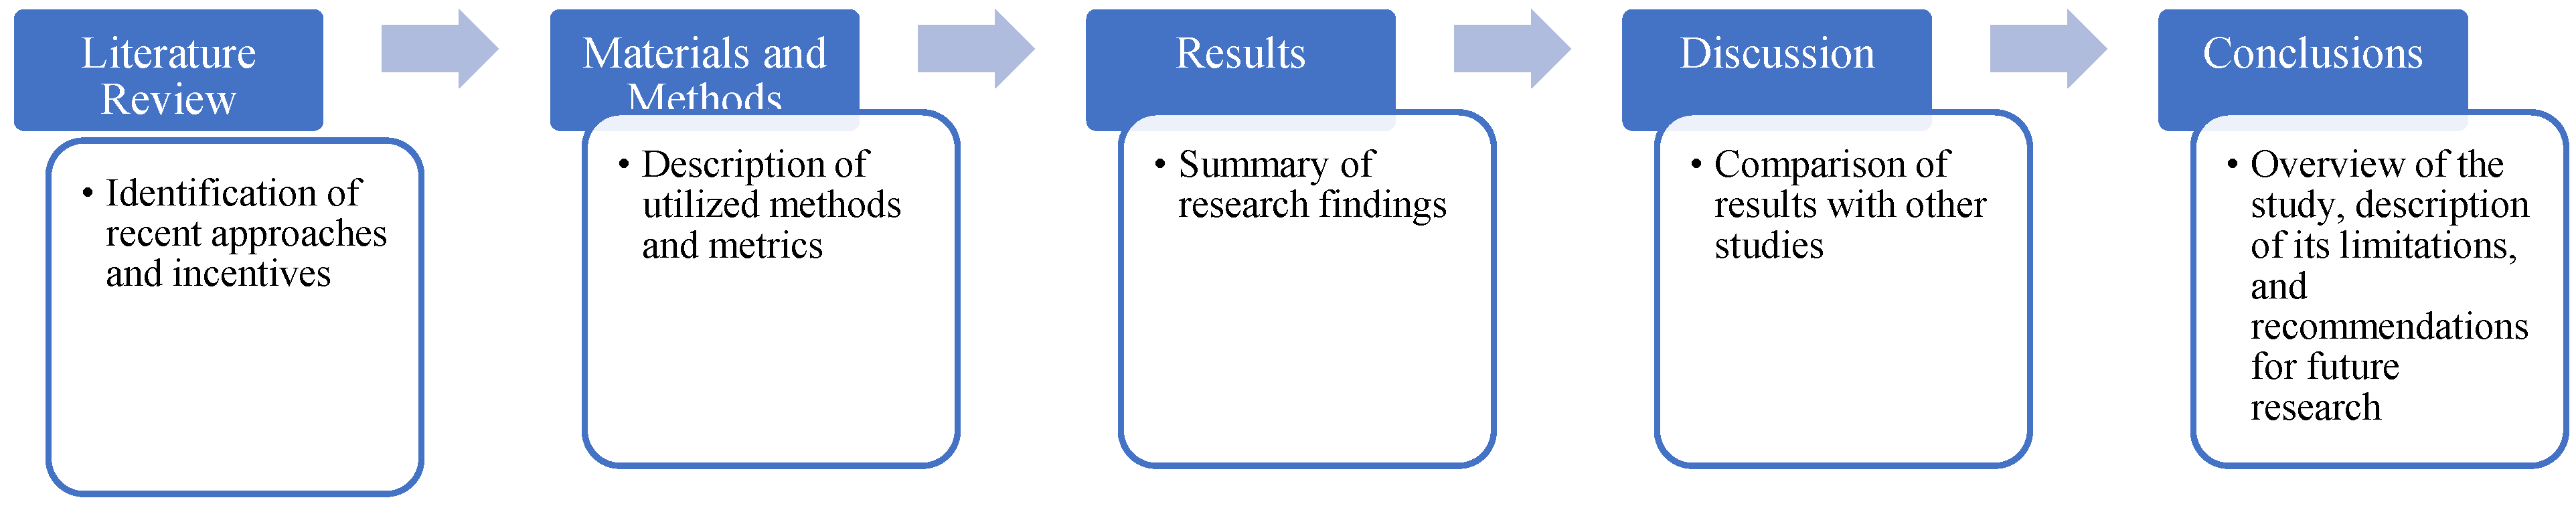
The article is divided into several sections as shown in Figure 1. First, recent approaches and incentives on the issue of profitability are identified in the literature review. Then, materials and methods are discussed, with a focus on the group of businesses that serve as the foundation for the development of a scientific article. The requirements that the companies had to meet to take part in the study are described, as well as the total number of companies that participated, with a clear breakdown of the companies by size category and by the state where their size category is most common, and the total number of participating companies. Indicators of profitability, which are the primary pillars of scientific output, are analyzed. To make the research clearer, the highest and lowest measured values of each business’s profitability are also included, as well as the values of mean, standard deviation, and median for each business size category. Companies are classified based on whether profitability indicators experienced a significant change in a positive direction, a significant change in a negative direction, or no significant change over the monitored period of 2019–2021 based on the one-sample Wilcoxon signed-rank test. Next, the issue of contingency tables is solved, which are used to figure out how variables depend on each other. The last thing is the correspondence analysis, which is used to make graphs of the results for each indicator of profitability and size category of businesses over time. In addition, the article contains a description of the results, which is supplemented by tables and a description of each table in order to create a clear picture of the outputs that were measured throughout the monitored period. In Section 5, the obtained results are compared with those obtained by other authors, and many observations and opinions are added. In Section 6, the conclusions drawn from the findings of the study are evaluated, the limitations of the study are listed, and suggestions for future research are given.

2. Literature Review

Profitability is not just a group of indicators that have been studied in many investigations. For example, ROA (Return on Assets) was discussed by Sohibien et al. (2022). ROE (Return on Equity) was analyzed by Habibniya et al. (2022), and Anton and Afloarei Nucu (2020). ROS (Return on Sales) was evaluated by Avi (2022). ROR (Return on Revenue) was assessed by Rupp et al. (2022). Finally, ROI (Return on Investment) was highlighted by Murphy et al. (2022). To figure out how profitable something is, different variables that make up the denominator of the formula can be used. One of these variables is wages. When a social contribution for employees is built into a business model, wages become more profitable (Cho et al. 2019). This contribution improves the performance of employees. A situation where employees have a high level of intellectual capital (Ovechkin et al. 2021) and are motivated by social contribution leads to the creation of business efficiency, as intellectual character can be transformed through the advancement of science and technology for the profit of the business, thereby increasing the profitability of the economic unit (Daneshgar and Zahedi 2022). Anton (2021) writes an interesting article about how to increase profits. He talks about how temperature affects profits and concludes that gas and heating companies make higher profits when the country’s temperature is higher. Interesting fact: The research was not conducted in places with high average annual temperatures. Instead, it was conducted in Belgium, Denmark, Finland, and 18 other places. On the other hand, the collective of authors, da Silva et al. (2022), focused on agricultural enterprises that demonstrated greater profitability when investing in irrigation systems in semi-arid regions, which increased production and were subsequently able to increase the total profits of agricultural enterprises through technological modernization. However, irrigation systems are not the only way to increase agricultural profitability. Lozowicka et al. (2022) state that incorporating chemistry into agriculture can also increase profitability, with the authors claiming that innovative solutions can produce previously unattainable profits within a few years. However, profitability is not solely dependent on the impact of introducing innovative business processes. China experienced a change in the profitability of businesses, specifically in the area of eliminating the carbon footprint of businesses (Wang et al. 2022; Zhu and Sun 2022). The COVID-19 pandemic revealed the biggest problems with businesses (Dinu and Bunea 2022) that depended on the purchasing power of the population always going up (Che-Ngoc et al. 2022). Banks also had to address this problem, which put pressure on the people (Caby et al. 2022) who wanted to profit despite the bad economy. European banks were discussed by Kozak and Wierzbowska (2022). Asian banks were analyzed by Nguyen and Le (2022) and Dsouza et al. (2022). Vietnamese banks were evaluated by Pham et al. (2022), and sub-Saharan African banks were assessed by Taylor et al. (2022). Multiple studies show that it is important to look at profitability since the COVID-19 pandemic had a big effect on the indicators of this financial and economic tool (Pervan et al. 2017). Some businesses were able to get back on their feet quickly after the pandemic and the ensuing financial crisis (Lim and Morris 2023). Some businesses, like those in sub-Saharan Africa, increased the number of services to protect themselves from the bad effects of the pandemic. This helped them stay profitable (Olarewaju and Msomi 2022). However, the crisis revealed the profitability indicators, such as ROA and ROE, that are most affected by the economic downturn (Zhao et al. 2022). Numerous mathematical and statistical techniques were used to draw this conclusion. Not only the aforementioned authors performed profitability indicator analyses, but in their analysis of Indian banks, Dsouza et al. (2022) employed additional methods, including panel regression, one-dimensional analysis, and descriptive statistics. In the US, however, Chue and Xu (2022) used the model of Hou, Xue, and Zhang, which solved aggregate profitability and investment in assets and showed high predictive power. Jihadi et al. (2021) looked at the relationship between the financial performance of the given indicators and social performance by using indicators of liquidity, activity, leverage, and profitability.

3. Materials and Methods

This scientific contribution looks at whether the growth of profitability indicators (ROA, ROE, and ROS) for businesses of different sizes changed significantly in 2019, 2020, and 2021, which are the years before, during, and after the pandemic.
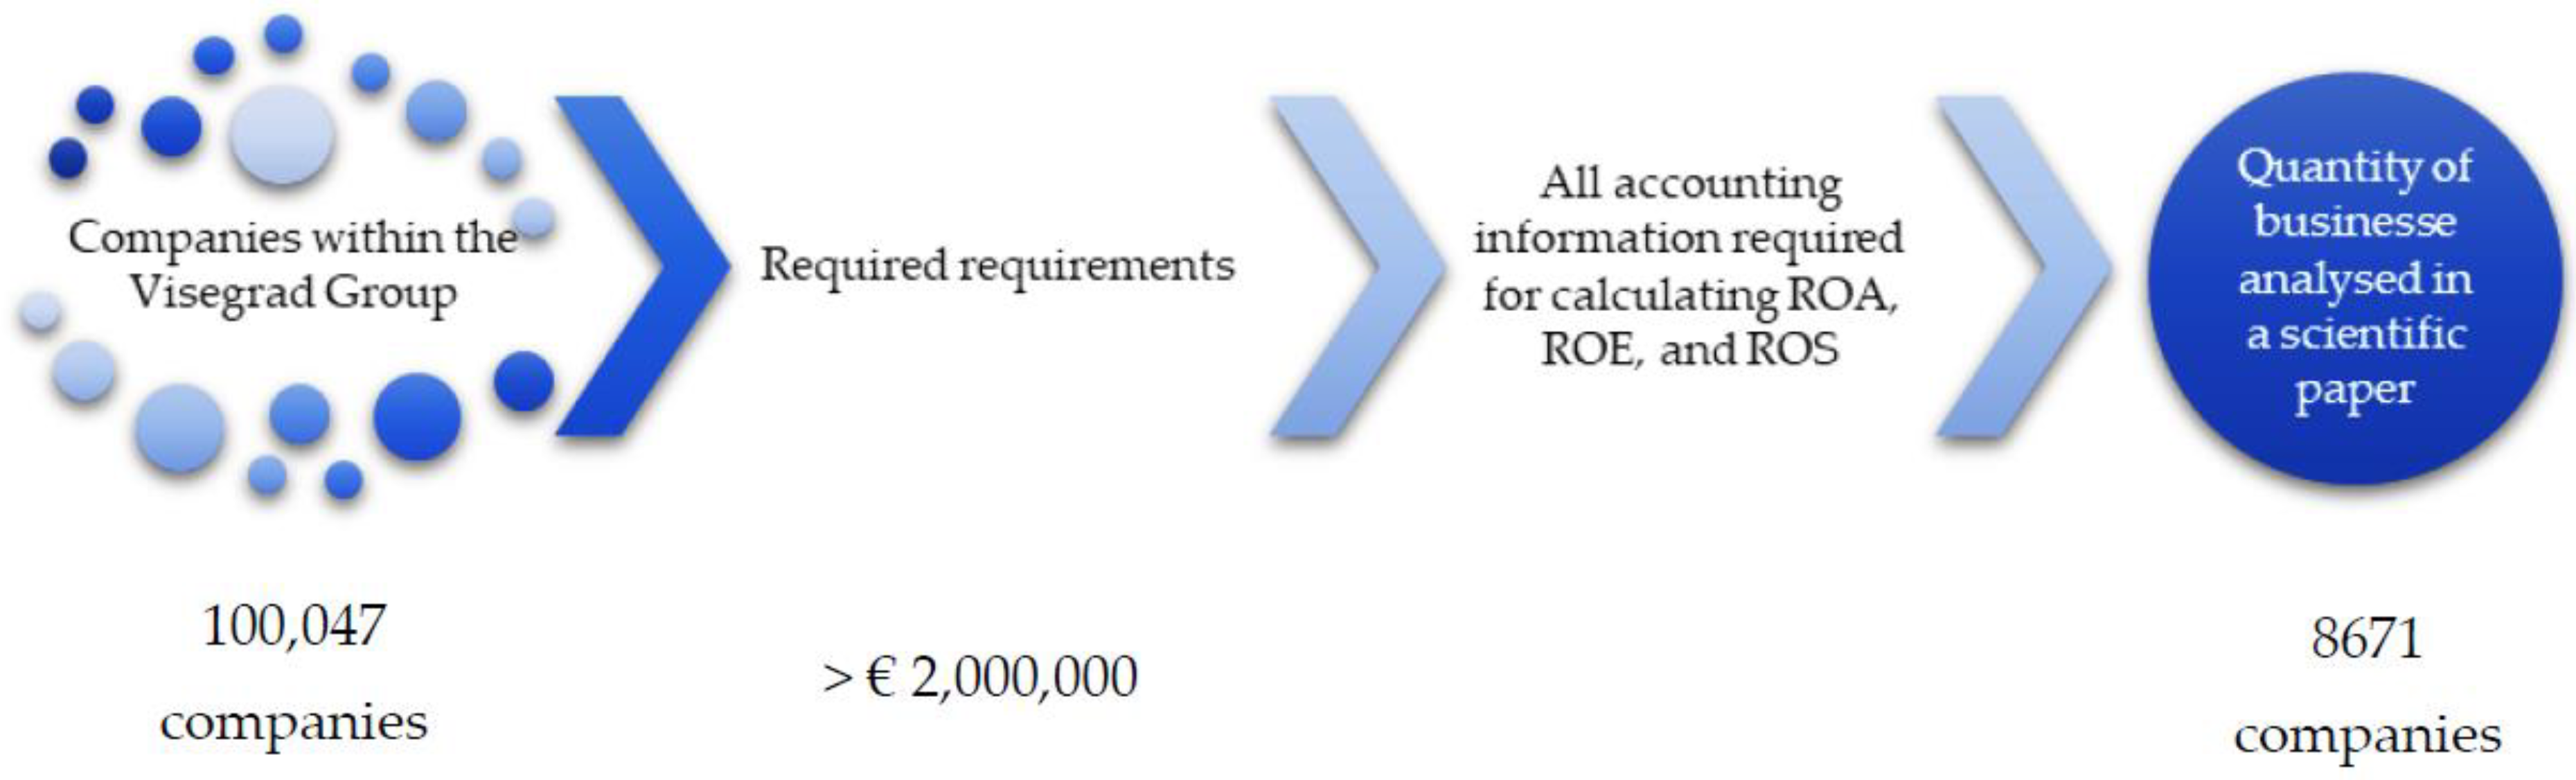
The article is mostly about how businesses work in the countries of the Visegrad Group. There are 100,477 businesses included in this group. The total number of businesses decreased to 8671 based on the criteria that a company must meet, i.e., a minimum amount of assets > €2,000,000 and all of the accounting data required to calculate ROA, ROE, and ROS, as shown in Figure 2.
Table 1 illustrates the categorization according to the ORBIS database. The enterprises must meet the criteria listed in the table in order to be classified as a medium, large, or very large enterprise. Otherwise, the enterprise was classified as a small enterprise.
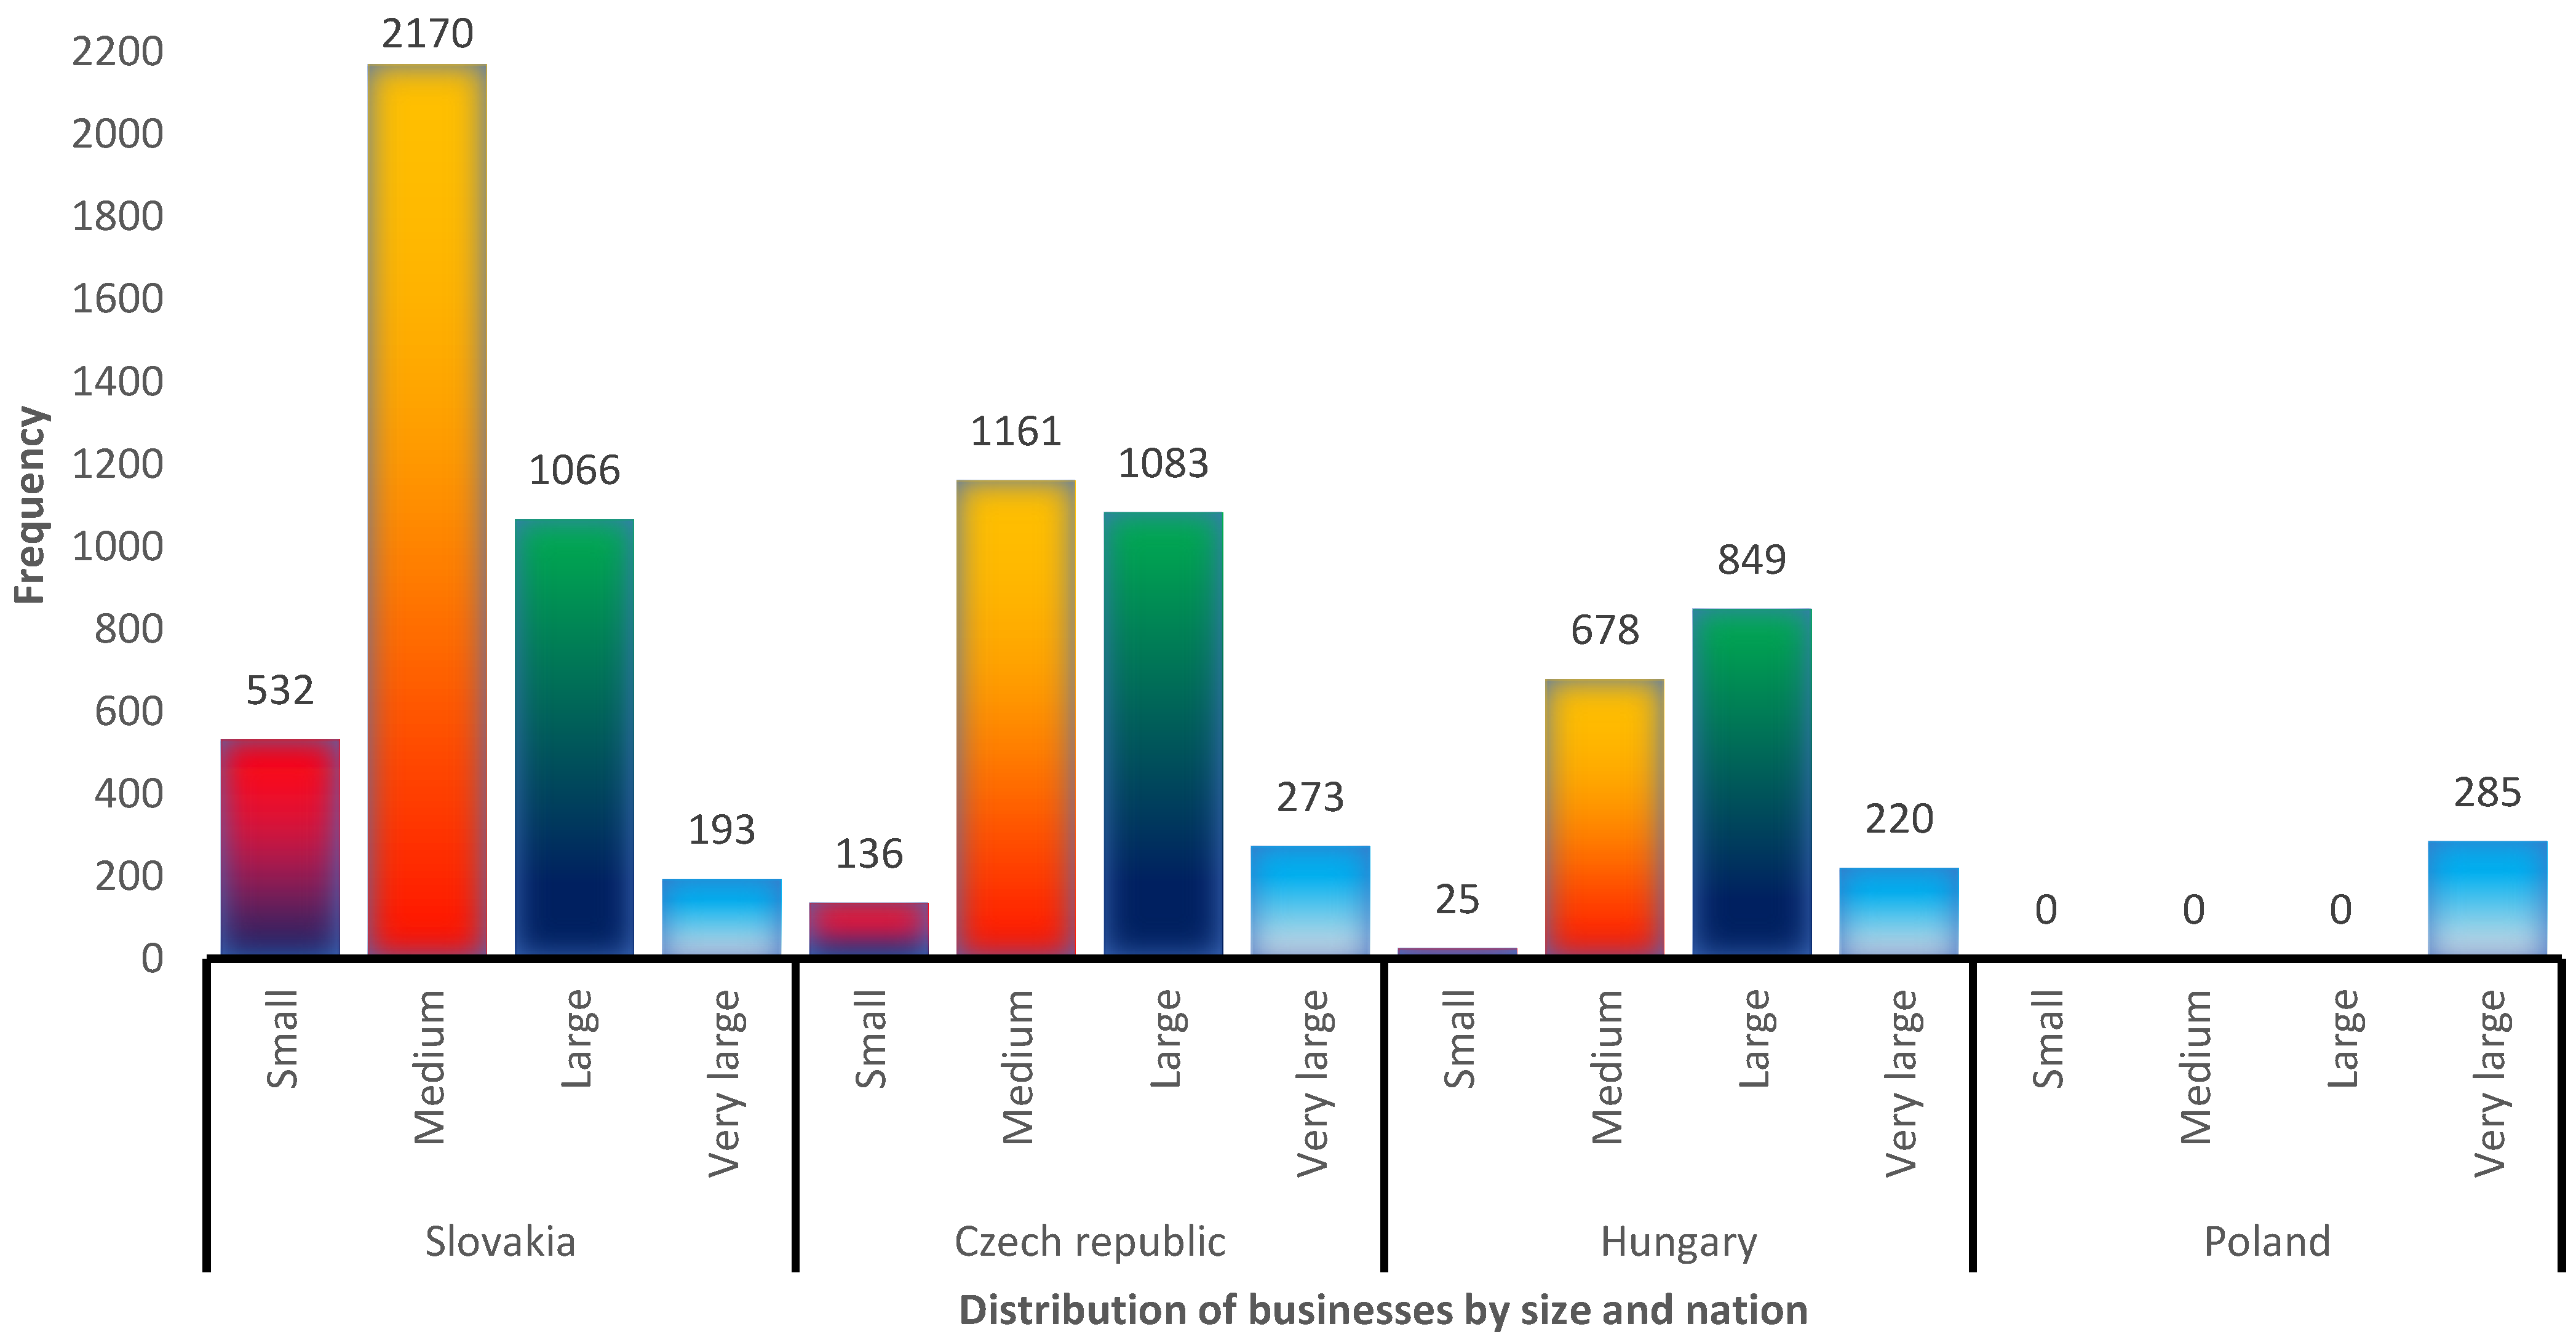
The representation of businesses in various nations is not uniform. Figure 3 depicts the number of businesses in each state as well as their classification by size category. As can be seen, the largest representation of companies comes from the Slovak Republic, which has 3961 companies, the majority of which are medium-sized businesses. In second place is the Czech Republic, with 2653 businesses, the majority of which are medium-sized enterprises, just as in the Slovak Republic. Another country represented is Hungary, with 1772 businesses. Compared with all other size categories, Hungary has the highest proportion of large companies. Poland, which has 285 companies represented in this scientific article, is the concluding member of the V4 group. All these companies qualify as extremely large businesses.
With the help of MS Excel and IBM Statistics 25, the information in tables and conclusions was presented in a clear way. MS Excel was also used to choose secondary data from the ORBIS database, which is owned by Bureau van Dijk, a 1991-founded subsidiary of Moody’s Investors Service, Yellow Maple Holding B.V., and has business information on all European countries.
Figure 4 indicates the profitability indicators that were calculated.
In mathematical terms, ROA (Equation (1)), ROE (Equation (2)), and ROS (Equation (3)) are calculated as follows:
R O A = E A T A s s e t s
R O E = E A T E q u i t y
R O S = E A T S a l e s
Earnings after tax, or EAT, is used in the calculations, as well as maximum, minimum, and the values of the median, mean, and standard deviation for 2019, 2020, and 2021 for the ROA, ROE, and ROS indicators for the different size categories of enterprises. The values of the entire Visegrad Group are in addition to these values (Table 2). The values of small businesses are presented in Table 2, the values of medium-sized businesses in Table 3, the values of large businesses in Table 4, and the values of extremely large businesses in Table 5.
The normality test was run to determine whether the enterprises are classified by average (if the population follows a normal distribution) or median values (if the population does not follow a normal distribution). The Kolmogorov–Smirnov test is recommended if each sample contains at least 50 observations. The following hypotheses were tested using 0.05 as the significance level.
H0. 
The population from which a sample of ROA, ROE, and ROS is taken in the observed years 2019, 2020, and 2021 follows a normal distribution.
H1. 
The population from which a sample of ROA, ROE, and ROS is taken in the observed years 2019, 2020, and 2021 does not follow a normal distribution.
The test was run for each subsample. If the computed  p -value (significance) was lower than the significance level alpha, the null hypothesis should be rejected, and the alternative hypothesis should be accepted based on 
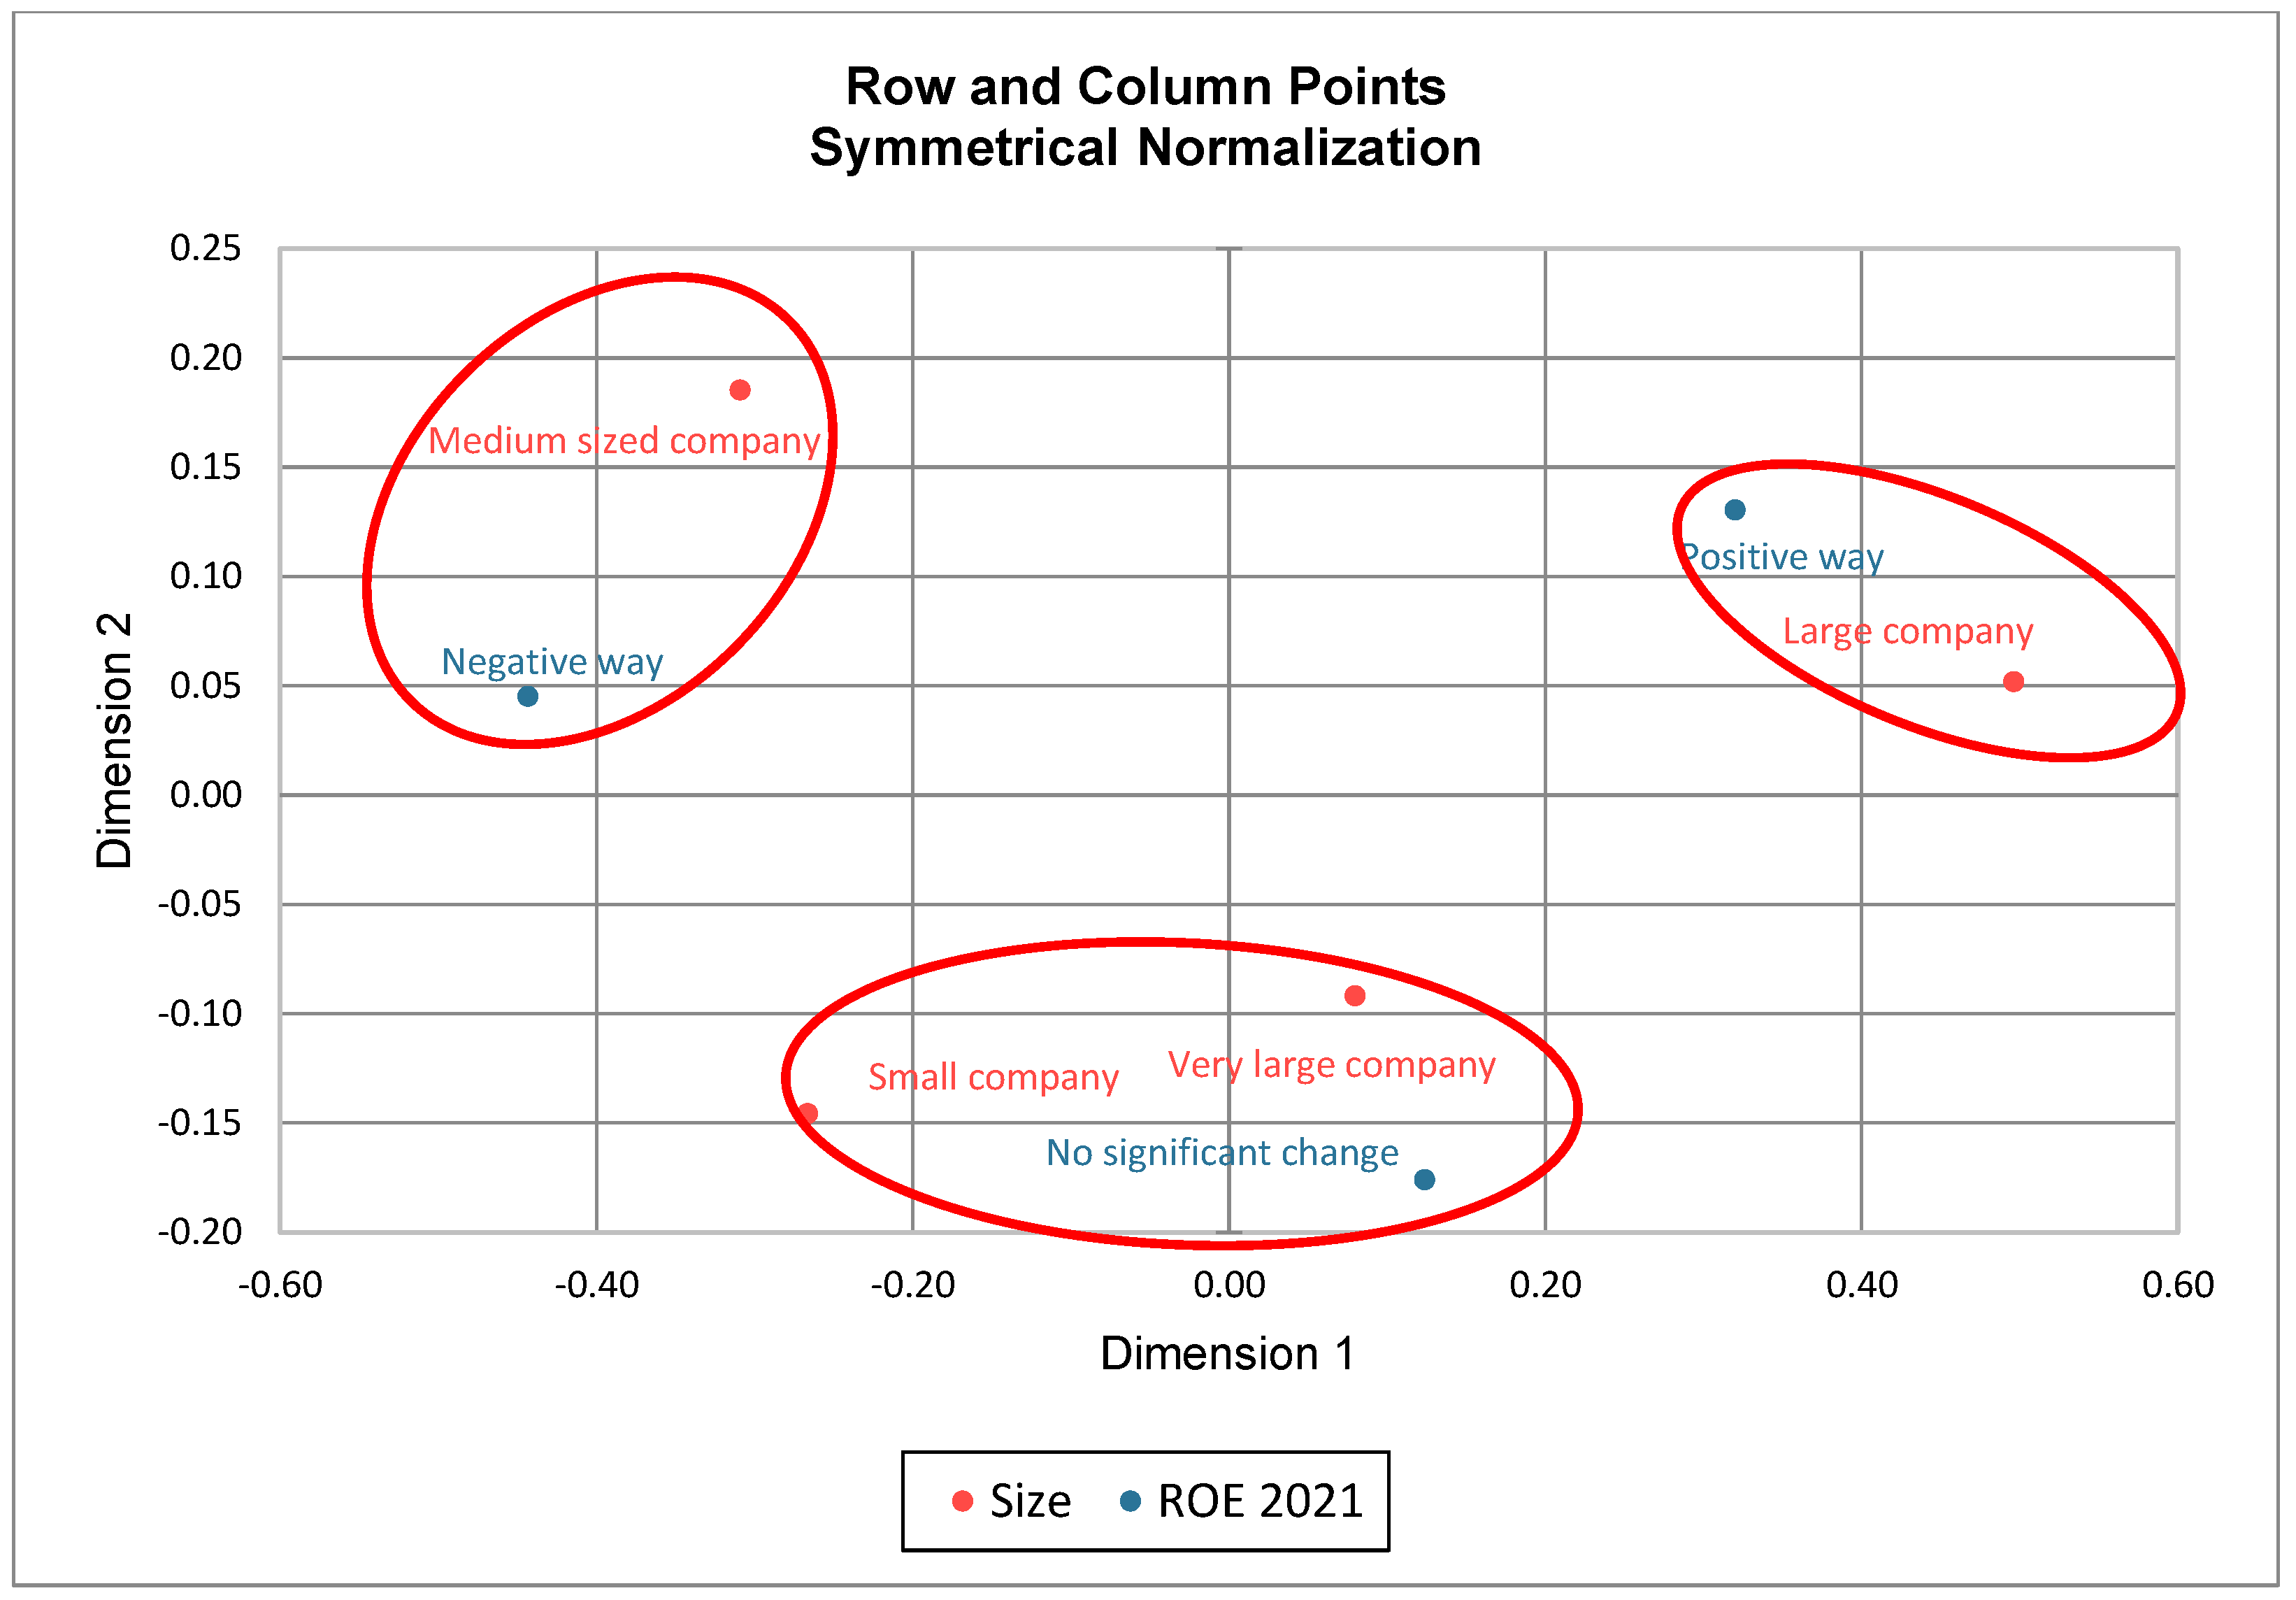
Table 6. The populations from which a sample of ROA, ROE, and ROS was taken in the observed years of 2019, 2020, and 2021 do not follow a normal distribution in all cases. Thus, the given size categories were able to reach the profitability indicator values with a positive change, a negative change, or no significant change based on the median values.
The one-sample Wilcoxon signed-rank test was run for each enterprise, each indicator, and each year according to the size of the business to see if the median values  ( m )  of ROA, ROE, and ROS were different from zero. The tested median value was chosen based on specific values from Table 2, Table 3, Table 4 and Table 5. If the median value of ROA, ROE, and ROS was not different from zero, there was no significant change. On the contrary, if the median value was different from zero, its positive value showed a positive change in profitability, and the negative value showed a positive one in ROA, ROE, and ROS (Figure 5). This approach was derived based on Valaskova and Gajdosikova (2022). They used the parametric  t -test, but we preferred the nonparametric version of t  t -test because there was no following normal distribution of analyzed populations of ROA, ROE, and ROS.
Thus, the following hypotheses were tested using 0.05 as the significance level.
H0. 
In the observed years 2019, 2020, and 2021, the median values of the indicators ROA, ROE, and ROS was not different from zero.
H1. 
In the monitored years of 2019, 2020, and 2021, the values of the indicators ROA, ROE, and ROS was different from zero.
The enterprises were divided into three groups based on a comparison of the specific p-value and significance level alpha:
  • Businesses that changed significantly for the worse;
  • Businesses that did not significantly change;
  • Businesses that changed significantly for the better.
The fundamental idea underlying the Pearson chi-square test is to compare the observed data values with the expected values if the prerequisites are met. The assumption of 80% of expected observations must be equal to/higher than value 5, and the second assumption of all cells of expected counts must be higher than value 1 (Valaskova et al. 2018).
The following hypotheses were tested using 0.05 as the significance level.
H0. 
In the observed years 2019, 2020, and 2021, the values of the indicators ROA, ROE, and ROS did not change.
H1. 
In the monitored years of 2019, 2020, and 2021, the values of the indicators ROA, ROE, and ROS changed.
After testing hypotheses for 2019, 2020, and 2021, the strength between two nominal variables was measured. Cramer’s V and contingency coefficient C were used if the dependence was confirmed.
V = χ 2 n · min r 1 ; s 1
where  χ 2  is test statistic from Pearson  χ 2  test,  n  is the number of total observations,  r  is the number of rows,  s  is the number of columns.
C = χ 2 n + χ 2
Olah et al. (2021), and Musova et al. (2021) determine indicative limits for the strength of the dependence determined by Cramer’s V and contingency coefficient according to these limits:
  • 0.0 < the rate of the coefficients ≤ 0.3 weak dependence;
  • 0.3 < the rate of the coefficients ≤ 0.8 medium dependence;
  • 0.8 < the rate of the coefficients ≤ 1.0 strong dependence.
It is also necessary to test the significance of the identified coefficients of contingency (Olah et al. 2021). The hypotheses for this test are as follows:
H0. 
Cramer’s V (Contingency coefficient) is not statistically significant.
H1. 
Cramer’s V (Contingency coefficient) is statistically significant.
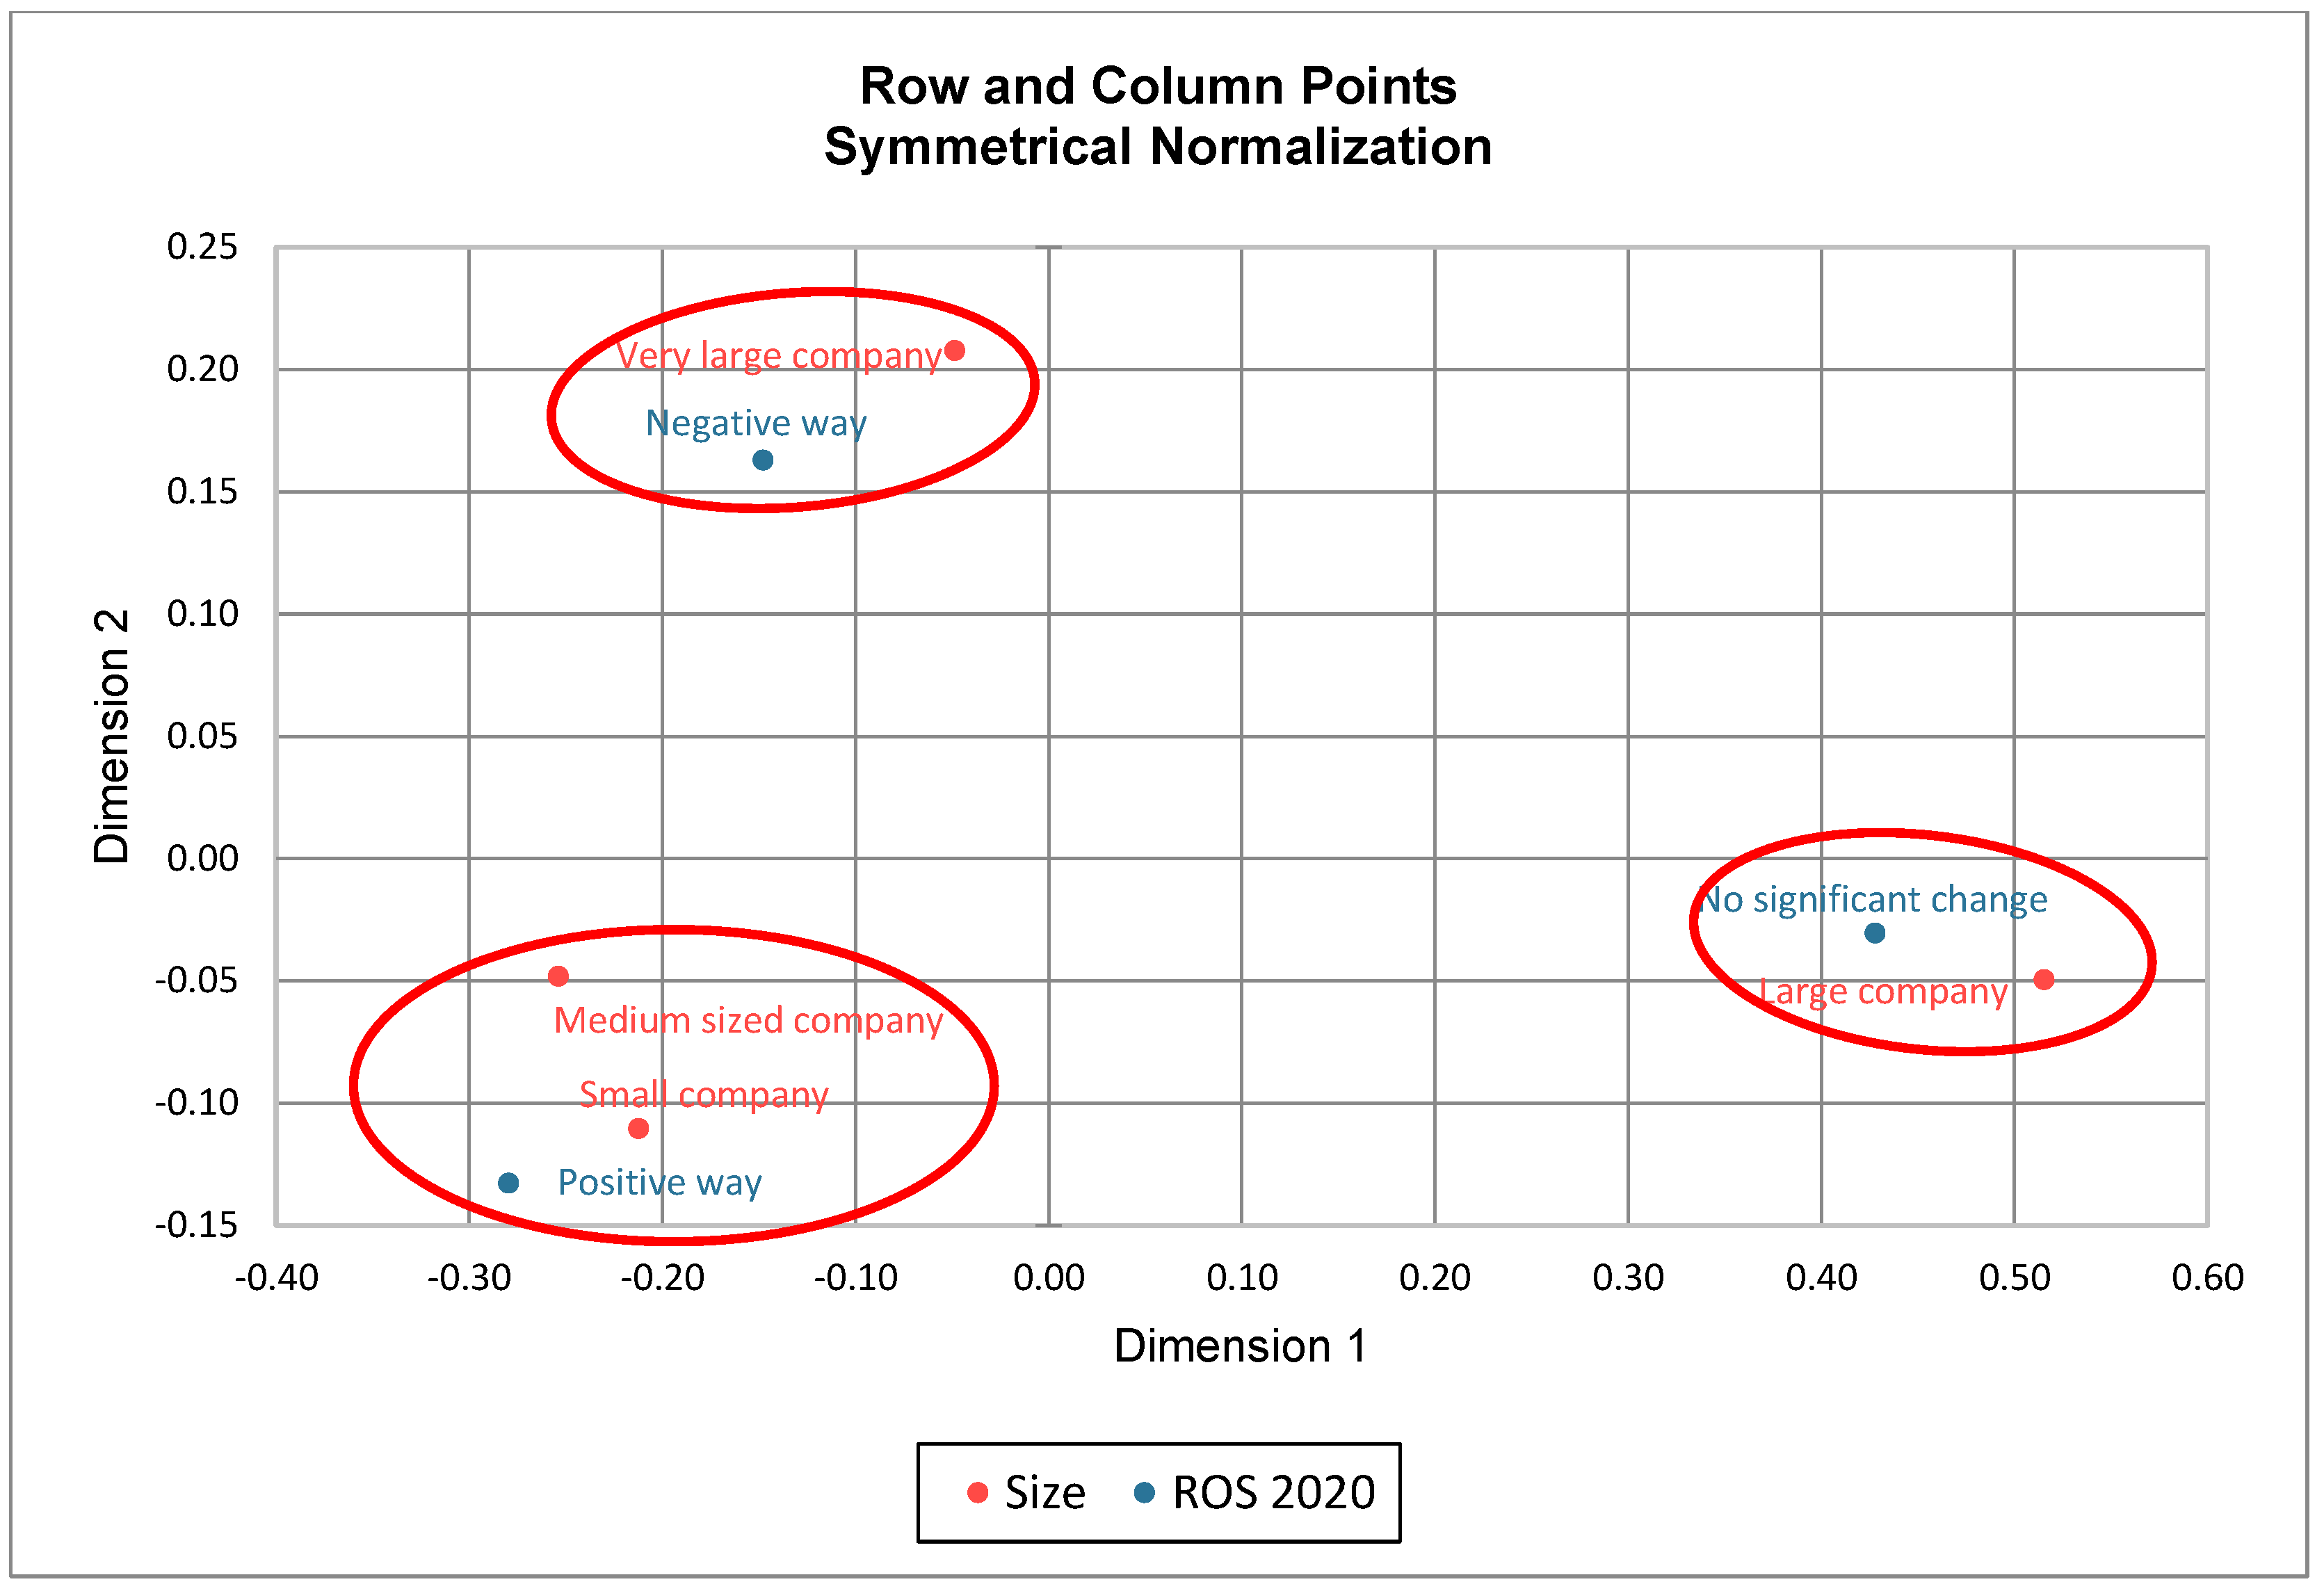
Based on the outcomes of the chi-square test (Shen et al. 2022), the size criteria of enterprises and changes in profitability indicators were further analyzed by means of correspondence analysis. The correspondence analysis is a common data visualization technique; see Liu et al. (2022), Ragazou et al. (2022), and Gajdosikova et al. (2022). We distinguish between simple and multiple correspondence analyses. In both instances, the results are displayed using points on a map. The relative frequencies in the contingency table are denoted by dots (Verma 2012). The position of the points indicates the similarity between the row and column categories, as well as their interdependence. Using this method, we have attempted to display the points by reducing the space dimensions so that hidden relationships and associations between the analyzed variables stand out; see Kral et al. (2009). The following is the procedure for calculating the correspondence method and marking with symbols:
  • The matrix of row profiles is denoted by the symbol R (Equation (4)), while the matrix of column profiles is denoted by the symbol C (Equation (5)).
  • r-term vector of row loads as r and s-term vector of column loads as c.
Their relationship is then expressed as follows:
R = D r 1 P = r 1 T r 2 T . . . r r T
C = D T 1 P T = c 1 c 2 . . . c s
where  D r 1  is a diagonal matrix containing vector r elements and  D c 1  is a diagonal matrix containing vector c elements. Then, the correspondence matrix can be expressed as follows (Equation (6)):
P r c T 1 = p 11 p 12 p 1 s p 1 p 21 p 22 p 2 s p 2 p r 1 p r 2 p r s r r c 1 c 2 c s 1
While the following relations hold true for the vector of row loads r (Equation (7)) and the vector of column loads c (Equation (8)):
r = j = 1 s p j + c j
c = i = 1 r p i + r i
Before beginning the actual procedure of the correspondence analysis, it is necessary to assess the suitability of the input variables. Thus, for the variables under consideration, we will evaluate their mutual relationship or association. The chi-square test for testing independence is utilized (Durana et al. 2019). If a statistically significant association is confirmed, the data are appropriate for the method’s application.
The degree of dissimilarity between the variable categories in the rows and columns is then assessed. The definition of the chi-squared distance calculation is as follows (Equation (9)):
D i , i , = j = 1 s ( r i j r i , j ) 2 c j
where rij and ri’j are elements of the matrix of row profiles R, and cj is the vector of column loads. Simultaneously, the vector of column loads equals the average column profile, also known as the centroid (center of gravity) of column profiles (Khomytska et al. 2020). Similarly, the degree of dissimilarity, or the distance between column categories j and j′, can be calculated.  R i  which represents the elements of the row load vector r, is used as a weight.
According to Gimferrer et al. (2020), the Euclidean distance between plane points is comparable to X2, the distance between points in three-dimensional space. It is required to find a projection that preserves, as much as possible, the relationship between the original points of the multidimensional space. We use the matrix of standardized residuals Z to look for the projection. Each element in the i-th row and j-th column is defined by the members of the correspondence matrix and their respective marginal sums (Equation (10)):
z i j = p i j p i + · p + j p i + · p + j
To compute the eigenvalues, we use singular value decomposition. We begin by calculating the Z matrix of standard residuals. When showing the graph, we do not search for coordinates in the original row and column profiles. Based on the standard residuals, which show the divergence of the row and column categories from independence, we take the following action. This matrix’s entries gain values in accordance with the relationship Equation (10). The correspondence matrix is denoted by the letter p.
The marginal row frequencies  p i +  (Equation (11)) are referred to as row loadings. Column marginal frequencies  p + j  (Equation (12)) are called column loads. The relationships are applicable to both row and column loads:
p i + = n i + n
p i + = n + j n
Linear marginal absolute frequencies  n i +  (Equation (13)) of character occurrence X and column marginal absolute abundances of character Y  n + j  (Equation (14)), which are in Equations (11) and (12), are computed based on the following relationships:
n i + = j s n i j
n + j = i r n i j

4. Results

This section discusses the results of this study. Calculations are performed for the years 2019 (the so-called starting year), 2020 (the so-called pandemic year), and 2021 (the so-called post-COVID year). During this period, the focus was on how certain indicators of profitability changed across different sizes of businesses in response to actions taken by the governments of the V4 countries, as well as how these actions affected certain indicators.

4.1. ROA Indicators

The first indicator analyzed is the asset profitability indicator. This indicator describes how the transformation process can convert the company’s assets into profit. The greater the value of this indicator, the more effectively the company converts assets into EAT (the profit input that was used throughout the scientific paper).

4.1.1. ROA 2019

Prior to employing the correspondence analysis, the established hypothesis H0 must be confirmed. The hypothesis is confirmed using crosstabs and Pearson’s chi-square. Based on the results of Table 7, when Pearson’s chi-square equals 0.000, it can be confirmed that at a significance level of 0.05, the null hypothesis H0 is rejected and the alternative hypothesis H1 is accepted.
Table 7 allows us to look at the strength of the relationships between the variables, the change in the profitability indicator value, and the size category of the company (Table 8). The results indicate that the dependence is 0.074, meaning that it is weak. With so many businesses, such an outcome is to be anticipated. Importantly, the p-value is less than the significance level of 0.05, indicating that all requirements for conducting the correspondence analysis have been met.
For 2019, a correlation analysis was performed with a change in the chosen indicator of profitability and the criterion of company size. Transformation of indicators from a three-dimensional space and four-dimensional space (because there were three and four options for the evaluated indicators) into a two-dimensional space with a 100% success rate mean that no value was left out and all values were transformed into a two-dimensional space. The correspondence analysis results for the ROA indicator in 2019 indicate the following:
  • A significantly positive change in the ROA indicator for 2019 occurred in large enterprises;
  • A significantly negative change in the ROA indicator for 2019 occurred in companies that are classified as medium-sized companies and very large companies;
  • No change occurred in small companies, or the ROA indicator did not show a significant change in either direction for 2019.
Figure 6 illustrates these results.

4.1.2. ROA 2020

Regarding the ROA indicator in 2020, the same procedure was followed. First, using crosstabs, it was determined whether, at a significance level of 0.05, the null hypothesis H0 is not rejected or whether H0 is rejected and the alternative hypothesis H1 is accepted. In this instance as well, the H0 hypothesis was rejected and the H1 hypothesis was accepted, as the > p-value, which is the result of the Pearson chi-square test, indicates (Table 9).
Table 10 illustrates the relationship between the variables. The values show that the level of dependence between the variables is 0.071, indicating that it is, once again, a weak dependence. The significant output, however, is the p-value, for which > p-value holds true at a significance level of 0.05. This fulfilled condition enables the creation of variable correspondence analysis.
The result of the correspondence analysis is a correspondence map that exemplifies the results obtained with this instrument. Figure 7 displays the following results:
  • A significant change in the positive direction for the ROA indicator in 2020 occurred in the category of large companies;
  • A significant change in the negative direction for the ROA indicator in 2020 occurred in the categories of medium-sized and very-large companies;
  • No significant change for the ROA indicator in 2020 occurred in the category of small companies.

4.1.3. ROA 2021

Crosstabs are used again in Table 11. The result is, once again, favorable, as the Pearson chi-square result is 0.000, indicating that the null hypothesis H0 is rejected and the alternative hypothesis H1 is accepted as the resulting p-value is less than the predetermined value of 0.05. The prerequisite for employing correspondence analysis has been satisfied.
The second step is determining the relationship between the variables under investigation. Based on the result of the contingency coefficient (Table 12), it is possible to conclude that the dependence between the variables is 0.089, indicating that it is a weak dependence. The p-value is at the level of 0.000, which is less than the significance level of 0.05 (p-value).
It was possible to proceed with the correspondence analysis after both conditions were met. The variables were completely transformed from a three-dimensional or four-dimensional space to a two-dimensional space, so no captured or calculated data were lost, resulting in a complete correspondence map with all the data (Figure 8).
The resulting correspondence map reveals the following findings:
  • Companies in the large company size category experienced a significant positive change in the ROA indicator for 2021;
  • Companies in the very large company size category experienced a significant negative change in the ROA indicator for 2021;
  • Companies in the small and medium-sized company size categories experienced no significant change in the ROA indicator for 2021.

4.2. ROE Indicators

The second selected indicator of profitability was the return on equity indicator. This indicator measures the ability to convert equity into after-tax earnings (EAT). The greater the result of this indicator, the more effectively the company is utilizing its own capital.

4.2.1. ROE 2019

At present, the starting year was 2019. The H0 and H1 hypotheses were applied to this situation. The procedure for determining whether there is a relationship between the given variables was based on crosstabs, with Pearson chi-square employed (Table 13). Since the p-value is greater than 0.00, it can be concluded that the null hypothesis H0 is rejected and the alternative hypothesis H1 is accepted.
The comparison between the p-value and the significance level allows the analysis to continue. In order to conduct a correspondence analysis, the contingency coefficient is compared with a significance level of 0.05 (Table 14). The contingency coefficient reached a value of 0.000, indicating that the p-value is less than 0.05, thereby satisfying the requirements for conducting a correspondence analysis. It can also be observed that the level of dependence between the given variables is weak, as indicated by the obtained value of 0.082.
A correlation analysis was performed on the variables enterprise size criterion and change in the selected profitability indicators for 2019. Each variable possessed at least three possibilities that could be represented in a three-dimensional space. Since two-dimensional space yields clearer results, these multidimensional variables have been transformed into a two-dimensional space. On the basis of the SPSS outputs, 100% of the variables were transformed into a two-dimensional space, meaning that all acquired values were plotted in the correspondence map without any data loss. Figure 9 represents the resulting illustration.
The SPSS results in Figure 9 show the following:
  • A significant positive change in the ROE profitability indicator for 2019 occurred within the category of large companies;
  • The small and medium-sized company categories saw a big change in the direction of the ROE profitability indicator for 2019;
  • In terms of company size, companies categorized as “very large” did not see a big change in the ROE profitability indicator for 2019.

4.2.2. ROE 2020

The COVID-19 pandemic was a significant problem in 2020. That year, businesses’ intentions, plans, and strategies began to experience a significant slowdown caused by new measures. The rapid adoption of measures to prevent the spread of the disease resulted in the imposition of a number of restrictions. An examination of hypotheses H0 and H1 was conducted on the basis of these facts. Crosstabs were used to determine which hypothesis would be pursued. Table 15 demonstrates that the Pearson chi-square test yielded a p-value of 0.000, indicating that H0 is rejected and H1 is accepted (p-value) when compared with the significance level of 0.05.
Since hypothesis H1 has been accepted, it is possible to determine the relationship between the variables under investigation. Utilizing the contingency coefficient, which yielded a value of 0.077, it was determined that there is a weak relationship between the investigated variables (Table 16). The p-value of the given coefficient is a significant finding as well. It is at the level of 0.000, which indicates that it is less than the significance level of 0.05; thus, another condition must be met before the correspondence analysis can be used to clearly plot the variables.
The results obtained to date have made a correspondence analysis applicable. The variables tested thus far, i.e., company size categories, and the change that occurred in 2020 for the selected profitability indicator, i.e., ROE, were chosen. These variables underwent three iterations of change. There were four variations of company size categories: small, medium, large, and very large. Based on the significance distribution, the acquired change of the profitability indicator ROE acquired three changes: a significant change in a positive direction, a significant change in a negative direction, and no significant change. In the case of the correspondence analysis, these changes were converted from a three-dimensional and four-dimensional space to a two-dimensional space, which is considerably more readable. Once more, 100% of variable transformations were obtained from SPSS outputs. Figure 10 depicts the resulting architecture.
The following conclusions are drawn from the obtained results and plotted coordinates:
  • Based on the results of the ROE indicator in 2020, enterprises that have achieved a significant change in a positive direction are included in the large company size category;
  • Based on the results of the ROE indicator in 2020, companies that have experienced a significant change in a negative direction fall into the small and medium-sized company categories;
  • Based on the results of the ROE indicator in 2020, enterprises that have not undergone significant changes are included in the category of very large corporations.

4.2.3. ROE 2021

The year 2021 is also known as the “post-COVID” period, during which the measures against the spread of the virus were loosened, and the business climate started to return to its pre-pandemic state. Due to changes in the ROE indicator values, a slight shift in the distribution of businesses and their classification was anticipated for the year. First, it is necessary to determine if a correspondence analysis based on the fulfillment of two conditions is feasible. The first step is to accept H1 as an alternative hypothesis if the Pearson chi-square p-value is less than 0.05. The p-value is less than the significance level, so the null hypothesis H0 is rejected and the alternative hypothesis H1 is accepted based on the data presented in Table 17. Thus, the first condition is satisfied.
A further requirement is to determine whether there is a dependence between the given variables and whether the p-value of the chosen confidential indicator, the contingency coefficient, is less than the significance level of 0.05. Table 18 reveals that there is a dependence between the variables, with a value of 0.108, indicating that it is a weak dependence. The p-value of the tested group is 0.000, which is less than the significance level of 0.05; therefore, the second condition is also met and the correspondence analysis can be conducted.
The correspondence analysis yields two maps that transform the multidimensional display into a two-dimensional representation. These two maps are then transformed into one that illustrates the respective relationships between the investigated variables and determines which business size categories fall under the relevant change within the ROE profitability indicator. The following groups were formed in 2021, as depicted in Figure 11:
  • Companies in the size category that experienced a significant change in the positive direction for the ROE indicator in 2021 are referred to as “large companies”;
  • Companies that experienced a significant change in the negative direction for the ROE indicator in 2021 are classified as medium-sized businesses;
  • Companies that did not experience a change in the ROE indicator in 2021 are classified as small companies or very large companies within the company size category.

4.3. ROS Indicators

The final indicator examined is the indicator of sales profitability, which characterizes the company based on its ability to optimally convert gain into EAT. The greater the values an organization attains, the better it is for the organization.

4.3.1. ROS 2019

The base year for the ROS indicator is 2019, which determined the distribution of enterprise size categories based on the magnitude of the change in the ROS indicator achieved values. Certain criteria must be met for the implementation of the correspondence analysis in order for the base-year results to be plotted. First, the hypothesis (H0 or H1) that is not rejected, rejected, or accepted is tested. The null hypothesis H0 is rejected because the p-value is less than the significance level of 0.05, and the alternative hypothesis H1 is accepted, as shown in Table 19.
Since the obtained results satisfy the first condition for conducting a correspondence analysis, the second condition is applied. On the basis of the contingency coefficient, it is determined that there is a weak dependence between the variables under investigation, specifically at the level of 0.096. This dependence is accompanied by a p-value that is again less than the significance level of 0.05, thereby satisfying the second prerequisite for performing the correspondence analysis. Table 20 shows the results obtained.
The previously obtained results enable the correspondence analysis in SPSS. Again, it was possible to transform all the possibilities of individual types of analyzed variables into a two-dimensional space, allowing for the complete plotting of all variables on the resulting map. The following conclusions can be drawn from the data presented in Figure 12:
  • Small and medium-sized companies can include companies whose ROS indicator changed significantly in a positive direction in 2019;
  • Very large companies tend to have a significant change in a negative direction for the ROS indicator in 2019;
  • Large businesses are made up of companies that did not see a big change in their ROS indicator in 2019.

4.3.2. ROS 2020

The profitability of sales suffered the most in 2020, as closed businesses automatically ceased producing both sales- and profit-generating goods. There were significant losses. Therefore, the results of this indicator analysis for the year 2020 may be intriguing. The alternative hypothesis H1 is accepted based on the significance level of 0.05, which is greater than the p-value obtained from the chi-square test, which is 0.000, as shown in Table 21.
Table 22 captures the dependence between the studied variables at a level of 0.102, indicating that the dependence between the variables is weak. The p-value, which has reached 0.000, is an important parameter for building the correspondence analysis. This means that the significance level is high enough to move forward with building the correspondence map through the correspondence analysis.
Figure 13 displays the results of a transformation of the three-dimensional and four-dimensional representations of the observed categories to a two-dimensional representation. Thus, Figure 12 depicts all variables whose coordinate values were determined using the SPSS program. Based on the achieved change, the size categories have been divided into the following groups:
  • Companies that made a big change in the positive direction on the ROS indicator for 2020 are small or medium-sized;
  • Companies that achieved a significant change in the negative direction within the ROS indicator for 2020 are in the category of very large companies;
  • Companies in the large company category did not experience significant changes in the ROS indicator for 2020.

4.3.3. ROS 2021

As the final indicator, the ROS indicator for 2021, or the so-called post-COVID period, was analyzed. On the basis of the p-value from Pearson’s chi-square test, the null hypothesis H0 can be rejected, and the alternative hypothesis H1 can be accepted since the level of significance of 0.05 is greater than the aforementioned p-value, which reached the value of 0.000, as shown in Table 23.
On the basis of the outcome of Pearson’s chi-square test and the acceptance of the alternative hypothesis H1, the investigation of the dependencies between the investigated variables is continued. In accordance with Table 24, the p-value is less than the significance level of 0.05; thus, another of the prerequisite conditions for the development of correspondence maps using correspondence analysis has been satisfied. There is a dependence among the variables with a strength of 0.090, indicating that it is a weak dependence.
Three-dimensional and four-dimensional representations of the monitored categories were converted to a two-dimensional representation in Figure 14. Consequently, the following graph depicts all variables. Based on the achieved change, the size categories have been divided into the following groups:
  • Medium-sized businesses are made up of companies that made a big improvement in the ROS indicator for 2021;
  • Small and very large companies have a significant change in a negative direction for the ROS indicator for 2021;
  • Large companies are those whose ROS indicators for 2021 did not change much.
For clarity of the overall results of this scientific output, Table 25 captures the overall classification of the size categories of enterprises according to the corresponding change in the selected profitability indicators for the monitored period of 2019–2021.

5. Discussion

This section of the paper discusses the importance of talking about profitability indicators. The results of this scientific study are compared with those of other authors who have written about the same or a similar topic, either in terms of indicators of profitability or of the chosen period of 2019–2021, which looks at how the pandemic will affect the business environment.
Based on the change from the median value of the V4 countries in the selected indicators of profitability, such as return on assets (ROA), return on equity (ROE), and return on sales (ROS), this scientific result showed that the size criterion divided companies into groups based on the subjective opinion of the authors (ROS). The median values were split into three groups based on how the enterprise’s profitability changed. Based on this scientific article, a classification of business sizes has been created that can help other scientists with their research. The problem was solved using correspondence analysis. Correspondence maps were used to show how each finding fit together, and the resulting table was used to round out the picture. The analysis of correspondence under the V4 conditions is a common technique. It is also supported by the scientific findings of Kovacova et al. (2019), in which the aforementioned analysis was used to examine ROA and ROE in the Visegrad Group countries for the examination of bankruptcies with largely implied profitability indicators in their formulas. When evaluating the results, Ruckova (2015) came to the intriguing conclusion that companies with increasing profitability values have a greater ability to obtain loans and support from commercial banks throughout the entire V4 group. However, if there is a global crisis, the ability to get more credit and help from banks drops quickly. Kocisova (2014) explains in her article that businesses in V4 countries lose money quickly when there is an economic crisis. The 2009 economic crisis and all other global crises illustrate this. This fact can complement the findings of Vavrina and Lacina (2018), who found significant differences in the results of the profitability of companies during financial crises in V4 countries. Focusing on SMEs in the V4 grouping and using the correspondence analysis, they found major problems caused by the crisis in terms of the size of the company and the state in which it operates. Every company seeks to increase its profitability in order to increase its market value; however, increased profitability does not necessarily create a more favorable business environment. Rather, it has a greater impact on shareholders, who are more concerned with profit (Gyulai and Szucs 2017). However, how the company’s overall profitability develops also depends on the company management, which, by misdirecting the company, can cause the negative effects of decisions to reflect on the company’s overall profitability as well as on client satisfaction, as was the case in the research of Bacik et al. (2019), who investigated ROA and ROE in the conditions of the V4 countries using various economic statistical methods. Other studies by authors who look at profitability both from the point of view of economic return on investment and from the point of view of putting profitability indicators into different models show that the topic of profitability is of general interest in the V4 region as a whole. These authors also include Sagan et al. (2022), Ugurlu (2022), and Michalkova et al. (2022).

6. Conclusions

In this paper, the authors address the global COVID-19 pandemic and how it affected the size of companies based on how the values of certain profitability indicators, such as ROA, ROE, and ROS, changed. Figure 15 below provides an overview of this chapter.
Using the MS Excel calculation software, secondary data from the ORBIS business-economic information database, which is managed by Bureau van Dijk and has more than 400 million financial statements from businesses in the European ecosystem, were used to figure out profitability indicators. From the obtained values, median values were calculated for individual indicators as well as for the entire V4 group, which served as the study’s central pillar. After dividing the values into significant positive and negative changes, putting the companies into size categories, and making hypotheses, the given hypotheses were tested, and the relationships between the given variables were found. After obtaining partial results, which determined the future direction of the research, a correspondence analysis was conducted, followed by a comparison of the results of this correspondence analysis, i.e., the drawing of groups on correspondence maps. Thus, the overall work showed the classification of size categories of enterprises in the evaluation of the number of selected profitability indicators for the monitored period of 2019 to 2021, where 2019 was the base year that showed the basic distribution of enterprises, 2020 was expected to be the year with the biggest change from the initial distribution, and 2021 was expected to be reclassified according to the basic grouping from 2019. The research results, however, revealed a different classification. Fiscal authorities may monitor the level and risk across a region of countries and keep an eye on the practical ramifications of these results. Before doing a thorough examination of the particular company and the due diligence phase, auditors may use the approach as the initial step of their research for the specific size of the company.
Out of the original 100,041 companies, only 8671 met the required criteria (assets greater than €2 million and complete accounting data). Searching through public databases of business financial statements could produce accounting data. This would lead to more businesses. Another constraint was the uneven distribution of businesses across nations. One of the problems is that only one method of analysis and a small number of time periods were looked at. These problems could be fixed by using more than one method of comparison and looking at a longer time period, or by looking at the time before the economic crisis in 2009 up until 2022 and seeing how different factors might have affected businesses in the V4 group.
In future research, we would focus on other measures of profitability, like ROC, ROI, ROR, and wage profitability, which we would look at using new methods and a longer time frame, as was explained in the last paragraph.

Author Contributions

Conceptualization, R.B. and J.M.; methodology, R.B.; software, R.B.; validation, P.D. and J.M.; formal analysis, P.D.; investigation, R.B. and K.B.; resources, R.B.; data curation, R.B. and K.B.; writing—original draft preparation, R.B. and K.B.; writing—review and editing, P.D.; visualization, R.B. and P.D.; supervision, P.D.; project administration, P.D.; funding acquisition, P.D. All authors have read and agreed to the published version of the manuscript.

Funding

This research received no external funding.

Data Availability Statement

The data presented in this study are available on request from the corresponding author.

Acknowledgments

The paper is an output of the Ministry of Education, Science, Research and Sport of the Slovak Republic and Slovak Academy of Sciences project VEGA 1/0677/22: Quo Vadis, Bankruptcy Models? Prospective Longitudinal Cohort Study with Emphasis on Changes Determined by COVID 19.

Conflicts of Interest

The authors declare no conflict of interest.

References

  1. Akhmadi, Akhmadi, and Yeni Januarsi. 2021. Profitability and firm value: Does dividend policy matter for Indonesian sustainable and responsible investment (SRI)-KEHATI listed firms? Economies 9: 163. [Google Scholar] [CrossRef]
  2. Alabdullah, Tariq Tawfeeq Yousif, Essia Ries Ahmed, Mohammed Almashhdani, Sara Kadhim Yousif, Hasan Ahmed Almashhadani, and Raghad Almashhadani Eskasari Putri. 2021. How Significantly to Emerging Economies Benefit From Board Attributes and Risk Management in Enhancing Firm Profitability? Journal of Accounting Science 5: 100–9. [Google Scholar] [CrossRef]
  3. Almashhadani, Mohammed. 2021. A brief Review of Corporate Governance Structure and Corporate Profitability in Developed and Developing economy: A review. International Journal of Business and Management Invention 10: 42–46. [Google Scholar] [CrossRef]
  4. Anton, Sorin Gabriel. 2021. The impact of temperature increase on firm profitability. Empirical evidence from the European energy and gas sectors. Applied Energy 295: 117051. [Google Scholar] [CrossRef]
  5. Anton, Sorin Gabriel, and Anca Elena Afloarei Nucu. 2020. The impact of working capital management on firm profitability: Empirical evidence from the Polish listed firms. Journal of Risk and Financial Management 14: 9. [Google Scholar] [CrossRef]
  6. Avi, Maria Silva. 2022. Sales Revenues Makers of Profit Monetary Cash Flow and Financial Resources. Journal of Economics & Management Research 3: 1–23. [Google Scholar] [CrossRef]
  7. Aydogmus, Mahmut, Guzhan Gulay, and Ergun Korkmaz. 2022. Impact of ESG Performance on Firm Value And Profitability. Borsa Istanbul Review 22: S119–S127. [Google Scholar] [CrossRef]
  8. Bacik, Radovan, Richard Fedorko, Ersis Warmansyah Abbas, Martin Grigelsky, Viera Ivankova, and Karina Obsatnikova. 2019. The impact of selected quality management attributes on the profitability of top hotels in the Visegrad Group countries. Polish Journal of Management Studies 19: 46–58. [Google Scholar] [CrossRef]
  9. Caby, Jerome, Ydriss Ziane, and Eric Lamarque. 2022. The impact of climate change management on banks profitability. Journal of Business Research 142: 412–22. [Google Scholar] [CrossRef]
  10. Che-Ngoc, Ha, Nga Do-Thi, and Thao Nguyen-Trang. 2022. Profitability of Ichimoku-based trading rule in Vietnam stock market in the context of the COVID-19 outbreak. Computational Economics. 1–19. [Google Scholar] [CrossRef] [PubMed]
  11. Cho, Sang Hun, Chune Young Chung, and Jason Young. 2019. Study on the Relationship between CSR and Financial Performance. Sustainability 11: 343. [Google Scholar] [CrossRef] [Green Version]
  12. Chue, Timothy K., and Jin Karen Xu. 2022. Profitability, asset investment, and aggregate stock returns. Journal of Banking & Finance 143: 106597. [Google Scholar] [CrossRef]
  13. da Silva, Thries George Freire, Alexandre Manicaba da Rosa Ferraz Jardim, Wellington Jairo da Silva Diniz Diniz, Luciana Sandra bastos Souza, George do Nascimento Araujo Junior, Gabriel Italo Novaes da Silva, Cleber Pereira Alves, Carlos Andre Alves de Souza, and Jose Edson Florentino de Morais. 2022. Profitability of using irrigation in forage cactus-sorghum intercropping for farmers in semi-arid environment. Revista Brasileira de Engenharia Agrícola e Ambiental 27: 132–39. [Google Scholar] [CrossRef]
  14. Daneshgar, Sareh, and Rahim Zahedi. 2022. Investigating the hydropower plants production and profitability using system dynamics approach. Journal of Energy Storage 46: 103919. [Google Scholar] [CrossRef]
  15. Didenko, Iryna, Katarina Valaskova, Artem Artyukhov, Serhiy Lyeonov, and Laszlo Vasa. 2022. Quality of scientific activity as a determinant of socio-economic development. Economics and Sociology 15: 301–18. [Google Scholar] [CrossRef]
  16. Dinu, Vasile, and Mariana Bunea. 2022. The Impact of Competition and Risk Exposure on Profitability of the Romanian Banking System During the COVID-19 Pandemic. Journal of Competitiveness 14: 5–22. [Google Scholar] [CrossRef]
  17. Dsouza, Suzan, Mustafa Raza Rabbani, Iqbal Thonse Hawaldar, and Ajay Kumar Jain. 2022. Impact of Bank Efficiency on the Profitability of the Banks in India: An Empirical Analysis Using Panel Data Approach. International Journal of Financial Studies 10: 93. [Google Scholar] [CrossRef]
  18. Durana, Pavol, Pavol Kral, Vojtech Stehel, George Lazariou, and Wlodziemierz Sroka. 2019. Quality culture of manufacturing enterprises: A possible way to adaptation to Industry 4.0. Social Sciences 8: 124. [Google Scholar] [CrossRef] [Green Version]
  19. Gajdosikova, Dominika, Katarina Valaskova, and Pavol Durana. 2022. Earnings management and corporate performance in the scope of firm-specific features. Journal of Risk and Financial Management 15: 426. [Google Scholar] [CrossRef]
  20. Ghani, Usman, Peter Toth, and David Fekete. 2022. Incorporating Survey Perceptions of Public Safety and Security Variables in Crime Rate Analyses for the Visegrád Group (V4) Countries of Central Europe. Societies 12: 156. [Google Scholar] [CrossRef]
  21. Gimferrer, Marti, Gerarad Comas-Vila, and Pedro Salvador. 2020. Can We Safely Obtain Formal Oxidation States from Centroids of Localized Orbitals? Molecules 25: 234. [Google Scholar] [CrossRef] [Green Version]
  22. Gyulai, Laszlo, and Gabor Szucs. 2017. The Effect of the Economic Crisis on the Bank Profitability in the V4 Countries. Management, Enterprise and Benchmarking in the 21st Century 41: 97–110. [Google Scholar]
  23. Habibniya, Houshang, Suzan Dsouza, Mustafa Raza Rabbani, Nishad Nawaz, and Rezart Demiraj. 2022. Impact of capital structure on profitability: Panel data evidence of the telecom industry in the United States. Risks 10: 157. [Google Scholar] [CrossRef]
  24. Hassan, Adewale Samuel. 2022. Does Country Risk Influence Foreign Direct Investment Inflows? A Case of the Visegrád Four. Economies 10: 221. [Google Scholar] [CrossRef]
  25. Jihadi, Muhammad, Elok Vilantika, Sayed Momin Hashemi, Zainal Arifin, Yanuar Bachtiar, and Fatmawati Sholichah. 2021. The effect of liquidity, leverage, and profitability on firm value: Empirical evidence from Indonesia. The Journal of Asian Finance, Economics and Business 8: 423–31. [Google Scholar] [CrossRef]
  26. Kaya, Emine Oner. 2015. The effects of firm-specific factors on the profitability of non-life insurance companies in Turkey. International Journal of Financial Studies 3: 510–29. [Google Scholar] [CrossRef] [Green Version]
  27. Khomytska, Iryna, Vasyl Teslyuk, Natalia Kryvinska, and Iryna Bazylevych. 2020. Software-based approach towards automated authorship acknowledgement—Chi-square test on one consonant group. Electronics 9: 1138. [Google Scholar] [CrossRef]
  28. Kliestik, Tomas, Alena Novak Sedlackova, Martin Bugaj, and Andrej Novak. 2022. Stability of profits and earnings management in the transport sector of Visegrad countries. Oeconomia Copernicana 13: 475–509. [Google Scholar] [CrossRef]
  29. Kocisova, Kristina. 2014. Profitability Determinants and the impact of global financial crisis. Paper presented at the 5th Central European Conference in Regional Science, Košice, Slovakia, October 5–8; pp. 396–406. [Google Scholar]
  30. Kovacova, Maria, Tomas Kliestik, Katarina Valaskova, Pavol Durana, and Zuzana Juhaszova. 2019. Systematic review of variables applied in bankruptcy prediction models of Visegrad group countries. Oeconomia Copernicana 10: 743–72. [Google Scholar] [CrossRef] [Green Version]
  31. Kozak, Sylwester, and Agata Wierzbowska. 2022. Did the COVID-19 pandemic amplify the positive impact of income diversification on the profitability of European banks? Equilibrium. Quarterly Journal of Economics and Economic Policy 17: 11–29. [Google Scholar] [CrossRef]
  32. Kral, Pavol, Maria Kanderova, Alena Kascakova, Gabriela Nedelova, and Veronika Bojdova. 2009. Multivariate Statistical Methods with a Focus on Solving Problems of Economic Practice. Banska Bystrica: Faculty of Economics UMB. [Google Scholar]
  33. Lim, King Yoong, and Diego Morris. 2023. Business optimism and the innovation-profitability nexus: Introducing the COVID-19 adaptable capacity framework. Research Policy 52: 104623. [Google Scholar] [CrossRef]
  34. Liu, Shuangshuang, Qipeng Liao, Mingzhu Xiao, Dengyue Zhao, and Chunbo Huang. 2022. Spatial and Temporal Variations of Habitat Quality and Its Response of Landscape Dynamic in the Three Gorges Reservoir Area, China. International Journal of Environmental Research and Public Health 19: 3594. [Google Scholar] [CrossRef] [PubMed]
  35. Lozowicka, Bozena, Piotr Iwaniuk, Rafal Konecki, Piotr Kaczynski, Nurlan Kuldybayec, and Yerlan Dutbayev. 2022. Impact of Diversified Chemical and Biostimulator Protection on Yield, Health Status, Mycotoxin Level, and Economic Profitability in Spring Wheat (Triticum aestivum L.) Cultivation. Agronomy 12: 258. [Google Scholar] [CrossRef]
  36. Mahmood, Faisal, Dongping Han, Nazakt Ali, Riaqa Mubeen, and Umeair Shahzad. 2019. Moderating effects of firm size and leverage on the working capital finance–profitability relationship: Evidence from China. Sustainability 11: 2029. [Google Scholar] [CrossRef] [Green Version]
  37. Michalkova, Lucia, Maria Kovacova, Martin Cepel, and Jaroslav Belas. 2022. Insolvency prediction and corporate bankrutpcy model in Visegrad group countries. Transformations in Business & Economics 21: 529–48. [Google Scholar]
  38. Murphy, J. David, Marco Raugei, Michael Carbajales-Dale, and Brenda Rubio Estrada. 2022. Energy Return on Investment of Major Energy Carriers: Review and Harmonization. Sustainability 14: 7098. [Google Scholar] [CrossRef]
  39. Musova, Zdenka, Hussam Musa, Jennifer Drugdova, George Lazaroiu, and Jehad Alayasa. 2021. Consumer attitudes towards new circular models in the fashion industry. Journal of Competitiveness 13: 111–28. [Google Scholar] [CrossRef]
  40. Nguyen, Dat T., and Tu Duc Quang Le. 2022. The interrelationships between bank profitability, bank stability and loan growth in Southeast Asia. Cogent Business & Management 9: 2084977. [Google Scholar] [CrossRef]
  41. Olah, Judit, Adriana Tiron Tudor, Vadim Pashkus, and Genady Alpatov. 2021. Preferences of Central European consumers in circular economy. Ekonomicko-Manazerske Spektrum 15: 99–110. [Google Scholar] [CrossRef]
  42. Olarewaju, Odunayo Marget, and Thabiso Sthembiso Msomi. 2022. Factors affecting the profitability of reinsurance companies in sub-Saharan Africa: Evidence from dynamic panel analysis. Cogent Business & Management 9: 2093485. [Google Scholar] [CrossRef]
  43. Ovechkin, Danila V., Gulnara F. Romashkina, and Vladimir A. Davydenko. 2021. The impact of intellectual capital on the profitability of Russian agricultural firms. Agronomy 11: 286. [Google Scholar] [CrossRef]
  44. Pervan, Maja, Marijana Curak, and Tomislava Pavic Kramaric. 2017. The influence of industry characteristics and dynamic capabilities on firms’ profitability. International Journal of Financial Studies 6: 4. [Google Scholar] [CrossRef] [Green Version]
  45. Pham, Nam Hai, Tri M. Haong, and Nhung Thi Hong Pham. 2022. The impact of capital structure on bank profitability: Evidence from Vietnam. Cogent Business & Management 9: 2096263. [Google Scholar] [CrossRef]
  46. Ragazou, Konstantina, Ioannis Passas, Alexandros Garefalakis, and Irini Dimou. 2022. Investigating the research trends on strategic ambidexterity, agility, and open innovation in SMEs: Perceptions from bibliometric analysis. Journal of Open Innovation: Technology, Market, and Complexity 8: 118. [Google Scholar] [CrossRef]
  47. Ruckova, Petra. 2015. Impact of liquidity and profitability on use of debt finance sources of companies in manufacturing industry in V4 countries. Acta Academica Karviniensia 15: 69–79. [Google Scholar] [CrossRef] [Green Version]
  48. Rupp, Marco-Christopher, Lukas N. Muench, Yannick J. Ehmann, Alexander Themessl, Philipp W. Winkler, Julian Mehl, Andreas B. Imhoff, and Matthias J. Feucht. 2022. Improved clinical outcome and high rate of return to low-impact sport and work after knee double level osteotomy for bifocal varus malalignment. Arthroscopy: The Journal of Arthroscopic & Related Surgery 38: 1944–53. [Google Scholar] [CrossRef]
  49. Sagan, Anna, Lucie Bryndova, Iwona Kowalska-Bobko, Martin Smatana, Annde Spranger, Viktoria Szerencses, Erin Webb, and Peter Gaal. 2022. A reversal of fortune: Comparison of health system responses to COVID-19 in the Visegrad group during the early phases of the pandemic. Health Policy 126: 446–55. [Google Scholar] [CrossRef]
  50. Shen, Cencheng, Sambit Panda, and Joshua T. Vogelstein. 2022. The chi-square test of distance correlation. Journal of Computational and Graphical Statistics 31: 254–62. [Google Scholar] [CrossRef]
  51. Sohibien, Gama Putra Danu, Lilis Laome, Achmad Choiruddin, and Heri Kuswanto. 2022. COVID-19 Pandemic’s Impact on Return on Asset and Financing of Islamic Commercial Banks: Evidence from Indonesia. Sustainability 14: 1128. [Google Scholar] [CrossRef]
  52. Taylor, Daniel, Bernard Sarpong, and Eunice Yaa Cudjoe. 2022. Cost-efficiency and bank profitability during health crisis. Applied Economics Letters, 1–6. [Google Scholar] [CrossRef]
  53. Ugurlu, Erginbay. 2022. Impacts of Renewable Energy on CO Emission: Evidence from the Visegrad Group Countries. Politics in Central Europe 18: 295–315. [Google Scholar] [CrossRef]
  54. Valaskova, Katarina, and Dominika Gajdosikova. 2022. Corporate debt and earnings management: Evidence from Slovakia. Paper presented at the 12th International Scientific Conference “Business and Management 2022”, Vilnius, Lithuania, May 12–13. [Google Scholar]
  55. Valaskova, Katarina, Tomas Kliestik, Lucia Svabova, and Peter Adamko. 2018. Financial risk measurement and prediction modelling for sustainable development of business entities using regression analysis. Sustainability 10: 2144. [Google Scholar] [CrossRef] [Green Version]
  56. Vavrina, Jan, and Lubor Lacina. 2018. Profitability of foodstuff processing companies in V4 countries during the 2008–2012 economic crisis. Society and Economy 40: 245–70. [Google Scholar] [CrossRef]
  57. Verma, Jay Prakash. 2012. Data Analysis in Management with SPSS Software. New Delhi: Springer Science & Business Media. [Google Scholar]
  58. Visser, Karmi, Gerbus Swart, Joggie Pretorius, Lin-Marie Esterhuyzen, Tanja Verster, and Erika Fourie. 2022. Customer comfort limit utilisation: Management tool informing credit limit-setting strategy decisions to improve profitability. Cogent Economics and Finance 10: 2056362. [Google Scholar] [CrossRef]
  59. Wang, Enci, Jianyun Nie, and Hong Zhan. 2022. The Impact of Carbon Emissions Trading on the Profitability and Debt Burden of Listed Companies. Sustainability 14: 13429. [Google Scholar] [CrossRef]
  60. Zhao, Likun, Shaotang Yang, Shouqing Wang, and Jianxiong Shen. 2022. Research on PPP Enterprise Credit Dynamic Prediction Model. Applied Sciences 12: 10362. [Google Scholar] [CrossRef]
  61. Zhu, Yajun, and Churen Sun. 2022. Carbon reduction, pollution intensity, and firms’ ratios of value added in exports: Evidence from China’s low-carbon pilot policy. Sustainability 14: 12687. [Google Scholar] [CrossRef]
Figure 1. Structure of the article. Source: own research.
Jrfm 16 00219 g001
Figure 2. Original and final sample of enterprises. Source: own research.
Jrfm 16 00219 g002
Figure 3. Size and national structure of the enterprises. Source: own research.
Jrfm 16 00219 g003
Figure 4. Select profitability measures. Source: own research.
Jrfm 16 00219 g004
Figure 5. Classification intervals for selected profitability indicator. Source: own research.
Jrfm 16 00219 g005
Figure 6. Correspondence map for ROA indicators in 2019 and enterprise size categories. Source: own research.
Jrfm 16 00219 g006
Figure 7. Correspondence map for ROA indicators in 2020 and enterprise size categories. Source: own research.
Jrfm 16 00219 g007
Figure 8. Correspondence map for ROA indicators in 2021 and enterprise size categories. Source: own research.
Jrfm 16 00219 g008
Figure 9. Correspondence map for ROE indicators in 2019 and enterprise size categories. Source: own research.
Jrfm 16 00219 g009
Figure 10. Correspondence map for ROE indicators in 2020 and enterprise size categories. Source: own research.
Jrfm 16 00219 g010
Figure 11. Correspondence map for ROE indicators in 2021 and enterprise size categories. Source: own research.
Jrfm 16 00219 g011
Figure 12. Correspondence map for ROS indicators in 2019 and enterprise size categories. Source: own research.
Jrfm 16 00219 g012
Figure 13. Correspondence map for ROS indicators in 2020 and enterprise size categories. Source: own research.
Jrfm 16 00219 g013
Figure 14. Correspondence map for ROS indicators in 2021 and enterprise size categories. Source: own research.
Jrfm 16 00219 g014
Figure 15. Structure of the conclusion. Source: own research.
Jrfm 16 00219 g015
Table 1. The categorization according to the ORBIS database. Source: own processing.
Size of
the Enterprise
Criterion
Operational RevenueTotal AssetsNumber of Employees
Medium≥1 million euros≥2 million euros≥15
Large≥10 million euros≥20 million euros≥150
Very large≥100 million euros≥200 million euros≥1000
Table 2. Descriptive statistics for small companies. Source: own research.
IndicatorMaximumMinimumMeanStandard DeviationMedian
ROA 20190.8582−1.73040.04780.126730.0266
ROA 20200.6275−1.31950.04500.109050.0269
ROA 20210.7334−2.77440.03000.177280.0278
ROE 201912.2830−13.29200.11920.772240.0792
ROE 20203.5023−21.69050.08400.894140.0748
ROE 202199.6224−50,02000.07914.611970.0747
ROS 20191.1467−126.4059−0.13084.809560.0302
ROS 20200.9359−912.4521−1.262134.688610.0308
ROS 20211.5913−3.76260.04470.248920.0330
Table 3. Descriptive statistics for medium-sized companies. Source: own research.
IndicatorMaximumMinimumMeanStandard DeviationMedian
ROA 20192.8008−15.04730.06330.293890.0391
ROA 20202.0927−9.86620.06320.252230.0415
ROA 20212.6236−11.34890.07360.05000.0461
ROE 2019218.7093−381.27550.04567.244660.0933
ROE 2020120.3801−86.87410.12342.761210.0953
ROE 202117.7152−222.71870.04344.063130.1088
ROS 201926.0759−19.71930.04620.536000.0281
ROS 202013.4727−72.76110.03221.194840.0310
ROS 202114.6834−2.46870.06000.333400.0358
Table 4. Descriptive statistics for large companies. Source: own research.
IndicatorMaximumMinimumMeanStandard DeviationMedian
ROA 201910.2472−4.39690.10790.338530.0413
ROA 20207.1580−4.18000.09510.304600.0432
ROA 202130.9130−3.42790.07360.241430.0567
ROE 2019126.3033−14.32570.18712.348330.1115
ROE 202095.0036−75.83380.15562.325690.1123
ROE 2021189.9278−37.78120.21823.611460.1390
ROS 2019190.4126−23.46500.14154.096530.0262
ROS 202048.8931−435.4195−0.08428.013080.0279
ROS 2021637.4648−7.11240.287311.663420.0351
Table 5. Descriptive statistics for very large companies. Source: own research.
IndicatorMaximumMinimumMeanStandard DeviationMedian
ROA 20194.0909−5.56890.05010.453750.0428
ROA 20205.6316−8.60870.05080.492910.0420
ROA 20213.4637−10.10330.06010.524070.0520
ROE 201936.5445−16.21490.14021.350610.0996
ROE 202016.4490−30.85170.06921.431740.0984
ROE 202119.0687−11.00940.16390.836010.1207
ROS 201915.5666−13.08050.05850.845620.0242
ROS 202016.7460−11.90210.04240.777040.0248
ROS 202110.2844−27.08000.03741.057920.0328
Table 6. Normality test. Source: own research.
Size Kolmogorov-Smirnov Test
StatisticdfSig.
ROA_2019Large company0.30329980.000
Medium sized company0.31840090.000
Small company0.2626920.000
Very large company0.3579700.000
ROA_2020Large company0.28629980.000
Medium sized company0.29040090.000
Small company0.2266920.000
Very large company0.3499700.000
ROA_2021Large company0.36829980.000
Medium sized company0.29140090.000
Small company0.2886920.000
Very large company0.3629700.000
ROS_2019Large company0.47129980.000
Medium sized company0.38740090.000
Small company0.4826920.000
Very large company0.3929700.000
ROS_2020Large company0.48429980.000
Medium sized company0.42640090.000
Small company0.5036920.000
Very large company0.3739700.000
ROS_2021Large company0.48529980.000
Medium sized company0.34340090.000
Small company0.3086920.000
Very large company0.4159700.000
ROE_2019Large company0.40929980.000
Medium sized company0.44740090.000
Small company0.3536920.000
Very large company0.3749700.000
ROE_2020Large company0.41129980.000
Medium sized company0.41440090.000
Small company0.3546920.000
Very large company0.3879700.000
ROE_2021Large company0.42929980.000
Medium sized company0.44640090.000
Small company0.4326920.000
Very large company0.3249700.000
Table 7. Chi-square test (enterprise size vs. change in the ROA 2019 profitability indicator). Source: own research.
Chi-Square Tests
ValuedfAsymptotic Significance (2-Sided)
Pearson Chi-Square47.513 a60.000
N of Valid Cases8671
a 0 cells (0.0%) have an expected count of less than 5. The minimum expected count is 59.14.
Table 8. Strength of dependence between variables. Source: own research.
Symmetric Measures
ValueApproximate Significance
Nominal by NominalCramer’s V0.0520.000
Contingency Coefficient0.0740.000
N of Valid Cases8671
Table 9. Chi-square test (enterprise size vs. change in the ROA 2020 profitability indicator). Source: own research.
Chi-Square Tests
ValuedfAsymptotic Significance (2-Sided)
Pearson Chi-Square43.803 b60.000
N of Valid Cases8671
b 0 cells (0.0%) have an expected count of less than 5. The minimum expected count is 72.25.
Table 10. Strength of dependence between variables. Source: own research.
Symmetric Measures
ValueApproximate Significance
Nominal by NominalCramer’s V0.0500.000
Contingency Coefficient0.0710.000
N of Valid Cases8671
Table 11. Chi-square test (enterprise size vs. change in the ROA 2021 profitability indicator). Source: own research.
Chi-Square Tests
ValuedfAsymptotic Significance (2-Sided)
Pearson Chi-Square69.513 c60.000
N of Valid Cases8671
c 0 cells (0.0%) have an expected count of less than 5. The minimum expected count is 69.61.
Table 12. Strength of dependence between variables. Source: own research.
Symmetric Measures
ValueApproximate Significance
Nominal by NominalCramer’s V0.0630.000
Contingency Coefficient0.0890.000
N of Valid Cases8671
Table 13. Chi-square test (enterprise size vs. change in the ROE 2019 profitability indicator). Source: own research.
Chi-Square Tests
ValuedfAsymptotic Significance (2-Sided)
Pearson Chi-Square59.091 d60.000
Likelihood Ratio58.71060.000
Linear-by-Linear Association16.85610.000
N of Valid Cases8671
d 0 cells (0.0%) have an expected count of less than 5. The minimum expected count is 211.71.
Table 14. Strength of dependence between variables. Source: own research.
Symmetric Measures
ValueApproximate Significance
Nominal by NominalCramer’s V0.0580.000
Contingency Coefficient0.0820.000
N of Valid Cases8671
Table 15. Chi-square test (enterprise size vs. change in the ROE 2020 profitability indicator). Source: own research.
Chi-Square Tests
ValuedfAsymptotic Significance (2-Sided)
Pearson Chi-Square51.514 e60.000
N of Valid Cases8671
e 0 cells (0.0%) have an expected count of less than 5. The minimum expected count is 200.28.
Table 16. Strength of dependence between variables. Source: own research.
Symmetric Measures
ValueApproximate Significance
Nominal by NominalCramer’s V0.0550.000
Contingency Coefficient0.0770.000
N of Valid Cases8671
Table 17. Chi-square test (enterprise size vs. change in the ROE 2021 profitability indicator). Source: own research.
Chi-Square Tests
ValuedfAsymptotic Significance (2-Sided)
Pearson Chi-Square102.404 f60.000
N of Valid Cases8671
f 0 cells (0.0%) have an expected count of less than 5. The minimum expected count is 184.30.
Table 18. Strength of dependence between variables. Source: own research.
Symmetric Measures
ValueApproximate Significance
Nominal by NominalCramer’s V0.0770.000
Contingency Coefficient0.1080.000
N of Valid Cases8671
Table 19. Chi-square test (enterprise size vs. change in the ROS 2019 profitability indicator). Source: own research.
Chi-Square Tests
ValuedfAsymptotic Significance (2-Sided)
Pearson Chi-Square80.257 g60.000
N of Valid Cases8671
g 0 cells (0.0%) have an expected count of less than 5. The minimum expected count is 42.44.
Table 20. Strength of dependence between variables. Source: own research.
Symmetric Measures
ValueApproximate Significance
Nominal by NominalCramer’s V0.0680.000
Contingency Coefficient0.0960.000
N of Valid Cases8671
Table 21. Chi-square test (enterprise size vs. change in the ROS 2020 profitability indicator). Source: own research.
Chi-Square Tests
ValuedfAsymptotic Significance (2-Sided)
Pearson Chi-Square90.868 h60.000
N of Valid Cases8671
h 0 cells (0.0%) have an expected count of less than 5. The minimum expected count is 57.30.
Table 22. Strength of dependence between variables. Source: own research.
Symmetric Measures
ValueApproximate Significance
Nominal by NominalCramer’s V0.0720.000
Contingency Coefficient0.1020.000
N of Valid Cases8671
Table 23. Chi-square test (enterprise size vs. change in the ROS 2021 profitability indicator). Source: own research.
Chi-Square Tests
ValuedfAsymptotic Significance (2-Sided)
Pearson Chi-Square70.021 i60.000
N of Valid Cases8671
i 0 cells (0.0%) have an expected count of less than 5. The minimum expected count is 50.19.
Table 24. Strength of dependence between variables. Source: own research.
Symmetric Measures
ValueApproximate Significance
Nominal by NominalCramer’s V0.0640.000
Contingency Coefficient0.0900.000
N of Valid Cases8671
Table 25. The resulting classification of enterprise size categories is based on their performance with respect to the selected profitability indicators for the period covered. Source: own research.
YEARProfitability IndicatorA Significant Positive ChangeA Significant Negative ChangeNo Significant Change
2019ROALarge companyMedium-sized company
Very large company
Small company
ROELarge companySmall company
Medium-sized company
Very large company
ROSSmall company
Medium-sized company
Very large companyLarge company
2020ROALarge companyMedium-sized company
Very large company
Small company
ROELarge companySmall company
Medium-sized company
Very large company
ROSSmall company
Medium-sized company
Very large companyLarge company
2021ROALarge companyVery large companySmall company
Medium-sized company
ROELarge companySmall company
Medium-sized company
Very large company
ROSMedium-sized companySmall company
Very large company
Large company
Disclaimer/Publisher’s Note: The statements, opinions and data contained in all publications are solely those of the individual author(s) and contributor(s) and not of MDPI and/or the editor(s). MDPI and/or the editor(s) disclaim responsibility for any injury to people or property resulting from any ideas, methods, instructions or products referred to in the content.

