

Pre-IPO Financial Performance and Offer Price Estimation: Evidence from India

Abstract
:1. Introduction
2. Literature Review and Rationale of the Present Study
2.1. Relevancy of Financial Elements and IPO Offer Price Estimation
2.2. Financial Information and Share Price Movements in Secondary Market
2.3. Offering Value and Pre-IPO Financials: Investors’ Rationale
2.4. Valuation Models and IPO Share Price Determination
2.5. Theoretical Framework
3. Research Gap, Objective and Hypothesis
3.1. Research Gap
3.2. Research Objective
- To investigate the relationship between IPO Offering Price and Financial Performance Indicators.
3.3. Hypothesis Formulation
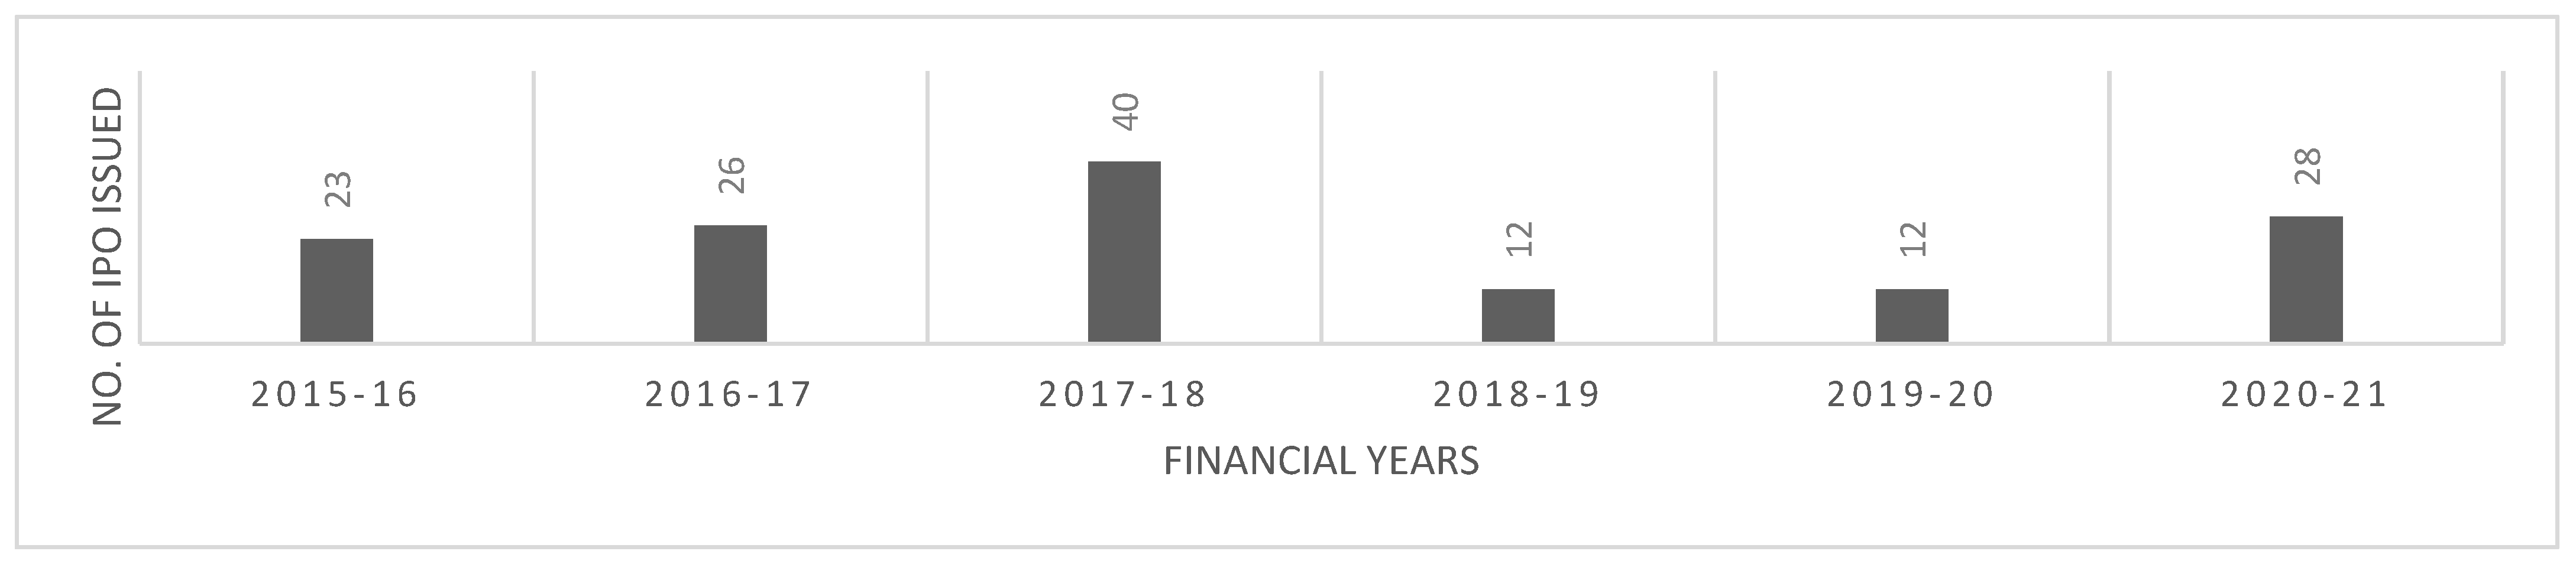
4. Sample and Data
4.1. Sample Construction
4.2. Data Collection and Variables
4.3. Statistical Tools for Data Analysis
5. Model Formation
5.1. Methodologies Employed in Previous Research Studies Focused on Financial Performance and IPO Pricing
5.2. Formulation of Empirical Model
5.3. The Multiple Linear Regression Model
6. Analysis and Interpretation of Results
6.1. Descriptive Statistics
6.2. Bivariate Correlation Matrix
6.3. Analysis Using Multiple Linear Regression (MLR)
7. Findings and Conclusions
8. Implications of the Study
9. Limitations of the Study and Future Scope
Author Contributions
Funding
Data Availability Statement
Acknowledgments
Conflicts of Interest
Abbreviations
| BSE | Bombay Stock Exchange |
| DCF | Discounted Cash Flow |
| DDM | Dividend Discount Model |
| FY | Financial Year |
| IPO | Initial Public Offer |
| MLR | Multiple Linear Regression |
| NSE | National stock Exchange |
| OLS | Ordinary Least Squares |
| P/V | Profit Volume |
| P/E | Price to Earnings |
| RHP | Red Herring Prospectus |
| SME | Small and Medium Enterprises |
| VIF | Variance Inflation Factor |
Appendix A
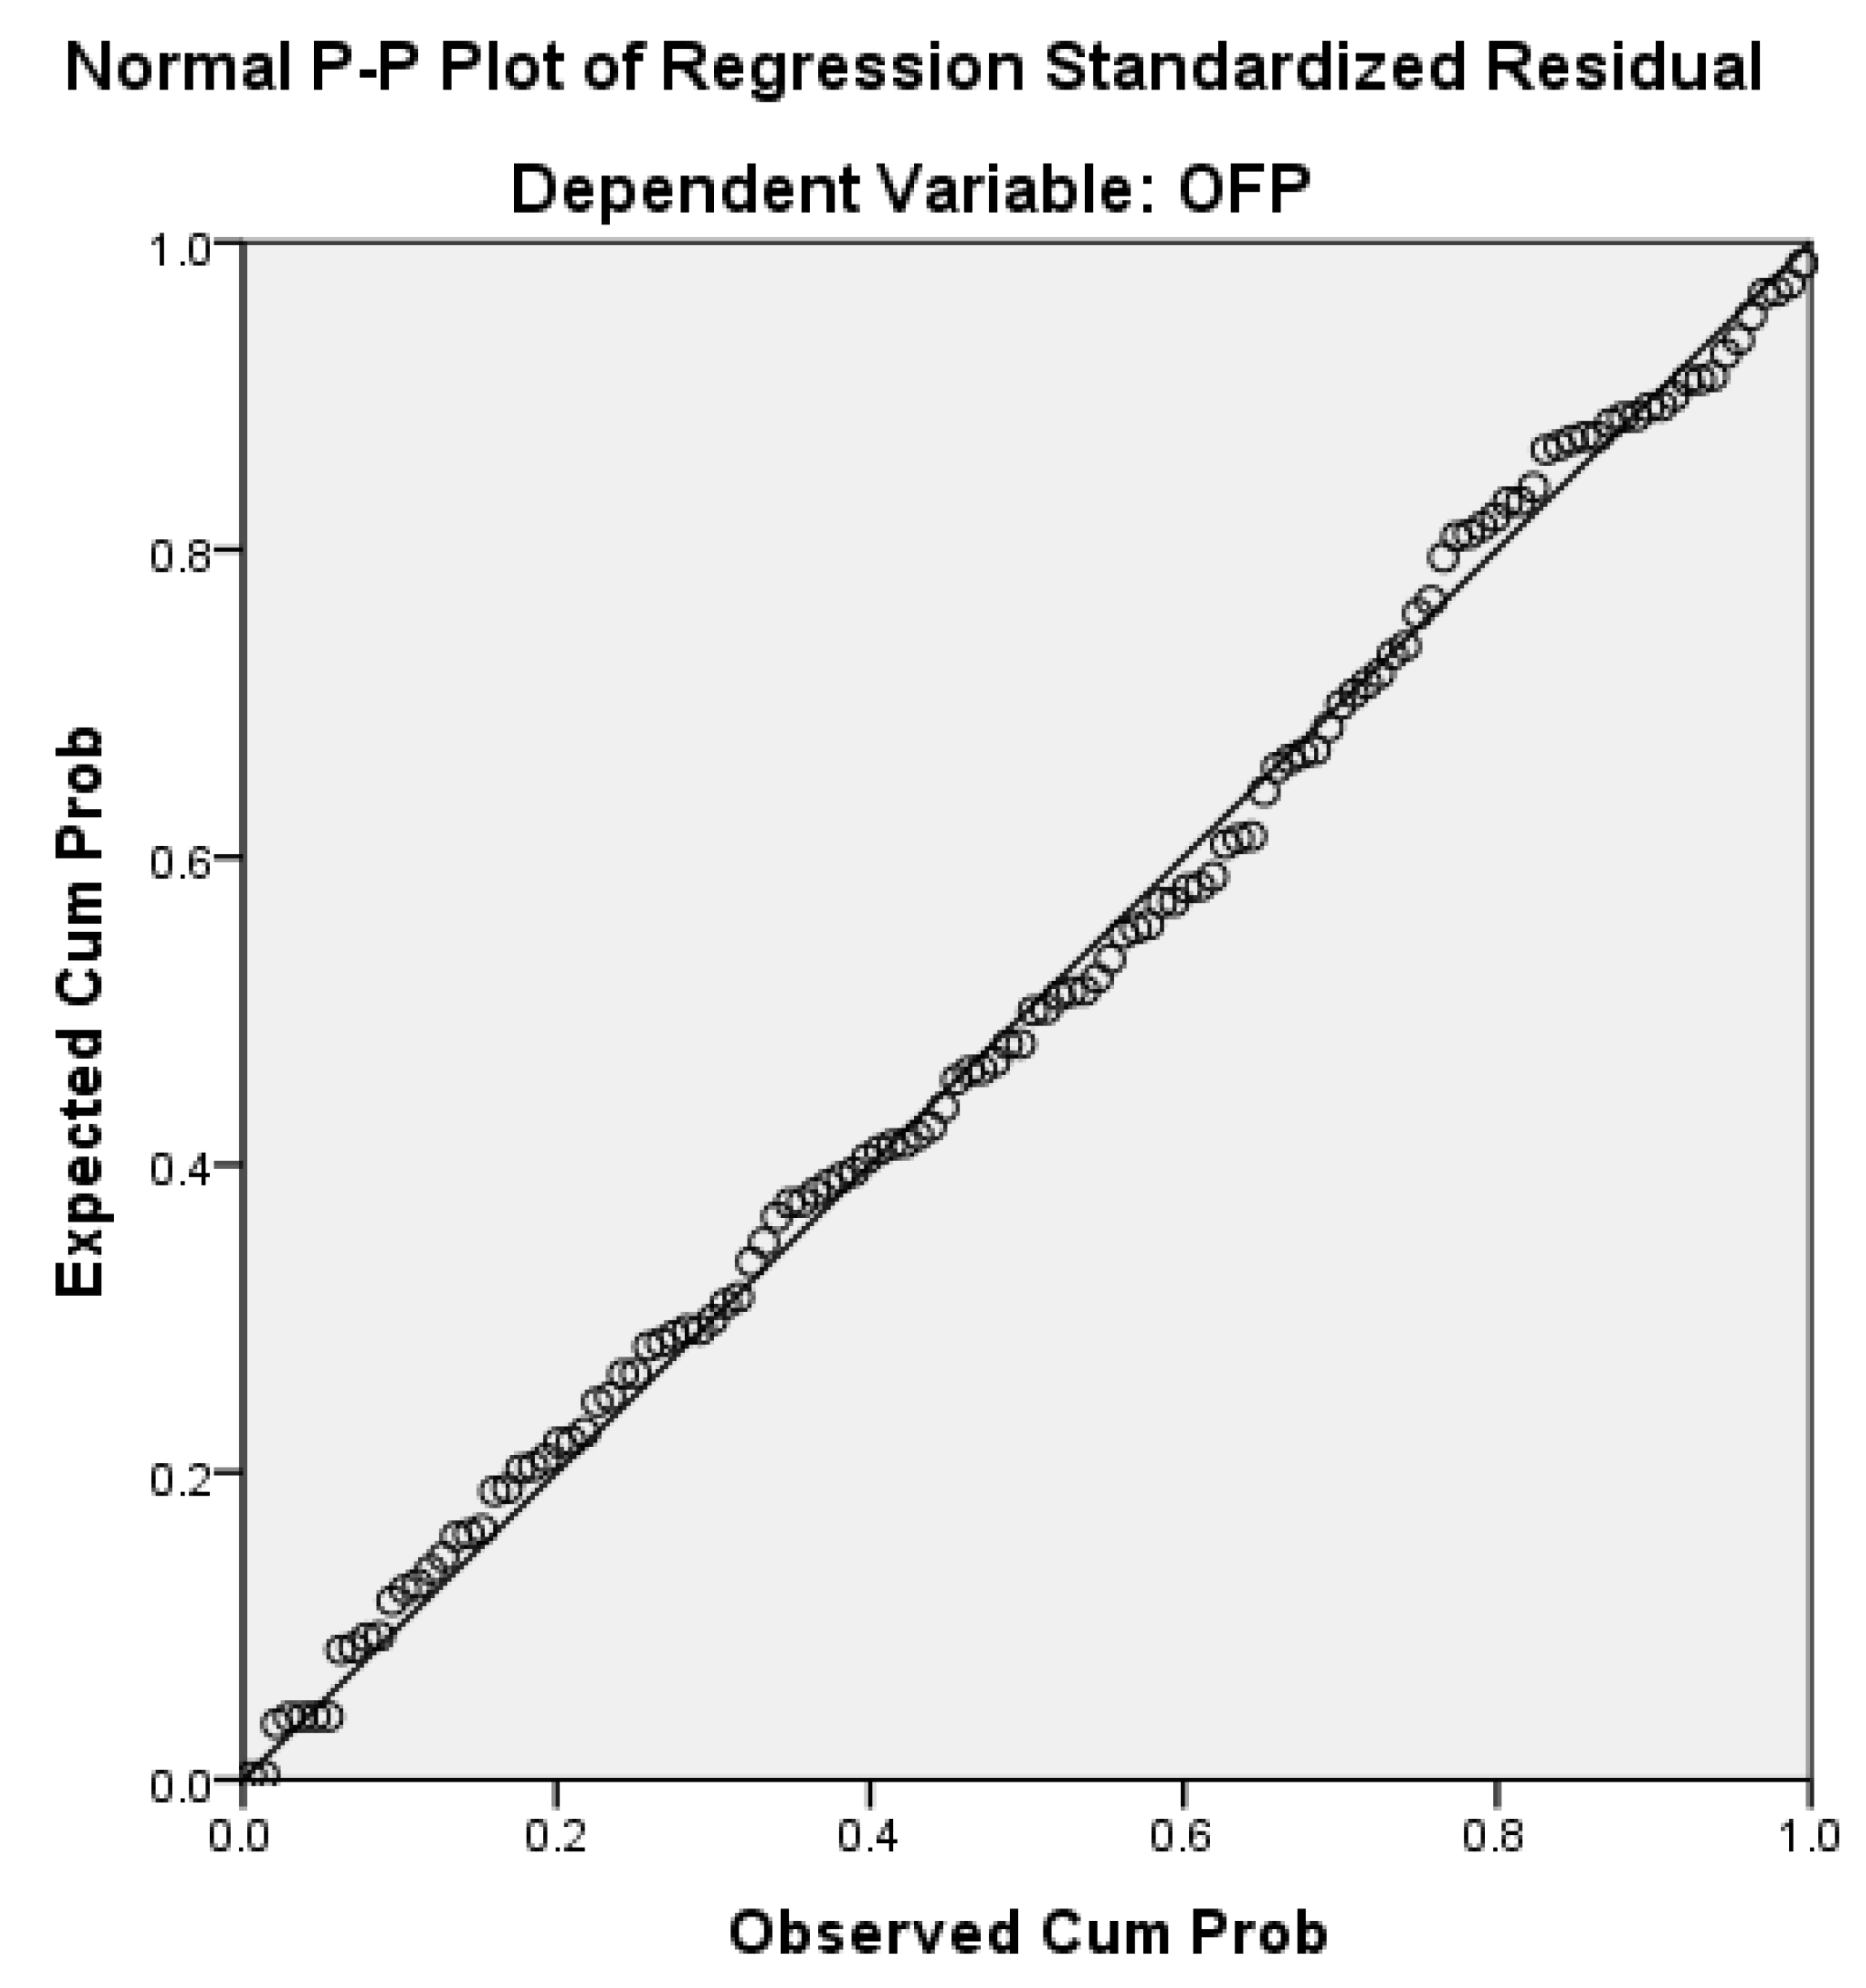
- Test for Linearity:The figure given below indicates the linear fit between response and predictor variables.

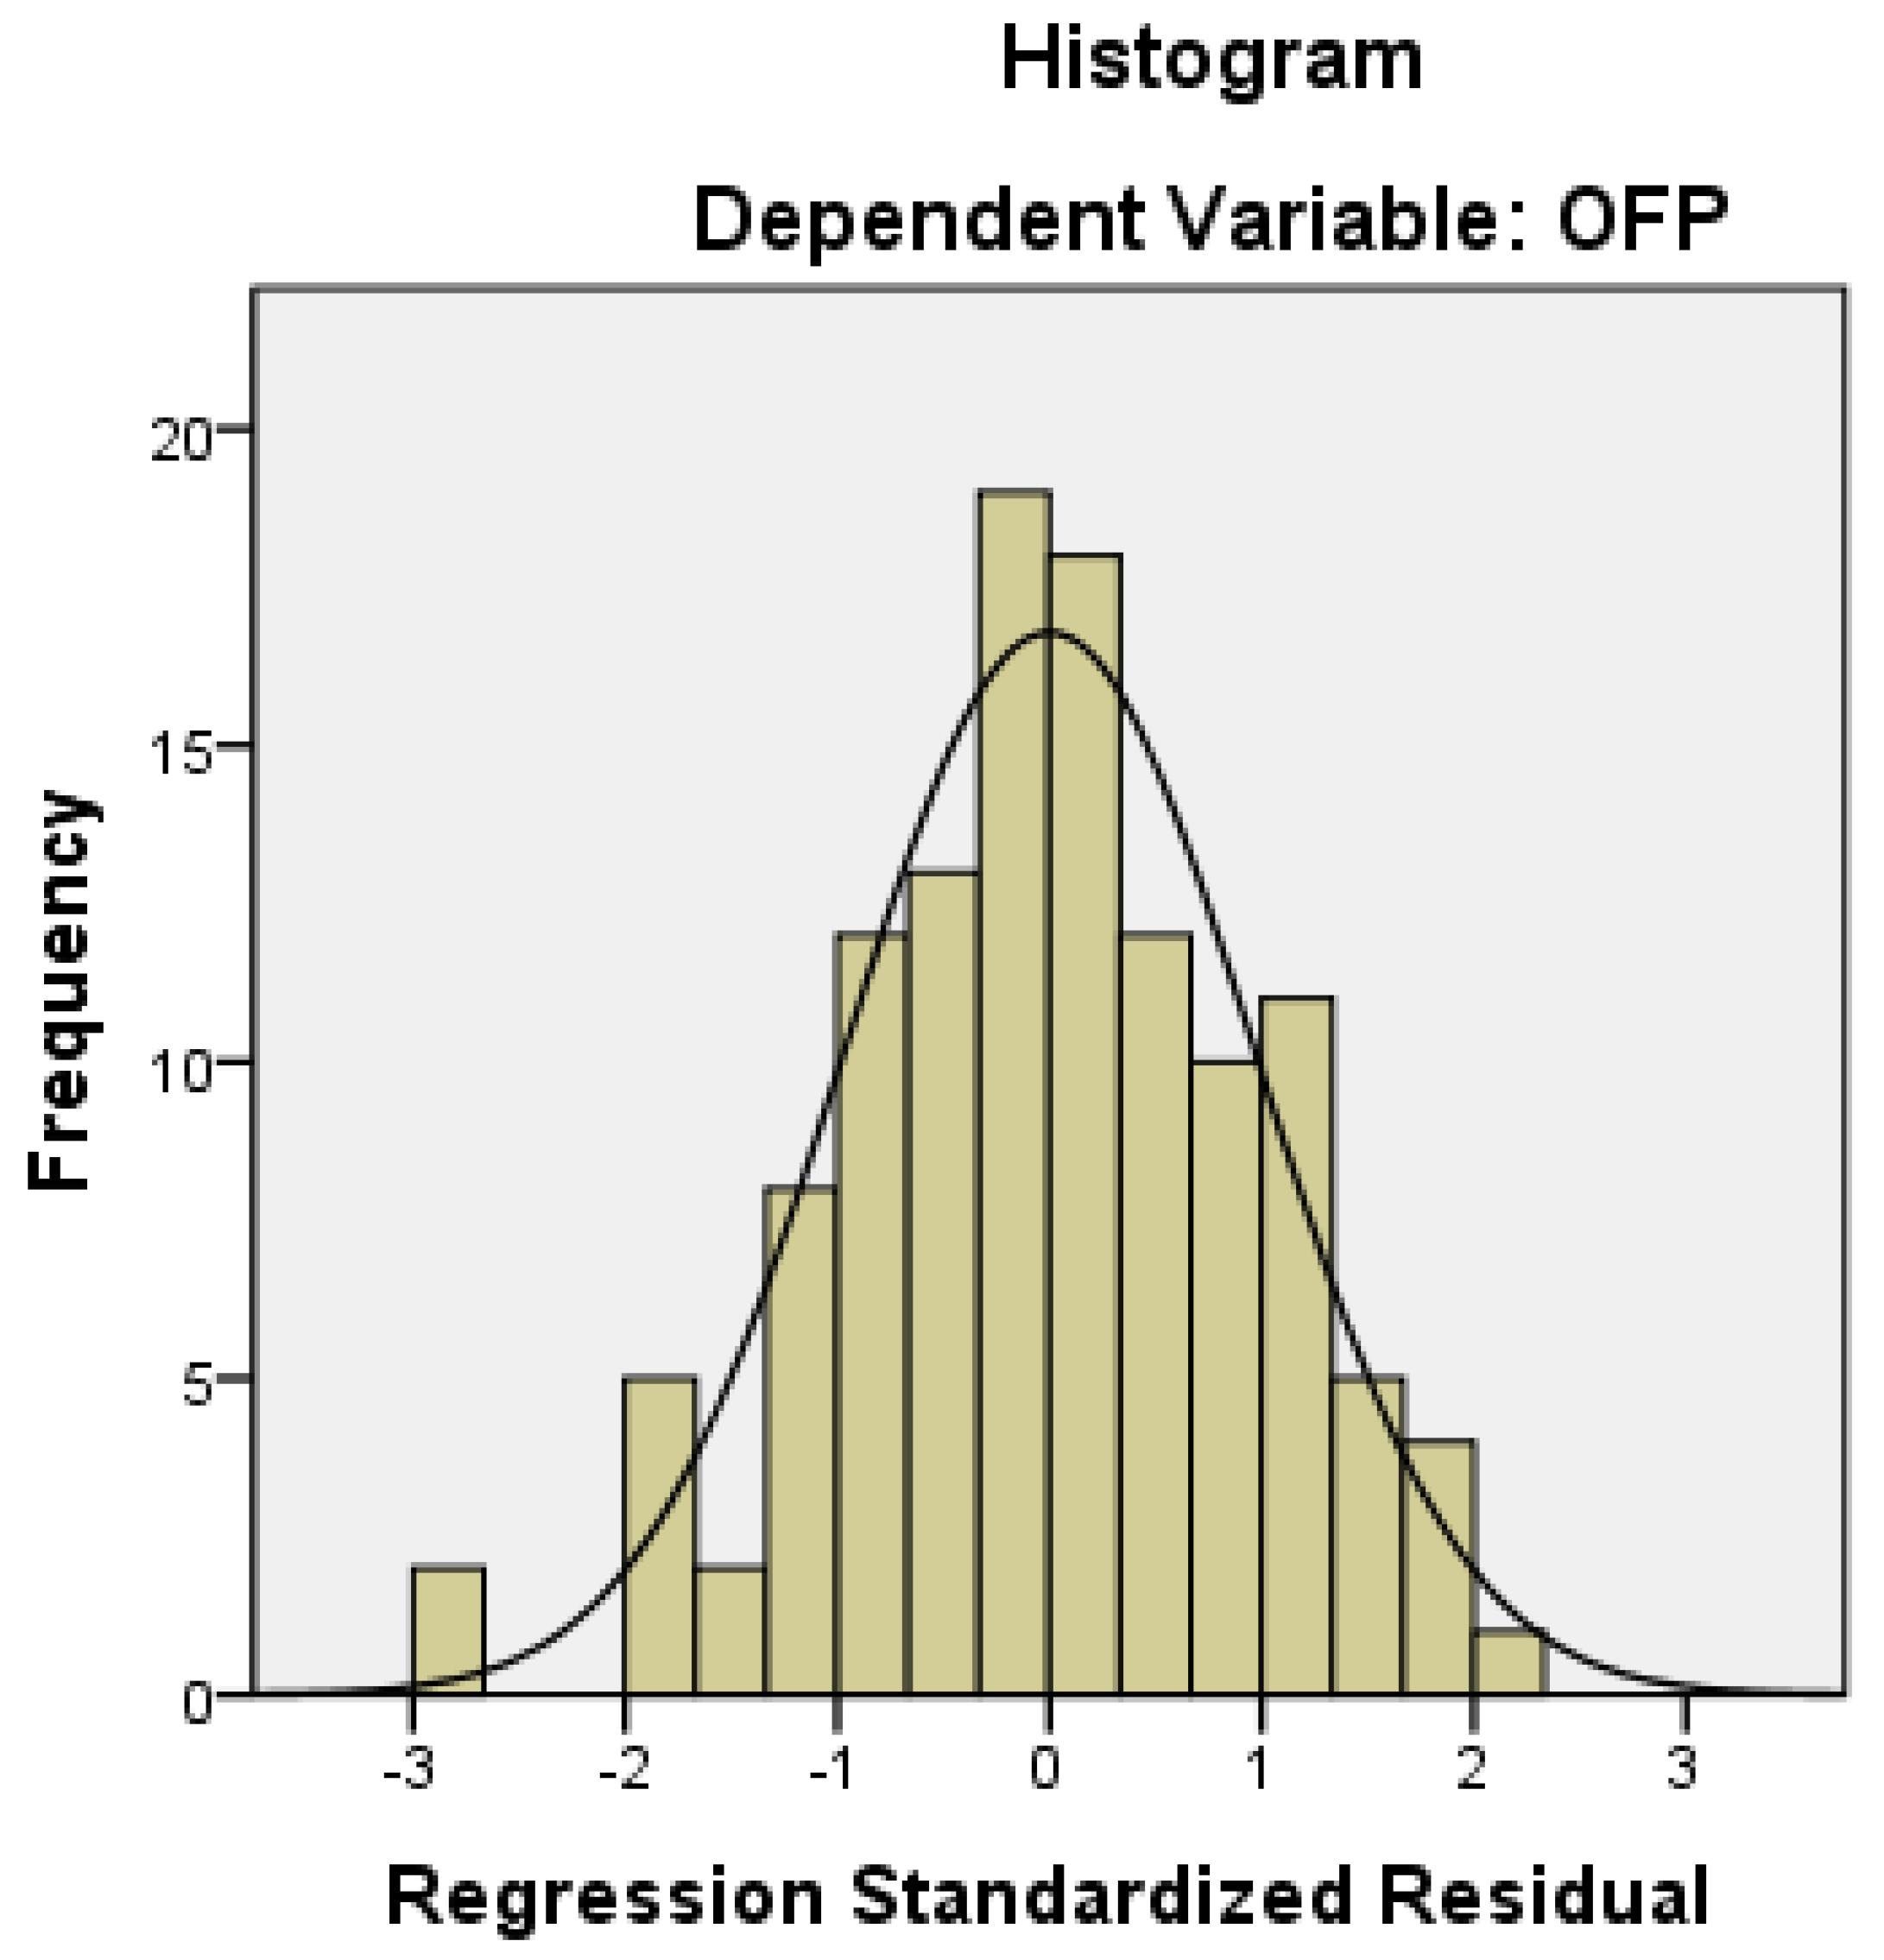
- Kolmogorov—Smirnov’s Normality TestTo determine whether a set of data is normal, we applied the Kolmogorov-Smirnov test.

| Kolmogorov-Smirnov | |||
|---|---|---|---|
| Statistic | df | Sig. | |
| OFP | 0.064 | 122 | 0.200 |
- Durbin-Watson’s Test: The residuals autocorrelation test.There is no autocorrelation evident in the DW statistic, which has a value of 1.970. As this value is very close to 2 denotes the absence of first-order autocorrelation.
- VIF Scores to check Multicollinearity in dataThe table given below reflects that our model is free from the issue of multicollinearity.
| Variables | VIF | 1/VIF |
|---|---|---|
| NAV | 2.152 | 0.464 |
| ROA | 1.666 | 0.600 |
| EPS | 3.304 | 0.302 |
| PAT | 1.883 | 0.531 |
| IPE | 1.028 | 0.972 |
| RONW | 1.375 | 0.727 |
| OFS | 1.635 | 0.611 |
| AGE | 1.123 | 0.890 |
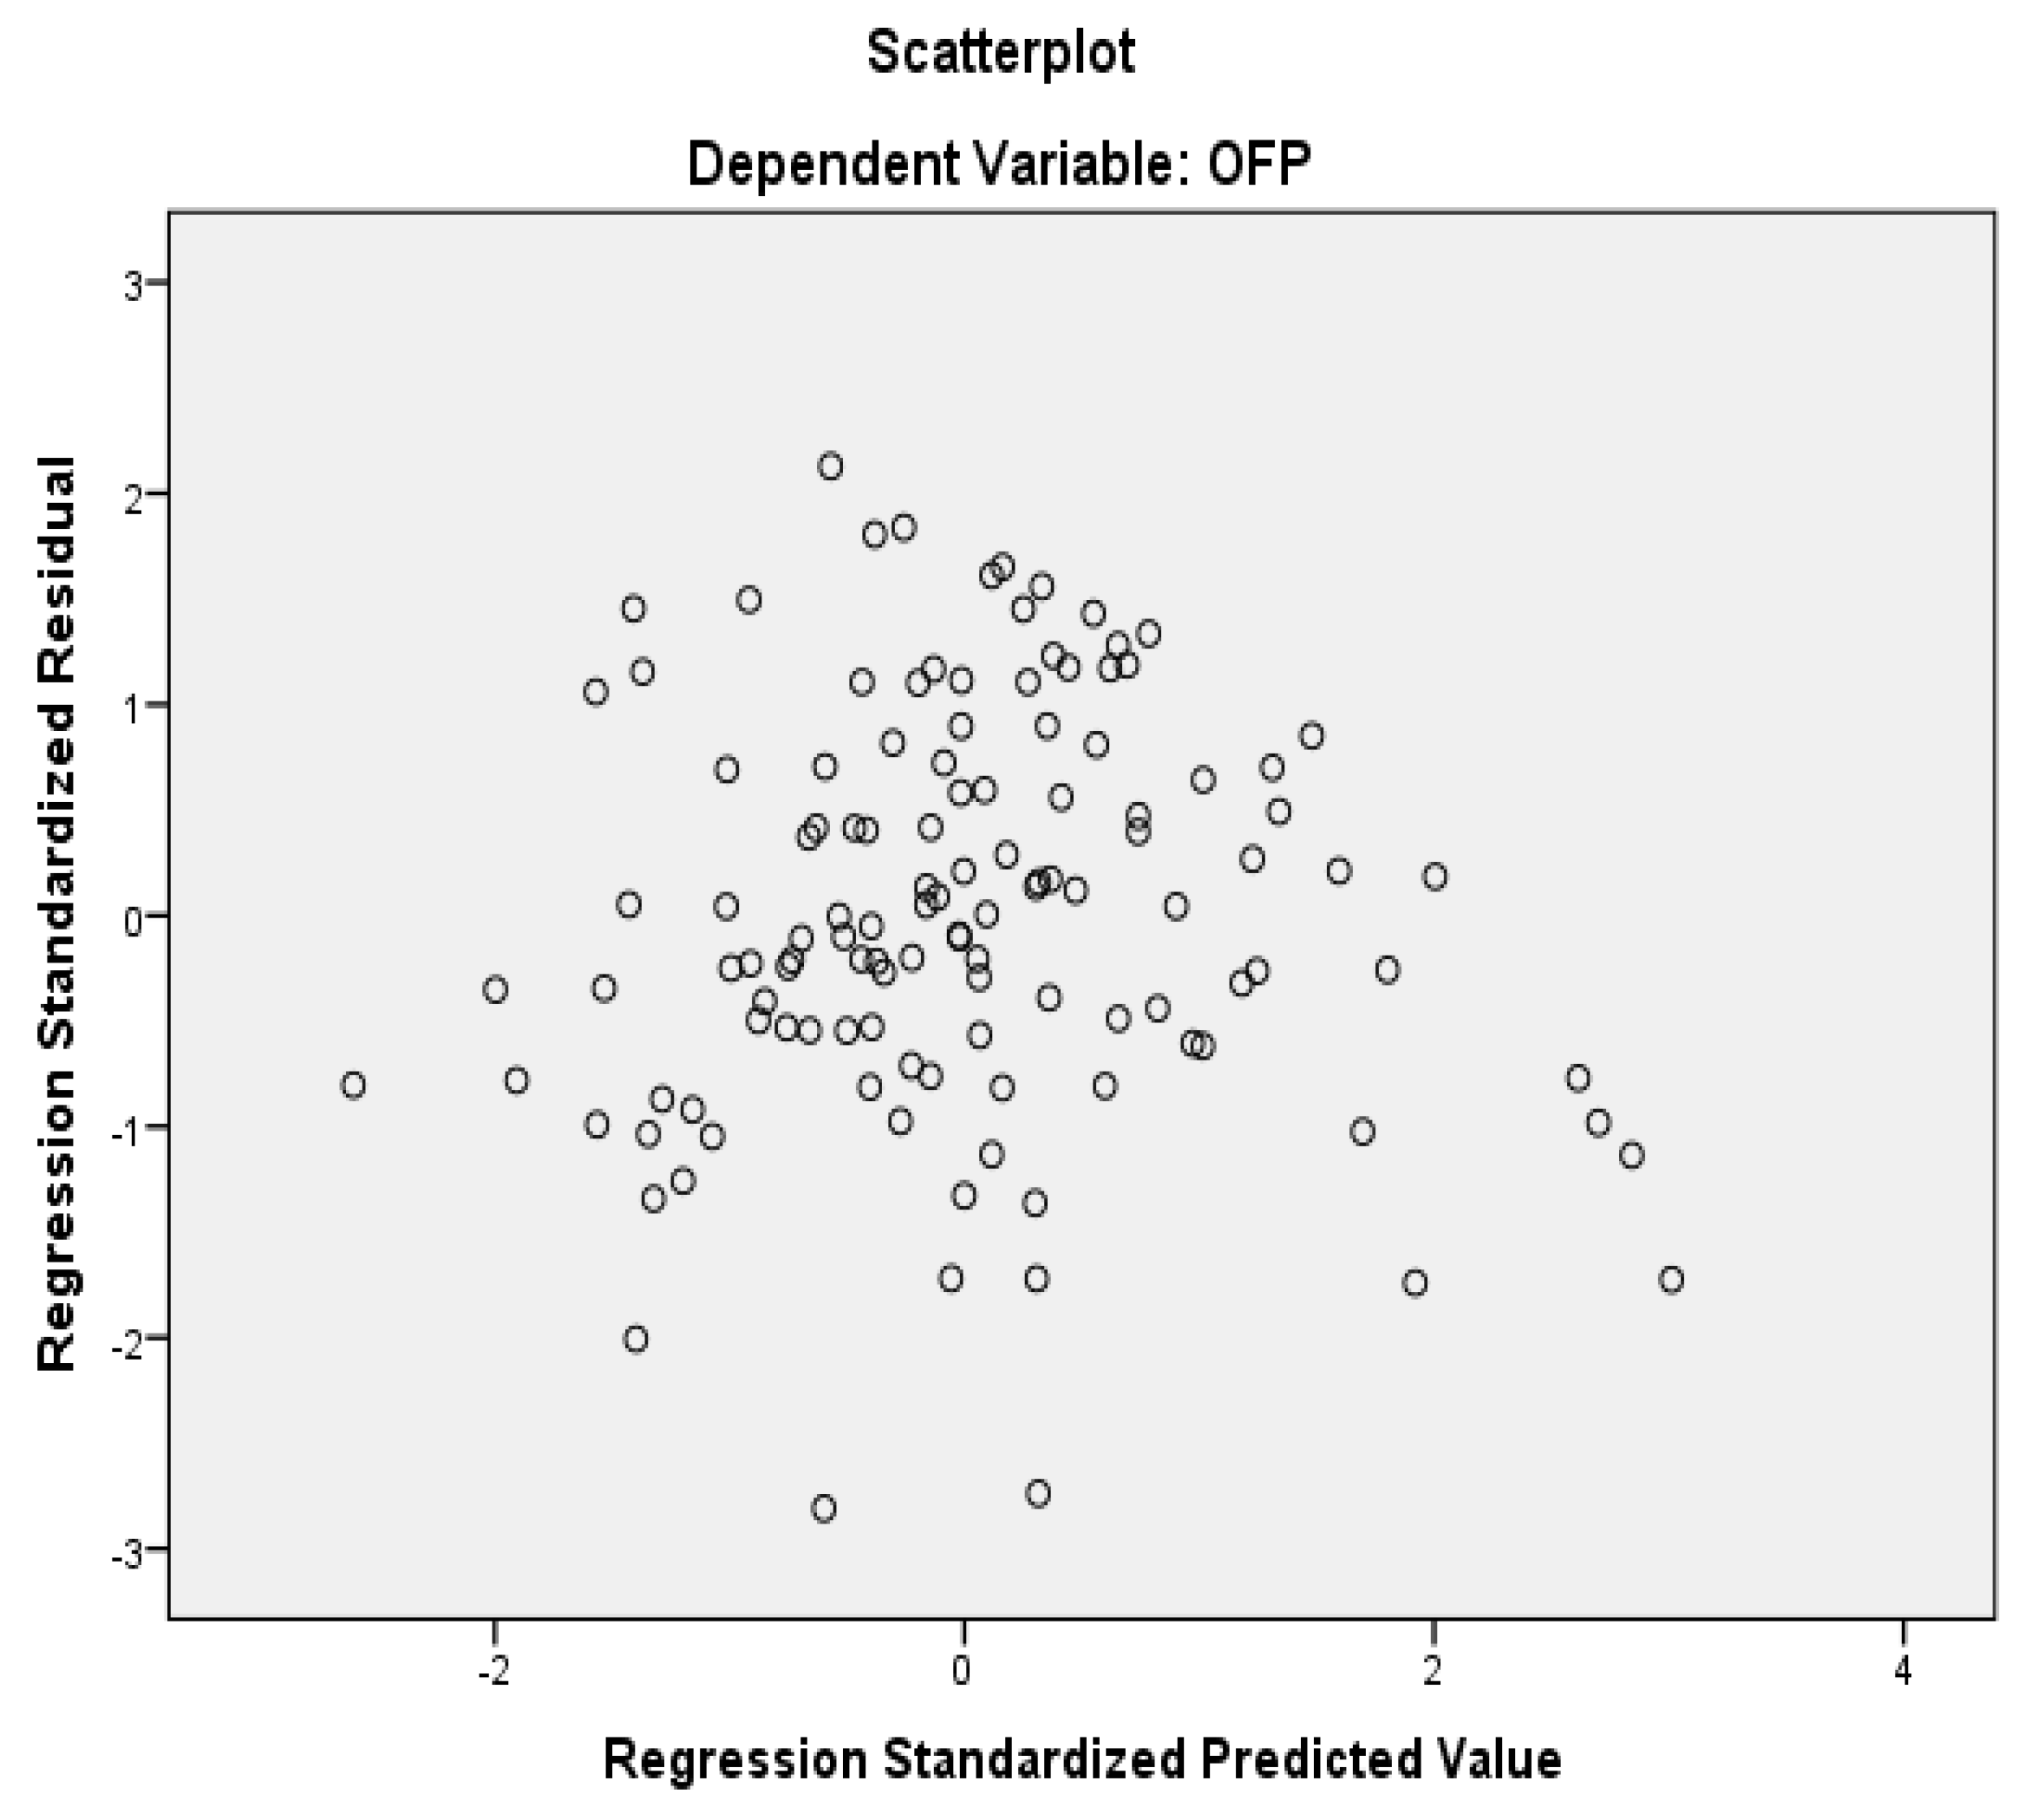
- Heteroscedasticity test to check non-constant variance.


References
- Agarwal, Sumit, Chunlin Liu, and S. Ghon Rhee. 2008. Investor Demand for IPOs and Aftermarket Performance: Evidence from the Hong Kong Stock Market. Journal of International Financial Markets, Institutions and Money 18: 176–90. [Google Scholar] [CrossRef] [Green Version]
- Aggarwal, Rajesh, Sanjai Bhagat, and Srinivasan Rangan. 2009. The Impact of Fundamentals on IPO Valuation. Financial Management 38: 253–84. [Google Scholar] [CrossRef] [Green Version]
- Agostino, Mariarosaria, Danilo Drago, and Damiano B. Silipo. 2011. The value relevance of IFRS in the European banking industry. Review of Quantitative Finance and Accounting 36: 437–57. [Google Scholar] [CrossRef]
- Al-Shubiri, Faris Nasif. 2013. Analysis of the relationship between economic forces and abnormal stock return: Empirical evidence. Polish Journal of Management Studies 8: 7–15. [Google Scholar]
- Ande, Diin Fitri, and Harsono Yoewono. 2018. The Effect of Financial Performance and Financial Distress Indicators to the Stock Price of Bank Rakyat Indonesia. International Journal of Business Studies 2: 1–15. [Google Scholar] [CrossRef] [Green Version]
- Andriantomo, and Fr. Ninik Yudianti. 2013. The Value Relevance of Accounting Information at Indonesia Stock Exchange. Paper presented at the 2013 IBEA, International Conference on Business, Economics, and Accounting, Bangkok, Thailand, March 20–23. [Google Scholar]
- Asif, Muhammad, Muhammad Ali Jinnah, and Kashif Arif. 2016. Impact of Accounting Information on Share Price: Empirical Evidence from Pakistan Stock Exchange. International Finance and Banking 3: 124–35. [Google Scholar] [CrossRef]
- Avci, Sureyya Burcu. 2021. IPO Valuation and IPO Inter-Industry Effects. Journal of Research in Economics Politics and Finance 6: 418–38. [Google Scholar] [CrossRef]
- Ball, Ray, and Philip Brown. 1968. An Empirical Evaluation of Accounting Income Numbers. Journal of Accounting Re- Search 6: 159–78. [Google Scholar] [CrossRef] [Green Version]
- Bankole, Kayode Oluwadamilare, and Isreal Omohefe Ukolobi. 2020. Value Relevance of Accounting Information and Share Price in Financial Service Industry. Research Journal of Finance and Accounting 11: 140–51. [Google Scholar] [CrossRef]
- Barniv, Ran, and Mark Myring. 2006. An international analysis of historical and forecast earnings in accounting-based valuation models. Journal of Business Finance Accounting 33: 1087–109. [Google Scholar] [CrossRef]
- Beatty, Randolph, Susan Riffe, and Rex Thompson. 2000. IPO Pricing with Accounting Information. Dallas: Southern Methodist University. [Google Scholar]
- Berkman, Henk, Michael E. Bradbury, and Jason Ferguson. 2000. The accuracy of price-earnings and discounted cash flow methods of IPO equity valuation. Journal of International Financial Management and Accounting 11: 71–83. [Google Scholar] [CrossRef]
- Bhabra, Harjeet S., and Richard H. Pettway. 2003. IPO prospectus information and subsequent performance. The Financial Review 38: 369–97. [Google Scholar] [CrossRef]
- Brau, James C., and Stanley E. Fawcett. 2006. Initial public offerings: An analysis of theory and Practice. SSRN Electronic Journal 61: 399–436. [Google Scholar] [CrossRef] [Green Version]
- Bünyamin ER. 2012. The Accuracy of Price-Earnings Ratio and Discounted Cash Flow Methods in Predicting the Offer Price of IPO Stocks. International Research Journal of Finance and Economics 97: 27–31. [Google Scholar]
- Cacheche, Loide Priscila, João Almeida Santos, Eduardo Biagi Almeida Santos, and Getulio Akabane. 2015. Small investors: Challenges and benefits of IPO—A case study in a small business in the region of the capao Redondo—SP. Independent Journal of Management & Production 6. [Google Scholar] [CrossRef]
- Canbaş, S., S. Y. Kandir, and A. Erişmiş. 2007. Testing Some Company Features Affecting Stock Yield in ISE Companies. Journal of Finance, Political and Economic Comments 44: 15–27. [Google Scholar]
- Chen, Jiun-Lin, Shih-Cheng Lee, and Chien-Ting Lin. 2017. Investment Horizons, systematic risk, and managerial skills of institutional investors. SSRN Electronic Journal, 1–50. [Google Scholar] [CrossRef]
- Chiang, Yao-Min, David Hirshleifer, Yiming Qian, and Ann Sherman. 2009. Learning to Fail? Evidence from Frequent IPO Investors. Munich Personal RePEc Archive, MPRA Paper 16854. Munich: University Library of Munich. [Google Scholar]
- Choudhary, Sangita. 2017. Equity Investment Decisions: Determinants for Retail Investors. Jindal Journal of Business Research 5: 1–14. [Google Scholar] [CrossRef]
- Clarke, Jonathan, Arif Khurshed, Alok Pande, and Ajai K. Singh. 2016. Sentiment Traders & IPO initial returns: The Indian evidence. Journal of Corporate Finance 37: 24–37. [Google Scholar] [CrossRef]
- Cogliati, Giordano, Stefano Paleari, and Silvio Vismara. 2011. IPO Pricing: Growth Rates Implied in Offer Prices. Annals of Finance 7: 53–82. [Google Scholar] [CrossRef] [Green Version]
- Dhall, Harmohan Singh, and Sukhdev Singh. 2017. Pricing Determinants of selected Fixed Price IPOs issued in India. IOSR Journal of Business and Management 19: 113–21. [Google Scholar] [CrossRef]
- Dhandayuthapani, S. P., and S. Ravindar. 2019. Indian Investors and IPO’S. International Journal for Research in Applied Science and Engineering Technology 7: 2093–97. [Google Scholar] [CrossRef]
- Dolvin, Steven D., and Mark K. Pyles. 2007. Seasonal affective disorder and the pricing of ipos. Review of Accounting and Finance 6: 214–28. [Google Scholar] [CrossRef] [Green Version]
- Ferraro, Olga. 2020. A brief overview of the IPO valuation methods. International Journal of Business and Management 15: 41–50. [Google Scholar] [CrossRef]
- Firth, Michael, and Oliver M. Rui. 2008. Ownership, governance mechanisms, and agency costs in China’s listed firms. Journal of Asset Management 9: 90–101. [Google Scholar] [CrossRef]
- Firth, Michael, Yue Li, and Steven Shuye Wang. 2008. Valuing IPOs using price-earnings multiples disclosed by IPO firms in an emerging capital market. Review of Pacific Basin Financial Markets and Policies 11: 429–63. [Google Scholar] [CrossRef]
- Francis, Jennifer, and Katherine Schipper. 1999. Have financial statements lost their relevance? Journal of Accounting Research 37: 319–52. [Google Scholar] [CrossRef]
- Fraz, Ahmad, and Arshad Hassan. 2017. Stock Price Synchronicity and Information Environment. Business & Economic Review 9: 215–34. [Google Scholar] [CrossRef]
- Glezakos, Michalis, John Mylonakis, and Charalampos Kafouros. 2012. The Impact of Accounting Information on Stock Prices: Evidence from the Athens Stock Exchange. International Journal of Economics and Finance 4: 56–68. [Google Scholar] [CrossRef]
- Gujarati, Damodar N., and Dawn C. Porter. 2009. Basic Econometrics. Boston: McGraw-Hill/Irwin. 922p. [Google Scholar]
- Halonen, Elisa, Jelena Pavlovic, and Rickard Persson. 2013. Value relevance of accounting information and its impact on stock prices: Evidence from Sweden. Journal of Contemporary Accounting and Economics 9: 47–59. [Google Scholar]
- Haque, Samina, and Murtaza Faruquee. 2013. Impact of fundamental factors on stock price: A case based approach on pharmaceutical companies listed with Dhaka stock exchange. International Journal of Business and Management Invention 2: 34–41. [Google Scholar]
- Hedau, Amit. 2016. IPO Pricing—Evidence from Indian Capital Market. Asian Journal of Management Research 7: 104–14. [Google Scholar]
- Hendricks, Lutz. 2015. Accounting for Changing Returns to Experience. CFS Working Paper 558. Frankfurt: Goethe University. [Google Scholar] [CrossRef] [Green Version]
- Houston, Joel, Christopher James, and Jason Karceski. 2006. What a difference a month makes: Stock analyst valuations following initial public offerings. Journal of Financial and Quantitative Analysis 41: 111–38. [Google Scholar] [CrossRef]
- Hove, Kudakwashe, Twoboy Shoko, Jonathan Shoko, Stanfford Dumisile Gobodi Dube, and Thabani Nyoni. 2020. Correlation between Stock Price and Financial Performance of ZSE Quoted Banking Financial Institutions. EPRA International Journal of Economics, Business and Management Studies 7: 28–42. [Google Scholar]
- Kim, Moonchul, and Jay R. Ritter. 1999. Valuing IPOs. Journal of Financial Economics 53: 409–37. [Google Scholar] [CrossRef]
- Klein, April. 1996. Can Investors Use the Prospectus to Price Initial Public Offerings. The Journal of Financial Statement Analysis 2: 23–39. [Google Scholar]
- Kousenidis, Dimitrios V., Anestis C. Ladas, and Christos I. Negakis. 2014. Accounting conservatism quality of accounting information and crash risk of stock prices. The Journal of Economic Asymmetries 11: 120–37. [Google Scholar] [CrossRef]
- Kaustia, Markku, and Samuli Knüpfer. 2008. Do investors overweight personal experience? Evidence from IPO subscriptions. The Journal of Finance 63: 2679–2702. [Google Scholar] [CrossRef] [Green Version]
- Khan, Muhammad Nauman, and Amanullah. 2012. Determinants of share prices at Karachi stock exchange. International Journal of Business & Management Studies 4: 1309–47. [Google Scholar]
- Kraus, Kalle, and Torkel Strömsten. 2012. Going public: The role of accounting and shareholder value in making sense of an IPO. Management Accounting Research 23: 186–201. [Google Scholar] [CrossRef]
- Ljungqvist, Alexander, Vikram Nanda, and Rajdeep Singh. 2006. Hot markets, investor sentiment, and IPO pricing. The Journal of Business 79: 1667–702. [Google Scholar] [CrossRef] [Green Version]
- Modi, Swati, and Bharti V. Pathak. 2014. A Study on Value Relevance of Accounting Information in Indian Stock Market: The Case of Auto Sector. The International Journal of Business & Management 2: 166–80. [Google Scholar]
- Mohanty, P. K. 2012. Relevance of Accounting Numbers: An Empirical Analysis of the IT and Steel Sector. Journal of Arts, Humanities & Management 1: 18–30. [Google Scholar]
- Mohd-Rashid, Rasidah, Mansur Masih, Ruzita Abdul-Rahim, and Norliza Che-Yahya. 2018. Does prospectus information matter in IPO pricing? Journal of Islamic Accounting and Business Research 9: 514–30. [Google Scholar] [CrossRef]
- Narullia, Dwi, and Bambang Subroto. 2018. Value Relevance of Accounting Information and Corporate Social Responsibility in Indonesia and Singapore. Jurnal Aplikasi Manajemen 16: 9–19. [Google Scholar] [CrossRef] [Green Version]
- Navyatha, K., and Gaddam Naresh Reddy. 2022. Factors Influencing the IPOs’ Pricing in India. International Journal of Advance Research and Innovative Ideas in Education 8: 89–98. [Google Scholar]
- Nooney, Lenin Kumar, and Bakhtawar Durrani. 2016. EPS and Financial Performance Relationship Analysis of selected banks in Oman. International Journal of Academic Research 3: 1–11. [Google Scholar]
- Ohlson, James A. 1995. Earnings, Book Values, and Dividends in Security Valuation. Contemporary Accounting Research 11: 661–87. [Google Scholar] [CrossRef]
- Ong, Chui Zi, Rasidah Mohd-Rashid, and Kamarun Nisham Taufil-Mohd. 2020. Leverage and IPO pricing: Evidence from Malaysia. International Journal of Banking and Finance 15: 1–19. [Google Scholar] [CrossRef]
- Ormiston, Jarrod, Kylie Charlton, M. Scott Donald, and Richard G. Seymour. 2015. Overcoming the challenges of impact investing: Insights from leading investors. Journal of Social Entrepreneurship 6: 352–78. [Google Scholar] [CrossRef]
- Ozlen, Serife. 2014. The Effect of Company Fundamentals on Stock Values. European Researcher 71: 595–602. [Google Scholar] [CrossRef]
- Purnanandam, Amiyatosh K., and Bhaskaran Swaminathan. 2004. Are ipos really underpriced? Review of Financial Studies 17: 811–48. [Google Scholar] [CrossRef]
- Reddy, R. Jayaprakash, and P. K. Hridhya. 2020. Source of information and investment decision by individual investors—A review of literature. Journal of Emerging Technologies and Innovative Research (JETIR) 7: 253–58. [Google Scholar]
- Roosenboom, Peter. 2010. How do underwriters value initial public offerings? An empirical analysis of the french IPO market. Contemporary Accounting Research 24: 1217–43. [Google Scholar] [CrossRef] [Green Version]
- Rusdiyanto, Rusdiyanto, Indra Prasetyo, Nabilah Aliyyah, and Diah Rani Nartasar. 2021. Impact Financial Performance to Stock Prices: Evidence from Indonesia. Journal of Legal, Ethical and Regulatory Issues 24. [Google Scholar] [CrossRef]
- Sahni, Deepak, and Soniya Mehandiratta. 2013. A Study on the Factors Affecting Pricing of India’s Ten Largest IPO’s. ZENITH International Journal of Business Economics & Management Research 3: 110–22. [Google Scholar]
- Sahoo, Seshadev, and Prabina Rajib. 2012. Determinants of Pricing IPOs: An Empirical Investigation. South Asian Journal of Management 19: 59–87. [Google Scholar]
- Scott, W. R. 2003. Financial Accounting Theory. The International Journal of Accounting 39: 431–34. [Google Scholar]
- Sharma, Anil Kumar, Satish K., and Ramanjeet Singh. 2012. Value relevance of financial reporting and its impact on stock prices: Evidence from India. South Asian Journal of Management 19: 60–77. [Google Scholar]
- Shehzad, Khurram, and Aisha Ismail. 2014. Value relevance of accounting information and its impact on stock prices: Case study of listed banks at Karachi Stock Exchange. Journal of Economic Info 1: 6–9. [Google Scholar] [CrossRef]
- Shenoy, Smitha, and Srinivasan Kannan. 2018. Relationship of IPO Issue Price and Listing Day Returns with IPO Pricing Parameters. International Journal of Management Studies 5: 11–22. [Google Scholar] [CrossRef]
- Singh, Mahavir. 2012. Investor’s perception on initial public offering (IPO). International Journal of Computing and Business Research 3: 1–21. [Google Scholar]
- Tambun, Sihar, Etty Murwaningsari, and Sekar Mayangsari. 2018. The Effect of Accounting Information on Stock Price Predictions through Fluctuation of Stock Price: Evidence from Indonesia. Journal of Accounting, Business and Finance Research 4: 20–27. [Google Scholar] [CrossRef] [Green Version]
- Tiron-Tudor, Adriana, and Andra Maria Achim (Nasca). 2019. Accounting quality and stock price informativeness: A cross-country study. Economic Research-Ekonomska Istraživanja 32: 2481–99. [Google Scholar] [CrossRef] [Green Version]
- Viet Ha, Hoang Thi, Dang Ngoc Hung, and Dung Manh Tran. 2018. Impact of Accounting Data on Stock Prices: The Case of Vietnam. International Journal of Accounting and Financial Reporting 8: 140–54. [Google Scholar] [CrossRef]
- Willenborg, Michael, Biyu Wu, and Yanhua Sunny Yang. 2015. Issuer operating performance and IPO price formation. Journal of Accounting Research 53: 1109–49. [Google Scholar] [CrossRef]
- Uwuigbe, Uwalomwa, Jimoh Jafaru, and Anijesushola Ajayi. 2012. Dividend Policy and Firm Performance: A Study of Listed Firms in Nigeria. Journal of Accounting and Management Information Systems 11: 442–54. [Google Scholar]
- Yu, Wei, and Dengshi Huang. 2005. Multifractal analysis of SSEC in Chinese stock market: A different empirical result from Heng Seng index. Physica A 355: 497–508. [Google Scholar] [CrossRef]

| Mainboard IPOs issued in India from FY 2015–16 to FY 2020–21. (Mainboard IPOs are the IPOs listed in stock exchange with the condition that the face value of the post-IPO paid-up capital should be a minimum of Rs 10 crore) | 141 |
| Firms that have begun their IPOs but could not get listed on stock exchange. | 04 |
| Eliminated IPO issuing firms whose complete dataset for this study was not available. | 15 |
| Total number of IPO firms included in the study as research sample | 122 |
| Response Variable | Notation | Data Source |
|---|---|---|
| Offer Price: The price at which shares of a firm that will become public are offered to the general public. Log transformation for offer prices was used in present study. | OFP | NSE Database |
| Explanatory Variables | ||
| Net Asset Value per share: A company’s net asset value is derived by dividing its net worth by its common shares. | NAV | R.H.P. |
| Return on Assets: This describes the earnings of a firm as a percentage of assets. | ROA | R.H.P. |
| Earnings Per Share (W.Avg): The profitability metric represents how much net profit can be allocated to each outstanding share of common stock. | EPS | R.H.P. |
| Profit after Tax: An organization’s net profit after tax is defined as Revenue altogether with other incomes less entirely cost with taxes. | PAT | R.H.P. |
| Industry P/E Ratio: It is a measure of the average price earnings ratio across all publicly traded companies in a particular industry peer set. | IPE | R.H.P. |
| Return on Net Worth (W.Avg): This metric refers to the amount of earnings earned by a corporation solely from the sheer strength of its shareholders’ equity. | RONW | R.H.P. |
| Control Variables | ||
| Shares Offered: The number of shares offered in an IPO to the general public. Log transformation for shares offered was used in present study. | OFS | R.H.P. |
| Age of the Firm: Log value of number of years since incorporation of the company until its public listing. | AGE | Authors’ Calculations |
| Observations | Minimum | Maximum | Mean | Std. Deviation | |
|---|---|---|---|---|---|
| OFP | 122 | 2.78 | 4.04 | 3.53 | 0.30 |
| NAV | 122 | 7.62 | 329.73 | 81.45 | 60.48 |
| ROA | 122 | −4.15 | 34.39 | 7.05 | 6.99 |
| EPS | 122 | −22.13 | 51.69 | 11.04 | 10.69 |
| PAT | 122 | −127.46 | 3127.67 | 210.53 | 400.69 |
| IPE | 122 | 1.60 | 636.71 | 51.63 | 65.59 |
| RONW | 122 | −23.78 | 225.01 | 20.26 | 24.62 |
| OFS | 122 | 6.72 | 9.40 | 8.19 | 0.44 |
| AGE | 122 | 1.00 | 2.93 | 2.21 | 0.31 |
| OFP | NAV | ROA | EPS | PAT | IPE | RONW | OFS | AGE | |
|---|---|---|---|---|---|---|---|---|---|
| OFP | 1 | ||||||||
| NAV | 0.502 ** | 1 | |||||||
| ROA | 0.331 ** | −0.052 | 1 | ||||||
| EPS | 0.558 ** | 0.586 ** | 0.441 ** | 1 | |||||
| PAT | 0.275 ** | 0.200 * | 0.084 | 0.454 ** | 1 | ||||
| IPE | 0.019 | −0.043 | −0.039 | −0.109 | −0.067 | 1 | |||
| RONW | 0.283 ** | −0.101 | 0.323 ** | 0.320 ** | 0.277 ** | −0.086 | 1 | ||
| OFS | −0.423 ** | −0.164 | −0.323 ** | −0.247 ** | 0.347 ** | 0.010 | −0.144 | 1 | |
| AGE | 0.115 | 0.244 ** | 0.062 | 0.258 ** | 0.136 | 0.075 | 0.052 | −0.159 | 1 |
| OFP (the Response Variable) | |
|---|---|
| EPS | 0.558 ** |
| NAV | 0.502 ** |
| ROA | 0.331 ** |
| RONW | 0.283 ** |
| PAT | 0.275 ** |
| OFS | −0.423 ** |
| AGE | 0.115 |
| IPE | 0.019 |
| Explanatory Variables | Coefficients (Beta) | t-Statistics | Significance (p-Value) |
|---|---|---|---|
| (Constant) | 21.638 | 0.000 | |
| NAV | 0.494 | 4.887 | 0.000 |
| ROA | 0.252 | 2.872 | 0.005 |
| EPS | 0.083 | 0.666 | 0.506 |
| PAT | 0.073 | 0.907 | 0.366 |
| IPE | 0.087 | 1.244 | 0.216 |
| RONW | 0.216 | 2.698 | 0.008 |
| AGE | −0.070 | −0.965 | 0.337 |
| Explanatory Variables | Coefficients (Beta) | t-Statistics | Significance (p-Value) |
|---|---|---|---|
| (Constant) | 11.629 | 0.000 | |
| NAV | 0.431 | 4.645 | 0.000 |
| ROA | 0.175 | 2.133 | 0.035 |
| EPS | −0.038 | −0.330 | 0.742 |
| PAT | 0.287 | 3.307 | 0.001 |
| IPE | 0.076 | 1.186 | 0.238 |
| RONW | 0.154 | 2.070 | 0.041 |
| OFS | −0.384 | −4.767 | 0.000 |
| Explanatory Variables | Coefficients (Beta) | t-Statistics | Significance (p-Value) |
|---|---|---|---|
| (Constant) | 11.470 | 0.000 | |
| NAV | 0.446 | 4.823 | 0.000 |
| ROA | 0.170 | 2.088 | 0.039 |
| EPS | −0.024 | −0.208 | 0.836 |
| PAT | 0.302 | 3.498 | 0.001 |
| IPE | 0.088 | 1.378 | 0.171 |
| RONW | 0.153 | 2.069 | 0.041 |
| AGE | −0.118 | −1.764 | 0.080 |
| OFS | −0.404 | −5.013 | 0.000 |
| Hypothesis | Result |
|---|---|
| H1: There exists a significant positive relationship between Net Asset Value and IPO Offer Price. | Accept |
| H2: There exists a significant positive relationship between Return on Assets and IPO Offer Price. | Accept |
| H3: There exists a significant positive relationship between EPS and IPO Offer Price. | Reject |
| H4: There is a positive relationship between Profit after tax and IPO Offer Price | Accept |
| H5: There is a positive relationship between Industry P/E and IPO Offer Price. | Reject |
| H6: There is a positive relationship between Return on Net Worth and IPO Offer Price. | Accept |
Disclaimer/Publisher’s Note: The statements, opinions and data contained in all publications are solely those of the individual author(s) and contributor(s) and not of MDPI and/or the editor(s). MDPI and/or the editor(s) disclaim responsibility for any injury to people or property resulting from any ideas, methods, instructions or products referred to in the content. |
© 2023 by the authors. Licensee MDPI, Basel, Switzerland. This article is an open access article distributed under the terms and conditions of the Creative Commons Attribution (CC BY) license (https://creativecommons.org/licenses/by/4.0/).
Share and Cite
Yadav, A.; Prosad, J.M.; Singh, S. Pre-IPO Financial Performance and Offer Price Estimation: Evidence from India. J. Risk Financial Manag. 2023, 16, 135. https://doi.org/10.3390/jrfm16020135
Yadav A, Prosad JM, Singh S. Pre-IPO Financial Performance and Offer Price Estimation: Evidence from India. Journal of Risk and Financial Management. 2023; 16(2):135. https://doi.org/10.3390/jrfm16020135
Chicago/Turabian StyleYadav, Ajay, Jaya Mamta Prosad, and Sumanjeet Singh. 2023. "Pre-IPO Financial Performance and Offer Price Estimation: Evidence from India" Journal of Risk and Financial Management 16, no. 2: 135. https://doi.org/10.3390/jrfm16020135