Article

The Effect of CDS Trading on Product Market Competition: Evidence from 10-K Filings

1
Holzschuh College of Business Administration, Niagara University, Lewiston, NY 14109, USA
2
Sobey School of Business, Saint Mary’s University, Halifax, NS B3H 3C3, Canada
3
Desautels Faculty of Management, McGill University, Montreal, QC H3A 1G5, Canada
*
Author to whom correspondence should be addressed.
J. Risk Financial Manag. 2023, 16(3), 207; https://doi.org/10.3390/jrfm16030207
Submission received: 12 February 2023 / Revised: 10 March 2023 / Accepted: 16 March 2023 / Published: 22 March 2023
(This article belongs to the Special Issue Advances in Corporate Finance and Financial Management)

Abstract

:
This paper examines how the initiation of credit default swap (CDS) trading affects the product market competition faced by the referenced firms in the US. The trading of CDS provides an avenue for creditors to hedge default risks, thereby weakening the incentives to monitor the borrowers. Our paper shows that the trading of CDS increases firm-level product market competition because a reduced creditor monitoring effect can lead to growing shareholder demand for information disclosure, revealing strategic information that may undermine the product market competency of the firm when disclosed. While prior literature shows that CDS-traded firms increase both the likelihood and frequency of earnings forecasts as a direct response to shareholder demand, we observe that firms made their mandatory disclosure (i.e., Form 10-K) less readable as a potential way to reduce strategic disclosure. We also find that the presence of institutional investors generally reduces a firm’s competition, but this positive effect is overturned in the presence of CDS trading.

1. Introduction

This paper explores the impact of credit default swap (CDS) trading on a firm’s forward-looking competitive threat in the product market. It also examines whether managers adjust the language in annual reports, such as readability and tone in Form 10-K, to affect information processing costs and escape potential competition. The introduction of CDS has revolutionized the debt market by enabling the transfer of credit risks without transferring ownership rights (Marsh 2006; Stulz 2010; Parlour and Winton 2013). This new instrument provides a way for investors to hedge credit risk, leading to increased liquidity and flexibility in the financial market (Greenspan 2004). Sufi (2007) shows that loan contracts depend heavily on information collection and monitoring by creditors. The onset of CDS trading will inevitably impact lenders’ incentives to monitor borrowers’ actions or demand information due to a dilution of risks associated with debt ownership (Pennacchi 1988; Gorton and Pennacchi 1995).
Firm managers generally hold a superior information advantage over outsiders about the true performance of the firm. Kim et al. (2018) document that a reduced creditor incentive to monitor the borrower after CDS trading initiation can lead to shareholders demanding more information from the management. They show that managers increase both the likelihood and the frequency of earnings forecasts. Equivalently, Vashishtha (2014) finds that shareholders reduce their demand for voluntary disclosure when creditors increase monitoring intensity after violations of debt covenants. However, a firm’s product market is tightly linked to the information environment since proprietary and strategic information allows firms to retain their competitive advantage in the long run (Graham et al. 2005). This disincentive to disclose information by firms is documented by the prior literature as the proprietary cost hypothesis. Another study by Li (2010) also shows how competitive threats may significantly impact both the quality and quantity of a firm’s disclosure.
Our paper first predicts that the initiation of CDS trading increases firm-level product market competition because reduced monitoring from creditors leads to increased shareholder demand for more information disclosure, thereby revealing strategic information that may undermine the competitive advantages of the firm. Using textual-based firm-level measures for competitive threats recently developed by Hoberg et al. (2014) and Li et al. (2013), we present evidence that the onset of CDS trading leads to bigger competitive threats faced by the referenced firm. The potential disclosure of additional proprietary and strategic information can be detrimental to the prospects of the firms, which is likely reflected by managers in the qualitative statements that discuss a firm’s current as well as forward-looking competition landscape.
A priori, there exists tension regarding whether CDS trading also affects mandatory disclosure. While prior literature documents a positive correlation between CDS trading initiation and voluntary disclosure, few have looked explicitly at the disclosure of soft information. With heightened investor demand for information following CDS initiation, firms have the option of either providing more disclosure in annual reports to complement voluntary disclosure or strategically increasing information processing costs by making information less accessible to competitors. The latter is possible because managers have considerable latitude in shaping the content of qualitative information. Empirically, we find evidence that firms made their mandatory disclosure (i.e., Form 10-K) less readable, potentially as a strategy to increase information opacity to escape competition.
In this paper, we also investigate the role of institutional holdings. Institutional investors are sophisticated larger stakeholders who might take over the monitoring role of the creditors after CDS initiation (Chung et al. 2002). Prior literature has also documented that institutional investors can effectively reduce the opportunistic behavior of firms (Bushee 1998; Hartzell and Starks 2003). Institutional presence may partially alleviate the concern of managers expropriating the shareholders due to information asymmetry and, hence, lead to reduced demand for information disclosure from the shareholders. We first observe that the presence of high institutional holdings per se reduces competition. However, at the onset of CDS trading, the presence of high institutional holdings appears to heighten competitive threats even more. This interesting observation may be ascribed to institutional investors, who have substantial ownership stakes, demanding even more information transparency after CDS initiation (Boone and White 2015; Bird and Karolyi 2016). Arguably, the potential positive moderating effect from the shifting of the monitoring role to institutional investors appears to be entirely offset by the additional demand for disclosure.
Our study makes several important contributions to the literature. To the best of our knowledge, we are the first to provide explicit evidence of a relation between firm-level product market competition and the trading of CDS for the referenced firms. Our paper also fills the gap in the literature regarding the consequences of the CDS trading and the determinants of information disclosure as well as the interactive role of institutional investors in shaping a firm’s disclosure strategy in the product market. Finally, we complement the existing literature that examines the general impact of CDS market development. The empirical findings of this paper potentially provide valuable policy implications for security regulation, particularly with regard to the information disclosure mechanism of firms in both CDS- and non-CDS-traded markets around the world.
The rest of the paper is organized as follows: Section 2 reviews the existing literature and develops our hypotheses. Section 3 explains the process of our sample construction and empirical designs. Section 4 discusses the main results. Section 5 concludes.

2. Literature and Hypotheses Development

2.1. CDS and Monitoring

The innovation of credit default swaps has provided an additional avenue for debt market investors to hedge credit risk exposure. However, being able to hedge credit risk also means that lenders have weaker incentives to monitor their borrowers (Morrison 2005; Ashcraft and Santos 2009; Shan et al. 2019). Prior literature has also documented the “empty creditor problem,” in which lenders could push borrowers into inefficient bankruptcy or liquidation since lenders may be more reluctant to restructure a distressed debt (Hu and Black 2008; Bolton and Oehmke 2011).
In traditional loans, creditors will naturally have the incentives to monitor the debtors to avoid any unnecessary default or financial distress. In the case of a syndicated loan, however, the lead arranger, has an incentive to overstate the quality of the syndicated loan and shirk its monitoring role. Therefore, the lead arranger banks in loan syndication will typically retain a larger share of the loan and perform intense monitoring and due diligence of the debtors (Sufi 2007). Nonetheless, CDS trading allows the lead arranger to hedge its credit risk and potentially reduces the effectiveness of using ownership as a means to reduce information asymmetry in a syndicated loan. Pennacchi (1988) and Gorton and Pennacchi (1995) show that by selling a portion of the loan in the secondary market, creditors experience a significant reduction in their incentives to monitor the debtors. Unlike the transfer of ownership rights when a loan is sold to another buyer, the resulting moral hazard problem is heightened when the availability of CDS allows for just the transfer of credit risks. Amiram et al. (2017) find that the initiation of CDS trading increases the share of loans retained by loan syndicate lead arrangers and increases loan spread, suggesting CDS initiation reduces the effectiveness of a lead arranger’s stake in the loan as a mechanism to address the adverse selection and moral hazard problems. Wong and Yu (2022) develop a theoretical model and predict that CDS trading expands debt capacity and allows firms to undertake more positive NPV projects. As a result, CDS firms tend to have more volatile equity returns than non-CDS firms.
Prior literature has also documented evidence that reduced monitoring induced by the transferring of credit risk through CDS can encourage risk-taking behavior. Ashcraft and Santos (2009) show that the borrowing cost increased for risky and informationally opaque firms after they were referenced in CDS contracts. Martin and Roychowdhury (2015) reveal that the initiation of CDS can lead to a decline in a firm’s reporting conservatism. Chen et al. (2019) find that boards offer pay packages for managers that encourage greater risk-taking to take advantage of the reduced creditor monitoring after CDS introduction. Chang et al. (2019) show that CDS trading allows firms to pursue more risky and original innovations by enhancing lenders’ risk tolerance and borrowers’ risk-taking.
As a result, the decreased monitoring from creditors and increased risk-taking behavior can motivate shareholders to request additional information disclosure. A recent study by Kim et al. (2018) argues that the initiation of CDS is associated with increased voluntary disclosures by managers. Similarly, Vashishtha (2014) finds that enhanced creditor monitoring leads to decreased corporate disclosure.
Based on prior studies that document an increased information disclosure from CDS-traded firms, we arrive at our first hypothesis:
H1. 
The initiation of CDS trading increases the competitive threats from rival firms.
This hypothesis is established on the ground that CDS trading leads to the disclosure of more proprietary and strategic information that is crucial to retaining the current competitive advantage of a firm (Graham et al. 2005). The advent of new forward-looking competition measures from Hoberg et al. (2014) and Li et al. (2013) allows us to delve into competitive landscapes at the firm level. In contrast, classical measures such as the market concentration ratio (CR) or the Herfindahl-Hirschman index (HHI) only capture competition at the industry level and rely on historical sales data.

2.2. Institutional Investors

While creditor monitoring is one channel that affects corporate governance, institutional monitoring is another prominent factor that limits potential agency problems within the firm. The presence of institutional monitoring can effectively reduce the opportunistic behavior of the firms (Bushee 1998; Hartzell and Starks 2003). The literature has also provided evidence on institutional investors’ monitoring and suggests that institutional ownership restrains earning management activities, improves corporate innovation, and drives corporate social responsibility (Dyck et al. 2019; Kim et al. 2019; Lel 2019; Lewellen and Lewellen 2022).
In the presence of institutional investors, other shareholders may freeride monitoring efforts and are less concerned about potential agency conflicts with the managers, and hence demand less information disclosure. The above argument leads to our second hypothesis:
H2a. 
The increase in competitive threats due to CDS trading is less pronounced in firms with a high institutional presence.
The intuition behind the hypothesis is that the presence of institutional investors will take over the monitoring of the creditors whose credit risks are hedged through CDS. It thus reduces additional demand for information disclosure from the general shareholders, since potential agency problems from CDS trading will be of less concern when institutional investors are expected to take over the monitoring role from creditors. Therefore, a firm may not experience increased competitive threats when it is no longer under shareholder pressure to disclose strategic information beyond an optimal level.
On the other hand, another stream of literature documents that institutional investors, usually with significant ownership stakes, may themselves demand greater disclosure from the firm.1 According to Healy et al. (1999), a rise in disclosure is associated with increased institutional ownership. Bird and Karolyi (2016) examine the impact of institutional ownership on a firm’s disclosure policy and document that firms with an exogenous increase in institutional ownership disclose longer 8-K filings together with more embedded graphics. Another study by Boone and White (2015) shows that firms with greater institutional presence tend to have a higher level of management disclosure and analyst following, leading to lower information asymmetry.
The above literature leads to our alternative hypothesis:
H2b. 
The increase in competitive threats due to CDS trading is more pronounced in firms with a high institutional presence.
While institutional investors may assume some of the monitoring roles from credit-hedged lenders leading to lower disclosure demand from the other general investors, they, as the shareholders with substantial ownership stakes, may demand additional disclosure from the firm.2

2.3. Delving into the Information Channel

Managers play a significant role in a firm’s disclosure policy. Several studies find that the management is more forthcoming in information disclosure when the performance of their firms is good (Lang and Lundholm 1993; Schrand and Walther 2000). Li (2008) finds that the linguistic features of annual reports and firm performance are highly correlated and that the readability of a firm’s disclosure can be a strategic feature used by managers. Common measures for readability include the Fog index, the length of 10-K annual reports, and the Flesch–Kincaid measure, which are reasonable proxies for the cost of processing information (Lehavy et al. 2011). While Kim et al. (2018) document that CDS trading leads to greater voluntary disclosure, it is still unclear how firms will change the linguistic features of mandatory reports. Earnings forecasts can be straightforward and relatively easy to interpret, but the disclosure of qualitative information may not be as forthright. It is possible that a firm attempts to offset the over-revelation of strategic information in voluntary disclosure by making other means of disclosure less accessible and more costly to process, to defend its advantageous competitive position. However, it will also be unsurprising if shareholders pressure firms to make information more accessible through mandatory annual filings to alleviate agency conflicts. This then leads to another set of competing hypotheses:
H3a. 
The initiation of CDS trading increases the readability of mandatory disclosures.
H3b. 
The initiation of CDS trading decreases the readability of mandatory disclosures.
Should H3a be supported, one may argue that the shareholders’ increasing demand for information in the post-CDS-trading period not only results in greater voluntary disclosure but also leads to more accessible information in annual reports (i.e., 10-K filings). If H3b is supported, one can argue that managers potentially make annual reports less readable in an attempt to hide strategic information. What we observe empirically may be a direct manifestation of changes in the competitive landscape after CDS initiation.

3. Materials and Methods

3.1. Sample Construction

We construct our initial sample by retrieving all firm-year observations from Compustat between 1994 to 2013 for the US public firms. We then identify the year of CDS initiation through CDS trading data from Datastream. Following prior literature, we define the earliest year in which a firm’s five-year-to-maturity CDS contract was traded as the CDS initiation year of that firm.3 The control group consists of firms without an initiation date and CDS-traded firms before CDS initiation.
Our primary measure of competition is the Fluidity variable, as constructed in Hoberg et al. (2014). Fluidity captures the variation in a firm’s product space with respect to the actions of its competitors. It is an ex-ante linguistic measure of threats in the product market. If there is a greater overlap between a firm’s products and the changes in its competitors’, the firm will be deemed to be facing stronger competition. We obtain Fluidity data from the Hoberg-Philips Data Library. We additionally use Pctcomp as an alternative measure of competition as constructed in Li et al. (2013) for robustness.4 Pctcomp measures the number of times competition-related words appear, which serves as an indication of competitive pressure faced by the firm from the perspective of the managers. Both measures of competition are based on the firm-level textual analysis of management’s disclosures in 10-K filings, whereas traditional measures such as the Herfindahl index (HHI) and market concentration ratios (CR) are industry-specific. Empirically, Fluidity and Pctcomp should capture greater variation in the product market space. Another advantage over traditional measures is that both consider competitive threats from non-public firms, which constitute a significant portion of the product market.
We first merge firm financial data from Compustat with the CDS initiation data from Datastream. We then supplement it with institutional holding data obtained from the SEC Form 13F. Following Li (2008), we use several readability measures, which include the Fog Index, the number of words, and the Flesch–Kincaid measure for 10-K filings. Following prior literature, we dropped utility and financial firms that start with a SIC code of 6 (i.e., 6000–6999) or have a SIC code between 4900 and 4949 (John et al. 2011; Landsman et al. 2023). Our final raw sample contains 65,762 firm-year observations between 1994 and 2013.5 Our sample size is further reduced to 51,043 and 26,379 firm-year observations after dropping firms with missing Fluidity and Pctcomp measures in some of our regression setups.

3.2. Empirical Design

Following Landsman et al. (2023), we estimate a linear regression model of competition measures against the dummy that denotes CDS trading (i.e., Tradedpost). This setup is essentially a version of the difference-in-difference research design, as in Bertrand and Mullainathan (2003), that controls for both firm and year fixed effects. We also control for lagged firm-specific characteristics in all our tests. More specifically, we test our first hypothesis by estimating the following regression model:
  C o m p e t i t i o n i , t = β 1 T r a d e d p o s t i , t + γ C o n t r o l s + F i x e d   E f f e c t s + e i , t
Fluidity captures the forward-looking competitive threat faced by the firm through the textual analysis of 10-K filings. We also use Pctcomp, which gauges the sentiment of the manager with regard to the competitive threats faced by the firm as a robustness check. To compare with the traditional measure of competition, we also test how CDS trading will affect lead market concentration (i.e., HHI). We define the Tradedpost dummy to be one for observations that occur in the year of CDS initiation or in years thereafter and zero otherwise. This main dummy indicates any firm-year observations with CDS trading. We also included firm and year fixed effects to capture group-wise unobserved time-invariant heterogeneity. Essentially, this is an alternative difference-in-differences model, as in Bertrand and Mullainathan (2003), because we cannot assign a specific date for the treatment (i.e., CDS initiation). Controls include common firm characteristics such as profitability (i.e., Roa), market capitalization (i.e., Size), dividend payout policy (i.e., Dividend), short-term liquidity (i.e., Cash), asset value to replacement cost (i.e., TobinsQ), and firm debt to equity ratio (i.e., DEratio). Appendix A Table A1 provides a comprehensive overview of the construction of all variables used in our analysis. To examine whether the presence of high institutional investors affects a firm’s competitive landscape, we estimate the following equations:
  C o m p e t i t i o n i , t = β 1 T r a d e d p o s t i , t + β 2 H i g h _ I n s t i , t 1 + β 3 H i g h _ I n s t i , t 1   ×   T r a d e d p o s t i , t + γ C o n t r o l s + F i x e d   E f f e c t s + e i , t
Model (2) modifies model (1) by adding an indicator of high institutional monitoring (i.e., High_Inst) and its interaction with the Tradedpost dummy. Unlike smaller retail traders in the secondary market, institutional investors typically need to file Form 13F with the SEC to disclose their respective holdings. We defined the High_Inst dummy to be one if a firm has a yearly average institutional ownership above the sample industry median, as it is likely that a certain threshold level of institutional presence may be required for effective involvement. Given that such a threshold may differ across industries, we also repeat the above regression using alternative measures, High_Inst(SIC2) and High_Inst(SIC3), which are dummies equal to one if a firm has a yearly average institutional ownership above its own 2- and 3-digit SIC industry median, respectively.
To test our third hypothesis, that CDS initiation may affect the disclosure of mandatory filings (i.e., Form 10-K), we estimate the following linear regression:
  R e a d a b i l i t y i , t = β 1 T r a d e d p o s t i , t + γ C o n t r o l s + F i x e d   E f f e c t s + e i , t
Following Li (2008), our main readability measure is the Fog Index, which estimates the number of years of education a person needs to understand the text on the first reading. We also include the Flesch–Kincaid index and the natural log of total words in Form 10-K as additional measures for readability. Following our baseline model (1), we include the same set of firm controls and fixed effects. While Kim et al. (2018) have shown that CDS trading increases both the likelihood and frequency of voluntary disclosure, the conclusion might not be equally straightforward regarding 10-K disclosures, according to the proprietary cost hypothesis.

4. Results and Discussion

4.1. Descriptive Statistics

Panel A of Table 1 describes the summary statistics for both our treatment (i.e., CDS-traded firms) and control group (i.e., non-CDS-traded firms). We perform a t-test on the difference of means between the two groups and find that CDS-traded firms are statistically different from their non-CDS counterparts in several dimensions, including the competition faced, report readability, and firm characteristics. The CDS-traded firms are facing less competition but have fewer readable disclosures on average. They are also larger in terms of size, profitability, tangibility, and dividend payouts. However, they seem to be less levered, hold less cash, and have a smaller Tobin’s Q ratio. Interestingly, their equity is also held more proportionally by institutional investors. It is, therefore, important to control for such differences in characteristics in our regression models.
Panel B of Table 1 illustrates the characteristics of CDS-traded firms before and after the initiation of CDS trading. Interestingly, the preliminary results do not reveal a clear difference between the two groups in the post- and pre-initiation trading periods regarding competitive threats, potentially because of the non-fixed CDS initiation dates. However, firms do seem to produce less-readable 10-K filings on average in the post-initiation period. Also, CDS trading does not directly reveal any significant change in profitability, but firms seem to experience a significant increase in size, dividend payouts, cash holdings, leverage, and institutional presence. We also observe a drop in firm tangibility and Tobin’s Q ratio. In Table 2, we also show the distribution of our entire firm-year observations based on the Fama–French 17 industries for both CDS- and Non-CDS-traded firms. The pairwise correlations of all used variables are reported in Appendix A Table A2.

4.2. The Impact of CDS Trading on Product Market Competition

4.2.1. The Baseline Results

Our first hypothesis examines whether the initiation of CDS trading increases the competitive threats faced by individual firms. Our main dependent variable is Fluidity as constructed in Hoberg et al. (2014), which captures the competition landscape of individual firms. We included common firm controls and two sets of fixed effects to account for firm and year level invariant heterogeneity among our sample. We also perform an identical test on Pctcomp as in Li et al. (2013) and traditional 2-digit SIC HHI alongside for comparison.7
Table 3 reports the regression results for the above three competition measures. Our main variable of interest is Tradedpost which indicates whether a firm-year observation occurs during or after the initiation of CDS trading. The coefficients on Tradedpost are both positive and statistically significant. Results from columns (1) and (2) imply that, on average, a firm faces a greater competitive threat following CDS initiation. The results are in favor of our first hypothesis, that the initiation of CDS trading increases the competitive threats from rival firms at the individual firm level.8 However, when we look at the lead HHI index from column (3), the positive coefficients imply that CDS initiation may instead increase market concentration at the industry level. These seemingly contradictory results may be explained by the following arguments: (1) HHI captures industry-level competition whereas Fluidity and Pctcomp capture firm-level competition. (2) CDS trading reveals more strategic or proprietary information at the industry level that drives firms with less core competency out of competition. In other words, it is possible that CDS trading changes the information environment such that more competitive firms grow and gain larger market shares while facing greater competitive threats from the surviving rivals. Nevertheless, the use of firm-level competitive measures has provided us with valuable but different insights compared to traditional measures like HHI.

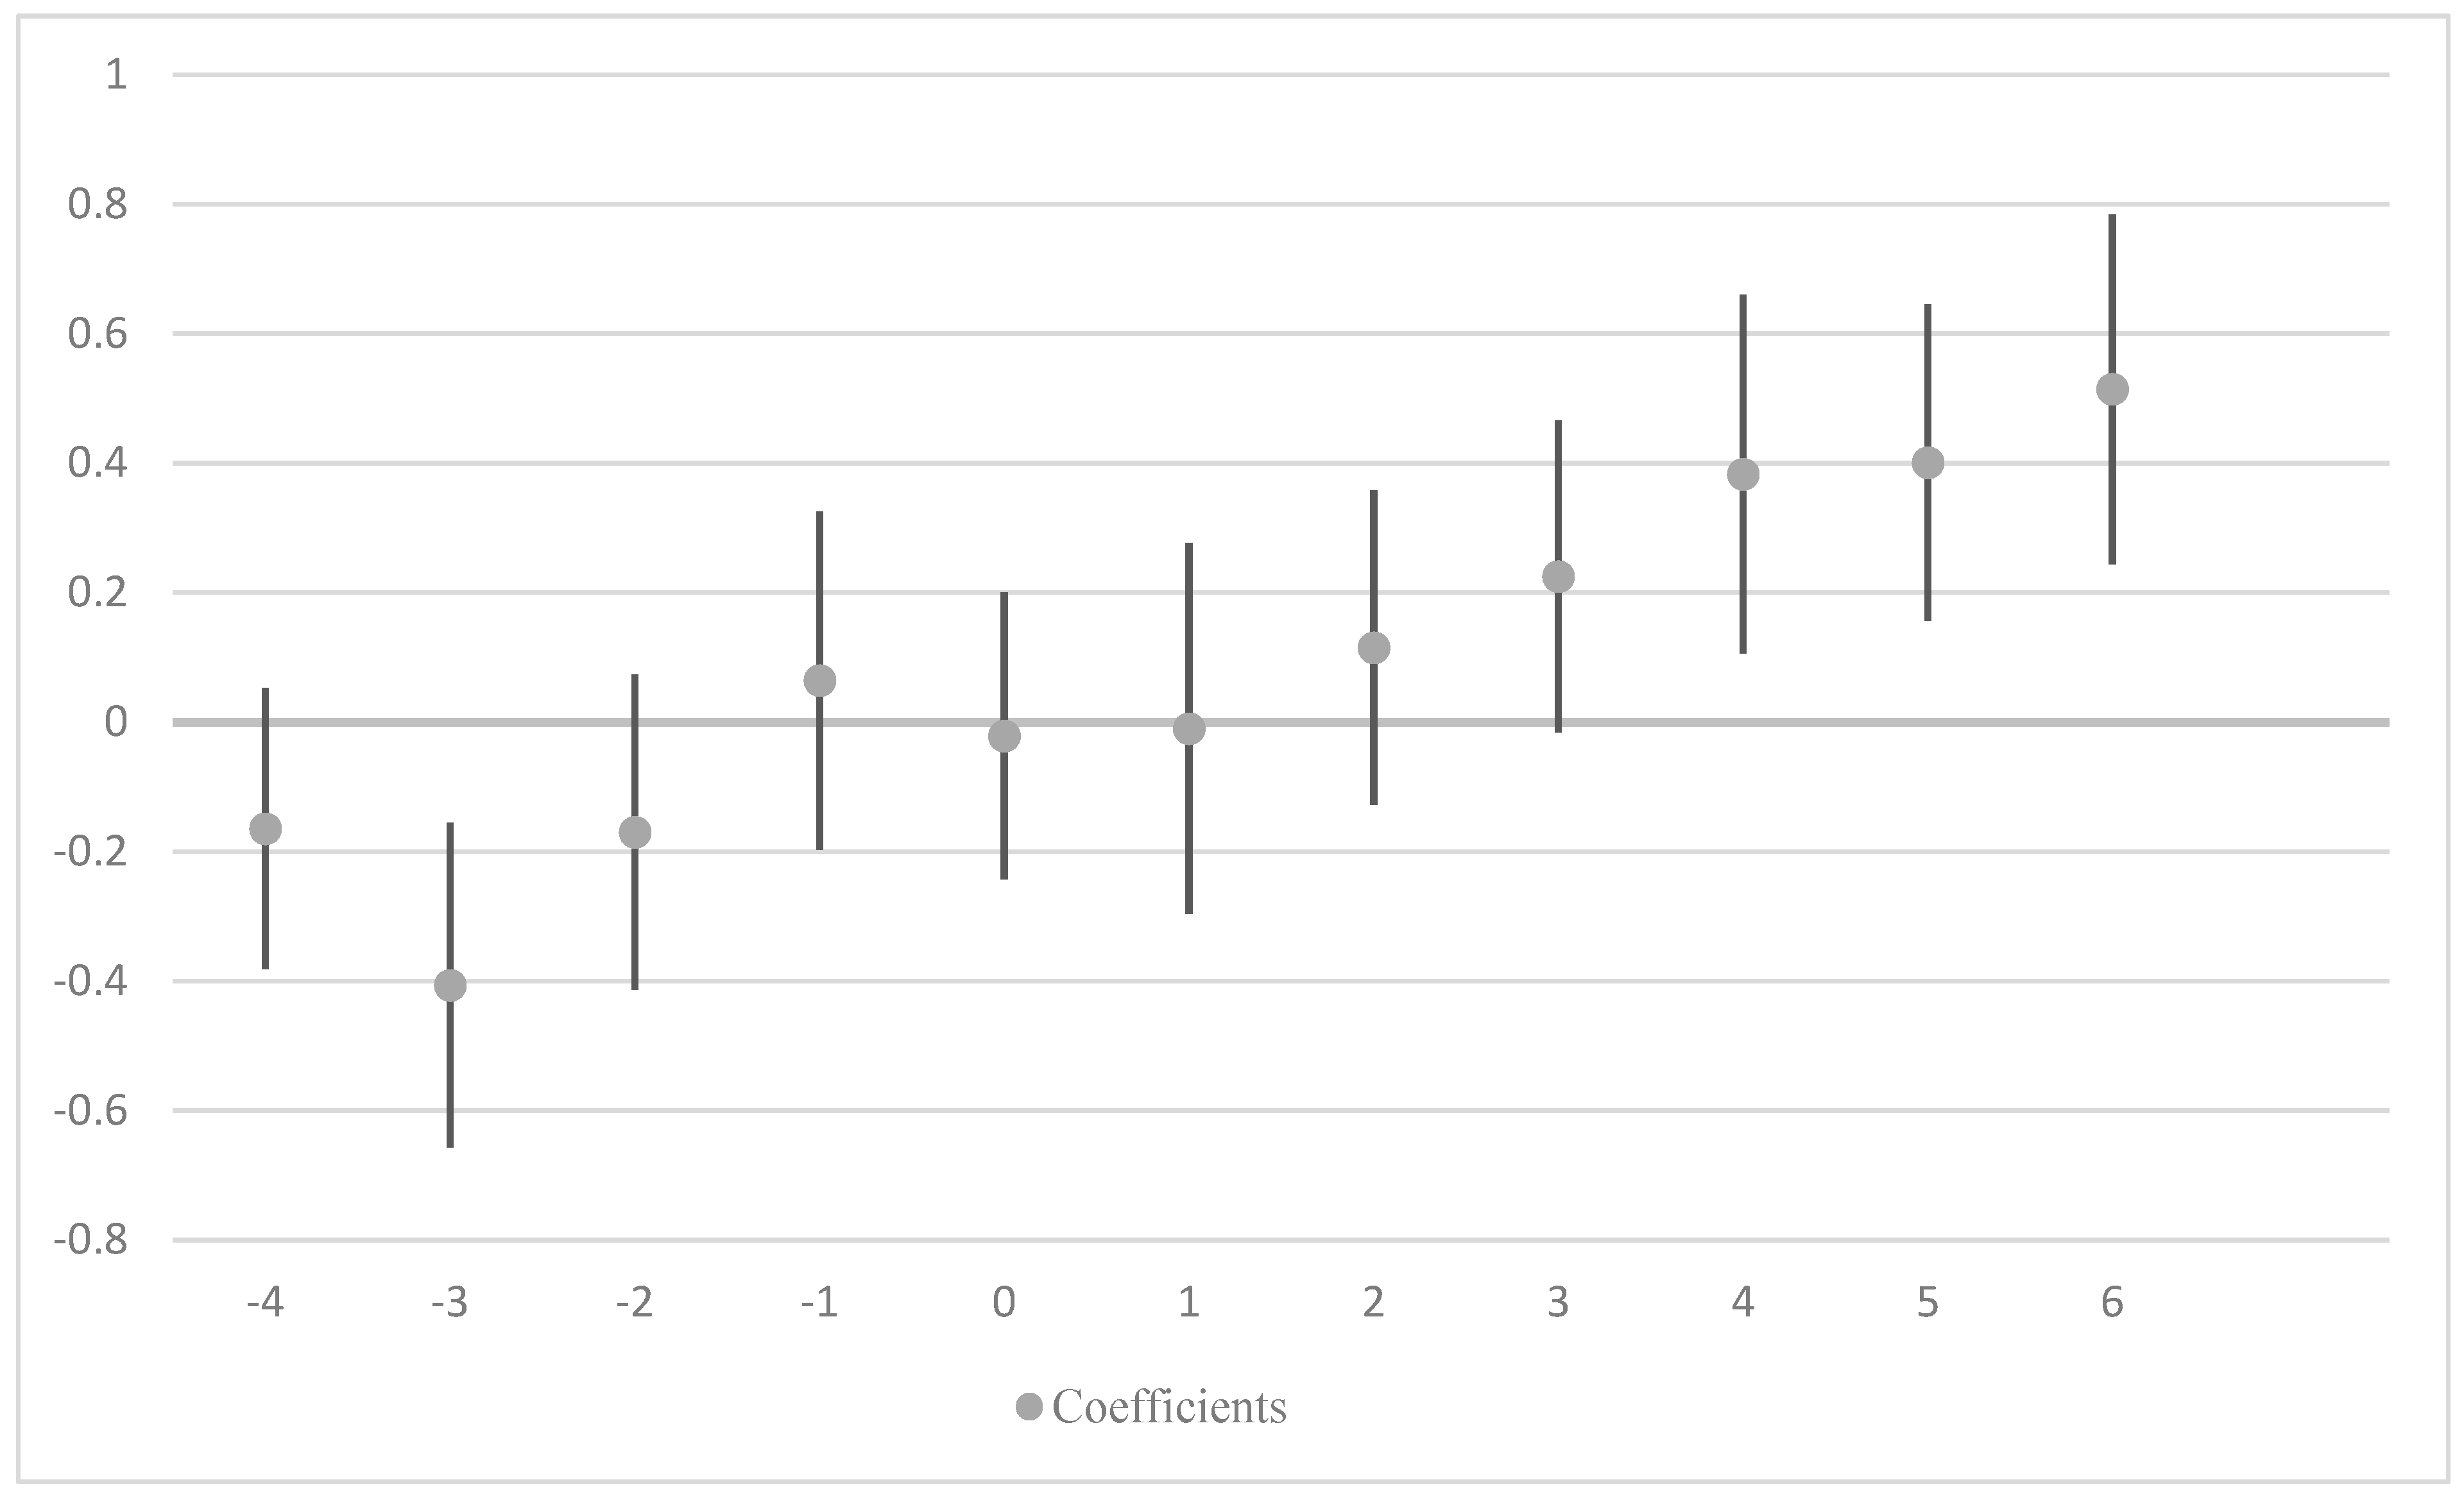
4.2.2. Addressing Endogeneity—Parallel Trend and Overlap Weight Propensity Score Matching

Endogeneity is always a concern for reduced formed regressions, and the parallel trend assumption is a crucial component of the difference-in-difference approach because it ensures that any observed differences between the treatment and control groups are due to the treatment itself and not other factors that could affect both groups differently over time. To address this concern, we run an alternative version of model (1) by replacing Tradedpost with separate dummy variables that indicate the years [t = −4 to t = 6] relative to the CDS initiation year (i.e., t = 0). This specification also permits us to assess the exact timing of when CDS initiation begins to impact competition. The coefficients and their corresponding 95% confidence interval are plotted in Figure 1. The result suggests that CDS trading begins to increase a firm’s competition (i.e., Fluidity) only after the initiation year.
Alternatively, we also use a special version of propensity score matching to address potential endogeneity concerns due to unobserved firm heterogeneity. As shown in Table 1, the CDS trading firms have very different characteristics relative to the non-CDS firms, which leads to conventional propensity score matching being unable to achieve covariate balance. Li et al. (2018) proposed the use of overlap weights, calculated from propensity scores, to reweight observations such that the exact mean balance of the matching covariates is achieved. We match controls to treatment firms without replacement based on CDS initiation year and several lagged covariates, including Roa, firm size, tangibility, debt-equity ratio, and institutional presence. Once a pair of firms is matched, we include all their firm-year observations and repeat our baseline model (1) with all of the matched samples. We focus on Fluidity and its lead measures (i.e., t + 1 to t + 3), and the results are reported in Table 4. The results once again concur with our first hypothesis that CDS trading increases the competitive threats faced by the firm.

4.3. Institutional Presence

Institutional investors hold significant ownership stakes and play a crucial role in firm monitoring (Bathala et al. 1994). To examine whether institutional presence affects a firm’s competitive landscape after CDS initiation, we run regression model (2) and report the results in Table 5. In column (1), we include both the High_Inst dummy and its interaction with the main independent variable, Tradedpost. For robustness, we also include alternative measures of High_Inst by additionally restricting the institutional ownership ranking to be within a firm’s own industry classification (i.e., 2- and 3-digit SIC) in columns (2) and (3).
The results for all three columns yield statistically significant results for the coefficients of both the dummy variable and their interaction terms. The negative coefficients suggest that high institutional presence generally reduces firm-level competition. However, this positive impact seems to be overturned once firms begin trading CDS, as demonstrated by the positive coefficients of the interaction terms. While achieving a causal inference on how institutional presence impacts competition is challenging, our results nonetheless are in favor of hypothesis H2b, that the increase in competitive threats due to CDS trading is more pronounced in firms with a higher institutional presence. A potential explanation for this observation is that institutional investors may take on some of the monitoring roles from credit-hedged lenders, causing a decrease in information demand from other general investors (Bushee 1998; Hartzell and Starks 2003). However, being major shareholders with significant ownership stakes, they might indeed be the most demanding of additional disclosures from the firm, leading to greater disclosure of strategic proprietary information to competitors (e.g., Healy et al. 1999; Core 2001; Boone and White 2015; Bird and Karolyi 2016).

4.4. Information Channels

Arguably, managers can strategically utilize linguistic features of the annual report to alter the costs of information processing for the market. To examine our third hypothesis, we employed three common readability measures to test whether managers show signs of using linguistic tools to respond strategically to potential changes in both the information and the competition environment. A higher readability index indicates a greater difficulty in understanding the documents and hence a higher information processing cost. The results for our model (3) are reported in Table 6. We find unanimous statistically positive associations between CDS initiation and all three measures, implying that the readability of annual 10-K filings is negatively correlated with CDS trading. This finding is in favor of hypothesis H3b, that the initiation of CDS trading decreases the readability of qualitative disclosure. Arguably, the managers may choose to strategically offset greater voluntary disclosure by making other qualitative disclosure (e.g., 10-Ks) less transparent when CDS initiation changes the competitive landscape surrounding the firm.
We also investigate whether the presence of institutional investors affects the sentiments of 10-K filings. Recent research in accounting and finance has paid huge attention to the linguistic features of qualitative disclosures. A common method to extract information from qualitative disclosure is the bag-of-words approach that utilizes word lists that have been specifically tailored for financial text. Loughran and McDonald (2011) extensively study the word usage in a large sample of 10-K filings from 1994 to 2008 and develop several word lists to reflect different sentiments in a business context. We follow their approach to construct the tones of 10-K filings for our samples. We first construct Positive_Tone (Negative_Tone) to measure the percentage occurrence of words from the positive (negative) wordlist as defined in Loughran and McDonald (2011). Net_Tone measures the overall net managerial sentiments of all of the 10-K filings.9 We then repeat model (3) by replacing readability measures with tone measures, and the results are presented in Table 7. Interestingly, firms seem to reveal more positive news after CDS begins to trade, as shown by the significantly positive coefficients of Tradedpost in columns (1) and (3). Firms do not seem to reveal more negative news after CDS initiation. Arguably, positive news is often related to a firm’s strategic information, which may partially explain why competition threat increases for firms after CDS initiation.
As discussed, prior literature has well documented the influence of institutional presence on information disclosure. It is, therefore, also potentially interesting to look at how firms conduct mandatory disclosure (i.e., 10-K filings) under high institutional presence after CDS initiation. We essentially interact High_Inst(SIC3) with Tradedpost for all our readability and tone measures from Table 6 and Table 7. The results are tabulated in Table 8. Interestingly, we observed some evidence regarding the influence from institutional presence after CDS initiation. The coefficients of the interaction terms in columns (1) and (2) suggest that firms on average report 10-Ks using a more positive net tone and a less negative tone after CDS initiation in the presence of high institutional holdings. There is also some evidence from column (4) that the presence of institutional investors might have induced firms to improve readability after CDS trading, which is consistent with our H2b that institutional investors demand additional disclosure after CDS initiation and potentially explains the results in Table 5.

5. Conclusions

Our paper examines how the initiation of CDS trading affects the competitive landscape of the referenced firms in the US. Undeniably, the innovation of CDS has many beneficial effects for debt investors, including the valuable ability to transfer credit risks without altering the ownership of bonds. However, hedging credit risk through CDS inevitably leads to disincentives for creditors to monitor the firms, which in turn spurs higher demand for information disclosure by the equity holders due to concerns over growing principal-agent problems.
Our study first shows that the initiation of CDS trading can intensify a firm’s forward-looking competitive threats in its product market, potentially due to heightened investor demand for information disclosure. Interestingly, instead of increasing voluntary disclosure, as found in prior literature, we observe that the managers decrease the readability of the annual 10-K reports, potentially as an approach to offset the over-disclosure of strategic information to escape competition. However, in the presence of high institutional holdings, we find that the positive substitutional effect from institutional monitoring appears to be overshadowed entirely by the even greater demand for additional disclosure ascribed to their substantial ownership stakes.
In essence, our study brings to the fore the explicit evidential relation between firm-level product market competition and the CDS trading pertaining to the referenced firms, which has not been documented previously in the literature. Our findings also complement the broader literature that examines the general impact of CDS trading on the information environment of financial markets, which provides potentially valuable policy implications for financial market regulation relating to the information disclosure mechanisms of firms when faced with reduced creditor monitoring.

Author Contributions

Conceptualization, C.H., M.L. and W.J.; Methodology, C.H. and W.J.; Software, C.H. and W.J.; Validation, C.H., M.L. and W.J.; Formal Analysis, C.H. and W.J.; Investigation, C.H. and W.J.; Resources, C.H. and W.J.; Data Curation, C.H. and W.J.; Writing—Original Draft Preparation, C.H.; Writing—Review & Editing, C.H., M.L. and W.J.; Visualization, C.H. All authors have read and agreed to the published version of the manuscript.

Funding

This research received no funding.

Data Availability Statement

This study utilizes both subscription-based and publicly available databases and all data sources were presented in the paper under Section 3. Materials and Methods.

Conflicts of Interest

The authors declare no conflict of interest.

Appendix A

Table A1. Variable Definitions.
VariableDescription
TradedpostTradedpost dummy equals one for observations that occur in the year of CDS initiation or in years thereafter, and zero otherwise.
Competition Measures
FluidityA textual based firm-level measure for competitive threat as in Hoberg et al. (2014)
Fluidity_RankFluidity_Rank is constructed by assigning to firms the decile rank of their Fluidity in the whole sample, with 1 being in the lowest Fluidity decile and 10 being the highest.
Fluidity_Rank(Year)Fluidity_Rank is constructed by assigning to firms the decile rank of their Fluidity within each fiscal year, with 1 being in the lowest Fluidity decile and 10 being in the highest.
Fluidity_Rank(SIC2)Fluidity_Rank(SIC2) is constructed by assigning to firms the decile rank of their Fluidity within each 2-digit SIC and fiscal year, with 1 being in the lowest Fluidity decile and 10 being in the highest.
Fluidity_Rank(SIC3)Fluidity_Rank(SIC3) is constructed by assigning to firms the decile rank of their Fluidity within each 3-digit SIC and fiscal year, with 1 being in the lowest Fluidity decile and 10 being in the highest.
PctcompA textual-based firm-level measure for competitive threat as in Li et al. (2013).
HHIHerfindahl-Hirschman Index is calculated based on the lead annual sales data from the Compustat database for each 2-digit SIC.
Linguistic Measures
FogIndexFog Index measured as 0.4 × [(total number of words/total number of sentences) + 100 × (complex words/total number of words)] where complex words are defined as words with three syllables or more
WordsNatural log of the number of words in Form 10-K
KincaidFlesch–Kincaid grade level measured as 0.39 × (total words/total sentences) + 11.8 × (total syllables/total words) − 15.59
Net_ToneNet_Tone is measured by taking the difference between the positive and negative words as defined in Loughran and McDonald (2011) divided by the total number of positive and negative words.
Negative_ToneThe total number of negative words, as defined in Loughran and McDonald (2011), divided by the total words from Form 10-K multiplied by 100.
Positive_ToneThe total number of positive words, as defined in Loughran and McDonald (2011), divided by the total words from Form 10-K multiplied by 100.
Firm Characteristics
RoaIncome before extraordinary item normalized by total assets
SizeNatural log of total assets
TangibilityProperty, plant, and equipment normalized by total assets
DividendA dummy equals to one if a firm pays out a positive dividend in year t
CashCash and cash equivalent normalized by total assets
TobinsQTobin’s Q ratio is calculated as (Total asset + Market Value of Equity − Book Value of Equity)/Total Assets
DEratioTotal debt over total common equity value
High_InstA dummy equal to one if the average institutional ownership in a particular year, as disclosed in Form 13F, is higher than the sample median.
High_Inst(SIC2)A dummy equal to one if the average institutional ownership in a particular 2-digit SIC and year, as disclosed in Form 13F, is higher than the sample median.
High_Inst(SIC3)A dummy equal to one if the average institutional ownership in a particular 3-digit SIC and year, as disclosed in Form 13F, is higher than the sample median.
Table A2. Variable pairwise correlations.
(1)(2)(3)(4)(5)(6)(7)(8)(9)(10)(11)(12)(13)(14)(15)(16)(17)(18)(19)(20)(21)(22)(23)
(1)Fluidity1.00
(2)Fluidity_Rank0.961.00
(3)Fluidity_Rank(Year)0.950.981.00
(4)Fluidity_Rank(SIC2)0.730.760.771.00
(5)Fluidity_Rank(SIC3)0.650.660.670.861.00
(6)Pctcomp0.140.150.150.120.101.00
(7)HHI−0.20−0.20−0.20−0.03−0.05−0.111.00
(8)FogIndex0.130.140.140.110.09−0.10−0.031.00
(9)Words0.240.240.250.210.19−0.23−0.030.291.00
(10)Kincaid0.160.160.160.130.11−0.15−0.050.980.331.00
(11)Net_Tone−0.06−0.08−0.08−0.05−0.030.24−0.04−0.11−0.29−0.131.00
(12)Negative_Tone0.220.230.230.200.16−0.17−0.040.120.330.17−0.731.00
(13)Positive_Tone0.200.170.170.170.160.14−0.11−0.01−0.010.020.580.081.00
(14)Roa−0.19−0.18−0.19−0.11−0.08−0.020.030.03−0.010.030.03−0.03−0.011.00
(15)Size−0.06−0.07−0.070.010.04−0.260.080.040.280.07−0.030.110.080.461.00
(16)Tangibility−0.04−0.04−0.04−0.05−0.03−0.110.18−0.040.03−0.06−0.03−0.13−0.190.050.201.00
(17)Dividend−0.17−0.18−0.18−0.15−0.11−0.140.06−0.030.02−0.040.08−0.12−0.030.110.340.161.00
(18)Cash0.410.380.390.250.190.17−0.180.060.000.090.020.170.24−0.11−0.27−0.41−0.201.00
(19)TobinsQ0.170.170.170.100.080.12−0.02−0.03−0.01−0.020.00−0.010.01−0.74−0.43−0.07−0.100.161.00
(20)DEratio−0.04−0.03−0.040.000.01−0.070.070.010.060.00−0.100.07−0.08−0.040.010.09−0.00−0.13−0.001.00
(21)High_Inst−0.09−0.09−0.10−0.03−0.01−0.040.030.010.020.030.050.040.110.220.490.050.14−0.08−0.18−0.101.00
(22)High_Inst(SIC2)−0.04−0.04−0.04−0.03−0.00−0.05−0.010.020.040.030.030.040.100.200.450.050.13−0.04−0.16−0.100.861.00
(23)High_Inst(SIC3)−0.00−0.00−0.01−0.000.01−0.04−0.020.030.040.040.030.050.100.190.410.040.11−0.02−0.15−0.100.800.871.00
Table A3. CDS initiations and fluidity ranks. This table reports the results of regression model (1) for alternative versions of Fluidity measures, which were ranked by deciles from each year and by industry classifications. Standard errors were clustered by firms and reported in parentheses. Lagged firm-specific controls and the firm and year fixed effects are included in all specifications. Coefficients with *, **, or *** indicate a significance level of 0.10, 0.05, or 0.01, respectively. For detailed definitions of variables, please refer to Appendix A Table A1.
(1)(2)(3)(4)
Fluidity_RankFluidity_Rank(Year)Fluidity_Rank(SIC2)Fluidity_Rank(SIC3)
Tradedpost0.5281 ***0.5114 ***0.3408 ***0.3397 ***
(0.093)(0.093)(0.117)(0.125)
Roa−0.1633 ***−0.1591 ***−0.0914 ***−0.0915 ***
(0.024)(0.024)(0.028)(0.030)
Size0.3047 ***0.3063 ***0.2436 ***0.2623 ***
(0.024)(0.025)(0.031)(0.033)
Tangibility0.6053 ***0.5816 ***0.3395 *0.4329 **
(0.160)(0.163)(0.183)(0.200)
Dividend−0.0505−0.0369−0.0383−0.0153
(0.032)(0.033)(0.041)(0.045)
Cash0.6380 ***0.6471 ***0.4909 ***0.4479 ***
(0.093)(0.095)(0.106)(0.115)
TobinsQ0.0180 ***0.0187 ***0.0130 ***0.0129 ***
(0.004)(0.004)(0.004)(0.004)
DEratio0.00350.00410.0107 ***0.0132 ***
(0.003)(0.003)(0.004)(0.004)
Firm FEYesYesYesYes
Year FEYesYesYesYes
Adj. R20.800.800.690.62
Observations51,04351,04351,04351,043

Notes

1
See Core (2001) for a brief discussion of the literature on firm disclosure in the presence of institutional investors.
2
A tension exists between the two forces, which are not mutually exclusive. Therefore, the empirical testing of the above competing hypotheses is a joint test that may only reveal which of the two forces dominates.
3
Five-year is the most common maturity of CDS contracts. See Landsman et al. (2023).
4
The data for Pctcomp was retrieved from Feng Li’s website (http://webuser.bus.umich.edu/feng/, accessed on 20 February 2020).
5
Please note that some observations from our final sample will be dropped depending on the exact specification of our regression models.
6
7
There are two important reasons for using Fluidity as our main measures. First, we believe that the construction of Fluidity fits the definition of product market competition better. Second, we will be able to retain more observations using Fluidity.
8
To ensure the robustness of our results, we follow Li and Zhan (2018) by creating alternative Fluidity measures and repeat our model (1). We construct Fluidity_Rank by assigning firms to the decile rank of their Fluidity within each year, with 1 being in the lowest Fluidity decile and 10 being in the highest. We also further refine our ranking approach by including industry classifications (i.e., Fluidity_Rank(SIC2) and Fluidity_Rank(SIC3)). The results are reported in Appendix A Table A3, which yield unanimously similar results in comparison to those in Table 3.
9
Please see Appendix A Table A1 for detailed definition of the tone variables.

References

  1. Amiram, Dan, William H. Beaver, Wayne R. Landsman, and Jianxin Zhao. 2017. The effects of credit default swap trading on information asymmetry in syndicated loans. Journal of Financial Economics 126: 364–82. [Google Scholar] [CrossRef]
  2. Ashcraft, Adam B., and Joao A. C. Santos. 2009. Has the CDS market lowered the cost of corporate debt? Journal of Monetary Economics 56: 514–23. [Google Scholar] [CrossRef] [Green Version]
  3. Bathala, Chenchuramaiah T., Kenneth P. Moon, and Ramesh P. Rao. 1994. Managerial ownership, debt policy, and the impact of institutional holdings: An agency perspective. Financial Management, 38–50. [Google Scholar] [CrossRef]
  4. Bertrand, Marianne, and Sendhil Mullainathan. 2003. Enjoying the quiet life? Corporate governance and managerial preferences. Journal of Political Economy 111: 1043–75. [Google Scholar] [CrossRef] [Green Version]
  5. Bird, Andrew, and Stephen A. Karolyi. 2016. Do institutional investors demand public disclosure? The Review of Financial Studies 29: 3245–77. [Google Scholar] [CrossRef]
  6. Bolton, Patrick, and Martin Oehmke. 2011. Credit default swaps and the empty creditor problem. The Review of Financial Studies 24: 2617–55. [Google Scholar] [CrossRef]
  7. Boone, Audra L., and Joshua T. White. 2015. The effect of institutional ownership on firm transparency and information production. Journal of Financial Economics 117: 508–33. [Google Scholar] [CrossRef]
  8. Bushee, Brian J. 1998. The influence of institutional investors on myopic R&D investment behavior. Accounting Review, 305–33. [Google Scholar]
  9. Chang, Xin, Yangyang Chen, Sarah Qian Wang, Kuo Zhang, and Wenrui Zhang. 2019. Credit default swaps and corporate innovation. Journal of Financial Economics 134: 474–500. [Google Scholar] [CrossRef]
  10. Chen, Jie, Woon Sau Leung, Wei Song, and Davide Avino. 2019. Does CDS trading affect risk-taking incentives in managerial compensation? Journal of Banking & Finance, 105485. [Google Scholar] [CrossRef] [Green Version]
  11. Chung, Richard, Michael Firth, and Jeong-Bon Kim. 2002. Institutional monitoring and opportunistic earnings management. Journal of Corporate Finance 8: 29–48. [Google Scholar] [CrossRef]
  12. Core, John E. 2001. A review of the empirical disclosure literature: Discussion. Journal of Accounting and Economics 31: 441–56. [Google Scholar] [CrossRef] [Green Version]
  13. Dyck, Alexander, Karl V. Lins, Lukas Roth, and Hannes F. Wagner. 2019. Do institutional investors drive corporate social responsibility? International evidence. Journal of Financial Economics 131: 693–714. [Google Scholar] [CrossRef]
  14. Gorton, Gary B., and George G. Pennacchi. 1995. Banks and loan sales marketing nonmarketable assets. Journal of Monetary Economics 35: 389–411. [Google Scholar] [CrossRef] [Green Version]
  15. Graham, John R., Campbell R. Harvey, and Shiva Rajgopal. 2005. The economic implications of corporate financial reporting. Journal of Accounting and Economics 40: 3–73. [Google Scholar] [CrossRef] [Green Version]
  16. Greenspan, Alan. 2004. Risk and uncertainty in monetary policy. American Economic Review 94: 33–40. [Google Scholar] [CrossRef]
  17. Hartzell, Jay C., and Laura T. Starks. 2003. Institutional investors and executive compensation. The Journal of Finance 58: 2351–74. [Google Scholar] [CrossRef] [Green Version]
  18. Healy, Paul M., Amy P. Hutton, and Krishna G. Palepu. 1999. Stock performance and intermediation changes surrounding sustained increases in disclosure. Contemporary Accounting Research 16: 485–520. [Google Scholar] [CrossRef]
  19. Hoberg, Gerard, Gordon Phillips, and Nagpurnanand Prabhala. 2014. Product market threats, payouts, and financial flexibility. The Journal of Finance 69: 293–324. [Google Scholar] [CrossRef]
  20. Hu, Henry T. C., and Bernard Black. 2008. Debt, equity and hybrid decoupling: Governance and systemic risk implications. European Financial Management 14: 663–709. [Google Scholar] [CrossRef]
  21. John, Kose, Anzhela Knyazeva, and Diana Knyazeva. 2011. Does geography matter? Firm location and corporate payout policy. Journal of Financial Economics 101: 533–51. [Google Scholar] [CrossRef]
  22. Kim, Jae B., Pervin Shroff, Dushyantkumar Vyas, and Regina Wittenberg-Moerman. 2018. Credit default swaps and managers’ voluntary disclosure. Journal of Accounting Research 56: 953–88. [Google Scholar] [CrossRef]
  23. Kim, Hyun-Dong, Kwangwoo Park, and Kyojik Roy Song. 2019. Do long-term institutional investors foster corporate innovation? Accounting & Finance 59: 1163–95. [Google Scholar]
  24. Landsman, Wayne R., Chao Kevin Li, and Jianxin Donny Zhao. 2023. CDS trading initiation, information asymmetry, and dividend payout. Management Science 69: 684–701. [Google Scholar] [CrossRef]
  25. Lang, Mark, and Russell Lundholm. 1993. Cross-sectional determinants of analyst ratings of corporate disclosures. Journal of Accounting Research 31: 246–71. [Google Scholar] [CrossRef]
  26. Lehavy, Reuven, Feng Li, and Kenneth Merkley. 2011. The effect of annual report readability on analyst following and the properties of their earnings forecasts. The Accounting Review 86: 1087–115. [Google Scholar] [CrossRef] [Green Version]
  27. Lel, Ugur. 2019. The role of foreign institutional investors in restraining earnings management activities across countries. Journal of International Business Studies 50: 895–922. [Google Scholar] [CrossRef]
  28. Lewellen, Jonathan, and Katharina Lewellen. 2022. Institutional investors and corporate governance: The incentive to be engaged. The Journal of Finance 77: 213–64. [Google Scholar] [CrossRef]
  29. Li, Fan, Kari Lock Morgan, and Alan M Zaslavsky. 2018. Balancing covariates via propensity score weighting. Journal of the American Statistical Association 113: 390–400. [Google Scholar] [CrossRef] [Green Version]
  30. Li, Feng. 2008. Annual report readability, current earnings, and earnings persistence. Journal of Accounting and Economics 45: 221–47. [Google Scholar] [CrossRef]
  31. Li, Feng, Russell Lundholm, and Michael Minnis. 2013. A measure of competition based on 10-K filings. Journal of Accounting Research 51: 399–436. [Google Scholar] [CrossRef]
  32. Li, Si, and Xintong Zhan. 2018. Product Market Threats and Stock Crash Risk. Management Science 65: 4011–31. [Google Scholar] [CrossRef]
  33. Li, Xi. 2010. The impacts of product market competition on the quantity and quality of voluntary disclosures. Review of Accounting Studies 15: 663–711. [Google Scholar] [CrossRef]
  34. Loughran, Tim, and Bill McDonald. 2011. When is a liability not a liability? Textual analysis, dictionaries, and 10-Ks. The Journal of Finance 66: 35–65. [Google Scholar] [CrossRef]
  35. Marsh, Ian W. 2006. The Effect of Lenders’ Credit Risk Transfer Activities on Borrowing Firms’ Equity Returns. Cass Business School Research Paper, Bank of Finland Research Discussion Paper. Available online: https://papers.ssrn.com/sol3/papers.cfm?abstract_id=942713 (accessed on 28 August 2022).
  36. Martin, Xiumin, and Sugata Roychowdhury. 2015. Do financial market developments influence accounting practices? Credit default swaps and borrowers׳ reporting conservatism. Journal of Accounting and Economics 59: 80–104. [Google Scholar] [CrossRef]
  37. Morrison, Alan D. 2005. Credit derivatives, disintermediation, and investment decisions. The Journal of Business 78: 621–48. [Google Scholar] [CrossRef]
  38. Parlour, Christine A, and Andrew Winton. 2013. Laying off credit risk: Loan sales versus credit default swaps. Journal of Financial Economics 107: 25–45. [Google Scholar] [CrossRef]
  39. Pennacchi, George G. 1988. Loan sales and the cost of bank capital. The Journal of Finance 43: 375–96. [Google Scholar] [CrossRef]
  40. Schrand, Catherine M., and Beverly R. Walther. 2000. Strategic benchmarks in earnings announcements: The selective disclosure of prior-period earnings components. The Accounting Review 75: 151–77. [Google Scholar] [CrossRef]
  41. Shan, Chenyu, Dragon Yongjun Tang, and Andrew Winton. 2019. Do banks still monitor when there is a market for credit protection? Journal of Accounting and Economics 68: 101241. [Google Scholar] [CrossRef]
  42. Stulz, René M. 2010. Credit default swaps and the credit crisis. Journal of Economic Perspectives 24: 73–92. [Google Scholar] [CrossRef] [Green Version]
  43. Sufi, Amir. 2007. Information asymmetry and financing arrangements: Evidence from syndicated loans. The Journal of Finance 62: 629–68. [Google Scholar] [CrossRef] [Green Version]
  44. Vashishtha, Rahul. 2014. The role of bank monitoring in borrowers׳ discretionary disclosure: Evidence from covenant violations. Journal of Accounting and Economics 57: 176–95. [Google Scholar] [CrossRef]
  45. Wong, Tak-Yuen, and Jin Yu. 2022. Credit default swaps and debt overhang. Management Science 68: 2069–97. [Google Scholar] [CrossRef]
Figure 1. Fluidity surrounding CDS initiation. This figure shows the results of an alternative version of model (1) by replacing Tradedpost with separate dummy variables that indicate the years [t = −4 to t = 6] relative to the CDS initiation year (i.e., t = 0). The coefficients and their corresponding 95% confidence interval are plotted.
Jrfm 16 00207 g001
Table 1. Descriptive statistics. This table reports the descriptive statistics of our entire sample from 1994 to 2013. Panel A compares the statistics of non-CDS- and CDS-traded firms, whereas panel B compares the statistics of CDS-traded firms in the pre- and post-CDS initiation periods. The differences in means from the t-test are marked with ** or *** indicating a significance level of 0.05 or 0.01, respectively. For detailed definitions of variables, please refer to Appendix A Table A1.
Panel A: All FirmsFull SampleNon-CDS-Traded (a)CDS-Traded Firms (b)
NMeanSD.NMeanSD.NMeanSD.t-Test (a)−(b)
Competition Measures
Fluidity51,0436.6603.34846,8686.7223.34941755.9633.2600.759 ***
Fluidity_Rank51,0435.0762.82546,8685.1322.81541754.4472.8650.685 ***
Fluidity_Rank(Year)51,0435.0062.82846,8685.0622.81941754.3792.8470.683 ***
Fluidity_Rank(SIC2)51,0435.3332.86046,8685.3722.85341754.8932.9040.479 ***
Fluidity_Rank(SIC3)51,0435.1592.86646,8685.1842.86541754.8752.8620.309 ***
Pctcomp26,3790.5740.46323,5270.5960.46728520.3920.3800.204 ***
HHI65,762638.656547.13161,063631.404539.6744699732.896628.635−101.492 ***
Linguistic Measures
FogIndex41,44019.3432.43237,92819.3312.463351219.4682.059−0.137 **
Words41,05010.0620.79837,55110.0310.796349910.3890.745−0.358 ***
Kincaid41,44015.2952.12637,92815.2732.144351215.5301.904−0.257 ***
Net_Tone65,752−0.3700.16561,053−0.3710.1654699−0.3530.161−0.018 ***
Negative_Tone65,7621.5430.44361,0631.5430.44646991.5370.4130.006
Positive_Tone65,7620.6830.17661,0630.6800.17646990.7130.180−0.033 ***
Firm Characteristics
Roa65,762−0.3891.81161,063−0.4231.87546990.0490.123−0.472 ***
Size65,7624.7832.61261,0634.4802.43646998.7191.303−4.238 ***
Tangibility65,7620.2510.23261,0630.2440.23146990.3380.233−0.094 ***
Dividend65,7620.3420.47461,0630.3100.46246990.7620.426−0.452 ***
Cash65,7620.2160.24861,0630.2260.25346990.0850.0970.141 ***
TobinsQ65,7624.73815.08661,0634.95915.63046991.8641.1633.095 ***
DEratio65,7621.5045.04561,0631.5265.16346991.2223.1040.304 ***
High_Inst65,7620.5290.49961,0630.5060.50046990.8190.385−0.313 ***
High_Inst(SIC2)65,7620.5100.50061,0630.4890.50046990.7820.413−0.293 ***
High_Inst(SIC3)65,7620.4940.50061,0630.4750.49946990.7390.439−0.264 ***
Panel B: CDS−Traded FirmsBefore CDS Initiation (a)After CDS Initiation (b)
NMeanSD.NMeanSD.t-Test (a)−(b)
Competition Measures
Fluidity20415.9653.27721345.9613.2450.004
Pctcomp19480.4800.4209040.2010.1510.279 ***
HHI2505679.542582.1202194793.814672.832−114.272 ***
Linguistic Measures
FogIndex224719.2841.913126519.7942.259−0.510 ***
Words223910.3240.674126010.5050.844−0.181 ***
Kincaid224715.2741.776126515.9852.036−0.711 ***
Net_Tone2505−0.3290.1782194−0.3810.1340.052 ***
Negative_Tone25051.4200.41821941.6720.364−0.252 ***
Positive_Tone25050.6940.19121940.7360.164−0.043 ***
Firm Characteristics
Roa25050.0490.15321940.0500.076−0.001
Size25058.2841.29621949.2151.121−0.930 ***
Tangibility25050.3520.22821940.3220.2370.030 ***
Dividend25050.7390.44021940.7890.409−0.050 ***
Cash25050.0730.10121940.0990.091−0.026 ***
TobinsQ25052.0571.43821941.6440.6700.412 ***
DEratio25051.0042.08721941.4723.944−0.467 ***
High_Inst25050.7610.42621940.8850.319−0.124 ***
High_Inst(SIC2)25050.7420.43821940.8290.377−0.087 ***
High_Inst(SIC3)25050.7140.45221940.7680.423−0.054 ***
Table 2. Industry classification. This table shows the distribution of our firm-year observations based on the Fama–French 17 industries for both CDS- and Non-CDS-traded firms. Detailed definitions of each industry category can be found in Kenneth French’s online data library.6.
Fama-French 17 IndustriesNon-CDS-TradedCDS-TradedTotal
Food18302232053
Mining and Minerals995701065
Oil and Petroleum Product30104793489
Textiles, Apparel & Footwear1136701206
Consumer Durables17291091838
Chemicals13711971568
Drugs, Soap, Perfumes, Tobacco30382923330
Construction and Construction Materials21373852522
Steel Works Etc.798105903
Fabricated Products53039569
Machinery and Business Equipment951766610,183
Automobiles982461028
Transportation22633822645
Retail Stores35833043887
Other28,144133229,476
Total61,063469965,762
Table 3. CDS initiations and product market competition. This table reports the results of our baseline regression model (1) for different competition measures. Standard errors were clustered by firms and reported in parentheses. Lagged firm-specific controls and the firm and year fixed effects are included in all specifications. Coefficients with ** or *** indicating a significance level of 0.05 or 0.01, respectively. For detailed definitions of variables, please refer to Appendix A Table A1.
(1)(2)(3)
FluidityPctcompHHI
Tradedpost0.5447 ***0.0435 **55.8385 ***
(0.114)(0.019)(19.336)
Roa−0.1857 ***0.0355 **0.3626
(0.028)(0.017)(0.668)
Size0.3818 ***−0.0092−2.2701
(0.029)(0.008)(2.636)
Tangibility0.5328 ***0.0668−0.8344
(0.183)(0.049)(18.009)
Dividend−0.0766 **−0.01081.3268
(0.037)(0.010)(5.704)
Cash0.7885 ***0.041610.6663
(0.110)(0.034)(8.366)
TobinsQ0.0212 ***0.0097 ***−0.1020
(0.004)(0.002)(0.109)
DEratio0.00360.0011−0.1232
(0.003)(0.001)(0.256)
Firm FEYesYesYes
Year FEYesYesYes
Adj. R20.810.560.89
Observations51,04326,37965,762
Table 4. Overlap weight propensity score matching. This table reports the results for model (1) with propensity score matched samples using overlap weights approach (Li et al. 2018). Control firms were matched based on CDS initiation year and lagged covariates, including Roa, firm size, tangibility, debt-equity ratio, and institutional presence. The firm-year observations of all matched firms are included in the regressions. Dependent variables include Fluidity and its lead measures (i.e., t + 1 to t + 3). Standard errors were clustered by firms and reported in parentheses. Lagged firm-specific controls and firm and year fixed effects are included in all specifications. Coefficients with *, **, or *** indicate a significance level of 0.10, 0.05, or 0.01, respectively. For detailed definitions of variables, please refer to Appendix A Table A1.
(1)(2)(3)(4)
FluidityFluidity (t + 1)Fluidity (t + 2)Fluidity (t + 3)
Tradedpost0.4018 ***0.4047 ***0.3563 **0.3147 **
(0.143)(0.144)(0.141)(0.140)
Roa−0.8644 ***−0.4733 **−0.1770−0.1619
(0.286)(0.210)(0.257)(0.269)
Size0.3834 ***0.3105 ***0.2439 ***0.1755 *
(0.091)(0.088)(0.093)(0.098)
Tangibility−0.2326−0.2856−0.01850.0685
(0.685)(0.601)(0.582)(0.604)
Dividend−0.2809 **−0.2089 *−0.2227 *−0.2329 **
(0.119)(0.115)(0.116)(0.115)
Cash0.76190.78030.45400.3254
(0.598)(0.592)(0.589)(0.569)
TobinsQ0.0496 ***0.0845 ***0.0836 ***0.0743 ***
(0.016)(0.018)(0.014)(0.016)
DEratio0.0056−0.0002−0.0087 **−0.0154 ***
(0.007)(0.005)(0.004)(0.004)
High_Inst(SIC3)−0.2235 *−0.3166 ***−0.2893 ***−0.2661 ***
(0.115)(0.106)(0.102)(0.101)
Firm FEYesYesYesYes
Year FEYesYesYesYes
Adj. R20.770.760.760.77
Observations7057732768866486
Table 5. CDS initiation and institutional holdings. This table reports the results of regression model (2) using our main competition measure, Fluidity. Standard errors were clustered by firms and reported in parentheses. Lagged firm-specific controls and firm and year fixed effects are included in all specifications. Coefficients with *, **, or *** indicate a significance level of 0.10, 0.05, or 0.01, respectively. For detailed definitions of variables, please refer to Appendix A Table A1.
(1)(2)(3)
FluidityFluidityFluidity
Tradedpost0.08790.13090.2312
(0.287)(0.215)(0.170)
High_Inst−0.2983 ***
(0.050)
Tradedpost * High_Inst0.5213 *
(0.287)
High_Inst(SIC2) −0.2683 ***
(0.045)
Tradedpost * High_Inst(SIC2) 0.4960 **
(0.211)
High_Inst(SIC3) −0.2157 ***
(0.041)
Tradedpost * High_Inst(SIC3) 0.3964 **
(0.170)
Roa−0.1832 ***−0.1846 ***−0.1852 ***
(0.028)(0.028)(0.028)
Size0.3936 ***0.3933 ***0.3912 ***
(0.029)(0.029)(0.029)
Tangibility0.5441 ***0.5330 ***0.5333 ***
(0.183)(0.183)(0.183)
Dividend−0.0840 **−0.0824 **−0.0821 **
(0.037)(0.037)(0.037)
Cash0.7896 ***0.7922 ***0.7900 ***
(0.110)(0.110)(0.110)
TobinsQ0.0216 ***0.0214 ***0.0214 ***
(0.004)(0.004)(0.004)
DEratio0.00300.00310.0032
(0.003)(0.003)(0.003)
Firm FEYesYesYes
Year FEYesYesYes
Adj. R20.810.810.81
Observations51,04351,04351,043
Table 6. CDS initiation and 10-K readability. This table reports the results of regression model (3) using our three main readability measures for a firm’s 10-K filings. Standard errors were clustered by firms and reported in parentheses. Lagged firm-specific controls and firm and year fixed effects are included in all specifications. Coefficients with *, **, or *** indicate a significance level of 0.10, 0.05, or 0.01, respectively. For detailed definitions of variables, please refer to Appendix A Table A1.
(1)(2)(3)
FogIndexKincaidWords
Tradedpost0.5712 ***0.5458 ***0.1208 ***
(0.100)(0.094)(0.031)
Roa0.01550.0148−0.0291 ***
(0.035)(0.029)(0.008)
Size0.0647 *0.0712 **0.1041 ***
(0.033)(0.029)(0.007)
Tangibility0.00360.0297−0.0655
(0.233)(0.198)(0.055)
Dividend0.08010.07450.0241 *
(0.054)(0.046)(0.013)
Cash0.06760.0624−0.0188
(0.134)(0.114)(0.033)
TobinsQ0.00100.00120.0013
(0.006)(0.005)(0.001)
DEratio0.00440.00290.0030 ***
(0.004)(0.003)(0.001)
High_Inst(SIC3)0.07290.0498−0.0353 ***
(0.056)(0.048)(0.013)
Firm FEYesYesYes
Year FEYesYesYes
Adj. R20.210.240.38
Observations41,44041,44041,050
Table 7. CDS initiation and 10-K tones. This table reports the results for an alternative version of model (3) using tone measures for a firm’s 10-K filings. Standard errors were clustered by firms and reported in parentheses. Lagged firm-specific controls and firm and year fixed effects are included in all specifications. Coefficients with *, **, or *** indicate a significance level of 0.10, 0.05, or 0.01, respectively. For detailed definitions of variables, please refer to Appendix A Table A1.
(1)(2)(3)
Net_ToneNegative_TonePositive_Tone
Tradedpost0.0144 *0.02410.0305 ***
(0.007)(0.018)(0.008)
Roa0.0038 ***−0.0123 ***0.0009
(0.001)(0.002)(0.001)
Size−0.0095 ***0.0289 ***−0.0012
(0.001)(0.003)(0.001)
Tangibility−0.00480.00650.0009
(0.008)(0.022)(0.008)
Dividend−0.0022−0.0182 ***−0.0097 ***
(0.002)(0.006)(0.002)
Cash0.0108 **0.0326 **0.0331 ***
(0.005)(0.014)(0.005)
TobinsQ0.0002 **−0.0007 ***0.0001
(0.000)(0.000)(0.000)
DEratio−0.0013 ***0.0052 ***−0.0002
(0.000)(0.000)(0.000)
High_Inst(SIC3)0.0055 **−0.00840.0006
(0.003)(0.007)(0.003)
Firm FEYesYesYes
Year FEYesYesYes
Adj. R20.470.520.59
Observations65,75265,76265,762
Table 8. Disclosure under high institutional ownership. This table reassesses the results from Table 6 and Table 7 after including institutional presence (i.e., High_Inst(SIC3)). Standard errors were clustered by firms and reported in parentheses. Lagged firm-specific controls and firm and year fixed effects are included in all specifications. Coefficients with *, **, or *** indicate a significance level of 0.10, 0.05, or 0.01, respectively. For detailed definitions of variables, please refer to Appendix A Table A1.
(1)(2)(3)(4)(5)(6)
Net_ToneNegative_TonePositive_ToneFogIndexKincaidWords
Tradedpost−0.00520.0672 **0.0139 0.9212 ***0.7783 ***0.1901 ***
(0.014)(0.029)(0.016) (0.196)(0.184)(0.051)
Tradedpost * High_Inst(SIC3)0.0256 *−0.0562 *0.0215 −0.4520 **−0.3003−0.0895
(0.013)(0.029)(0.016) (0.202)(0.188)(0.055)
High_Inst(SIC3)0.0045 *−0.0062−0.0002 0.08720.0594−0.0325 **
(0.003)(0.007)(0.003) (0.057)(0.048)(0.014)
Roa0.0038 ***−0.0123 ***0.0009 0.01550.0148−0.0291 ***
(0.001)(0.002)(0.001) (0.035)(0.029)(0.008)
Size−0.0095 ***0.0288 ***−0.0012 0.0644 *0.0711 **0.1041 ***
(0.001)(0.003)(0.001) (0.033)(0.029)(0.007)
Tangibility−0.00470.00630.0010 0.00250.0290−0.0657
(0.008)(0.022)(0.008) (0.233)(0.198)(0.055)
Dividend−0.0023−0.0180 ***−0.0098 ***0.08120.07530.0244 *
(0.002)(0.006)(0.002) (0.054)(0.046)(0.013)
Cash0.0108 **0.0325 **0.0331 ***0.06660.0618−0.0190
(0.005)(0.014)(0.005) (0.134)(0.114)(0.033)
TobinsQ0.0002 **−0.0007 ***0.0001 0.00100.00120.0013
(0.000)(0.000)(0.000) (0.006)(0.005)(0.001)
DEratio−0.0013 ***0.0052 ***−0.0002 0.00430.00280.0029 ***
(0.000)(0.000)(0.000) (0.004)(0.003)(0.001)
Firm FEYesYesYesYesYesYes
Year FEYesYesYesYesYesYes
Adj. R20.470.520.59 0.210.240.38
Observations65,75265,76265,762 41,44041,44041,050
Disclaimer/Publisher’s Note: The statements, opinions and data contained in all publications are solely those of the individual author(s) and contributor(s) and not of MDPI and/or the editor(s). MDPI and/or the editor(s) disclaim responsibility for any injury to people or property resulting from any ideas, methods, instructions or products referred to in the content.

