

Heart Rate Response, Temporal Structure and the Stroke Technique Distribution in Table Tennis National Category Matches

Abstract
:
1. Introduction
2. Materials and Methods
2.1. Participants
2.2. Procedures
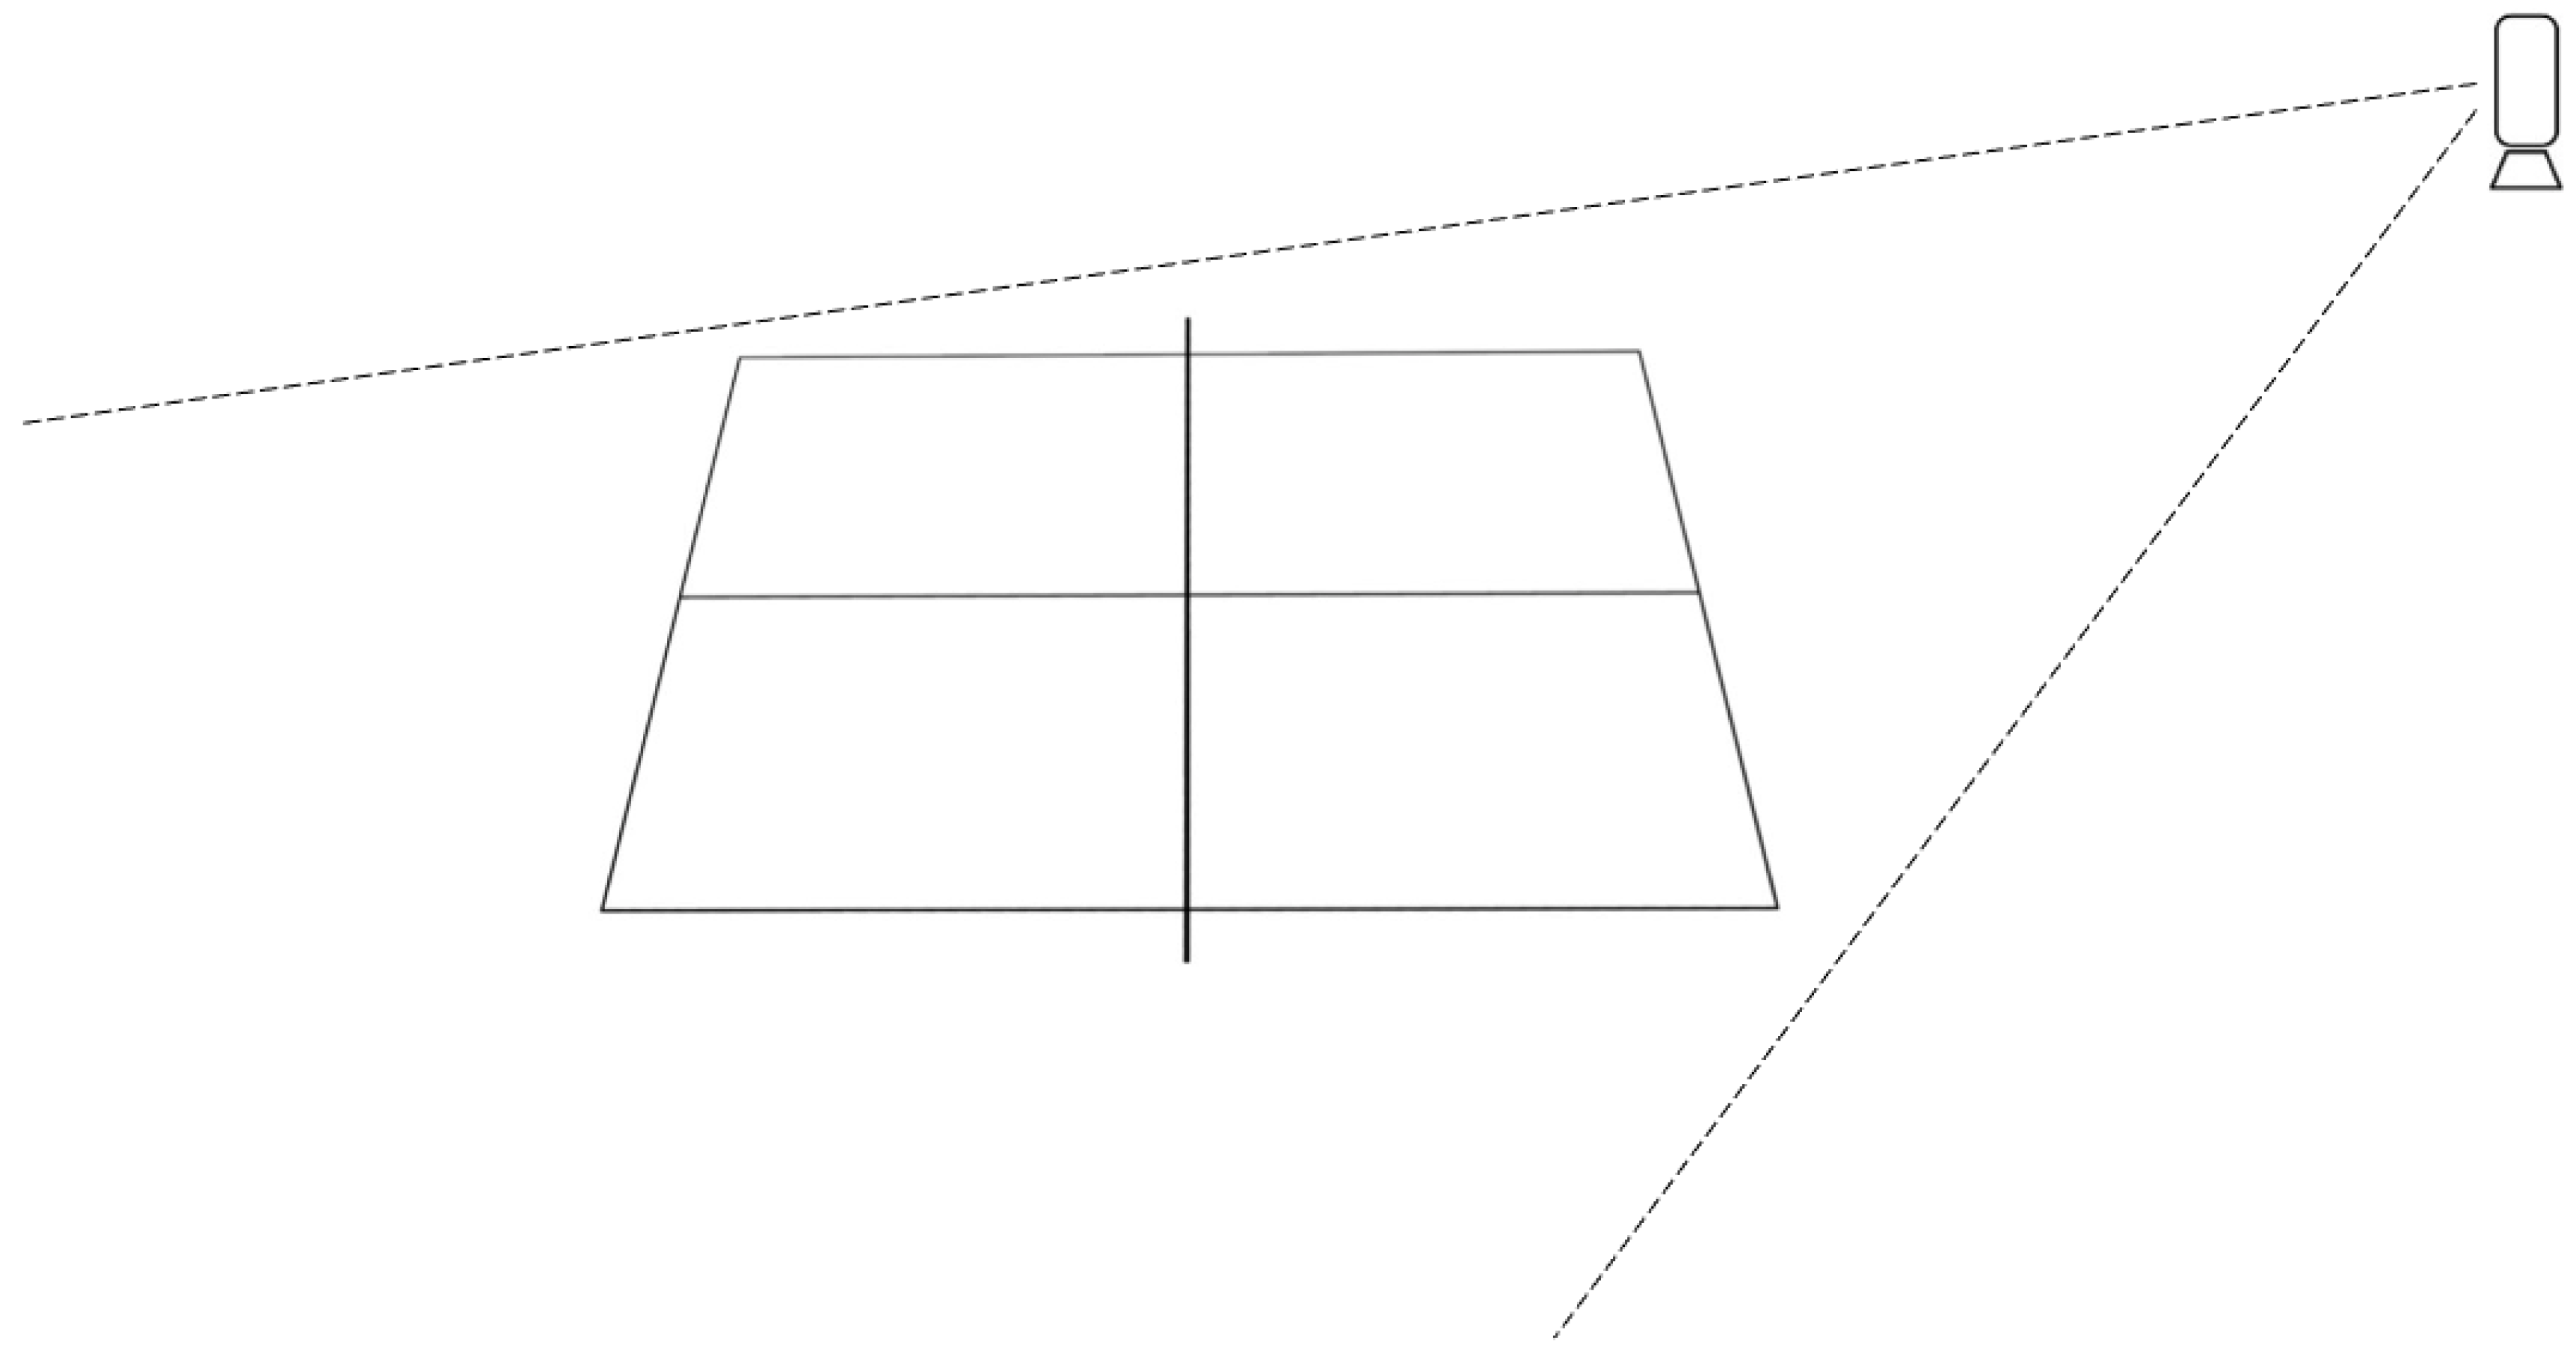
2.3. Measures
2.4. Statistical Analysis
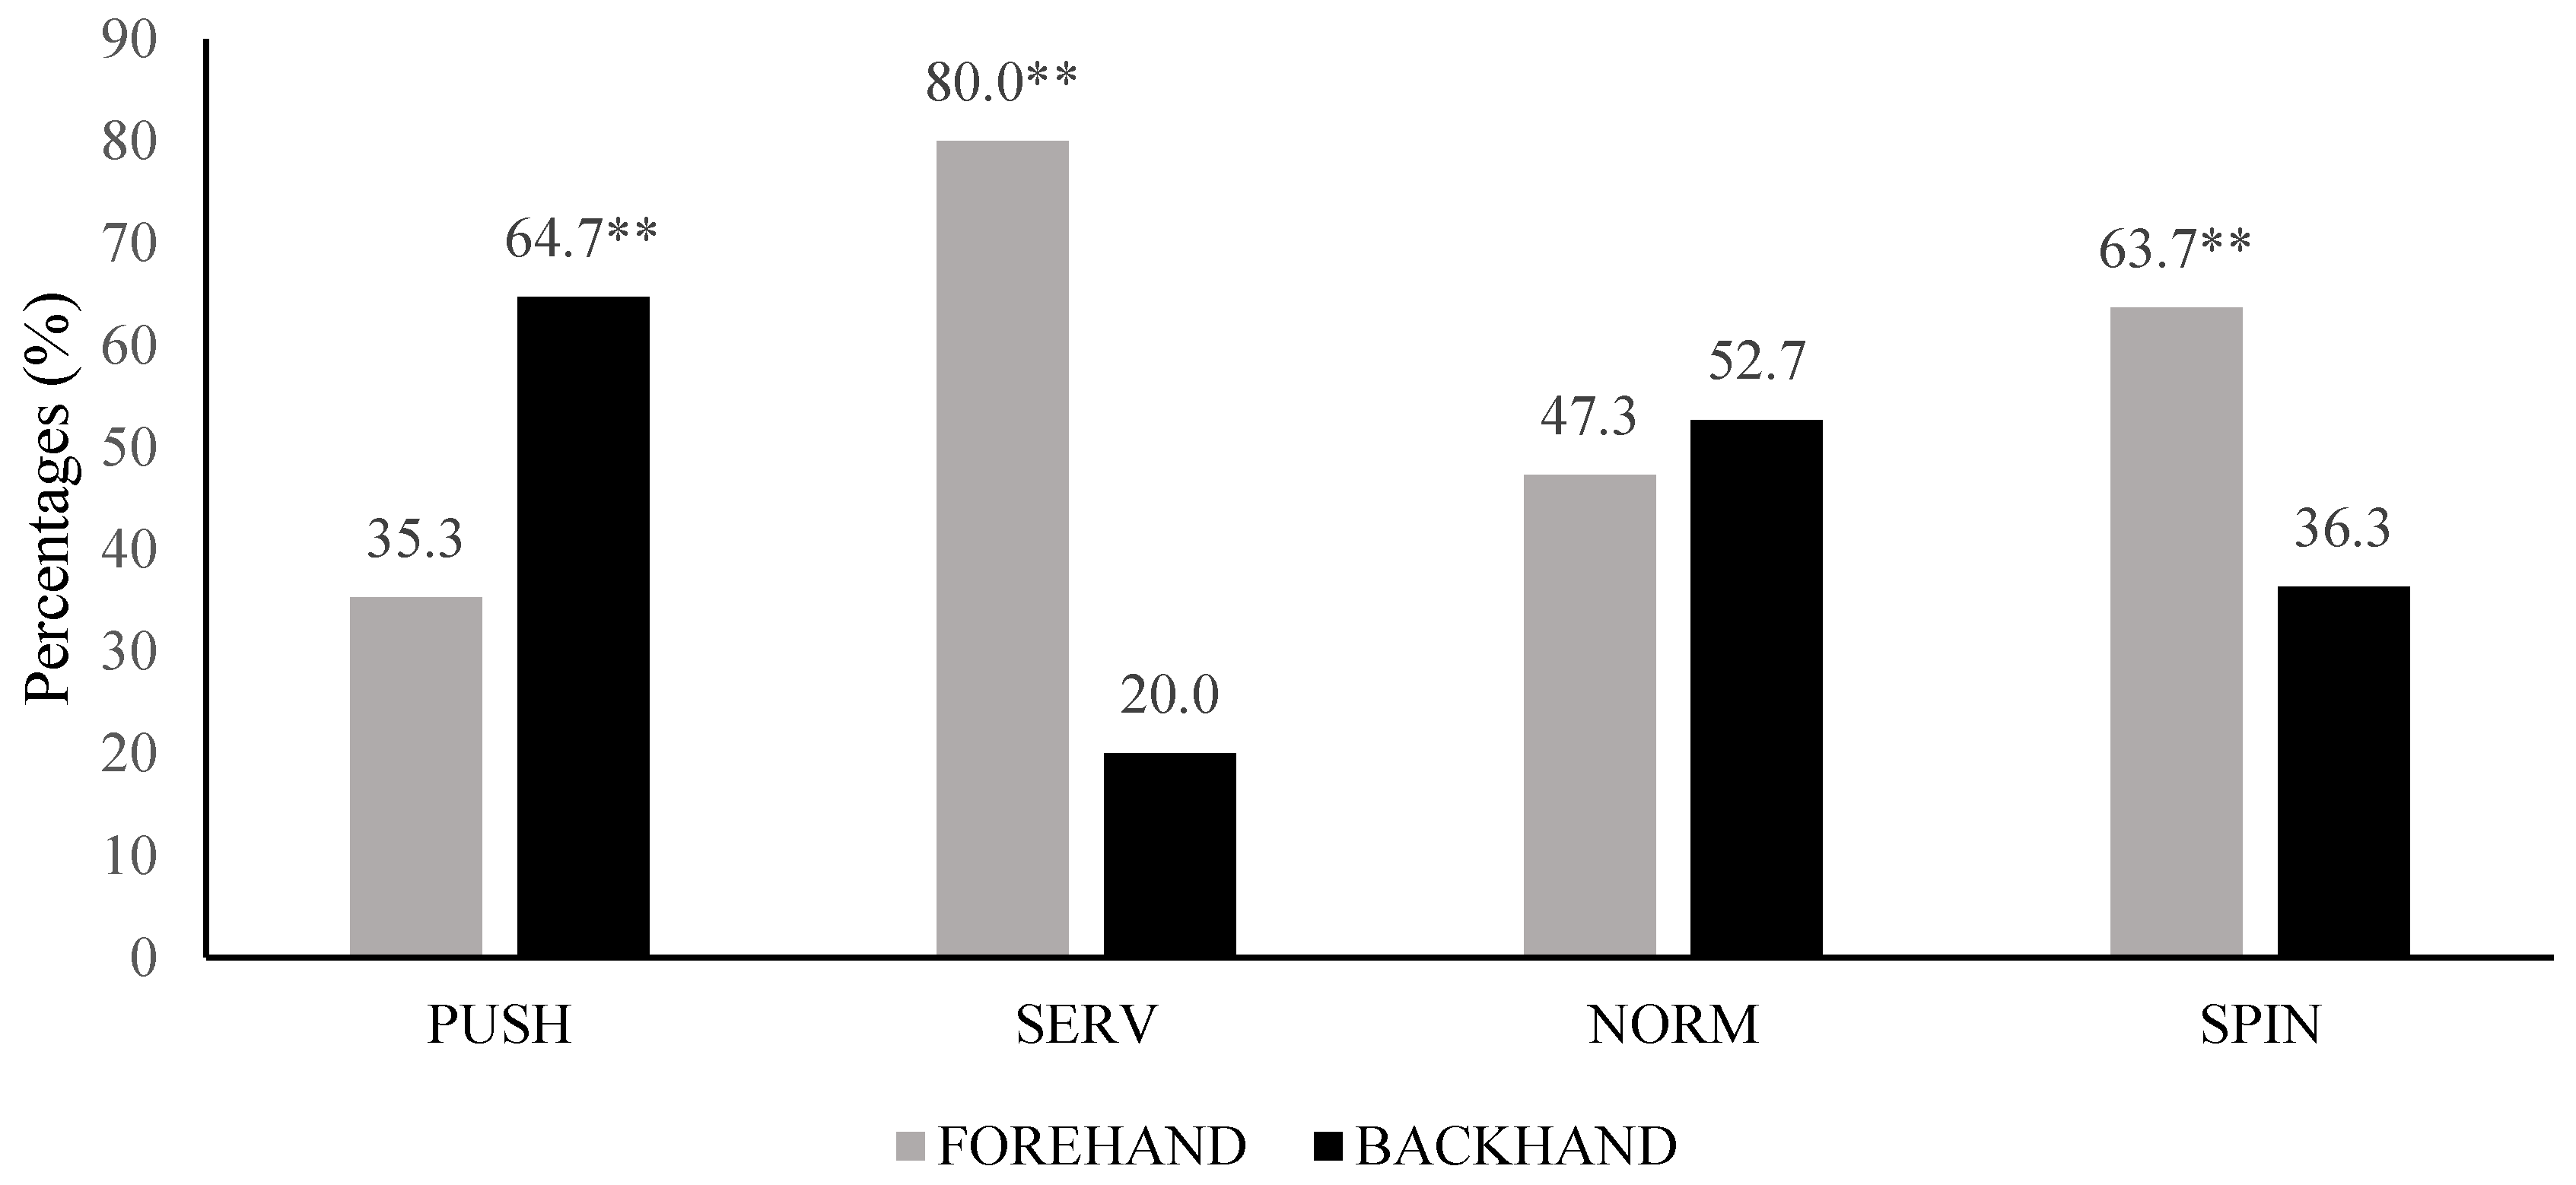
3. Results
4. Discussion
5. Conclusions
Author Contributions
Funding
Institutional Review Board Statement
Informed Consent Statement
Data Availability Statement
Acknowledgments
Conflicts of Interest
References
- Pradas, F.; Toro-Román, V.; de la Torre, A.; Moreno-Azze, A.; Gutiérrez-Betancur, J.F.; Ortega-Zayas, M.Á. Analysis of Specific Physical Fitness in High-Level Table Tennis Players—Sex Differences. Int. J. Environ. Res. Public Health 2022, 19, 5119. [Google Scholar] [CrossRef] [PubMed]
- Pradas, F.; de la Torre, A.; Castellar, C.; Toro-Román, V. Physiological Profile, Metabolic Response and Temporal Structure in Elite Individual Table Tennis: Differences According to Gender. Int. J. Environ. Res. Public Health 2021, 18, 11898. [Google Scholar] [CrossRef] [PubMed]
- Picabea, J.M.; Cámara, J.; Yanci, J. Physical Fitness Profiling of National Category Table Tennis Players: Implication for Health and Performance. Int. J. Environ. Res. Public Health 2021, 18, 9362. [Google Scholar] [CrossRef] [PubMed]
- De Mello Leite, J.V.; Barbieri, F.A.; Miyagi, W.; de Souza Malta, E.; Zagatto, A.M. Influence of game evolution and the phase of competition on temporal game structure in high-level table tennis tournaments. J. Hum. Kinet. 2017, 55, 55–67. [Google Scholar] [CrossRef] [PubMed] [Green Version]
- Kondric, M.; Furjan-Mandic, G.; Kondric, L.; Gabaglio, A. Physiological demands and testing in table tennis. Int. J. Table Tennis Sci. 2010, 6, 165–170. [Google Scholar]
- Pradas, F.; Ara, I.; Toro, V.; Courel-Ibáñez, J. Benefits of regular table tennis practice in body composition and physical fitness compared to physically active children aged 10–11 years. Int. J. Environ. Res. Public Health 2021, 18, 2854. [Google Scholar] [CrossRef]
- Zagatto, A.M.; Morel, E.A.; Gobatto, C.A. Physiological responses and characteristics of table tennis matches determined in official tournaments. J. Strength Cond. Res. 2010, 24, 942–949. [Google Scholar] [CrossRef]
- Faber, I.R.; Elferink-Gemser, M.T.; Faber, N.R.; Oosterveld, F.G.J.; Nijhuis-Van Der Sanden, M.W.G. Can perceptuo-motor skills assessment outcomes in young table tennis players (7–11 years) predict future competition participation and performance? An observational prospective study . PLoS ONE 2016, 11, 593–601. [Google Scholar] [CrossRef]
- Pradas de la Fuente, F.; Castellar, C.; Ochiana, N. Analysis of explosive and elastic-explosive strength of lower limbs in Spanish young top-level table tennis players. Gymnasium 2013, 14, 21–28. [Google Scholar]
- Wang, J.; Li, M.; Xiong, X. A Longitudinal Study of Changes in the Shot Characteristics of Women Table Tennis Players: Analysis of the Olympic Semifinals and Finals of Women’s Singles. Front. Psychol. 2022, 13, 901755. [Google Scholar] [CrossRef]
- Cabello Manrique, D.; González-Badillo, J.J. Analysis of the characteristics of competitive badminton. Br. J. Sport. Med. 2003, 37, 62–66. [Google Scholar] [CrossRef] [PubMed] [Green Version]
- Fernandez-Fernandez, J.; Mendez-Villanueva, A.; Fernandez-Garcia, B.; Terrados, N. Match activity and physiological responses during a junior female singles tennis tournament. Br. J. Sport. Med. 2007, 41, 711–716. [Google Scholar] [CrossRef] [PubMed]
- Zagatto, A.M.; Leite, J.V.; Papoti, M.; Beneke, R. Energetics of Table Tennis and Table Tennis-Specific Exercise Testing. Int. J. Sports Physiol. Perform. 2016, 11, 1012–1017. [Google Scholar] [CrossRef] [PubMed]
- Pradas, F.; Martínez, P.; Rapún, M.; Bataller, V.; Castellar, C.; Carrasco, L. Assessment of table tennis temporary structure. Int. J. Table Tennis Sci. 2011, 7, 80–85. [Google Scholar]
- Pradas de la Fuente, F.; Salvá Martínez, P.; González Campos, G.; González Jurado, J.A. Analysis of performance indicators that define the modern table tennis. J. Sport Health Res. 2015, 7, 149–162. [Google Scholar]
- Picabea, J.M.; Cámara, J.; Nakamura, F.Y.; Yanci, J. Comparison of Heart Rate Variability Before and After a Table Tennis Match. J. Hum. Kinet. 2021, 77, 107–115. [Google Scholar] [CrossRef]
- Malagoli Lanzoni, I.; Di Michele, R.; Merni, F. A notational analysis of shot characteristics in top-level table tennis players. Eur. J. Sport Sci. 2014, 14, 309–317. [Google Scholar] [CrossRef]
- Pradas, F.; Floría, P.; González Jurado, J.A.; Carrasco, L.; Bataller, V. Desarrollo de una herramienta de observación individual del tenis de mesa. J. Sport Health Res. 2012, 4, 255–268. [Google Scholar]
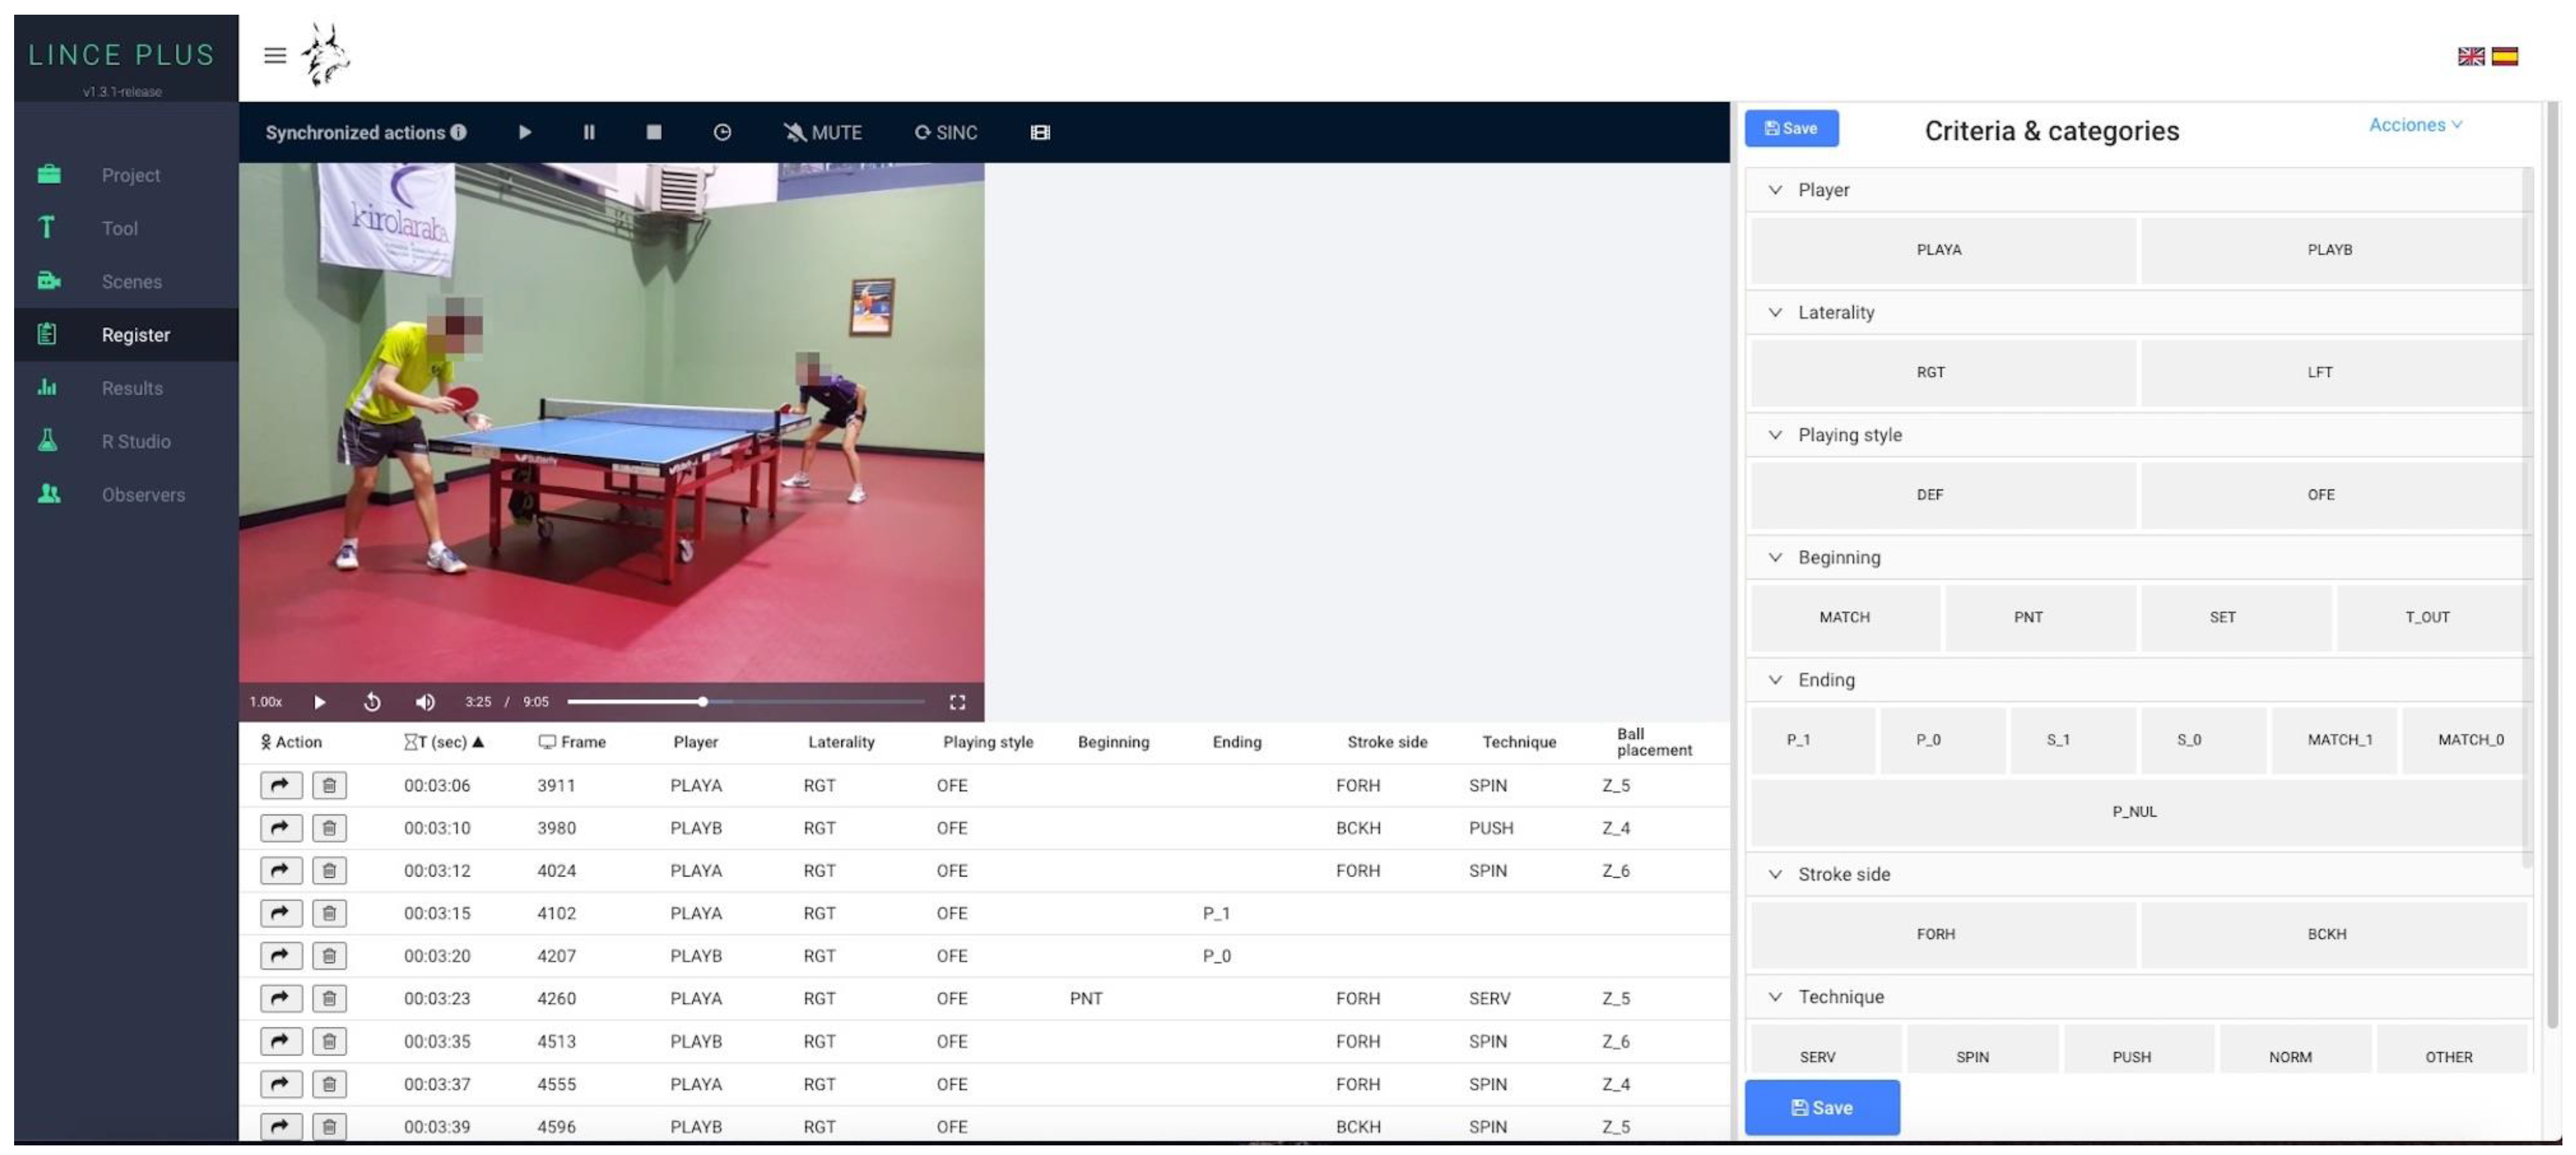
- Soto, A.; Camerino, O.; Iglesias, X.; Anguera, M.T.; Castañer, M. LINCE PLUS: Research Software for Behaviour Video Analysis. Apunts. Educ. Física Deportes 2019, 137, 149–153. [Google Scholar] [CrossRef]
- Kasai, J.; Ohta, A.; Jung, T.E.; Mori, T. Research on table tennis players cardio-respiratory endurance. Int. J. Table Tennis Sci. 2010, 6, 1–3. [Google Scholar]
- Suchomel, A. A comparison of exercise intensity on different player levels in table tennis. Int. J. Table Tennis Sci. 2010, 6, 79–82. [Google Scholar]
- Djokic, Z. Heart Rate Monitoring of Table Tennis Players. In Proceedings of the Science and Racket Sports III: The Proceedings of the Eighth International Table Tennis Federation Sports Science Congress and The Third World Congress of Science and Racket Sports, Paris, France, 17–19 May 2003; Routledge: London, UK, 2004; p. 24. [Google Scholar]
- Zagatto, A.M.; Kondric, M.; Knechtle, B.; Nikolaidis, P.T.; Sperlich, B. Energetic demand and physical conditioning of table tennis players. A study review. J. Sports Sci. 2017, 36, 724–731. [Google Scholar] [CrossRef] [Green Version]
- Zhang, H.; Zhou, Z.; Yang, Q. Match analyses of table tennis in China: A systematic review. J. Sport. Sci. 2018, 36, 2663–2674. [Google Scholar] [CrossRef] [PubMed]
- Zhang, K.N. Technical and tactical analysis of Japanese elite female table tennis players: Miu Hirano. Cont. Sport Sci. Tech. 2021, 11, 249–252. [Google Scholar] [CrossRef]
- Michael, K.; Theofilos, P.; Aikaterini, V. Real Play Time in Table Tennis Matches in the XXVIII Olympic Games Athens 2004. In Proceedings of the Book 10th Anniversary ITTF Sports Science Congress, Zagreb, Croatia, 18–20 May 2007; pp. 1–5. [Google Scholar]
- Kondric, M.; Zagatto, A.M.; Sekulic, D. The physiological demands of table tennis: A review. J. Sports Sci. Med. 2013, 12, 362–370. [Google Scholar] [PubMed]
- Malagoli Lanzoni, I.; Di Michele, R.; Merni, F. Technical and tactical performance oftop-class senior, junior and cadet table tennis players. Int. J. Table Tennis Sci. 2013, 8, 80–85. [Google Scholar]
- Huang, W.; Lu, M.; Zengm, Y.; Hu, M.; Xiao, Y. Technical and tactical diagnosis model of table tennis matches based on BP neural network. BMC Sport. Sci. Med. Rehabil. 2021, 13, 54. [Google Scholar]


| Player |
| PLAYA: Player serving |
| PLAYB: Player receiving |
| Laterality |
| RGT: Right-handed player |
| LFT: Left-handed player |
| Playing style |
| DEF: The player uses a defensive playing style |
| OFE: The player uses an offensive playing style |
| Beginning |
| MATCH: The match begins |
| PNT: The point begins |
| SET: The set begins |
| T_OUT: A time-out is requested |
| Ending |
| P_1: The player wins the point |
| P_0: The player loses the point |
| S_1: The player wins the set |
| S_0: The player loses the set |
| MATCH_1: The player wins the match |
| MATCH_0: The player loses the match |
| P_NUL: The point is considered as null |
| Stroke side |
| FORH: The stroke is done with the forehand sideBCKH: The stroke is done with the backhand side |
| Technique |
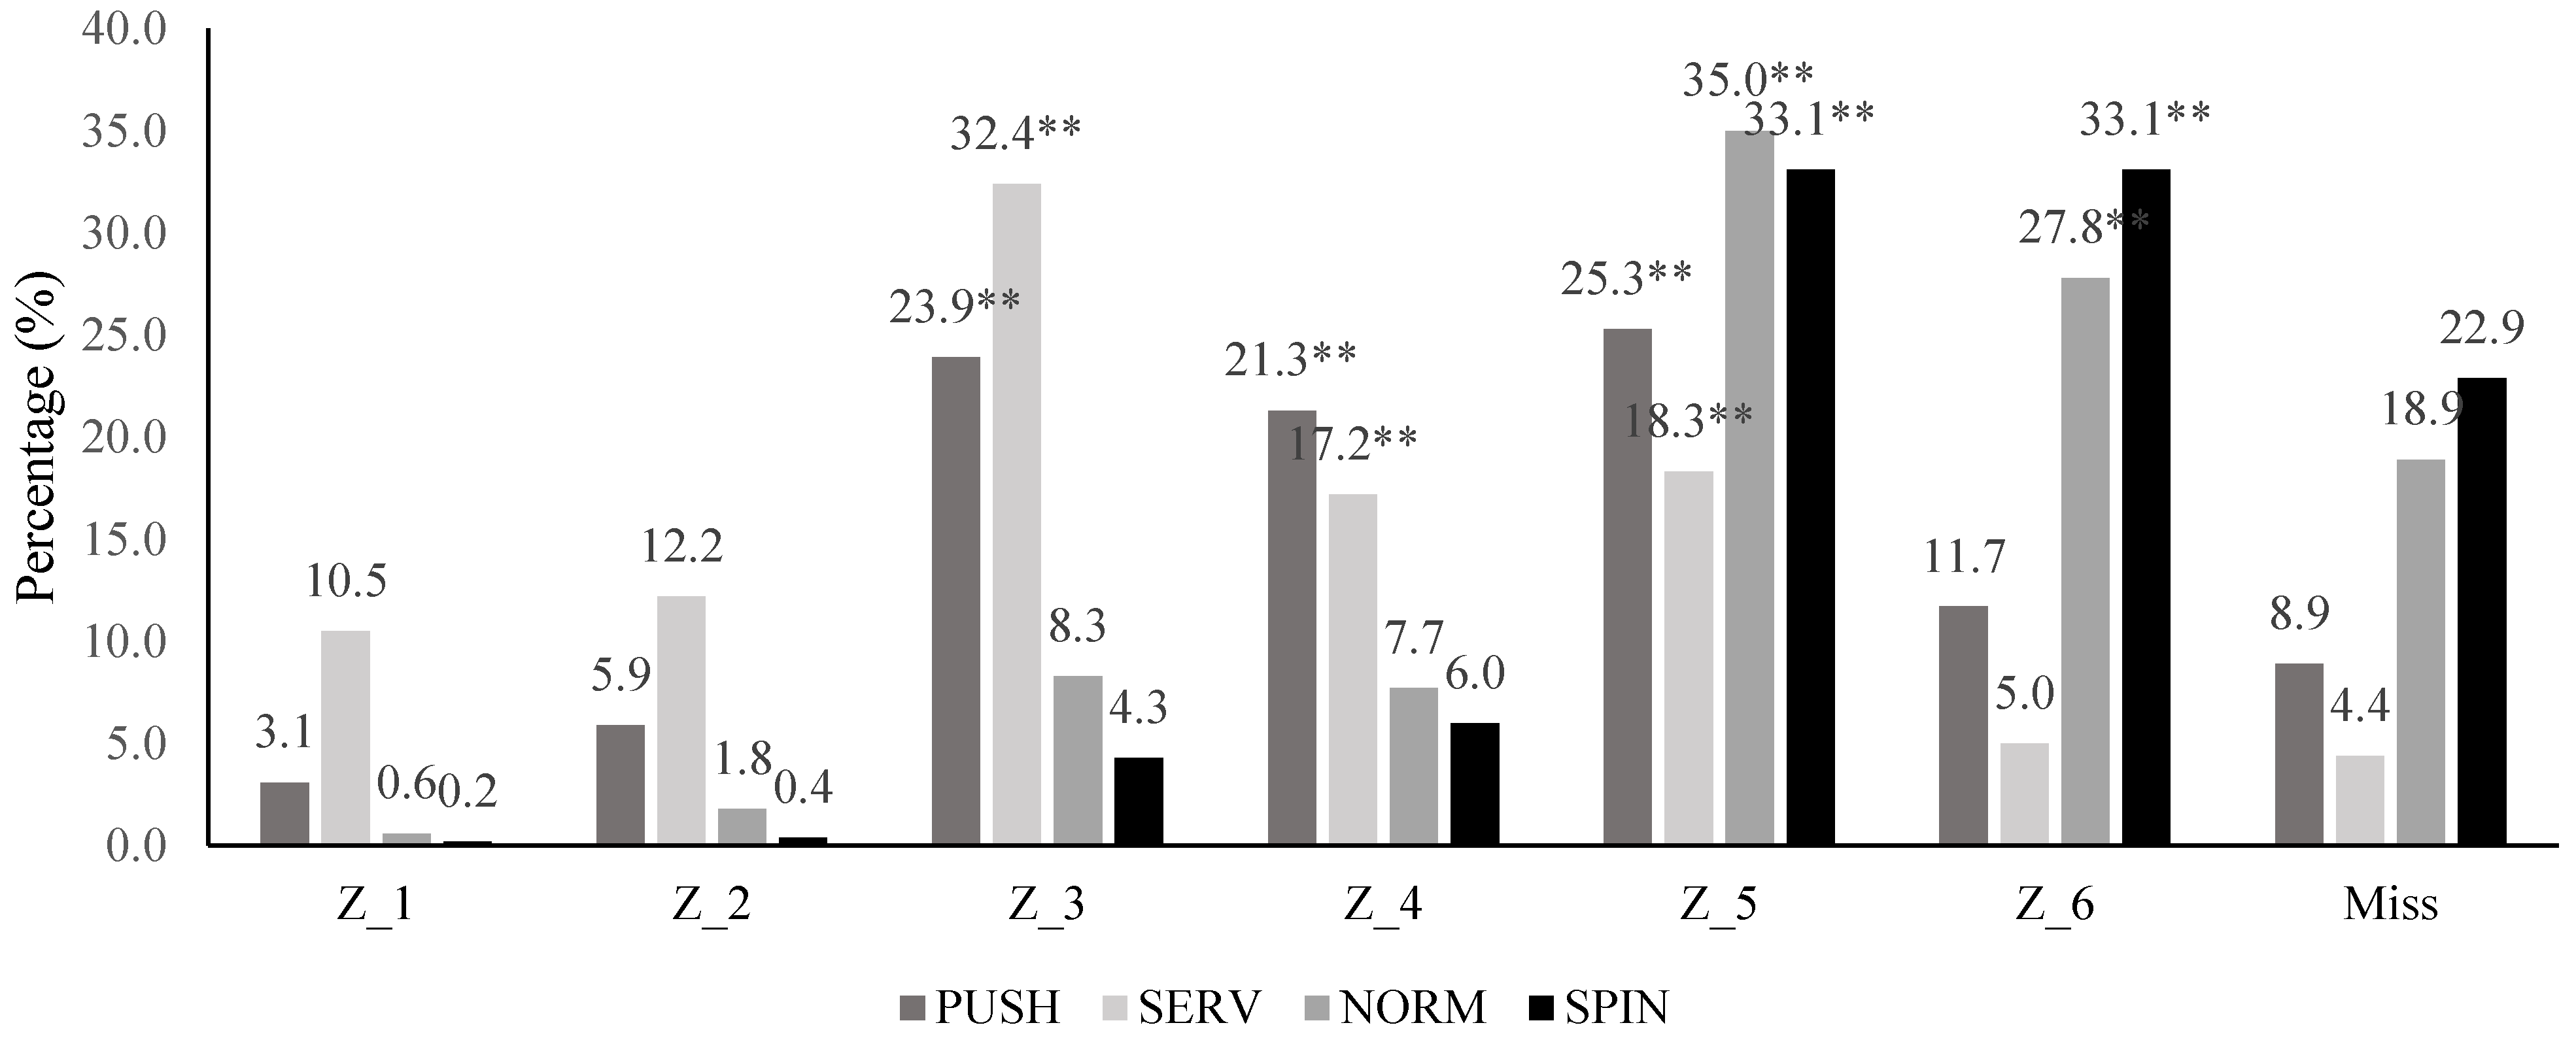
| SERV: Serve |
| SPIN: Stroke done close (flip) or far (topspin) from the table where the ball is given a spin effect with a down-up and back-forward racquet movement. |
| PUSH: Short distance stroke inside the table (push) or away from the table (chop) where the ball is given a backspin effect with an up-down and back-forward racquet movement. |
| NORM: Stroke done close (block) or medium distance (attack or smash) from the table where no effect is given to the ball with a back-forward racquet movement. |
| OTHER: Another technique not described in the previous ones |
| Ball placement |
| Z_1: The ball bounces in the left quadrant near the net. |
| Z_2: The ball bounces in the right quadrant near the net. |
| Z_3: The ball bounces in the intermediate left quadrant. |
| Z_4: The ball bounces in the intermediate right quadrant. |
| Z_5: The ball bounces in the left quadrant away from the net. |
| Z_6: The ball bounces in the right quadrant away from the net. |
| Side rotation |
| ROT: Side change in the last set |
| Mean ± SD | Min. | Max. | |
|---|---|---|---|
| Heart rate responses | |||
| HRmean (bpm) | 142.69 ± 14.10 | 107.71 | 171.5 |
| HRmin (bpm) | 104.81 ± 16.98 | 68.07 | 140.42 |
| HRpeak (bpm) | 167.26 ± 16.51 | 128.59 | 202.18 |
| Game temporal structure | |||
| TT (min) | 15.74 ± 3.82 | 7.13 | 21.63 |
| RPT (min) | 4.14 ± 1.47 | 1.77 | 7.51 |
| TRT (min) | 11.60 ± 2.67 | 4.33 | 15.31 |
| GD | 0.36 ± 0.12 | 0.21 | 0.76 |
| Forehand Stroke Techniques | Z_1% (n) | Z_2% (n) | Z_3% (n) | Z_4% (n) | Z_5% (n) | Z_6% (n) | Miss% (n) | Total% (n) | |
|---|---|---|---|---|---|---|---|---|---|
| SERV | 3.55% (154) | 3.89% (169) | 10.64% (462) | 5.52% (240) | 6.42% (279) | 1.61% (70) | 1.50% (65) | 33.13% (1439) | |
| SPIN | 0.00% (0) | 0.23% (10) | 1.61% (70) | 2.88% (125) | 12.48% (542) | 14.85% (645) | 8.70% (378) | 40.75% (1770) | |
| PUSH | 0.78% (34) | 1.59% (69) | 3.66% (159) | 5.52% (179) | 3.34% (145) | 1.50% (65) | 1.96% (85) | 16.94% (736) | |
| NORM | 0.12% (5) | 0.12% (5) | 0.81% (35) | 1.04% (45) | 2.76% (120) | 2.76% (120) | 1.59% (69) | 9.19% (399) | |
| OTHER | 0.00% (0) | 0.00% (0) | 0.00% (0) | 0.00% (0) | 0.00% (0) | 0.00% (0) | 0.00% (0) | 0.00% (0) | |
| TOTAL | 4.44% (193) | 5.82% (253) | 16.71% (726) | 13.56% (589) | 25.00% (1086) | 20.72% (900) | 13.74% (597) | 100% (4344) | |
| Backhand Stroke Technique | Z_1% (n) | Z_2% (n) | Z_3% (n) | Z_4% (n) | Z_5% (n) | Z_6% (n) | Miss% (n) | Total% (n) | |
| SERV | 1.11% (35) | 1.58% (50) | 3.80% (120) | 2.18% (69) | 1.58% (50) | 0.63% (20) | 0.47% (15) | 11.36% (359) | |
| SPIN | 0.16% (5) | 0.00% (0) | 1.58% (50) | 1.33% (42) | 11.96% (378) | 8.64% (273) | 8.19% (259) | 31.86% (1007) | |
| PUSH | 0.95% (30) | 1.71% (54) | 10.72% (339) | 8.38% (265) | 12.15% (384) | 5.66% (179) | 3.16% (100) | 42.74% (1351) | |
| NORM | 0.00% (0) | 0.32% (10) | 1.11% (35) | 0.63% (20) | 5.54% (175) | 3.61% (114) | 2.85% (90) | 14.05% (444) | |
| OTHER | 0.00% (0) | 0.00% (0) | 0.00% (0) | 0.00% (0) | 0.00% (0) | 0.00% (0) | 0.00% (0) | 0.00% (0) | |
| TOTAL | 2.21% (70) | 3.61% (114) | 17.21% (544) | 12.53% (396) | 31.22% (987) | 18.54% (586) | 14.68% (464) | 100% (3161) |
| SERV | SPIN | PUSH | NORM | HRmean | HRmin | HRpeak | TT | RPT | TRT | |
|---|---|---|---|---|---|---|---|---|---|---|
| SERV | ||||||||||
| SPIN | 0.26 | |||||||||
| PUSH | 0.47 ** | 0.04 | ||||||||
| NORM | 0.49 ** | 0.14 | 0.46 ** | |||||||
| HRmean | 0.02 | 0.14 | 0.05 | 0.18 | ||||||
| HRmin | −0.05 | 0.03 | 0.08 | 0.10 | 0.72 ** | |||||
| HRpeak | 0.00 | 0.08 | −0.04 | 0.12 | 0.88 ** | 0.50 ** | ||||
| TT | 0.59 ** | 0.07 | −0.09 | 0.09 | 0.02 | 0.07 | −0.04 | |||
| RPT | 0.59 ** | 0.23 | 0.48 ** | 0.76 ** | 0.04 | −0.02 | −0.09 | 0.90 ** | ||
| TRT | 0.57 ** | 0.16 | 0.50 ** | 0.67 ** | 0.18 | 0.12 | 0.11 | 0.96 ** | 0.77 ** |
Disclaimer/Publisher’s Note: The statements, opinions and data contained in all publications are solely those of the individual author(s) and contributor(s) and not of MDPI and/or the editor(s). MDPI and/or the editor(s) disclaim responsibility for any injury to people or property resulting from any ideas, methods, instructions or products referred to in the content. |
© 2022 by the authors. Licensee MDPI, Basel, Switzerland. This article is an open access article distributed under the terms and conditions of the Creative Commons Attribution (CC BY) license (https://creativecommons.org/licenses/by/4.0/).
Share and Cite
Picabea, J.M.; Cámara, J.; Yanci, J. Heart Rate Response, Temporal Structure and the Stroke Technique Distribution in Table Tennis National Category Matches. Int. J. Environ. Res. Public Health 2023, 20, 739. https://doi.org/10.3390/ijerph20010739
Picabea JM, Cámara J, Yanci J. Heart Rate Response, Temporal Structure and the Stroke Technique Distribution in Table Tennis National Category Matches. International Journal of Environmental Research and Public Health. 2023; 20(1):739. https://doi.org/10.3390/ijerph20010739
Chicago/Turabian StylePicabea, Jon Mikel, Jesús Cámara, and Javier Yanci. 2023. "Heart Rate Response, Temporal Structure and the Stroke Technique Distribution in Table Tennis National Category Matches" International Journal of Environmental Research and Public Health 20, no. 1: 739. https://doi.org/10.3390/ijerph20010739