
Evaluation of the Effectiveness of the National Clean Air Programme in Terms of Health Impacts from Exposure to PM2.5 and NO2 Concentrations in Poland

Abstract
:1. Introduction
2. Materials and Methods
2.1. Study Area
2.2. GEM-AQ Model
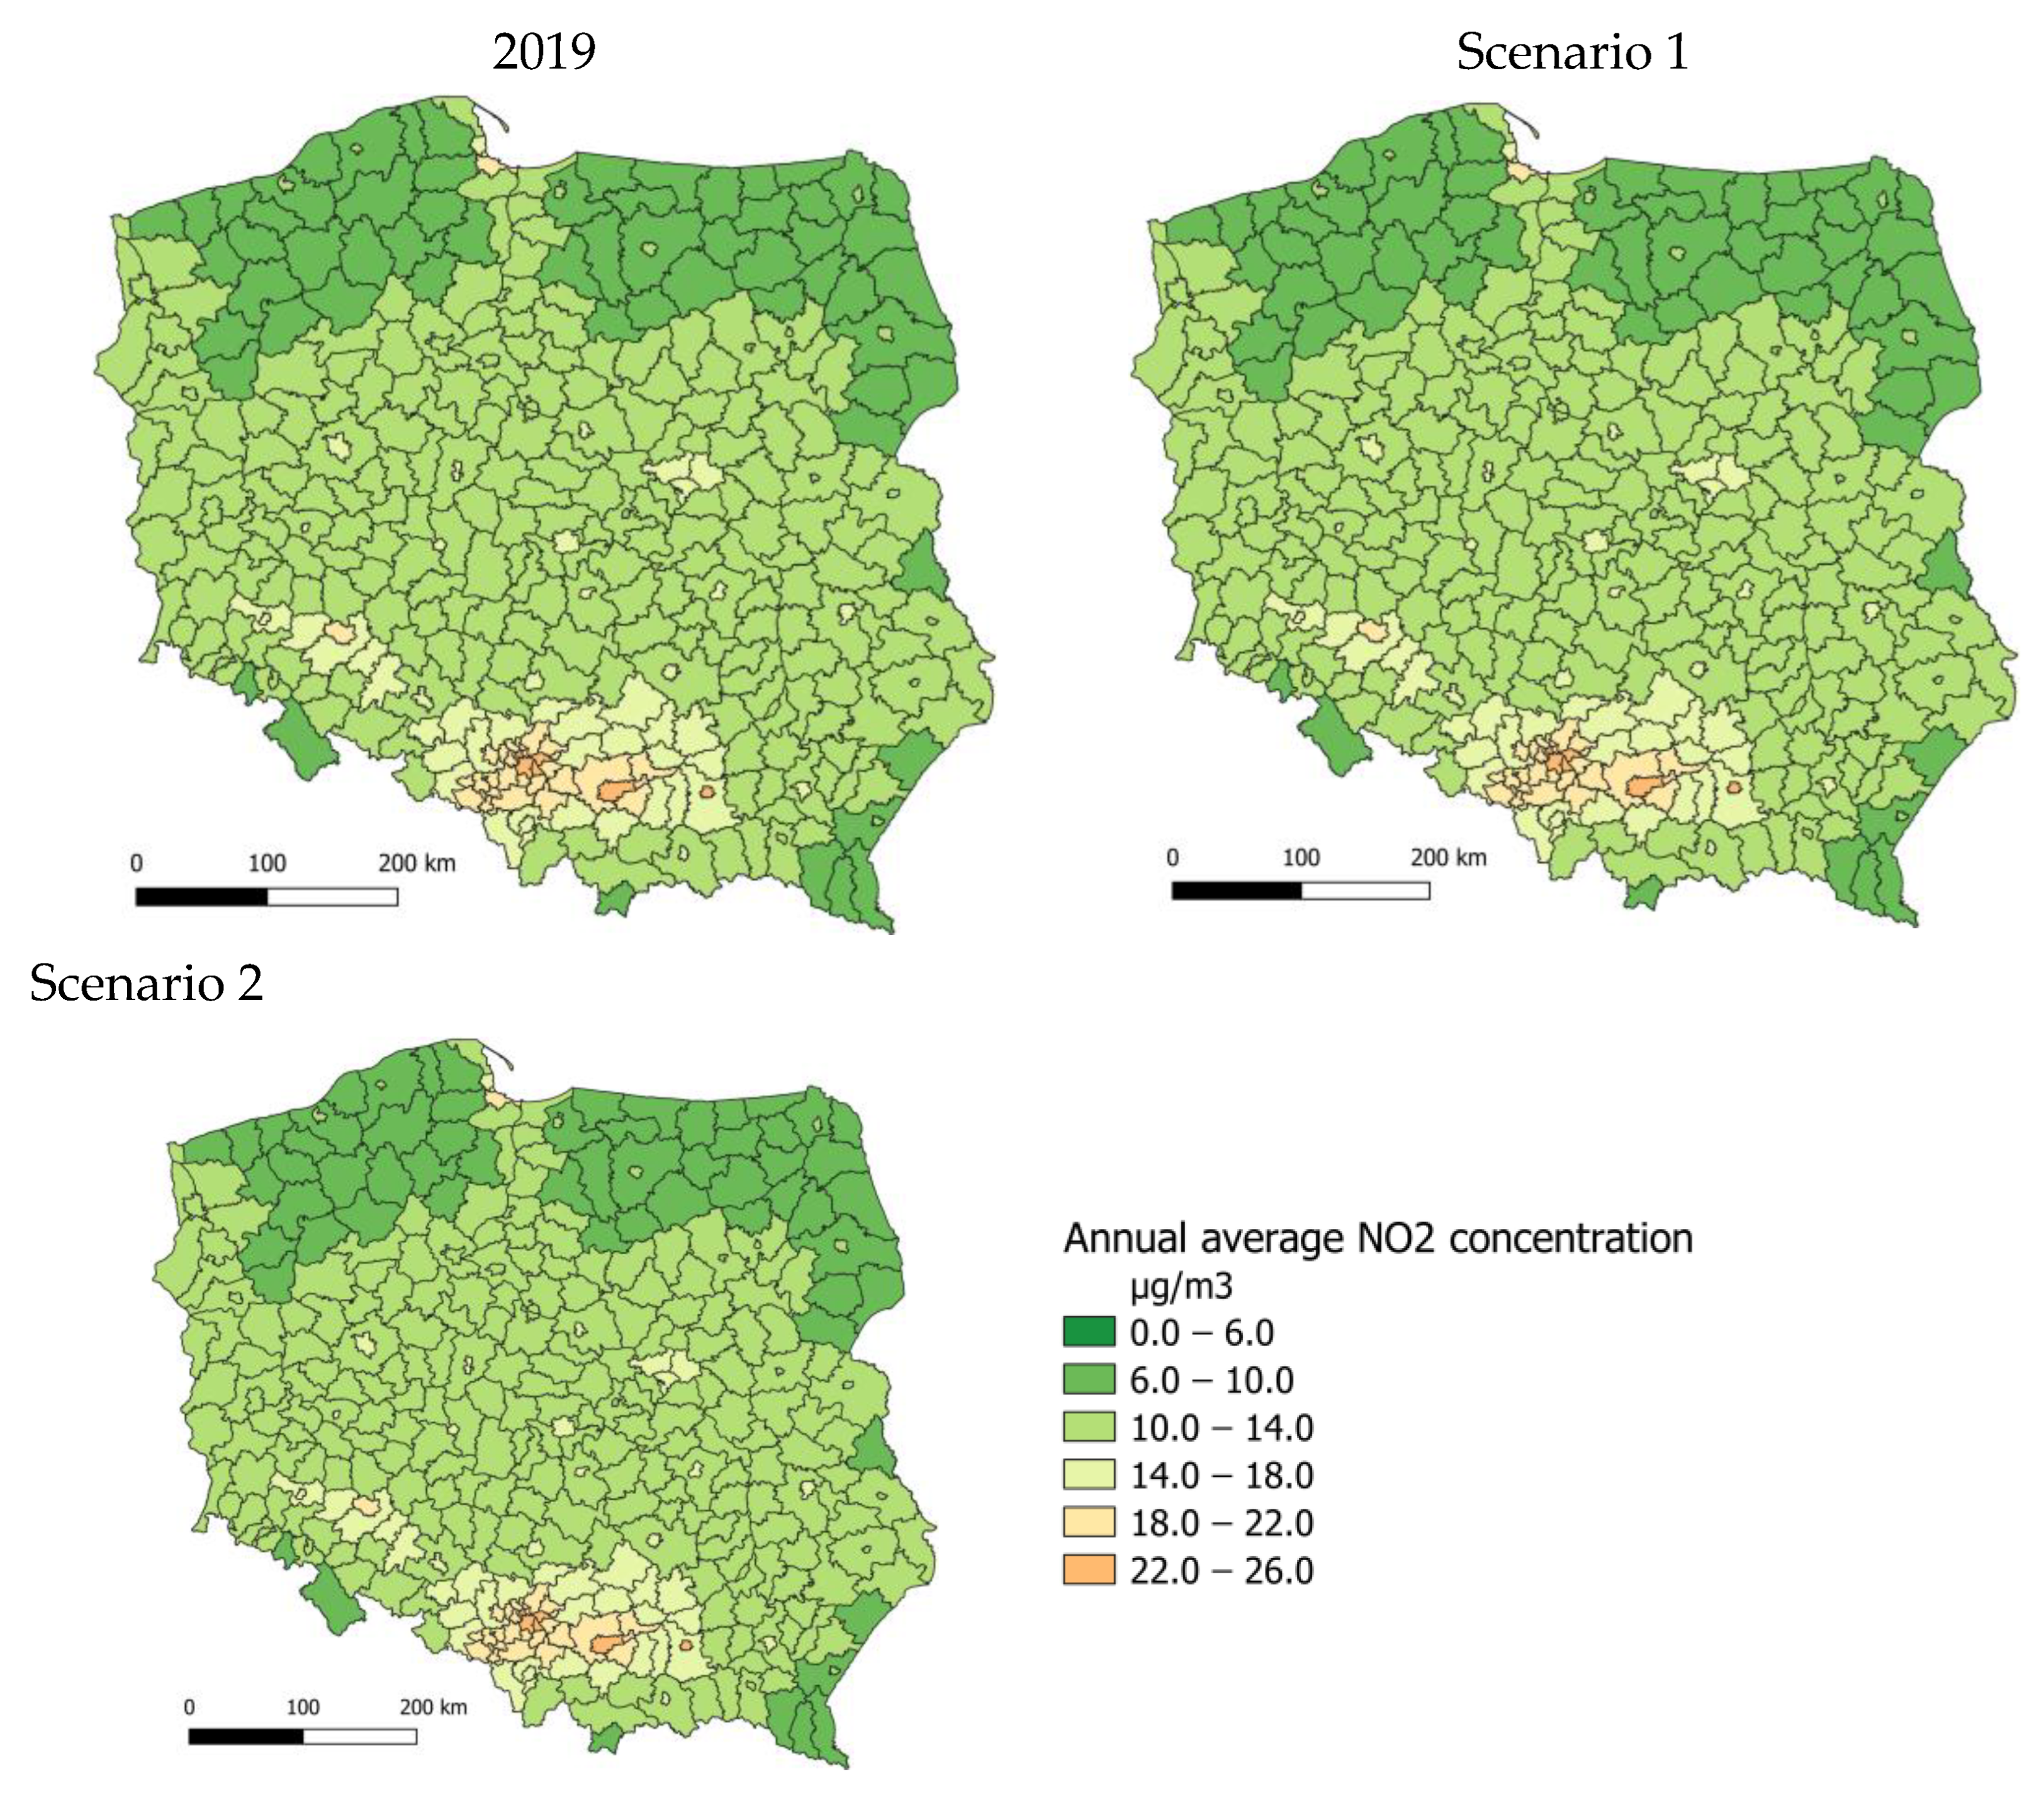
2.3. Scenarios
- Base scenario—emissions from the national Central Emission Database for 2019 without modifications.
- Scenario 1—emission reductions were applied in all voivodeships in Poland. Since there are approx. 6.628 million single-family buildings in Poland, the change of emission factors was implemented for 30% of buildings in each administrative unit.
- Scenario 2—emission reductions were applied in 254 administrative units (out of 380), where the modelled annual average PM2.5 exceeded 20 µg/m3 in 2019. The change was applied to 39% of buildings in each selected county. For this scenario, if an exceedance occurred, even in one model grid, the entire county was eligible for emission reductions.
2.4. Methodology and Data
- Annual average concentrations of PM2.5 and NO2, calculated using the GEM-AQ model for the reference scenario 2019, averaged over counties;
- Annual average concentrations of PM2.5 and NO2 obtained in scenarios 1 and 2, using the GEM-AQ model, averaged over counties;
- Number of deaths per county in 2019, according to the Central Statistical Office [49];
- The total population in counties in 2019, according to the Statistical Office [49];
- Relative risk factor, assumed based on the HRAPIE project [50], as recommended by the WHO.
3. Results
3.1. Air Quality Changes
3.2. Health Effects
4. Discussion
5. Conclusions
Author Contributions
Funding
Institutional Review Board Statement
Informed Consent Statement
Data Availability Statement
Conflicts of Interest
References
- Chen, J.; Hoek, G. Long-Term Exposure to PM and All-Cause and Cause-Specific Mortality: A Systematic Review and Meta-Analysis. Environ. Int. 2020, 143, 105974. [Google Scholar] [CrossRef] [PubMed]
- Santos, U.; Arbex, M.; Braga, A.; Mizutani, R.; Cançado, J.; Terra-Filho, M.; Chatkin, J. Environmental air pollution: Respiratory effects. J. Bras. Pneumol. Publicacao 2021, 47, e20200267. [Google Scholar] [CrossRef] [PubMed]
- Hamanaka, R.B.; Mutlu, G. Particulate Matter Air Pollution: Effects on the Cardiovascular System . Front. Endocrinol. 2018, 9, 680. [Google Scholar] [CrossRef] [PubMed] [Green Version]
- Hwang, B.-F.; Chen, Y.-H.; Lin, Y.-T.; Wu, X.-T.; Leo Lee, Y. Relationship between exposure to fine particulates and ozone and reduced lung function in children. Environ. Res. 2015, 137, 382–390. [Google Scholar] [CrossRef] [PubMed]
- Rice, M.B.; Rifas-Shiman, S.L.; Litonjua, A.A.; Oken, E.; Gillman, M.W.; Kloog, I.; Luttmann-Gibson, H.; Zanobetti, A.; Coull, B.A.; Schwartz, J.; et al. Lifetime Exposure to Ambient Pollution and Lung Function in Children. Am. J. Respir. Crit. Care Med. 2016, 193, 881–888. [Google Scholar] [CrossRef] [Green Version]
- Dąbrowiecki, P.; Adamkiewicz, Ł.; Mucha, D.; Czechowski, P.; Soliński, M.; Chciałowski, A.; Badyda, A. Impact of Air Pollution on Lung Function among Preadolescent Children in Two Cities in Poland. J. Clin. Med. 2021, 10, 2375. [Google Scholar] [CrossRef]
- Adamkiewicz, Ł.; Matysiak, N. Smog w Polsce i Jego Konsekwencje; Polski INSTYTUT Ekonomiczny: Warsaw, Poland, 2019; ISBN 978-83-66306-59-2. [Google Scholar]
- Krajowy Ośrodek Bilansowania I Zarządzania Emisjami (KOBiZE). Krajowy bilans Emisji SO2, NOx, CO, NH3, NMLZO, pyłów, metali ciężkich i TZO za lata 2015–2017 w układzie klasyfikacji SNAP.; Raport syntetyczny; Krajowy Ośrodek Bilansowania I Zarządzania Emisjami: Warszawa, Poland, 2019. [Google Scholar]
- Li, J.; Gao, W.; Cao, L.; He, L.; Zhang, X.; Yan, Y.; Mao, J.; Xin, J.; Wang, L.; Tang, G.; et al. Effects of different stagnant meteorological conditions on aerosol chemistry and regional transport changes in Beijing, China. Atmos. Environ. 2021, 118483, 1352–2310. [Google Scholar] [CrossRef]
- Toro, A.R.; Kvakić, M.; Klaić, B.Z.; Koračin, D.; Morales, R.G.E.S.; Leiva, M.A.G. Exploring atmospheric stagnation during a severe particulate matter air pollution episode over complex terrain in Santiago, Chile. Environ. Pollut. 2019, 244, 705–714. [Google Scholar] [CrossRef]
- Maddison, J.W.; Abalos, M.; Barriopedro, D.; García-Herrera, R.; Garrido-Perez, J.M.; Ordóñez, C. Linking air stagnation in Europe with the synoptic- to large-scale atmospheric circulation. Weather. Clim. Dynam. 2021, 2, 675–694. [Google Scholar] [CrossRef]
- WHO. Health Effects of Particulate Matter. Policy Implications for Countries in Eastern Europe, Caucasus and Central Asia; WHO Regional Office for Europe: Copenhagen, Denmark, 2013; ISBN 9787 92 890 0001 7. [Google Scholar]
- Bu, X.; Xie, Z.; Liu, J.; Wei, L.; Wang, X.; Chen, M.; Ren, H. Global PM2.5-attributable health burden from 1990 to 2017: Estimates from the Global Burden of disease study 2017. Environ. Res. 2021, 197, 111123. [Google Scholar] [CrossRef]
- EEA. European Environment Agency. Air Quality in Europe—2018–2021 Report. Available online: https://www.eea.europa.eu/publications#c7=en&c11=5&c14=air-quality-reports&c12=EEA%20Report&b_start=0 (accessed on 27 December 2022).
- Khomenko, S.; Cirach, M.; Pereira-Barboza, E.; Mueller, N.; Barrera-Gómez, J.; Rojas-Rueda, D.; de Hoogh, K.; Hoek, G.; Nieuwenhuijsen, M. Premature mortality due to air pollution in European cities: A health impact assessment. Lancet Planet. Health 2021, 5, e121–e134. [Google Scholar] [CrossRef]
- Parascandola, M. Ambient air pollution and lung cancer in Poland: Research findings and gaps. J. Health Inequalities 2018, 4, 3–8. [Google Scholar] [CrossRef]
- Adamkiewicz, Ł.; Maciejewska, K.; Rabczenko, D.; Drzeciecka-Osiadacz, A. Ambient Particulate Air Pollution and Daily Hospital Admissions in 31 Cities in Poland. Atmosphere 2022, 13, 345. [Google Scholar] [CrossRef]
- World Health Organization. Air Quality Guidelines. 2005. Available online: https://www.who.int/publications/i/item/WHO-SDE-PHE-OEH-06.02 (accessed on 27 December 2022).
- World Health Organization. Global Air Quality Guidelines. 2021. Available online: https://www.who.int/publications/i/item/9789240034228 (accessed on 27 December 2022).
- Sicard, P.; Agathokleous, E.; De Marco, A.; Paoletti, E.; Calatayud, V. Urban population exposure to air pollution in Europe over the last decades. Environ. Sci. Eur. 2021, 33, 28. [Google Scholar] [CrossRef] [PubMed]
- Air Pollution and Health in Cities. Available online: https://www.stateofglobalair.org/resources/health-in-cities (accessed on 27 December 2022).
- Główny Instektorat Ochrony Środowiska. Roczne oceny jakości powietrza za rok 2019 dla każdego województwa. Available online: https://powietrze.gios.gov.pl/pjp/content/show/1002022 (accessed on 27 December 2022).
- Clean Air Programme. Available online: https://czystepowietrze.gov.pl/ (accessed on 27 December 2022).
- WHO. AirQ+ Software. Available online: https://www.who.int/europe/tools-and-toolkits/airq---software-tool-for-health-risk-assessment-of-air-pollution (accessed on 27 December 2022).
- Kaminski, J.W.; Neary, L.; Struzewska, J.; McConnell, J.C.; Lupu, A.; Jarosz, J.; Toyota, K.; Gong, S.L.; Côté, J.; Liu, X. GEM-AQ, an online global multiscale chemical weather modelling system: Model description and evaluation of gas phase chemistry processes. Atmos. Chem. Phys. 2008, 8, 3255–3281. [Google Scholar] [CrossRef] [Green Version]
- Côté, J.; Gravel, S.; Méthot, A.; Patoine, A.; Roch, M.; Staniforth, A. The operational CMC–MRB global environmental multiscale (GEM) model. Part I: Design considerations and formulation. Mon. Weather. Rev. 1998, 126, 1373–1395. [Google Scholar] [CrossRef]
- Enkatram, A.; Karamchandani, P.; Misra, P. Testing a comprehensive acid deposition model. Atmos. Environ. 1988, 22, 737–747. [Google Scholar] [CrossRef]
- Struzewska, J.; Kaminski, J.W. Impact of urban parameterisation on high resolution air quality forecast with the GEM—AQ model. Atmos. Chem. Phys. 2012, 12, 10387–10404. [Google Scholar] [CrossRef] [Green Version]
- Struzewska, J.; Zdunek, M.; Kaminski, J.W.; Łobocki, L.; Porebska, M.; Jefimow, M.; Gawuc, L. Evaluation of the GEM-AQ model in the context of the AQMEII Phase 1 project. Atmos. Chem. Phys. 2015, 15, 3971–3990. [Google Scholar] [CrossRef] [Green Version]
- Struzewska, J.; Kaminski, J.W. Formation and transport of photooxidants over Europe during the July 2006 heat wave—Observations and GEM-AQ model simulations. Atmos. Chem. Phys. 2008, 8, 721–736. [Google Scholar] [CrossRef]
- Struzewska, J.; Kaminski, J.; Jefimow, M. Application of model output statistics to the GEM-AQ high resolution air quality forecast. Atmos. Res. 2016, 181, 186–199. [Google Scholar] [CrossRef]
- European Air Quality, Copernicus, Atmosphere Monitoring Service. Available online: https://www.regional.atmosphere.copernicus.eu/ (accessed on 27 December 2022).
- Gawuc, L.; Szymankiewicz, K.; Kawicka, D.; Mielczarek, E.; Marek, K.; Soliwoda, M.; Maciejewska, J. Bottom–Up Inventory of Residential Combustion Emissions in Poland for National Air Quality Modelling: Current Status and Perspectives. Atmosphere 2021, 12, 1460. [Google Scholar] [CrossRef]
- Tagaris, E.; Sotiropoulou, R.E.P.; Gounaris, N.; Andronopoulos, S.; Vlachogiannis, D. Effect of the Standard Nomenclature for Air Pollution (SNAP) categories on air quality over Europe. Atmosphere 2015, 6, 1119–1128. [Google Scholar] [CrossRef] [Green Version]
- Chief Inspectorate for Environmental Protection. Assessment of Air Quality in Poland for 2019. Consolidated National Report on the Annual Assessment of Air Quality in Zones Performed by the Chief Inspectorate of Environmental Protection According to the Principles Set Out in Article 89 of the Act—Environmental Protection Law. Available online: https://powietrze.gios.gov.pl/pjp/publications/card/22100 (accessed on 27 December 2022).
- Search Engine for Equipment and Materials. Available online: https://lista-zum.ios.edu.pl/ (accessed on 27 December 2022).
- President of the Polish Parliament. Journal of Laws of the Republic of Poland. Consolidated Text of the Act on Support for Thermomodernisation and Renovation and on the Central Register of Building Emissions (Dz. U. z 2021 r. poz. 554, z późn. zm.); Polish Parliament: Warsaw, Poland, 2021.
- Topographic Objects Database. Available online: https://www.geoportal.gov.pl/dane/baza-danych-obiektow-topograficznych-bdot (accessed on 27 December 2022).
- Journal of Law of the Republic of Poland, M.P. 2019 poz. 572, Resolution No. 34 of the Council of Ministers of 29 April 2019 on the adoption of the National Programme for the Reduction of Air Pollution; Polish Parliament: Warsaw, Poland, 2019.
- Sacks, J.; Fann, N.; Gumy, S.; Kim, I.; Ruggeri, G.; Mudu, P. Quantifying the Public Health Benefits of Reducing Air Pollution: Critically Assessing the Features and Capabilities of WHO’s AirQ+ and U.S. EPA’s Environmental Benefits Mapping and Analysis Program—Community Edition (BenMAP—CE). Atmosphere 2020, 11, 516. [Google Scholar] [CrossRef] [PubMed]
- World Health Organization. 2020 AirQ+: Software Tool for Health Risk Assessment of Air Pollution. Available online: http://www.euro.who.int/en/health-topics/environment-and-health/air-quality/activities/airq-software-tool-for-health-risk-assessment-of-air-pollution (accessed on 27 December 2022).
- Sówka, I.; Pachurka, Ł.; Przepiórka, M.; Zwoździak, A.; Rogula-Kozłowska, W. Ocena krótkoterminowego wpływu stężeń pyłu zawieszonego na zdrowie mieszkańców Wrocławia. Politech. Koszalińska Rocz. Ochr. Sr. 2016, 18, 603–615. [Google Scholar]
- Sówka, I.; Nych, A.; Kobus, D.; Bezyk, J.; Zathey, M. Analysis of exposure of inhabitants of Polish cities to air pollution with particulate matters with application of statistical and geostatistical tools. E3S Web Conf. 2019, 100, 75. [Google Scholar] [CrossRef]
- Nasir, A.H.; Nawaz, R.; Haider, R.; Irshad, M.A. Modeling Air Pollution Health Risk for Environmental Management of an Internationally Important Site: The Salt Range (Kallar Kahar), Pakistan. Atmosphere 2022, 100, 100. [Google Scholar] [CrossRef]
- Matkovic, V.; Mulić, M.; Azabagić, S.; Jevtić, M. Premature Adult Mortality and Years of Life Lost Attributed to Long-Term Exposure to Ambient Particulate Matter Pollution and Potential for Mitigating Adverse Health Effects in Tuzla and Lukavac, Bosnia and Herzegovina. Atmosphere 2020, 1107, 1107. [Google Scholar] [CrossRef]
- Abbas, T.R.; Abbas, R.R. Assessing Health Impact of Air Pollutants in Five Iraqi Cities Using AirQ + Model, Conference Series. Mater. Sci. Eng. 2021, 1094, 012006. [Google Scholar]
- Hades, M.; Hopke, P.; Shahsavani, A.; Jahanmehr, N.; Rahmatinia, M.; Farhadi, M.; Yarahmadi, M.; Kermani, M. Mortality and morbidity economic burden due to PM2.5 and ozone: An AirQ+ modelling in Iran. J. Appl. Phycol. 2020, 5, 1–10. [Google Scholar]
- Rovira, J.; Domingo, J.L.; Schuhmacher, M. Air quality, health impacts and burden of disease due to air pollution (PM10, PM2.5, NO2 and O3): Application of AirQ+ model to the Camp de Tarragona County (Catalonia, Spain). Sci. Total Environ. 2020, 135538, 38–9697. [Google Scholar] [CrossRef]
- Statistics Poland. Available online: https://bdl.stat.gov.pl/bdl/start (accessed on 27 December 2022).
- Health risk or air pollution in Europe—HARPIE project. WHO. 2013. Available online: https://www.euro.who.int/__data/assets/pdf_file/0006/238956/Health_risks_air_pollution_HRAPIE_project.pdf (accessed on 27 December 2022).
- Wengler, L.; Mirosławska, D. Polskie Miasta dla Zdrowego Powietrza; Tom, I., Ed.; Polskie Towarzystwo Programów Zdrowotnych: Gdańsk, Poland, 2020; pp. 83–97. [Google Scholar]
- Połednik, B. Emissions of Air Pollution in Industrial and Rural Region in Poland and Health Impacts. J. Ecol. Eng. 2022, 23, 250–258. [Google Scholar] [CrossRef]
- Wojtyniak, B.; Goryński, P. Health Status of Polish Population and its Determinants; National Institute of Public Health—National Institute of Hygiene: Warsaw, Poland, 2020; pp. 483–500. [Google Scholar]
- Samek, L. Overall human mortality and morbidity due to exposure to air pollution. Int. J. Occup. Med. Environ. Health 2016, 29, 417–426. [Google Scholar] [CrossRef]


| Pollution | Health Exposure | Relative Risk [RR] | Reference Concentration [µg/m3] |
|---|---|---|---|
| PM2.5 | Number of premature deaths from natural causes | 1.062 | 10 |
| NO2 | Number of premature deaths from natural causes | 1.041 | 10 |
| 2019 | Scenario 1 | Scenario 2 | ||||||
|---|---|---|---|---|---|---|---|---|
| Counties | Premature Deaths (Per 100,000 Inhabitants) Populations | Counties | Premature Deaths (Per 100,000 Inhabitants) | Counties | Premature Deaths (Per 100,000 Inhabitants) | |||
| Estimated number of premature deaths due to annual average PM2.5 concentrations (per 100,000 population) | Highest exposure | 1 | Chorzów | 160 107,807 | Chorzów | 147 | Chorzów | 144 |
| 2 | Świętochłowice | 155 49,557 | Świętochłowice | 143 | Świętochłowice | 141 | ||
| 3 | Bytom | 130 165,263 | Bytom | 118 | Bytom | 116 | ||
| Lowest exposure | 4 | Policki | 10 80,652 | Policki | 10 | Policki | 10 | |
| 5 | Bytowski | 15 79,198 | Bytowski | 13 | Koszaliński | 14 | ||
| 6 | Koszaliński | 16 66,480 | Koszaliński | 14 | Bytowski | 14 | ||
| 2019 | Scenario 1 | Scenario 2 | ||||||||
|---|---|---|---|---|---|---|---|---|---|---|
| Counties | Premature Deaths (Per 100, 000 Inhabitants) Populations | Counties | Premature Deaths (Per 100,000 Inhabitants) Populations | Counties | Premature Deaths (Per 100,000 Inhabitants) Populations | |||||
| Estimated number of premature deaths due to annual average NO2 concentrations (per 100,000 population) | Highest exposure | 1 | Chorzów | 66 107,807 | Chorzów | 67 | Chorzów | 67 | ||
| 2 | Sosnowiec | 58 199,974 | Sosnowiec | 59 | Sosnowiec | 59 | ||||
| 3 | Katowice | 56 292,774 | Katowice | 57 | 4 | Świętochłowice | 57 49,557 | |||
| Lowest exposure | 5 | Czarnkowsko-Trzcianecki | 0.4 86,990 | Czarnkowsko-Trzcianecki | 0.4 | Czarnkowsko-Trzcianecki | 0.4 | |||
| 6 | Łomżyński | 0.4 50,943 | 8 | Ostrołęcki | 0.4 88,654 | Ostrołęcki | 0.4 | |||
| 7 | Nowomiejski | 0.4 43,822 | 9 | Bialski | 0.5 110,772 | Bialski | 0.5 | |||
| 2019 | Scenario 1 | Scenario 2 | |
|---|---|---|---|
| Estimated number of premature deaths due to annual average PM2.5 concentrations (Reference concentration 10 µg/m3) The number of natural deaths | 19,332 383,909 | 16 464 | 16 324 |
| Percentage of premature deaths nationally due to annual average PM2.5 concentrations | 5% | 4.3% | 4.3% |
| 2019 | Scenario 1 | Scenario 2 | |
|---|---|---|---|
| Estimated number of premature deaths due to annual average NO2 concentrations (Reference concentration 10 µg/m3) The number of natural deaths | 6008 383,909 | 6092 | 6 094 |
| Percentage of premature deaths nationally due to annual average NO2 concentrations | 1.5% | 1.55% | 1.55% |
Disclaimer/Publisher’s Note: The statements, opinions and data contained in all publications are solely those of the individual author(s) and contributor(s) and not of MDPI and/or the editor(s). MDPI and/or the editor(s) disclaim responsibility for any injury to people or property resulting from any ideas, methods, instructions or products referred to in the content. |
© 2022 by the authors. Licensee MDPI, Basel, Switzerland. This article is an open access article distributed under the terms and conditions of the Creative Commons Attribution (CC BY) license (https://creativecommons.org/licenses/by/4.0/).
Share and Cite
Jagiełło, P.; Struzewska, J.; Jeleniewicz, G.; Kamiński, J.W. Evaluation of the Effectiveness of the National Clean Air Programme in Terms of Health Impacts from Exposure to PM2.5 and NO2 Concentrations in Poland. Int. J. Environ. Res. Public Health 2023, 20, 530. https://doi.org/10.3390/ijerph20010530
Jagiełło P, Struzewska J, Jeleniewicz G, Kamiński JW. Evaluation of the Effectiveness of the National Clean Air Programme in Terms of Health Impacts from Exposure to PM2.5 and NO2 Concentrations in Poland. International Journal of Environmental Research and Public Health. 2023; 20(1):530. https://doi.org/10.3390/ijerph20010530
Chicago/Turabian StyleJagiełło, Paulina, Joanna Struzewska, Grzegorz Jeleniewicz, and Jacek W. Kamiński. 2023. "Evaluation of the Effectiveness of the National Clean Air Programme in Terms of Health Impacts from Exposure to PM2.5 and NO2 Concentrations in Poland" International Journal of Environmental Research and Public Health 20, no. 1: 530. https://doi.org/10.3390/ijerph20010530