

Fine-Scale Monitoring of Industrial Land and Its Intra-Structure Using Remote Sensing Images and POIs in the Hangzhou Bay Urban Agglomeration, China

Abstract
:1. Introduction
2. Materials and Methods
2.1. Materials
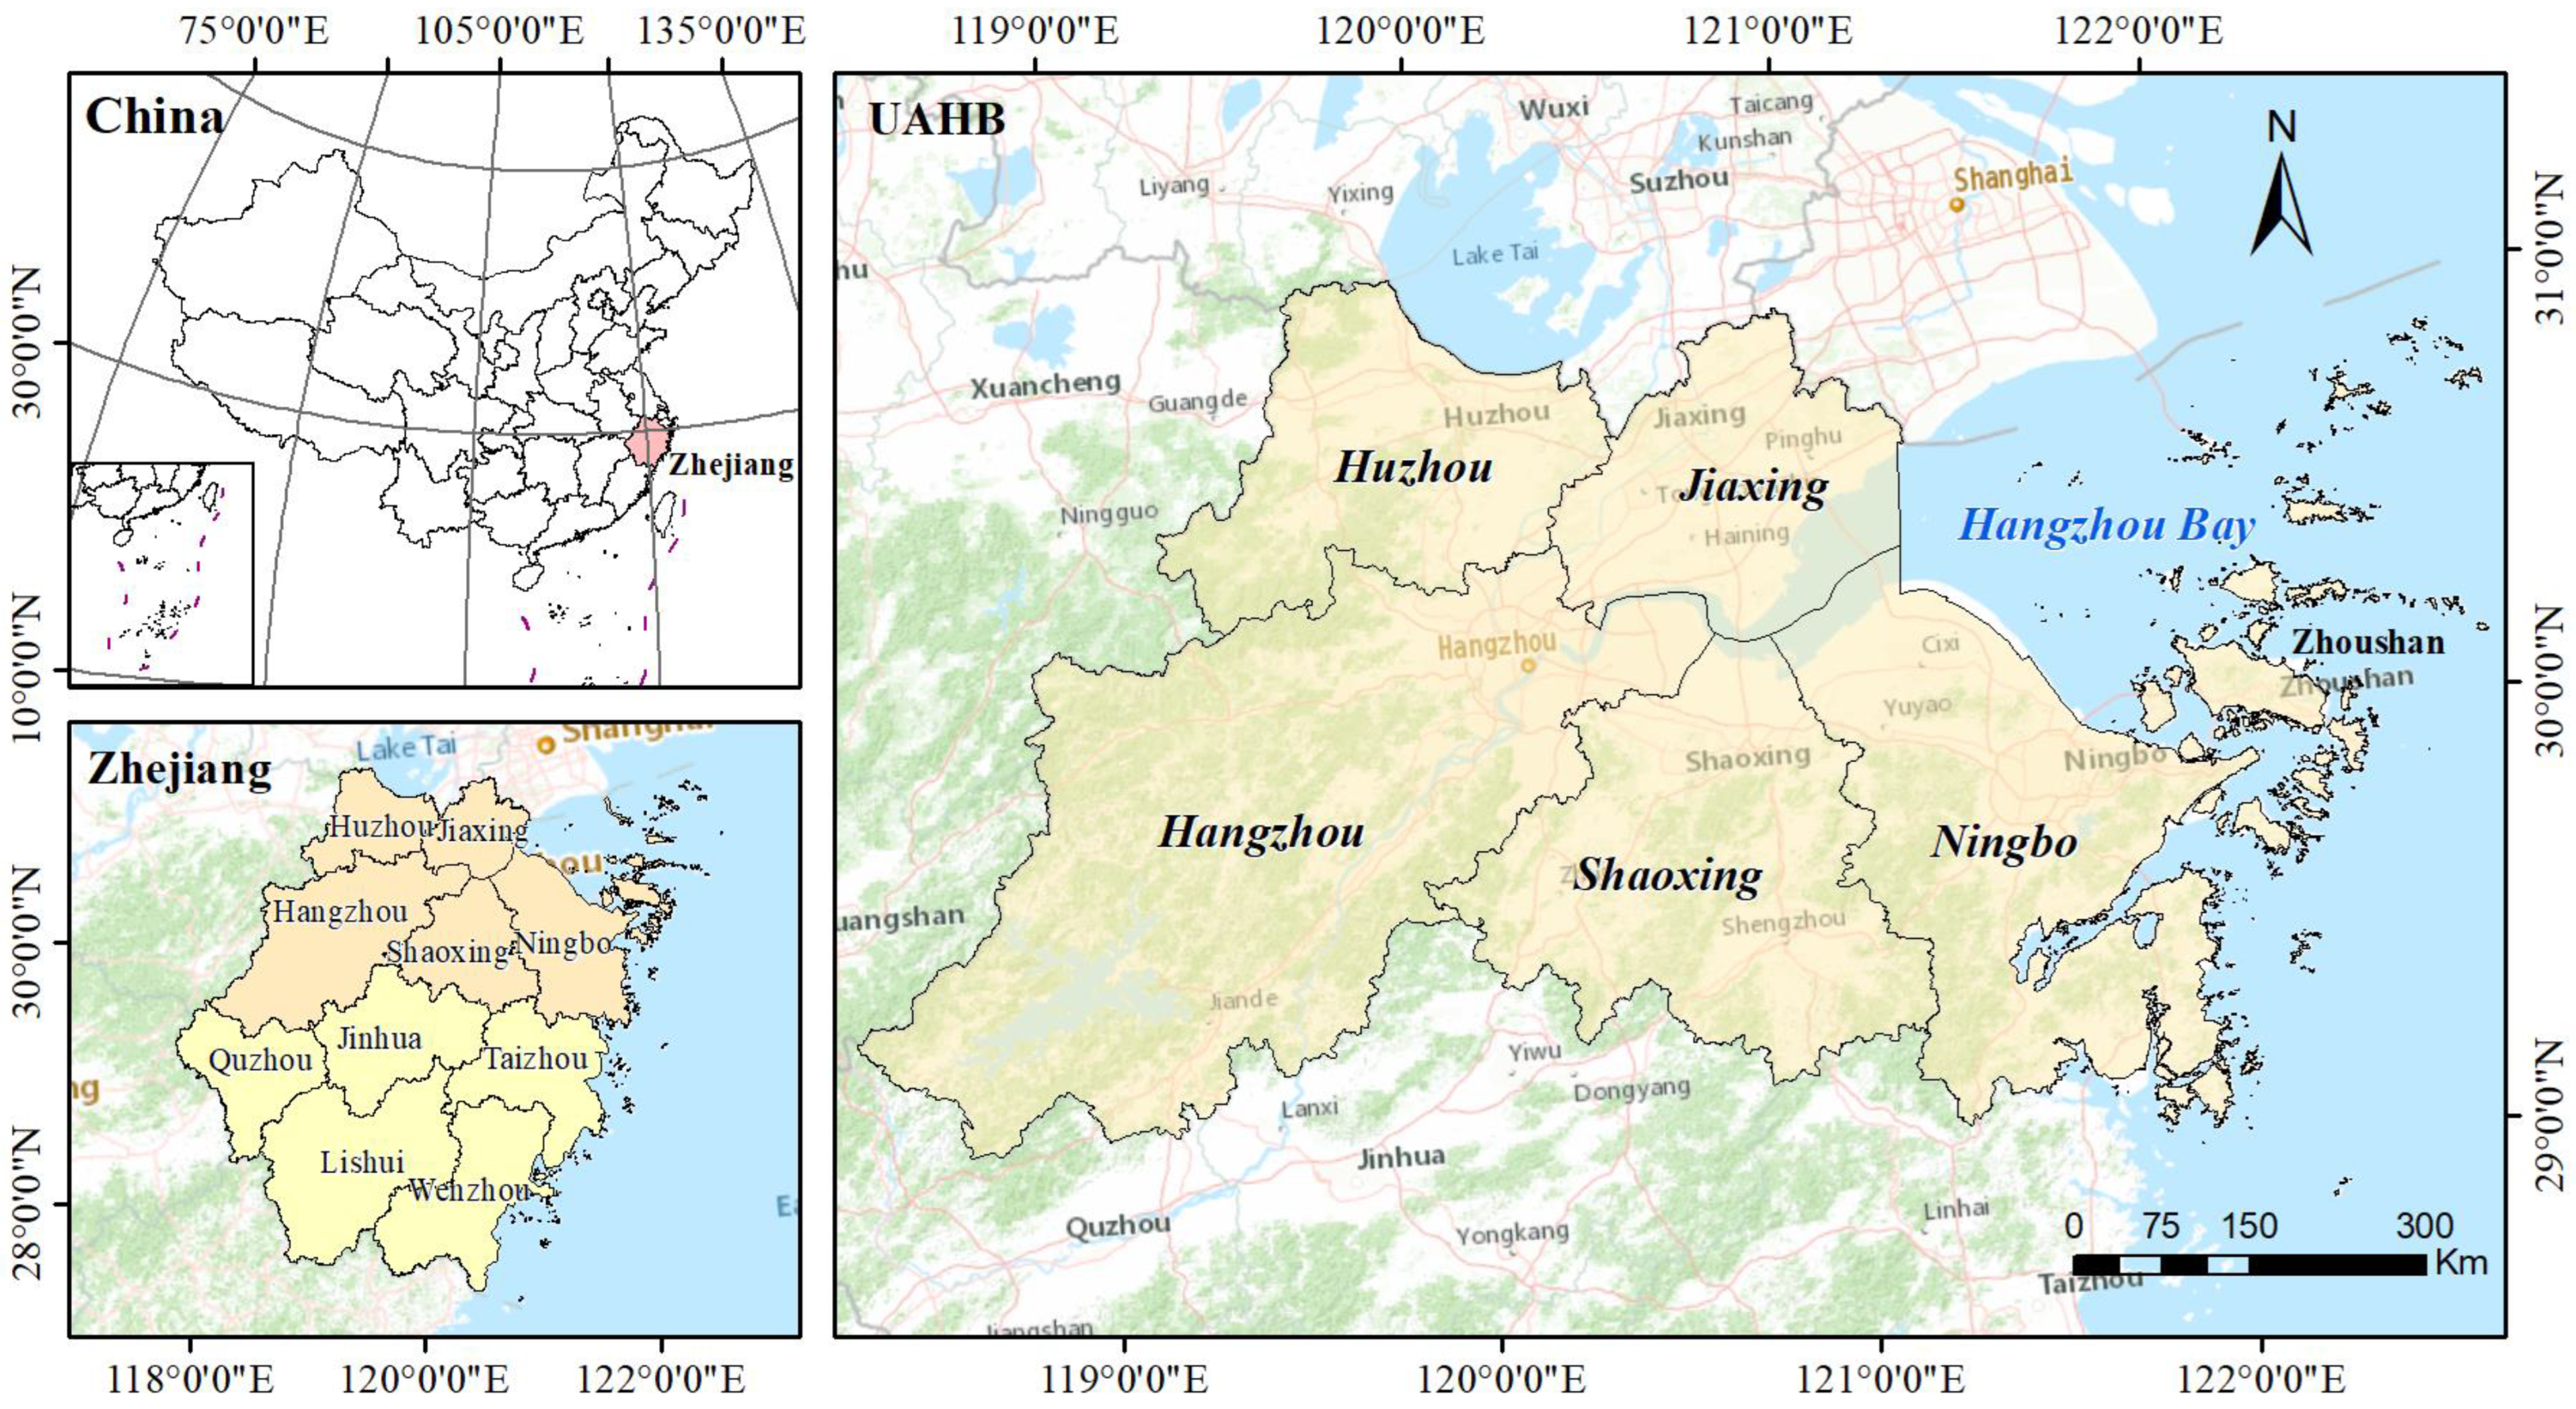
2.1.1. Study Area
2.1.2. Data Preparation
2.2. Methods
2.2.1. Identifying Industrial Structure Using Natural Language Learning and Machine Learning
2.2.2. Industrial Land Mapping Using Google Earth Maps
2.2.3. Spatial Measurements of Urban Industrial Land and Internal Structure
3. Results
3.1. Industrial Structure Classification
3.2. Overall Statistics of Industrial Land and Its Internal Structure
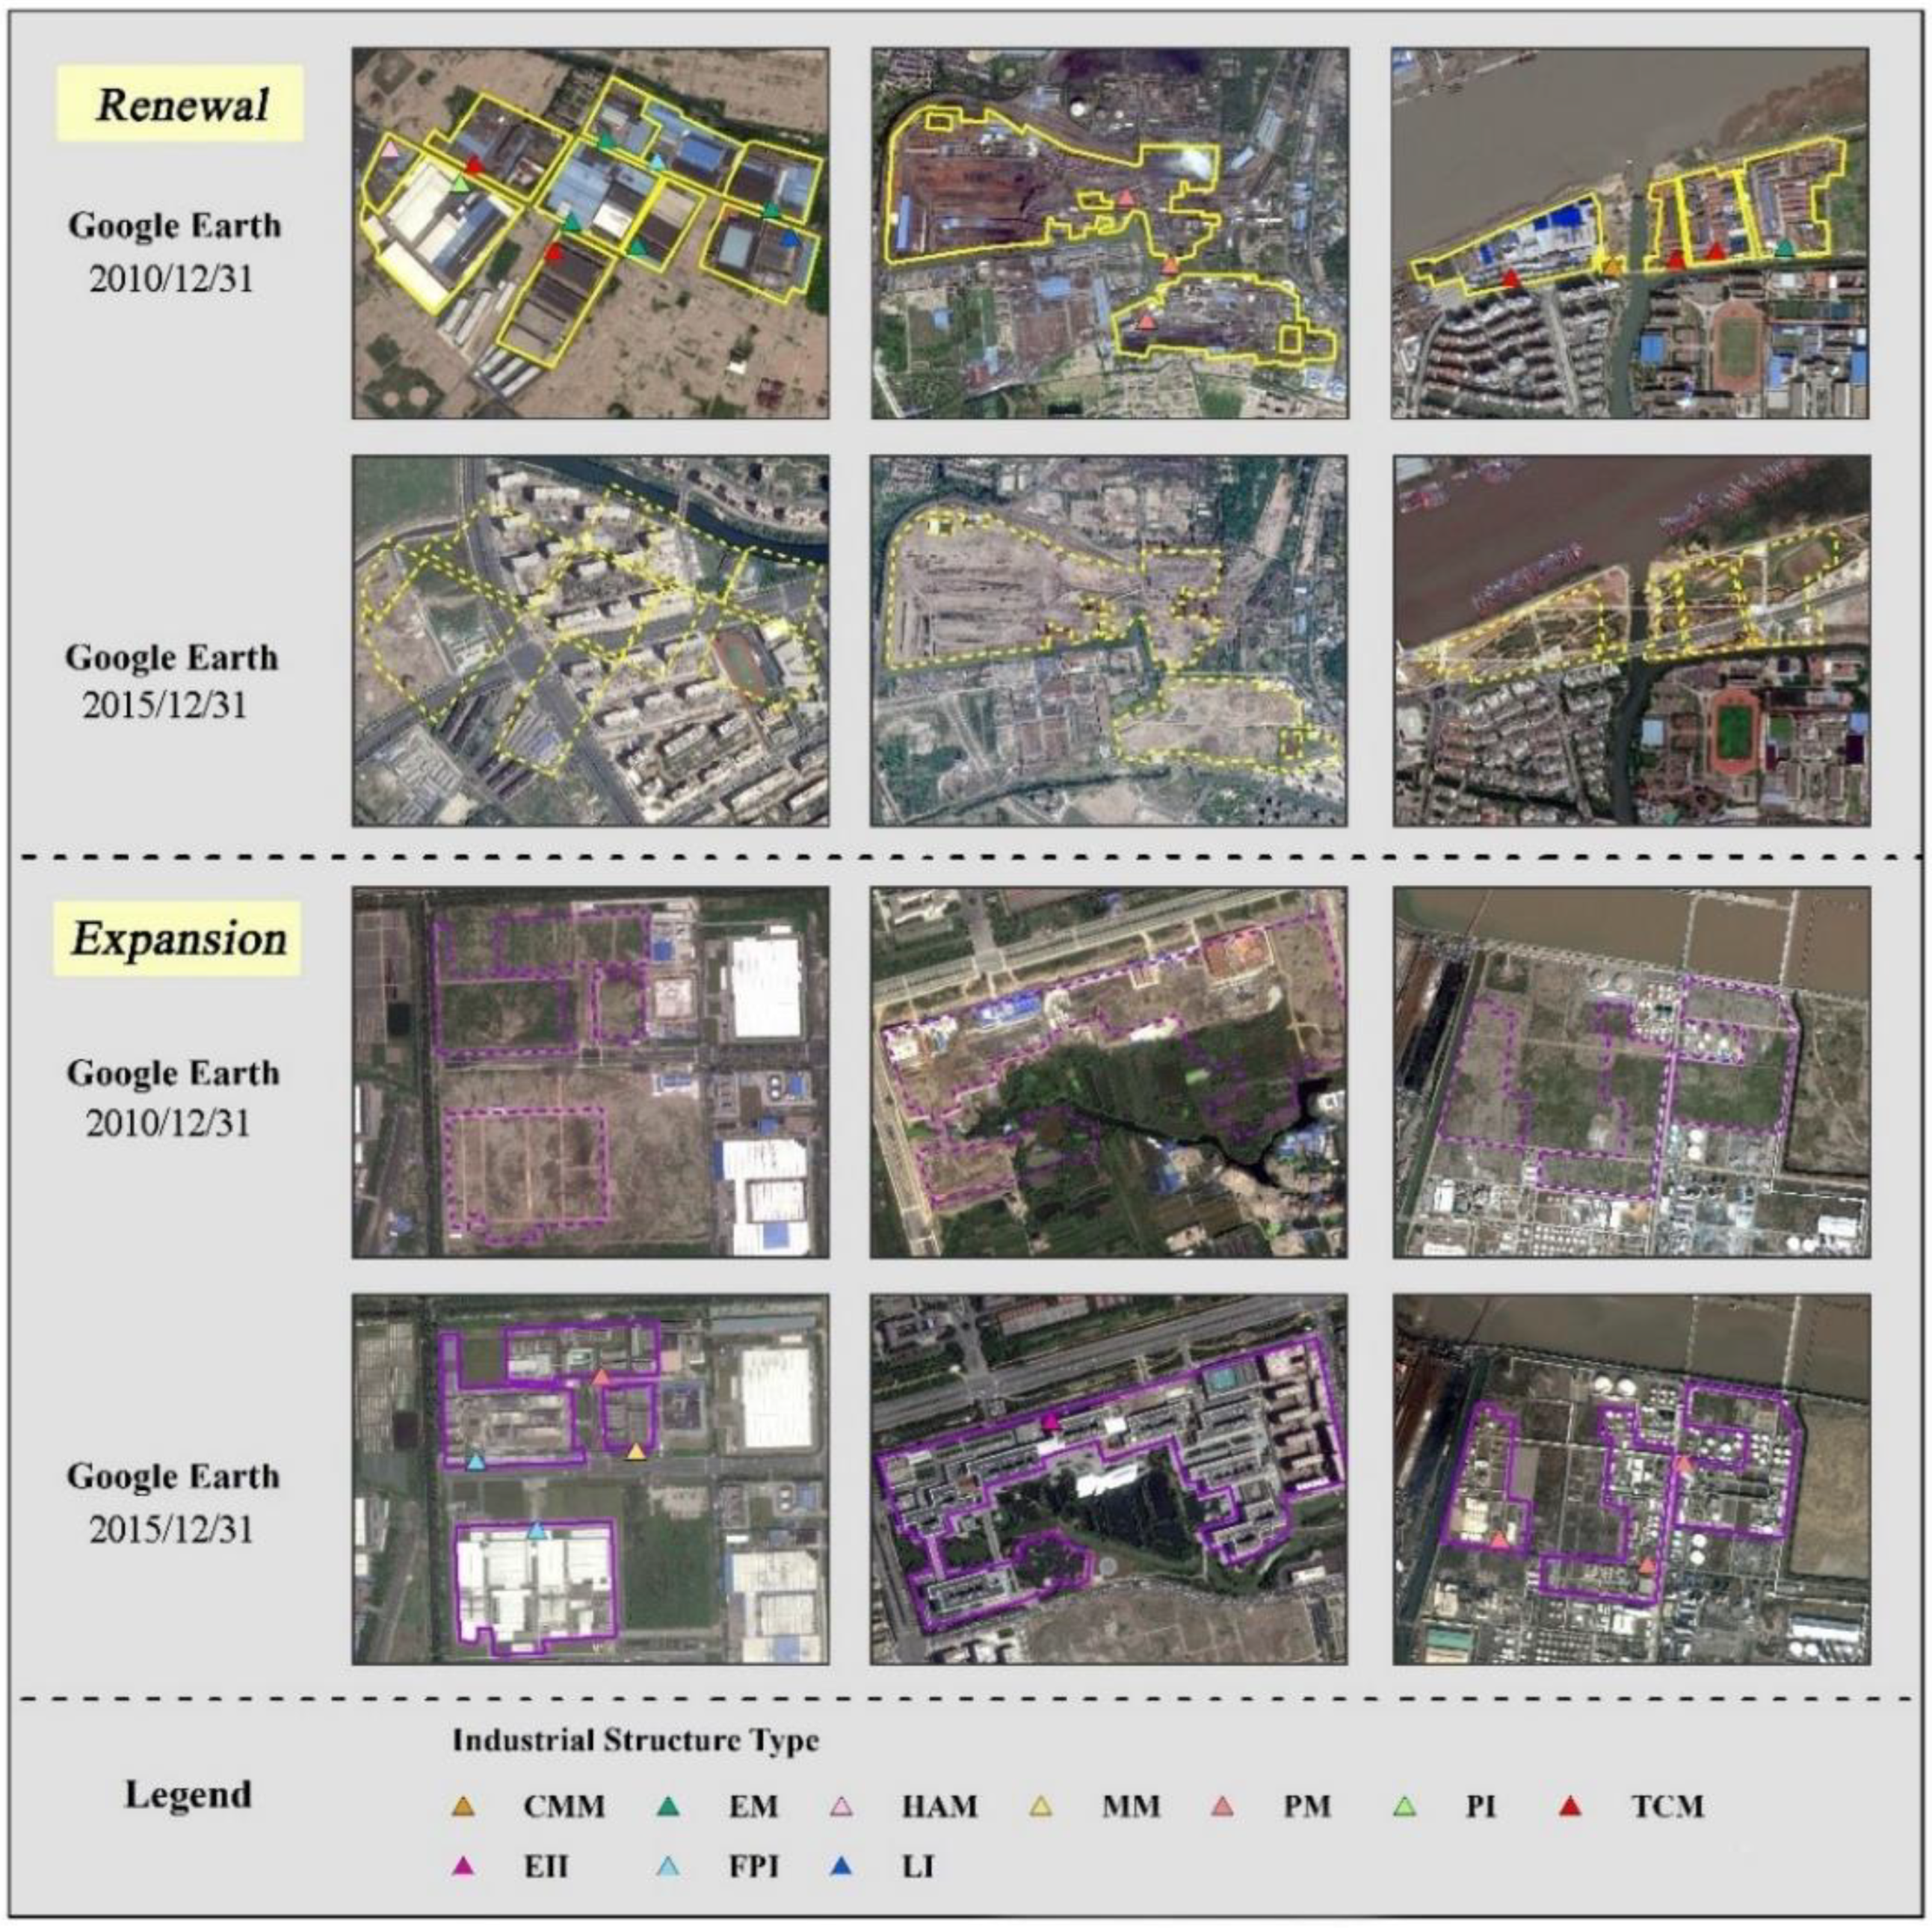
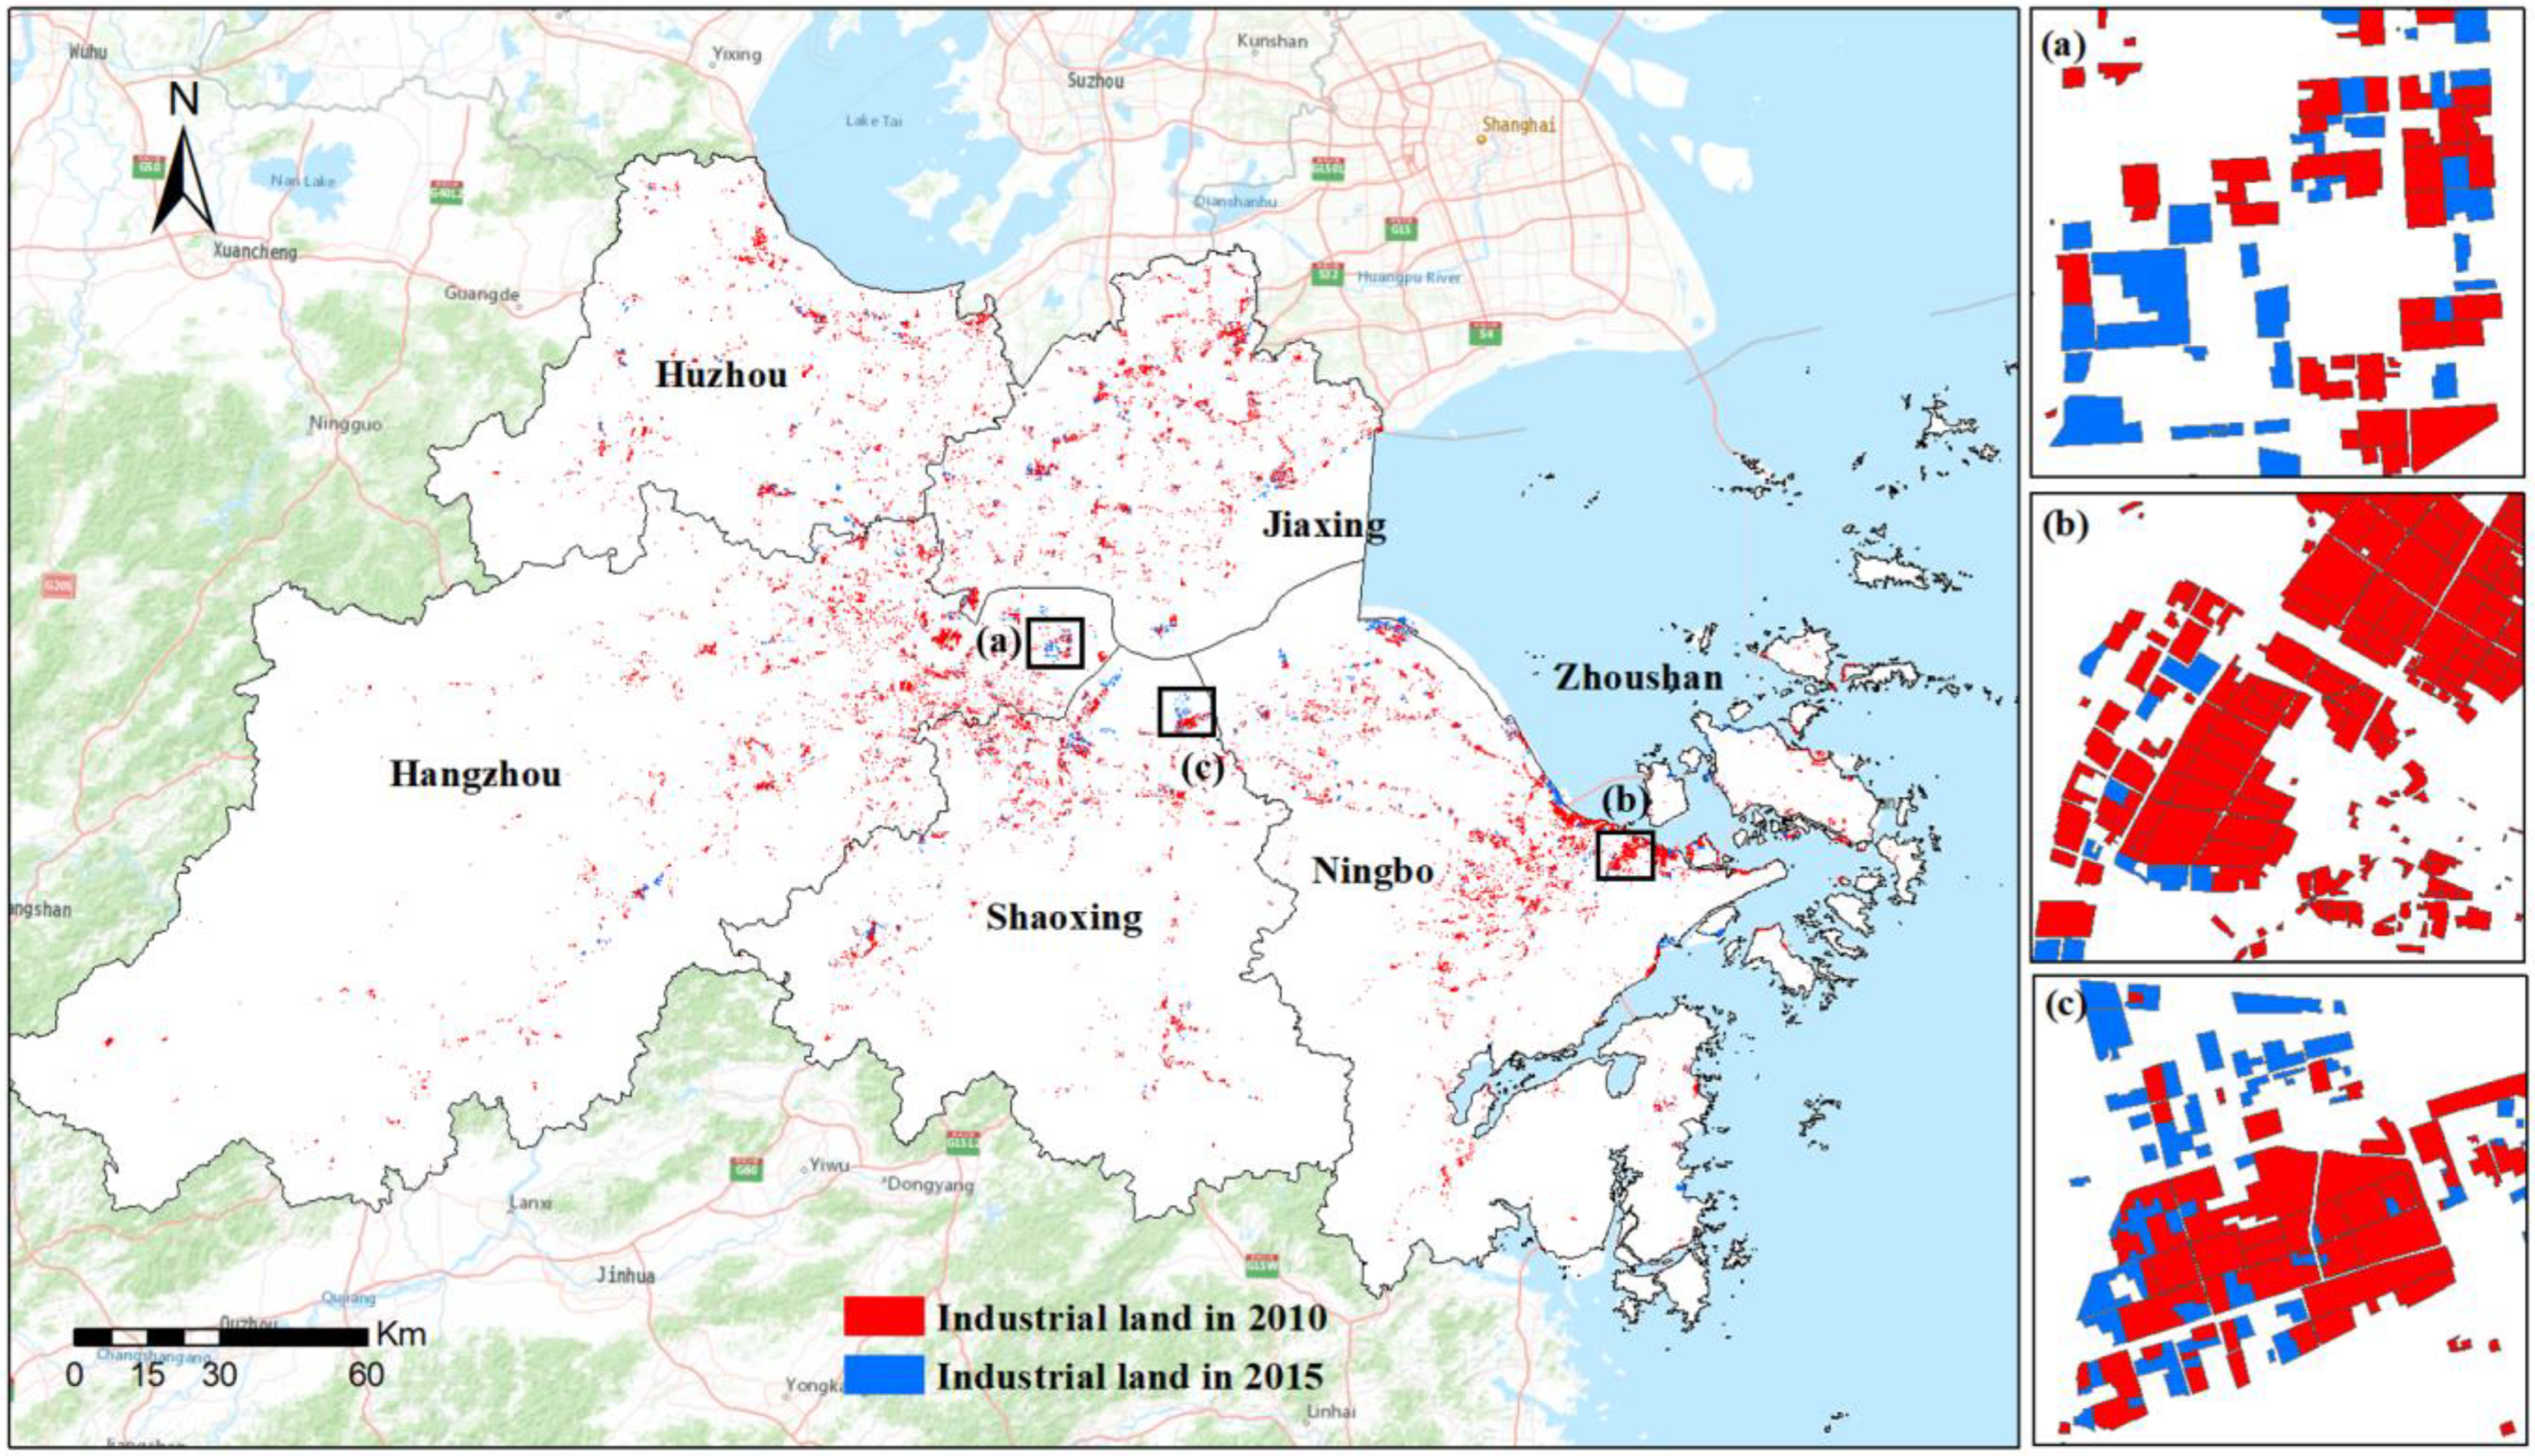
3.3. Characteristics of the Industrial Land Expansion and Renewal Process
3.4. Kernel Density Estimation of Industrial Clusters in the UAHB
4. Discussion
4.1. Advantage and Applicability Analysis of the Methodology
4.2. Change Dynamics
4.3. Implications for Sustainable Industrial Land Development in the Future
5. Conclusions
Author Contributions
Funding
Institutional Review Board Statement
Informed Consent Statement
Data Availability Statement
Conflicts of Interest
Appendix A

| TCM | EM | PI | PM | LI | MLI | HAM | TEM | CMM | FPI | EPI | MM | NI | MI | SI | EII | EMI | NEI | OI | UA | |
|---|---|---|---|---|---|---|---|---|---|---|---|---|---|---|---|---|---|---|---|---|
| TCM | 120 | 2 | 3 | 2 | 1 | 0 | 0 | 0 | 0 | 3 | 3 | 4 | 0 | 0 | 1 | 0 | 1 | 1 | 1 | 84.5% |
| EM | 3 | 102 | 1 | 1 | 2 | 0 | 5 | 3 | 3 | 0 | 3 | 0 | 0 | 0 | 0 | 2 | 2 | 2 | 0 | 79.1% |
| PI | 4 | 0 | 90 | 2 | 1 | 2 | 0 | 0 | 3 | 1 | 0 | 3 | 0 | 0 | 0 | 0 | 0 | 0 | 1 | 84.1% |
| PM | 0 | 0 | 2 | 91 | 1 | 3 | 3 | 0 | 5 | 0 | 0 | 4 | 0 | 0 | 0 | 0 | 1 | 0 | 0 | 82.7% |
| LI | 0 | 0 | 0 | 0 | 89 | 1 | 1 | 4 | 0 | 1 | 0 | 2 | 0 | 0 | 1 | 0 | 3 | 5 | 0 | 83.2% |
| MLI | 0 | 0 | 1 | 3 | 0 | 97 | 2 | 3 | 0 | 0 | 0 | 6 | 0 | 1 | 0 | 0 | 4 | 0 | 0 | 82.9% |
| HAM | 2 | 4 | 0 | 0 | 0 | 1 | 105 | 6 | 3 | 0 | 7 | 0 | 0 | 0 | 0 | 1 | 0 | 0 | 1 | 80.8% |
| TEM | 0 | 0 | 0 | 0 | 5 | 2 | 1 | 96 | 0 | 0 | 3 | 0 | 0 | 0 | 0 | 0 | 0 | 0 | 2 | 88.1% |
| CMM | 1 | 2 | 2 | 1 | 2 | 1 | 0 | 1 | 118 | 0 | 0 | 7 | 0 | 0 | 0 | 0 | 4 | 0 | 1 | 84.3% |
| FPI | 2 | 0 | 0 | 1 | 2 | 0 | 0 | 0 | 0 | 93 | 0 | 2 | 0 | 0 | 2 | 0 | 0 | 0 | 3 | 88.6% |
| EPI | 0 | 0 | 0 | 0 | 3 | 3 | 2 | 2 | 0 | 0 | 116 | 0 | 0 | 0 | 0 | 2 | 0 | 6 | 0 | 86.6% |
| MM | 0 | 0 | 2 | 4 | 0 | 2 | 3 | 1 | 4 | 0 | 0 | 98 | 0 | 0 | 0 | 2 | 1 | 0 | 0 | 83.8% |
| NI | 0 | 0 | 0 | 0 | 0 | 0 | 0 | 0 | 0 | 0 | 0 | 0 | 8 | 0 | 0 | 0 | 0 | 0 | 0 | 100.0% |
| MI | 0 | 0 | 0 | 0 | 0 | 3 | 0 | 0 | 0 | 0 | 0 | 1 | 0 | 46 | 0 | 0 | 0 | 0 | 0 | 92.0% |
| SI | 0 | 0 | 0 | 0 | 0 | 0 | 0 | 0 | 0 | 2 | 0 | 0 | 0 | 0 | 36 | 0 | 0 | 0 | 0 | 94.7% |
| EII | 0 | 3 | 0 | 0 | 2 | 3 | 4 | 0 | 0 | 0 | 2 | 1 | 0 | 0 | 0 | 102 | 0 | 1 | 0 | 86.4% |
| EMI | 3 | 0 | 2 | 1 | 2 | 0 | 0 | 0 | 2 | 0 | 0 | 0 | 0 | 0 | 0 | 0 | 65 | 0 | 0 | 86.7% |
| NEI | 0 | 2 | 1 | 0 | 1 | 2 | 1 | 0 | 0 | 0 | 0 | 2 | 0 | 0 | 0 | 0 | 2 | 92 | 3 | 86.8% |
| OI | 3 | 2 | 4 | 1 | 2 | 2 | 3 | 1 | 2 | 0 | 3 | 2 | 0 | 0 | 0 | 0 | 0 | 1 | 96 | 78.7% |
| PA | 87.0% | 87.2% | 83.3% | 85.0% | 78.8% | 79.5% | 80.8% | 82.1% | 84.3% | 93.0% | 84.7% | 74.2% | 100.0% | 97.9% | 90.0% | 93.6% | 78.3% | 85.2% | 88.9% | OA: 84.5% |
References
- Zhou, Y.; Li, X.; Liu, Y. Cultivated Land Protection and Rational Use in China. Land Use Policy 2021, 106, 105454. [Google Scholar] [CrossRef]
- Wang, J.; Lin, Y.; Glendinning, A.; Xu, Y. Land-Use Changes and Land Policies Evolution in China’s Urbanization Processes. Land Use Policy 2018, 75, 375–387. [Google Scholar] [CrossRef]
- Grimm, N.B.; Faeth, S.H.; Golubiewski, N.E.; Redman, C.L.; Wu, J.; Bai, X.; Briggs, J.M. Global Change and the Ecology of Cities. Science 2008, 319, 756–760. [Google Scholar] [CrossRef] [PubMed] [Green Version]
- Yang, Q.; Li, Z.; Lu, X.; Duan, Q.; Huang, L.; Bi, J. A Review of Soil Heavy Metal Pollution from Industrial and Agricultural Regions in China: Pollution and Risk Assessment. Sci. Total Environ. 2018, 642, 690–700. [Google Scholar] [CrossRef]
- Huang, L.; Shahtahmassebi, A.R.; Gan, M.; Deng, J.; Wang, J.; Wang, K. Characterizing Spatial Patterns and Driving Forces of Expansion and Regeneration of Industrial Regions in the Hangzhou Megacity, China. J. Clean. Prod. 2020, 253, 119959. [Google Scholar] [CrossRef]
- Lin, Q.; Yu, S. Losses of Natural Coastal Wetlands by Land Conversion and Ecological Degradation in the Urbanizing Chinese Coast. Sci. Rep. 2018, 8, 15046. [Google Scholar] [CrossRef] [Green Version]
- National Bureau of Statistics. China’s Urban Construction Statistical Yearbook (2014); China Statistics Press: Beijing, China, 2015.
- Shi, Y.; Fan, W.; Pu, S. Comparative Analysis of Scale, Structure and Benefits of Metropolitan Industrial Land in China. Tongji Univ. J. Soc. Sci. Sect. 2010, 21, 25–31. [Google Scholar]
- Lai, Y.; Tang, B.; Chen, X.; Zheng, X. Spatial Determinants of Land Redevelopment in the Urban Renewal Processes in Shenzhen, China. Land Use Policy 2021, 103, 105330. [Google Scholar] [CrossRef]
- Gao, J.; Chen, W.; Yuan, F. Spatial Restructuring and the Logic of Industrial Land Redevelopment in Urban China: I. Theoretical Considerations. Land Use Policy 2017, 68, 604–613. [Google Scholar] [CrossRef]
- Meng, Y.; Zhang, F.R.; An, P.L.; Dong, M.L.; Wang, Z.Y.; Zhao, T. Industrial Land-Use Efficiency and Planning in Shunyi, Beijing. Landsc. Urban Plan. 2008, 85, 40–48. [Google Scholar] [CrossRef]
- Deichmann, U.; Lall, S.V.; Redding, S.J.; Venables, A.J. Industrial Location in Developing Countries. World Bank Res. Obs. 2008, 23, 219–246. [Google Scholar] [CrossRef]
- Georganos, S.; Grippa, T.; Vanhuysse, S.; Lennert, M.; Shimoni, M.; Kalogirou, S.; Wolff, E. Less Is More: Optimizing Classification Performance through Feature Selection in a Very-High-Resolution Remote Sensing Object-Based Urban Application. GIScience Remote Sens. 2018, 55, 221–242. [Google Scholar] [CrossRef]
- Scott, G.J.; Marcum, R.A.; Davis, C.H.; Nivin, T.W. Training Deep Convolutional Neural Networks for Land Cover Classification of High-Resolution Imagery. IEEE Geosci. Remote Sens. Lett. 2017, 14, 1638–1642. [Google Scholar] [CrossRef]
- Mahdianpari, M.; Salehi, B.; Rezaee, M.; Mohammadimanesh, F.; Zhang, Y. Very Deep Convolutional Neural Networks for Complex Land Cover Mapping Using Multispectral Remote Sensing Imagery. Remote Sens. 2018, 10, 1119. [Google Scholar] [CrossRef] [Green Version]
- Hossain, M.D.; Chen, D. Segmentation for Object-Based Image Analysis (OBIA): A Review of Algorithms and Challenges from Remote Sensing Perspective. ISPRS J. Photogramm. Remote Sens. 2019, 150, 115–134. [Google Scholar] [CrossRef]
- Liang, Y.; Wang, F.; Li, G.; Jiang, H. Present Condition and Thoughts on Cadastral Information Service Policy. Shandong L. Resour. 2014, 30, 94–96. [Google Scholar]
- Hu, T.; Yang, J.; Li, X.; Gong, P. Mapping Urban Land Use by Using Landsat Images and Open Social Data. Remote Sens. 2016, 8, 151. [Google Scholar] [CrossRef]
- Yuan, J.; Zheng, Y.; Xie, X. Discovering Regions of Different Functions in a City Using Human Mobility and POIs. In Proceedings of the 18th ACM SIGKDD International Conference on Knowledge Discovery and Data Mining, Beijing, China, 12–16 August 2012; pp. 186–194. [Google Scholar] [CrossRef]
- Zhai, W.; Bai, X.; Shi, Y.; Han, Y.; Peng, Z.R.; Gu, C. Beyond Word2vec: An Approach for Urban Functional Region Extraction and Identification by Combining Place2vec and POIs. Comput. Environ. Urban Syst. 2019, 74, 1–12. [Google Scholar] [CrossRef]
- Chen, W.; Liu, L.; Liang, Y. Retail Center Recognition and Spatial Aggregating Feature Analysis of Retail Formats in Guangzhou Based on POI Data. Geogr. Res. 2016, 35, 703–716. [Google Scholar] [CrossRef]
- Zhang, J.; Yuan, X.D.; Lin, H. The Extraction of Urban Built-Up Areas by Integrating Night-Time Light and POI Data—A Case Study of Kunming, China. IEEE Access 2021, 9, 22417–22429. [Google Scholar] [CrossRef]
- Jiang, S.; Alves, A.; Rodrigues, F.; Ferreira, J.; Pereira, F.C. Mining Point-of-Interest Data from Social Networks for Urban Land Use Classification and Disaggregation. Comput. Environ. Urban Syst. 2015, 53, 36–46. [Google Scholar] [CrossRef]
- Yao, Y.; Li, X.; Liu, X.; Liu, P.; Liang, Z.; Zhang, J.; Mai, K. Sensing Spatial Distribution of Urban Land Use by Integrating Points-of-Interest and Google Word2Vec Model. Int. J. Geogr. Inf. Sci. 2017, 31, 825–848. [Google Scholar] [CrossRef]
- Jia, X.; Hu, B.; Marchant, B.P.; Zhou, L.; Shi, Z.; Zhu, Y. A Methodological Framework for Identifying Potential Sources of Soil Heavy Metal Pollution Based on Machine Learning: A Case Study in the Yangtze Delta, China. Environ. Pollut. 2019, 250, 601–609. [Google Scholar] [CrossRef] [PubMed]
- Wang, Z.; Huang, Y.; Zhang, Y. An Empirical Study of the Industrial Space Development in Wuhan City Based on GIS. Urban Plan. Gard. Landsc. 2012, 3, 132–138. [Google Scholar] [CrossRef]
- Gao, Y.; Ma, Y. What Is Absent from the Current Monitoring: Idleness of Rural Industrial Land in Suburban Shanghai. Habitat Int. 2015, 49, 138–147. [Google Scholar] [CrossRef]
- Tan, R.; Liu, Y.; Liu, Y.; He, Q.; Ming, L.; Tang, S. Urban Growth and Its Determinants across the Wuhan Urban Agglomeration, Central China. Habitat Int. 2014, 44, 268–281. [Google Scholar] [CrossRef]
- Sun, W.; Jin, X.; Zhang, Z.; Han, J.; Xiang, X.; Zhou, Y. Characteristics of New Manufacturing Land and Coupling Analysis with Urban System in Chinese Major Urban Agglomerations. Prog. Geogr. 2016, 35, 1483–1493. [Google Scholar] [CrossRef] [Green Version]
- Thornton, G.; Franz, M.; Edwards, D.; Pahlen, G.; Nathanail, P. The Challenge of Sustainability: Incentives for Brownfield Regeneration in Europe. Environ. Sci. Policy 2007, 10, 116–134. [Google Scholar] [CrossRef]
- Fragkou, P.; Petridis, V.; Kehagias, A. A Dynamic Programming Algorithm for Linear Text Segmentation. J. Intell. Inf. Syst. 2004, 23, 179–197. [Google Scholar] [CrossRef]
- Ponte, J.M.; Bruce Croft, W. Text Segmentation by Topic. In Proceedings of the International Conference on Theory and Practice of Digital Libraries, Pisa, Italy, 1–3 September 1997; Springer: Berlin/Heidelberg, Germany, 1997; Volume 1324, pp. 113–125. [Google Scholar] [CrossRef] [Green Version]
- Blei, D.M.; Moreno, P.J.; Hall, S. Topic Segmentation with an Aspect Hidden Markov Model. In Proceedings of the 24th Annual International ACM SIGIR Conference on Research and Development in Information Retrieval, Singapore, 20–24 July 2001; pp. 352–357. [Google Scholar]
- Silverman, B.W. Density Estimation for Statistics and Data Analysis; Routledge: London, UK, 2018. [Google Scholar]
- Cai, X.; Wu, Z.; Cheng, J. Using Kernel Density Estimation to Assess the Spatial Pattern of Road Density and Its Impact on Landscape Fragmentation. Int. J. Geogr. Inf. Sci. 2013, 27, 222–230. [Google Scholar] [CrossRef]
- Hu, Q.; Wu, W.; Xia, T.; Yu, Q.; Yang, P.; Li, Z.; Song, Q. Exploring the Use of Google Earth Imagery and Object-Based Methods in Land Use/Cover Mapping. Remote Sens. 2013, 5, 6026–6042. [Google Scholar] [CrossRef] [Green Version]
- Zheng, Q.; Wang, K.; Huang, L.; Zheng, Q.; Abubakar, G.A. Monitoring the Different Types of Urban Construction Land Expansion (UCLE) in China’s Port City: A Case Study of Ningbo’s Central City. Sustainability 2017, 9, 2374. [Google Scholar] [CrossRef] [Green Version]
- Zhou, G.; Li, C.; Li, M.; Zhang, J.; Liu, Y. Agglomeration and Diffusion of Urban Functions: An Approach Based on Urban Land Use Conversion. Habitat Int. 2016, 56, 20–30. [Google Scholar] [CrossRef]
- Chrysochoou, M.; Brown, K.; Dahal, G.; Granda-Carvajal, C.; Segerson, K.; Garrick, N.; Bagtzoglou, A. A GIS and Indexing Scheme to Screen Brownfields for Area-Wide Redevelopment Planning. Landsc. Urban Plan. 2012, 105, 187–198. [Google Scholar] [CrossRef]
- Rizzo, E.; Pesce, M.; Pizzol, L.; Alexandrescu, F.M.; Giubilato, E.; Critto, A.; Marcomini, A.; Bartke, S. Brownfield Regeneration in Europe: Identifying Stakeholder Perceptions, Concerns, Attitudes and Information Needs. Land Use Policy 2015, 48, 437–453. [Google Scholar] [CrossRef]
- Cheng, F.; Geertman, S.; Kuffer, M.; Zhan, Q. An Integrative Methodology to Improve Brownfield Redevelopment Planning in Chinese Cities: A Case Study of Futian, Shenzhen. Comput. Environ. Urban Syst. 2011, 35, 388–398. [Google Scholar] [CrossRef]
- Ahmad, N.; Zhu, Y.; Ibrahim, M.; Waqas, M.; Waheed, A. Development of a Standard Brownfield Definition, Guidelines, and Evaluation Index System for Brownfield Redevelopment in Developing Countries: The Case of Pakistan. Sustainability 2018, 10, 4347. [Google Scholar] [CrossRef] [Green Version]
- Megharaj, M.; Naidu, R. Soil and Brownfield Bioremediation. Microb. Biotechnol. 2017, 10, 1244–1249. [Google Scholar] [CrossRef]
- Tang, G.; Xu, W.; Wang, S. A Study on the Geographic Distribution Features and the Performance and the Forming Mechanism for the Zhejiang Regional Mass Ec Onomy. Hum. Geogr. 2003, 18, 53–59. [Google Scholar] [CrossRef]
- Ma, S.; Li, X.; Cai, Y. Computers, Environment and Urban Systems Delimiting the Urban Growth Boundaries with a Modi Fi Ed Ant Colony Optimization Model. Comput. Environ. Urban Syst. 2017, 62, 146–155. [Google Scholar] [CrossRef]
- Gao, J.; Wei, Y.D.; Chen, W.; Chen, J. Economic Transition and Urban Land Expansion in Provincial China. Habitat Int. 2014, 44, 461–473. [Google Scholar] [CrossRef]
- Zhou, D.; Xu, J.; Wang, L.; Lin, Z. Assessing Urbanization Quality Using Structure and Function Analyses: A Case Study of the Urban Agglomeration around Hangzhou Bay (UAHB), China. Habitat Int. 2015, 49, 165–176. [Google Scholar] [CrossRef]
- Shen, Q.; Wang, H. A Decision-Making Framework for Sustainable Land Use in Hong Kong’s Urban Renewal Projects. Smart Sustain. Built Environ. 2014, 3, 35–53. [Google Scholar] [CrossRef]
- Bai, L.; Qiao, Q.; Yao, Y.; Guo, J.; Xie, M. Insights on the Development Progress of National Demonstration Eco-Industrial Parks in China. J. Clean. Prod. 2014, 70, 4–14. [Google Scholar] [CrossRef]


| First Class | Sub-Class |
|---|---|
| Traditional industry | Textile and clothing manufacturing (TCM) |
| Equipment manufacturing (EM) | |
| Paper industry (PI) | |
| Petrochemical manufacturing (PM) | |
| Logistics industry (LI) | |
| Metallurgical industry (MLI) | |
| Household appliance manufacturing (HAM) | |
| Transportation equipment manufacturing (TEM) | |
| Construction material manufacturing (CMM) | |
| Food-processing industry (FPI) | |
| Electric power industry (EPI) | |
| Medical manufacturing (MM) | |
| Nuclear industry (NI) | |
| Mining industry (MI) | |
| Salt industry (SI) | |
| New-fashioned industry | Electronic information industry (EII) |
| New material industry (EMI) | |
| New energy industry (NEI) | |
| Other industry | Other industry (OI) |
| Number | Text Segmentation Result Example |
|---|---|
| 1 | Ningbo/Zhonglei/wool/textile/factory/ |
| 2 | Ningbo/Xinxin/plastic/product/factory/ |
| 3 | Ningbo/Fulianyue/garment/factory/ |
| 4 | Chenhong/dressing/factory/ |
| 5 | Shanghai/Yiyun/international/delivery/factory/ |
| 6 | KaiEndi/numerical control technique/factory/ |
| 7 | Ningbo/Saifu/international/delivery/factory/ |
| 8 | Ningbo/newspaper/printing/factory/ |
| 9 | Ningbo/Changjin/imports and exports/factory/ |
| 10 | Hanlong/metallic material/technology/factory/ |
| City | 2010/ha | 2015/ha | 2010–2015/ha |
|---|---|---|---|
| Hangzhou | 26,630.8 | 29,558.8 | 2928.0 |
| Huzhou | 12,706.0 | 14,606.3 | 1900.3 |
| Jiaxing | 20,720.2 | 24,196.2 | 3476.0 |
| Ningbo | 32,376.8 | 38,632.4 | 6255.6 |
| Shaoxing | 16,925.2 | 20,542.9 | 3617.7 |
| Zhoushan | 3407.9 | 4587.7 | 1179.8 |
| Total | 112,766.9 | 132,124.2 | 19,357.3 |
| Industrial Structure Type | Expansion/ha | Percentage/% | Renewal/ha | Percentage/% |
|---|---|---|---|---|
| Textile and clothing manufacturing (TCM) | 2684.38 | 13.84 | 166.25 | 28.58 |
| Equipment manufacturing (EM) | 4183.41 | 21.57 | 151.49 | 26.04 |
| Paper industry (PI) | 360.13 | 1.86 | 46.44 | 7.98 |
| Petrochemical manufacturing (PM) | 1939.51 | 10.00 | 12.85 | 2.21 |
| Logistics industry (LI) | 1210.44 | 6.24 | 2.78 | 0.48 |
| Metallurgical industry (MLI) | 811.35 | 4.18 | 20.87 | 3.59 |
| Household appliance manufacturing (HAM) | 736.47 | 3.80 | 24.24 | 4.17 |
| Transportation equipment manufacturing (TEM) | 1156.14 | 5.96 | 43.19 | 7.42 |
| Construction material manufacturing (CMM) | 341.66 | 1.76 | 23.95 | 4.12 |
| Food-processing industry (FPI) | 439.02 | 2.26 | 24.83 | 4.27 |
| Electric power industry (EPI) | 386.88 | 1.99 | 3.53 | 0.61 |
| Medical manufacturing (MM) | 283.82 | 1.46 | 0.73 | 0.12 |
| Nuclear industry (NI) | - | - | - | - |
| Mining industry (MI) | - | - | - | - |
| Salt industry (SI) | 3.12 | 0.02 | 0.13 | 0.02 |
| Electronic information industry (EII) | 637.96 | 3.29 | 2.83 | 0.49 |
| New material industry (EMI) | 374.92 | 1.93 | - | - |
| New energy industry (NEI) | 244.23 | 1.26 | - | - |
| Other industry | 3602.74 | 18.57 | 57.60 | 9.90 |
| Summary | 19,396.17 | 100.00 | 581.70 | 100.00 |
| Percentage area in central city of total amount/% | 53.30 | - | 94.20 | - |
| Site number | 2888 | - | 182 | - |
Disclaimer/Publisher’s Note: The statements, opinions and data contained in all publications are solely those of the individual author(s) and contributor(s) and not of MDPI and/or the editor(s). MDPI and/or the editor(s) disclaim responsibility for any injury to people or property resulting from any ideas, methods, instructions or products referred to in the content. |
© 2022 by the authors. Licensee MDPI, Basel, Switzerland. This article is an open access article distributed under the terms and conditions of the Creative Commons Attribution (CC BY) license (https://creativecommons.org/licenses/by/4.0/).
Share and Cite
Huang, L.; Xiang, S.; Zheng, J. Fine-Scale Monitoring of Industrial Land and Its Intra-Structure Using Remote Sensing Images and POIs in the Hangzhou Bay Urban Agglomeration, China. Int. J. Environ. Res. Public Health 2023, 20, 226. https://doi.org/10.3390/ijerph20010226
Huang L, Xiang S, Zheng J. Fine-Scale Monitoring of Industrial Land and Its Intra-Structure Using Remote Sensing Images and POIs in the Hangzhou Bay Urban Agglomeration, China. International Journal of Environmental Research and Public Health. 2023; 20(1):226. https://doi.org/10.3390/ijerph20010226
Chicago/Turabian StyleHuang, Lingyan, Shanshan Xiang, and Jianzhuang Zheng. 2023. "Fine-Scale Monitoring of Industrial Land and Its Intra-Structure Using Remote Sensing Images and POIs in the Hangzhou Bay Urban Agglomeration, China" International Journal of Environmental Research and Public Health 20, no. 1: 226. https://doi.org/10.3390/ijerph20010226