
The Role of Biomarkers and Scores in Describing Urosepsis

 ,
,
Abstract
:1. Introduction
2. Materials and Methods
2.1. Patients Selection
- Fever, temperature above 38 °C, or hypothermia below 36 °C.
- Tachycardia—over 90/min.
- Tachypnea—over 20 breaths/min or partial pressure of carbon dioxide in the arterial blood (PaCO2) < 32 mm Hg.
- Leukocytosis > 12,000/mm3 or leukopenia < 4000/mm3, or the presence of immature cells in the periphery < 10% [8].
2.2. Collected Factors
2.3. Vadiable Definition
2.4. Patient Grouping According to the Disease Stage
2.5. Statistical Analysis
3. Results
4. Discussion
5. Conclusions
Supplementary Materials
Author Contributions
Funding
Institutional Review Board Statement
Informed Consent Statement
Conflicts of Interest
References
- Naber, K.G.; Bergman, B.; Bishop, M.C.; Bjerklund-Johansen, T.E.; Botto, H.; Lobel, B.; Jinenez Cruz, F.; Selvaggi, F.P. Urinary Tract Infection (UTI) Working Group of the Health Care Office (HCO) of the European Association of Urology (EAU) EAU guidelines for the management of urinary and male genital tract infections. Urinary Tract Infection (UTI) Working Group of the Health Care Office (HCO) of the European Association of Urology (EAU). EAU Guidelines for the Management of Urinary and Male Genital Tract Infections. Eur. Urol. 2001, 40, 576–588. [Google Scholar] [CrossRef] [PubMed]
- Singer, M.; Deutschman, C.S.; Seymour, C.W.; Shankar-Hari, M.; Annane, D.; Bauer, M.; Bellomo, R.; Bernard, G.R.; Chiche, J.-D.; Coopersmith, C.M.; et al. The Third International Consensus Definitions for Sepsis and Septic Shock (Sepsis-3). JAMA 2016, 315, 801–810. [Google Scholar] [CrossRef]
- Bone, R.C.; Balk, R.A.; Cerra, F.B.; Dellinger, R.P.; Fein, A.M.; Knaus, W.A.; Schein, R.M.; Sibbald, W.J. Definitions for sepsis and organ failure and guidelines for the use of innovative therapies in sepsis. Chest 1992, 101, 1644–1655. [Google Scholar] [CrossRef] [PubMed] [Green Version]
- Levy, M.M.; Artigas, A.; Phillips, G.S.; Rhodes, A.; Beale, R.; Osborn, T.; Vincent, J.-L.; Townsend, S.; Lemeshow, S.; Dellinger, R.P. Outcomes of the Surviving Sepsis Campaign in intensive care units in the USA and Europe: A prospective cohort study. Lancet Infect. Dis. 2012, 12, 919–924. [Google Scholar] [CrossRef]
- Foxman, B.; Klemstine, K.L.; Brown, P.D. Acute pyelonephritis in US hospitals in 1997: Hospitalization and in-hospital mortality. Ann. Epidemiol. 2003, 13, 144–150. [Google Scholar] [CrossRef] [PubMed]
- Hotchkiss, R.S.; Karl, I.E. The pathophysiology and treatment of sepsis. N. Engl. J. Med. 2003, 348, 138–150. [Google Scholar] [CrossRef] [PubMed] [Green Version]
- Guliciuc, M.; Maier, A.C.; Maier, I.M.; Kraft, A.; Cucuruzac, R.R.; Marinescu, M.; Şerban, C.; Rebegea, L.; Constantin, G.B.; Firescu, D. The Urosepsis-A Literature Review. Med. Kaunas Lith. 2021, 57, 872. [Google Scholar] [CrossRef]
- Chakraborty, R.K.; Burns, B. Systemic Inflammatory Response Syndrome. In StatPearls; StatPearls Publishing: Treasure Island, FL, USA, 2022. [Google Scholar]
- Jones, A.E.; Fiechtl, J.F.; Brown, M.D.; Ballew, J.J.; Kline, J.A. Procalcitonin test in the diagnosis of bacteremia: A meta-analysis. Ann. Emerg. Med. 2007, 50, 34–41. [Google Scholar] [CrossRef] [PubMed]
- Pan, Y.-P.; Fang, Y.-P.; Xu, Y.-H.; Wang, Z.-X.; Shen, J.-L. The Diagnostic Value of Procalcitonin Versus Other Biomarkers in Prediction of Bloodstream Infection. Clin. Lab. 2017, 63, 277–285. [Google Scholar] [CrossRef]
- Luo, X.; Yang, X.; Li, J.; Zou, G.; Lin, Y.; Qing, G.; Yang, R.; Yao, W.; Ye, X. The procalcitonin/albumin ratio as an early diagnostic predictor in discriminating urosepsis from patients with febrile urinary tract infection. Medicine 2018, 97, e11078. [Google Scholar] [CrossRef]
- ProCESS Investigators; Yealy, D.M.; Kellum, J.A.; Huang, D.T.; Barnato, A.E.; Weissfeld, L.A.; Pike, F.; Terndrup, T.; Wang, H.E.; Hou, P.C.; et al. A randomized trial of protocol-based care for early septic shock. N. Engl. J. Med. 2014, 370, 1683–1693. [Google Scholar] [CrossRef] [PubMed] [Green Version]
- Seymour, C.W.; Liu, V.X.; Iwashyna, T.J.; Brunkhorst, F.M.; Rea, T.D.; Scherag, A.; Rubenfeld, G.; Kahn, J.M.; Shankar-Hari, M.; Singer, M.; et al. Assessment of Clinical Criteria for Sepsis: For the Third International Consensus Definitions for Sepsis and Septic Shock (Sepsis-3). JAMA 2016, 315, 762–774. [Google Scholar] [CrossRef] [Green Version]
- Charlson, M.E.; Pompei, P.; Ales, K.L.; MacKenzie, C.R. A new method of classifying prognostic comorbidity in longitudinal studies: Development and validation. J. Chronic Dis. 1987, 40, 373–383. [Google Scholar] [CrossRef] [PubMed]
- World Health Organization Guidelines for the Collection of Clinical Specimens during Field Investigation of Outbreaks; World Health Organization: Geneva, Switzerland, 2000.
- Yang, Y.; Yang, K.S.; Hsann, Y.M.; Lim, V.; Ong, B.C. The effect of comorbidity and age on hospital mortality and length of stay in patients with sepsis. J. Crit. Care 2010, 25, 398–405. [Google Scholar] [CrossRef] [PubMed]
- Saver, J.L.; Dreiher, J.; Greenberg, D. Temporal Trends in Patient Characteristics and Treatment with Intravenous Thrombolysis among Acute Ischemic Stroke Patients at Get with the Guidelines-Stroke Hospitals. Circ. Cardiovasc. Qual. Outcomes 2013, 6, 543–549. [Google Scholar]
- Tran, D.D.; Groeneveld, A.B.; van der Meulen, J.; Nauta, J.J.; Strack van Schijndel, R.J.; Thijs, L.G. Age, chronic disease, sepsis, organ system failure, and mortality in a medical intensive care unit. Crit. Care Med. 1990, 18, 474–479. [Google Scholar] [CrossRef]
- Vincent, J.-L.; Moreno, R.; Takala, J.; Willatts, S.; De Mendonça, A.; Bruining, H.; Reinhart, C.K.; Suter, P.M.; Thijs, L.G. The SOFA (Sepsis-related Organ Failure Assessment) score to describe organ dysfunction/failure. Intensive Care Med. 1996, 22, 707–710. [Google Scholar] [CrossRef]
- Regel, G.; Grotz, M.; Weltner, T.; Sturm, J.A.; Tscherne, H. Pattern of organ failure following severe trauma. World J. Surg. 1996, 20, 422–429. [Google Scholar] [CrossRef]
- Vincent, J.L.; de Mendonça, A.; Cantraine, F.; Moreno, R.; Takala, J.; Suter, P.M.; Sprung, C.L.; Colardyn, F.; Blecher, S. Use of the SOFA score to assess the incidence of organ dysfunction/failure in intensive care units: Results of a multicenter, prospective study. Working group on “sepsis-related problems” of the European Society of Intensive Care Medicine. Crit. Care Med. 1998, 26, 1793–1800. [Google Scholar] [CrossRef] [PubMed] [Green Version]
- Antonelli, M.; Moreno, R.; Vincent, J.L.; Sprung, C.L.; Mendoça, A.; Passariello, M.; Riccioni, L.; Osborn, J. Application of SOFA score to trauma patients. Sequential Organ Failure Assessment. Intensive Care Med. 1999, 25, 389–394. [Google Scholar] [CrossRef] [PubMed]
- Moreno, R.; Vincent, J.L.; Matos, R.; Mendonça, A.; Cantraine, F.; Thijs, L.; Takala, J.; Sprung, C.; Antonelli, M.; Bruining, H.; et al. The use of maximum SOFA score to quantify organ dysfunction/failure in intensive care. Results of a prospective, multicentre study. Working Group on Sepsis related Problems of the ESICM. Intensive Care Med. 1999, 25, 686–696. [Google Scholar] [CrossRef] [PubMed]
- Lambden, S.; Laterre, P.F.; Levy, M.M.; Francois, B. The SOFA score-development, utility and challenges of accurate assessment in clinical trials. Crit. Care Lond. Engl. 2019, 23, 374. [Google Scholar] [CrossRef] [PubMed] [Green Version]
- Minne, L.; Abu-Hanna, A.; de Jonge, E. Evaluation of SOFA-based models for predicting mortality in the ICU: A systematic review. Crit. Care Lond. Engl. 2008, 12, R161. [Google Scholar] [CrossRef] [PubMed] [Green Version]
- van Nieuwkoop, C.; Bonten, T.N.; van’t Wout, J.W.; Kuijper, E.J.; Groeneveld, G.H.; Becker, M.J.; Koster, T.; Wattel-Louis, G.H.; Delfos, N.M.; Ablij, H.C.; et al. Procalcitonin reflects bacteremia and bacterial load in urosepsis syndrome: A prospective observational study. Crit. Care 2010, 14, R206. [Google Scholar] [CrossRef] [PubMed] [Green Version]
- O’Grady, N.P.; Barie, P.S.; Bartlett, J.G.; Bleck, T.; Carroll, K.; Kalil, A.C.; Linden, P.; Maki, D.G.; Nierman, D.; Pasculle, W.; et al. Guidelines for evaluation of new fever in critically ill adult patients: 2008 update from the American College of Critical Care Medicine and the Infectious Diseases Society of America. Crit. Care Med. 2008, 36, 1330–1349. [Google Scholar] [CrossRef] [PubMed]
- Lavrentieva, A.; Papadopoulou, S.; Kioumis, J.; Kaimakamis, E.; Bitzani, M. PCT as a diagnostic and prognostic tool in burn patients. Whether time course has a role in monitoring sepsis treatment. Burns 2012, 38, 356–363. [Google Scholar] [CrossRef]
- BalcI, C.; Sungurtekin, H.; Gürses, E.; Sungurtekin, U.; Kaptanoglu, B. Usefulness of procalcitonin for diagnosis of sepsis in the intensive care unit. Crit. Care 2003, 7, 85–90. [Google Scholar] [CrossRef] [Green Version]
- Ivancević, N.; Radenković, D.; Bumbasirević, V.; Karamarković, A.; Jeremić, V.; Kalezić, N.; Vodnik, T.; Beleslin, B.; Milić, N.; Gregorić, P.; et al. Procalcitonin in preoperative diagnosis of abdominal sepsis. Langenbecks Arch. Surg. 2008, 393, 397–403. [Google Scholar] [CrossRef]
- Askim, Å.; Moser, F.; Gustad, L.T.; Stene, H.; Gundersen, M.; Åsvold, B.O.; Dale, J.; Bjørnsen, L.P.; Damås, J.K.; Solligård, E. Poor performance of quick-SOFA (qSOFA) score in predicting severe sepsis and mortality—A prospective study of patients admitted with infection to the emergency department. Scand. J. Trauma Resusc. Emerg. Med. 2017, 25, 56. [Google Scholar] [CrossRef] [PubMed] [Green Version]
- Wang, Y.; Wang, D.; Fu, J.; Liu, Y. Predictive value of SOFA, qSOFA score and traditional evaluation index on sepsis prognosis. Zhonghua Wei Zhong Bing Ji Jiu Yi Xue 2017, 29, 700–704. [Google Scholar] [CrossRef] [PubMed]
- Kreger, B.E.; Craven, D.E.; Carling, P.C.; McCabe, W.R. Gram-negative bacteremia. III. Reassessment of etiology, epidemiology and ecology in 612 patients. Am. J. Med. 1980, 68, 332–343. [Google Scholar] [CrossRef]
- Kreger, B.E.; Craven, D.E.; McCabe, W.R. Gram-negative bacteremia. IV. Re-evaluation of clinical features and treatment in 612 patients. Am. J. Med. 1980, 68, 344–355. [Google Scholar] [CrossRef]
- Elhanan, G.; Sarhat, M.; Raz, R. Empiric antibiotic treatment and the misuse of culture results and antibiotic sensitivities in patients with community-acquired bacteraemia due to urinary tract infection. J. Infect. 1997, 35, 283–288. [Google Scholar] [CrossRef] [PubMed]
- Kollef, M.H.; Ward, S. The influence of mini-BAL cultures on patient outcomes: Implications for the antibiotic management of ventilator-associated pneumonia. Chest 1998, 113, 412–420. [Google Scholar] [CrossRef]
- Singh, N.; Yu, V.L. Rational empiric antibiotic prescription in the ICU. Chest 2000, 117, 1496–1499. [Google Scholar] [CrossRef] [PubMed]
- Chibelean, C.B.; Petca, R.-C.; Mareș, C.; Popescu, R.-I.; Enikő, B.; Mehedințu, C.; Petca, A. A Clinical Perspective on the Antimicrobial Resistance Spectrum of Uropathogens in a Romanian Male Population. Microorganisms 2020, 8, 848. [Google Scholar] [CrossRef] [PubMed]
- Petca, R.-C.; Negoiță, S.; Mareș, C.; Petca, A.; Popescu, R.-I.; Chibelean, C.B. Heterogeneity of Antibiotics Multidrug-Resistance Profile of Uropathogens in Romanian Population. Antibiotics 2021, 10, 523. [Google Scholar] [CrossRef] [PubMed]
- Petca, R.-C.; Mareș, C.; Petca, A.; Negoiță, S.; Popescu, R.-I.; Boț, M.; Barabás, E.; Chibelean, C.B. Spectrum and Antibiotic Resistance of Uropathogens in Romanian Females. Antibiotics 2020, 9, 472. [Google Scholar] [CrossRef]
- Wagenlehner, F.M.E.; Lichtenstern, C.; Rolfes, C.; Mayer, K.; Uhle, F.; Weidner, W.; Weigand, M.A. Diagnosis and management for urosepsis. Int. J. Urol. Off. J. Jpn. Urol. Assoc. 2013, 20, 963–970. [Google Scholar] [CrossRef]
- Sagana, R.; Hyzy, R.C. Management of Sepsis and Septic Shock. In Evidence-Based Critical Care; Hyzy, R.C., McSparron, J., Eds.; Springer International Publishing: Cham, Switzerland, 2020; pp. 449–460. ISBN 978-3-030-26709-4. [Google Scholar]
- Guliciuc, M.; Porav-Hodade, D.; Maier, A.C.; Bogdan-Calin, C.; Cucuruzac, R.R.; Iacob, V.A.; Tetic-Turcanu, R.D.; Marinescu, M.; Firescu, D. Urosepsis During Covid-19 Pandemic. J. Urol. Ren. Dis. 2022, 7, 1272. [Google Scholar] [CrossRef]


| Deceased | SIRS | Sepsis | Septic Shock | |||||
|---|---|---|---|---|---|---|---|---|
| Yes | No | Yes | No | Yes | No | Yes | No | |
| No | 23 | 151 | 46 | 128 | 88 | 86 | 40 | 134 |
| Age (years) Mean ± SD | 71.04 ± 11.03 | 59.91 ± 16.04 | 56.84 ± 17.22 | 62.97 ± 15.17 | 60.37 ± 15.54 | 62.40 ± 16.29 | 69.03 ± 12.72 | 59.10 ± 16.08 |
| p value ** | <0.001 | <0.01 | 0.40 | <0.0001 | ||||
| leukocyte (106/L) median (IQR) | 18,270.0 (12,582.5–24,550.0) | 16,360.0 (11,615.0–20,625.0) | 16,065.0 (12,050.0–19,310.0) | 16,470.0 (11,635.0–21,705.0) | 16,360.0 (11,367.5–19,937.5) | 16,530.0 (12,082.5–22,337.5) | 18,920.0 (12,395.0–28,140.0) | 16,315.0 (11,600.0–19,660.0) |
| p value * | 0.24 | 0.79 | 0.16 | <0.01 | ||||
| Procalcitonin (ng/mL) | 32.0 (10.38–32.0) | 7.55 (2.70–12.2) | 2.45 (0.70–3.20) | 11.20 (7.25–22.32) | 9.6 (6.3–12.2) | 4.7 (1.7–22.1) | 24.7 (13.5–32.0) | 6.3 (2.70–10.6) |
| p value * | <0.0001 | <0.0001 | <0.01 | <0.0001 | ||||
| SOFA | 10.0 (8.25–12.0) | 5.0 (3.0–7.0) | 3.0 (2.0–4.0) | 7.0 (5.0–9.0) | 6.0 (4.0–7.0) | 5.0 (3.0–9.0) | 9.5 (8.0–12.0) | 4.5 (3.0–6.0) |
| p value * | <0.0001 | <0.0001 | 0.78 | <0.0001 | ||||
| qSOFA | 3.0 (2.0–3.0) | 1.0 (0.0–2.0) | 0.0 (0.0–0.0) | 1.0 (1.0–2.0) | 1.0 (0.0–1.75) | 1.0 (0.0–2.0) | 2.0 (2.0–3.0) | 0.0 (0.0–1.0) |
| p value * | <0.0001 | <0.0001 | 0.32 | <0.0001 | ||||
| CCI | 11.0 (9.2–13.0) | 6.0 (2.0–8.0) | 4.0 (1.0–8.0) | 8.0 (4.0–9.5) | 7.0 (3.0–9.0) | 7.0 (3/25–9/0) | 9.0 (7.0–12.0) | 6.0 (2.0–8.0) |
| p value * | <0.0001 | <0.0001 | 0.46 | <0.0001 | ||||
| Intensive care days | 5.0 (2.0–8.75) | 0.0 (0.0–1.0) | 0.0 (0.0–0.0) | 1.0 (0.0–3.0) | 0.0 (0.0–1.0) | 1.0 (0.0–3.0) | 3.5 (2.0–7.0) | 0.0 (0.0–1.0) |
| p value * | <0.0001 | <0.0001 | <0.001 | <0.0001 | ||||
| Hospitalization days | 10.0 (6.25–18.7) | 8.0 (5.0–13.0) | 5.0 (3.0–8.0) | 10.0 (6.5–17.0) | 9.0 (6.0–13.7) | 7.0 (4.0–13.7) | 15.0 (8.0–22.5) | 8.0 (5.0–11.0) |
| p value * | 0.22 | <0.0001 | 0.12 | <0.0001 | ||||
| Hospitalization costs (Lei) | 10855.0 (6752.5–24,053.2) | 5329.0 (2230.2–9690.5) | 2863.0 (1247.0–6833.0) | 7309.0 (3416.5–14,994.0) | 5836.0 (2351.7–9398.2) | 6833.0 (2663.7–11,805.0) | 14704.5 (7357.0–26,103.5) | 4437.5 (1914.0–7967.0) |
| p value * | <0.001 | <0.0001 | 0.40 | <0.0001 | ||||
| Deceased | |||||
|---|---|---|---|---|---|
| Cutoff value | Specificity % (95% CI) | Sensitivity % (95% CI) | AUC % | 95% CI | |
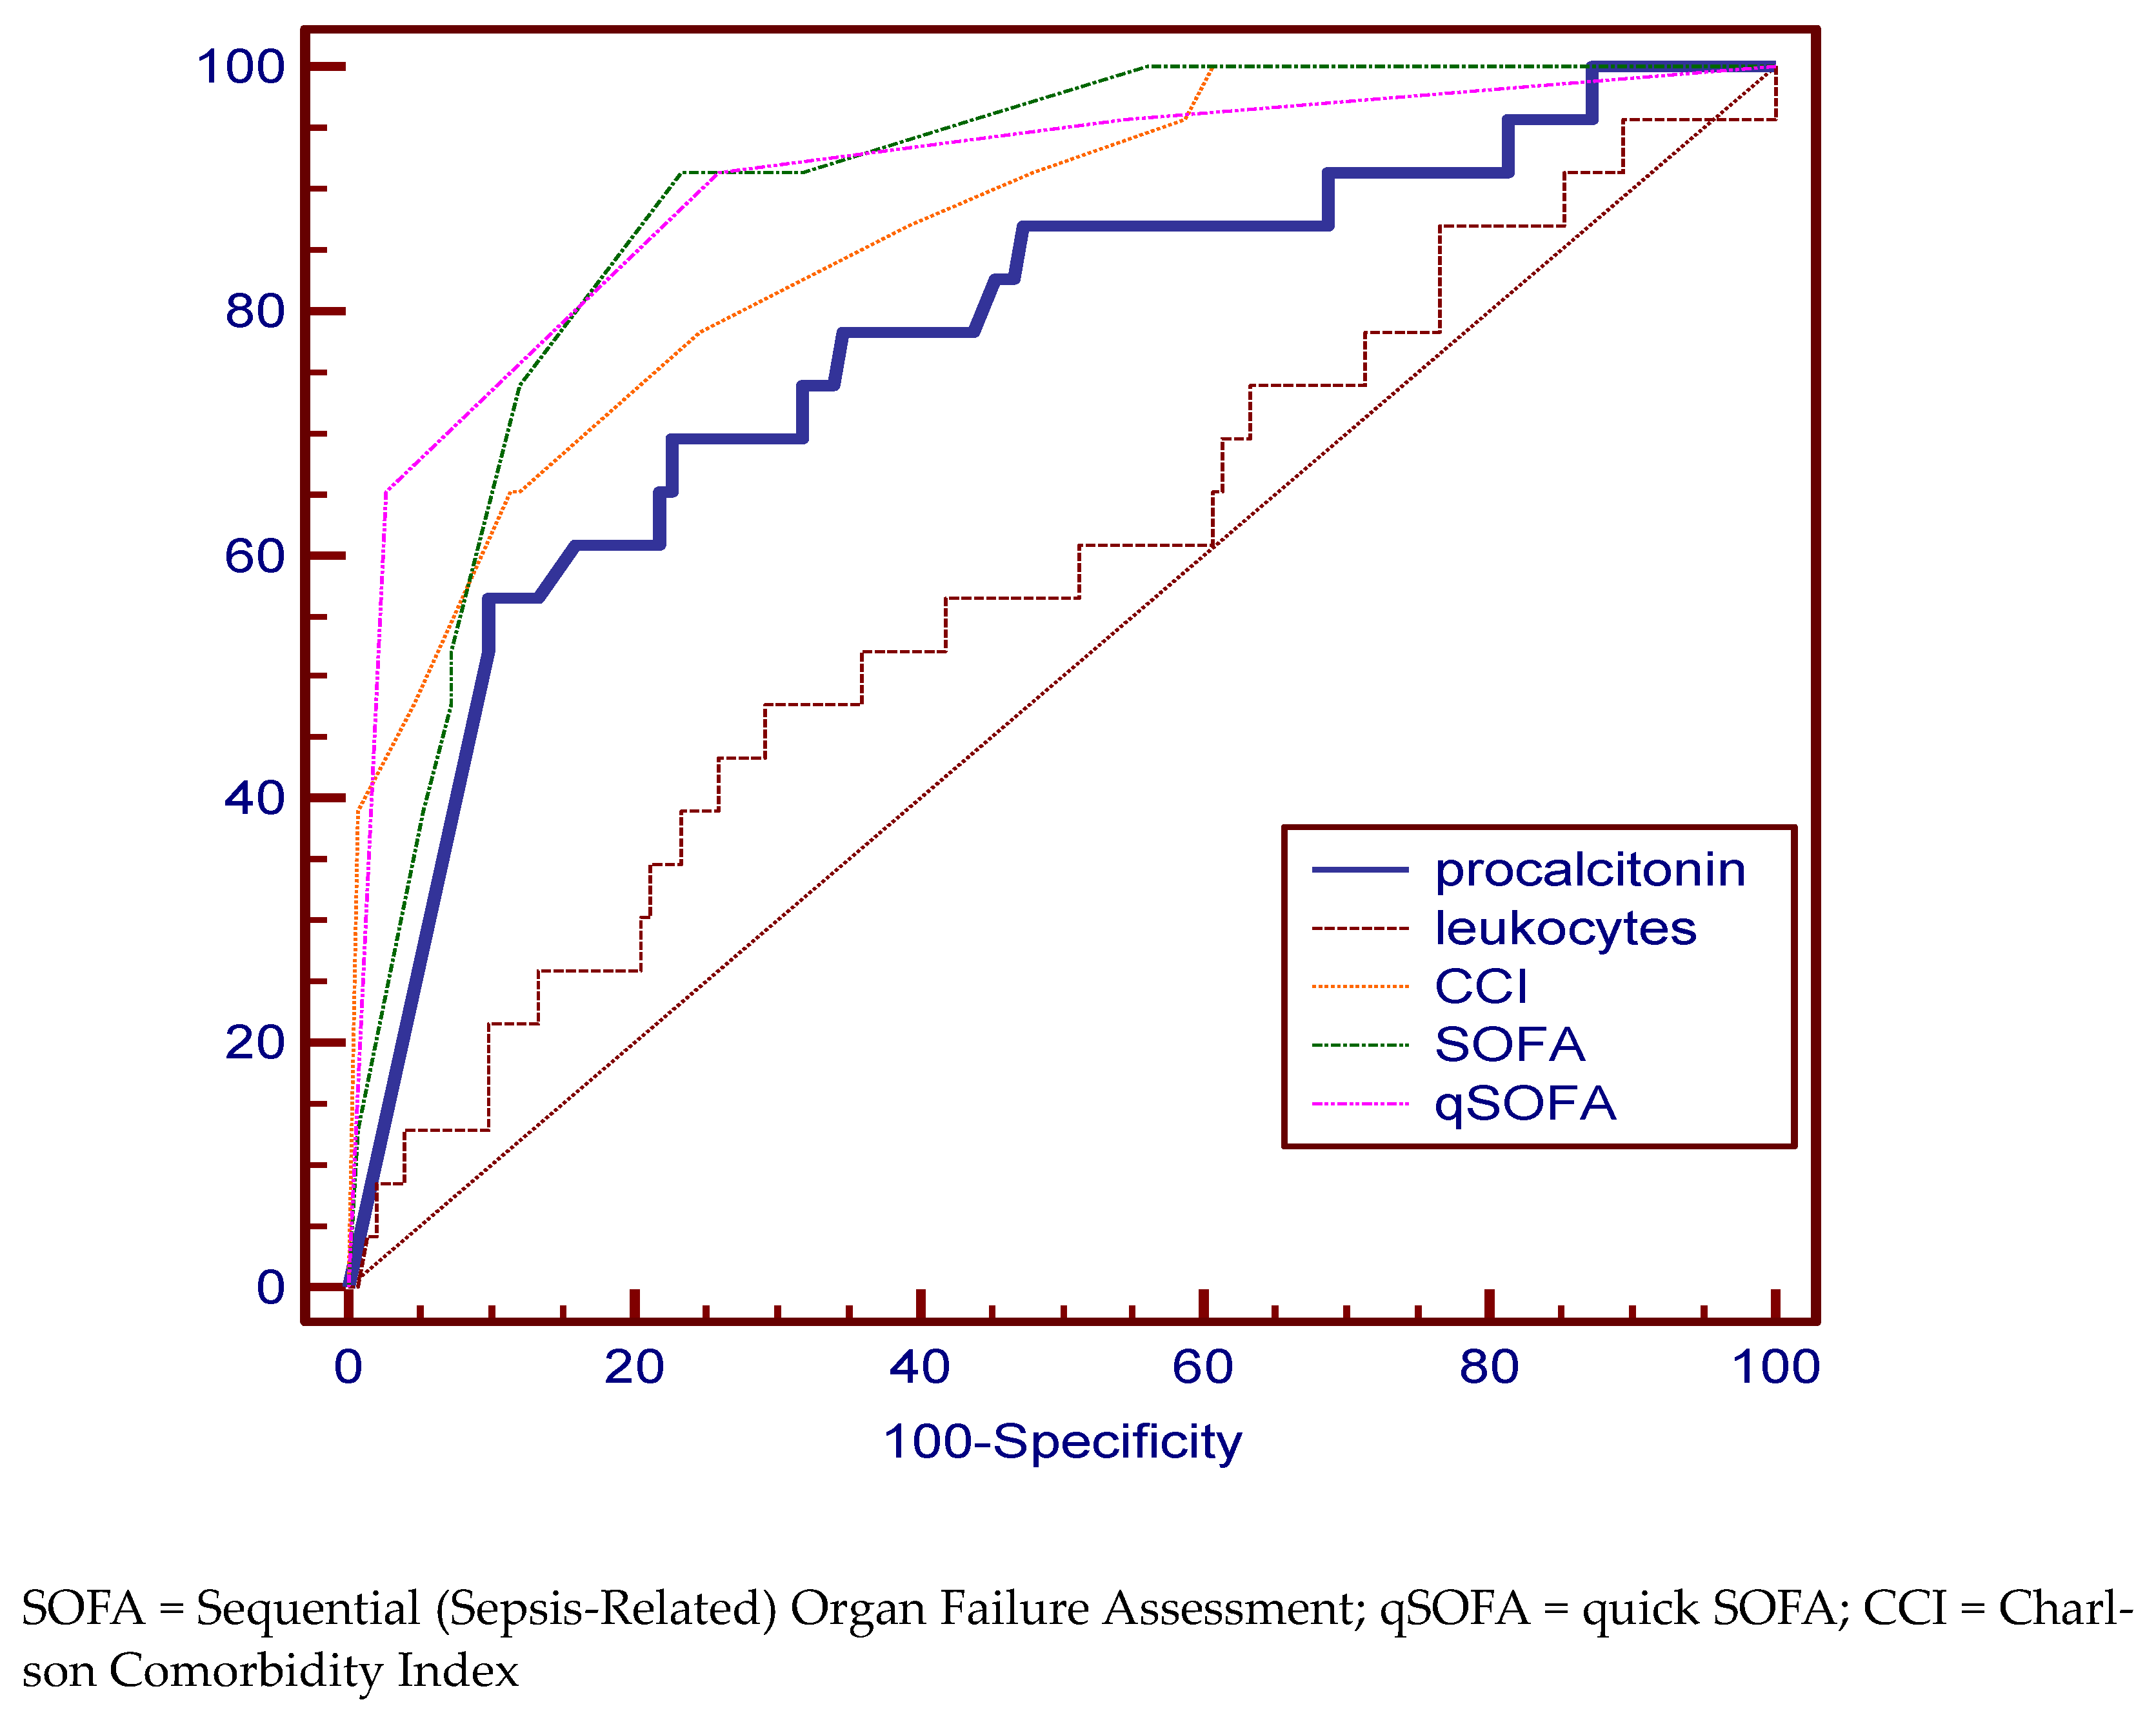
| procalcitonin | 12.5 | 69.57 (47.1–86.8) | 77.33 (69.8–83.8) | 77.2 | 70.2 to 83.2 |
| leukocytes | 19,340 × 106/L | 47.83 (26.8–69.4) | 70.86 (62.9–78.0) | 57.6 | 49.9 to 65.1 |
| CCI | 10 | 65.22 (42.7–83.6) | 88.74 (82.6–93.3) | 86.3 | 80.2 to 91.0 |
| SOFA | 7 | 91.33 (72.0–98.9) | 76.82 (69.3–83.3) | 89.3 | 83.7 to 93.5 |
| qSOFA | 1 | 91.30 (72.0–98.9) | 74.17 (66.4–80.9) | 90.3 | 84.9 to 94.3 |
| SIRS group | |||||
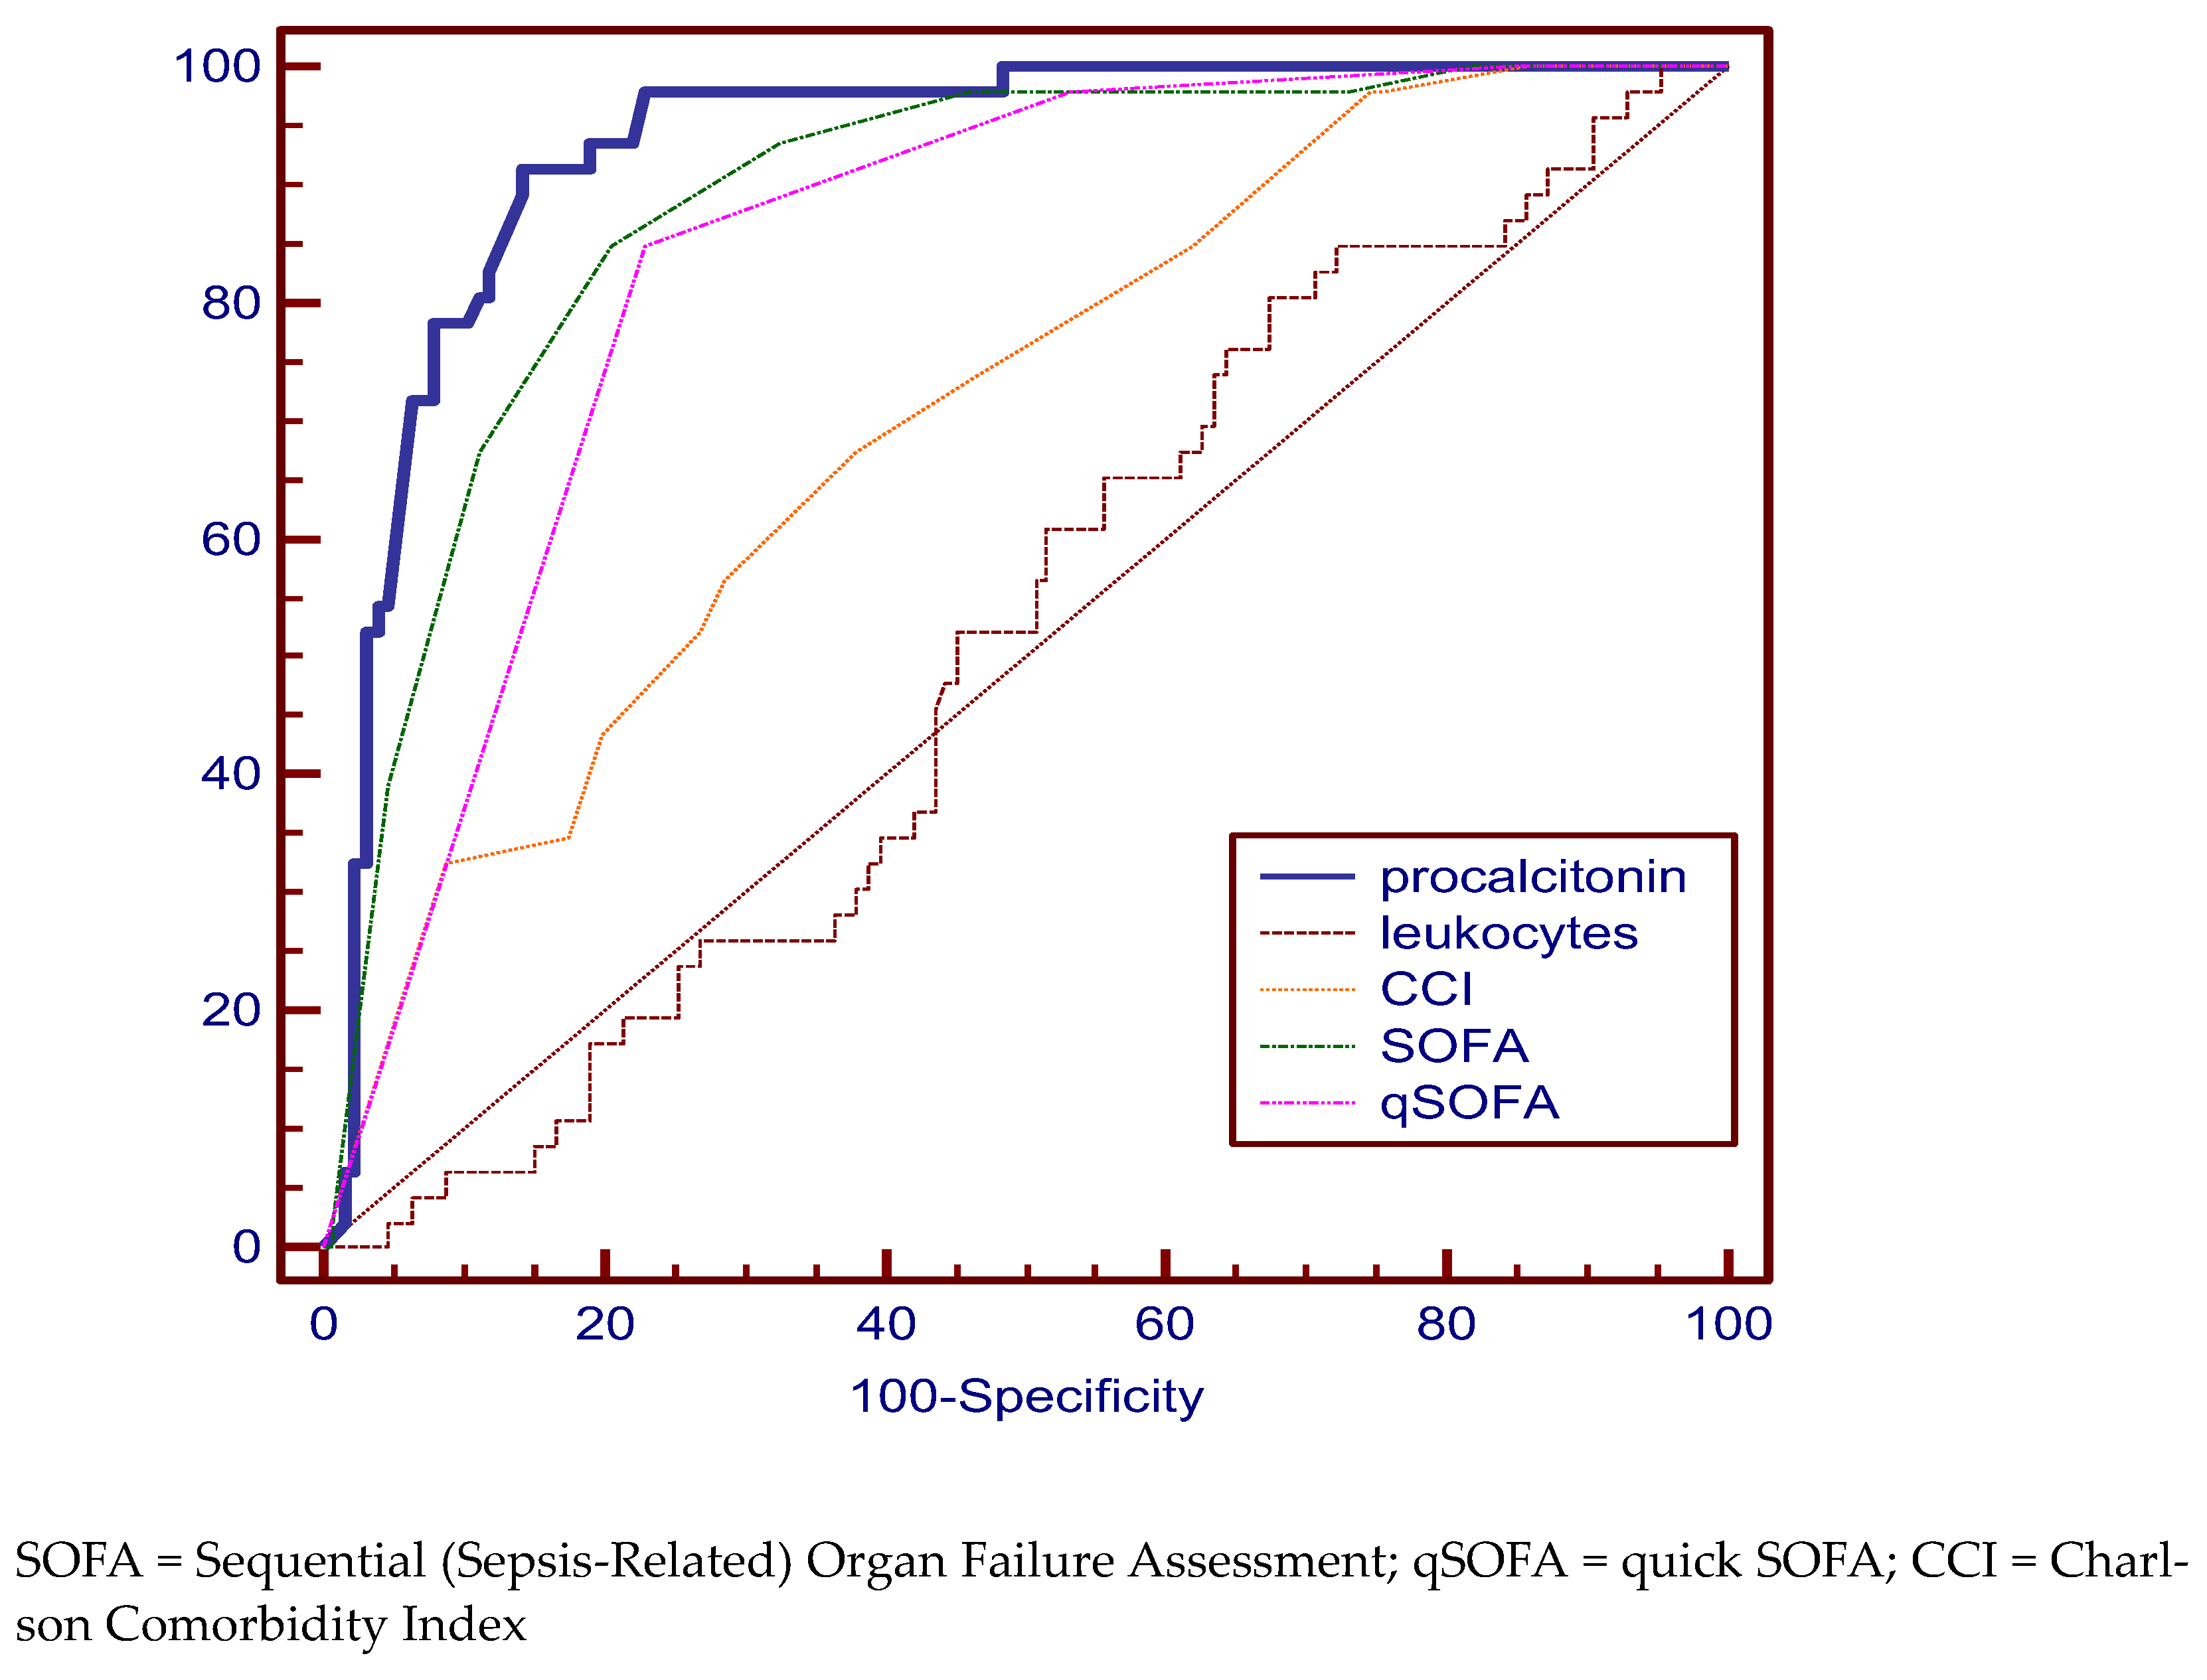
| procalcitonin | 4.8 | 91.30 (79.2–97.6) | 85.71 (78.4–91.3) | 93.0 | 88.1 to 96.3 |
| leukocytes | 19,750 × 106 L | 80.43 (66.1–90.6) | 32.28 (24.3–41.2) | 51.1 | 43.4 to 58.8 |
| CCI | 6 | 67.39 (52.0–80.5) | 61.42 (52.4–69.9) | 70.3 | 62.9 to 77.0 |
| SOFA | 4 | 84.78 (71.1–93.7) | 78.74 (70.6–85.5) | 88.3 | 82.5 to 92.7 |
| qSOFA | 0 | 84.78 (71.1–93.7) | 76.38 (68.0–83.5) | 83.8 | 77.4 to 88.9 |
| Sepsis Group | |||||
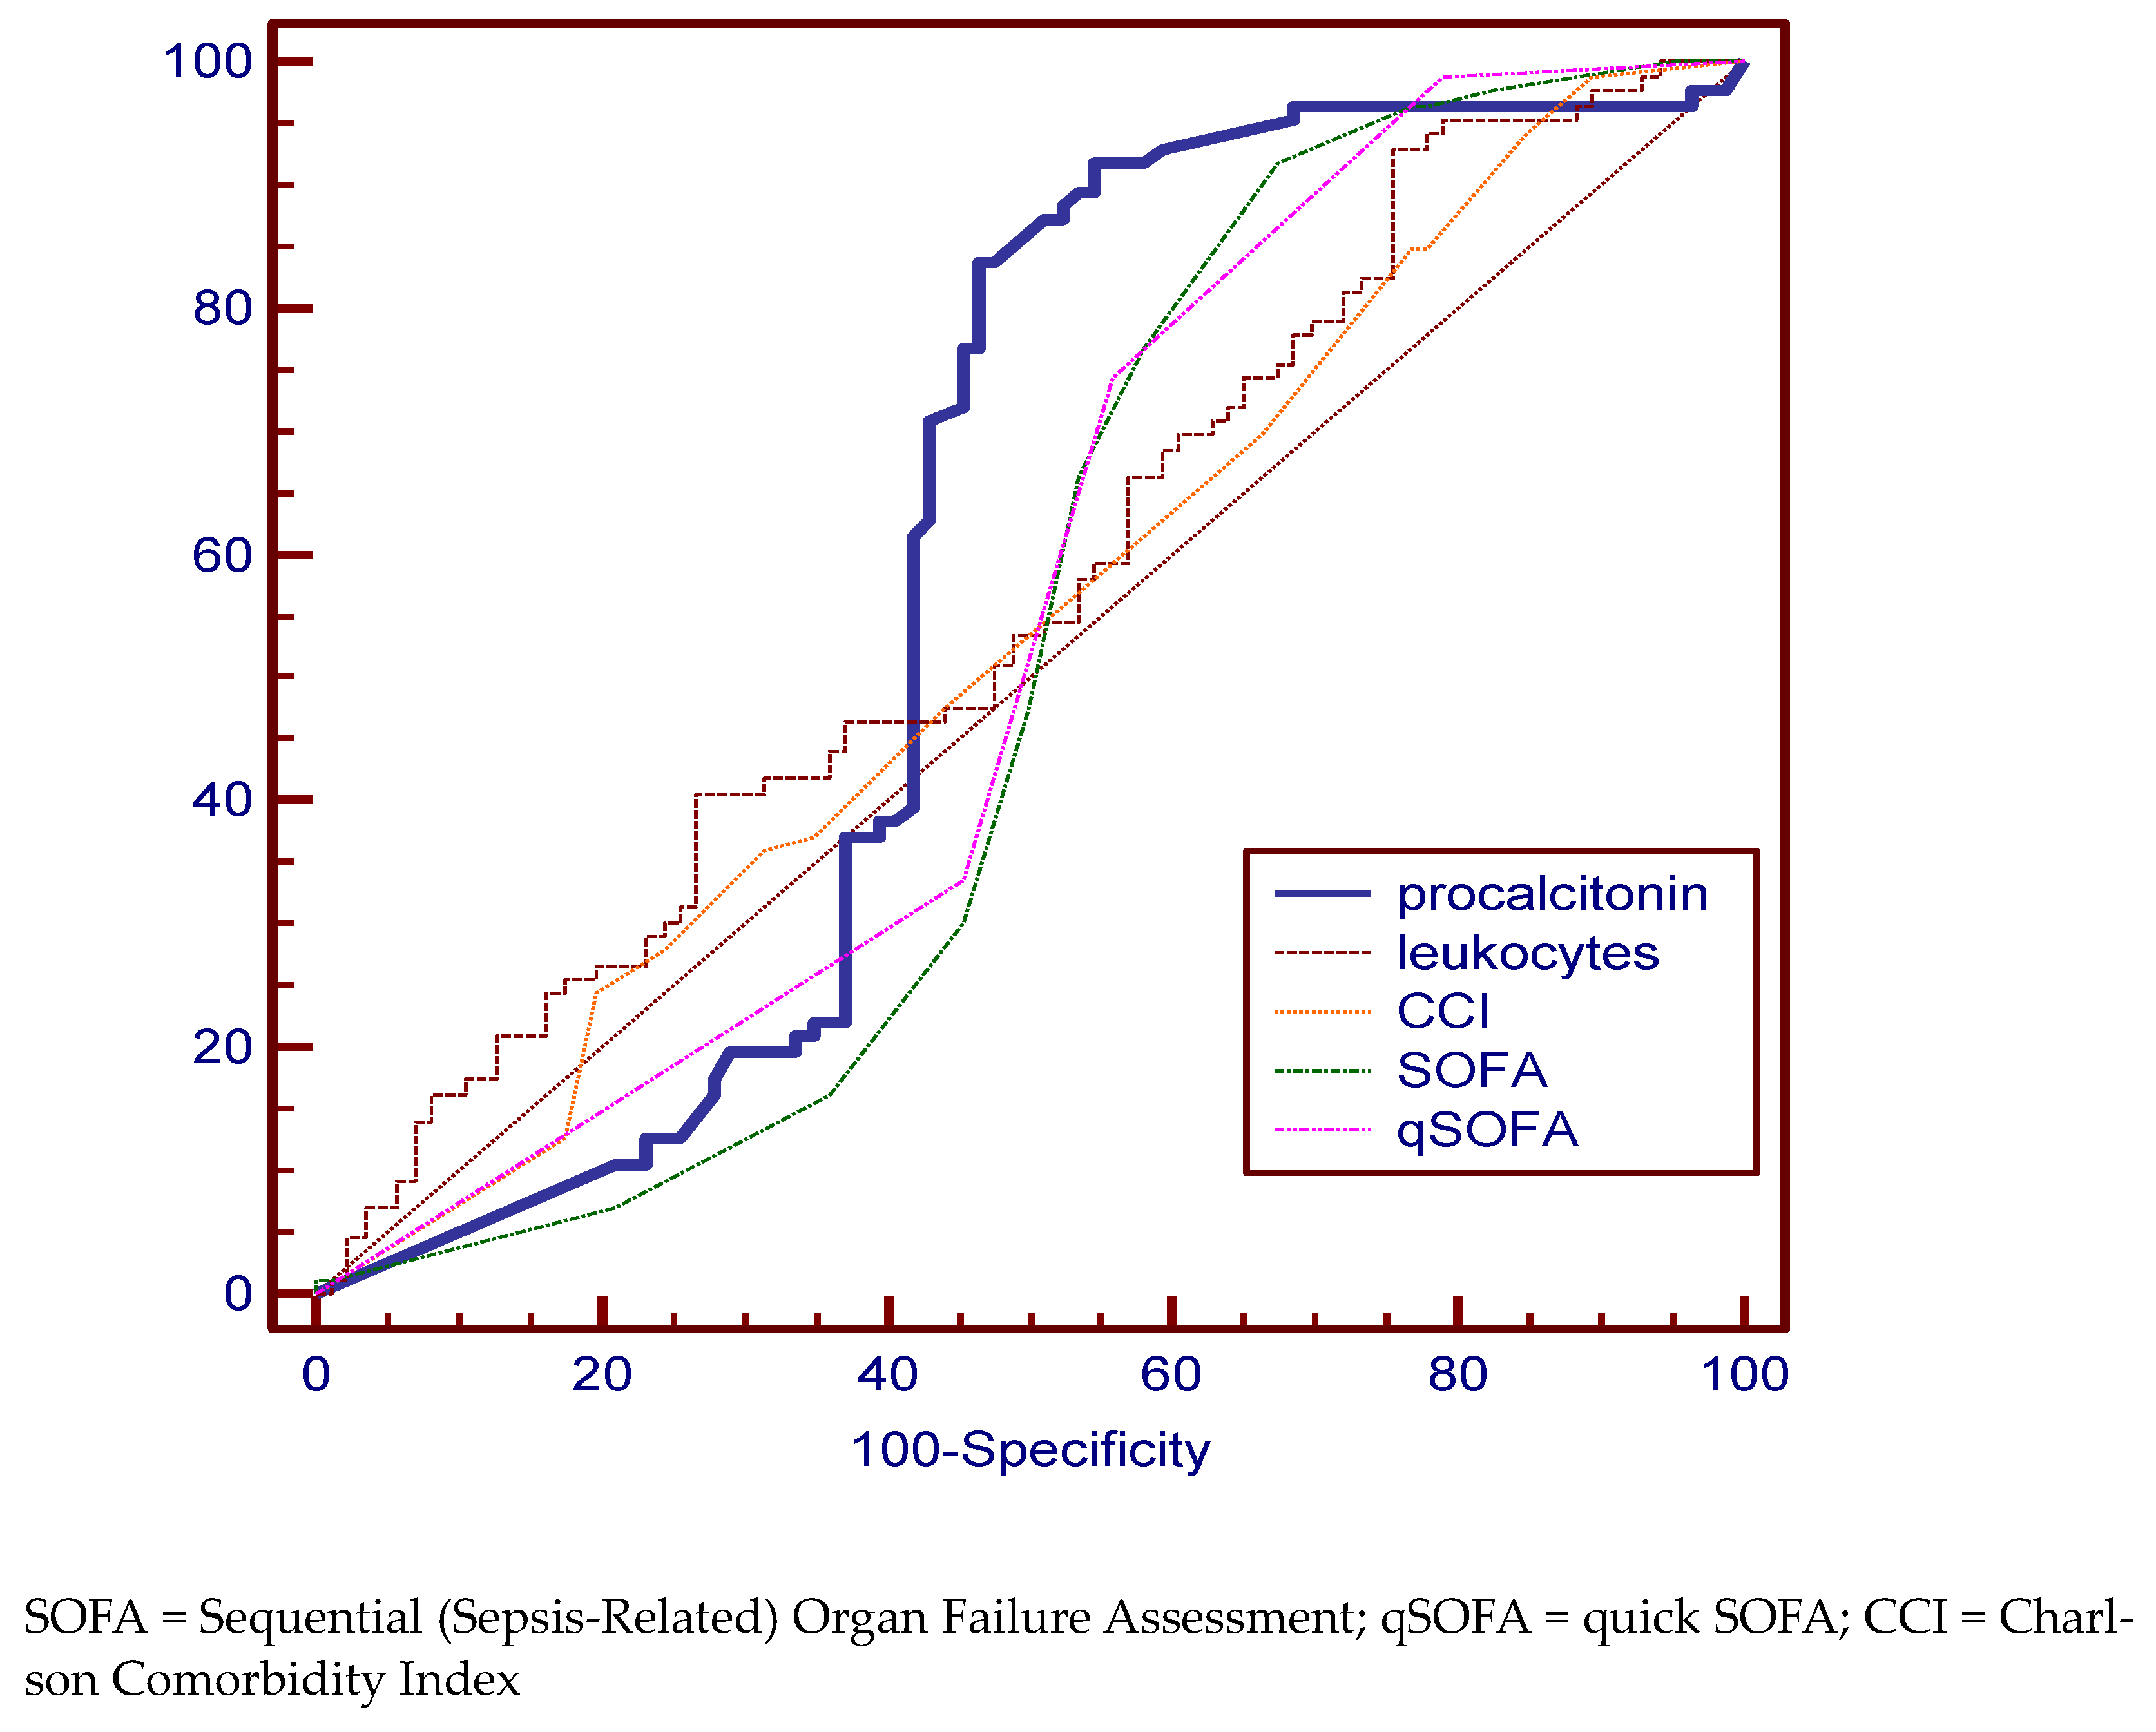
| procalcitonin | 4.8 | 83.72 (74.2–90.8) | 53.49 (42.4–64.3) | 59.3 | 51.6 to 66.8 |
| leucocytes | 24,070 × 106/L | 93.10 (85.6–97.4) | 24.43 (15.8–34.9) | 56.8 | 49.0 to 64.3 |
| CCI | 11 | 94.25 | 15.12 | 53.6 | 45.9 to 61.2 |
| SOFA | 8 | 91.95 (84.1–96.7) | 32.58 (22.8–43.5) | 51.4 | 43.7 to 59.1 |
| qSOFA | 2 | 98.85 (93.8–100.0) | 20.93 (12.9–31.0) | 54.3 | 46.5 to 61.9 |
| Septic Shock group | |||||
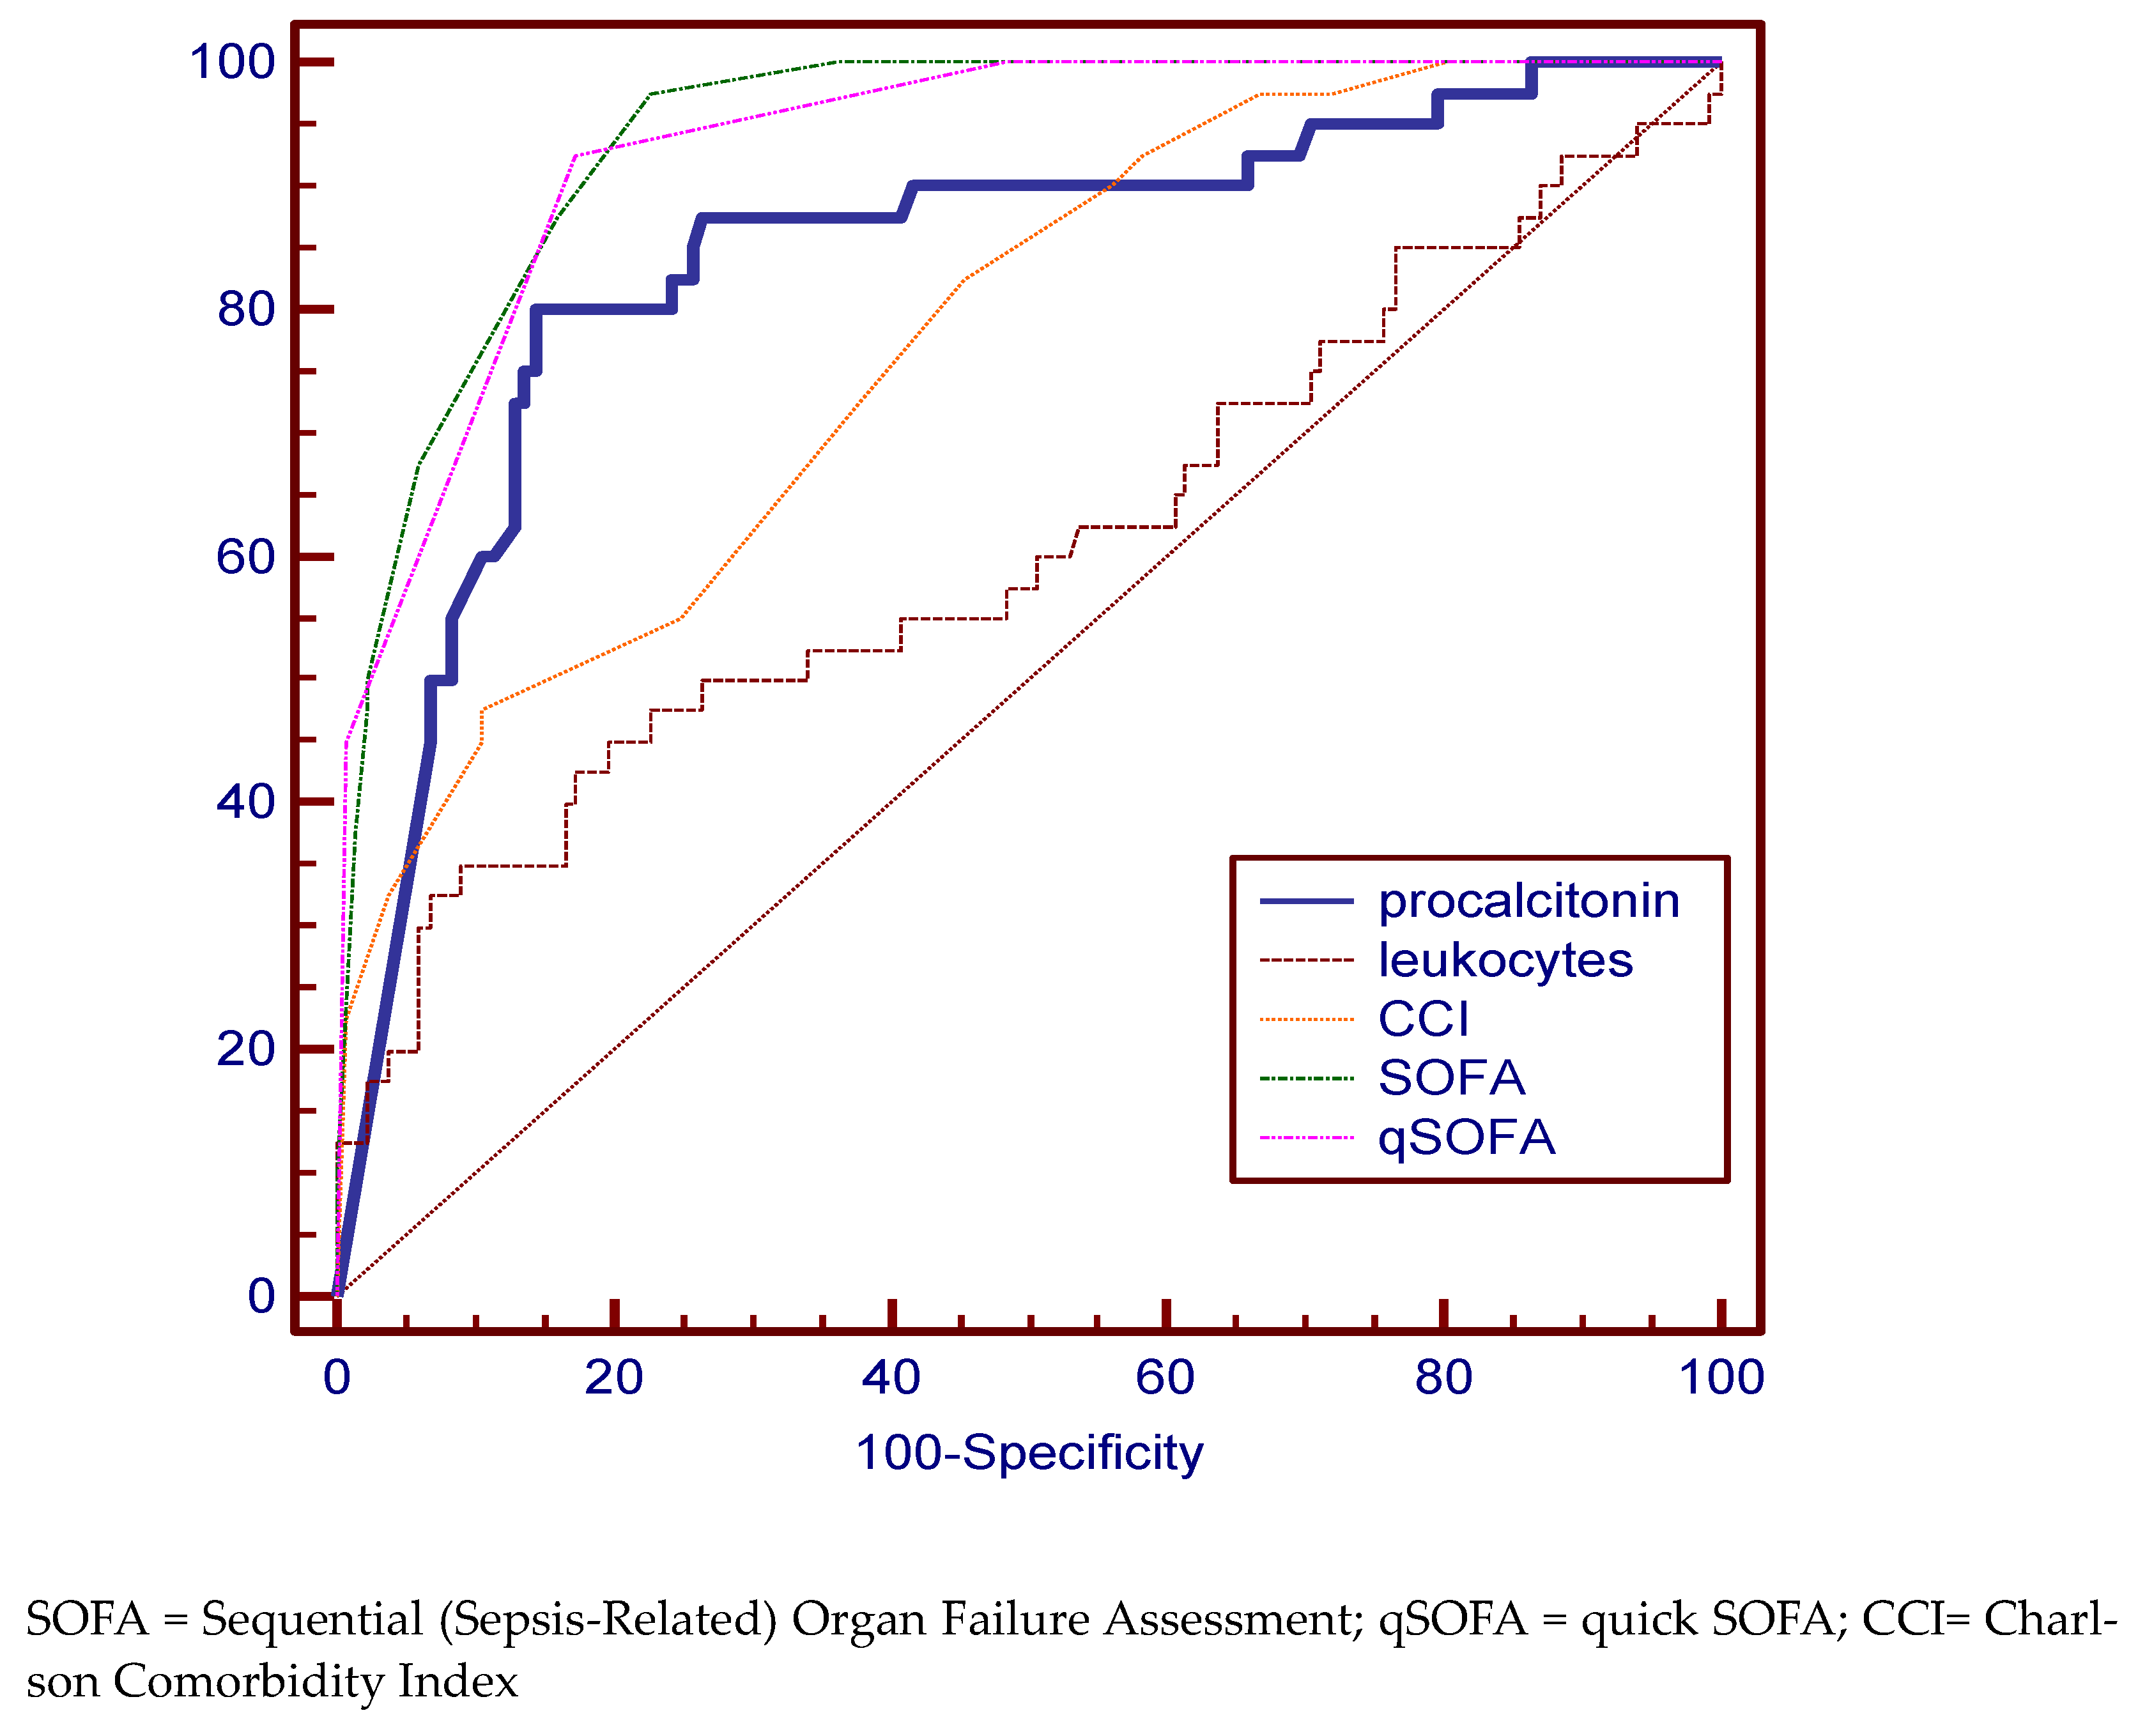
| procalcitonin | 12.4 | 80.00 (64.4–90.9) | 85.61 (78.4–91.1) | 84.1 | 77.8 to 89.2 |
| leukocytes | 24,260 × 106 L | 35.00 (20.6–51.7) | 90.98 (84.8–95.3) | 60.7 | 53.0 to 68.1 |
| CCI | 6 | 82.5 (67.2–92.7) | 54.89 (46.0–63.5) | 77.4 | 70.4 to 83.4 |
| SOFA | 6 | 97.50 (86.8–99.9) | 77.44 (69.4–84.2) | 93.9 | 89.3 to 97.0 |
| qSOFA | 1 | 92.50 (79.6–98.4) | 82.71 (75.2–88.7) | 93.0 | 88.2 to 96.4 |
Disclaimer/Publisher’s Note: The statements, opinions and data contained in all publications are solely those of the individual author(s) and contributor(s) and not of MDPI and/or the editor(s). MDPI and/or the editor(s) disclaim responsibility for any injury to people or property resulting from any ideas, methods, instructions or products referred to in the content. |
© 2023 by the authors. Licensee MDPI, Basel, Switzerland. This article is an open access article distributed under the terms and conditions of the Creative Commons Attribution (CC BY) license (https://creativecommons.org/licenses/by/4.0/).
Share and Cite
Guliciuc, M.; Porav-Hodade, D.; Chibelean, B.-C.; Voidazan, S.T.; Ghirca, V.M.; Maier, A.C.; Marinescu, M.; Firescu, D. The Role of Biomarkers and Scores in Describing Urosepsis. Medicina 2023, 59, 597. https://doi.org/10.3390/medicina59030597
Guliciuc M, Porav-Hodade D, Chibelean B-C, Voidazan ST, Ghirca VM, Maier AC, Marinescu M, Firescu D. The Role of Biomarkers and Scores in Describing Urosepsis. Medicina. 2023; 59(3):597. https://doi.org/10.3390/medicina59030597
Chicago/Turabian StyleGuliciuc, Mădălin, Daniel Porav-Hodade, Bogdan-Calin Chibelean, Septimiu Toader Voidazan, Veronica Maria Ghirca, Adrian Cornel Maier, Monica Marinescu, and Dorel Firescu. 2023. "The Role of Biomarkers and Scores in Describing Urosepsis" Medicina 59, no. 3: 597. https://doi.org/10.3390/medicina59030597