Article

Non-Clinical Variables Influencing Cesarean Section Rate According to Robson Classification

1
Department of Health Sciences, University of Florence, Obstetrics and Gynecology, Careggi University Hospital, 50134 Florence, Italy
2
Department of Experimental, Clinical and Biomedical Sciences, University of Florence, Obstetrics and Gynecology, Careggi University Hospital, 50134 Florence, Italy
3
Department of Obstetrics and Gynecology, New York Health and Hospitals/Lincoln, Bronx, NY 10451, USA
*
Author to whom correspondence should be addressed.
These authors contributed equally to this work.
Medicina 2020, 56(4), 180; https://doi.org/10.3390/medicina56040180
Submission received: 6 March 2020 / Revised: 3 April 2020 / Accepted: 13 April 2020 / Published: 15 April 2020
(This article belongs to the Special Issue Pregnancy: Diagnosis, Misdiagnosis, Complications and Outcomes)

Abstract

:
Background and Objectives: The incidence of cesarean section (CS) has progressively increased worldwide, without any proven benefit to either the mother or the newborn. The aim of this study was to evaluate the association between CS rates and both clinical and non-clinical variables, while applying the Robson classification system. Materials and Methods: This is a retrospective observational study of pregnant women delivering at a tertiary care hospital between 2012 and 2017, either under public or private healthcare. The overall CS rate, and the elective and non-elective CS rate, divided by classes of Robson, were determined. The rate of vaginal deliveries and CSs was compared between the public and private setting. The distribution of incidence of non-elective CSs and their main indications were analyzed between daytime and nighttime. Results: 18,079 patients delivered during the study period: 69.2% delivered vaginally and 30.8% by CS. Robson class 5 was the most frequent (23.4%), followed by class 2B (16.8%). Of the 289 private practice deliveries, 59.2% were CSs. The CS rate was significantly higher in private compared to public practice: 59.2% and 30.4%, respectively (OR 3.32, 95% CI 2.62 ± 4.21). When only considering elective CSs, a statistically significant difference was found in Robson class 5 between private and public practice, with the latter having more CSs (94.2% and 83.8%, respectively (p = 0.046)). The rate of non-elective CS was significantly lower during nighttime than during daytime (17.2% vs. 21.5%, p < 0.01). During daytime, the higher incidence of CS occurred between 4:00 and 4:59 pm, and during nighttime between 9:00 and 9:59 pm. Failed induction was significantly more common as an indication to CS during daytime when compared to nighttime (p = 0.01). Conclusions: This study identified two non-clinical variables that influenced the CS rate: the type of healthcare setting (private vs. public) and the time of the day. We believe that these indications might be related more to the practitioner attitude, rather than objective delivery complications.

1. Introduction

Cesarean section (CS) is the most common obstetric surgery performed in the world. In recent decades, the incidence of CS has progressively increased worldwide [1,2,3]. The CS rates show wide variation among countries in the world, ranging from 0.4 to 40 percent. In Italy, the CS rate changed from 10% in 1980 to 33% in 2000, showing an increase of 196% from 1980–2000 [4]. It has been reported that subjective indications, such as non-reassuring fetal status and labor arrest disorders [5], contribute to a larger proportion in the rise of the CS rate compared to objective indications [6]. Indeed, the consistent rise in the CS rate is mainly due to non-clinical indications, such as doctors’ fear of malpractice litigation, patients’fear of labor pain, convenience for the mother in scheduling in advance the day of the delivery, and, last but not least, the misconception that CS ensures a birth with no complications [7].
Many clinicians believe that a primary CS would benefit the patient, regardless of the underlying indications [8,9,10]. On the contrary, there is recent evidence that vaginal delivery would be the best option for maternal and neonatal health [11,12]. Moreover, women undergoing CS will most likely choose to have another CS in subsequent pregnancies, leading to a further increase in the CS rate, with the well-known associated complications of repeated surgeries.
In 2014, the World Health Organization (WHO) revisited the optimal CS rate at both population and hospital level, and identified a universal classification system for CS. Additionally, WHO conducted a worldwide study to assess the association between CS and maternal and neonatal mortality [13,14]. These two studies demonstrated that, at the population level, if the CS rate rises towards 10–15%, the number of maternal and newborn deaths decreases. When the rate goes above 10–15%, there is no evidence that mortality and morbidity rates get any better. On the other hand, at the hospital level, there was no standard classification system for CS that would allow the use of CS rates to compare maternal and perinatal outcome for different facilities, cities, countries, or regions. Therefore, WHO recommended adopting the Robson classification system as a global standard for assessing, monitoring, and comparing CS rates within healthcare facilities over time, and between facilities. The classification allocates pregnant women at the time of delivery into 10 groups, which are mutually exclusive. The groups are based on five obstetric characteristics that are routinely collected in every care setting: parity, onset of labor, gestational age, fetal presentation, and number of the fetuses (Table 1).
Indeed, the Robson classification can be easily applied to evaluate the CS rates and their implications and, nowadays, the classes where CS rate should be lowered are well defined; nevertheless, we think that the Robson classification has some limitations as based only on clinical- variables. For instance, a recent Cochrane has proved that interventions on non-clinical variables are effective in reducing the number of unnecessary CSs [15].
In the present study we evaluated the association of non-clinical variables such as type of setting (private or public) and time of the day at which deliveries occurred with the CS rate in our population. These associations may impact the developing of new interventions aimed at reducing unnecessary CSs.

2. Materials and Methods

This is a retrospective observational study on pregnant women delivering at Careggi University Hospital (Florence, Italy), a tertiary level hospital, from September 2012 to November 2017. At Careggi University Hospital, both private and public healthcare is offered. All of the data that were collected from electronic medical charts software in the time frame 2012–2017 were facilitated by the use of the electronic medical records software ARGOS 3.49 (Dedalus S.p.a., Florence, Italy).
We identified three main endpoints in this study in order to evaluate the association between CS rate and both clinical and non-clinical variables. The first endpoint was to determine the overall CS rate, and the elective and non-elective CS rate, divided by classes of Robson. Moreover, the incidence of the most frequent indications to CS was calculated in Robson classes 1 and 2, which are considered to be lower risk classes of CS deliveries.
The second endpoint was to compare the rate of vaginal deliveries (spontaneous and instrumental), and elective and non-elective CSs between patients who delivered in private and public setting. Private patients were defined as those whose delivery was funded by private health insurance or self-funded, whereas the public patients included women whose medical bills were completely covered by the Italian National Health Care system.
The third endpoint was to compare the different distribution of non-elective CSs and their main indications between daytime and nighttime. We compared the non-elective CS rate between day and night time. The time of birth was categorized into six periods of time from 00:00 am to 03:59 am, from 04:00 am to 07:59 am, from 08:00 am to 11:59 am, from 12:00 pm to 03:59 pm, from 04:00 pm to 07:59 pm, and 08:00 pm to 11:59 pm. We calculated the rate of daytime CS and nighttime CS. At our institution, nightshift starts at 8 pm and ends at 8 am, while a daytime shift is from 8 am until 8 pm. We defined night-time CS as the CS performed during nightshift, and daytime CS as the CS performed during daytime shift.
The study was exempted from IRB (Institutional Review Board) review because the data were fully anonymized and de-identified.

Statistical Analysis

The chi-square test with continuity correction or Fisher’s exact test was used to compare the categorical variables. The results were significant for p-values <0.05. Data were analyzed using Graph Pad INSTAT3 software package (San Diego, CA, USA).

3. Results

There were 18,079 consecutive deliveries during the study period. Of these, 12,505 (69.2%) were vaginal deliveries, and 5574 (30.8%) were CSs. Of the CSs, 3022 (16.7% of total deliveries) were non-elective CS, and 2552 (14.1% of total deliveries) were elective CS. Table 2 shows the percentage of vaginal deliveries and CSs for each Robson class.
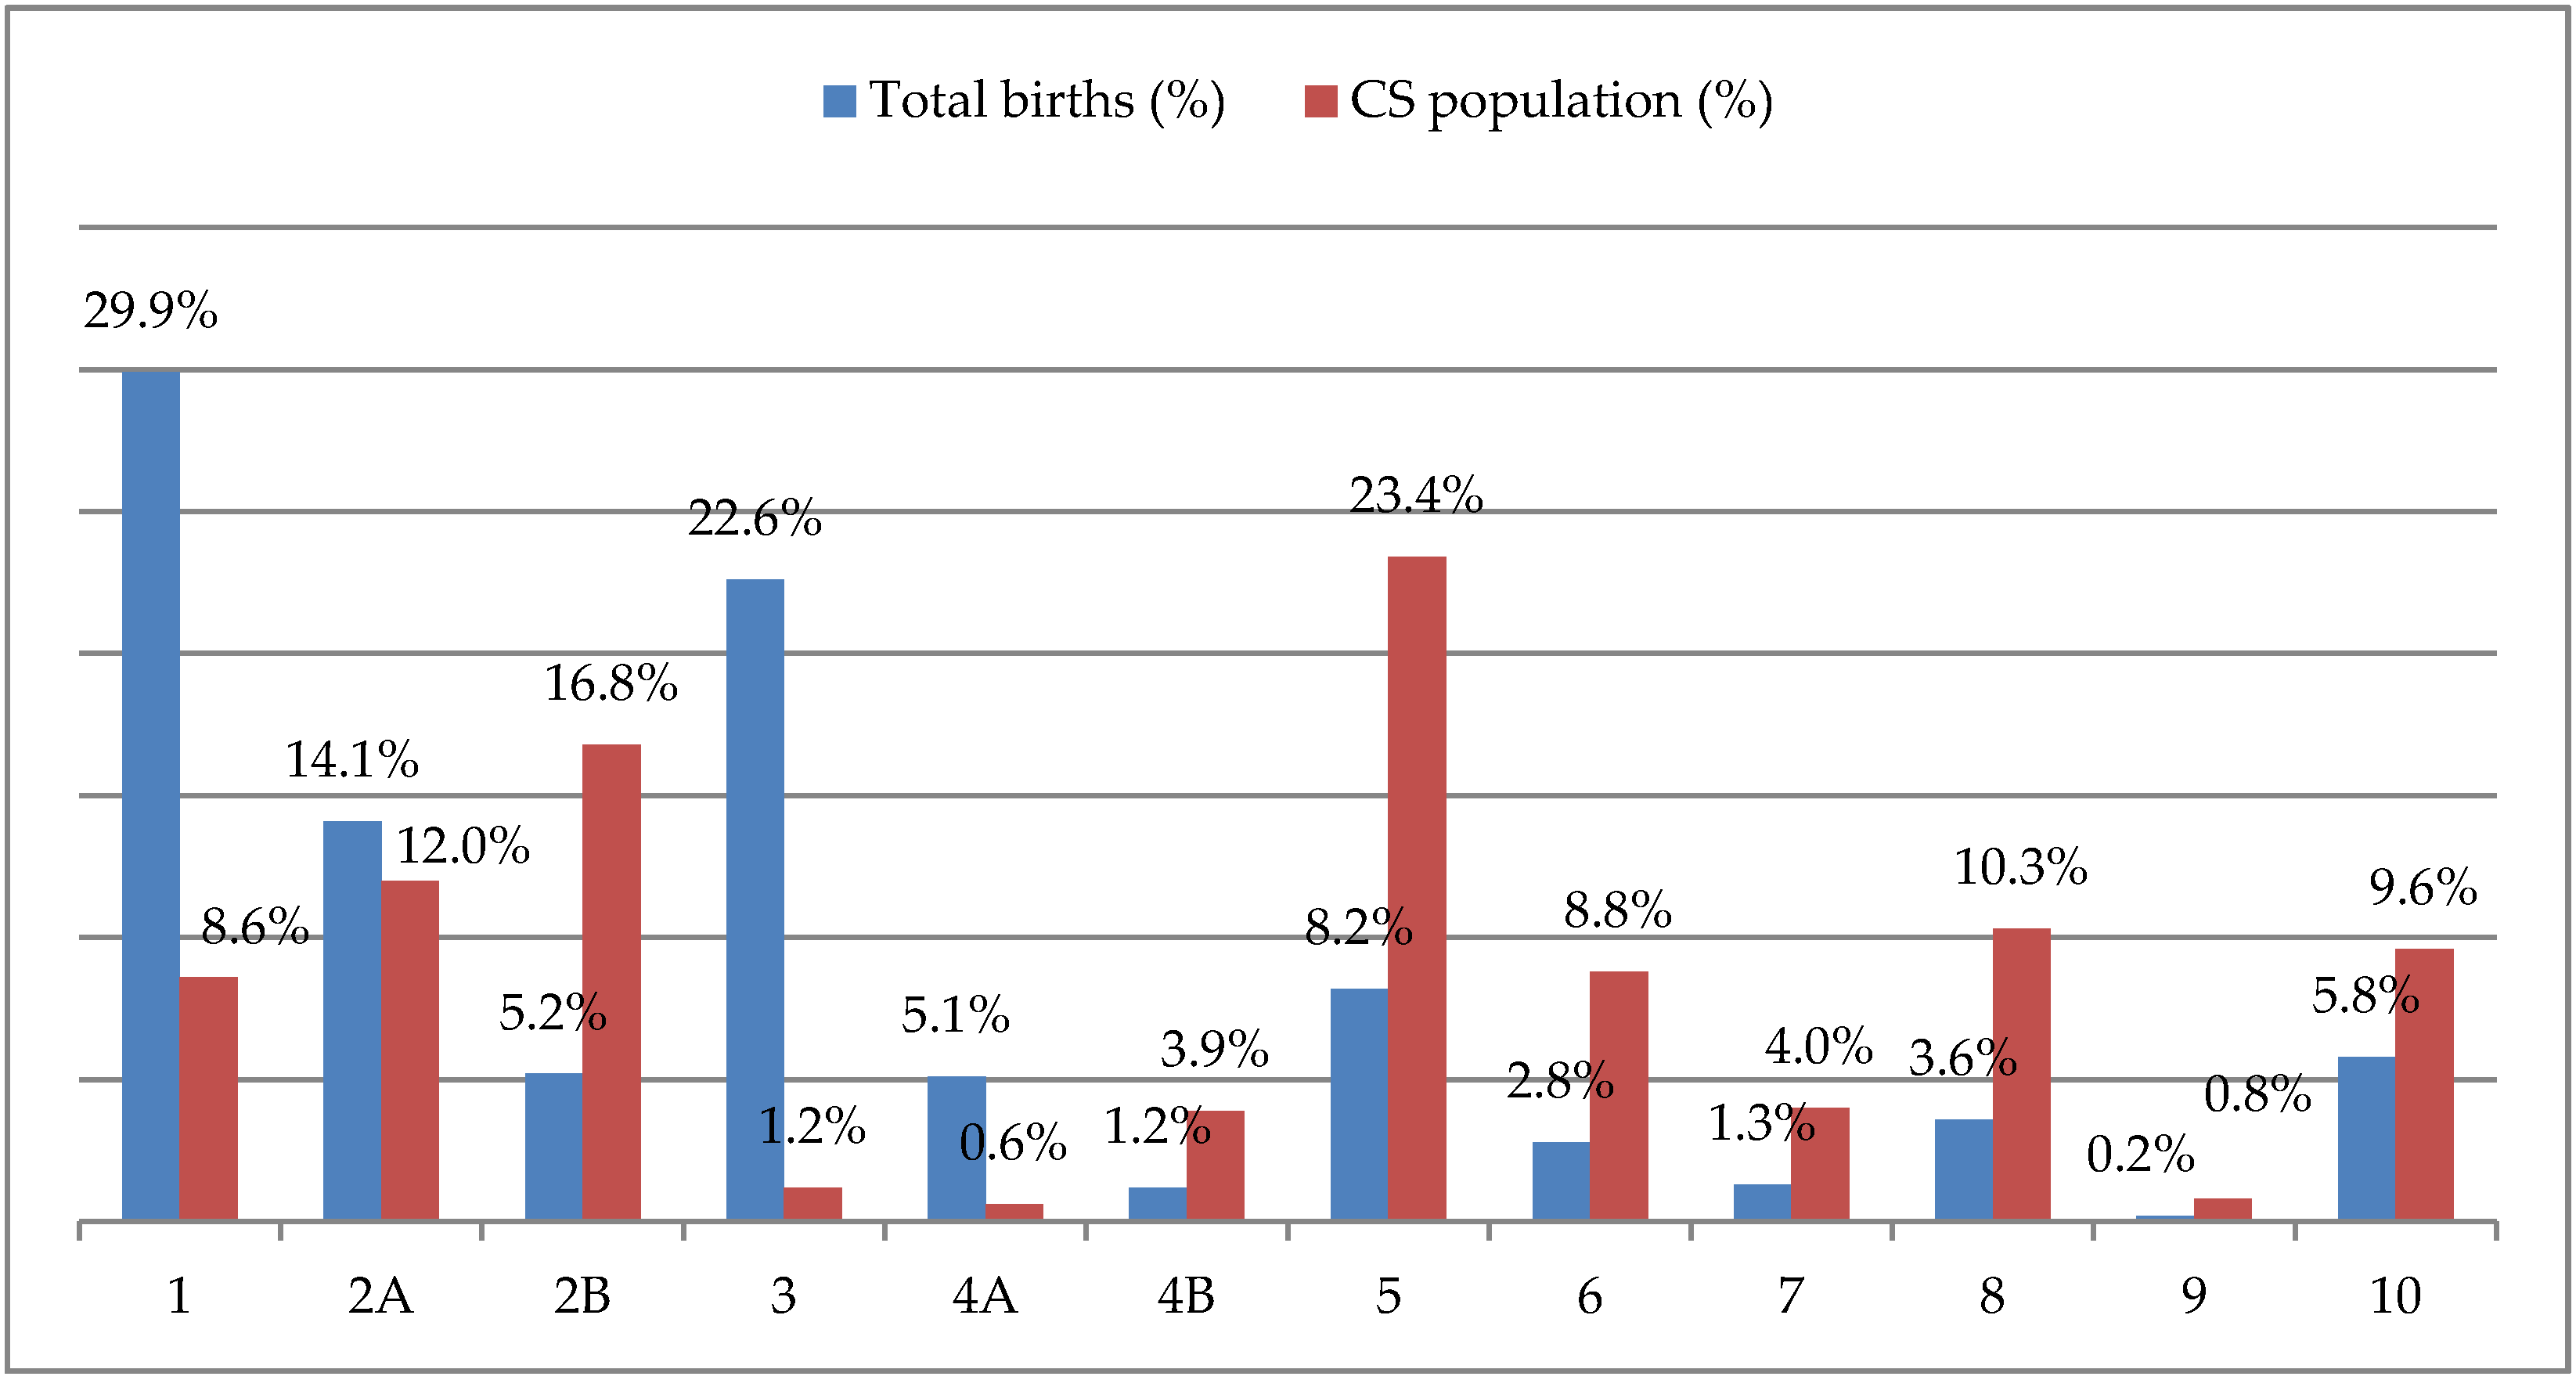
When considering the distribution of CSs by Robson class, Robson class 5 (women with a previous uterine scar) was the most frequent (23.4%) and class 2B (nulliparous women with a single cephalic term pregnancy, delivered by CS before labor) was the second one (16.8%) (Figure 1). Singleton pregnancies with cephalic presentation of the fetus and with no uterine surgery in spontaneous labor had a low risk of CS: 8.6% in the first Robson class (nulliparous women) and 1.2% in the third one (multiparous women).
The combination of Robson class 1 and class 2, which are considered to be low risk classes for CS delivery, represented 49.1% of our study population and 37.4% of overall CSs. The main CS indications in these two low-risk classes were fetal distress (22.8%), malpresentation (21.7%), and failed induction of labor (18.5%). Other less frequent indications for CS in these classes were pelvic anomalies (6.9%) and dynamic dystocia (2.5%) (Table 3).
Private practice deliveries were 289, of which 171 were CSs (59.2%). There was a significant difference in the CS rate between private and public patients: 59.2% vs 30.4%, OR 3.32; 95% CI 2.62 ± 4.21 (Table 2). On the other hand, the rate of operative vaginal delivery was similar between private and public-private patients (10.7% vs 7.1%, OR 1.48; 95% CI 0.81 ± 2.69).
Table 4 shows the distribution of the elective and non-elective CSs in each Robson class: the overall elective CS rate was significantly higher in the private practice setting (p < 0.01). In particular, when divided by Robson class, class 2B and 4B (multiparous women with a single cephalic term pregnancy, delivered by CS before labor) were the only ones to have a higher frequency of CS in the private practice group when compared to public setting (p < 0.01 and p = 0.02, respectively).
In addition, we compared the vaginal delivery and elective CS rate per class of Robson in private and non-private practice, after excluding non-elective CSs, and found a statistically significant difference for Robson class 5; in public practice, there was a lower rate of elective CS (83.8% vs 94.2%, p = 0.046) when compared to private setting.
Table 5 and 
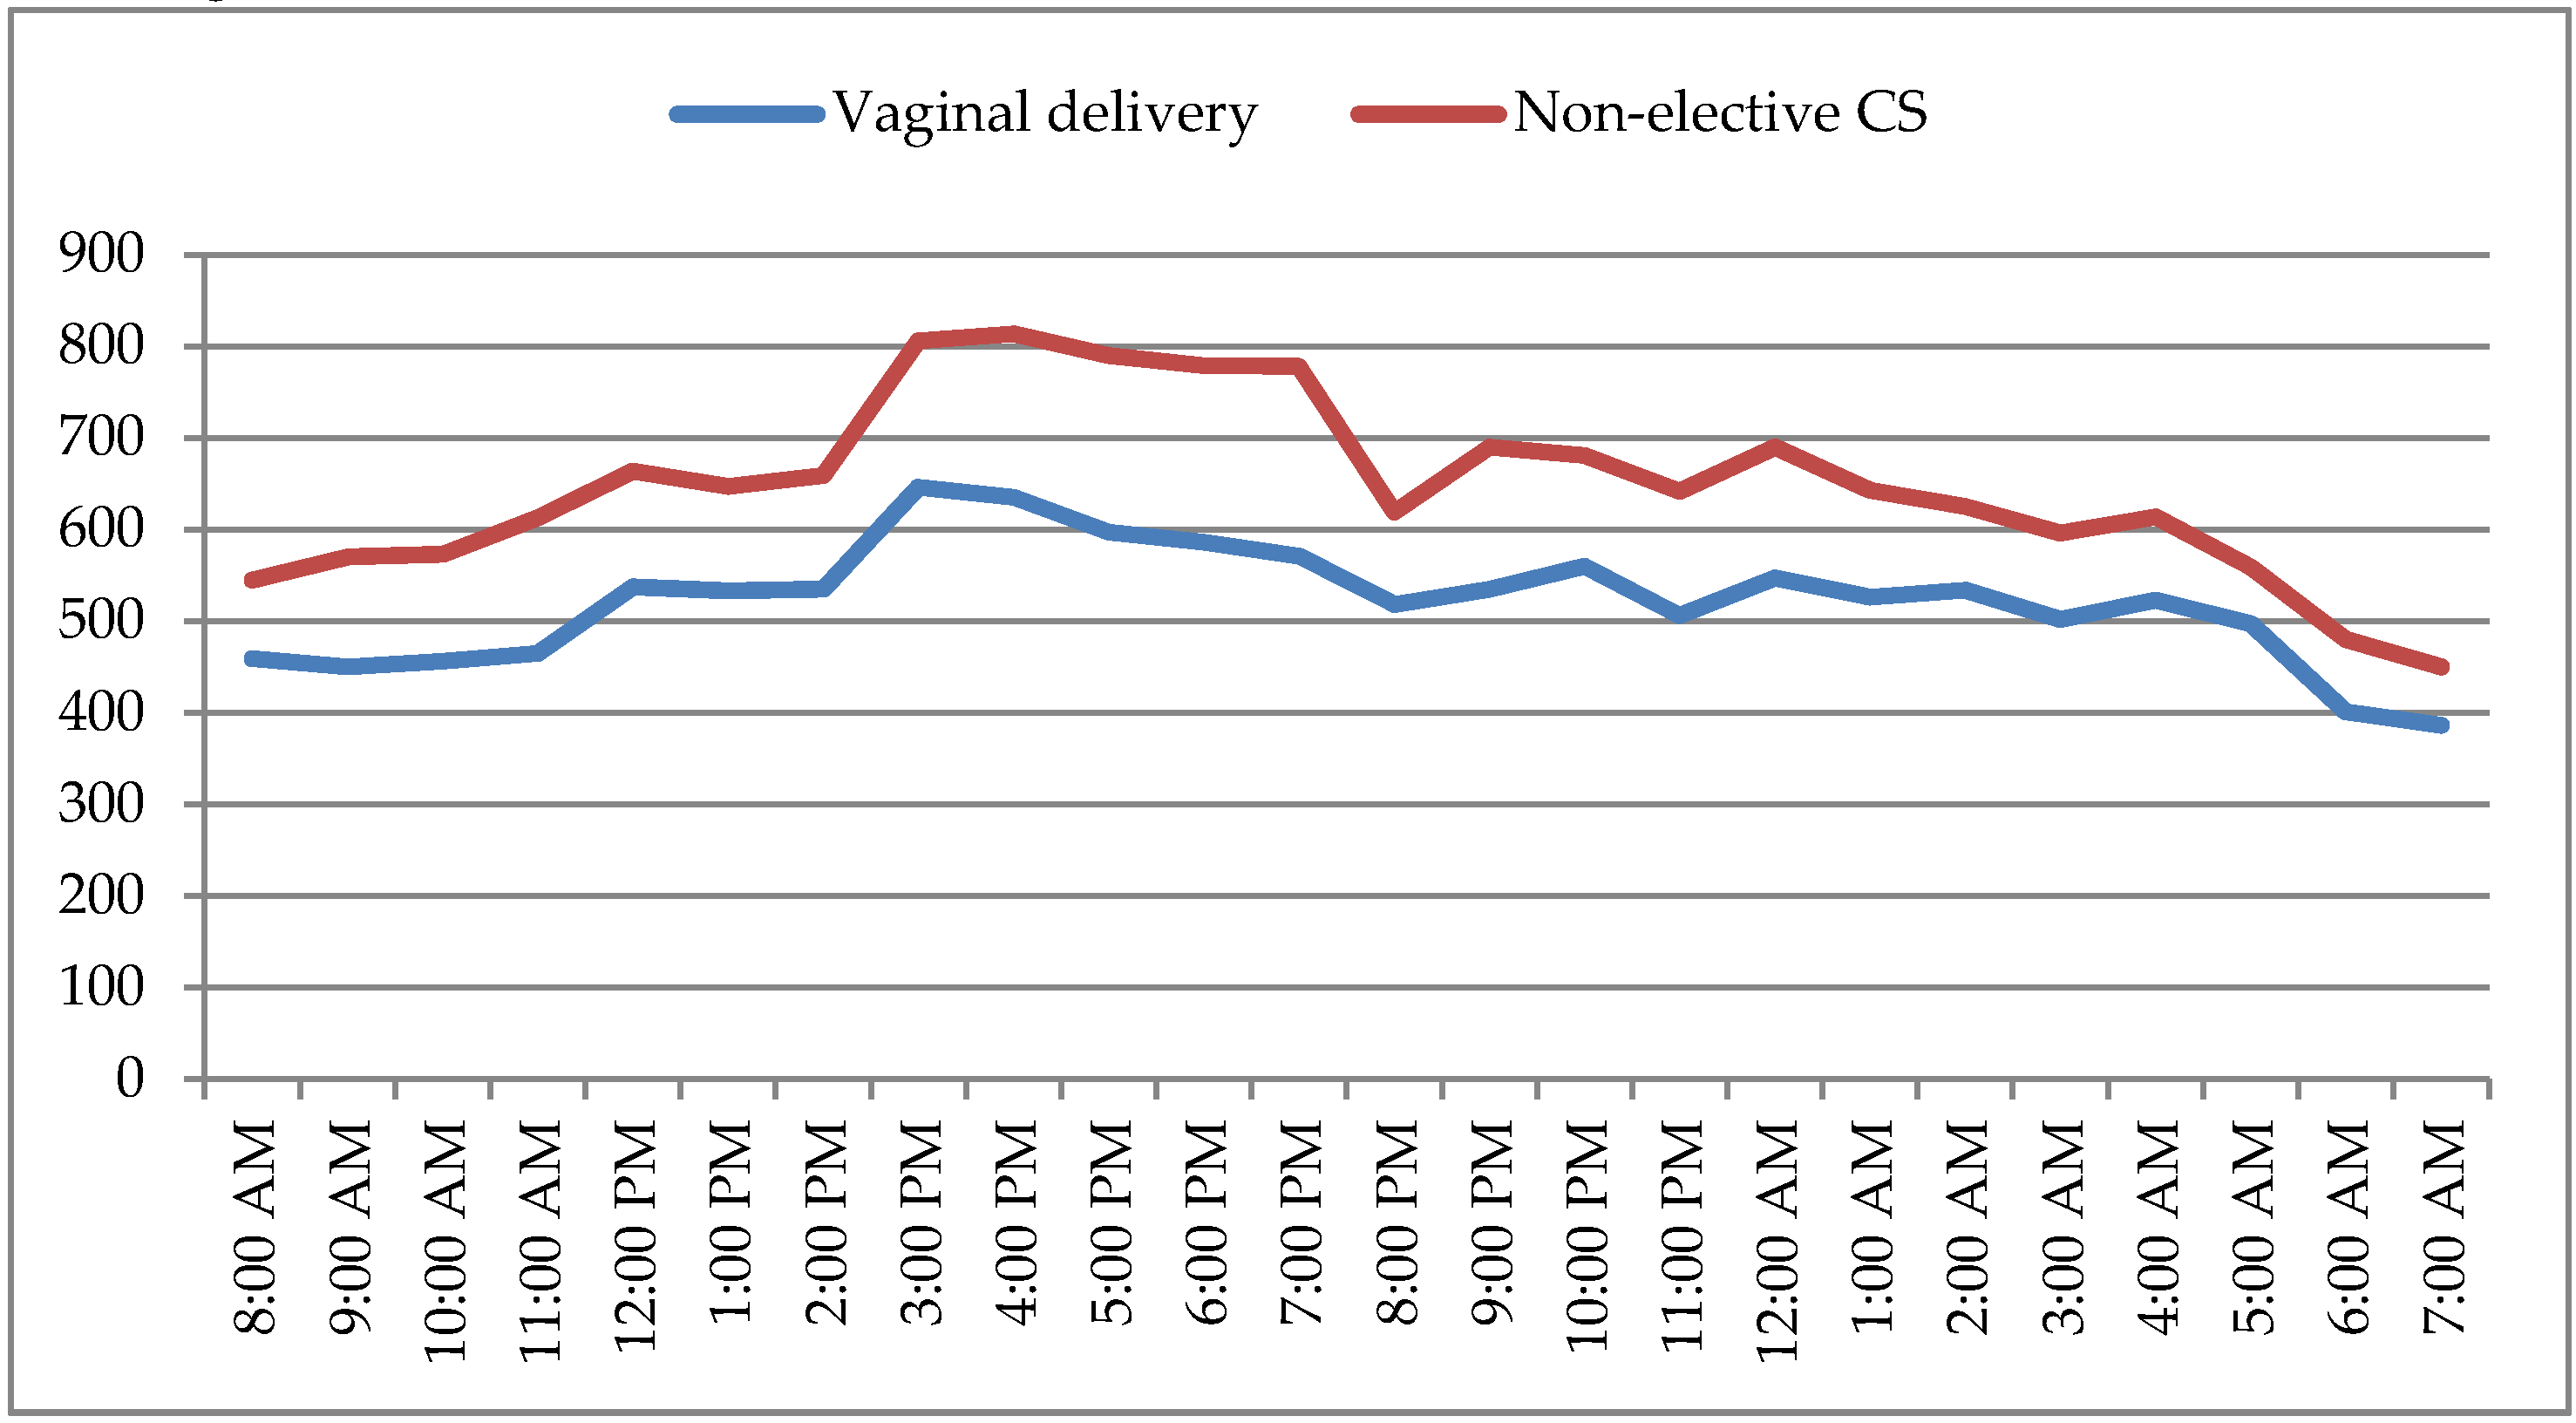
Table 6 report the hourly distribution of vaginal birth and non-elective CS.
The rate of non-elective CS was significant lower during nighttime than during daytime (17.2% vs. 21.5%, p < 0.01) (Table 7). During daytime, the lower incidence of CS was between 8:00–8:59 am and the higher between 4:00–4:59 pm; during nighttime, the higher incidence of CS was between 9:00–9:59 pm, while the lower incidence of CS was in the last period of the night shift, between 7:00–7:59 am (Figure 2).
Fetal distress was the most frequent indication to CS during both the daytime and nighttime (Table 7).
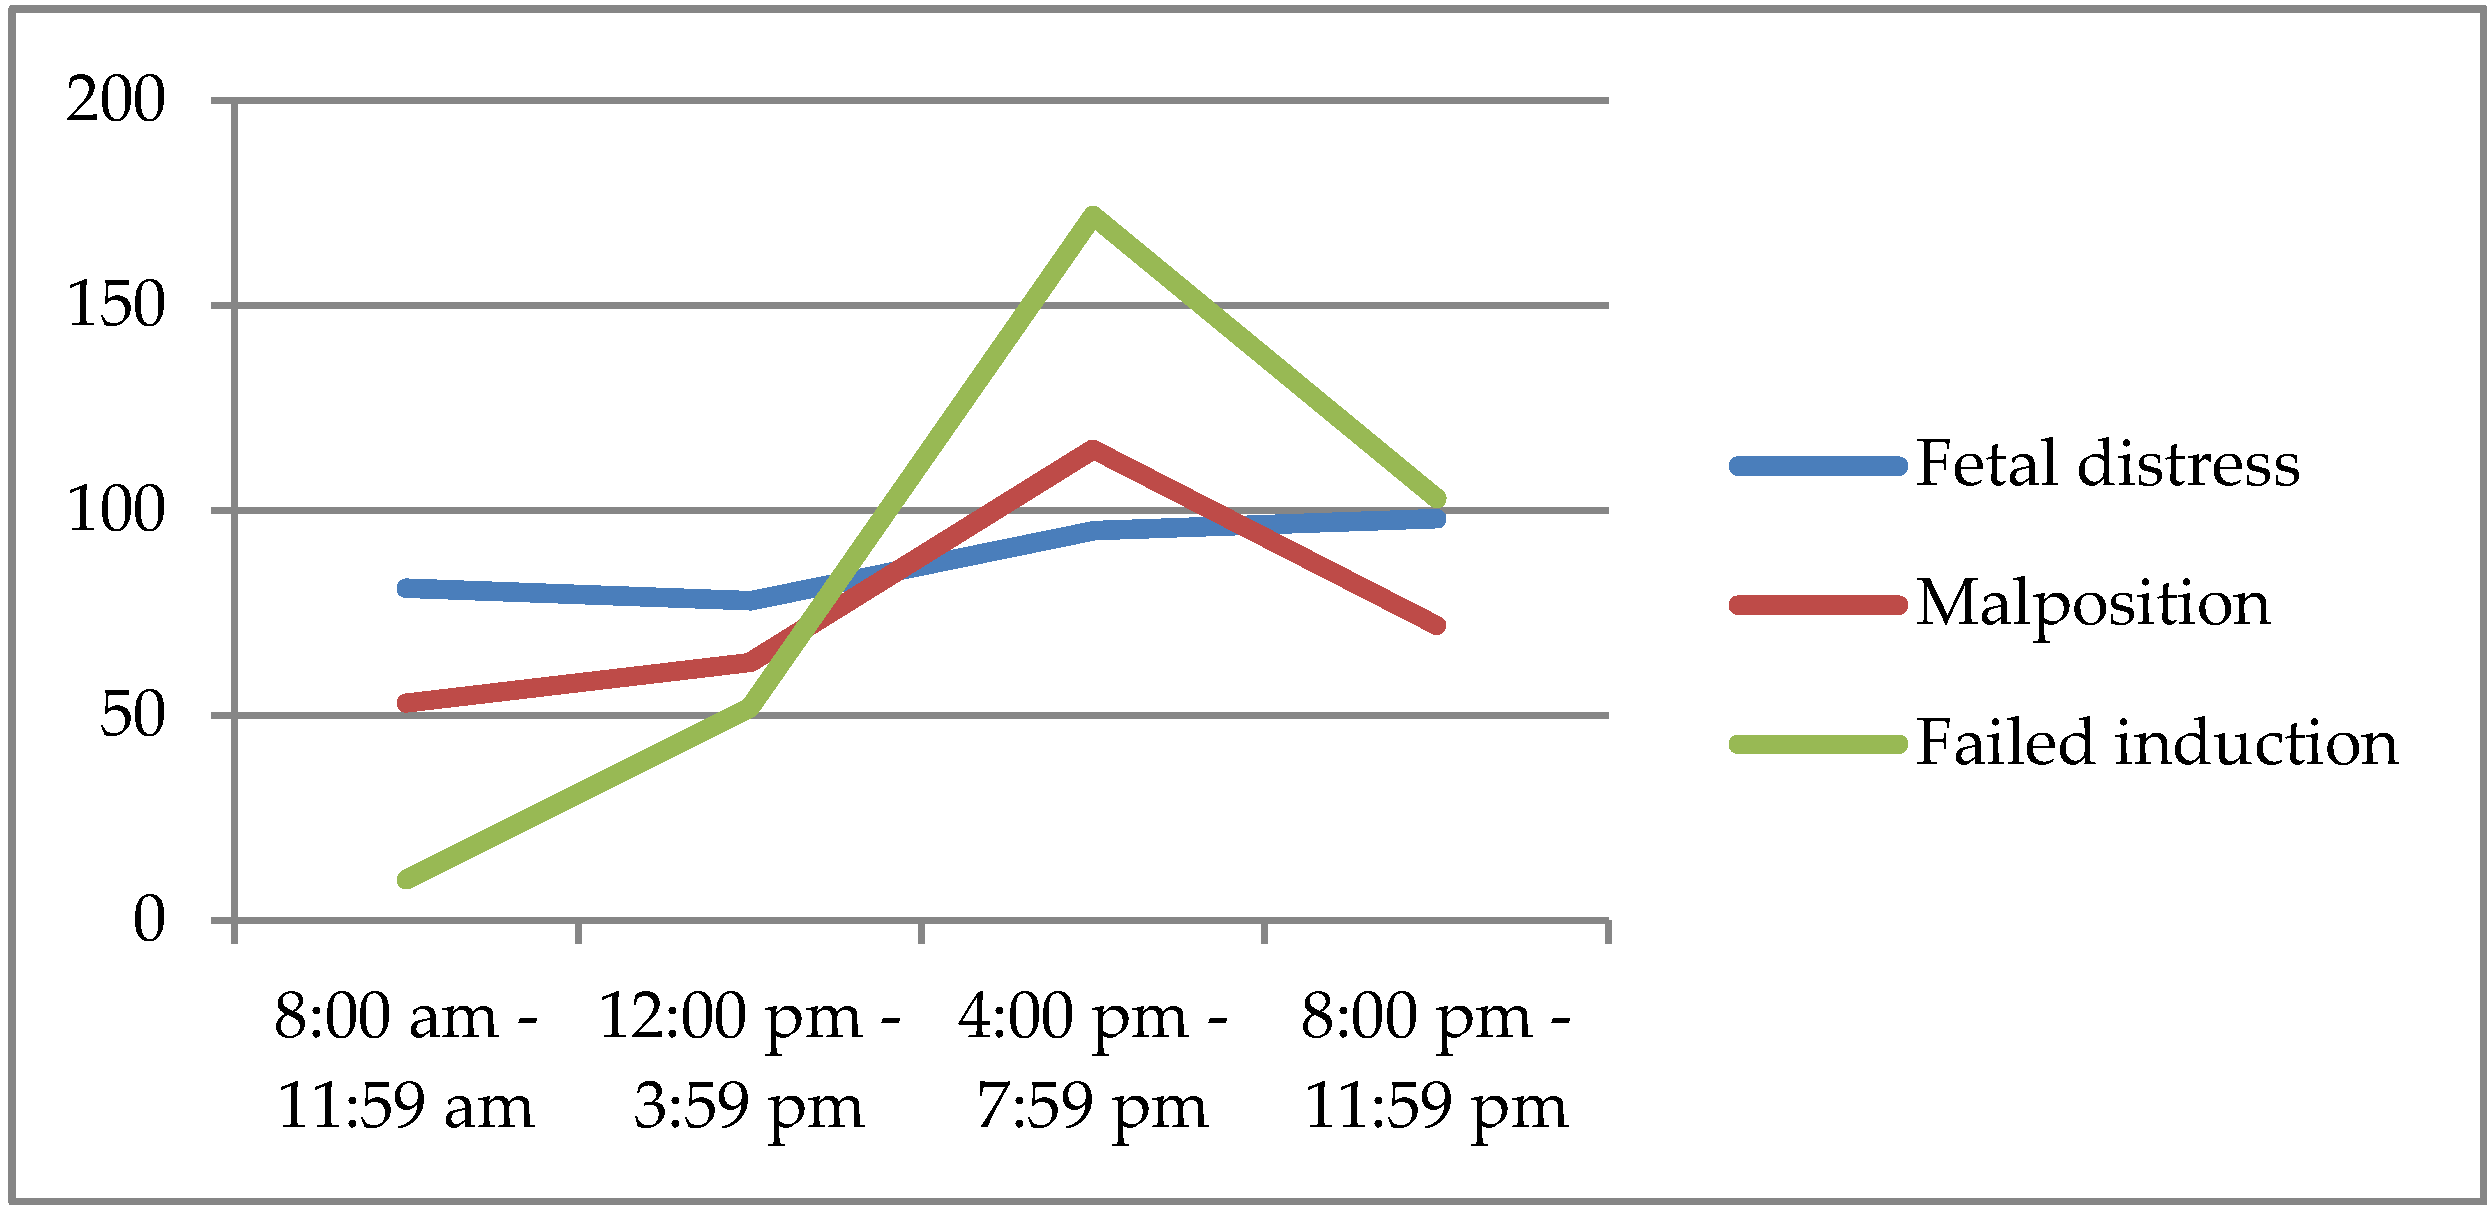
Failed induction was significantly more common as an indication to CS during daytime as compared with nighttime (31.4% vs 24.3%; p = 0.01); on the other hand, there was a trend towards a higher incidence of CSs for malpresentation or arrest of labor during nighttime when compared to daytime (35.5% vs 31.0%), however the difference was not statistically significant (Table 7). It was also noticed that the peaks of malpresentation and failed induction was in the same period of the day, between 4:00 and 7:79 pm (Figure 3).

4. Discussion

This retrospective study showed that, in our population, the overall CS rate was 30.8% and Robson class 5 represented the most frequent class among CSs. Moreover, there was a significant difference in the overall CS rate between non-private and private settings. Vaginal deliveries and CSs had different hourly distributions, showing a difference in CS indications between daytime and nighttime.
This study not only complied with the request of WHO to adopt the Robson classification system in order to assess the CS rate at a hospital level, but it also identified the role of two non-clinical variables in the CS rate. Both aspects might allow for the creation of an effective strategy to reduce unnecessary CSs. The reasons of rising cesarean section trends worldwide are controversial, whereas it is clear that the rise in the rate of CS is not associated with reduced maternal-fetal risks or with significant improvements in perinatal outcomes [11,16,17,18].
Our first outcome was to determine the overall CS rate, and the elective and non-elective CS rate. Although the CS rate at our hospital is below the national CS rate (30.8% vs 33.7%) [19], it is still far from the WHO recommended rate of 10–15%. The non-elective CS rate alone is consistent with the average rate in Europe [14,19]. Other studies identified the main obstetric pathologies (e.g., fetal growth restriction, preeclampsia) as risk factor for primary non-elective CS and invited to consider the maternal characteristics and different assistential levels as potential bias [20,21]. Moreover, the analysis of the indicators in the first two classes of Robson, known to include the women with the lowest risk of CS, showed that fetal distress, malpresentation, and failed induction were the most frequent one. Consequently, the high CS rate of our study might be partly explained by the fact that our hospital is a tertiary care center. In our institution there is the highest number of high-risk pregnancies when compared to other hospitals of the Region and high-risk pregnancies have higher incidence of fetal distress and failed induction. In our cohort of patients, CSs primarily occurred in patients in Robson class 5 and in Robson class 2. Repeated CS is associated with a higher incidence of maternal and fetal complications when compared to vaginal birth and the first CS [22,23]. Health care providers play a decisive role in order to encourage trial of labor after cesarean (TOLAC) [24]. Currently, all of the guidelines recommend that patients with a previous CS should be thoroughly counseled during prenatal care regarding the benefits and risks of both a TOLAC and an elective repeat CS [25]. However, sometimes the fear of medico-legal litigation might influence the caregiver’s advice.
The second endpoint was to determine operative vaginal delivery and CS rate in the public and private practice setting separately and compared them. We did not find any significant difference in instrumental vaginal delivery, in contrast to the literature [26], but we found significant differences in the CS rates between private and public setting. This finding is consistent with previous studies, which reported that private patients were more likely to have a CS as compared to public patients, regardless of the Robson class [27]. Generally, the private system can be guided by financial incentives and patients’ preferences, rather than evidence-based medicine, and this has been reported as the most significant reason why the CS rate differs between public and private settings.
Our data showed that not only the overall CS rate differed significantly between the two types of settings, but also the elective CS rate, especially in Robson class 5. This indicated that women with a previous uterine scar had a higher rate of vaginal delivery in public practice than in the private setting, even if the incidence of elective CS in this class remained high in both practices. A recent Cochrane review noticed this non-clinical variable [15], where it was shown that the private practice care model might increase the repetition of CS compared to midwifery-laborist model of care [28,29].
In private practice, evidence-based interventions and programs to reduce both primary and repeat cesarean sections are lacking. Why providers are more apt to perform cesareans in patients that deliver in private settings is a complex issue. In our facility, antenatal care can be performed privately or through publicly funded healthcare and delivery can occur in a public or private setting, depending on patient’s choice. Regardless of the type of antenatal care, our analysis showed a significant difference in the CS trend between private and public delivery. We could argue that one of the possible explanations to the higher incidence of c-section in private practice is a lack of information regarding the benefits of TOLAC at the time of patients’ counselling. In fact, in our study, the elective CS rate among public patients of Robson class 5 was significantly lower than among private patients. Nevertheless, the level of care of a hospital, not the setting (private vs public) of the delivery, should be the main determinant in the decision on the modality of birth after a CS. The American College of Obstetricians and Gynecologists recommends that TOLAC takes place in a hospital where providers are immediately available to perform an emergency CS [30]. Our hospital is a tertiary care center and, therefore, TOLAC should be offered to all women with previous CS in the absence of clinical contraindications, regardless of whether they are private or public patients. We speculate that the increased rate in Robson class 5 CS in private delivery could be explained not only by medico-legal reasons, but also by the scheduling preferences of the provider.
The third endpoint was to assess the hourly distribution of CS. We found that, in our study population, the CS rate was not constant over 24 hours, significantly increasing between 04:00–07:59 pm. The nighttime overall CS rate was comparable to the daytime’s, although the indications were different: the rate of non-elective CS was significant lower during nighttime than during daytime. Other studies had shown similar results [31].
Interestingly, non-reassuring fetal status was the most frequent indication to CS during both daytime and nighttime. On the other hand, the second most frequent indication was different: during daytime it was failed induction and during nighttime it was malpresentation. A possible explanation of the former finding is that, at our hospital, inductions are started early in the morning and usually before the end of the daytime shift an induction that has not led to birth should be labeled as failed and a CS is performed. The latter finding, a higher frequency of malpresentation as indication to c-section during nighttime, is difficult to clinically understand: perhaps it could be explained by considering physician-related variables rather than patient’s. Evidence based data show that sleep deprivation affects physicians; consequently, judgment errors may increase due to a lack of sleep during nighttime shifts [32].
Our work presents some strengths and limitations. One strength lies in the large number of patients that are included in the study. Moreover, the fact that our hospital includes both private and non-private delivery settings within the same institution makes the comparison between settings more reliable than in studies where private and public care occur in different hospitals. Finally, some non-clinical variables that may impact CS rate were analyzed. The limitations are mainly related to unforeseeable bias due to the retrospective nature of the study and the single-center cohort population. We did not perform a sample size calculation before beginning the study. The study did not analyze level of urgency in the definition of non-elective CS, the perinatal outcome, and pregestational or gestational pathologies.

5. Conclusions

We believe that the CS rate might be reduced by monitoring CSs’ incidence and indications with the use of Robson classification, being identified by the WHO as the best global standard for studying the CS rate trend. Interestingly, our study identified two non-clinical variables that play a pivotal part in the CS rate, and that could be related more to the practitioner attitude than to the patient’s clinical condition. During nighttime, there appears to be an increase in subjective indications for CS, while, during the daytime, practitioners may be more objective. Moreover, delivering in private practice might be a risk factor for unnecessary CS. Therefore, we believe that educational interventions on the obstetricians and midwives might have an impact on the overall cesarean section rates, and that a stricter adherence to current guidelines is required for obstetricians, regardless whether the delivery occurs in public or private setting. A possible decrease in the CS rate could be achieved by reducing the impact of non-clinical variables, although further multicentric studies are necessary to better understand the complex and multifactorial origin of the increasing trend in CS rates.

Author Contributions

Conceptualization, M.D.T. and C.F.; methodology, F.S.; validation, N.S., G.M.B. and C.F.; formal analysis, N.S.; investigation, N.S.; resources, F.S. and G.M.B.; data curation, N.S.; writing—original draft preparation, N.S. and F.S.; writing—review and editing, V.S. and G.S.; visualization, V.S.; supervision, M.D.T.; project administration, M.D.T. All authors have read and agreed to the published version of the manuscript.

Funding

This research received no external funding.

Conflicts of Interest

The authors declare no conflict of interest.

References

  1. Villar, J.; Valladares, E.; Wojdyla, D.; Zavaleta, N.; Carroli, G.; Velazco, A.; Shah, A.; Campodónico, L.; Bataglia, V.; Faundes, A.; et al. WHO 2005 global survey on maternal and perinatal health research group. Caesarean delivery rates and pregnancy outcomes: The 2005 WHO global survey on maternal and perinatal health in Latin America. Lancet 2006, 367, 1819–1829. [Google Scholar] [CrossRef]
  2. Shah, A.; Fawole, B.; M’imunya, J.M.; Amokrane, F.; Nafiou, I.; Wolomby, J.J.; Mugerwa, K.; Neves, I.; Nguti, R.; Kublickas, M.; et al. Cesarean delivery outcomes from the WHO global survey on maternal and perinatal health in Africa. Int. J. Gynaecol. Obstet. 2009, 107, 191–197. [Google Scholar] [CrossRef] [PubMed]
  3. Chaves, S.C.; Cecatti, J.G.; Carroli, G.; Lumbiganon, P.; Hogue, C.J.; Mori, R.; Zhang, J.; Jayaratne, K.; Togoobaatar, G.; Pileggi-Castro, C.; et al. Obstetric transition in the World Health Organization Multicountry, Survey on Maternal and Newborn Health: Exploring pathways for maternal mortality reduction. Revista Panamericana Salud Pública 2015, 37, 203–210. [Google Scholar]
  4. Istituto Superiore di Sanità. Available online: http://www.snlg-iss.it (accessed on 10 December 2019).
  5. Nelson, D.B. New or not-so-new labor management practices and cesarean delivery for arrest of progress of labour. AJOG 2019, 222, e1–e71. [Google Scholar] [CrossRef] [Green Version]
  6. Barber, E.L.; Lundsberg, L.; Belanger, K.; Pettker, M.C.; Funai, E.F.; Illuzzi, J.L. Contributing Indications to the Rising Cesarean Delivery Rate. Obstet. Gynecol. 2011, 118, 29–38. [Google Scholar] [CrossRef]
  7. Angeja, A.C.; Washington, A.E.; Vargas, J.E.; Gomez, R.; Rojas, I.; Caughey, A.B. Chilean women’s preferences regarding mode of delivery: Which do they prefer and why? BJOG 2006, 113, 1253–1258. [Google Scholar] [CrossRef]
  8. Lilford, R.J.; Van Coeverden de Groot, H.A.; Moore, P.J.; Bingham, P. The relative risks of caesarean section (intrapartum and elective) and vaginal delivery: A detailed analysis to exclude the effects of medical disorders and other acute pre-existing physiological disturbances. BJOG 1990, 97, 883–892. [Google Scholar] [CrossRef]
  9. Morrison, J.J.; Rennie, J.M.; Milton, P.J. Neonatal respiratory morbidity and mode of delivery at term: Influence of timing of elective caesarean section. BJOG 1995, 102, 101–106. [Google Scholar] [CrossRef]
  10. Sandall, J.; Tribe, R.M.; Avery, L.; Mola, G.; Visser, G.H.; Homer, C.S.; Gibbons, D.; Kelly, N.M.; Kennedy, H.P.; Kidanto, H.; et al. Short-term and long-term effects of caesarean section on the health of women and children. Lancet 2018, 392, 1349–1357. [Google Scholar] [CrossRef]
  11. Visser, G.H. Women are designed to deliver vaginally and not by cesarean section: An obstetrician’s view. Neonatology 2015, 107, 8–13. [Google Scholar] [CrossRef]
  12. World Health Organization. Appropriate technology for birth. Lancet 1985, 2, 436–437. [Google Scholar]
  13. Betran, A.P.; Torloni, M.R.; Zhang, J.; Ye, J.; Mikolajczyk, R.; Deneux-Tharaux, C.; Oladapo, O.T.; Souza, J.P.; Tunçalp, Ö.; Vogel, J.P.; et al. What is the optimal rate of caesarean section at population level? A systematic review of ecologic studies. Reprod. Health 2015, 21, 12–57. [Google Scholar] [CrossRef] [PubMed] [Green Version]
  14. Ye, J.; Zhang, J.; Mikolajczyk, R.; Torloni, M.R.; Gülmezoglu, A.M.; Betran, A.P. Association between rates of caesarean section and maternal and neonatal mortality in the 21st century: A worldwide population-based ecological study with longitudinal data. BJOG 2016, 123, 745–753. [Google Scholar] [CrossRef] [PubMed]
  15. Chen, I.; Opiyo, N.; Tavender, E.; Mortazhejri, S.; Rader, T.; Petkovic, J.; Yogasingam, S.; Taljaard, M.; Agarwal, S.; Laopaiboon, M.; et al. Non-clinical interventions for reducing unnecessary caesarean section. Cochrane Database Syst. Rev. 2018, 9, CD005528. [Google Scholar] [CrossRef]
  16. Robson, M.S. The 10-Group Classification System-a new way of thinking. AJOG 2018, 219, 1–4. [Google Scholar] [CrossRef]
  17. Victora, C.G.; Barros, F.C. Beware: Unnecessary caesarean sections may be hazardous. Lancet 2006, 367, 1796–1797. [Google Scholar] [CrossRef]
  18. Chong, Y.S.; Kwek, K.Y. Safer childbirth: Avoiding medical interventions for non-medical reasons. Lancet 2010, 375, 440–442. [Google Scholar] [CrossRef]
  19. Boldrini, R.; Di Cesare, M.; Basili, F.; Messia, I.; Giannetti, A. Certificati di Assistenza al Parto. Analisi Dell’evento Nascita—Anno 2016. Ministero Della Salute Italiana. 2019. Available online: www.salute.gov.it/statistiche (accessed on 28 October 2019).
  20. Gerli, S.; Favilli, A.; Franchini, D.; De Giorgi, M.; Casucci, P.; Parazzini, F. Is the Robson’s Classification System Burdened by Obstetric Pathologies, Maternal Characteristics and Assistential Levels in Comparing Hospitals Cesarean Rates? A Regional Analysis of Class 1 and 3. J. Matern. Fetal Neonatal Med. 2018, 31, 173–177. [Google Scholar] [CrossRef]
  21. Horowitz, K.M.; Feldman, D. Fetal Growth Restriction: Risk Factors for Unplanned Primary Cesarean Delivery. J. Matern. Fetal Neonatal Med. 2015, 28, 2131–2134. [Google Scholar] [CrossRef]
  22. Betrán, A.P.; Merialdi, M.; Lauer, J.A.; Bing-Shun, W.; Thomas, J.; Van Look, P.; Wagner, M. Rates of caesarean section: Analysis of global, regional and national estimates. Paediatr. Perinat. Epidemiol. 2007, 21, 98–113. [Google Scholar] [CrossRef]
  23. Laganà, A.S.; Cromi, A.; Tozzi, R.; Franchi, M.; Lukanovic, D.; Ghezzi, F. Uterine Scar Healing After Cesarean Section: Managing an Old Surgery in an Evidence-Based Environment. J. Investig. Surg. 2019, 32, 770–772. [Google Scholar] [CrossRef] [PubMed] [Green Version]
  24. Tampakoudis, P.; Assimakopoulos, E.; Grimbizis, G.; Zafrakas, M.; Tampakoudis, G.; Mantalenakis, S.; Bontis, J. Cesarean section rates and indications in Greece: Data from a 24-year period in a teaching hospital. Clin. Exp. Obstet. Gynecol. 2004, 31, 289–292. [Google Scholar]
  25. Panda, S.; Begley, C.; Daly, D. Clinicians’ views of factors influencing decision-making for caesarean section: A systematic review and metasynthesis of qualitative, quantitative and mixed methods studies. PLoS ONE 2018, 13, e0200941. [Google Scholar] [CrossRef] [PubMed] [Green Version]
  26. Gholami, A.; Faraji, Z.; Lotfabadi, P.; Foroozanfar, Z.; Rezaof, M.; Rajabi, A. Factors Associated with Preference for Repeat Cesarean in Neyshabur Pregnant Women. Int. J. Prev. Med. 2014, 5, 1192–1198. [Google Scholar] [PubMed]
  27. Cox, K.J. Counseling women with a previous cesarean birth: Toward a shared decision-making partnership. J. Midwifery Womens Health 2014, 59, 237–245. [Google Scholar] [CrossRef] [PubMed]
  28. Murphy, D.J.; Fahey, T. A retrospective cohort study of mode of delivery among public and private patients in an integrated maternity hospital setting. BMJ Open 2013, 3, e003865. [Google Scholar] [CrossRef] [PubMed] [Green Version]
  29. Rosenstein, M.G.; Nijagal, M.; Nakagawa, S.; Gregorich, S.E.; Kuppermann, M. The Association of Expanded Access to a Collaborative Midwifery and Laborist Model with Cesarean Delivery Rates. Obstet. Gynecol. 2015, 126, 716–723. [Google Scholar] [CrossRef] [PubMed] [Green Version]
  30. American College of Obstetricians and Gynecologists. ACOG Practice Bulletin No. 205: Vaginal Birth After Cesarean Delivery. Obstet. Gynecol. 2019, 133, e110–e127. [Google Scholar] [CrossRef]
  31. Bernis, C.; Varea, C. Hour of birth and birth assistance: From a primate to a medicalized pattern? Am. J. Hum. Biol. 2012, 24, 14–21. [Google Scholar] [CrossRef]
  32. Del Cul, A.; Baillet, S.; Dehaene, S. Brain dynamics underlying the non linear threshold for access to consciussness. PLoS Biol. 2007, 5, e260. [Google Scholar] [CrossRef]
Figure 1. Percentages of total births and cesarean section (CS) in each Robson class.
Medicina 56 00180 g001
Figure 2. Hourly distribution of non-elective cesarean section (CS) and vaginal delivery.
Medicina 56 00180 g002
Figure 3. Distribution of the main indications to non-elective cesarean section (CS) during day time and nighttime.
Medicina 56 00180 g003
Table 1. The Robson classification. CS: cesarean section.
Robson ClassDescription
1Nulliparous women with a single cephalic pregnancy, ≥37 weeks gestation in spontaneous labor
2ANulliparous women with a single cephalic pregnancy, ≥37 weeks gestation who had labor induced
2BNulliparous women with a single cephalic pregnancy, ≥37 weeks gestation who were delivered by CS before labor
3Multiparous women without a previous uterine scar, with a single cephalic pregnancy, ≥37 weeks gestation in spontaneous labor
4AMultiparous women without a previous uterine scar, with a single cephalic pregnancy, ≥37 weeks gestation who had labor induced
4BMultiparous women without a previous uterine scar, with a single cephalic pregnancy, ≥37 weeks gestation who were delivered by CS before labor
5All multiparous women with at least one previous uterine scar, with a single cephalic pregnancy, ≥37 weeks gestation
6All nulliparous women with a single breech presentation
7All multiparous women with a single breech presentation, including women with a previous uterine scar
8All women with multiple pregnancy, including women with a previous uterine scar
9All women with a single pregnancy with a transverse or oblique lie, including women with a previous uterine scar
10All women with a single cephalic pregnancy <37 weeks gestation, including women with a previous uterine scar
Table 2. Distribution of vaginal deliveries and cesarean sections (CSs) in each Robson class, according to government and private health insurance coverage. Chi-square statistical test was used to compare the 2 groups.
Study PopulationNon-Private Practice PopulationPrivate Practice Population
Robson ClassTotal Births; nVaginal Delivery; n (%)CS; n (%)Total Births; nVaginal Delivery; n (%)CS; n (%)Total Births; nVaginal Delivery; n (%)CS; n (%)p-ValueORCI 95%
154064928 (91.2%)478 (8.8%)53634890 (91.2%)473 (8.8%)4338 (88.4%)5 (11.6%)0.711.360.53 ± 3.48
2A25411870 (73.6%)671 (26.4%)25171857 (73.8%)660 (26.2%)2413 (54.2%)11 (45.8%)0.052.381.06 ± 5.34
2B9370937 (100.0%)8860886 (100.0%)51051 (100.0%)---
340884020 (98.3%)68 (1.7%)40493981 (98.3%)68 (1.7%)3939 (100.0%)00.850.740.06 ± 12.10
4A931898 (96.5%)33 (3.5%)909876 (96.4%)33 (%)2222 (100.0%)01.000.580.04 ± 9.80
4B2150215 (100.0%)2050205 (100.0%)10010 (100.0%)---
51484180 (12.1%)1304 (87.9%)1423177 (12.4%)1246 (87.6%)613 (4.9%)58 (95.1%)0.112.750.85 ± 8.86
64986 (1.2%)492 (98.8%)4896 (1.2%)483 (98.8%)909 (100.0%)1.000.260.01 ± 4.87
724016 (6.7%)224 (93.3%)23516 (6.8%)219 (93.2%)505 (100.0%)1.000.830.04 ± 15.62
865380 (12.3%)573 (87.7%)63580 (12.6%)555 (87.4%)18018 (100.0%)0.155.360.32 ± 89.90
944044 (100.0%)44044 (100.0%)000---
101042507 (48.7%)535 (51.3%)1035504 (48.7%)531 (51.3%)73 (42.9%)4 (57.1%)1.001.270.28 ± 5.67
Total18,07912,505 (69.2%)5574 (30.8%)17,79012,387 (69.6%)5403 (30.4%)289118 (40.8%)171 (59.2%)< 0.013.322.62 ± 4.21
Table 3. Indications for cesarean section (CS) in the two low risk classes (Robson class 1 and 2). “n”: number.
IndicationNon-Elective; nElective CS; nTotal CS; nTotal CS; %
Fetal distress470547522.8%
Malpresentation4421045221.7%
Failed induction378838618.5%
Dynamic dystocia504542.6%
Pelvic anomalies271161436.9%
Maternal anxiety1020301.4%
Cephalopelvic disproportion1728452.2%
Fetal growth restriction1523381.8%
Hypertension or preeclampsia2313361.7%
Placental abruption200201.0%
Elderly primigravida117180.9%
Placenta praevia419231.1%
Macrosomia2680.4%
Gestational diabetes mellitus69150.7%
Oligohydramnios813211.0%
Maternal fever7070.3%
Umbilical cord prolapse5050.2%
Polyhydramnios110110.5%
Operative vaginal delivery5050.2%
Prolonged pregnancy5490.4%
Other maternal pathology619251.2%
Fetal pathology116170.8%
Others9514824311.7%
Total1,6084782,086100.0%
Table 4. Distribution of elective and non-elective cesarean section (CS) according to government and private health insurance coverage. Chi-square statistical test was used to compare the 2 groups.
Non-Private Practice PopulationPrivate Practice Population
Robson ClassTotal CS Elective CSNon-Elective CSCSElective CSNon-Elective CSp-ValueORCI 95%
14784730473505--
2A671660066011011--
2B937886436 (49.2%)450 (50.8%)5142 (82.4%)9 (17.6%)< 0,010.210.10 ± 0.43
36868068000--
4A3333033000--
4B215205106 (51.7%)99 (48.3%)109 (90.0%)1 (10.0%)0.020.120.02 ± 0.96
513041246918 (73.7%)328 (26.3%)5849 (84.5%)9 (15.5%)0.070.510.25 ± 1.06
6492483296 (61.3%)187 (38.7%)97 (77.8%)2 (22.2%)0.490.450.09 ± 2.20
7224219117 (53.4%)102 (46.6%)54 (80.0%)1 (20.0%)0.380.290.03 ± 2.61
8573555327 (58.9%)228 (41.1%)1814 (77.8%)4 (22.2%)0.150.410.13 ± 1.26
9444421 (47.7%)23 (52.3%)000--
10535531205 (38.6%)326 (61.4%)41 (25.0%)3 (75.0%)1.001.890.19 ± 18.27
Total557454032426 (44.9%)2977 (55.1%)171126 (73.7%)45 (26.3%)< 0.010.290.21 ± 0.41
Table 5. Hourly distribution of non-elective cesarean section (CS).
Non-Elective CS
Day Time
Robson Class8 am9 am10 am11 am12 pm1 pm2 pm3 pm4 pm5 pm6 pm7 pmTotal
1171719201910261918243026245
2A68820720293758606772392
2B122424201422202226293028271
354221234432436
4A01014321126122
4B33935342462650
512241722161291514141422191
61214101312917129611116
746235538325349
8791114172121215201211142
920320022211217
1061012282726133122231821237
Total861201171481271141241601791931932071768
Nighttime
Robson Class8 pm9 pm10 pm11 pm12 am1 am2 am3 am4 am5 am6 am7 amTotal
1151424201924202522142016233
2A3454293831221716176105279
2B1727242222168121061212188
323223252142432
4A31102211000011
4B16459434453250
51014715121814111511118146
6273612774929573
736588525331554
841210610587987490
90012002000016
1010111112151247134292
Total1011551211361431179194916279641254
Table 6. Hourly distribution of vaginal delivery.
Vaginal Delivery
Day Time
Robson Class8 am9 am10 am11 am12 pm1 pm2 pm3 pm4 pm5 pm6 pm7 pmTotal
11972012122142232032061992412112011772485
2A202331354962861421431461431391019
2B------------
31971921661671771521281591261351351561890
4A15814245580809880767356659
4B-------------
5995811868474786
60011000010003
703111021020112
824455725905149
9-------------
10191022101621253431202534267
Total4594504564655375335356466355975865716470
Nighttime
Robson Class8 pm9 pm10 pm11 pm12 am1 am2 am3 am4 am5 am6 am7 amTotal
11731922201912302162202152182231781672443
2A122125111849876636138341623851
2B-------------
31331461691751601892021802271981791722130
4A4933302624171516101126239
4B-------------
5411758715511107494
62000000000103
70010111000004
853144214201431
9-------------
10302521212218172117211710240
Total5185355605065475265345025234974013866035
Table 7. Main indications for non-elective cesarean sections (CSs) in the two lower risk classes during daytime and nighttime. Chi-square statistical test was used to compare the 2 groups.
IndicationNon Elective CS; n8:00 -11:59 am12:00 -3:59 pm4:00 -7:59 pmTotal Daytime% Day Time8:00 -11:59 pm12:00 -3:59 am4:00 -7:59 amTotal Nighttime% Night Timep-ValueOR (CI 95%)
Fetal distress47081789525434.098714721636.40.351.10 (0.91 ± 1.32)
Malpresentation or no progression of the baby442536311523131.072805921135.50.871.02 (0.84 ± 1.23)
Failed induction378105217223431.4103271414424.30.011.52 (1.23 ± 1.87)
Dynamic dystocia50999273.68105233.80.861.10 (0.63 ± 1.91)
Total1340153202391746100.0281188125594100.00.011.17 (1.05 ± 1.31)

