Article

In Vitro Evaluation of ALDH1A3-Affinic Compounds on Breast and Prostate Cancer Cell Lines as Single Treatments and in Combination with Doxorubicin

1
Faculty of Pharmacy, Al-Zaytoonah University of Jordan, Amman 11733, Jordan
2
Aurum Biotech, Amman 11941, Jordan
*
Author to whom correspondence should be addressed.
These authors contributed equally to this work.
Curr. Issues Mol. Biol. 2023, 45(3), 2170-2181; https://doi.org/10.3390/cimb45030139
Submission received: 3 January 2023 / Revised: 18 February 2023 / Accepted: 4 March 2023 / Published: 6 March 2023

Abstract

:
Aldehyde dehydrogenase (ALDH) enzymes are involved in the growth and development of several tissues, including cancer cells. It has been reported that targeting the ALDH family, including the ALDH1A subfamily, enhances cancer treatment outcomes. Therefore, we aimed to investigate the cytotoxicity of ALDH1A3-affinic compounds that have been recently discovered by our group, on breast (MCF7 and MDA-MB-231) and prostate (PC-3) cancer cell lines. These compounds were investigated on the selected cell lines as single treatments and in combination with doxorubicin (DOX). Results showed that the combination treatment experiments of the selective ALDH1A3 inhibitors (compounds 15 and 16) at variable concentrations with DOX resulted in significant increases in the cytotoxic effect on the MCF7 cell line for compound 15, and to a lesser extent for compound 16 on the PC-3 cell line, compared to DOX alone. The activity of compounds 15 and 16 as single treatments on all cell lines was found to be non-cytotoxic. Therefore, our findings showed that the investigated compounds have a promising potential to target cancer cells, possibly via an ALDH-related pathway, and sensitize them to DOX treatment.

1. Introduction

Aldehyde dehydrogenases (ALDHs) are phase I oxidizing enzymes [1], which irreversibly oxidize endogenous or exogenous short-chain aliphatic or aromatic aldehydes to their corresponding carboxylic acids [2,3]. Human ALDHs are NAD(P)+-dependent enzymes that occur in 19 different isoforms [1,4,5]. ALDH oxidation reactions may result in either detoxification of aldehydes or production of bioactive products, such as retinoic acid (RA), which is involved in signaling pathways that are important for the growth and development of many organs and tissues [3,6].
Furthermore, the expression of ALDHs is linked to the cancer progression of several tissues, such as melanoma and melanoma stem cells, lung cancers, human prostate cancer, bone metastasis, hepatocellular carcinoma and adenoma, and breast cancer [7,8,9,10,11,12]. The ALDH isoforms include the ALDH1A subfamily (ALDH1A1, ALDH1A3), ALDH3A1, ALDH7A1, and ALDH18A1. In addition, ALDH-active cells have been identified as biomarkers for tumor-initiating and metastasis-initiating cells in human prostate cancer [13]. The ALDH2 subfamily is also associated with alcohol-related cancers [14] and its polymorphisms increase the risk of esophageal cancers [15].
Moreover, ALDHs are expressed in normal stem cells (NSCs) and cancer stem cells (CSCs) and, hence, have been considered as CSC biomarkers [16,17]. ALDH1A1, ALDH1A3, and ALDH3A1 are among the ALDH isoforms that are important in self-protection, differentiation, and cellular proliferation of NSCs and CSCs [18,19]. Thus, targeting ALDH enzymes has a high potential for cancer treatment and diagnosis [20].
Recently, our group has discovered a number of compounds with ALDH-affinic properties (Figure 1), compounds 16, 1519, 2328, and 3234, which have been investigated on several ALDH-expressing cancer cell lines and have shown promising cytotoxic results [21,22]. These compounds have been found to work via a variety of mechanisms, ranging from inhibiting to activating particular ALDH isoforms [21,22]. In particular, compound 15 was the most potent ALDH1A3 inhibitor, followed by compounds 16, 18, and 1, with remaining enzyme activities of 0.14%, 4.27%, 16.01%, and 21.07%, respectively, compared to the control enzyme activity [21]. In these studies, non-small cell lung cancer cell lines (NSCLC) (A549 and H1299) [21] and prostate cancer cell lines (PC-3, LNCaP, and DU145) [22] have been used. A549 has been shown to express ALDH1A1, ALDH1A3, and ALDH3A1 isoforms [23,24], which were found to be absent in H1299 [24]. PC-3 has been shown to express ALDH1A1, ALDH1A3 [25], and ALDH3A1 [22]; LNCaP has been shown to express the ALDH1A3 isoform [22,25], and DU145 has been shown to express ALDH1A1 and ALDH1A3 isoforms [22].
Further investigation is required to demonstrate the potential of these ALDH-affinic compounds in cancer treatment. This includes exposing additional cancer cell lines to these compounds, either as single agents or in combination with anticancer drugs to enhance their sensitivity.
Although doxorubicin (DOX) is a commonly prescribed anticancer drug for a wide variety of cancer types, emerging resistance is considered a major barrier to its effective treatment outcomes. Several studies have shown that high ALDH activity and/or expression is correlated with low treatment outcomes using DOX [7,26,27,28]. In addition, lower expression, or downregulation of ALDH, has been found to enhance the treatment consequences for DOX [7]. Therefore, combining the ALDH-affinic compounds with DOX and measuring the consequent effects on several cancer cell lines is a promising line of investigation.
Breast cancer cell lines have been reported to express ALDH1A3 with a variety of in vitro activities, with MDA-MB-468 having the highest ALDH activity, followed by SKBR3, MDA-MB-435, BT-20, MCF7, T47D, and finally MDA-MB-231 [12]. This activity was measured via an Aldefluor assay, showing that MCF7, T47D, and MDA-MB-231 cell lines are among the breast cancer cells with low Aldefluor activity, while SKBR3 is among those with high Aldefluor activity [12]. Similar results have been observed by Charafe-Jauffret et al. [29], who reported that T47D, MCF7, and MDA-MB-231 cell lines have 0–1% of the tumorigenic Aldefluor+ cells, whereas the SKBR3 cell line has 100% of the Aldefluor+ cells. The ALDH1A1 isoform has also been shown to promote angiogenesis via vascular endothelial growth factor in vitro and in vivo using the MCF7 cell line [30]. Hence, there is the possibility that ALDH1A1 is involved in breast cancer progression and diffusion [30]. Additionally, the ALDH3A1 isoform is expressed in the MCF7 cell line, but with low activity. This isoform can be overexpressed using various drug treatments, as determined by mRNA levels [31].
In addition, using diethylaminobenzaldehyde (DEAB), which is a pan-ALDH inhibitor [32], has been found to sensitize MDA-MB-468 and MDA-MB-231 cells to DOX, paclitaxel, and radiation, with a significant reduction in cell viability compared to DOX, paclitaxel, or radiation alone [33]. Moreover, combination therapy with DOX is used in the treatment of breast cancer to achieve a synergistic effect [34].
In the present study, we aimed to investigate the cytotoxicity of DEAB and the recently discovered ALDH-affinic compounds [21] on several ALDH1A3-expressing breast and prostate cancer cell lines as single agents, and in combination with DOX to evaluate the possibility of enhancing sensitization to DOX treatment.

2. Results and Discussion

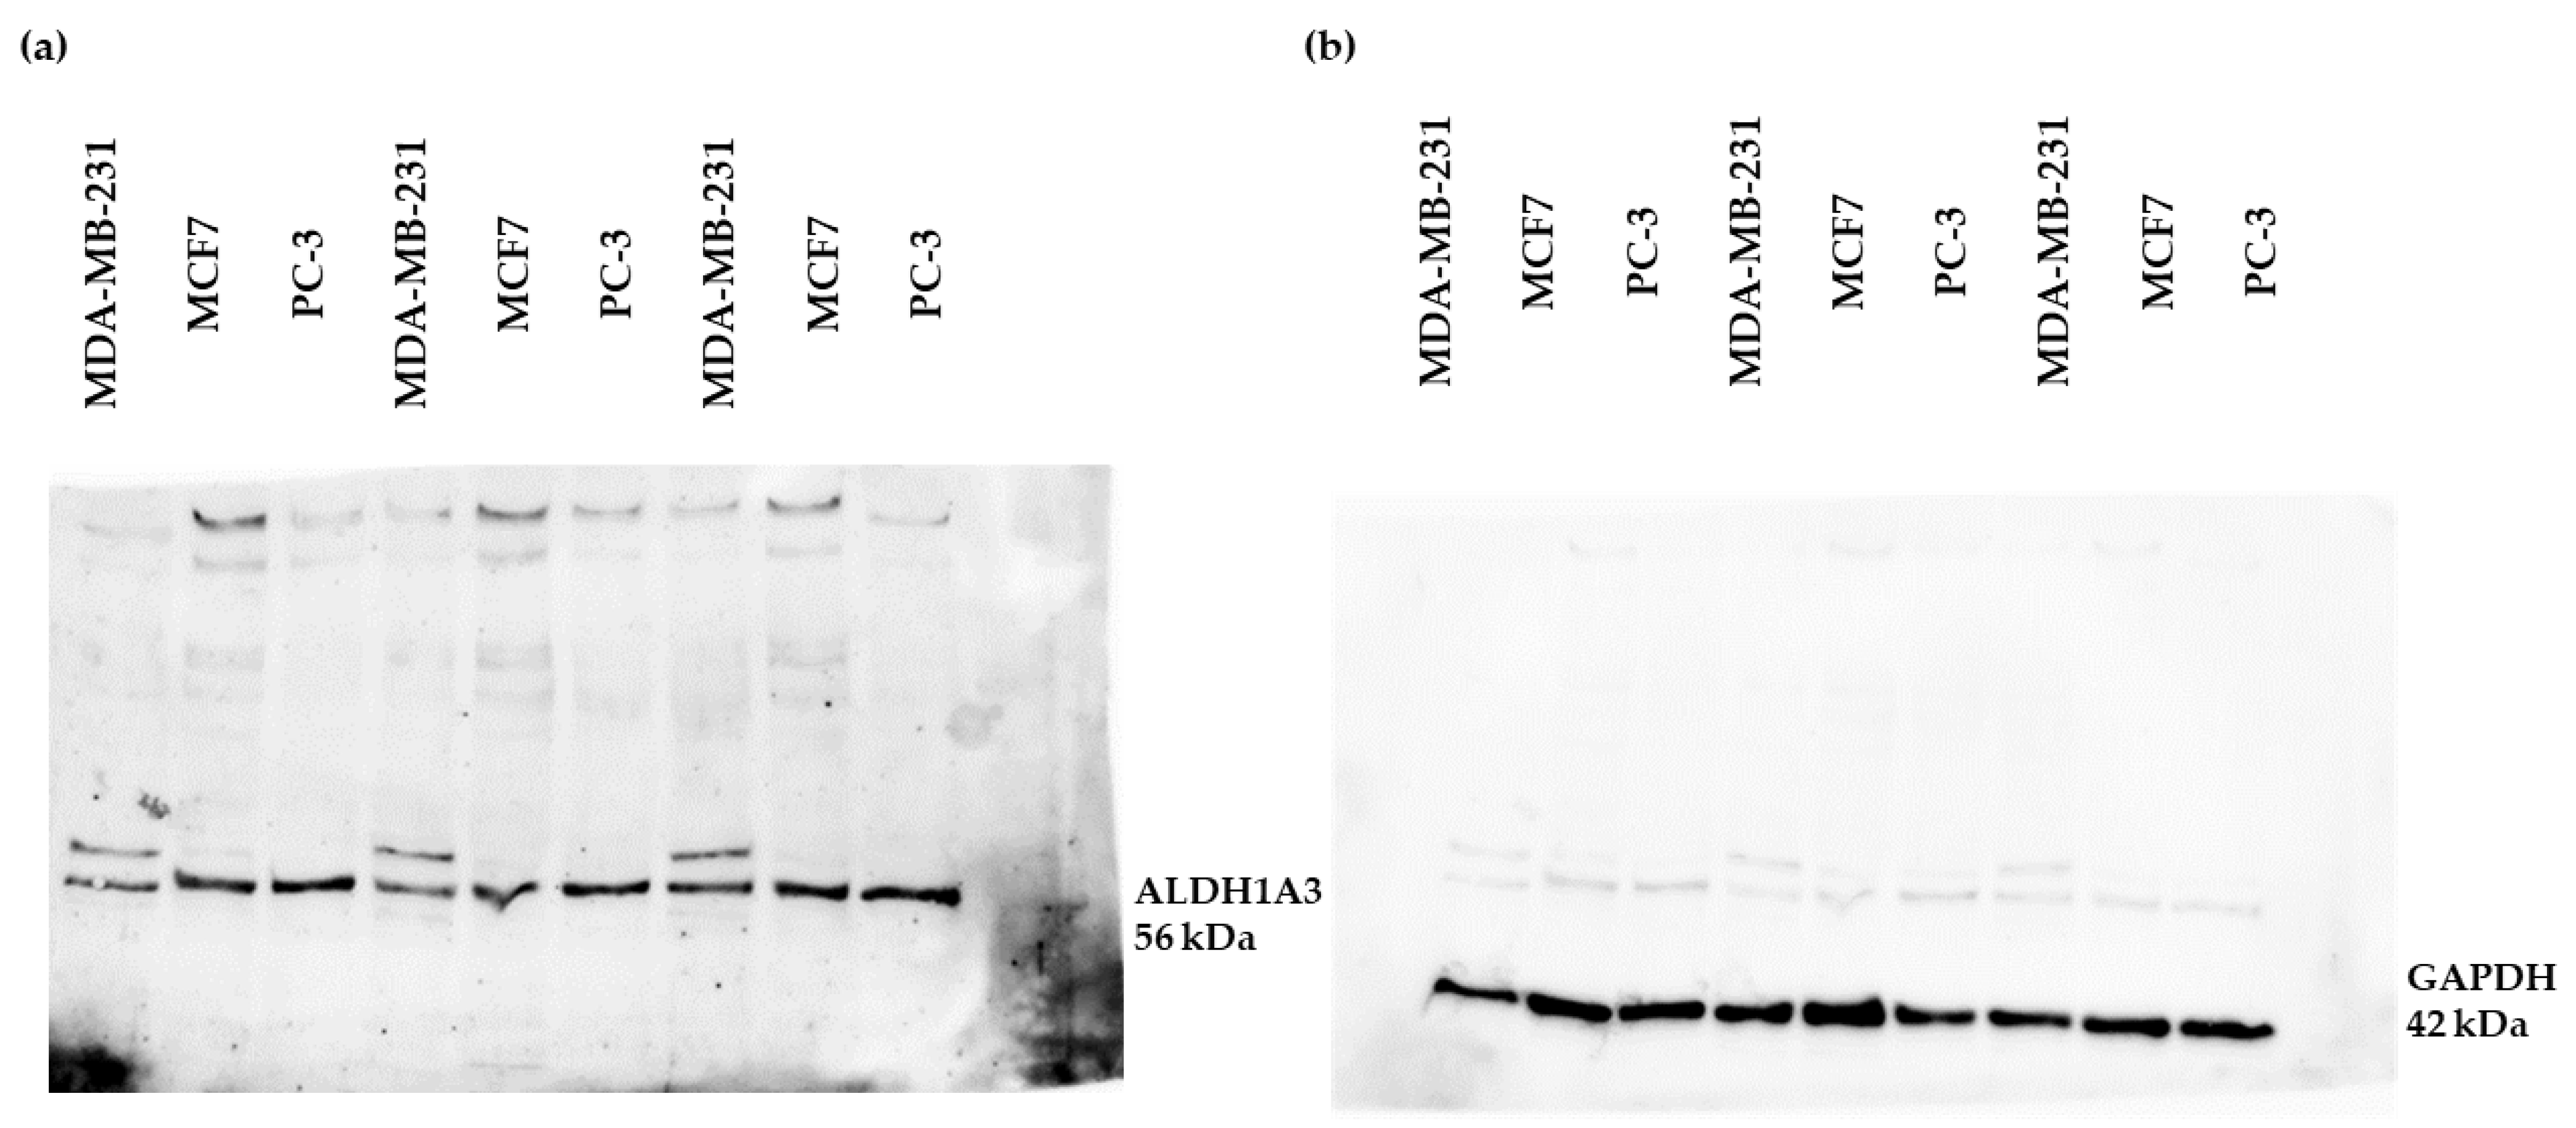
2.1. The Expression of ALDH1A3 in MCF7, MDA-MB-231, and PC-3 Cell Lines

As discussed in the introduction, breast cancer (MCF7 and MDA-MB-231) and prostate cancer (PC-3) cell lines are known to express ALDH1A3. In our study, we also investigated the expression of this enzyme in these cell lines before conducting our experiments. As shown in Figure 2, these cell lines were confirmed to express the ALDH1A3 enzyme and were, therefore, considered suitable for use in the cell viability experiments. As the figure shows, there might be a variation in the expression of ALDH1A3 enzyme in these cell lines, in line with previous work reported in the literature [12,22,29].

2.2. Cell Viability Assays

Cell viability was evaluated using an MTT colorimetric assay by treating MCF7, MDA-MB-231, and PC-3 cell lines for 48 h with compounds 16, 1519, 2328, and 3234, which have been synthesized by our group [21], and DEAB as a positive control. The results are shown in Table 1.
The IC50 values presented in Table 1 showed that compound 24 is the most cytotoxic on all cell lines tested: MCF7, MDA-MB-231, and PC-3, with IC50 values of 24.5, 31.7, and 25.2 μM, respectively. In contrast, compounds 15, 1518, 23, 34, and DEAB showed no cytotoxicity in any of the cell lines tested. Compounds 19 and 27 showed no cytotoxicity in MDA-MB-231 and PC-3 cell lines, while compound 33 was non-toxic in the MCF7 cell line, with IC50 values higher than 100 μM. The IC50s of the remaining compounds on the indicated cell lines are shown in Table 1; these are all higher than the values obtained for compound 24.
Ibrahim et al. [21] have reported that compounds 15 and 16 were the most potent of these ALDH1A3 inhibitors, with IC50 values of 0.23 μM and 1.29 μM, respectively. Given that compounds 15 and 16 showed no cytotoxicity on the tested cell lines, which have been found to variably express the ALDH1A3 isoform—as previously mentioned and as our Western blot results showed (Figure 2)—a possible explanation is that these compounds were detoxified by other isoforms or other oxidoreductases [21]. Hence, compounds 15 and 16 may act as substrates for other ALDH isoforms, thus affecting their antiproliferative activity [21].
Compounds 2, 5, 6, 17, and 19 have not shown significant inhibition of ALDH1A3 activity, in contrast to compounds 1 and 18 [21]. However, compound 6 was found cytotoxic on all tested cell lines (MCF7, MDA-MB-231, and PC-3) with IC50 values of 47.0, 57.9, and 50.7 μM, respectively, as presented in Table 1. Compound 19 showed an IC50 value of 91.9 μM on the MCF7 cell line, with no cytotoxicity in either MBA-MB-231 or PC-3 cell lines (Table 1). The mechanism of how these compounds affect cell proliferation warrants further investigation.
Compounds 2426, 28, and 32 showed cytotoxic effects on both MCF7 and PC-3 cell lines, compound 27 was cytotoxic in MCF7 cells only, and compound 33 was cytotoxic in MDA-MB-231 and PC-3 cell lines, as presented in Table 1. It is worth mentioning that according to Ibrahim et al., compounds 24, 28, 32, and 33 have shown variable cytotoxicity on A549 and H1299 cell lines [21]. Again, these cytotoxic effects are worth further investigation.
Compounds 6, 24, and 33 are derivatives of coniferyl aldehyde that contain cinnamaldehyde nuclei [21]. Cinnamaldehyde has been reported to be cytotoxic to cancer cell lines, such as leukemia K562 [35] and MCF7 [36]. Although previous studies have reported that coniferyl aldehyde derivatives are non-toxic on MCF7 and NCI-H187 (small-cell lung cancer) cell lines [37], compounds 6, 24 and 33 were found to be cytotoxic against MCF7 (compounds 6 and 24 only), MDA-MB-231, and PC-3 cell lines, as presented in Table 1.
Ibrahim et al. [21] reported that several ALDH-affinic compounds (6, 17, 19, 24, 28, 32, and 33) resulted in cytotoxicity in H1299 cells, which do not express the ALDH1A3 isoform. On the other hand, on A549 cells—an ALDH1A3-expressing cell line—a cytotoxic effect was reported only for compounds 23, 28, and 32 [21]. The lack of cytotoxicity of ALDH1A3 potent inhibitors in this study and the finding from our previous study [21] that there was no cytotoxicity on ALDH1A3-expressing cells, shows that the cytotoxicity mechanism is not necessarily related to ALDH1A3 inhibition. Other mechanisms might be involved in the cytotoxicity of these ALDH-affinic compounds, which requires further investigation.

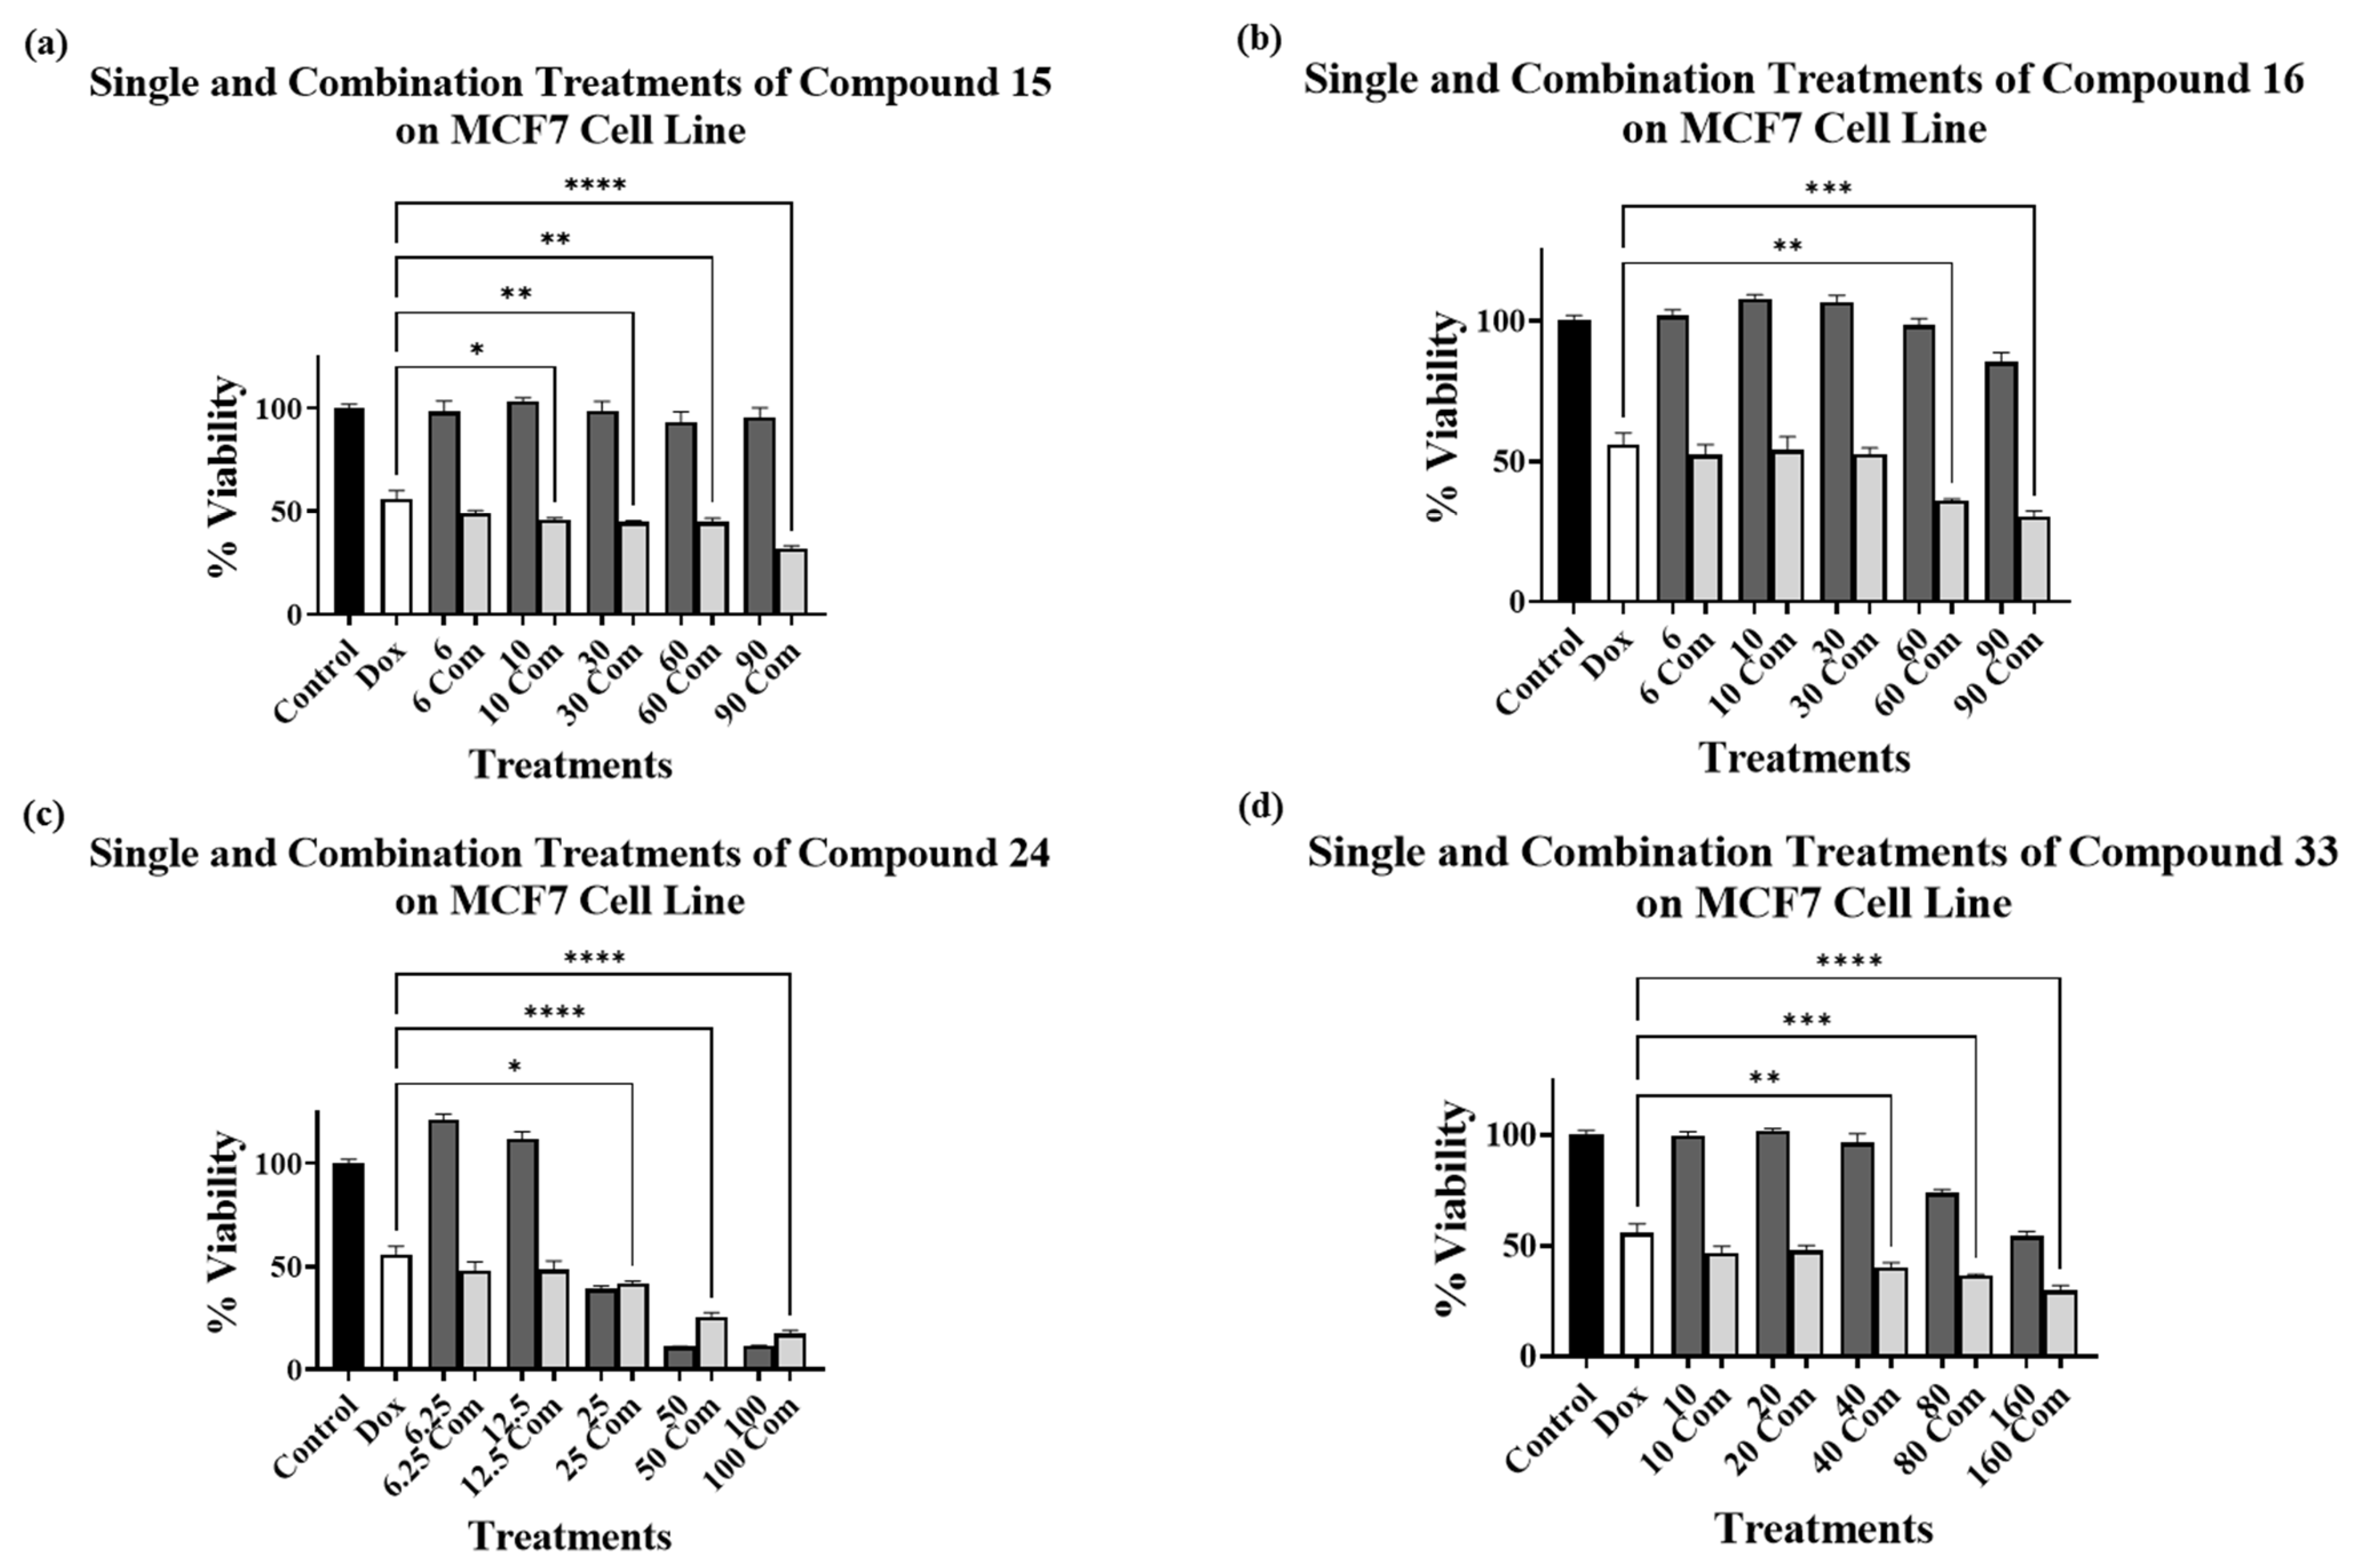
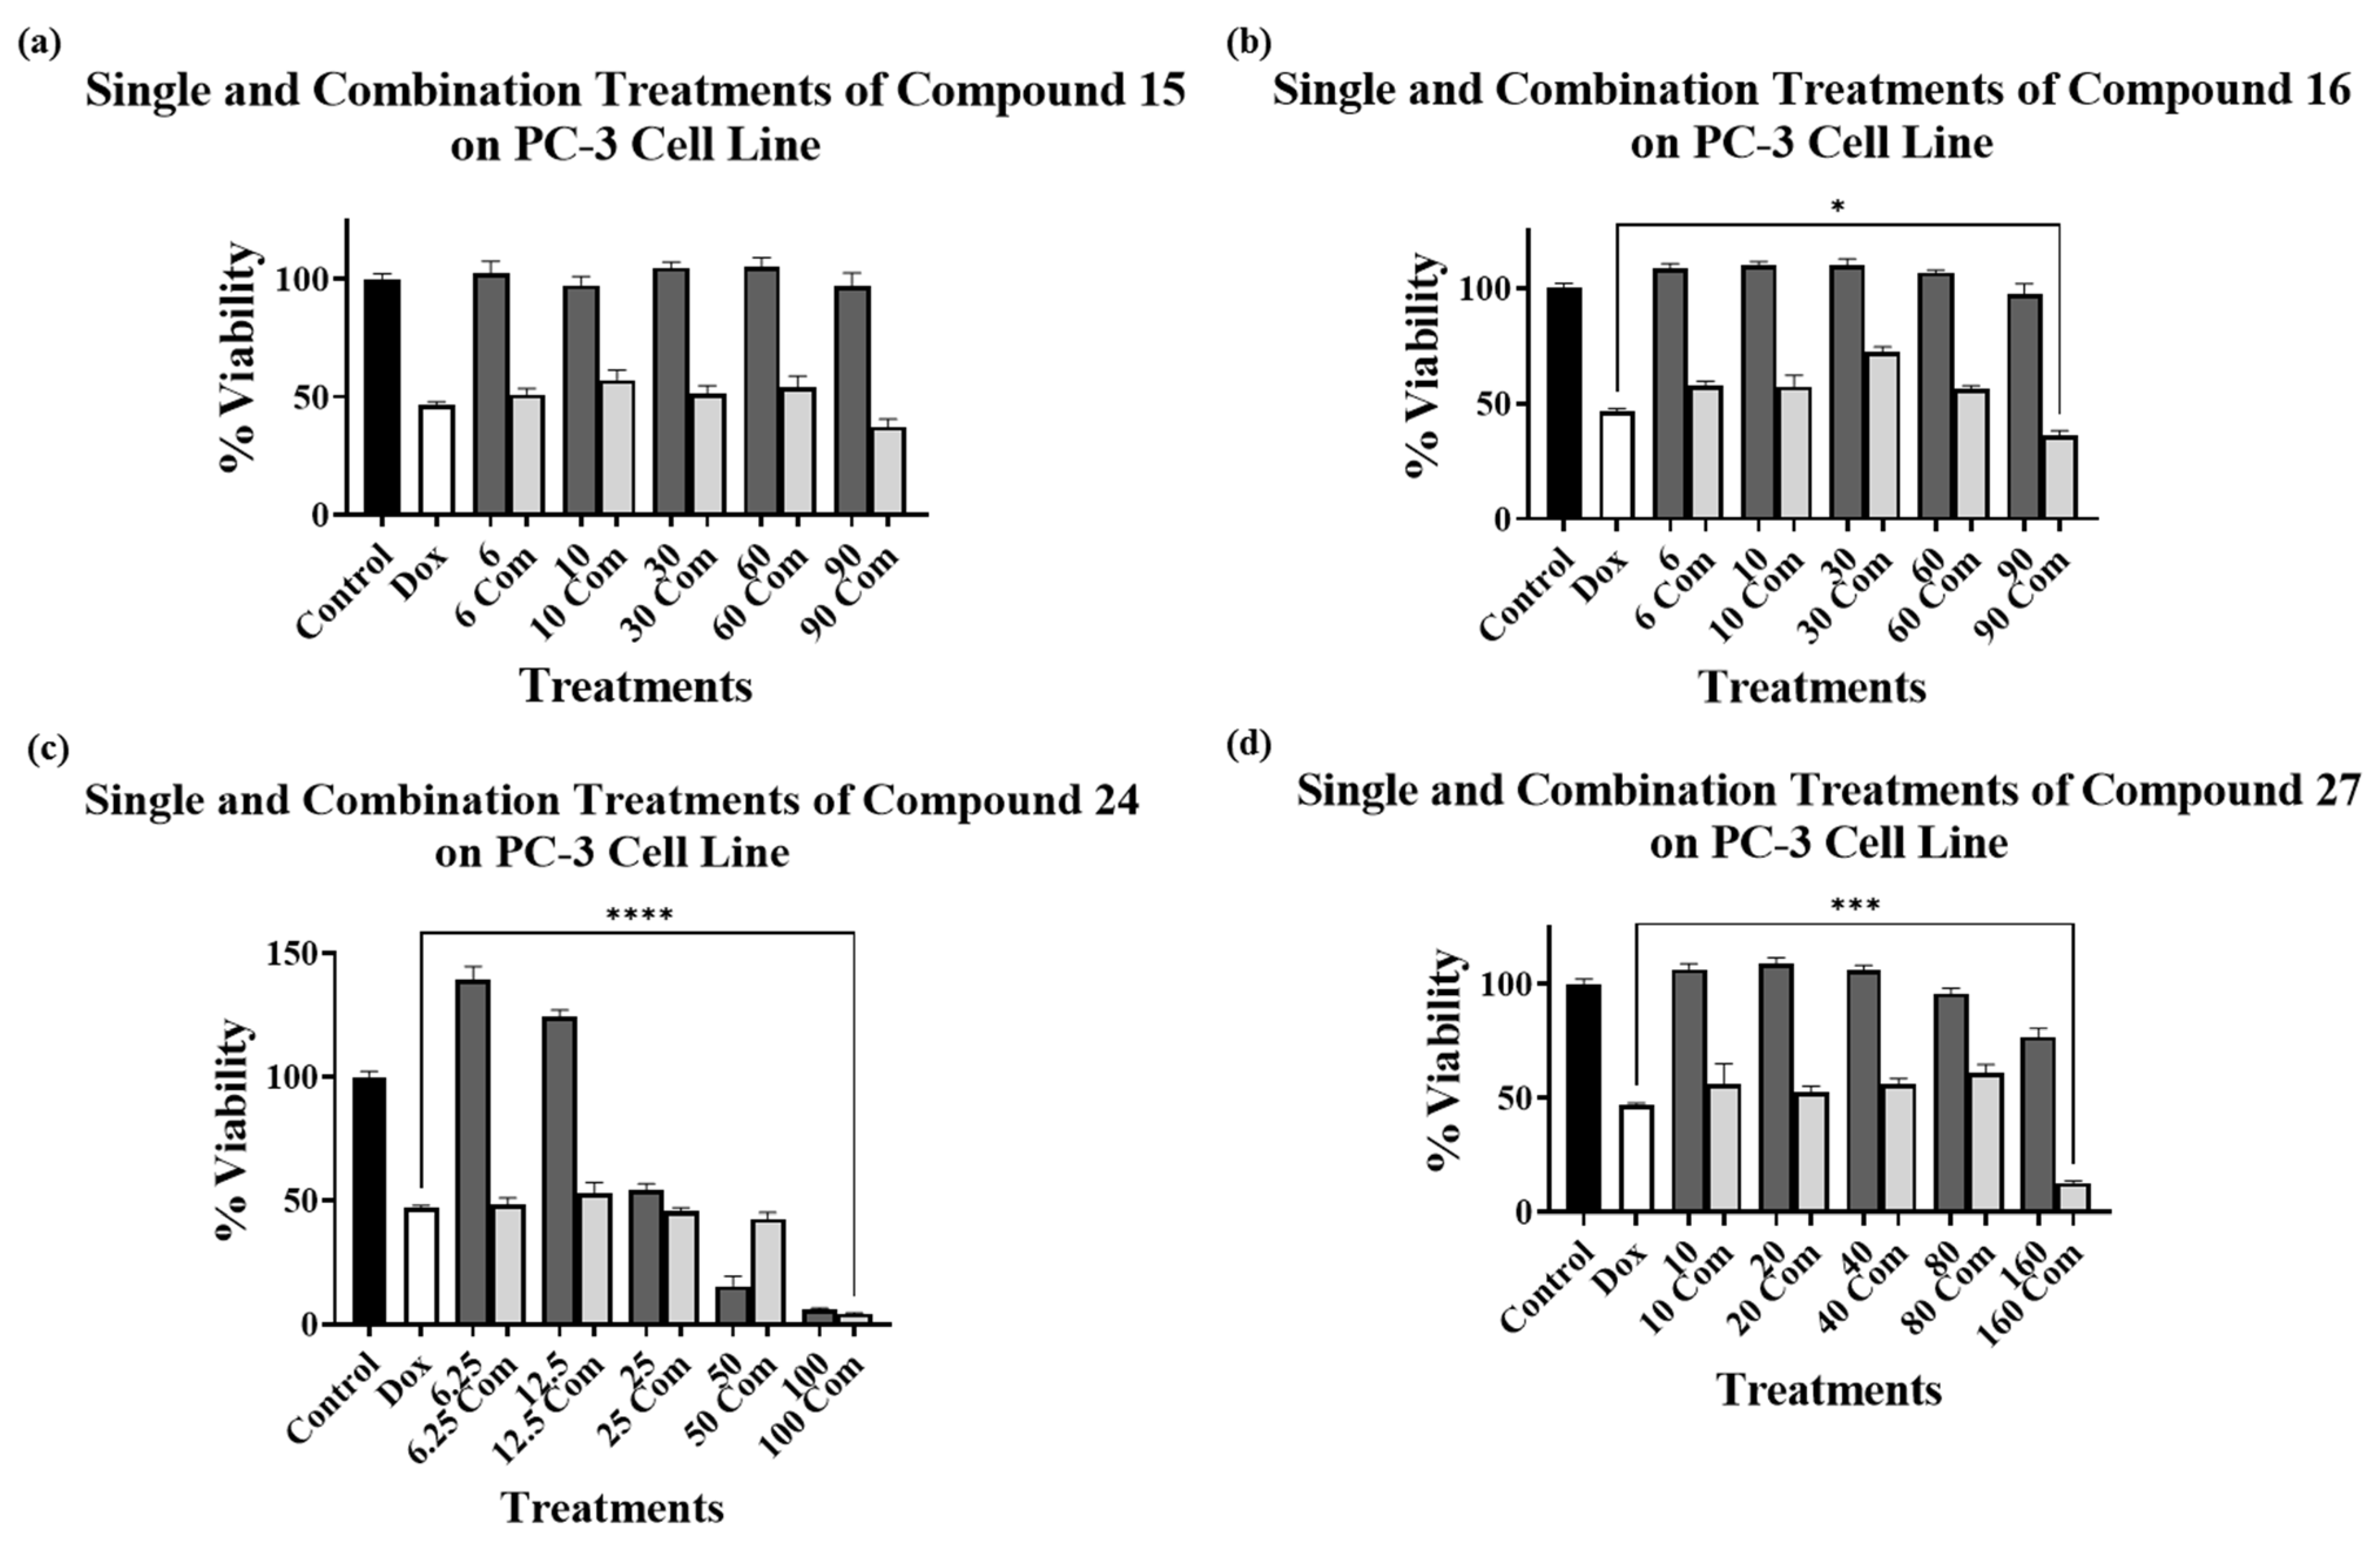
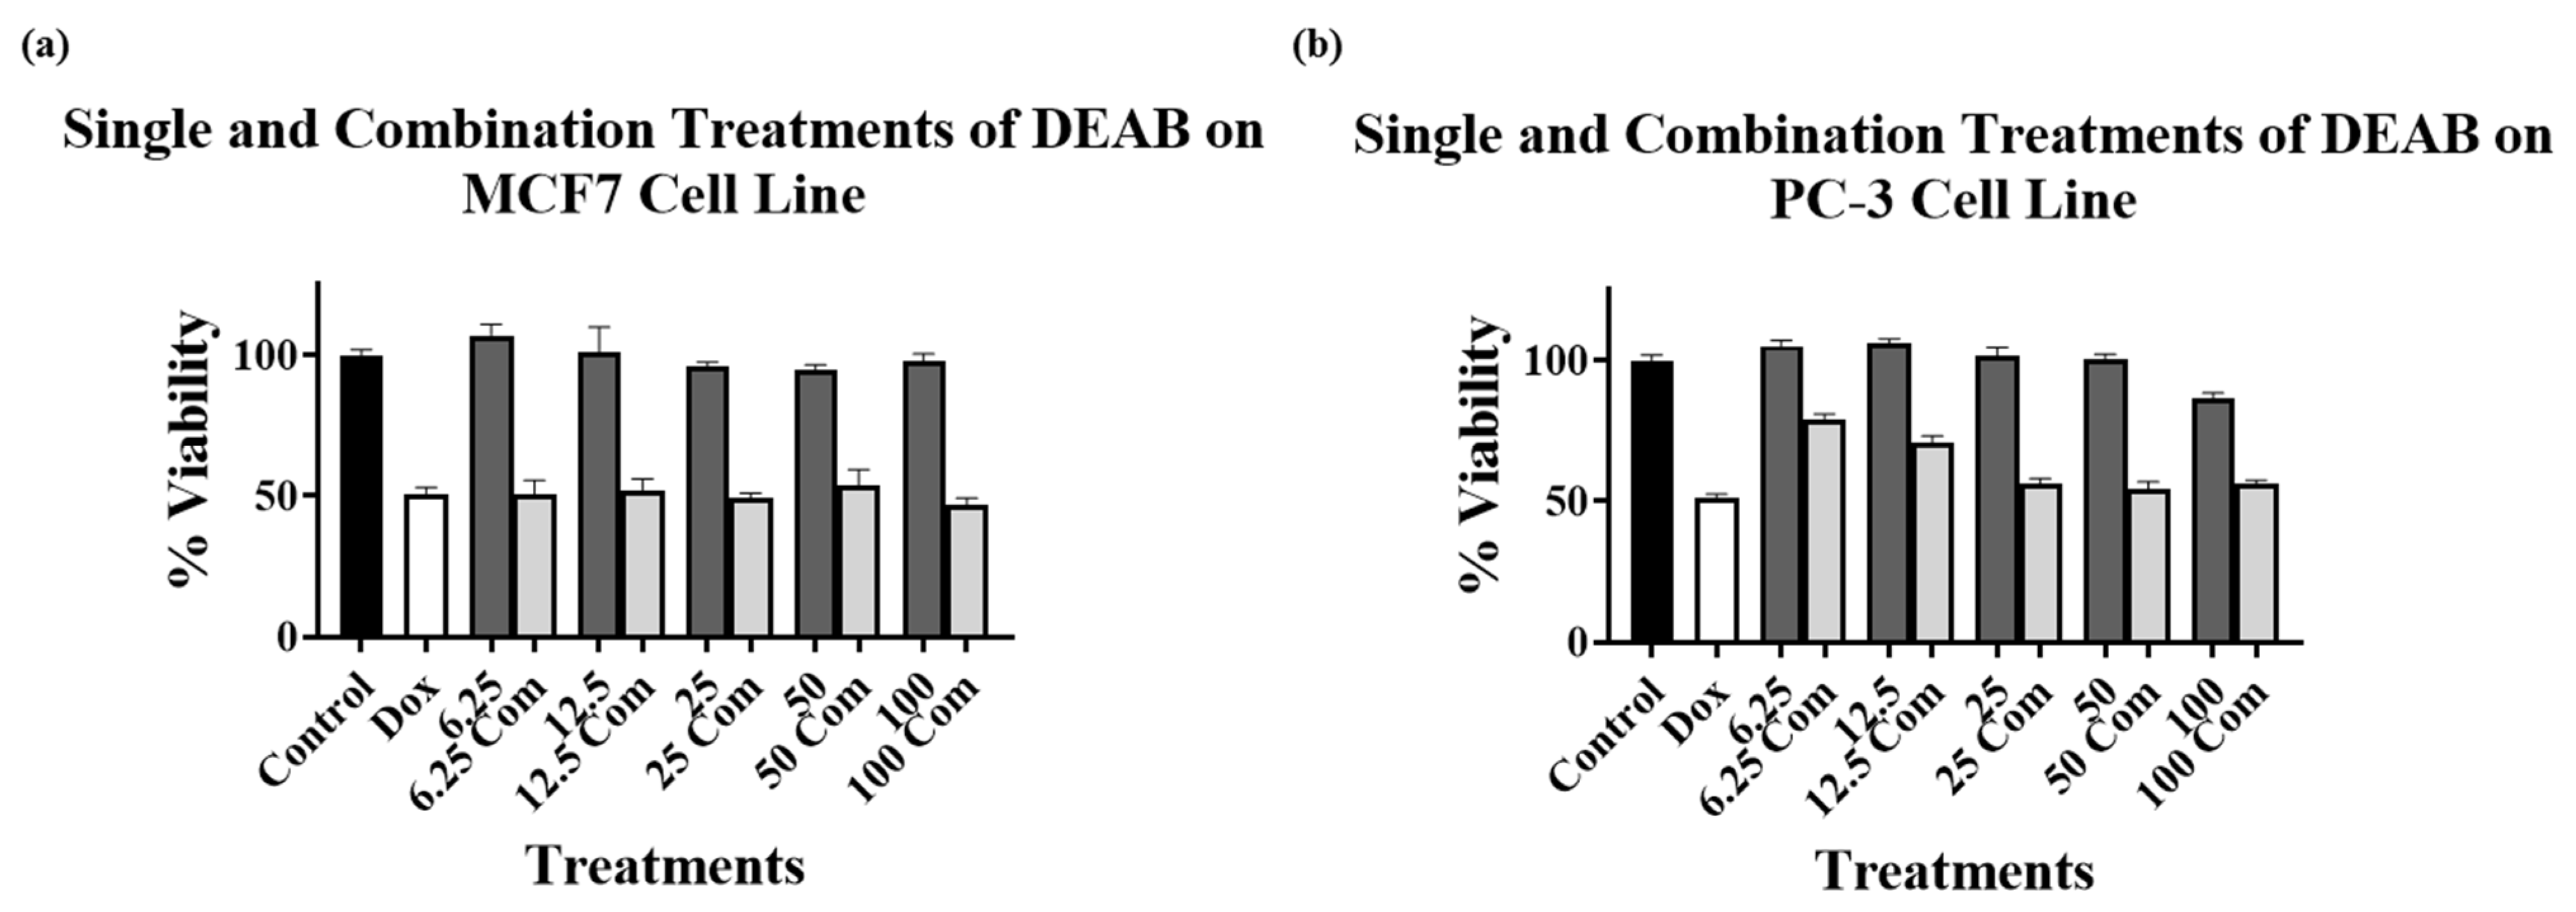
2.3. Combination Treatments with Doxorubicin

Variable sensitivity to DOX has been reported in breast and prostate cancer cell lines [38,39,40]. In addition, the expression of ALDHs is related to decreased cytotoxic effect and sensitivity to DOX [7,26,27,28], as mentioned above.
To investigate enhancing DOX sensitivity via an ALDH-related pathway, selected compounds were tested in this study in combination with DOX on MCF7 and PC-3 cell lines. These cell lines were chosen because they express ALDH1A3 isoform. Compounds 15, 16, 24, 27, 33, and DEAB were used in this study, in which compounds 15 and 16 have been found to be the most potent ALDH1A3 inhibitors [21] and, according to the IC50 values shown in Table 1, they were considered relatively non-cytotoxic. Compound 24 showed the highest cytotoxicity on all tested cell lines, while compounds 27 and 33 appeared to be non-cytotoxic on PC-3 and MCF7 cell lines (Table 1), respectively. DEAB, a known pan-ALDH inhibitor [32], was chosen to evaluate any enhancement of DOX sensitivity in combination treatments.
Cell viability assays were also evaluated via MTT colorimetric assays by treating MCF7 and PC-3 cell lines for 48 h with compounds 15, 16, 24, 27 (on PC-3), and 33 (on MCF7), in combination with DOX. In addition, DEAB was used in combination with DOX on MCF7 and PC-3 cell lines. The concentrations used for DOX were selected based on their respective IC50 on each cell line: 5 μM and 1 μM for MCF7 and PC-3, respectively.
For compounds 15 and 16, concentrations of 90, 60, 30, 10, and 6 μM were used, which were below their IC50 values on both MCF7 and PC-3 cell lines. This was to investigate whether the combination treatment showed a dose-dependent sensitization or whether the effect was independent of the concentration used. For compound 24, the concentrations used (100, 50, 25, 12.5, and 6.25 μM) ranged above and below its respective IC50 value (~25 μM, Table 1) on MCF7 and PC-3 cell lines. This was in order to evaluate the effect of cytotoxic and non-cytotoxic concentrations on cell viability when used alone or in combination with DOX. For compounds 27 and 33, several concentrations were used (160, 80, 40, 20, and 10 μM). As compounds 27 and 33 have expected IC50 values above 100 μM, 160 μM was used alongside concentrations below 100 μM to determine the effect of its non-cytotoxic concentrations, as with compounds 15 and 16. Similar to compounds 27 and 33, the concentrations used for DEAB were 100, 50, 25, 12.5, and 6.25 μM, which are non-cytotoxic concentrations on both cell lines.
One-way ANOVA followed by Tukey’s multiple comparisons analysis was conducted to analyze the results of the combination treatments on MCF7 and PC-3 cell lines when compared to DOX alone to determine any significant enhancement of cytotoxicity, as shown in Figure 3, Figure 4 and Figure 5.
Figure 3a–d show the cytotoxic effect of compounds 15, 16, 24 and 33, respectively, in combination with 5 μM DOX compared to 5 μM DOX treatment alone on the MCF7 cell line. The data analysis revealed a significant decrease in cell viability of the cells treated with 5 μM DOX in combination with various concentrations of compound 15 (Figure 3a), with 60 and 90 μM of compound 16 (Figure 3b), with 25, 50, and 100 μM of compound 24 (Figure 3c), and with 40, 80, and 160 μM of compound 33 (Figure 3d). The combination of compound 15 with DOX showed a significant reduction in MCF7 cell viability (Figure 3a) at all concentrations except for 6 μM. The significant reduction of cell viability for compound 16 was only observed at higher concentrations (60 μM and 90 μM), compared to compound 15, as shown in Figure 3b.
Taking into consideration that compounds 15 and 16 were found to be non-cytotoxic on MCF7 cells (Table 1) and were the most potent ALDH1A3 inhibitors, with compound 15 being more potent than 16 [21], it could be hypothesized that compound 15 sensitized MCF7 cells to DOX treatment to a greater extent than compound 16. Voulgaridou et al. have reported that MCF7 cells expressing the ALDH3A1 isoform resulted in approximately 11-fold resistance to DOX compared to ALDH3A1 non-expressing cells [41]. Therefore, a possible explanation for this enhancement of DOX cytotoxicity could be that compounds 15 and 16 target the ALDH enzymes as either inhibitors (for ALDH1A3) or potential substrates (for ALDH3A1) [21], which could lead to sensitization of the MCF7 cells to DOX treatment. Compounds 24 and 33 also showed significant reduction in cell viability compared to DOX alone (Figure 3c,d), but only at relatively high concentrations, which may indicate a non-sensitizing combined cytotoxic activity.
Figure 4a–d show the cytotoxic effect of compounds 15, 16, 24, and 27, respectively, on PC-3 cells, in combination with 1 μM DOX compared to the single 1 μM DOX treatment. The results showed no decrease in the cell viability for the combination treatment of DOX with compound 15 at any of the concentrations used (Figure 4a). However, a significant decrease in cell viability for the combination treatments with DOX was observed with compound 16 at 90 μM (Figure 4b), with compound 24 at 100 μM (Figure 4c), and with compound 27 at 160 μM (Figure 4d).
The results obtained from the combination treatment experiments on the PC-3 cell line showed a significant reduction in cell viability only at the highest concentration used for the compounds tested (16, 24, and 27) in combination with DOX, compared to DOX alone. Unexpectedly, compound 15, at all tested concentrations, did not show any enhancement of the DOX cytotoxicity, compared to the single DOX treatment. A possible explanation for the differences observed between MCF7 and PC-3 cell lines results may be due to the variations in the level of ALDH expressions in these cell lines, and which may be related to variable metabolic processes. Again, further validation studies are required to support this hypothesis, which could potentially pave the way for selective targeting of certain cancer types.
In both cell lines, compound 24 produced an anomalous pattern of cell viability reduction at high concentrations (50 and 100 μM in MCF7 and 50 μM in PC3), in which the combined treatment resulted in higher cell viability than the compound alone at both concentrations used. This requires further investigation to understand why this kind of combination decreased the cytotoxic effect of the compound on both cell lines. An alternate hypothesis based on the compound 24 results could be that DOX is enhancing the activity of the ALDH-affinic compounds.
Figure 5a,b represents the cytotoxic effect of DEAB on MCF7 (Figure 5a) and PC-3 (Figure 5b) cells alone and in combination with 5 μM and 1 μM DOX, respectively, compared to the single 5 μM and 1 μM DOX treatments. The results did not show a significant decrease in the cell viability for the combination treatment of DOX with DEAB in any of the DEAB concentrations used in either cell line compared to DOX alone. Although there was a reduction in cell viability of both cell lines when combination treatments were used compared to DEAB alone, the reduction was not significant compared to DOX alone. The results indicate that DEAB did not enhance the cytotoxicity of DOX on either of the tested cell lines. Taking into account the results obtained for compounds 15 and 16, the observed effects of DEAB on both cell lines may be due to DEAB’s non-selective ALDH inhibitory activity.
Given that compounds 15 and 16 are non-cytotoxic on ALDH1A3-expressing cells even though they are potent ALDH1A3 inhibitors, the enhancement of cytotoxic activity when combined with DOX might be driven by a different mechanism. Moreover, DOX might be the agent that is enhancing the cytotoxic effects of these ALDH-affinic compounds on the tested cell lines.
The ATP-binding cassette (ABC)-superfamily is composed of several efflux pump transporters that are responsible for chemoresistance [42]. Examples of ABC transporters include P-glycoprotein (P-gp/MDR1/ABCB1), MDR-associated protein (MRP)1 (ABCC1), and breast cancer resistance protein ABCG2 (also known as BCRP, ABCP, or MXR) [43]. P-gp expression is associated with drug resistance and reduced response to chemotherapy in cancer patients, with DOX being a P-gp substrate [44,45]. Hence, the investigated compounds might be ABC substrates competing with DOX on these transporters, which would allow for enhanced DOX entry and, thus, enhanced cytotoxicity. Additionally, the lack of cytotoxicity of the potent ALDH1A3 inhibitors might be due to their ability to act as ABC transporter substrates.
Both hypotheses—ALDH-affinic compounds enhancing DOX sensitivity or vice versa, and the possibility of ALDH-affinic compounds being ABC substrates—require further investigation, along with further analog development related to compounds 15 and 16.

3. Materials and Methods

3.1. Cell Subculture and Growth Conditions

DMEM High Glucose, RPMI-1640 media, Heat Inactivated Fetal Bovine Serum (FBS), and PBS were purchased from Euroclone, Pero, Italy. Breast cancer cell lines (MCF7 (ATCC HTB-22) and MDA-MB-231 (ATCC CRM-HTB26)) and a prostate cancer cell line (PC-3 (ATCC CRL-1435)) were purchased from ATCC®. MCF7 and MDA-MB-231 cells were grown in 10% (v/v) FBS/DMEM High Glucose (complete medium) and PC-3 cells were grown in 10% (v/v) FBS/RPMI-1640 (complete medium). They were incubated at 37 °C in a humidified air atmosphere of 5% CO2. All cells are adherent and were frequently washed with PBS and supplemented with fresh media for their growth.

3.2. Analysis of the Expression of ALDH1A3 in MCF7, MDA-MB-231, and PC-3 Cell Lines

Samples of MCF7, MDA-MB-231, and PC-3 cells were lysed using a RIPA lysis buffer (sc-24948A, Santa Cruz Biotechnology, Dallas, TX, USA). Equal quantities of isolated proteins were then mixed with 5× Laemmli loading dye. Proteins were separated by sodium dodecyl sulfate-polyacrylamide gel electrophoresis (SDS-PAGE) (12%) and electrophoretically transferred at a constant current of 25 V for 30 min using a Trans-Blot TurboTM Transfer System (Bio-Rad, Hercules, CA, USA) onto a polyvinylidene difluoride (PVDF) membrane, Santa Cruz Biotechnology). After blocking with 3% (w/v), fat-free milk diluted in TBST (50 mM Tris-HCl, 150 mM NaCl, pH 7.4, 0.1% (v/v) Tween 20) for 30 min at 4 °C, the membrane was incubated overnight at 4 °C with one of the following primary antibodies: anti-ALDH1A3 (ab129815; Abcam, Cambridge, UK) or anti-GAPDH antibody as a loading control (ab9485, Abcam). The amount of each antibody used was as per the manufacturer’s instructions. The next day, the primary antibody was removed, and the washing and blocking processes were carried out for 15 and 30 min, respectively. The secondary antibody (goat anti-rabbit IgG H&L (HRP) (ab205718, Abcam)) was then added for 90 min. The secondary antibody was then removed and the membrane was washed for 15 min to prepare it for imaging using a ChemiDocTM Imaging System (Bio-Rad, Hercules, CA, USA).

3.3. MTT Colorimetric Cell Viability Assay

Cells were seeded in 96-well plates at a seeding density of 10 × 103 (MCF7), 9 × 10³ (MDA-MB-231), or 8 × 10³ (PC-3) cells/well in triplicates. Cells were incubated for 24 h to allow for cell attachment, then the media were aspirated and fresh complete media containing the compounds of interest were added. Compounds were first dissolved in DMSO (Fisher Chemicals) and then diluted in the complete medium, resulting in a final well concentration of 1% for DMSO for the highest concentration for any compound used. Untreated control samples were also prepared (1% DMSO/complete media). Final well concentrations for all compounds were 100, 50, 25, 12.5, and 6.25 μM. Plates were then incubated for 48 h. After 48 h incubation, the MTT colorimetric assay was performed as described previously [46]. Briefly, MTT was dissolved in PBS (5 mg/mL), and after 48 h, media were aspirated and discarded from all wells, and then 100 µL of fresh media was added in addition to 15 µL of MTT solution. Plates were incubated for 3 h, and then all culture media was aspirated from wells and 150 µL of absolute DMSO was added to dissolve formazan crystals. Finally, plates were incubated at room temperature while shaking for 30 min, and then absorbance was measured at 570 nm using a Multiskan GO spectrophotometer (Thermofisher, UK). Experiments were performed in triplicate, in three independent experiments. The results were then used to calculate percentage viability relative to the controls. Dose-response curves were generated using GraphPad Prism version 9.0.

3.4. Cell Viability Assays of Combination Treatments with Doxorubicin

Cell viability assays were conducted as described above in Section 2.3. In these experiments, DOX (Sigma-Aldrich, St. Louis, MO, USA), at a final concentration of 5 µM (MCF7 cell line) and 1 µM (PC-3 cell line) was used, along with a range of concentrations for specific compounds. Experiments were performed in triplicates, in three independent experiments.

3.5. Statistical Analysis

Data were presented as means and standard errors of the means (SEM). Nonlinear regression analysis was used to generate dose–response curves and determine IC50 values. One-way ANOVA followed by Tukey’s multiple comparisons analysis was used to compare the results of combination treatments (compounds plus DOX) with DOX alone. All statistical analyses were based on a p < 0.05 level of significance, using GraphPad Prism version 9.0.

4. Conclusions

In conclusion, several ALDH-affinic compounds were investigated as single agents and in combination with DOX on ALDH-expressing cells: breast cancer cell lines (MCF7 and MDA-MB-231) and a prostate cancer cell line (PC-3). The treatment with DOX showed enhanced cytotoxicity when combined with the selective ALDH inhibitors, particularly compound 15, on the MCF7 cell line. Other compounds, including DEAB—a known non-selective ALDH inhibitor—did not show any promising enhancements of the DOX cytotoxicity on either cell line. Thus, the combination treatment experiment highlighted a promising potential impact of ALDH-selective inhibition in overcoming cancer resistance to chemotherapeutic agents. Indeed, the use of these ALDH-affinic compounds with DOX showed enhancement of antiproliferative activity and may be applied to overcome DOX resistance and/or to improve DOX-based therapeutic regimens.

Author Contributions

Conceptualization, O.H.A. and A.I.M.I.; formal analysis, O.H.A. and A.I.M.I.; methodology, H.I., A.M.H. and W.H.I.; project administration, O.H.A. and A.I.M.I.; supervision, O.H.A. and A.I.M.I.; writing—original draft, O.H.A.; writing—review and editing, O.H.A., A.I.M.I. and A.M.H. All authors have read and agreed to the published version of the manuscript.

Funding

This work was supported by Al-Zaytoonah University of Jordan grants; fully supported by grant number 03/18/2018-2019 and partially supported by grant number 32/11/2020-2021.

Institutional Review Board Statement

Not applicable.

Informed Consent Statement

Not applicable.

Data Availability Statement

Data are contained within the article.

Acknowledgments

All authors thank the Deanship of Scientific Research and Innovation at Al-Zaytoonah University of Jordan for funding this research.

Conflicts of Interest

The authors declare that they have no conflict of interest.

References

  1. Sládek, N.E. Human aldehyde dehydrogenases: Potential pathological, pharmacological, and toxicological impact. J. Biochem. Mol. Toxicol. 2003, 17, 7–23. [Google Scholar] [CrossRef] [PubMed]
  2. Lindahl, R. Aldehyde dehydrogenases and their role in carcinogenesis. Crit. Rev. Biochem. Mol. Biol. 1992, 27, 283–335. [Google Scholar] [CrossRef] [PubMed]
  3. Vasiliou, V.; Pappa, A.; Petersen, D.R. Role of aldehyde dehydrogenases in endogenous and xenobiotic metabolism. Chem. Biol. Interact 2000, 129, 1–19. [Google Scholar] [CrossRef]
  4. Jackson, B.; Brocker, C.; Thompson, D.C.; Black, W.; Vasiliou, K.; Nebert, D.W.; Vasiliou, V. Update on the aldehyde dehydrogenase gene (ALDH) superfamily. Hum. Genom. 2011, 5, 283–303. [Google Scholar] [CrossRef] [PubMed] [Green Version]
  5. Vasiliou, V.; Pappa, A.; Estey, T. Role of human aldehyde dehydrogenases in endobiotic and xenobiotic metabolism. Drug Metab. Rev. 2004, 36, 279–299. [Google Scholar] [CrossRef]
  6. Ghyselinck, N.B.; Duester, G. Retinoic acid signaling pathways. Development 2019, 146, dev167502. [Google Scholar] [CrossRef] [Green Version]
  7. Luo, Y.; Dallaglio, K.; Chen, Y.; Robinson, W.A.; Robinson, S.E.; McCarter, M.D.; Wang, J.; Gonzalez, R.; Thompson, D.C.; Norris, D.A.; et al. ALDH1A isozymes are markers of human melanoma stem cells and potential therapeutic targets. Stem Cells 2012, 30, 2100–2113. [Google Scholar] [CrossRef] [Green Version]
  8. Patel, M.; Lu, L.; Zander, D.S.; Sreerama, L.; Coco, D.; Moreb, J.S. ALDH1A1 and ALDH3A1 expression in lung cancers: Correlation with histologic type and potential precursors. Lung Cancer 2008, 59, 340–349. [Google Scholar] [CrossRef]
  9. Kardos, G.R.; Wastyk, H.C.; Robertson, G.P. Disruption of Proline Synthesis in Melanoma Inhibits Protein Production Mediated by the GCN2 Pathway. Mol. Cancer Res. 2015, 13, 1408–1420. [Google Scholar] [CrossRef] [Green Version]
  10. van den Hoogen, C.; van der Horst, G.; Cheung, H.; Buijs, J.T.; Pelger, R.C.M.; van der Pluijm, G. The aldehyde dehydrogenase enzyme 7A1 is functionally involved in prostate cancer bone metastasis. Clin. Exp. Metastasis 2011, 28, 615–625. [Google Scholar] [CrossRef] [Green Version]
  11. Dinavahi, S.S.; Bazewicz, C.G.; Gowda, R.; Robertson, G.P. Aldehyde Dehydrogenase Inhibitors for Cancer Therapeutics. Trends Pharmacol. Sci. 2019, 40, 774–789. [Google Scholar] [CrossRef] [PubMed]
  12. Marcato, P.; Dean, C.A.; Pan, D.; Araslanova, R.; Gillis, M.; Joshi, M.; Helyer, L.; Pan, L.; Leidal, A.; Gujar, S.; et al. Aldehyde dehydrogenase activity of breast cancer stem cells is primarily due to isoform ALDH1A3 and its expression is predictive of metastasis. Stem Cells 2011, 29, 32–45. [Google Scholar] [CrossRef] [PubMed]
  13. van den Hoogen, C.; van der Horst, G.; Cheung, H.; Buijs, J.T.; Lippitt, J.M.; Guzmán-Ramírez, N.; Hamdy, F.C.; Eaton, C.L.; Thalmann, G.N.; Cecchini, M.G.; et al. High aldehyde dehydrogenase activity identifies tumor-initiating and metastasis-initiating cells in human prostate cancer. Cancer Res. 2010, 70, 5163–5173. [Google Scholar] [CrossRef] [PubMed] [Green Version]
  14. Chang, J.S.; Hsiao, J.-R.; Chen, C.-H. ALDH2 polymorphism and alcohol-related cancers in Asians: A public health perspective. J. Biomed. Sci. 2017, 24, 19. [Google Scholar] [CrossRef] [PubMed] [Green Version]
  15. Liu, K.; Song, G.; Zhu, X.; Yang, X.; Shen, Y.; Wang, W.; Shi, G.; Li, Q.; Duan, Y.; Zhao, Y.; et al. Association between ALDH2 Glu487Lys polymorphism and the risk of esophageal cancer. Medicine 2017, 96, e6111. [Google Scholar] [CrossRef]
  16. Moreb, J.S. Aldehyde dehydrogenase as a marker for stem cells. Curr. Stem. Cell Res. Ther. 2008, 3, 237–246. [Google Scholar] [CrossRef]
  17. Douville, J.; Beaulieu, R.; Balicki, D. ALDH1 as a functional marker of cancer stem and progenitor cells. Stem. Cells Dev. 2009, 18, 17–25. [Google Scholar] [CrossRef]
  18. Ma, I.; Allan, A.L. The role of human aldehyde dehydrogenase in normal and cancer stem cells. Stem. Cell Rev. Rep. 2011, 7, 292–306. [Google Scholar] [CrossRef]
  19. Muzio, G.; Maggiora, M.; Paiuzzi, E.; Oraldi, M.; Canuto, R. Aldehyde dehydrogenases and cell proliferation. Free Radic. Biol. Med. 2012, 52, 735–746. [Google Scholar] [CrossRef]
  20. Pors, K.; Moreb, J.S. Aldehyde dehydrogenases in cancer: An opportunity for biomarker and drug development? Drug Discov. Today 2014, 19, 1953–1963. [Google Scholar] [CrossRef]
  21. Ibrahim, A.I.M.; Ikhmais, B.; Batlle, E.; AbuHarb, W.K.; Jha, V.; Jaradat, K.T.; Jiménez, R.; Pequerul, R.; Parés, X.; Farrés, J.; et al. Design, Synthesis, Biological Evaluation and In Silico Study of Benzyloxybenzaldehyde Derivatives as Selective ALDH1A3 Inhibitors. Molecules 2021, 26, 5770. [Google Scholar] [CrossRef] [PubMed]
  22. Ibrahim, A.I.M.; Batlle, E.; Sneha, S.; Jiménez, R.; Pequerul, R.; Parés, X.; Rüngeler, T.; Jha, V.; Tuccinardi, T.; Sadiq, M.; et al. Expansion of the 4-(Diethylamino)benzaldehyde Scaffold to Explore the Impact on Aldehyde Dehydrogenase Activity and Antiproliferative Activity in Prostate Cancer. J. Med. Chem. 2022, 65, 3833–3848. [Google Scholar] [CrossRef] [PubMed]
  23. Park, J.W.; Jung, K.-H.; Lee, J.H.; Moon, S.H.; Cho, Y.S.; Lee, K.-H. Inhibition of aldehyde dehydrogenase 1 enhances the cytotoxic effect of retinaldehyde on A549 cancer cells. Oncotarget 2017, 8, 99382–99393. [Google Scholar] [CrossRef] [PubMed] [Green Version]
  24. Moreb, J.S.; Zucali, J.R.; Ostmark, B.; Benson, N.A. Heterogeneity of aldehyde dehydrogenase expression in lung cancer cell lines is revealed by Aldefluor flow cytometry-based assay. Cytom. B Clin. Cytom. 2007, 72, 281–289. [Google Scholar] [CrossRef]
  25. Quattrini, L.; Sadiq, M.; Petrarolo, G.; Maitland, N.; Frame, F.; Pors, K.; La Motta, C. Aldehyde Dehydrogenases and Prostate Cancer: Shedding Light on Isoform Distribution to Reveal Druggable Target. Biomedicines 2020, 8, 569. [Google Scholar] [CrossRef]
  26. Awad, O.; Yustein, J.T.; Shah, P.; Gul, N.; Katuri, V.; O’Neill, A.; Kong, Y.; Brown, M.L.; Toretsky, J.A.; Loeb, D.M. High ALDH Activity Identifies Chemotherapy-Resistant Ewing’s Sarcoma Stem Cells That Retain Sensitivity to EWS-FLI1 Inhibition. PLoS ONE 2010, 5, e13943. [Google Scholar] [CrossRef] [Green Version]
  27. Zhuang, X.; Zhang, W.; Chen, Y.; Han, X.; Li, J.; Zhang, Y.; Zhang, Y.; Zhang, S.; Liu, B. Doxorubicin-enriched, ALDH(br) mouse breast cancer stem cells are treatable to oncolytic herpes simplex virus type 1. BMC Cancer 2012, 12, 549. [Google Scholar] [CrossRef] [PubMed] [Green Version]
  28. Suman, S.; Das, T.P.; Damodaran, C. Silencing NOTCH signaling causes growth arrest in both breast cancer stem cells and breast cancer cells. Br. J. Cancer 2013, 109, 2587–2596. [Google Scholar] [CrossRef]
  29. Charafe-Jauffret, E.; Ginestier, C.; Iovino, F.; Wicinski, J.; Cervera, N.; Finetti, P.; Hur, M.-H.; Diebel, M.E.; Monville, F.; Dutcher, J.; et al. Breast cancer cell lines contain functional cancer stem cells with metastatic capacity and a distinct molecular signature. Cancer Res. 2009, 69, 1302–1313. [Google Scholar] [CrossRef] [Green Version]
  30. Ciccone, V.; Terzuoli, E.; Donnini, S.; Giachetti, A.; Morbidelli, L.; Ziche, M. Stemness marker ALDH1A1 promotes tumor angiogenesis via retinoic acid/HIF-1α/VEGF signalling in MCF-7 breast cancer cells. J. Exp. Clin. Cancer Res. 2018, 37, 311. [Google Scholar] [CrossRef]
  31. Sreerama, L.; Sládek, N.E. Three different stable human breast adenocarcinoma sublines that overexpress ALDH3A1 and certain other enzymes, apparently as a consequence of constitutively upregulated gene transcription mediated by transactivated EpREs (electrophile responsive elements) present in the 5’-upstream regions of these genes. Chem. Biol. Interact 2001, 130–132, 247–260. [Google Scholar]
  32. Russo, J.E.; Hauquitz, D.; Hilton, J. Inhibition of mouse cytosolic aldehyde dehydrogenase by 4-(diethylamino)benzaldehyde. Biochem. Pharmacol. 1988, 37, 1639–1642. [Google Scholar] [CrossRef] [PubMed]
  33. Croker, A.K.; Allan, A.L. Inhibition of aldehyde dehydrogenase (ALDH) activity reduces chemotherapy and radiation resistance of stem-like ALDHhiCD44⁺ human breast cancer cells. Breast Cancer Res. Treat. 2012, 133, 75–87. [Google Scholar] [CrossRef] [PubMed]
  34. Hamadneh, L.; Abu-Irmaileh, B.; Al-Majawleh, M.; Bustanji, Y.; Jarrar, Y.; Al-Qirim, T. Doxorubicin-paclitaxel sequential treatment: Insights of DNA methylation and gene expression changes of luminal A and triple negative breast cancer cell lines. Mol. Cell Biochem. 2021, 476, 3647–3654. [Google Scholar] [CrossRef]
  35. Zhang, J.-H.; Liu, L.-Q.; He, Y.-L.; Kong, W.-J.; Huang, S.-A. Cytotoxic effect of trans-cinnamaldehyde on human leukemia K562 cells. Acta Pharmacol. Sin. 2010, 31, 861–866. [Google Scholar] [CrossRef] [Green Version]
  36. Najar, B.; Shortrede, J.E.; Pistelli, L.; Buhagiar, J. Chemical Composition and in Vitro Cytotoxic Screening of Sixteen Commercial Essential Oils on Five Cancer Cell Lines. Chem. Biodivers. 2020, 17, e1900478. [Google Scholar] [CrossRef] [Green Version]
  37. Sudanich, S.; Tiyaworanant, S.; Yenjai, C. Cytotoxicity of flavonoids and isoflavonoids from Crotalaria bracteata. Nat. Prod. Res. 2017, 31, 2641–2646. [Google Scholar] [CrossRef]
  38. Shafei, A.; El-Bakly, W.; Sobhy, A.; Wagdy, O.; Reda, A.; Aboelenin, O.; Marzouk, A.; El Habak, K.; Mostafa, R.; Ali, M.A.; et al. A review on the efficacy and toxicity of different doxorubicin nanoparticles for targeted therapy in metastatic breast cancer. Biomed. Pharmacother. 2017, 95, 1209–1218. [Google Scholar] [CrossRef]
  39. Lovitt, C.J.; Shelper, T.B.; Avery, V.M. Doxorubicin resistance in breast cancer cells is mediated by extracellular matrix proteins. BMC Cancer 2018, 18, 41. [Google Scholar] [CrossRef] [Green Version]
  40. David-Beabes, G.L.; Overman, M.J.; Petrofski, J.A.; Campbell, P.A.; De Marzo, A.M.; Nelson, W.G. Doxorubicin-resistant variants of human prostate cancer cell lines DU 145, PC-3, PPC-1, and TSU-PR1: Characterization of biochemical determinants of antineoplastic drug sensitivity. Int. J. Oncol. 2000, 17, 1077–1086. [Google Scholar] [CrossRef]
  41. Voulgaridou, G.-P.; Kiziridou, M.; Mantso, T.; Chlichlia, K.; Galanis, A.; Koukourakis, M.I.; Franco, R.; Panayiotidis, M.I.; Pappa, A. Aldehyde dehydrogenase 3A1 promotes multi-modality resistance and alters gene expression profile in human breast adenocarcinoma MCF-7 cells. Int. J. Biochem. Cell Biol. 2016, 77 (Pt A), 120–128. [Google Scholar] [CrossRef]
  42. Sharom, F.J. ABC multidrug transporters: Structure, function and role in chemoresistance. Pharmacogenomics 2008, 9, 105–127. [Google Scholar] [CrossRef] [PubMed]
  43. Litman, T.; Druley, T.E.; Stein, W.D.; Bates, S.E. From MDR to MXR: New understanding of multidrug resistance systems, their properties and clinical significance. Cell Mol. Life Sci. 2001, 58, 931–959. [Google Scholar] [CrossRef] [PubMed]
  44. Leslie, E.M.; Deeley, R.G.; Cole, S.P. Multidrug resistance proteins: Role of P-glycoprotein, MRP1, MRP2, and BCRP (ABCG2) in tissue defense. Toxicol. Appl. Pharmacol. 2005, 204, 216–237. [Google Scholar] [CrossRef] [PubMed]
  45. Hsieh, I.-S.; Huang, W.-H.; Liou, H.-C.; Chuang, W.-J.; Yang, R.-S.; Fu, W.-M. Upregulation of drug transporter expression by osteopontin in prostate cancer cells. Mol. Pharmacol. 2013, 83, 968–977. [Google Scholar] [CrossRef]
  46. Aboalhaija, N.H.; Syaj, H.; Afifi, F.; Sunoqrot, S.; Al-Shalabi, E.; Talib, W. Chemical Evaluation, In Vitro and In Vivo Anticancer Activity of Lavandula angustifolia Grown in Jordan. Molecules 2022, 27, 5910. [Google Scholar] [CrossRef]
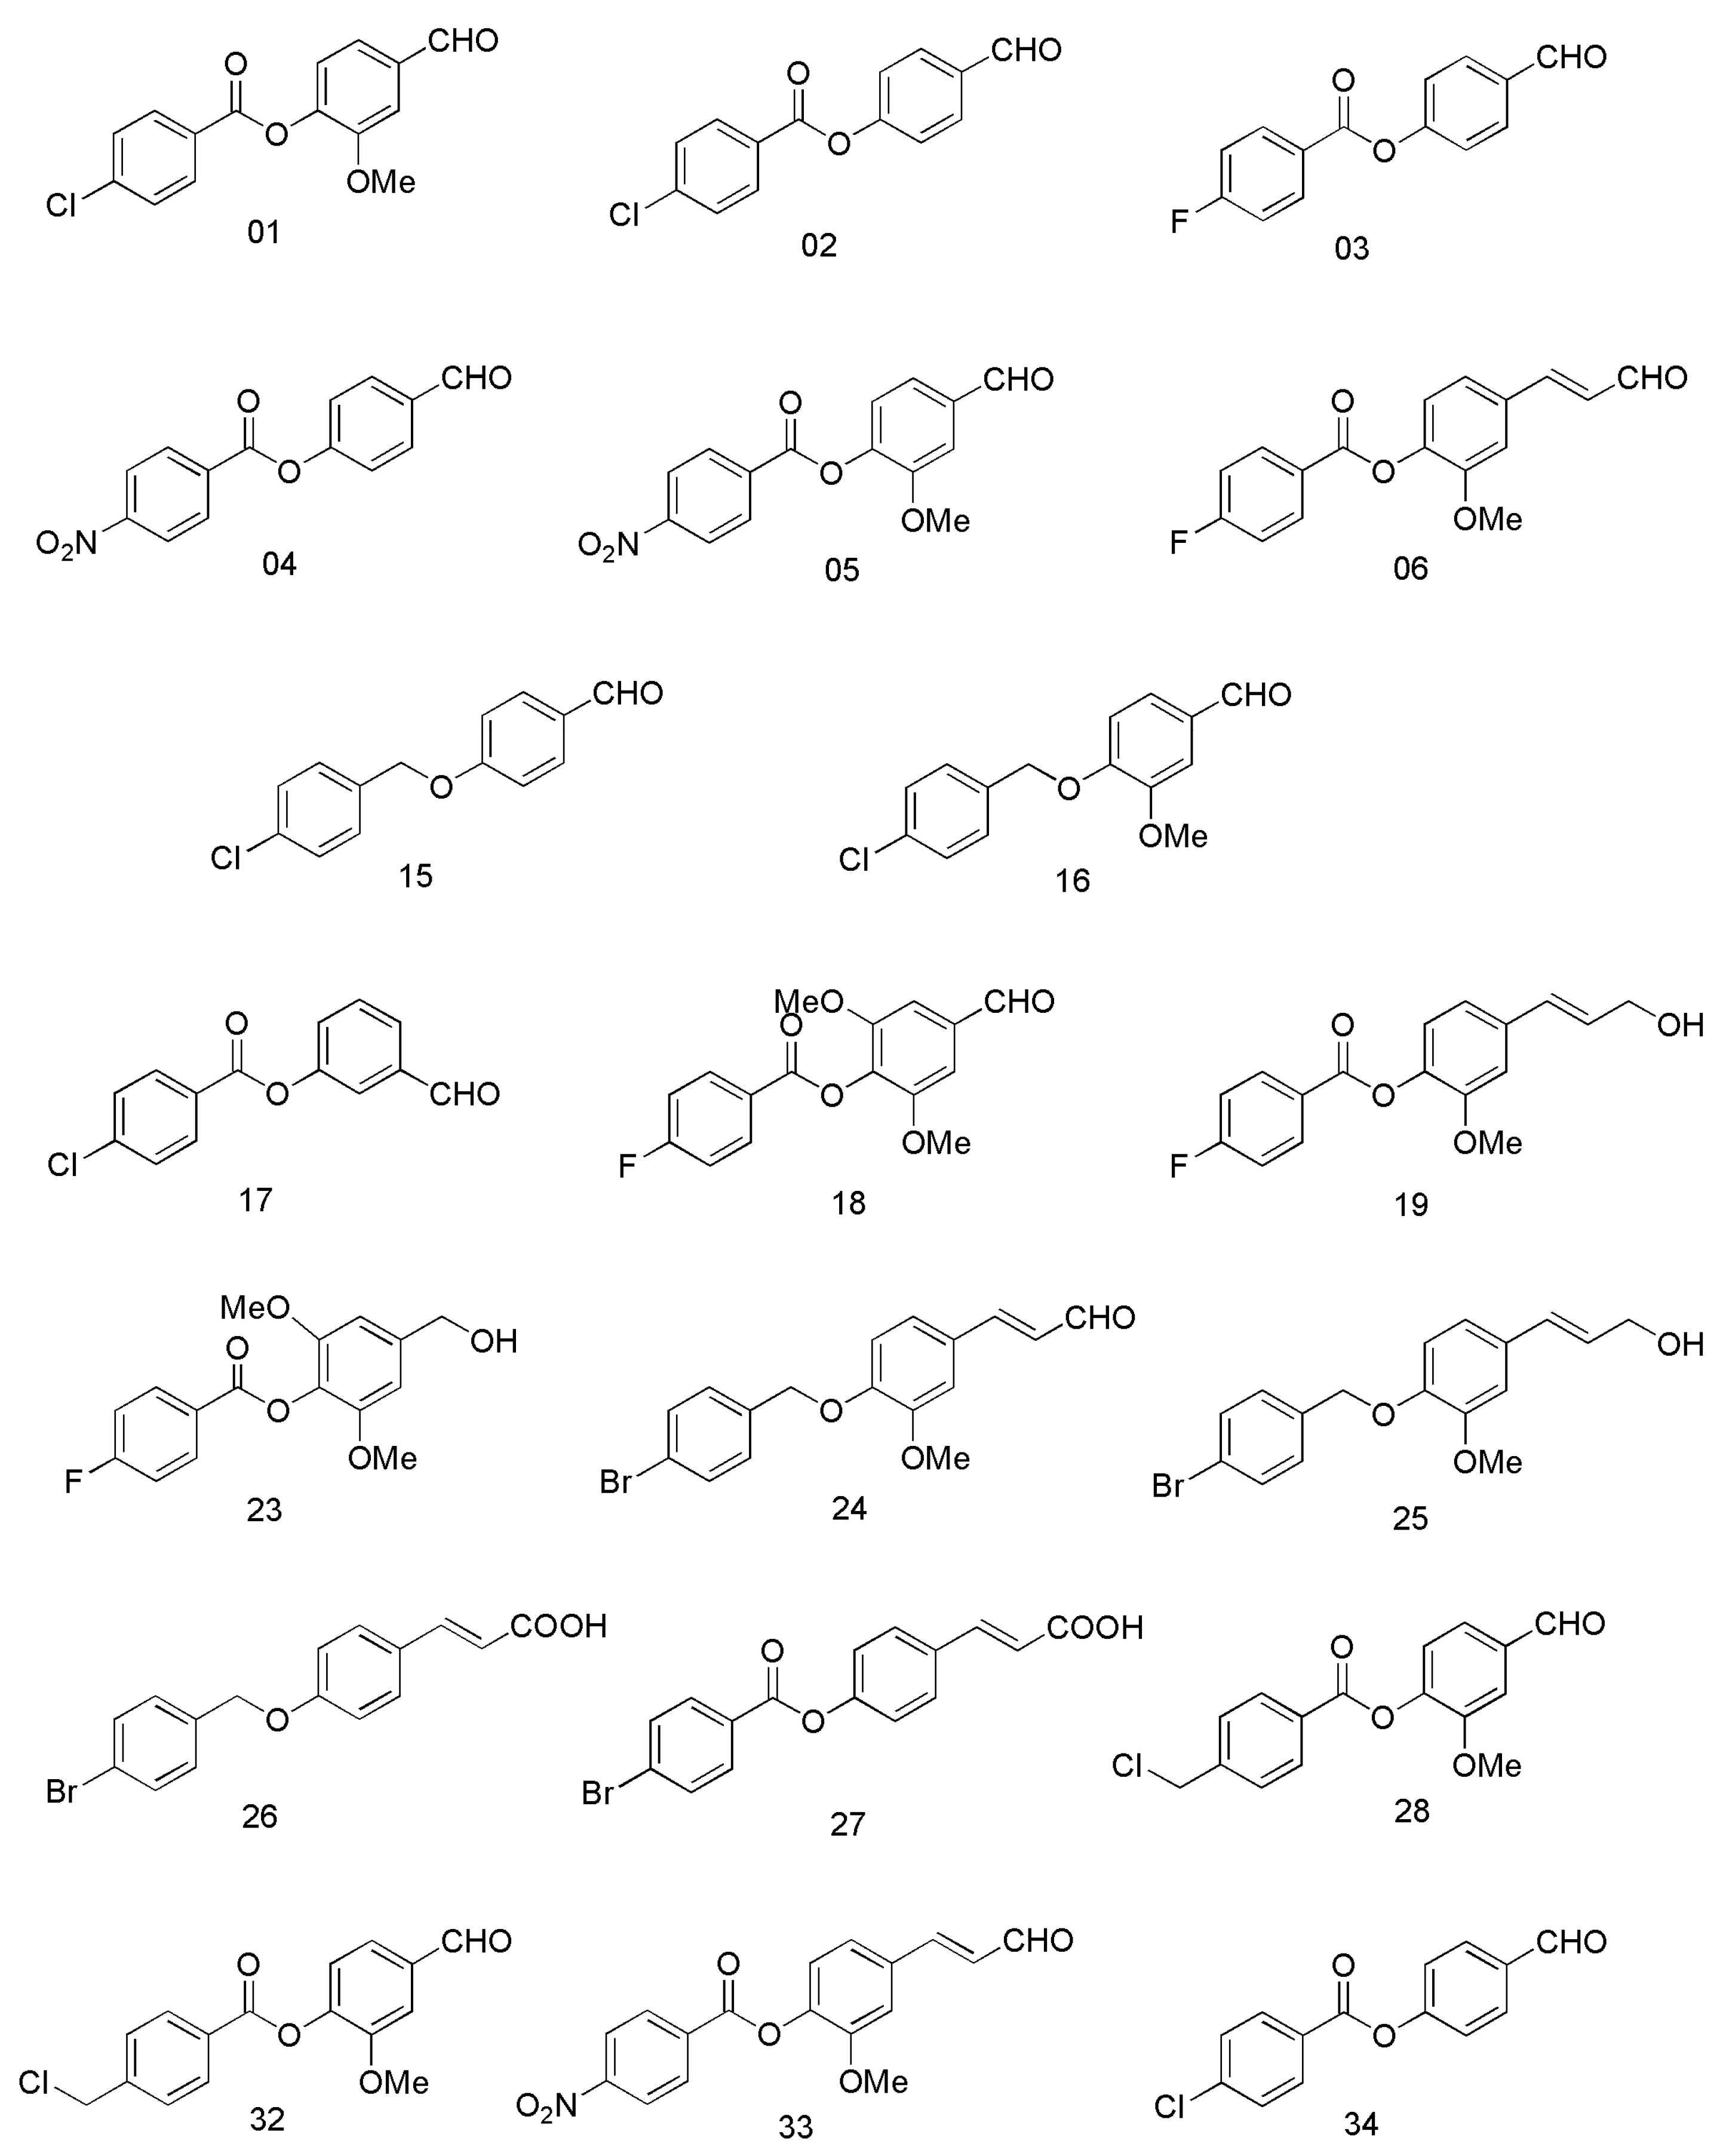
Figure 1. Chemical structures of ALDH-affinic compounds, adapted from Ibrahim et al. [21].
Cimb 45 00139 g001
Figure 2. Western blot membranes showing the expression of (a) ALDH1A3 enzyme and (b) GAPDH loading control on MDA-MB-231, MCF7, and PC-3 cell lines.
Cimb 45 00139 g002
Figure 3. Cell viability assays using compounds (a) 15, (b) 16, (c) 24, and (d) 33 alone at various concentrations (μM) (dark grey bars) and in combination with 5 μM DOX (light grey bars) on MCF7 cell line. Control bar chart (black bar) means no treatments were added. DOX at 5 μM alone is presented as a white bar. Experiments were performed in triplicates at three independent experiments with controls (* p < 0.05, ** p < 0.01, *** p < 0.001, and **** p < 0.0001).
Cimb 45 00139 g003
Figure 4. Cell viability assays using compounds (a) 15, (b) 16, (c) 24, and (d) 27 alone at various concentrations (dark grey bars) and in combination with 1 μM DOX (light grey bars) on PC-3 cell line. Control bar chart (black bar) means no treatments were added. DOX at 1 μM alone is presented as a white bar. Experiments were performed in triplicates in three independent experiments with controls (* p < 0.05, *** p < 0.001, and **** p < 0.0001).
Cimb 45 00139 g004
Figure 5. Cell viability assays using DEAB on (a) MCF7 and (b) PC-3 cell lines alone at various concentrations (dark grey bars) and in combination with (a) 5 μM DOX and (b) 1 μM DOX (light grey bars). Control bar charts (black bars) mean no treatments were added. DOX at (a) 5 μM and (b) 1 μM alone are presented as white bars. Experiments were performed in triplicates in three independent experiments with controls.
Cimb 45 00139 g005
Table 1. Cytotoxicity (IC50 ± SEM) of 16, 1519, 2328, 3234, and DEAB on MCF7, MDA-MB-231, and PC-3 cell lines after treatment for 48 h; n = 3.
CompoundMCF7
IC50 ± SEM (μM)
MDA-MB-231
IC50 ± SEM (μM)
PC-3
IC50 ± SEM (μM)
1>100>100>100
2>100>100>100
3>100>100>100
4>100>100>100
5>100>100>100
647.0 ± 2.057.9 ± 2.250.7 ± 0.6
15>100>100>100
16>100>100>100
17>100>100>100
18>100>100>100
1991.9 ± 3.4>100>100
23>100>100>100
2424.5 ± 0.131.7 ± 1.325.2 ± 3.6
2581.4 ± 5.288.2 ± 1.962.5 ± 3.2
2666.7 ± 3.464.8 ± 2.650.5 ± 2.7
2783.5 ± 0.4>100>100
2863.4 ± 0.563.9 ± 2.548.7 ± 0.5
3265.4 ± 5.663.1 ± 4.948.8 ± 1.2
33>10081.9 ± 12.267.6 ± 1.5
34>100>100>100
DEAB *>100>100>100
* DEAB: diethylaminobenzaldehyde.
Disclaimer/Publisher’s Note: The statements, opinions and data contained in all publications are solely those of the individual author(s) and contributor(s) and not of MDPI and/or the editor(s). MDPI and/or the editor(s) disclaim responsibility for any injury to people or property resulting from any ideas, methods, instructions or products referred to in the content.

